TECHNICAL PAPER Field measurement and Journal of … determined using SAP2000 software ... of a...
9
28 Shibeshi RD, Roth CP. Field measurement and dynamic analysis of a steel truss railway bridge. J. S. Afr. Inst. Civ. Eng. 2016;58(3), Art. #1210, 9 pages. http://dx.doi.org/10.17159/2309-8775/2016/v58n3a4 TECHNICAL PAPER JOURNAL OF THE SOUTH AFRICAN INSTITUTION OF CIVIL ENGINEERING Vol 58 No 3, September 2016, Pages 28–36, Paper 1210 RAHEL SHIBESHI (AMSAICE), holds a BSc in Civil Engineering, BEng (Hons) and MEng in Structural Engineering. She was at the University of Pretoria when the work for this paper was done, and was a junior lecturer there while doing her BEng (Hons). She is also a candidate at ECSA (Engineering Council of South Africa). She started her career in the construction sector as a site and office engineer in 2006, and is currently working as a civil and structural design engineer. Contact details: FABB+Partners Consulting Engineers Unit C, Riverworld Park 42 Homestead Road Sandton 2191 South Africa T: +27 11 482 1609 E: [email protected] PROF CHRIS ROTH Pr Eng (FSAICE), is Associate Professor in Civil Engineering at the University of Pretoria, working in the discipline of Structural Engineering. He started his career in consulting engineering before joining the University of Pretoria. He obtained a BEng degree in Civil Engineering at the University of Stellenbosch, and an MS and PhD at Cornell University. His interests are in structural reliability and structural analysis. Contact details: Department of Civil Engineering University of Pretoria Pretoria 0002 South Africa T: +27 12 420 2185 E: [email protected] Keywords: railway bridge, finite element modelling, field measurement, dynamic analysis, steel truss bridge INTRODUCTION In this study a dynamic analysis of a 77-year- old single span steel truss railway bridge was carried out. The bridge carries passenger trains between Johannesburg and Pretoria. The study was approached by three differ- ent methods – field measurement, modal analysis using a three-dimensional finite element model of the bridge, and a simple single degree of freedom (SDOF) approach. The intention was to investigate different methods of analysis, and determine whether a simple moving load model could accurately predict the dynamic behaviour of the bridge. Several other authors have investigated railway bridges and compared field measure- ment and analysis results. Ashebo et al (2007) studied the effect of the skewness on a three- span box girder bridge in Hong Kong having a total length of 73 m. Natural frequencies were determined using SAP2000 software and field measurement. Caglayan et al (2011) performed a dynamic structural assessment of a four-span riveted steel plate girder bridge in Turkey with a total length of 54 m. Natural frequencies were determined using COSMOS software and field measurements. Liu et al (2009) studied a seven-span composite bridge on a high-speed railway line between Turin and Milan in Italy. The total length of the bridge was 322 m. Rodrigues (2002) used field measurement to determine natural frequencies of a single-span 31.4 m steel truss railway bridge in Portugal for an active tilting Field measurement and dynamic analysis of a steel truss railway bridge R D Shibeshi, C P Roth In this study a dynamic analysis of a 77-year-old single-span steel truss railway bridge was carried out. The study was approached by three different methods – field measurement, modal analysis using a three-dimensional finite element model of the bridge, and a simple generalised single degree of freedom (SDOF) analysis. Field measurement was conducted using accelerometers and displacement transducers, which were mounted on special sections fixed to an adjacent bridge. The finite element models of the bridge were prepared using beam and shell elements. The dynamic responses studied include the displacement, acceleration and natural frequency of the bridge. The results showed that the generalised SDOF model, with simple addition of the effects of each axle, provided reasonably accurate displacements compared to the measured values. The generalised SDOF model, finite element model with beam elements and finite element model with shell elements also gave reasonably accurate estimates for the natural frequency of the bridge. Figure 1 Side view of the bridge
Transcript of TECHNICAL PAPER Field measurement and Journal of … determined using SAP2000 software ... of a...

28 Shibeshi RD, Roth CP. Field measurement and dynamic analysis of a steel truss railway bridge. J. S. Afr. Inst. Civ. Eng. 2016;58(3), Art. #1210, 9 pages. http://dx.doi.org/10.17159/2309-8775/2016/v58n3a4
TECHNICAL PAPERJournal of the South african inStitution of civil engineeringVol 58 No 3, September 2016, Pages 28–36, Paper 1210
RAHEL SHIBESHI (AMSAICE), holds a BSc in Civil Engineering, BEng (Hons) and MEng in Structural Engineering. She was at the University of Pretoria when the work for this paper was done, and was a junior lecturer there while doing her BEng (Hons). She is also a candidate at ECSA (Engineering Council of South Africa). She started her career in the construction sector as a
site and office engineer in 2006, and is currently working as a civil and structural design engineer.
Contact details: FABB+Partners Consulting Engineers Unit C, Riverworld Park 42 Homestead Road Sandton 2191 South Africa T: +27 11 482 1609 E: [email protected]
PROF CHRIS ROTH Pr Eng (FSAICE), is Associate Professor in Civil Engineering at the University of Pretoria, working in the discipline of Structural Engineering. He started his career in consulting engineering before joining the University of Pretoria. He obtained a BEng degree in Civil Engineering at the University of Stellenbosch, and an MS and PhD at Cornell University. His
interests are in structural reliability and structural analysis.
Contact details: Department of Civil Engineering University of Pretoria Pretoria 0002 South Africa T: +27 12 420 2185 E: [email protected]
Keywords: railway bridge, finite element modelling, field measurement, dynamic analysis, steel truss bridge
INTRoduCTIoNIn this study a dynamic analysis of a 77-year-old single span steel truss railway bridge was carried out. The bridge carries passenger trains between Johannesburg and Pretoria. The study was approached by three differ-ent methods – field measurement, modal analysis using a three-dimensional finite element model of the bridge, and a simple single degree of freedom (SDOF) approach. The intention was to investigate different methods of analysis, and determine whether a simple moving load model could accurately predict the dynamic behaviour of the bridge.
Several other authors have investigated railway bridges and compared field measure-ment and analysis results. Ashebo et al (2007)
studied the effect of the skewness on a three-span box girder bridge in Hong Kong having a total length of 73 m. Natural frequencies were determined using SAP2000 software and field measurement. Caglayan et al (2011) performed a dynamic structural assessment of a four-span riveted steel plate girder bridge in Turkey with a total length of 54 m. Natural frequencies were determined using COSMOS software and field measurements. Liu et al (2009) studied a seven-span composite bridge on a high-speed railway line between Turin and Milan in Italy. The total length of the bridge was 322 m. Rodrigues (2002) used field measurement to determine natural frequencies of a single-span 31.4 m steel truss railway bridge in Portugal for an active tilting
Field measurement and dynamic analysis of a steel truss railway bridgeR D Shibeshi, C P Roth
In this study a dynamic analysis of a 77-year-old single-span steel truss railway bridge was carried out. The study was approached by three different methods – field measurement, modal analysis using a three-dimensional finite element model of the bridge, and a simple generalised single degree of freedom (SDOF) analysis. Field measurement was conducted using accelerometers and displacement transducers, which were mounted on special sections fixed to an adjacent bridge. The finite element models of the bridge were prepared using beam and shell elements. The dynamic responses studied include the displacement, acceleration and natural frequency of the bridge. The results showed that the generalised SDOF model, with simple addition of the effects of each axle, provided reasonably accurate displacements compared to the measured values. The generalised SDOF model, finite element model with beam elements and finite element model with shell elements also gave reasonably accurate estimates for the natural frequency of the bridge.
Figure 1 Side view of the bridge

Journal of the South African Institution of Civil Engineering • Volume 58 Number 3 September 2016 29
train at speeds of up to 200 km/h. Xia et al (2005) presented the experimental results of a 28-span pre-stressed concrete bridge for a high-speed train in China. Deflections, accel-erations, strains and forces were measured. Hamidi and Danshjoo (2010) used a math-ematical approach to determine the impact factor for steel railway bridges considering the effects of vehicle speed and ratio of axle distance to span length. Kaliyaperumal et al (2011) analysed a six-span continuously welded plate girder railway bridge of 189 m total length located in Sweden. Three Abaqus models were used – beam elements only, shell elements only, and a combination.
dEsCRIPTIoN oF THE bRIdgE ANd TRAINThe bridge, constructed in 1936, is located in a peri-urban area outside Centurion, near Pretoria, South Africa, and is owned by the Passenger Rail Association of South Africa (PRASA). It spans the Hennops River, a river that is formed by the confluence of the Olifantspruit and the Sesmylspruit.
The bridge is one of two independent identical single-span simply-supported truss
bridges at the site, as shown in Figures 1 and 2. Each bridge spans 32.54 m, has a width of 5.26 m and carries a track of Cape gauge (1.067 m). The bridges are made up of a number of built-up sections which form the elements of a truss, with no ballast or deck, as shown in Figure 1. No obvious structural problems were noted during a visual inspec-tion of the bridge.
The bridges carry passenger trains with 12 coaches travelling between Johannesburg and Pretoria. These trains cross the bridge every 10–15 minutes during peak hours, and every 30–40 minutes during off-peak hours.
A typical train is shown in Figure 3. The current maximum speed limit of the train on the bridge is 90 km/h. The trains consist of motor coaches (MC) with 180 kN axle loads, and trailer coaches (TC) with 114 kN axle loads. The axle spacing for a trailer coach is shown in Figure 4. Arrangements of 1MC+6TC+1MC+3TC+1MC and 1MC+3TC+1MC+6TC+1MC were observed during the field measurements.
FIELd mEAsuREmENTField measurement of the displacement and acceleration of the bridge was done. In gen-eral it is difficult to measure displacements of a bridge using transducers where there is no suitable fixed reference point, such as at the mid-span of this bridge, which is approx-imately 8 m above the river. Fortunately in
Figure 2 End view of the bridge
Figure 3 Typical train
Table 1 Locations of measuring instruments
Accelerometer Displacement transducers
1 Mid-span left cross beam a Mid-span right bottom chord
2 Mid-span left rail b Mid-span right cross beam
3 ¾ span left stringer c Mid-span intersection of right stringer and cross beam
4 ¾ span left top of the bottom chord d Mid-span right rail
5 Mid-span right cross beam
6 Mid-span right stringer
7 Mid-span right rail
Figure 4 Axle spacing for trailer coach
1 422 2 134 11 430 1 4222 134 443
Journal of the South African Institution of Civil Engineering • Volume 58 Number 3 September 201630
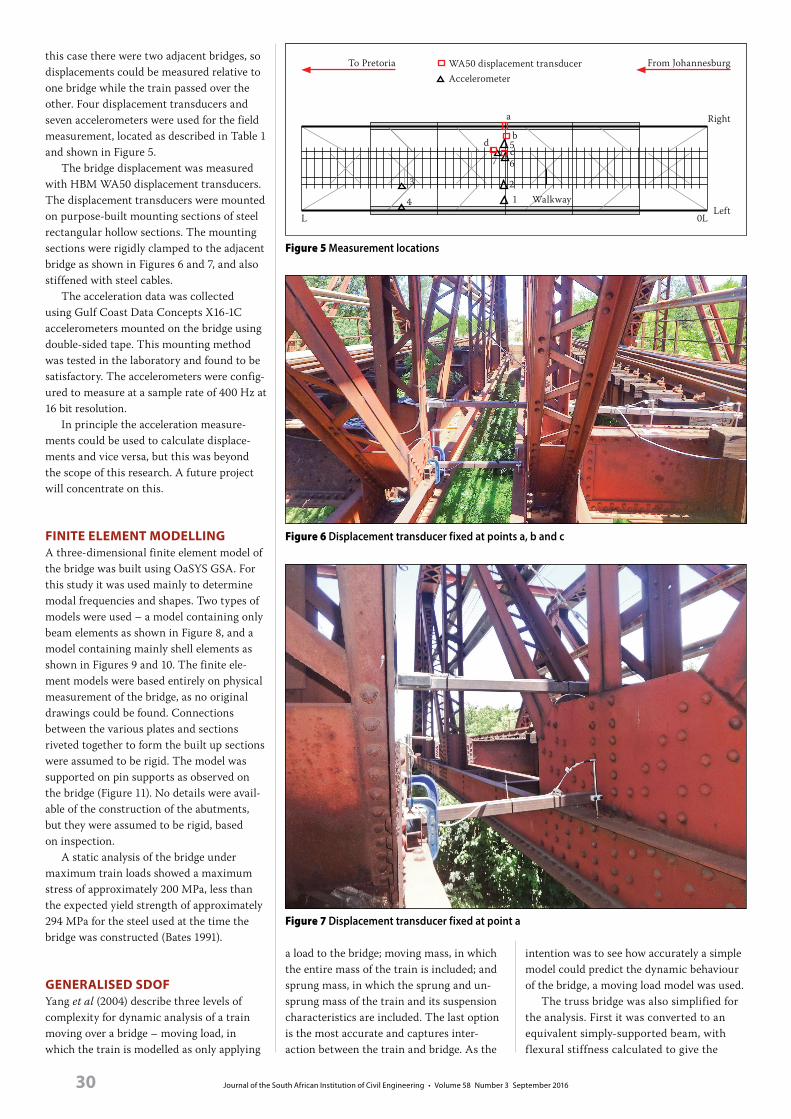
this case there were two adjacent bridges, so displacements could be measured relative to one bridge while the train passed over the other. Four displacement transducers and seven accelerometers were used for the field measurement, located as described in Table 1 and shown in Figure 5.
The bridge displacement was measured with HBM WA50 displacement transducers. The displacement transducers were mounted on purpose-built mounting sections of steel rectangular hollow sections. The mounting sections were rigidly clamped to the adjacent bridge as shown in Figures 6 and 7, and also stiffened with steel cables.
The acceleration data was collected using Gulf Coast Data Concepts X16-1C accelerometers mounted on the bridge using double-sided tape. This mounting method was tested in the laboratory and found to be satisfactory. The accelerometers were config-ured to measure at a sample rate of 400 Hz at 16 bit resolution.
In principle the acceleration measure-ments could be used to calculate displace-ments and vice versa, but this was beyond the scope of this research. A future project will concentrate on this.
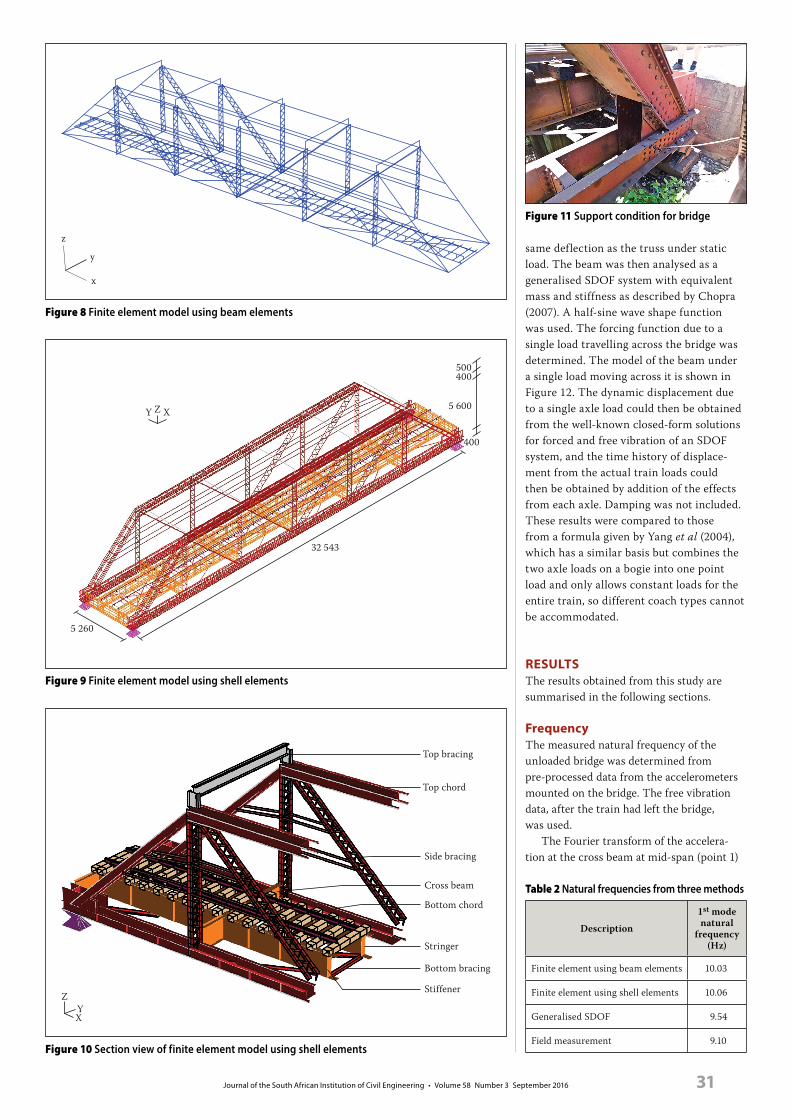
FINITE ELEmENT modELLINgA three-dimensional finite element model of the bridge was built using OaSYS GSA. For this study it was used mainly to determine modal frequencies and shapes. Two types of models were used – a model containing only beam elements as shown in Figure 8, and a model containing mainly shell elements as shown in Figures 9 and 10. The finite ele-ment models were based entirely on physical measurement of the bridge, as no original drawings could be found. Connections between the various plates and sections riveted together to form the built up sections were assumed to be rigid. The model was supported on pin supports as observed on the bridge (Figure 11). No details were avail-able of the construction of the abutments, but they were assumed to be rigid, based on inspection.
A static analysis of the bridge under maximum train loads showed a maximum stress of approximately 200 MPa, less than the expected yield strength of approximately 294 MPa for the steel used at the time the bridge was constructed (Bates 1991).
gENERALIsEd sdoFYang et al (2004) describe three levels of complexity for dynamic analysis of a train moving over a bridge – moving load, in which the train is modelled as only applying
a load to the bridge; moving mass, in which the entire mass of the train is included; and sprung mass, in which the sprung and un-sprung mass of the train and its suspension characteristics are included. The last option is the most accurate and captures inter-action between the train and bridge. As the
intention was to see how accurately a simple model could predict the dynamic behaviour of the bridge, a moving load model was used.
The truss bridge was also simplified for the analysis. First it was converted to an equivalent simply-supported beam, with flexural stiffness calculated to give the
Figure 6 Displacement transducer fixed at points a, b and c
Figure 7 Displacement transducer fixed at point a
Figure 5 Measurement locations
Right
LeftWalkway1
2
6c5b
a
d
3
4
To Pretoria From Johannesburg
L 0L
AccelerometerWA50 displacement transducer
7
Journal of the South African Institution of Civil Engineering • Volume 58 Number 3 September 2016 31
same deflection as the truss under static load. The beam was then analysed as a generalised SDOF system with equivalent mass and stiffness as described by Chopra (2007). A half-sine wave shape function was used. The forcing function due to a single load travelling across the bridge was determined. The model of the beam under a single load moving across it is shown in Figure 12. The dynamic displacement due to a single axle load could then be obtained from the well-known closed-form solutions for forced and free vibration of an SDOF system, and the time history of displace-ment from the actual train loads could then be obtained by addition of the effects from each axle. Damping was not included. These results were compared to those from a formula given by Yang et al (2004), which has a similar basis but combines the two axle loads on a bogie into one point load and only allows constant loads for the entire train, so different coach types cannot be accommodated.
REsuLTsThe results obtained from this study are summarised in the following sections.
FrequencyThe measured natural frequency of the unloaded bridge was determined from pre-processed data from the accelerometers mounted on the bridge. The free vibration data, after the train had left the bridge, was used.
The Fourier transform of the accelera-tion at the cross beam at mid-span (point 1)
Figure 11 Support condition for bridge
Table 2 Natural frequencies from three methods
Description
1st mode natural
frequency (Hz)
Finite element using beam elements 10.03
Finite element using shell elements 10.06
Generalised SDOF 9.54
Field measurement 9.10
Figure 8 Finite element model using beam elements
z
x
y
Figure 9 Finite element model using shell elements
5 260
32 543
5 600
400
400
Y Z X
500
Figure 10 Section view of finite element model using shell elements
Top bracing
Top chord
Side bracing
Cross beam
Bottom chord
Stringer
StiffenerZ
YX
Bottom bracing

Journal of the South African Institution of Civil Engineering • Volume 58 Number 3 September 201632
is shown in Figure 13. A peak at 9.1 Hz is visible.
Table 2 compares the measured fun-damental natural frequency with those obtained from the finite element and generalised SDOF models. The results are
approximately similar, with the measured frequency slightly lower than the finite ele-ment and generalised SDOF frequencies. This may indicate some errors in the model-ling assumptions, such as the rigid abutment supports assumed. Further monitoring and
measurement of the frequency could be used in monitoring the structural health of the bridge.
For comparison, the natural frequencies calculated by the empirical formulae suggested by Kaliyaperumal et al (2011) are shown in Table 3, where l is the bridge span in m. The values from Frýba (1996) are 95% confidence intervals for steel truss bridges, while the values from UIC (1979) and EN 1991-2 (2003) are limits outside of which more detailed analysis is needed. It appears that the bridge is near the upper end of Frýba’s interval, and above the UIC and EN 1991-2 limit, though Frýba does state that, according to his data, many bridges will exceed this upper limit.
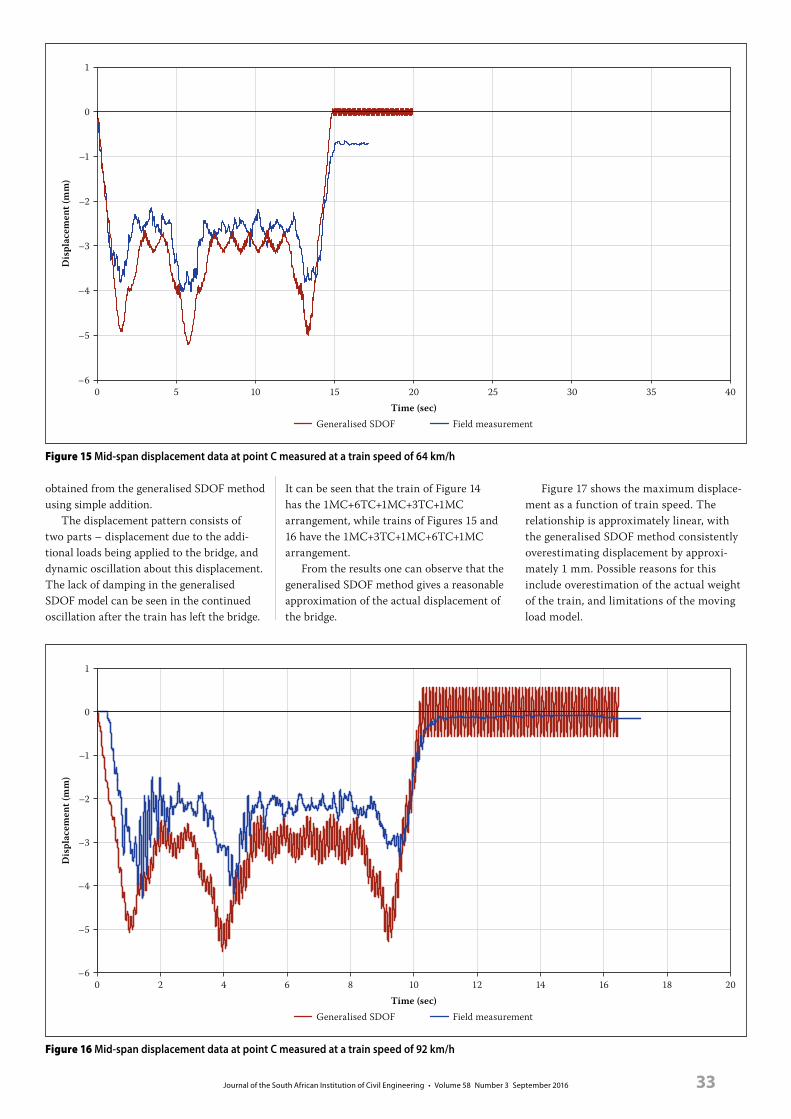
displacementThe displacements measured at mid-span (point C) are shown in Figures 14–16 for various speeds. Displacements from the field measurements are compared with those
Figure 13 Amplitude vs frequency plot using pre-processed data at point 1
Four
ier a
mpl
itud
e
0.5
0.3
0.2
0.1
00 5 10 15 20 25
Frequency (Hz)
0.4
Table 3 Natural frequencies from empirical formulae
Reference Formula Frequency(Hz)
Frýbalower 219l–1.1 4.8
upper 430l–1.1 9.3
UIC & EN 1991-2
lower 23.58l–0.592 3.0
upper 94.76l–0.748 7.0
Figure 12 Simplified model of a simply-supported bridge subjected to moving load
P0
V
x
u(x,t)
L
m(x), EI(x)
Figure 14 Mid-span displacement data at point B measured at a train speed of 38 km/h
Dis
plac
emen
t (m
m)
1
0
–1
–2
–3
–4
–5
–6
Time (sec)0 5 10 15 20 25 30 35 40
Generalised SDOF Field measurement
Journal of the South African Institution of Civil Engineering • Volume 58 Number 3 September 2016 33
obtained from the generalised SDOF method using simple addition.
The displacement pattern consists of two parts – displacement due to the addi-tional loads being applied to the bridge, and dynamic oscillation about this displacement. The lack of damping in the generalised SDOF model can be seen in the continued oscillation after the train has left the bridge.
It can be seen that the train of Figure 14 has the 1MC+6TC+1MC+3TC+1MC arrangement, while trains of Figures 15 and 16 have the 1MC+3TC+1MC+6TC+1MC arrangement.
From the results one can observe that the generalised SDOF method gives a reasonable approximation of the actual displacement of the bridge.
Figure 17 shows the maximum displace-ment as a function of train speed. The relationship is approximately linear, with the generalised SDOF method consistently overestimating displacement by approxi-mately 1 mm. Possible reasons for this include overestimation of the actual weight of the train, and limitations of the moving load model.
Figure 15 Mid-span displacement data at point C measured at a train speed of 64 km/h
Dis
plac
emen
t (m
m)
1
0
–1
–2
–3
–4
–5
–6
Time (sec)0 5 10 15
Generalised SDOF Field measurement
2520 30 4035
Figure 16 Mid-span displacement data at point C measured at a train speed of 92 km/h
Dis
plac
emen
t (m
m)
1
0
–1
–2
–3
–4
–5
–6
Time (sec)0 4 10 12 20
Generalised SDOF Field measurement
2 6 8 14 16 18

Journal of the South African Institution of Civil Engineering • Volume 58 Number 3 September 201634
Another point that one can observe from Figures 14–16 is that the displacement due to the motor coach is about 1.58 times that due to the trailer coach. This is almost equal to the ratio of the weights of the coaches, indi-cating the linearity between the force applied and resulting displacement.
The displacements measured at different points on the bridge structure at mid-span (points A, B and C) are close, as shown in Figure 18, indicating little relative displacement between points in the truss. This is one reason why the simple
beam approximation for the truss works reasonably well.
The two generalised SDOF methods, one using the formula given by Yang et al (2004) and one using simple addition of the effects of each axle, are compared in Figure 19. It is clear that the formula from Yang et al does not work well when the coaches have different masses.
As the generalised SDOF approach with simple addition of loads appears to give approximately accurate results, the effect of speed on maximum displacement was
determined for a larger range of speeds than could be measured. The results are shown in Figure 20. The relationship between speed and maximum displacement is approxi-mately linear, except for some slight peaks where more dynamic amplification occurs. The peak at around 74 km/h occurs because at this speed the two axles on a bogie enter the bridge approximately 0.1 s apart, which is close to the natural period of the bridge and the resulting dynamic in-phase oscillations.
Impact factors, as defined by Hamidi and Danshjoo (2010), relating the dynamic deflection of the bridge to the static deflec-tion, could also be calculated from the generalised SDOF method. The formula for determining the impact factor is presented in Equation 1.
I = Ddyn – Dst
Dst (1)
where: I = impact factor Ddyn = dynamic deflection Dst = static deflection.
Hamidi and Danshjoo (2010) and Yang et al (2004) list several sources of impact fac-tors from literature. The factors calculated based on the AASHTO manual (1989), AREMA manual (2006) and OHBD code (1983) are 0.216, 0.238 and 0.25 respectively. The calculated results shown in Figure 21 are higher than the values given by the dif-ferent codes. The upper limit of the impact factor calculated by the Iranian and French codes (Hamidi & Danshjoo 2010) is less than some of the results obtained in this research study.
Figure 18 Displacement vs time at different locations at a train speed of 38 km/h
Dis
plac
emen
t (m
m)
–0.5
0
0.5
–2.0
–1.5
–1.0
–3.5
–3.0
–2.5
–5.0
–4.0
Time (sec)0 5 10 15 20 25
A B C
–4.5
Figure 17 Comparison of maximum displacement of the bridge for different train speeds
Max
imum
dis
plac
emen
t (m
m)
6
5
4
3
2
1
0
Train speed (km/h)0 20 40 60
Generalised SDOF Field measurement
10080

Journal of the South African Institution of Civil Engineering • Volume 58 Number 3 September 2016 35
CoNCLusIoNsA 77-year-old steel truss bridge carrying passenger trains was instrumented and analysed in this study. It was fortunate that displacement could be measured using sections rigidly clamped to the
adjacent bridge. Accelerometers were also used.
The results showed that the generalised SDOF moving load model with simple addi-tion provided reasonably accurate displace-ments compared to the measured values,
despite the bridge actually being a truss which has different mass and stiffness distribution and behaviour compared to a beam, and the train being more complex than just a moving load in its interaction with the bridge. Possible other reasons for the differences include more complex issues, such as rail defects, wheel-rail interaction, and damping, which were not taken into account in the simple model.
Two finite element models of the bridge were prepared – one with beam elements, and one with mainly shell elements. The finite element model may also be used for dynamic time-history analysis of the bridge, but this would be substantially more complex and time-consuming than the simple model.
The generalised SDOF model, finite element model with beam elements and finite element model with shell elements gave reasonably accurate estimates for the natural frequency of the bridge. Differences could be due to the supports being less stiff than assumed.
The empirical formulae suggested by UIC and BS EN 1991-2 underestimated the natural frequency of the bridge. Formulae in the AASHTO manual, AREMA and OHBD codes also underestimated the dynamic impact factor.
REFERENCEsAASHTO (American Association of State Highway
and Transportation Officials) 1989. Standard
Specifications for Highway Bridges, 14th ed.
Washington, D.C.: AASHTO.
AREMA 2006. Manual for Railway Engineering.
Lanham-Seabrook, MD: American Railway
Engineering and Maintenance-of-Way Association.
Ashebo, D, Tommy, H & Chan, L 2007. Evaluation of
dynamic loads on a skew box girder continuous
bridge. Part I: Field test and modal analysis.
Engineering Structures, 29: 1052–1063.
Bates, W 1991. Historical Structural Steelwork
Handbook. London: The British Constructional
Steelwork Association Limited.
Caglayan, O, Ozakgul, O, Tezer, O & Uzgider, E 2011.
Evaluation of a steel railway bridge for dynamic
and seismic loads. Journal of Constructional Steel
Research, 67: 1198–1211.
Chopra, A K 2007. Dynamics of Structures: Theory
and Applications to Earthquake Engineering. Upper
Saddle River, NJ: Pearson.
EN (European Standard) 2003. EN 1991-2: 2003.
Eurocode 1: Actions on Structures. Part 2: Traffic
Loads on Bridges. Brussels: European Committee for
Standardization (CEN).
Frýba, L 1996. Dynamics of Railway Bridges. London:
Thomas Telford.
Hamidi, S & Danshjoo, F 2010. Determination of
impact factor for steel railway bridges considering
simultaneous effects of vehicle speed and axle
Figure 19 Displacement vs time using an equation from Yang et al (2004) and simple addition
Dis
plac
emen
t (m
)
1
2
–1
0
5
6
3
4
8
9
7
Time (sec)12
Simple addition Yang et al (2004)
1086420
Figure 20 Maximum displacement of bridge for different ranges of train speeds
Dis
plac
emen
t (m
m)
8
7
6
5
4
3
2
1
0
Train speed (km/h)0 20 40 60 80 100 120 140
6.66
6.58 6.59 7.46 6.64 6.886.6
Figure 21 Calculated impact factors as a function of speed
Impa
ct fa
ctor
0.6
0.5
0.4
0.3
0.2
0.1
0
Speed (km/h)0 20 40 60 80 100
y = 0.0008x + 0.2409 R2 = 0.8055

Journal of the South African Institution of Civil Engineering • Volume 58 Number 3 September 201636
distance to span length ratio. Engineering Structures,
32: 1369–1376.
Kaliyaperumal, G, Imam, B & Righiniotis, T 2011.
Advanced dynamic finite element analysis of a skew
steel railway bridge. Engineering Structures, 33: 181–190.
Liu, K, Lombaert, G, Roeck, G, Leuven, K, Chellini, G,
Nardini, L, Salvatore, W & Peeters, B 2009.
The structural behaviour of a composite bridge
during the passage of high-speed trains. Structural
Engineering International, 19: 427–431.
OHBD 1983. Ontario Highway Bridge Design Code.
Downsview, Ontario, Canada: Ministry of
Transportation and Communication.
Rodrigues, J 2002. Dynamic performance of a steel
truss bridge under railway traffic. Proceedings, 20th
IMAC-XX Conference on Structural Dynamics, Los
Angeles, CA.
UIC (International Union of Railways) 1979. UIC 776–1
R 1979. Loads to be Considered in the Design of
Railway Bridges. Paris: UIC.
Xia, H, Zhang, N & Gao, R 2005. Experimental analysis
of a railway bridge under high-speed trains. Journal
of Sound and Vibration, 282: 517–528.
Yang, Y, Yao, Z & Wu, Y 2004. Vehicle-Bridge
Interaction Dynamics: With Applications to High-
Speed Railways. River Edge, NJ: World Scientific
Publishing Co.