Technical Memorandums from Gordan Gjerapic at Golder ... 2008f_ RS 74A... · Appendix D Technical...
76
Appendix D Technical Memorandums from Gordan Gjerapic at Golder Associates to John Borovsky at Barr. Dated May 7, 2007, May 29, 2007, May 31, 2007 Regarding Ponding and Percolation Estimates; December 17, 2007 and December 21, 2007 Regarding Percolation Estimates of Other Mine Site Deatures; and May 20, 2008 Regarding HELP Modeling of Stockpile Liner Leakage
Transcript of Technical Memorandums from Gordan Gjerapic at Golder ... 2008f_ RS 74A... · Appendix D Technical...

Appendix D
Technical Memorandums from Gordan Gjerapic at
Golder Associates to John Borovsky at Barr.
Dated May 7, 2007, May 29, 2007, May 31, 2007 Regarding Ponding
and Percolation Estimates; December 17, 2007 and December 21,
2007 Regarding Percolation Estimates of Other Mine Site Deatures;
and May 20, 2008 Regarding HELP Modeling of Stockpile Liner
Leakage

OFFICES ACROSS AFRICA, ASIA, AUSTRALIA, EUROPE, NORTH AMERICA AND SOUTH AMERICA
TECHNICAL MEMORANDUM Golder Associates Inc. 44 Union Blvd., Suite 300 Telephone: 303-980-0540 Lakewood, Colorado 80228 Fax: 303-985-2080
TO: John Borovsky, Barr Engineering DATE: May 7, 2007
FROM: Gordan Gjerapic P.E., GAI OUR REF.: 053-2209
CC: Brent R. Bronson P.E., GAI
RE: PONDING AND PERCOLATION ESTIMATES FOR CATEGORIES 3 AND 4 WASTE ROCK STOCKPILES, POLYMET PROJECT, MINNESOTA
1.0 INTRODUCTION
Golder Associates Inc. (Golder) has prepared this technical memorandum for Barr Engineering (Barr) to present predicted estimates of ponding and percolation for the Category 3 and 4 waste rock stockpiles. This work was completed based on authorization provided during phone conversations and e-mail correspondence between Barr and Golder on April 30 and May 1 2007. The purpose of this work is to allow more refined estimates of potential head development and liner leakage to be predicted relative to the more simplistic and conservative approach previously conducted. The predicted results presented in this memorandum were obtained using the HELP (Hydrologic Evaluation of Landfill Performance) model and should be viewed as estimates. The predicted results may be subject to further revisions pending on the future changes in the stockpile design and more detailed information on the properties of the stockpile, overliner and cover materials.
2.0 INPUT PARAMETERS
All simulations use a 100-year weather record for Duluth, Minnesota synthetically generated by HELP. The lower model boundary consists of an 80-mil LLDPE placed on a 12-inch thick subgrade material. The proposed liner is overlain by 12 inches of the overliner material and 40-ft of the stockpile rock. HELP simulations summarized in Table 2.1 assume the stockpile is exposed to the atmosphere (i.e., the final cover has not been constructed on the stockpile). HELP simulations evaluating the final cover performance are summarized in Table 2.2.
Table 2.1. Baseline Modeling Scenarios 3 without the Final Cover
Scenario Liner Installation
Defects (holes/acre)
Liner Manufacturing Defects
(pinholes/acre)
Spacing of Leachate Collection Pipes (ft)
Stockpile Rock and Overliner Permeability
(cm/s)
Case 1 4 0 100 0.3 Case 2 4 4 100 0.3 Case 3 4 4 50 0.3 Case 4 4 4 50 0.03
TECHNICAL MEMORANDUM Barr Engineering May 8, 2007 John Borovsky -2- 053-2209
I:\05\2209\0100\TM-HELP-Categ3_4-08May07\053-2209 TM-HELP-08May07.Doc Golder Associates
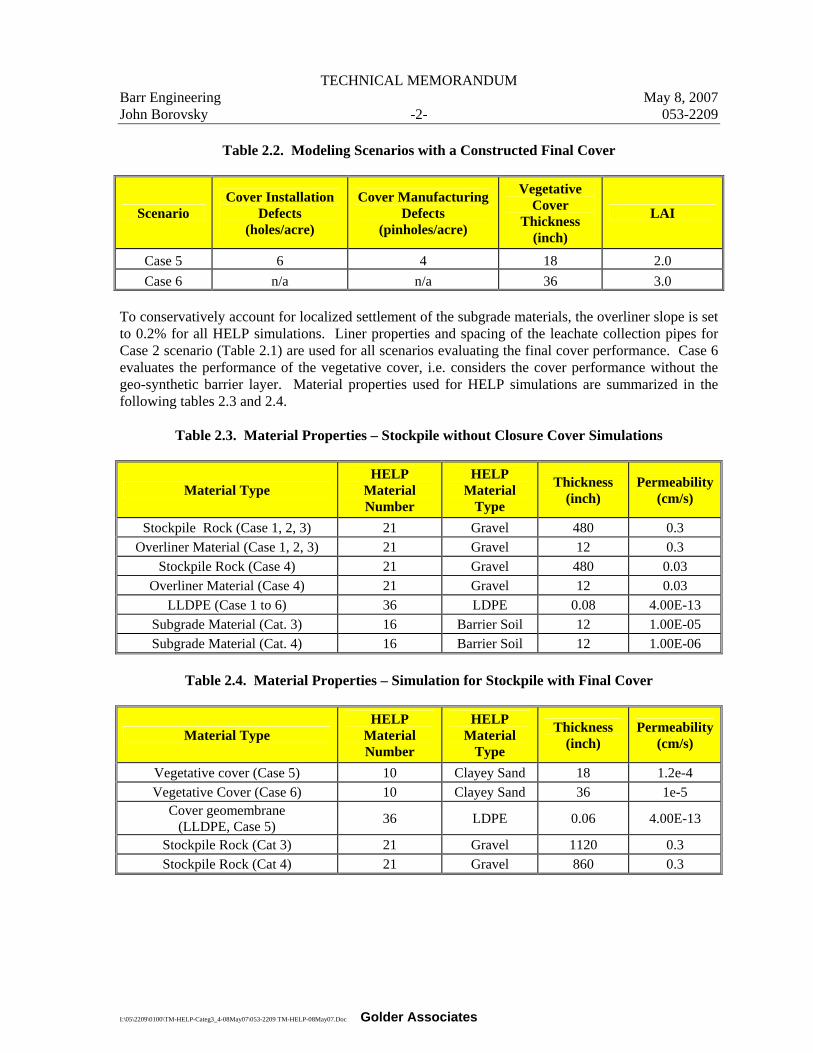
Table 2.2. Modeling Scenarios with a Constructed Final Cover
Scenario Cover Installation
Defects (holes/acre)
Cover Manufacturing Defects
(pinholes/acre)
Vegetative Cover
Thickness (inch)
LAI
Case 5 6 4 18 2.0 Case 6 n/a n/a 36 3.0
To conservatively account for localized settlement of the subgrade materials, the overliner slope is set to 0.2% for all HELP simulations. Liner properties and spacing of the leachate collection pipes for Case 2 scenario (Table 2.1) are used for all scenarios evaluating the final cover performance. Case 6 evaluates the performance of the vegetative cover, i.e. considers the cover performance without the geo-synthetic barrier layer. Material properties used for HELP simulations are summarized in the following tables 2.3 and 2.4.
Table 2.3. Material Properties – Stockpile without Closure Cover Simulations
Material Type HELP
Material Number
HELP Material
Type
Thickness (inch)
Permeability(cm/s)
Stockpile Rock (Case 1, 2, 3) 21 Gravel 480 0.3 Overliner Material (Case 1, 2, 3) 21 Gravel 12 0.3
Stockpile Rock (Case 4) 21 Gravel 480 0.03 Overliner Material (Case 4) 21 Gravel 12 0.03
LLDPE (Case 1 to 6) 36 LDPE 0.08 4.00E-13 Subgrade Material (Cat. 3) 16 Barrier Soil 12 1.00E-05 Subgrade Material (Cat. 4) 16 Barrier Soil 12 1.00E-06
Table 2.4. Material Properties – Simulation for Stockpile with Final Cover
Material Type HELP
Material Number
HELP Material
Type
Thickness (inch)
Permeability(cm/s)
Vegetative cover (Case 5) 10 Clayey Sand 18 1.2e-4 Vegetative Cover (Case 6) 10 Clayey Sand 36 1e-5
Cover geomembrane (LLDPE, Case 5) 36 LDPE 0.06 4.00E-13
Stockpile Rock (Cat 3) 21 Gravel 1120 0.3 Stockpile Rock (Cat 4) 21 Gravel 860 0.3

TECHNICAL MEMORANDUM Barr Engineering May 8, 2007 John Borovsky -3- 053-2209
I:\05\2209\0100\TM-HELP-Categ3_4-08May07\053-2209 TM-HELP-08May07.Doc Golder Associates
3.0 RESULTS
HELP results are summarized in the following tables:
Table 3.1. HELP Results for Category 3 Stockpiles without a Final Cover
Quantity Case 1 Case 2 Case 3 Case 4
Avg. annual precipitation (inch) 29.2 29.2 29.2 29.16 Avg. annual runoff (inch) 3.9 3.9 3.9 4.034 Avg. annual evaporation (inch) 12.4 12.4 12.4 14.25 Avg annual lateral drainage (inch) 12.7 12.7 12.7 10.58 Avg. annual percolation (inch) 2.34E-02 3.77E-02 2.05E-02 7.8E-02 Average annual head on liner (inch) 0.9 0.9 0.5 2.03 Change in water storage (inch) 0.1 0.1 0.1 0.214 Peak daily percolation (inch) 1.75E-04 2.81E-04 1.57E-04 4.19E-04 Peak daily head on liner (inch) 3.1 3.1 1.6 4.19
Table 3.2. HELP Results for Category 4 Stockpile without a Final Cover
Quantity Case 1 Case 2
Avg. annual precipitation (inch) 29.2 29.2 Avg. annual runoff (inch) 3.9 3.9 Avg. annual evaporation (inch) 12.4 12.4 Avg annual lateral drainage (inch) 12.7 12.7 Avg. annual percolation (inch) 4.30E-03 6.92E-03 Average annual head on liner (inch) 0.9 0.9 Change in water storage (inch) 0.1 0.1 Peak daily percolation (inch) 3.20E-05 5.20E-05 Peak daily head on liner (inch) 3.1 3.1
Table 3.3. Summary of Calculated Percolation Rates without a Final Cover
Simulation Case 1 Case 2 Case 3 Case 4
Category 3 Stockpile Avg. annual perc. (gal/acre/day) 1.7 2.8 1.5 5.8
Category 3 Stockpile Peak daily percolation (gal/acre/day) 4.7 7.6 4.3 11.3
Category 4 Stockpile Avg. annual perc. (gal/acre/day) 0.3 0.5 - -
Category 4 Stockpile Peak daily percolation (gal/acre/day) 0.9 1.4 - -

TECHNICAL MEMORANDUM Barr Engineering May 8, 2007 John Borovsky -4- 053-2209
I:\05\2209\0100\TM-HELP-Categ3_4-08May07\053-2209 TM-HELP-08May07.Doc Golder Associates
Table 3.4. HELP Results for Category 3 Stockpile with a Final Cover
Quantity Case 5 Case 6
Avg. annual precipitation (inch) 29.2 29.2 Avg. annual runoff (inch) 5.9 9.9 Avg. annual evaporation (inch) 22.6 19.1 Avg annual lateral drainage (inch) 0.5 0.1 Avg. annual percolation – cover (inch) 6.7e-1 ~ 0.1 Avg. annual percolation – liner (inch) 2.0e-3 4.4E-04 Average annual head on liner (inch) <0.1 inch <0.1 inch Change in water storage (inch) 0.2 0.1 Peak daily percolation (inch) 0.54 0.14 Peak daily head on liner (inch) 0.4 0.2
Table 3.5 HELP Results for Category 4 Stockpile with a Final Cover
Quantity Case 5 Case 6
Avg. annual precipitation (inch) 29.2 29.2 Avg. annual runoff (inch) 5.9 9.9 Avg. annual evaporation (inch) 22.5 19.1 Avg annual lateral drainage (inch) 0.5 0.1 Avg. annual percolation - cover (inch) 6.7e-1 ~0.1 Avg. annual percolation - liner (inch) 4.1e-4 8e-5 Average annual head on liner (inch) <0.1 inch <0.1 inch Change in water storage (inch) 0.2 0.1 Peak daily percolation (gal/acre/day) 0.11 <0.1 Peak daily head on liner (inch) 0.4 0.2
4.0 CONCLUSIONS
HELP model simulations indicate an average annual percolation rates for Category 3 stockpiles without a final cover ranging from approximately 2 to 6 gal/acre/day with the average head on the liner varying from about 1 to 2 inches. For Category 3 open stockpiles, the maximum head on the liner is not likely to exceed 4 inches with the corresponding maximum percolation of approximately 10 gal/acre/day. HELP model results for the Category 4 stockpile without final cover indicate the average annual percolation rate is below 1 gal/acre/day with the corresponding average annual head on the liner of approximately 1 inch. The maximum calculated daily head for the open Category 4 stockpile is 3.1 inches. The corresponding maximum daily percolation rate is likely to remain below 2 gal/acre/day. HELP simulations considering stockpiles with the constructed final cover indicate percolation rates well below 1 gal/acre/day. Consequently, the corresponding head on the liner is less than 1 inch for all modeling scenarios considering capped stockpiles.

OFFICES ACROSS AFRICA, ASIA, AUSTRALIA, EUROPE, NORTH AMERICA AND SOUTH AMERICA
TECHNICAL MEMORANDUM Golder Associates Inc. 44 Union Blvd., Suite 300 Telephone: 303-980-0540 Lakewood, Colorado 80228 Fax: 303-985-2080
TO: John Borovsky, Barr Engineering DATE: May 29, 2007
FROM: Gordan Gjerapic P.E., GAI OUR REF.: 053-2209
CC: Brent R. Bronson P.E., GAI
RE: PONDING AND PERCOLATION ESTIMATES FOR THE CATEGORY 4 WASTE ROCK STOCKPILES, POLYMET PROJECT, MINNESOTA
1.0 INTRODUCTION
Golder Associates Inc. (Golder) has prepared this technical memorandum for Barr Engineering (Barr) to present predicted estimates of ponding and percolation for the Category 4 waste rock stockpiles. This work was completed based on the authorization provided during phone conversations and e-mail correspondence between Barr and Golder on May 9 and May 15 2007. The purpose of this work is to refine analyses presented in the technical memorandum “Ponding and Percolation Estimates for Categories 3 and 4 Waste Rock Stockpiles, PolyMet Project, Minnesota” by Golder from May 7 2007, and investigate the influence of liner grades and waste rock heights to water balance quantities. The results in this memorandum were obtained by using the HELP (Hydrologic Evaluation of Landfill Performance) model and should be viewed as estimates. The predicted results may be subject to further revisions pending on the future changes in the stockpile design and more detailed information on the properties of the stockpile, overliner, and cover materials.
2.0 INPUT PARAMETERS
All simulations use a 100-year weather record for Duluth, Minnesota, synthetically generated by HELP. The following material parameters were used for HELP simulations:
Table 2.1 Material Parameters for Modeling Scenarios without the Final Cover
Materials HELP No.
ksat (cm/s)
Thickness (inch)
Drainage Grades and Geomembrane Defects
Waste rock 21 3.00E-01 480 (1120)* Waste rock 21 0.03 480 (1120)* Overliner
(50 ft drains) 21 3.00E-01 12 0.2, 0.5, 1 and 2%
Overliner (50 ft drains) 21 3.00E-02 12 0.2, 0.5, 1 and 2%
LLDPE 36 4.00E-13 0.08 4 holes, 1 pinhole per acre subgrade 16 1.00E-06 12
* waste rock thickness of 1120 inch was used to model capped stockpiles.
TECHNICAL MEMORANDUM Barr Engineering May29, 2007 John Borovsky -2- 053-2209
I:\05\2209\0100\TM-HELP-Categ4WR-29May07\TM-HELP-Categ4WR-29May07.Doc Golder Associates
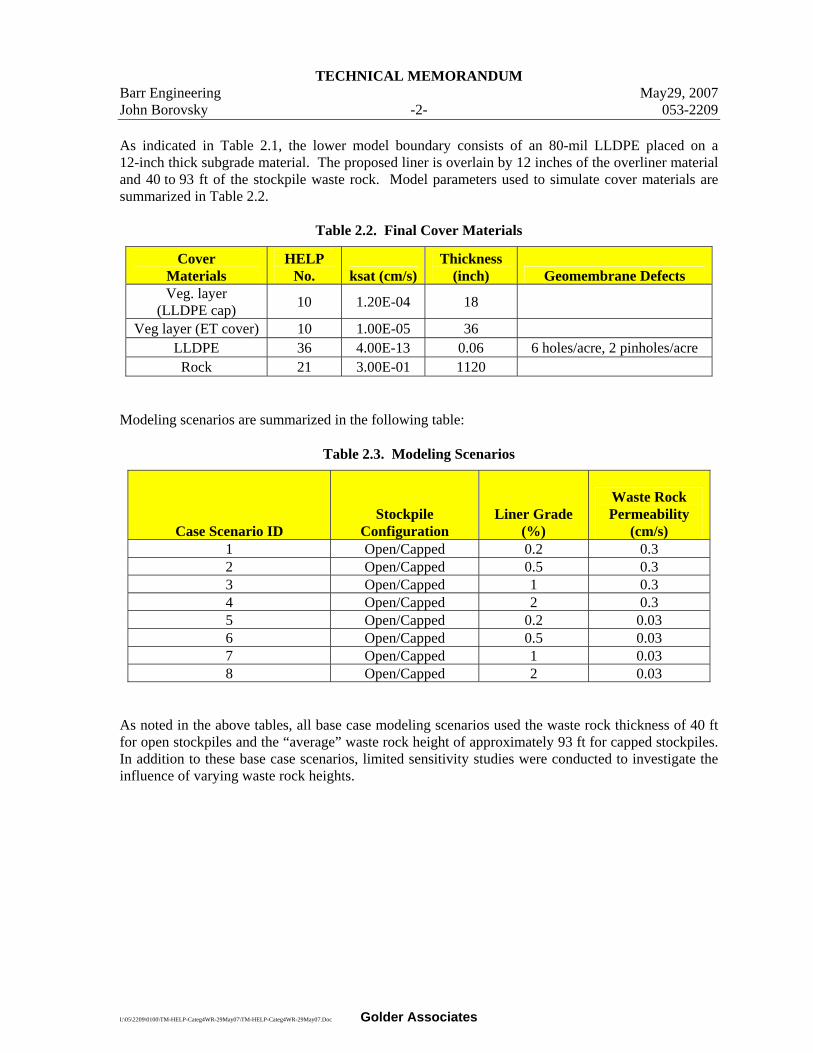
As indicated in Table 2.1, the lower model boundary consists of an 80-mil LLDPE placed on a 12-inch thick subgrade material. The proposed liner is overlain by 12 inches of the overliner material and 40 to 93 ft of the stockpile waste rock. Model parameters used to simulate cover materials are summarized in Table 2.2.
Table 2.2. Final Cover Materials
Cover Materials
HELP No. ksat (cm/s)
Thickness (inch) Geomembrane Defects
Veg. layer (LLDPE cap) 10 1.20E-04 18
Veg layer (ET cover) 10 1.00E-05 36 LLDPE 36 4.00E-13 0.06 6 holes/acre, 2 pinholes/acre Rock 21 3.00E-01 1120
Modeling scenarios are summarized in the following table:
Table 2.3. Modeling Scenarios
Case Scenario ID Stockpile
Configuration Liner Grade
(%)
Waste Rock Permeability
(cm/s) 1 Open/Capped 0.2 0.3 2 Open/Capped 0.5 0.3 3 Open/Capped 1 0.3 4 Open/Capped 2 0.3 5 Open/Capped 0.2 0.03 6 Open/Capped 0.5 0.03 7 Open/Capped 1 0.03 8 Open/Capped 2 0.03
As noted in the above tables, all base case modeling scenarios used the waste rock thickness of 40 ft for open stockpiles and the “average” waste rock height of approximately 93 ft for capped stockpiles. In addition to these base case scenarios, limited sensitivity studies were conducted to investigate the influence of varying waste rock heights.

TECHNICAL MEMORANDUM Barr Engineering May29, 2007 John Borovsky -3- 053-2209
I:\05\2209\0100\TM-HELP-Categ4WR-29May07\TM-HELP-Categ4WR-29May07.Doc Golder Associates
3.0 RESULTS FOR BASE CASE SCENARIOS
HELP results are summarized in the following tables:
Table 3.1. Average Annual Precipitation, Runoff, and Evaporation Values
Configuration
Avg. Annual Precipitation
(inch) Avg. Annual Runoff (inch)
Avg. Annual Evaporation
(inch) Open Stockpile – Case 1 to 4 29.2 3.9 12.4 Open Stockpile – Case 5 to 8 29.2 4.0 14.3 ET Cover – Case 1 to 8 29.2 9.9 19.1 Geomembrane Cover – Case 1 to 8 29.2 6.1 22.7
Table 3.2. HELP Results for Lateral Drainage, Percolation and Head on Liner Open Stockpile
Case Scenario ID
Avg. Annual Lateral
Drainage (inch)
Avg. Annual Percolation
(inch)
Avg. Annual Head on
Liner (inch)
Peak Daily Percolation
(inch)
Peak Daily Head on
Liner (inch) 1 12.7 2.6E-03 0.5 2.1E-05 1.6 2 12.7 1.3E-03 0.2 1.4E-05 1.2 3 12.7 6.8E-04 0.1 8.0E-06 0.8 4 12.7 3.6E-04 0.1 4.0E-06 0.5 5 10.7 1.0E-02 2.0 5.5E-05 4.9 6 10.7 7.6E-03 1.5 4.7E-05 4.1 7 10.7 4.7E-03 0.9 3.6E-05 3.2 8 10.7 2.5E-03 0.4 2.2E-05 2.2
Table 3.3. HELP Results for Lateral Drainage, Percolation and Head on Liner Stockpile with ET Cover
Case Scenario ID
Avg. Annual Lateral
Drainage (inch)
Avg. Annual Percolation
(inch)
Avg. Annual Head on
Liner (inch)
Peak Daily Percolation
(inch)
Peak Daily Head on
Liner (inch) 1 0.1 4.0E-05 <0.1 <1.0E-06 0.1 2 0.1 2.0E-05 <0.1 <1.0E-06 <0.1 3 0.1 1.0E-05 <0.1 <1.0E-06 <0.1 4 0.1 1.0E-05 <0.1 <1.0E-06 <0.1 5 <0.1 2.0E-05 <0.1 <1.0E-06 0.1 6 <0.1 1.0E-05 <0.1 <1.0E-06 <0.1 7 <0.1 1.0E-05 <0.1 <1.0E-06 <0.1 8 <0.1 <1.0E-05 <0.1 <1.0E-06 <0.1

TECHNICAL MEMORANDUM Barr Engineering May29, 2007 John Borovsky -4- 053-2209
I:\05\2209\0100\TM-HELP-Categ4WR-29May07\TM-HELP-Categ4WR-29May07.Doc Golder Associates
Table 3.4 HELP Results for Lateral Drainage, Percolation and Head on Liner
Stockpile with Geomembrane Cover
Case Scenario ID
Avg. Annual Lateral
Drainage (inch)
Avg. Annual Percolation
(inch)
Avg. Annual Head on
Liner (inch)
Peak Daily Percolation
(inch)
Peak Daily Head on
Liner (inch) 1 0.2 5.0E-05 <0.1 1.0E-06 0.2 2 0.2 3.0E-05 <0.1 <1.0E-06 <0.1 3 0.2 2.0E-05 <0.1 <1.0E-06 <0.1 4 0.2 1.0E-05 <0.1 <1.0E-06 <0.1 5 0.1 1.1E-04 <0.1 3.0E-06 0.4 6 0.1 5.1E-05 <0.1 2.0E-06 0.2 7 0.1 3.0E-05 <0.1 1.0E-06 0.1 8 0.1 2.0E-05 <0.1 1.0E-06 0.1
Table 3.5. Summary of Calculated Percolation Rates
Case Scenario ID
Open Stockpile Avg. Annual
Perc. (gal/acre/day)
Open Stockpile Peak Daily Perc. (gal/acre/day)
Capped Stockpile Avg. Annual
Perc. (gal/acre/day)
Capped Stockpile Peak Daily Perc. (gal/acre/day)
1 0.2 0.6 <0.1 <0.1 2 0.1 0.4 <0.1 <0.1 3 0.1 0.2 <0.1 <0.1 4 <0.1 0.1 <0.1 <0.1 5 0.8 1.5 <0.1 0.1 6 0.6 1.3 <0.1 <0.1 7 0.4 1.0 <0.1 <0.1 8 0.2 0.6 <0.1 <0.1
4.0 SENSITIVITY STUDIES
Results of sensitivity studies, conducted to investigating the influence of varying waste rock heights to water balance quantities, are divided into two sections:
• Sensitivity studies for open stockpiles; • Sensitivity studies for capped stockpiles.
4.1 Sensitivity studies for open stockpiles
Results of sensitivity studies for open stockpiles are summarized in the following tables:

TECHNICAL MEMORANDUM Barr Engineering May29, 2007 John Borovsky -5- 053-2209
I:\05\2209\0100\TM-HELP-Categ4WR-29May07\TM-HELP-Categ4WR-29May07.Doc Golder Associates
Table 4.1.1. Percentiles for Annual Head on Liner – Open Stockpile, Case 1
Percentile
Head on Liner for Waste Rock Height = 40 ft
(inch)
Head on Liner for Waste Rock Height = 80 ft
(inch)
Head on Liner for Waste Rock Height = 120 ft
(inch)
Head on Liner for Waste Rock Height = 160 ft
(inch) 5 0.36 0.36 0.34 0.29
10 0.38 0.39 0.39 0.39 25 0.41 0.43 0.44 0.43 50 0.47 0.47 0.46 0.46 75 0.50 0.51 0.51 0.51 90 0.56 0.54 0.54 0.53 95 0.57 0.56 0.56 0.56
Table 4.1.2. Percentiles for Daily Head on Liner – Open Stockpile, Case 1
Percentile
Head on Liner for Waste Rock Height = 40 ft
(inch)
Head on Liner for Waste Rock Height = 80 ft
(inch)
Head on Liner for Waste Rock Height = 120 ft
(inch)
Head on Liner for Waste Rock Height = 160 ft
(inch) 5 0.18 0.18 0.17 0.13
10 0.23 0.24 0.23 0.22 25 0.30 0.35 0.35 0.34 50 0.41 0.46 0.48 0.48 75 0.58 0.57 0.57 0.57 90 0.75 0.68 0.65 0.64 95 0.86 0.74 0.70 0.67
Table 4.1.3. Percentiles for Annual Percolation Rates – Open Stockpile, Case 1
Percentile
Percolation Rate for Waste Rock Height = 40 ft (gal/acre/day)
Percolation Rate for Waste Rock Height = 80 ft (gal/acre/day)
Percolation Rate for Waste Rock Height = 120 ft (gal/acre/day)
Percolation Rate for Waste Rock Height = 160 ft (gal/acre/day)
5 0.16 0.16 0.15 0.13 10 0.16 0.17 0.17 0.17 25 0.18 0.18 0.19 0.19 50 0.20 0.20 0.20 0.20 75 0.21 0.22 0.22 0.22 90 0.23 0.23 0.23 0.23 95 0.24 0.24 0.24 0.23

TECHNICAL MEMORANDUM Barr Engineering May29, 2007 John Borovsky -6- 053-2209
I:\05\2209\0100\TM-HELP-Categ4WR-29May07\TM-HELP-Categ4WR-29May07.Doc Golder Associates
Table 4.1.4 Percentiles for Daily Percolation Rates – Open Stockpile, Case 1
Percentile
Percolation Rate for Waste Rock Height = 40 ft (gal/acre/day)
Percolation Rate for Waste Rock Height = 80 ft (gal/acre/day)
Percolation Rate for Waste Rock Height = 120 ft (gal/acre/day)
Percolation Rate for Waste Rock Height = 160 ft (gal/acre/day)
5 0.09 0.09 0.08 0.07 10 0.11 0.11 0.11 0.10 25 0.14 0.16 0.15 0.15 50 0.18 0.20 0.20 0.21 75 0.25 0.24 0.24 0.24 90 0.31 0.28 0.27 0.27 95 0.35 0.31 0.29 0.28
Table 4.1.5. Percentiles for Annual Head on Liner – Open Stockpile, Case 2
Percentile
Head on Liner for Waste Rock Height = 40 ft
(inch)
Head on Liner for Waste Rock Height = 80 ft
(inch)
Head on Liner for Waste Rock Height = 120 ft
(inch)
Head on Liner for Waste Rock Height = 160 ft
(inch) 5 0.15 0.15 0.14 0.12
10 0.16 0.17 0.17 0.16 25 0.18 0.18 0.19 0.19 50 0.21 0.20 0.20 0.20 75 0.23 0.22 0.23 0.23 90 0.26 0.25 0.25 0.24 95 0.28 0.26 0.25 0.25

TECHNICAL MEMORANDUM Barr Engineering May29, 2007 John Borovsky -7- 053-2209
I:\05\2209\0100\TM-HELP-Categ4WR-29May07\TM-HELP-Categ4WR-29May07.Doc Golder Associates
Table 4.1.6. Percentiles for Daily Head on Liner – Open Stockpile, Case 2
Percentile
Head on Liner for Waste Rock Height = 40 ft
(inch)
Head on Liner for Waste Rock Height = 80 ft
(inch)
Head on Liner for Waste Rock Height = 120 ft
(inch)
Head on Liner for Waste Rock Height = 160 ft
(inch) 5 0.06 0.05 0.04 0.03
10 0.09 0.08 0.07 0.07 25 0.12 0.14 0.14 0.13 50 0.17 0.20 0.21 0.21 75 0.27 0.26 0.26 0.26 90 0.37 0.32 0.31 0.30 95 0.44 0.36 0.33 0.32
Table 4.1.7. Percentiles for Annual Percolation Rates – Open Stockpile, Case 2
Percentile
Percolation Rate for Waste Rock Height = 40 ft (gal/acre/day)
Percolation Rate for Waste Rock Height = 80 ft (gal/acre/day)
Percolation Rate for Waste Rock Height = 120 ft (gal/acre/day)
Percolation Rate for Waste Rock Height = 160 ft (gal/acre/day)
5 0.07 0.07 0.07 0.06 10 0.08 0.08 0.08 0.08 25 0.08 0.09 0.09 0.09 50 0.10 0.09 0.09 0.09 75 0.10 0.10 0.10 0.10 90 0.12 0.11 0.11 0.11 95 0.12 0.12 0.11 0.11
Table 4.1.8. Percentiles for Daily Percolation Rates – Open Stockpile, Case 2
Percentile
Percolation Rate for Waste Rock Height = 40 ft (gal/acre/day)
Percolation Rate for Waste Rock Height = 80 ft (gal/acre/day)
Percolation Rate for Waste Rock Height = 120 ft (gal/acre/day)
Percolation Rate for Waste Rock Height = 160 ft (gal/acre/day)
5 0.03 0.03 0.02 0.02 10 0.04 0.04 0.04 0.03 25 0.06 0.07 0.07 0.07 50 0.08 0.09 0.10 0.10 75 0.12 0.12 0.12 0.12 90 0.16 0.14 0.14 0.13 95 0.19 0.16 0.15 0.14

TECHNICAL MEMORANDUM Barr Engineering May29, 2007 John Borovsky -8- 053-2209
I:\05\2209\0100\TM-HELP-Categ4WR-29May07\TM-HELP-Categ4WR-29May07.Doc Golder Associates
Table 4.1.9. Percentiles for Annual Head on Liner – Open Stockpile, Case 3
Percentile
Head on Liner for Waste Rock Height = 40 ft
(inch)
Head on Liner for Waste Rock Height = 80 ft
(inch)
Head on Liner for Waste Rock Height = 120 ft
(inch)
Head on Liner for Waste Rock Height = 160 ft
(inch) 5 0.08 0.07 0.07 0.06
10 0.08 0.08 0.08 0.08 25 0.09 0.09 0.09 0.09 50 0.10 0.10 0.10 0.10 75 0.11 0.11 0.11 0.11 90 0.13 0.12 0.12 0.12 95 0.14 0.13 0.13 0.13
Table 4.1.10. Percentiles for Daily Head on Liner – Open Stockpile, Case 3
Percentile
Head on Liner for Waste Rock Height = 40 ft
(inch)
Head on Liner for Waste Rock Height = 80 ft
(inch)
Head on Liner for Waste Rock Height = 120 ft
(inch)
Head on Liner for Waste Rock Height = 160 ft
(inch) 5 0.02 0.02 0.01 0.01
10 0.04 0.03 0.03 0.03 25 0.06 0.07 0.07 0.07 50 0.09 0.10 0.11 0.11 75 0.13 0.13 0.13 0.13 90 0.19 0.16 0.15 0.15 95 0.23 0.19 0.17 0.16
Table 4.1.11. Percentiles for Annual Percolation Rates – Open Stockpile, Case 3
Percentile
Percolation Rate for Waste Rock Height = 40 ft (gal/acre/day)
Percolation Rate for Waste Rock Height = 80 ft (gal/acre/day)
Percolation Rate for Waste Rock Height = 120 ft (gal/acre/day)
Percolation Rate for Waste Rock Height = 160 ft (gal/acre/day)
5 0.04 0.04 0.04 0.03 10 0.04 0.04 0.04 0.04 25 0.04 0.05 0.05 0.05 50 0.05 0.05 0.05 0.05 75 0.06 0.05 0.06 0.06 90 0.06 0.06 0.06 0.06 95 0.07 0.06 0.06 0.06

TECHNICAL MEMORANDUM Barr Engineering May29, 2007 John Borovsky -9- 053-2209
I:\05\2209\0100\TM-HELP-Categ4WR-29May07\TM-HELP-Categ4WR-29May07.Doc Golder Associates
Table 4.1.12. Percentiles for Daily Percolation Rates – Open Stockpile, Case 3
Percentile
Percolation Rate for Waste Rock Height = 40 ft (gal/acre/day)
Percolation Rate for Waste Rock Height = 80 ft (gal/acre/day)
Percolation Rate for Waste Rock Height = 120 ft (gal/acre/day)
Percolation Rate for Waste Rock Height = 160 ft (gal/acre/day)
5 0.01 0.01 0.01 0.01 10 0.02 0.02 0.02 0.01 25 0.03 0.04 0.04 0.03 50 0.04 0.05 0.05 0.05 75 0.06 0.06 0.06 0.06 90 0.09 0.08 0.07 0.07 95 0.10 0.09 0.08 0.08
Table 4.1.13. Percentiles for Annual Head on Liner – Open Stockpile, Case 4
Percentile
Head on Liner for Waste Rock Height = 40 ft
(inch)
Head on Liner for Waste Rock Height = 80 ft
(inch)
Head on Liner for Waste Rock Height = 120 ft
(inch)
Head on Liner for Waste Rock Height = 160 ft
(inch) 5 0.04 0.04 0.04 0.03
10 0.04 0.04 0.04 0.04 25 0.04 0.05 0.05 0.05 50 0.05 0.05 0.05 0.05 75 0.06 0.06 0.06 0.06 90 0.06 0.06 0.06 0.06 95 0.07 0.06 0.06 0.06
Table 4.1.14. Percentiles for Daily Head on Liner – Open Stockpile, Case 4
Percentile
Head on Liner for Waste Rock Height = 40 ft
(inch)
Head on Liner for Waste Rock Height = 80 ft
(inch)
Head on Liner for Waste Rock Height = 120 ft
(inch)
Head on Liner for Waste Rock Height = 160 ft
(inch) 5 0.01 0.01 <0.01 <0.01
10 0.02 0.01 0.01 0.01 25 0.03 0.04 0.04 0.03 50 0.04 0.05 0.05 0.05 75 0.07 0.07 0.07 0.07 90 0.10 0.08 0.08 0.08 95 0.11 0.09 0.09 0.08

TECHNICAL MEMORANDUM Barr Engineering May29, 2007 John Borovsky -10- 053-2209
I:\05\2209\0100\TM-HELP-Categ4WR-29May07\TM-HELP-Categ4WR-29May07.Doc Golder Associates
Table 4.1.15. Percentiles for Annual Percolation Rates – Open Stockpile, Case 4
Percentile
Percolation Rate for Waste Rock Height = 40 ft (gal/acre/day)
Percolation Rate for Waste Rock Height = 80 ft (gal/acre/day)
Percolation Rate for Waste Rock Height = 120 ft (gal/acre/day)
Percolation Rate for Waste Rock Height = 160 ft (gal/acre/day)
5 0.02 0.02 0.02 0.02 10 0.02 0.02 0.02 0.02 25 0.02 0.02 0.03 0.03 50 0.03 0.03 0.03 0.03 75 0.03 0.03 0.03 0.03 90 0.03 0.03 0.03 0.03 95 0.04 0.03 0.03 0.03
Table 4.1.16. Percentiles for Daily Percolation Rates – Open Stockpile, Case 4
Percentile
Percolation Rate for Waste Rock Height = 40 ft (gal/acre/day)
Percolation Rate for Waste Rock Height = 80 ft (gal/acre/day)
Percolation Rate for Waste Rock Height = 120 ft (gal/acre/day)
Percolation Rate for Waste Rock Height = 160 ft (gal/acre/day)
5 0.01 0.00 0.00 <0.01 10 0.01 0.01 0.01 0.01 25 0.02 0.02 0.02 0.02 50 0.02 0.03 0.03 0.03 75 0.04 0.03 0.03 0.03 90 0.05 0.04 0.04 0.04 95 0.06 0.05 0.04 0.04
Table 4.1.17. Percentiles for Annual Head on Liner – Open Stockpile, Case 5
Percentile
Head on Liner for Waste Rock Height = 40 ft
(inch)
Head on Liner for Waste Rock Height = 80 ft
(inch)
Head on Liner for Waste Rock Height = 120 ft
(inch)
Head on Liner for Waste Rock Height = 160 ft
(inch) 5 1.68 1.51 0.40 0.02
10 1.80 1.79 1.67 1.37 25 1.92 1.95 1.92 1.93 50 2.08 2.07 2.06 2.05 75 2.23 2.24 2.19 2.20 90 2.33 2.31 2.31 2.30 95 2.41 2.38 2.37 2.34
TECHNICAL MEMORANDUM Barr Engineering May29, 2007 John Borovsky -11- 053-2209
I:\05\2209\0100\TM-HELP-Categ4WR-29May07\TM-HELP-Categ4WR-29May07.Doc Golder Associates
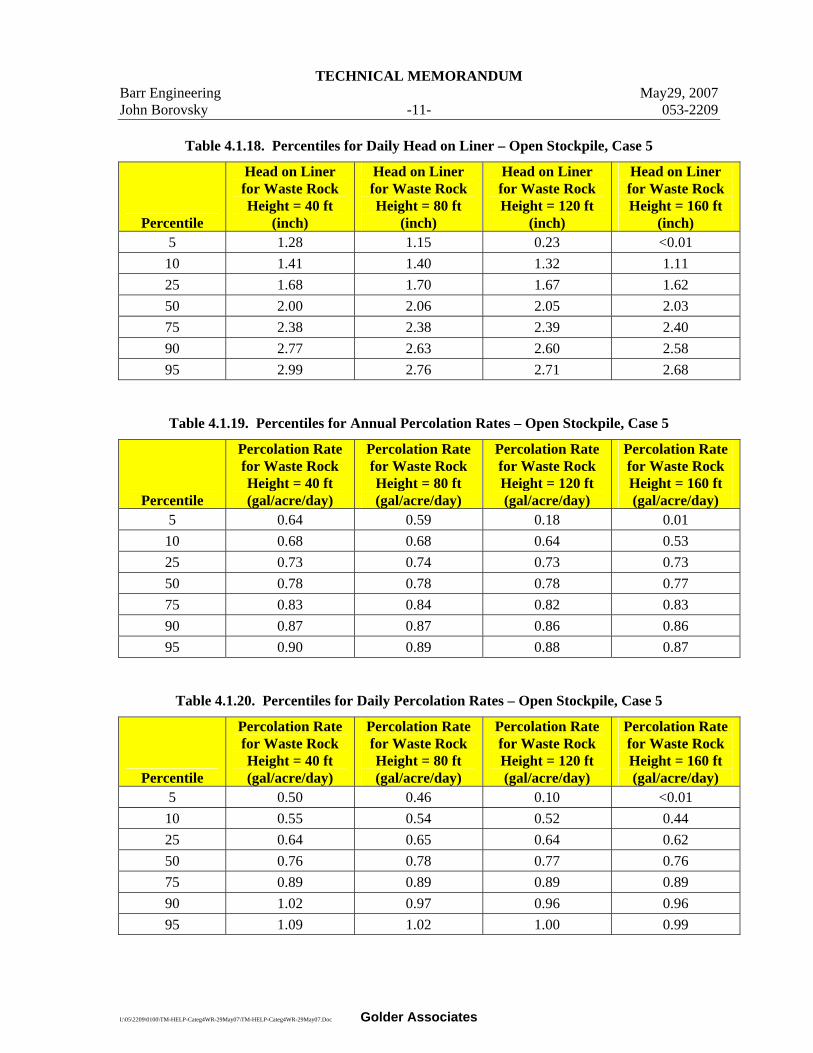
Table 4.1.18. Percentiles for Daily Head on Liner – Open Stockpile, Case 5
Percentile
Head on Liner for Waste Rock Height = 40 ft
(inch)
Head on Liner for Waste Rock Height = 80 ft
(inch)
Head on Liner for Waste Rock Height = 120 ft
(inch)
Head on Liner for Waste Rock Height = 160 ft
(inch) 5 1.28 1.15 0.23 <0.01
10 1.41 1.40 1.32 1.11 25 1.68 1.70 1.67 1.62 50 2.00 2.06 2.05 2.03 75 2.38 2.38 2.39 2.40 90 2.77 2.63 2.60 2.58 95 2.99 2.76 2.71 2.68
Table 4.1.19. Percentiles for Annual Percolation Rates – Open Stockpile, Case 5
Percentile
Percolation Rate for Waste Rock Height = 40 ft (gal/acre/day)
Percolation Rate for Waste Rock Height = 80 ft (gal/acre/day)
Percolation Rate for Waste Rock Height = 120 ft (gal/acre/day)
Percolation Rate for Waste Rock Height = 160 ft (gal/acre/day)
5 0.64 0.59 0.18 0.01 10 0.68 0.68 0.64 0.53 25 0.73 0.74 0.73 0.73 50 0.78 0.78 0.78 0.77 75 0.83 0.84 0.82 0.83 90 0.87 0.87 0.86 0.86 95 0.90 0.89 0.88 0.87
Table 4.1.20. Percentiles for Daily Percolation Rates – Open Stockpile, Case 5
Percentile
Percolation Rate for Waste Rock Height = 40 ft (gal/acre/day)
Percolation Rate for Waste Rock Height = 80 ft (gal/acre/day)
Percolation Rate for Waste Rock Height = 120 ft (gal/acre/day)
Percolation Rate for Waste Rock Height = 160 ft (gal/acre/day)
5 0.50 0.46 0.10 <0.01 10 0.55 0.54 0.52 0.44 25 0.64 0.65 0.64 0.62 50 0.76 0.78 0.77 0.76 75 0.89 0.89 0.89 0.89 90 1.02 0.97 0.96 0.96 95 1.09 1.02 1.00 0.99

TECHNICAL MEMORANDUM Barr Engineering May29, 2007 John Borovsky -12- 053-2209
I:\05\2209\0100\TM-HELP-Categ4WR-29May07\TM-HELP-Categ4WR-29May07.Doc Golder Associates
Table 4.1.21. Percentiles for Annual Head on Liner – Open Stockpile, Case 6
Percentile
Head on Liner for Waste Rock Height = 40 ft
(inch)
Head on Liner for Waste Rock Height = 80 ft
(inch)
Head on Liner for Waste Rock Height = 120 ft
(inch)
Head on Liner for Waste Rock Height = 160 ft
(inch) 5 1.13 0.98 0.18 0.01
10 1.24 1.23 1.13 0.85 25 1.35 1.38 1.35 1.36 50 1.50 1.49 1.49 1.48 75 1.64 1.65 1.61 1.62 90 1.74 1.72 1.72 1.70 95 1.82 1.78 1.78 1.74
Table 4.1.22. Percentiles for Daily Head on Liner – Open Stockpile, Case 6
Percentile
Head on Liner for Waste Rock Height = 40 ft
(inch)
Head on Liner for Waste Rock Height = 80 ft
(inch)
Head on Liner for Waste Rock Height = 120 ft
(inch)
Head on Liner for Waste Rock Height = 160 ft
(inch) 5 0.76 0.65 0.09 <0.01
10 0.88 0.86 0.79 0.63 25 1.12 1.14 1.11 1.07 50 1.42 1.48 1.47 1.45 75 1.79 1.78 1.79 1.80 90 2.15 2.02 1.99 1.98 95 2.37 2.15 2.10 2.07
Table 4.1.23. Percentiles for Annual Percolation Rates – Open Stockpile, Case 6
Percentile
Percolation Rate for Waste Rock Height = 40 ft (gal/acre/day)
Percolation Rate for Waste Rock Height = 80 ft (gal/acre/day)
Percolation Rate for Waste Rock Height = 120 ft (gal/acre/day)
Percolation Rate for Waste Rock Height = 160 ft (gal/acre/day)
5 0.45 0.39 0.08 0.01 10 0.49 0.48 0.45 0.35 25 0.53 0.54 0.53 0.53 50 0.58 0.58 0.58 0.57 75 0.63 0.63 0.62 0.62 90 0.66 0.66 0.66 0.65 95 0.69 0.68 0.68 0.66

TECHNICAL MEMORANDUM Barr Engineering May29, 2007 John Borovsky -13- 053-2209
I:\05\2209\0100\TM-HELP-Categ4WR-29May07\TM-HELP-Categ4WR-29May07.Doc Golder Associates
Table 4.1.24. Percentiles for Daily Percolation Rates – Open Stockpile, Case 6
Percentile
Percolation Rate for Waste Rock Height = 40 ft (gal/acre/day)
Percolation Rate for Waste Rock Height = 80 ft (gal/acre/day)
Percolation Rate for Waste Rock Height = 120 ft (gal/acre/day)
Percolation Rate for Waste Rock Height = 160 ft (gal/acre/day)
5 0.31 0.27 0.05 <0.01 10 0.36 0.35 0.32 0.26 25 0.45 0.45 0.44 0.43 50 0.55 0.58 0.57 0.56 75 0.68 0.68 0.68 0.69 90 0.81 0.76 0.75 0.75 95 0.88 0.81 0.79 0.78
Table 4.1.25. Percentiles for Annual Head on Liner – Open Stockpile, Case 7
Percentile
Head on Liner for Waste Rock Height = 40 ft
(inch)
Head on Liner for Waste Rock Height = 80 ft
(inch)
Head on Liner for Waste Rock Height = 120 ft
(inch)
Head on Liner for Waste Rock Height = 160 ft
(inch) 5 0.61 0.51 0.09 0.01
10 0.68 0.67 0.61 0.44 25 0.77 0.78 0.76 0.76 50 0.87 0.86 0.86 0.85 75 0.96 0.98 0.95 0.95 90 1.07 1.03 1.02 1.02 95 1.13 1.08 1.08 1.05
Table 4.1.26. Percentiles for Daily Head on Liner – Open Stockpile, Case 7
Percentile
Head on Liner for Waste Rock Height = 40 ft
(inch)
Head on Liner for Waste Rock Height = 80 ft
(inch)
Head on Liner for Waste Rock Height = 120 ft
(inch)
Head on Liner for Waste Rock Height = 160 ft
(inch) 5 0.33 0.27 0.04 <0.01
10 0.42 0.40 0.35 0.26 25 0.59 0.59 0.57 0.54 50 0.80 0.85 0.85 0.83 75 1.08 1.07 1.08 1.09 90 1.38 1.27 1.24 1.23 95 1.57 1.38 1.33 1.30

TECHNICAL MEMORANDUM Barr Engineering May29, 2007 John Borovsky -14- 053-2209
I:\05\2209\0100\TM-HELP-Categ4WR-29May07\TM-HELP-Categ4WR-29May07.Doc Golder Associates
Table 4.1.27. Percentiles for Annual Percolation Rates – Open Stockpile, Case 7
Percentile
Percolation Rate for Waste Rock Height = 40 ft (gal/acre/day)
Percolation Rate for Waste Rock Height = 80 ft (gal/acre/day)
Percolation Rate for Waste Rock Height = 120 ft (gal/acre/day)
Percolation Rate for Waste Rock Height = 160 ft (gal/acre/day)
5 0.25 0.22 0.05 <0.01 10 0.28 0.28 0.25 0.19 25 0.31 0.32 0.31 0.31 50 0.35 0.35 0.35 0.35 75 0.39 0.39 0.38 0.38 90 0.42 0.41 0.41 0.41 95 0.45 0.43 0.43 0.42
Table 4.1.28. Percentiles for Daily Percolation Rates – Open Stockpile, Case 7
Percentile
Percolation Rate for Waste Rock Height = 40 ft (gal/acre/day)
Percolation Rate for Waste Rock Height = 80 ft (gal/acre/day)
Percolation Rate for Waste Rock Height = 120 ft (gal/acre/day)
Percolation Rate for Waste Rock Height = 160 ft (gal/acre/day)
5 0.15 0.12 0.02 <0.01 10 0.18 0.17 0.16 0.12 25 0.25 0.25 0.24 0.23 50 0.33 0.35 0.35 0.34 75 0.43 0.43 0.43 0.43 90 0.54 0.50 0.49 0.48 95 0.61 0.54 0.52 0.51
Table 4.1.29. Percentiles for Annual Head on Liner – Open Stockpile, Case 8
Percentile
Head on Liner for Waste Rock Height = 40 ft
(inch)
Head on Liner for Waste Rock Height = 80 ft
(inch)
Head on Liner for Waste Rock Height = 120 ft
(inch)
Head on Liner for Waste Rock Height = 160 ft
(inch) 5 0.30 0.26 0.05 <0.01
10 0.34 0.34 0.31 0.22 25 0.38 0.39 0.38 0.38 50 0.44 0.43 0.43 0.43 75 0.48 0.49 0.48 0.47 90 0.54 0.52 0.51 0.51 95 0.57 0.54 0.54 0.53

TECHNICAL MEMORANDUM Barr Engineering May29, 2007 John Borovsky -15- 053-2209
I:\05\2209\0100\TM-HELP-Categ4WR-29May07\TM-HELP-Categ4WR-29May07.Doc Golder Associates
Table 4.1.30. Percentiles for Daily Head on Liner – Open Stockpile, Case 8
Percentile
Head on Liner for Waste Rock Height = 40 ft
(inch)
Head on Liner for Waste Rock Height = 80 ft
(inch)
Head on Liner for Waste Rock Height = 120 ft
(inch)
Head on Liner for Waste Rock Height = 160 ft
(inch) 5 0.13 0.10 0.02 <0.01
10 0.18 0.16 0.14 0.10 25 0.29 0.28 0.26 0.24 50 0.40 0.44 0.44 0.44 75 0.55 0.55 0.55 0.55 90 0.71 0.65 0.63 0.62 95 0.82 0.71 0.67 0.66
Table 4.1.31. Percentiles for Annual Percolation Rates – Open Stockpile, Case 8
Percentile
Percolation Rate for Waste Rock Height = 40 ft (gal/acre/day)
Percolation Rate for Waste Rock Height = 80 ft (gal/acre/day)
Percolation Rate for Waste Rock Height = 120 ft (gal/acre/day)
Percolation Rate for Waste Rock Height = 160 ft (gal/acre/day)
5 0.14 0.12 0.02 <0.01 10 0.15 0.15 0.14 0.10 25 0.17 0.17 0.17 0.17 50 0.19 0.19 0.19 0.18 75 0.21 0.21 0.20 0.20 90 0.23 0.22 0.22 0.22 95 0.24 0.23 0.23 0.22
Table 4.1.32. Percentiles for Daily Percolation Rates – Open Stockpile, Case 8
Percentile
Percolation Rate for Waste Rock Height = 40 ft (gal/acre/day)
Percolation Rate for Waste Rock Height = 80 ft (gal/acre/day)
Percolation Rate for Waste Rock Height = 120 ft (gal/acre/day)
Percolation Rate for Waste Rock Height = 160 ft (gal/acre/day)
5 0.06 0.05 0.01 <0.01 10 0.09 0.08 0.07 0.05 25 0.13 0.13 0.12 0.11 50 0.18 0.19 0.19 0.19 75 0.23 0.23 0.23 0.23 90 0.29 0.27 0.26 0.26 95 0.33 0.29 0.28 0.28

TECHNICAL MEMORANDUM Barr Engineering May29, 2007 John Borovsky -16- 053-2209
I:\05\2209\0100\TM-HELP-Categ4WR-29May07\TM-HELP-Categ4WR-29May07.Doc Golder Associates
4.2 Sensitivity studies for capped stockpiles
Results of sensitivity studies for capped stockpiles are summarized in the following tables:
Table 4.2.1. Percentiles for Annual Head on Liner – Capped Stockpile, Case 1
Percentile
Head on Liner for Waste Rock Height = 40 ft
ET Cover (inch)
Head on Liner for Waste Rock Height = 93 ft
ET Cover (inch)
Head on Liner for Waste Rock Height = 40 ft LLDPE Cap
(inch)
Head on Liner for Waste Rock
Height =93 ft LLDPE Cap
(inch) 5 <0.01 <0.01 <0.01 <0.01
10 <0.01 <0.01 <0.01 <0.01 25 <0.01 <0.01 <0.01 <0.01 50 <0.01 <0.01 0.01 <0.01 75 <0.01 <0.01 0.02 0.01 90 0.01 <0.01 0.02 0.02 95 0.01 <0.01 0.02 0.02
Table 4.2.2. Percentiles for Daily Head on Liner – Capped Stockpile, Case 1
Percentile
Head on Liner for Waste Rock Height = 40 ft
ET Cover (inch)
Head on Liner for Waste Rock Height = 93 ft
ET Cover (inch)
Head on Liner for Waste Rock Height = 40 ft LLDPE Cap
(inch)
Head on Liner for Waste Rock
Height =93 ft LLDPE Cap
(inch) 5 <0.01 <0.01 <0.01 <0.01
10 <0.01 <0.01 <0.01 <0.01 25 <0.01 <0.01 <0.01 <0.01 50 <0.01 <0.01 0.01 <0.01 75 <0.01 <0.01 0.02 0.01 90 0.01 <0.01 0.03 0.02 95 0.01 <0.01 0.03 0.03

TECHNICAL MEMORANDUM Barr Engineering May29, 2007 John Borovsky -17- 053-2209
I:\05\2209\0100\TM-HELP-Categ4WR-29May07\TM-HELP-Categ4WR-29May07.Doc Golder Associates
Table 4.2.3. Percentiles for Annual Percolation Rates – Capped Stockpile, Case 1
Percentile
Percolation Rate for Waste Rock Height = 40 ft
ET Cover (gal/acre/day)
Percolation Rate for Waste Rock Height = 93 ft
ET Cover (gal/acre/day)
Percolation Rate for Waste Rock Height = 40 ft LLDPE Cap
(gal/acre/day)
Percolation Rate for Waste Rock
Height =93 ft LLDPE Cap
(gal/acre/day) 5 <0.01 <0.01 <0.01 <0.01
10 <0.01 <0.01 <0.01 <0.01 25 <0.01 <0.01 <0.01 <0.01 50 <0.01 <0.01 <0.01 <0.01 75 <0.01 <0.01 <0.01 <0.01 90 <0.01 <0.01 <0.01 <0.01 95 <0.01 <0.01 0.01 0.01
Table 4.2.4. Percentiles for Daily Percolation Rates – Capped Stockpile, Case 1
Percentile
Percolation Rate for Waste Rock Height = 40 ft
ET Cover (gal/acre/day)
Percolation Rate for Waste Rock Height = 93 ft
ET Cover (gal/acre/day)
Percolation Rate for Waste Rock Height = 40 ft LLDPE Cap
(gal/acre/day)
Percolation Rate for Waste Rock
Height =93 ft LLDPE Cap
(gal/acre/day) 5 <0.01 <0.01 <0.01 <0.01
10 <0.01 <0.01 <0.01 <0.01 25 <0.01 <0.01 <0.01 <0.01 50 <0.01 <0.01 <0.01 <0.01 75 <0.01 <0.01 <0.01 <0.01 90 <0.01 <0.01 0.01 0.01 95 <0.01 <0.01 0.01 0.01

TECHNICAL MEMORANDUM Barr Engineering May29, 2007 John Borovsky -18- 053-2209
I:\05\2209\0100\TM-HELP-Categ4WR-29May07\TM-HELP-Categ4WR-29May07.Doc Golder Associates
Table 4.2.5. Percentiles for Annual Head on Liner – Capped Stockpile, Case 2
Percentile
Head on Liner for Waste Rock Height = 40 ft
ET Cover (inch)
Head on Liner for Waste Rock Height = 93 ft
ET Cover (inch)
Head on Liner for Waste Rock Height = 40 ft LLDPE Cap
(inch)
Head on Liner for Waste Rock
Height =93 ft LLDPE Cap
(inch) 5 <0.01 <0.01 <0.01 <0.01
10 <0.01 <0.01 <0.01 <0.01 25 <0.01 <0.01 <0.01 <0.01 50 <0.01 <0.01 <0.01 <0.01 75 <0.01 <0.01 <0.01 <0.01 90 <0.01 <0.01 <0.01 <0.01 95 <0.01 <0.01 <0.01 <0.01
Table 4.2.6. Percentiles for Daily Head on Liner – Capped Stockpile, Case 2
Percentile
Head on Liner for Waste Rock Height = 40 ft
ET Cover (inch)
Head on Liner for Waste Rock Height = 93 ft
ET Cover (inch)
Head on Liner for Waste Rock Height = 40 ft LLDPE Cap
(inch)
Head on Liner for Waste Rock
Height =93 ft LLDPE Cap
(inch) 5 <0.01 <0.01 <0.01 <0.01
10 <0.01 <0.01 <0.01 <0.01 25 <0.01 <0.01 <0.01 <0.01 50 <0.01 <0.01 <0.01 <0.01 75 <0.01 <0.01 <0.01 <0.01 90 <0.01 <0.01 0.01 <0.01 95 <0.01 <0.01 0.01 0.01

TECHNICAL MEMORANDUM Barr Engineering May29, 2007 John Borovsky -19- 053-2209
I:\05\2209\0100\TM-HELP-Categ4WR-29May07\TM-HELP-Categ4WR-29May07.Doc Golder Associates
Table 4.2.7. Percentiles for Annual Percolation Rates – Capped Stockpile, Case 2
Percentile
Percolation Rate for Waste Rock Height = 40 ft
ET Cover (gal/acre/day)
Percolation Rate for Waste Rock Height = 93 ft
ET Cover (gal/acre/day)
Percolation Rate for Waste Rock Height = 40 ft LLDPE Cap
(gal/acre/day)
Percolation Rate for Waste Rock
Height =93 ft LLDPE Cap
(gal/acre/day) 5 <0.01 <0.01 <0.01 <0.01
10 <0.01 <0.01 <0.01 <0.01 25 <0.01 <0.01 <0.01 <0.01 50 <0.01 <0.01 <0.01 <0.01 75 <0.01 <0.01 <0.01 <0.01 90 <0.01 <0.01 <0.01 <0.01 95 <0.01 <0.01 <0.01 <0.01
Table 4.2.8. Percentiles for Daily Percolation Rates – Capped Stockpile, Case 2
Percentile
Percolation Rate for Waste Rock Height = 40 ft
ET Cover (gal/acre/day)
Percolation Rate for Waste Rock Height = 93 ft
ET Cover (gal/acre/day)
Percolation Rate for Waste Rock Height = 40 ft LLDPE Cap
(gal/acre/day)
Percolation Rate for Waste Rock
Height =93 ft LLDPE Cap
(gal/acre/day) 5 <0.01 <0.01 <0.01 <0.01
10 <0.01 <0.01 <0.01 <0.01 25 <0.01 <0.01 <0.01 <0.01 50 <0.01 <0.01 <0.01 <0.01 75 <0.01 <0.01 <0.01 <0.01 90 <0.01 <0.01 <0.01 <0.01 95 <0.01 <0.01 <0.01 <0.01

TECHNICAL MEMORANDUM Barr Engineering May29, 2007 John Borovsky -20- 053-2209
I:\05\2209\0100\TM-HELP-Categ4WR-29May07\TM-HELP-Categ4WR-29May07.Doc Golder Associates
Table 4.2.9. Percentiles for Annual Head on Liner – Capped Stockpile, Case 3
Percentile
Head on Liner for Waste Rock Height = 40 ft
ET Cover (inch)
Head on Liner for Waste Rock Height = 93 ft
ET Cover (inch)
Head on Liner for Waste Rock Height = 40 ft LLDPE Cap
(inch)
Head on Liner for Waste Rock
Height =93 ft LLDPE Cap
(inch) 5 <0.01 <0.01 <0.01 <0.01
10 <0.01 <0.01 <0.01 <0.01 25 <0.01 <0.01 <0.01 <0.01 50 <0.01 <0.01 <0.01 <0.01 75 <0.01 <0.01 <0.01 <0.01 90 <0.01 <0.01 <0.01 <0.01 95 <0.01 <0.01 <0.01 <0.01
Table 4.2.10. Percentiles for Daily Head on Liner – Capped Stockpile, Case 3
Percentile
Head on Liner for Waste Rock Height = 40 ft
ET Cover (inch)
Head on Liner for Waste Rock Height = 93 ft
ET Cover (inch)
Head on Liner for Waste Rock Height = 40 ft LLDPE Cap
(inch)
Head on Liner for Waste Rock
Height =93 ft LLDPE Cap
(inch) 5 <0.01 <0.01 <0.01 <0.01
10 <0.01 <0.01 <0.01 <0.01 25 <0.01 <0.01 <0.01 <0.01 50 <0.01 <0.01 <0.01 <0.01 75 <0.01 <0.01 <0.01 <0.01 90 <0.01 <0.01 <0.01 <0.01 95 <0.01 <0.01 <0.01 <0.01

TECHNICAL MEMORANDUM Barr Engineering May29, 2007 John Borovsky -21- 053-2209
I:\05\2209\0100\TM-HELP-Categ4WR-29May07\TM-HELP-Categ4WR-29May07.Doc Golder Associates
Table 4.2.11. Percentiles for Annual Percolation Rates – Capped Stockpile, Case 3
Percentile
Percolation Rate for Waste Rock Height = 40 ft
ET Cover (gal/acre/day)
Percolation Rate for Waste Rock Height = 93 ft
ET Cover (gal/acre/day)
Percolation Rate for Waste Rock Height = 40 ft LLDPE Cap
(gal/acre/day)
Percolation Rate for Waste Rock
Height =93 ft LLDPE Cap
(gal/acre/day) 5 <0.01 <0.01 <0.01 <0.01
10 <0.01 <0.01 <0.01 <0.01 25 <0.01 <0.01 <0.01 <0.01 50 <0.01 <0.01 <0.01 <0.01 75 <0.01 <0.01 <0.01 <0.01 90 <0.01 <0.01 <0.01 <0.01 95 <0.01 <0.01 <0.01 <0.01
Table 4.2.12. Percentiles for Daily Percolation Rates – Capped Stockpile, Case 3
Percentile
Percolation Rate for Waste Rock Height = 40 ft
ET Cover (gal/acre/day)
Percolation Rate for Waste Rock Height = 93 ft
ET Cover (gal/acre/day)
Percolation Rate for Waste Rock Height = 40 ft LLDPE Cap
(gal/acre/day)
Percolation Rate for Waste Rock
Height =93 ft LLDPE Cap
(gal/acre/day) 5 <0.01 <0.01 <0.01 <0.01
10 <0.01 <0.01 <0.01 <0.01 25 <0.01 <0.01 <0.01 <0.01 50 <0.01 <0.01 <0.01 <0.01 75 <0.01 <0.01 <0.01 <0.01 90 <0.01 <0.01 <0.01 <0.01 95 <0.01 <0.01 <0.01 <0.01

TECHNICAL MEMORANDUM Barr Engineering May29, 2007 John Borovsky -22- 053-2209
I:\05\2209\0100\TM-HELP-Categ4WR-29May07\TM-HELP-Categ4WR-29May07.Doc Golder Associates
Table 4.2.13. Percentiles for Annual Head on Liner – Capped Stockpile, Case 4
Percentile
Head on Liner for Waste Rock Height = 40 ft
ET Cover (inch)
Head on Liner for Waste Rock Height = 93 ft
ET Cover (inch)
Head on Liner for Waste Rock Height = 40 ft LLDPE Cap
(inch)
Head on Liner for Waste Rock
Height =93 ft LLDPE Cap
(inch) 5 <0.01 <0.01 <0.01 <0.01
10 <0.01 <0.01 <0.01 <0.01 25 <0.01 <0.01 <0.01 <0.01 50 <0.01 <0.01 <0.01 <0.01 75 <0.01 <0.01 <0.01 <0.01 90 <0.01 <0.01 <0.01 <0.01 95 <0.01 <0.01 <0.01 <0.01
Table 4.2.14. Percentiles for Daily Head on Liner – Capped Stockpile, Case 4
Percentile
Head on Liner for Waste Rock Height = 40 ft
ET Cover (inch)
Head on Liner for Waste Rock Height = 93 ft
ET Cover (inch)
Head on Liner for Waste Rock Height = 40 ft LLDPE Cap
(inch)
Head on Liner for Waste Rock
Height =93 ft LLDPE Cap
(inch) 5 <0.01 <0.01 <0.01 <0.01
10 <0.01 <0.01 <0.01 <0.01 25 <0.01 <0.01 <0.01 <0.01 50 <0.01 <0.01 <0.01 <0.01 75 <0.01 <0.01 <0.01 <0.01 90 <0.01 <0.01 <0.01 <0.01 95 <0.01 <0.01 <0.01 <0.01

TECHNICAL MEMORANDUM Barr Engineering May29, 2007 John Borovsky -23- 053-2209
I:\05\2209\0100\TM-HELP-Categ4WR-29May07\TM-HELP-Categ4WR-29May07.Doc Golder Associates
Table 4.2.15. Percentiles for Annual Percolation Rates – Capped Stockpile, Case 4
Percentile
Percolation Rate for Waste Rock Height = 40 ft
ET Cover (gal/acre/day)
Percolation Rate for Waste Rock Height = 93 ft
ET Cover (gal/acre/day)
Percolation Rate for Waste Rock Height = 40 ft LLDPE Cap
(gal/acre/day)
Percolation Rate for Waste Rock
Height =93 ft LLDPE Cap
(gal/acre/day) 5 <0.01 <0.01 <0.01 <0.01
10 <0.01 <0.01 <0.01 <0.01 25 <0.01 <0.01 <0.01 <0.01 50 <0.01 <0.01 <0.01 <0.01 75 <0.01 <0.01 <0.01 <0.01 90 <0.01 <0.01 <0.01 <0.01 95 <0.01 <0.01 <0.01 <0.01
Table 4.2.16. Percentiles for Daily Percolation Rates – Capped Stockpile, Case 4
Percentile
Percolation Rate for Waste Rock Height = 40 ft
ET Cover (gal/acre/day)
Percolation Rate for Waste Rock Height = 93 ft
ET Cover (gal/acre/day)
Percolation Rate for Waste Rock Height = 40 ft LLDPE Cap
(gal/acre/day)
Percolation Rate for Waste Rock
Height =93 ft LLDPE Cap
(gal/acre/day) 5 <0.01 <0.01 <0.01 <0.01
10 <0.01 <0.01 <0.01 <0.01 25 <0.01 <0.01 <0.01 <0.01 50 <0.01 <0.01 <0.01 <0.01 75 <0.01 <0.01 <0.01 <0.01 90 <0.01 <0.01 <0.01 <0.01 95 <0.01 <0.01 <0.01 <0.01

TECHNICAL MEMORANDUM Barr Engineering May29, 2007 John Borovsky -24- 053-2209
I:\05\2209\0100\TM-HELP-Categ4WR-29May07\TM-HELP-Categ4WR-29May07.Doc Golder Associates
Table 4.2.17. Percentiles for Annual Head on Liner – Capped Stockpile, Case 5
Percentile
Head on Liner for Waste Rock Height = 40 ft
ET Cover (inch)
Head on Liner for Waste Rock Height = 93 ft
ET Cover (inch)
Head on Liner for Waste Rock Height = 40 ft LLDPE Cap
(inch)
Head on Liner for Waste Rock
Height =93 ft LLDPE Cap
(inch) 5 <0.01 <0.01 <0.01 <0.01
10 <0.01 <0.01 <0.01 <0.01 25 <0.01 <0.01 <0.01 <0.01 50 0.03 <0.01 0.10 <0.01 75 0.06 <0.01 0.15 0.02 90 0.09 <0.01 0.20 0.06 95 0.11 0.01 0.23 0.10
Table 4.2.18. Percentiles for Daily Head on Liner – Capped Stockpile, Case 5
Percentile
Head on Liner for Waste Rock Height = 40 ft
ET Cover (inch)
Head on Liner for Waste Rock Height = 93 ft
ET Cover (inch)
Head on Liner for Waste Rock Height = 40 ft LLDPE Cap
(inch)
Head on Liner for Waste Rock
Height =93 ft LLDPE Cap
(inch) 5 <0.01 <0.01 <0.01 <0.01
10 <0.01 <0.01 <0.01 <0.01 25 <0.01 <0.01 <0.01 <0.01 50 0.02 <0.01 0.08 <0.01 75 0.06 <0.01 0.16 0.02 90 0.10 <0.01 0.22 0.07 95 0.11 0.01 0.24 0.11

TECHNICAL MEMORANDUM Barr Engineering May29, 2007 John Borovsky -25- 053-2209
I:\05\2209\0100\TM-HELP-Categ4WR-29May07\TM-HELP-Categ4WR-29May07.Doc Golder Associates
Table 4.2.19. Percentiles for Annual Percolation Rates – Capped Stockpile, Case 5
Percentile
Percolation Rate for Waste Rock Height = 40 ft
ET Cover (gal/acre/day)
Percolation Rate for Waste Rock Height = 93 ft
ET Cover (gal/acre/day)
Percolation Rate for Waste Rock Height = 40 ft LLDPE Cap
(gal/acre/day)
Percolation Rate for Waste Rock
Height =93 ft LLDPE Cap
(gal/acre/day) 5 <0.01 <0.01 <0.01 <0.01
10 <0.01 <0.01 <0.01 <0.01 25 <0.01 <0.01 <0.01 <0.01 50 0.02 <0.01 0.04 <0.01 75 0.03 <0.01 0.06 <0.01 90 0.05 <0.01 0.07 0.02 95 0.06 <0.01 0.08 0.04
Table 4.2.20. Percentiles for Daily Percolation Rates – Capped Stockpile, Case 5
Percentile
Percolation Rate for Waste Rock Height = 40 ft
ET Cover (gal/acre/day)
Percolation Rate for Waste Rock Height = 93 ft
ET Cover (gal/acre/day)
Percolation Rate for Waste Rock Height = 40 ft LLDPE Cap
(gal/acre/day)
Percolation Rate for Waste Rock
Height =93 ft LLDPE Cap
(gal/acre/day) 5 <0.01 <0.01 <0.01 <0.01
10 <0.01 <0.01 <0.01 <0.01 25 <0.01 <0.01 <0.01 <0.01 50 0.01 <0.01 0.03 <0.01 75 0.03 <0.01 0.06 <0.01 90 0.05 <0.01 0.08 0.03 95 0.06 <0.01 0.08 0.04

TECHNICAL MEMORANDUM Barr Engineering May29, 2007 John Borovsky -26- 053-2209
I:\05\2209\0100\TM-HELP-Categ4WR-29May07\TM-HELP-Categ4WR-29May07.Doc Golder Associates
Table 4.2.21. Percentiles for Annual Head on Liner – Capped Stockpile, Case 6
Percentile
Head on Liner for Waste Rock Height = 40 ft
ET Cover (inch)
Head on Liner for Waste Rock Height = 93 ft
ET Cover (inch)
Head on Liner for Waste Rock Height = 40 ft LLDPE Cap
(inch)
Head on Liner for Waste Rock
Height =93 ft LLDPE Cap
(inch) 5 <0.01 <0.01 <0.01 <0.01
10 <0.01 <0.01 <0.01 <0.01 25 <0.01 <0.01 <0.01 <0.01 50 0.01 <0.01 0.04 <0.01 75 0.02 <0.01 0.06 <0.01 90 0.04 <0.01 0.08 0.03 95 0.05 <0.01 0.10 0.04
Table 4.2.22. Percentiles for Daily Head on Liner – Capped Stockpile, Case 6
Percentile
Head on Liner for Waste Rock Height = 40 ft
ET Cover (inch)
Head on Liner for Waste Rock Height = 93 ft
ET Cover (inch)
Head on Liner for Waste Rock Height = 40 ft LLDPE Cap
(inch)
Head on Liner for Waste Rock
Height =93 ft LLDPE Cap
(inch) 5 <0.01 <0.01 <0.01 <0.01
10 <0.01 <0.01 <0.01 <0.01 25 <0.01 <0.01 <0.01 <0.01 50 <0.01 <0.01 0.03 <0.01 75 0.02 <0.01 0.07 <0.01 90 0.04 <0.01 0.09 0.03 95 0.05 <0.01 0.11 0.05
TECHNICAL MEMORANDUM Barr Engineering May29, 2007 John Borovsky -27- 053-2209
I:\05\2209\0100\TM-HELP-Categ4WR-29May07\TM-HELP-Categ4WR-29May07.Doc Golder Associates
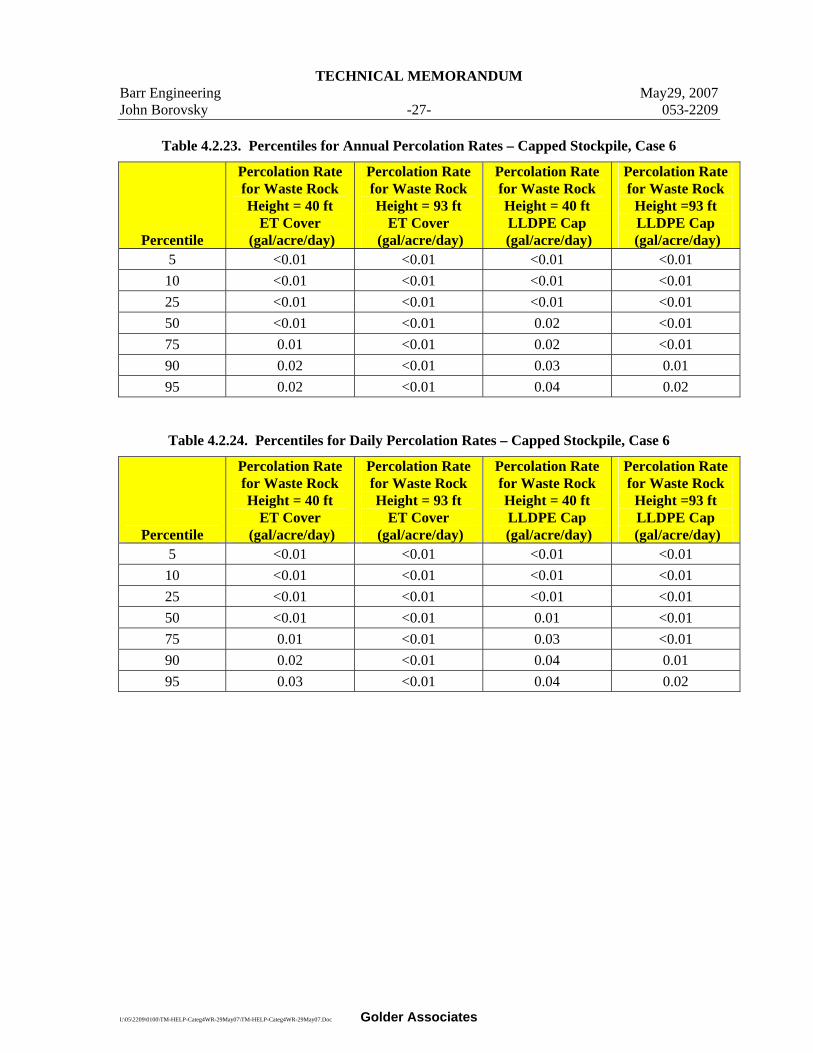
Table 4.2.23. Percentiles for Annual Percolation Rates – Capped Stockpile, Case 6
Percentile
Percolation Rate for Waste Rock Height = 40 ft
ET Cover (gal/acre/day)
Percolation Rate for Waste Rock Height = 93 ft
ET Cover (gal/acre/day)
Percolation Rate for Waste Rock Height = 40 ft LLDPE Cap
(gal/acre/day)
Percolation Rate for Waste Rock
Height =93 ft LLDPE Cap
(gal/acre/day) 5 <0.01 <0.01 <0.01 <0.01
10 <0.01 <0.01 <0.01 <0.01 25 <0.01 <0.01 <0.01 <0.01 50 <0.01 <0.01 0.02 <0.01 75 0.01 <0.01 0.02 <0.01 90 0.02 <0.01 0.03 0.01 95 0.02 <0.01 0.04 0.02
Table 4.2.24. Percentiles for Daily Percolation Rates – Capped Stockpile, Case 6
Percentile
Percolation Rate for Waste Rock Height = 40 ft
ET Cover (gal/acre/day)
Percolation Rate for Waste Rock Height = 93 ft
ET Cover (gal/acre/day)
Percolation Rate for Waste Rock Height = 40 ft LLDPE Cap
(gal/acre/day)
Percolation Rate for Waste Rock
Height =93 ft LLDPE Cap
(gal/acre/day) 5 <0.01 <0.01 <0.01 <0.01
10 <0.01 <0.01 <0.01 <0.01 25 <0.01 <0.01 <0.01 <0.01 50 <0.01 <0.01 0.01 <0.01 75 0.01 <0.01 0.03 <0.01 90 0.02 <0.01 0.04 0.01 95 0.03 <0.01 0.04 0.02

TECHNICAL MEMORANDUM Barr Engineering May29, 2007 John Borovsky -28- 053-2209
I:\05\2209\0100\TM-HELP-Categ4WR-29May07\TM-HELP-Categ4WR-29May07.Doc Golder Associates
Table 4.2.25. Percentiles for Annual Head on Liner – Capped Stockpile, Case 7
Percentile
Head on Liner for Waste Rock Height = 40 ft
ET Cover (inch)
Head on Liner for Waste Rock Height = 93 ft
ET Cover (inch)
Head on Liner for Waste Rock Height = 40 ft LLDPE Cap
(inch)
Head on Liner for Waste Rock
Height =93 ft LLDPE Cap
(inch) 5 <0.01 <0.01 <0.01 <0.01
10 <0.01 <0.01 <0.01 <0.01 25 <0.01 <0.01 <0.01 <0.01 50 <0.01 <0.01 0.02 <0.01 75 0.01 <0.01 0.03 <0.01 90 0.02 <0.01 0.04 0.01 95 0.02 <0.01 0.05 0.02
Table 4.2.26. Percentiles for Daily Head on Liner – Capped Stockpile, Case 7
Percentile
Head on Liner for Waste Rock Height = 40 ft
ET Cover (inch)
Head on Liner for Waste Rock Height = 93 ft
ET Cover (inch)
Head on Liner for Waste Rock Height = 40 ft LLDPE Cap
(inch)
Head on Liner for Waste Rock
Height =93 ft LLDPE Cap
(inch) 5 <0.01 <0.01 <0.01 <0.01
10 <0.01 <0.01 <0.01 <0.01 25 <0.01 <0.01 <0.01 <0.01 50 <0.01 <0.01 0.01 <0.01 75 0.01 <0.01 0.03 <0.01 90 0.02 <0.01 0.05 0.02 95 0.02 <0.01 0.06 0.02

TECHNICAL MEMORANDUM Barr Engineering May29, 2007 John Borovsky -29- 053-2209
I:\05\2209\0100\TM-HELP-Categ4WR-29May07\TM-HELP-Categ4WR-29May07.Doc Golder Associates
Table 4.2.27. Percentiles for Annual Percolation Rates – Capped Stockpile, Case 7
Percentile
Percolation Rate for Waste Rock Height = 40 ft
ET Cover (gal/acre/day)
Percolation Rate for Waste Rock Height = 93 ft
ET Cover (gal/acre/day)
Percolation Rate for Waste Rock Height = 40 ft LLDPE Cap
(gal/acre/day)
Percolation Rate for Waste Rock
Height =93 ft LLDPE Cap
(gal/acre/day) 5 <0.01 <0.01 <0.01 <0.01
10 <0.01 <0.01 <0.01 <0.01 25 <0.01 <0.01 <0.01 <0.01 50 <0.01 <0.01 <0.01 <0.01 75 <0.01 <0.01 0.01 <0.01 90 0.01 <0.01 0.02 <0.01 95 0.01 <0.01 0.02 0.01
Table 4.2.28. Percentiles for Daily Percolation Rates – Capped Stockpile, Case 7
Percentile
Percolation Rate for Waste Rock Height = 40 ft
ET Cover (gal/acre/day)
Percolation Rate for Waste Rock Height = 93 ft
ET Cover (gal/acre/day)
Percolation Rate for Waste Rock Height = 40 ft LLDPE Cap
(gal/acre/day)
Percolation Rate for Waste Rock
Height =93 ft LLDPE Cap
(gal/acre/day) 5 <0.01 <0.01 <0.01 <0.01
10 <0.01 <0.01 <0.01 <0.01 25 <0.01 <0.01 <0.01 <0.01 50 <0.01 <0.01 <0.01 <0.01 75 <0.01 <0.01 0.01 <0.01 90 0.01 <0.01 0.02 <0.01 95 0.01 <0.01 0.02 0.01

TECHNICAL MEMORANDUM Barr Engineering May29, 2007 John Borovsky -30- 053-2209
I:\05\2209\0100\TM-HELP-Categ4WR-29May07\TM-HELP-Categ4WR-29May07.Doc Golder Associates
Table 4.2.29. Percentiles for Annual Head on Liner – Capped Stockpile, Case 8
Percentile
Head on Liner for Waste Rock Height = 40 ft
ET Cover (inch)
Head on Liner for Waste Rock Height = 93 ft
ET Cover (inch)
Head on Liner for Waste Rock Height = 40 ft LLDPE Cap
(inch)
Head on Liner for Waste Rock
Height =93 ft LLDPE Cap
(inch) 5 <0.01 <0.01 <0.01 <0.01
10 <0.01 <0.01 <0.01 <0.01 25 <0.01 <0.01 <0.01 <0.01 50 <0.01 <0.01 0.01 <0.01 75 <0.01 <0.01 0.02 <0.01 90 <0.01 <0.01 0.02 <0.01 95 0.01 <0.01 0.02 0.01
Table 4.2.30. Percentiles for Daily Head on Liner – Capped Stockpile, Case 8
Percentile
Head on Liner for Waste Rock Height = 40 ft
ET Cover (inch)
Head on Liner for Waste Rock Height = 93 ft
ET Cover (inch)
Head on Liner for Waste Rock Height = 40 ft LLDPE Cap
(inch)
Head on Liner for Waste Rock
Height =93 ft LLDPE Cap
(inch) 5 <0.01 <0.01 <0.01 <0.01
10 <0.01 <0.01 <0.01 <0.01 25 <0.01 <0.01 <0.01 <0.01 50 <0.01 <0.01 <0.01 <0.01 75 <0.01 <0.01 0.02 <0.01 90 <0.01 <0.01 0.02 <0.01 95 0.01 <0.01 0.03 0.01
TECHNICAL MEMORANDUM Barr Engineering May29, 2007 John Borovsky -31- 053-2209
I:\05\2209\0100\TM-HELP-Categ4WR-29May07\TM-HELP-Categ4WR-29May07.Doc Golder Associates
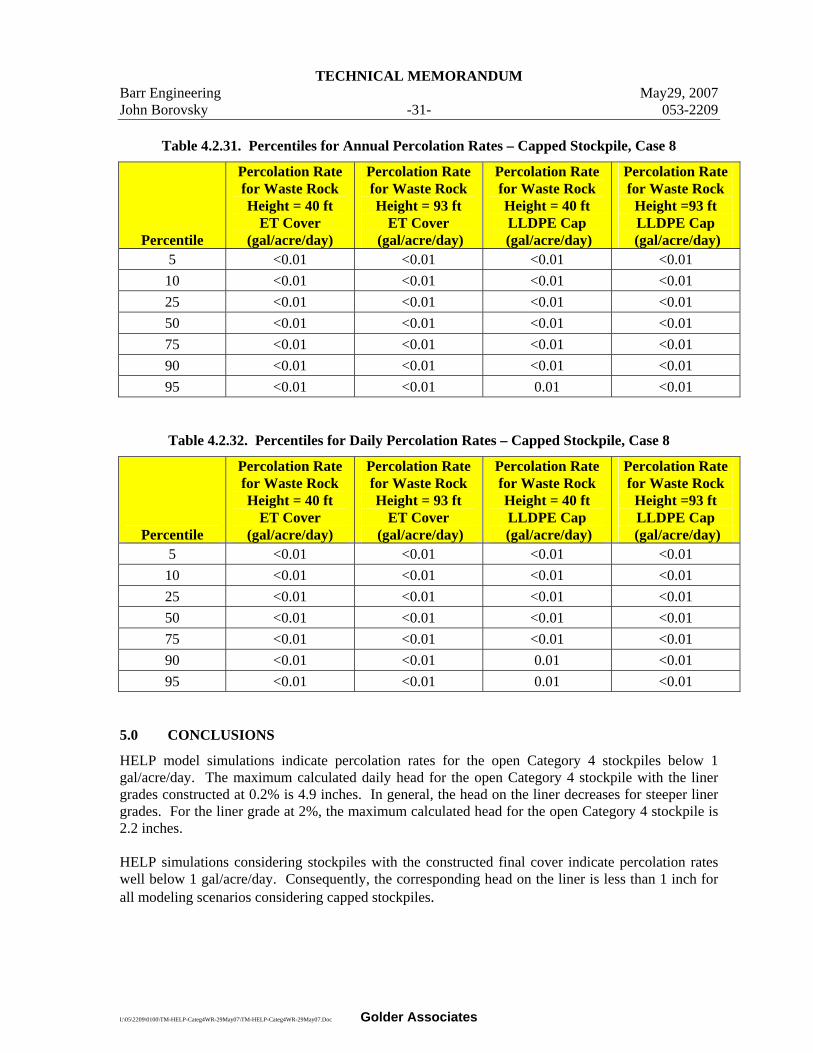
Table 4.2.31. Percentiles for Annual Percolation Rates – Capped Stockpile, Case 8
Percentile
Percolation Rate for Waste Rock Height = 40 ft
ET Cover (gal/acre/day)
Percolation Rate for Waste Rock Height = 93 ft
ET Cover (gal/acre/day)
Percolation Rate for Waste Rock Height = 40 ft LLDPE Cap
(gal/acre/day)
Percolation Rate for Waste Rock
Height =93 ft LLDPE Cap
(gal/acre/day) 5 <0.01 <0.01 <0.01 <0.01
10 <0.01 <0.01 <0.01 <0.01 25 <0.01 <0.01 <0.01 <0.01 50 <0.01 <0.01 <0.01 <0.01 75 <0.01 <0.01 <0.01 <0.01 90 <0.01 <0.01 <0.01 <0.01 95 <0.01 <0.01 0.01 <0.01
Table 4.2.32. Percentiles for Daily Percolation Rates – Capped Stockpile, Case 8
Percentile
Percolation Rate for Waste Rock Height = 40 ft
ET Cover (gal/acre/day)
Percolation Rate for Waste Rock Height = 93 ft
ET Cover (gal/acre/day)
Percolation Rate for Waste Rock Height = 40 ft LLDPE Cap
(gal/acre/day)
Percolation Rate for Waste Rock
Height =93 ft LLDPE Cap
(gal/acre/day) 5 <0.01 <0.01 <0.01 <0.01
10 <0.01 <0.01 <0.01 <0.01 25 <0.01 <0.01 <0.01 <0.01 50 <0.01 <0.01 <0.01 <0.01 75 <0.01 <0.01 <0.01 <0.01 90 <0.01 <0.01 0.01 <0.01 95 <0.01 <0.01 0.01 <0.01
5.0 CONCLUSIONS
HELP model simulations indicate percolation rates for the open Category 4 stockpiles below 1 gal/acre/day. The maximum calculated daily head for the open Category 4 stockpile with the liner grades constructed at 0.2% is 4.9 inches. In general, the head on the liner decreases for steeper liner grades. For the liner grade at 2%, the maximum calculated head for the open Category 4 stockpile is 2.2 inches. HELP simulations considering stockpiles with the constructed final cover indicate percolation rates well below 1 gal/acre/day. Consequently, the corresponding head on the liner is less than 1 inch for all modeling scenarios considering capped stockpiles.

OFFICES ACROSS AFRICA, ASIA, AUSTRALIA, EUROPE, NORTH AMERICA AND SOUTH AMERICA
TECHNICAL MEMORANDUM Golder Associates Inc. 44 Union Blvd., Suite 300 Telephone: 303-980-0540 Lakewood, Colorado 80228 Fax: 303-985-2080
TO: John Borovsky, Barr Engineering DATE: May 31, 2007
FROM: Gordan Gjerapic P.E., GAI OUR REF.: 053-2209
CC: Brent R. Bronson P.E., GAI
RE: PONDING AND PERCOLATION ESTIMATES FOR THE CATEGORY 1/2 AND CATEGORY 3 WASTE ROCK STOCKPILES, POLYMET PROJECT, MINNESOTA
1.0 INTRODUCTION Golder Associates Inc. (Golder) has prepared this technical memorandum for Barr Engineering (Barr) to present predicted estimates of ponding and percolation for the Category 1/2 and Category 3 waste rock stockpiles. This work was completed based on the authorization provided via e-mail correspondence between Barr and Golder on May 28, 2007. The purpose of this work is to refine analyses presented in the previous reports (RS-23 and RS-49 issued by Golder on February 16, 2007) and the technical memorandum “Ponding and Percolation Estimates for Categories 3 and 4 Waste Rock Stockpiles, PolyMet Project, Minnesota” (Golder, May 7 2007). In particular, this memorandum investigates the influence of liner grades and spacing between the leach collection pipes to the water balance and to predicted percolation rates. The results in this memorandum were obtained by using the HELP (Hydrologic Evaluation of Landfill Performance) model developed by the US Environmental Protection Agency (Schroeder, P.R. et. al.). The predicted results may be subject to further revisions pending on the future changes in the stockpile design and more detailed information on the properties of the stockpile, overliner, and cover materials. 2.0 INPUT PARAMETERS All simulations use a 100-year weather record for Duluth, Minnesota, synthetically generated by HELP. The following material parameters were used for HELP simulations:
Table 2.1. Material Parameters for Modeling Scenarios without the Final Cover
Materials HELP No.
ksat (cm/s)
Thickness (inch)
Drainage Grades and Geomembrane Defects
Waste rock 21 3.00E-01 480 Overliner (50 or 100 ft drains) 21 3.00E-01 12 0.2%, 0.5% slope
LLDPE 36 4.00E-13 0.08 4 holes, 1 pinhole per acre Subgrade Cat. 1/2 16 5.00E-07 12 Subgrade Cat. 3 16 1.00E-05 12

TECHNICAL MEMORANDUM Barr Engineering May 31, 2007 John Borovsky -2- 053-2209
I:\05\2209\0100\TM-Cat1_2_3wrstkpiles-31May07\TM-Cat1_2_3wrstkpiles-31May07.Doc Golder Associates
As indicated in Table 2.1, the lower model boundary for Category 3 stockpiles consists of an 80-mil LLDPE placed on a 12 inch thick subgrade material. The proposed liner is overlain by 12 inches of the overliner material and 40 ft of the stockpile waste rock. The HELP model for Category 1/2 stockpiles assumes 12 inch of subgrade material overlain by 12 inches of the overliner material and 40 ft of the stockpile waste rock. Modeling scenarios are summarized in the following table:
Table 2.2. Modeling Scenarios
Simulation No. Type Liner Grade
(%) Drainage Length
(ft)
Simulation ID Cat. 1-1 Open Stockpile 0.2 50 C1OS1DF Cat. 1-2 Open Stockpile 0.2 100 C1OS1DH Cat. 1-3 Open Stockpile 0.5 50 C1OS2DF Cat. 1-4 Open Stockpile 0.5 100 C1OS2DH Cat. 3-1 Open Stockpile 0.2 50 C3OS1DF Cat. 3-2 Open Stockpile 0.2 100 C3OS1DH Cat. 3-3 Open Stockpile 0.5 50 C3OS2DF Cat. 3-4 Open Stockpile 0.5 100 C3OS2DH
3.0 RESULTS HELP results are summarized in the following tables:
Table 3.1. Average Annual Precipitation, Runoff, and Evaporation Values
Avg. Annual Precipitation (inch)
Avg. Annual Runoff (inch)
Avg. Annual Evaporation (inch)
29.2 3.9 12.4
Table 3.2. HELP Results for Lateral Drainage, Percolation, and Head on Liner Open Stockpile
Simulation No.
Avg. Annual Lateral
Drainage (inch)
Avg. Annual Percolation
(inch)
Avg. Annual Head on
Liner (inch)
Peak Daily Percolation
(inch)
Peak Daily Head on
Liner (inch) Cat. 1-1 6.68 6.05 0.25 1.9e-2 1.51 Cat. 1-2 6.50 6.24 0.49 2.0e-2 2.80 Cat. 1-3 6.87 5.86 0.11 1.8e-2 1.06 Cat. 1-4 6.73 6.01 0.22 1.9e-2 2.0 Cat. 3-1 12.72 0.01 0.46 1.1e-4 1.64 Cat. 3-2 12.70 0.03 0.92 2.0e-4 3.10 Cat. 3-3 12.73 0.01 0.21 7.5e-5 1.16 Cat. 3-4 12.72 0.01 0.41 1.3e-4 2.19

TECHNICAL MEMORANDUM Barr Engineering May 31, 2007 John Borovsky -3- 053-2209
I:\05\2209\0100\TM-Cat1_2_3wrstkpiles-31May07\TM-Cat1_2_3wrstkpiles-31May07.Doc Golder Associates
Table 3.5. Summary of Calculated Percolation Rates
Simulation No.
Open Stockpile Avg. Annual Perc.
(gal/acre/day)
Open Stockpile Peak Daily Perc. (gal/acre/day)
Cat. 1-1 450 513 Cat. 1-2 464 556 Cat. 1-3 436 493 Cat. 1-4 447 520 Cat. 3-1 1.1 3.0 Cat. 3-2 2.0 5.5 Cat. 3-3 0.5 2.0 Cat. 3-4 1.0 3.6
4.0 CONCLUSIONS HELP model simulations indicate average annual percolation rates for the open Category 1/2 stockpiles is between 400 and 500 gal/acre/day. The maximum calculated daily head for the open Category 1/2 stockpile with the liner grades constructed at 0.2% is 2.8 inches. In general, the head on the liner decreases for steeper liner grades and smaller spacing between the leach collection pipes. HELP simulations for Category 3 stockpiles indicate maximum percolation rates of approximately 2 gal/acre/day for the liner grades of 0.2% and the leach collection pipe spacing of 100 ft. The maximum calculated daily head for the open Category 3 stockpile is 3.1 inches. The presented percolation values are likely conservative as they neglect the waste rock uptake potential and the buffering of peak daily values for the stockpile heights in excess of 40 ft. 5.0 REFERENCES Schroeder, P.R., Dozier, T.S., Zappi, P.A., McEnroe, B.M., Sjostrom, J.W., and Peyton, R.L. 1994.
“The Hydrologic Evaluation of Landfill Performance (HELP) Model: Engineering Documentation for Version 3.” EPA/600/R-94/168b, U.S. Environmental Protection Agency Office of Research and Development, Washington, DC.

OFFICES ACROSS AFRICA, ASIA, AUSTRALIA, EUROPE, NORTH AMERICA AND SOUTH AMERICA
TECHNICAL MEMORANDUM
TO: Miguel Wong, Barr Engineering DATE: December 17, 2007
FR: Gordan Gjerapic P.E., Golder Associates Inc. OUR REF: 053-2209
CC:
RE:
Brent Bronson, P.E., Golder Associates Inc.
DRAFT PERCOLATION ESTIMATES FOR DRAINAGE SUMPS, PROCESS WATER PONDS AND WWTF EQUALIZATION PONDS, POLYMET PROJECT, MINNESOTA
1.0 INTRODUCTION
Golder Associates Inc. (Golder) has prepared this draft technical memorandum for Barr Engineering (Barr) to present predicted percolation estimates for drainage sumps, process water ponds and Waste Water Treatment Facility (WWTF) equalization ponds. This work was completed based on authorization provided via e-mail correspondence between Barr and Golder on December 6, 2007. The methodology used to estimate the percolation through the drainage sump liner systems for (1) Category 1 and 2 stockpiles and (2) Category 3 and 4 stockpiles are based on the previous technical memorandum by Golder “Percolation Estimates for Drainage Sumps, PolyMet Project, Minnesota” dated July 26,2007. Estimated percolation rates for WWTF equalization ponds and process water ponds were determined based on the input parameters from Barr as outlined in the e-mail correspondence from December 6, 2007.
2.0 APPROACH
All calculations were conducted using the methodology for leakage through single, double and composite liners described by Hutchison et al. (1992) relying on work by Bonaparte et al. (1989), Giroud and Bonaparte (1989) and Giroud et al. (1989; 1992; 1994). The calculations involving liquid migration through composite liners were updated using the formulation by Giroud (1997) for geosynthetics with circular, square and rectangular defects:
( )[ ] 74.09.01.095.0/1.01 ssqo khathCQ += - for circular defects (1)
( )[ ] 74.09.02.095.0/1.01 ssqo khbthCQ += - for square defects (2)
( )[ ] ( )[ ] 87.045.01.095.074.09.02.095.0 )(/2.01/1.01 ssqssqo khbbBthCkhbthCQ −+++= ∞
- for rectangular defects (3)

TECHNICAL MEMORANDUM Barr Engineering December 17, 2007 Miguel Wong -2- 053-2209
I:\05\2209\0100\TM-DFTPERCEST_17DEC07\TM-DFTPERCOLEST-17DEC07.DOC Golder Associates
Where:
Q = flow rate through the composite liner (m3/s);
Cqo = flow coefficient through circular opening depending on the quality of contact between the soil and geomembrane (extreme values are 0.21 for good contact and 1.15 for poor contact);
∞qC = flow coefficient through an infinitely long defect (B=∞ ) with the width b depending on the quality of contact between the soil and geomembrane (extreme values are 0.52 for good contact and 1.22 for poor contact);
a = circular defect area (m2);
b = width of square/rectangular defect (m);
B =length of rectangular defect (m);
h = head of liquid on top of the geomembrane (m);
ks = hydraulic conductivity of the soil layer below geomembrane (m/s); and
ts = thickness of the soil layer below geomembrane (m).
Giroud (1997) noted that Equations (1), (2) and (3) are not applicable for the liquid head on top of geomembrane larger than 3 m or for the soil liner permeability (ks) above the kg value defined as:
( )[ ] ⎪⎭
⎪⎬⎫
⎪⎩
⎪⎨⎧
+=
4.095.0
8.1
/1.013891.0
hthCdk
sqog , (4)
where d is the diameter of the circular defect. For the case where ks exceeds the kg value, Torricelli’s equation for orifice flow is used (see e.g. Giroud and Bonaparte, 1989 and Foose et al., 2001):
hgaQ 26.0= , (5)
with the variables defined above. Based on the Geosyntec recommendations outlined in Hutchison (1992), a circular defect area (a) of 0.1 cm2 (0.016 inch2) was used for drainage sumps and process ponds liner system performance evaluations containing geomembrane. Similar recommendations can be found in Giroud et al. (1994). All liners were assumed to exhibit good contact between the soil and the geomembrane. Percolation through the WWTF equalization pond liners was calculated based on the input parameters provided by Barr as follows:
- Liner is a composite Geomembrane / Geosynthetic Clay liner - Circular, square, and rectangular defects are present - Total frequency of defects is 2.5 per acre (n = 2.5) - Total liner leakage is based on summing the leakage rate for 2.5 circular defects,
2.5 square defects, and 2.5 rectangular defects and then dividing by 3 (i.e. assuming 0.83 defects of each type per acre)
- Defect Sizes: o Circular = 1 cm diameter o Square = 1 cm width (b) o Rectangular = 2 meter length (B) x 1 cm width (b)
TECHNICAL MEMORANDUM Barr Engineering December 17, 2007 Miguel Wong -3- 053-2209
I:\05\2209\0100\TM-DFTPERCEST_17DEC07\TM-DFTPERCOLEST-17DEC07.DOC Golder Associates
- Contact quality coefficient of 0.21 assumed for circular and square defects, coefficients of 0.21 and 0.52 assumed for rectangular defects.
- Liner thickness = 6.5 mm - Subgrade soil permeability Ks = 3 x 10⁻⁹ cm/sec.
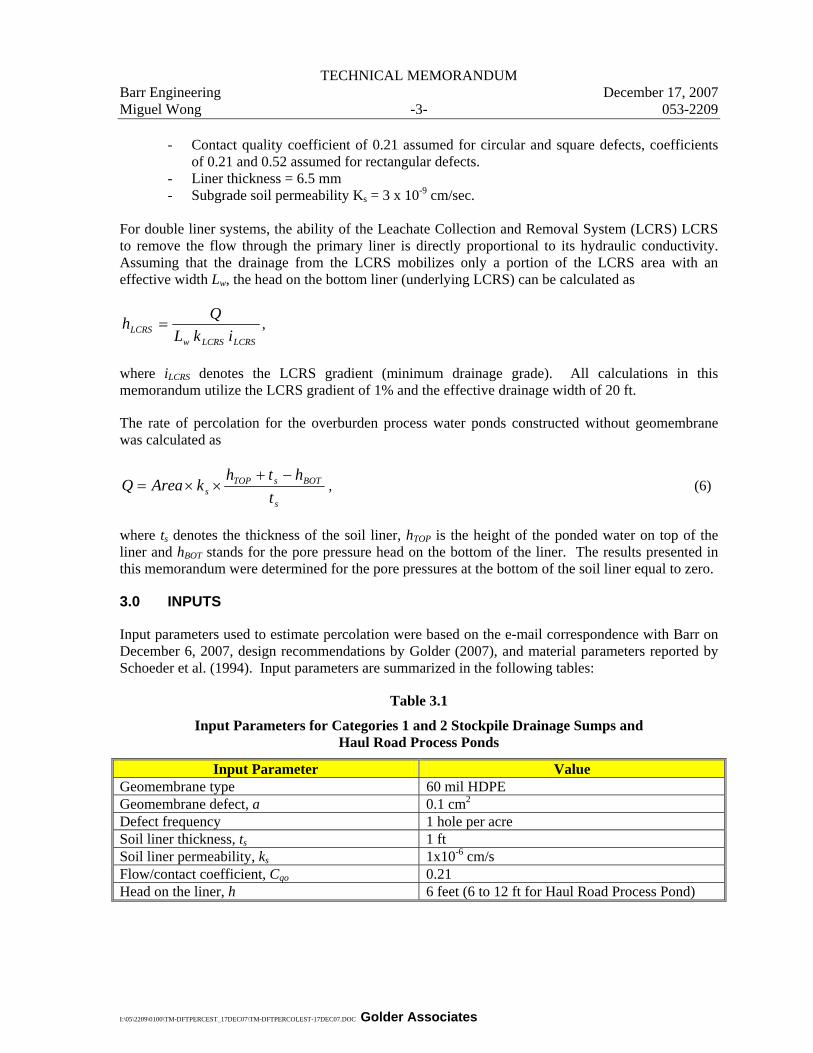
For double liner systems, the ability of the Leachate Collection and Removal System (LCRS) LCRS to remove the flow through the primary liner is directly proportional to its hydraulic conductivity. Assuming that the drainage from the LCRS mobilizes only a portion of the LCRS area with an effective width Lw, the head on the bottom liner (underlying LCRS) can be calculated as
LCRSLCRSwLCRS ikL
Qh = ,
where iLCRS denotes the LCRS gradient (minimum drainage grade). All calculations in this memorandum utilize the LCRS gradient of 1% and the effective drainage width of 20 ft.
The rate of percolation for the overburden process water ponds constructed without geomembrane was calculated as
s
BOTsTOPs t
hthkAreaQ
−+××= , (6)
where ts denotes the thickness of the soil liner, hTOP is the height of the ponded water on top of the liner and hBOT stands for the pore pressure head on the bottom of the liner. The results presented in this memorandum were determined for the pore pressures at the bottom of the soil liner equal to zero.
3.0 INPUTS
Input parameters used to estimate percolation were based on the e-mail correspondence with Barr on December 6, 2007, design recommendations by Golder (2007), and material parameters reported by Schoeder et al. (1994). Input parameters are summarized in the following tables:
Table 3.1
Input Parameters for Categories 1 and 2 Stockpile Drainage Sumps and Haul Road Process Ponds
Input Parameter Value Geomembrane type 60 mil HDPE Geomembrane defect, a 0.1 cm2 Defect frequency 1 hole per acre Soil liner thickness, ts 1 ft Soil liner permeability, ks 1x10⁻⁶ cm/s Flow/contact coefficient, Cqo 0.21 Head on the liner, h 6 feet (6 to 12 ft for Haul Road Process Pond)

TECHNICAL MEMORANDUM Barr Engineering December 17, 2007 Miguel Wong -4- 053-2209
I:\05\2209\0100\TM-DFTPERCEST_17DEC07\TM-DFTPERCOLEST-17DEC07.DOC Golder Associates
Table 3.2
Input Parameters for Categories 3 and 4 Stockpile Drainage Sumps and Rail Transfer Process Pond
Input Parameter Value Top geomembrane type 60 mil HDPE Top geomembrane defect, a 0.1 cm2 Top geomembrane defect frequency 1 hole per acre Top geomembrane contact coefficient, Cqo 0.21 Head on the top liner, h 6 feet (6 to 12 ft for Rail TransferPond) LRCS type Geonet LRCS thickness 0.6 cm LRCS permeability 33 cm/s Bottom geomembrane type 40 mil HDPE Bottom geomembrane defect, a 0.1 cm2 Bottom geomembrane defect frequency 1 hole per acre Bottom geomembrane contact coefficient, Cqo 0.21 Soil liner thickness, ts 1 ft Soil liner permeability, ks 1x10⁻⁶ cm/s
Table 3.3
Input Parameters for Overburden Process Ponds
Input Parameter Value Soil liner thickness, ts 2 ft Soil liner permeability, ks 1x10⁻⁶ cm/s Head on the liner, h 6 to 12 feet
Table 3.4
Input Parameters WWTF Equalization Ponds
Input Parameter Value Geomembrane type 60 mil HDPE Geomembrane circular defect area, a 0.785 cm2 Geomembrane square defect area 1.0 cm2 Geomembrane rectangular defect area 200 cm2 Defect frequency 2.5 defects per acre (0.83 defects of each type per acre) GCL thickness, ts 6.5 mm GCL permeability, ks 3x10⁻⁹ cm/s Flow/contact coefficient, Cqo 0.21 Flow/contact coefficient, ∞qC 0.52 Head on the liner, h varies

TECHNICAL MEMORANDUM Barr Engineering December 17, 2007 Miguel Wong -5- 053-2209
I:\05\2209\0100\TM-DFTPERCEST_17DEC07\TM-DFTPERCOLEST-17DEC07.DOC Golder Associates
Sump design details (effective liner areas and average liquid depths) were provided by Barr and are summarized in the following tables:
Table 3.5
Sump Design Details
Sump Area (acres) Stockpile Average Depth
(ft) Liner Type S-1 0.1 Cat 1/2 6 1/2 S-2 0.2 Cat 1/2 6 1/2 S-3 0.1 Cat 1/2 6 1/2 S-4 0.1 Cat 1/2 6 1/2 S-5 0.1 Cat 1/2 6 1/2 S-6 1.5 Cat 4 LO 6 3/4 S-7 1.1 Cat 4 LO 6 3/4 S-8 1.3 Cat 4 6 3/4 S-9 1.3 Cat 3 LO 6 3/4
S-10 1.5 Cat 3 LO 6 3/4 S-11 1.5 Cat 3 6 3/4
Table 3.6
Process Water Pond Design Details
Design Option 1* Design Option 2*
Pond Water Source Liner Type Area 1 (acres)
Avg. Depth 1 (ft)
Area 2 (acres)
Avg. Depth 2 (ft)
PW-1 Overburden None 1.7 12 3.3 6 PW-7 Overburden None 3.1 12 6.2 6 PW-2 Haul Roads 1/2 0.7 12 1.4 6 PW-4 Haul Roads 1/2 1.5 12 2.9 6 PW-3 Rail Transfer 3/4 0.4 12 0.7 6 * Note – Two possible design scenarios exist for each pond (resulting in the same volume, but
different depths/areas)
4.0 RESULTS
The results of the calculations discussed above are summarized in the following tables.
Table 4.1
Unitized Drainage Sump Percolation Rates
Category 1 and 2 Category 3 and 4 Flow rate (m3/s/acre) 2.2x10⁻⁷ 3.5x10⁻¹⁰
Flow rate (gal/acre/day) 5.0 8.0x10⁻³

TECHNICAL MEMORANDUM Barr Engineering December 17, 2007 Miguel Wong -6- 053-2209
I:\05\2209\0100\TM-DFTPERCEST_17DEC07\TM-DFTPERCOLEST-17DEC07.DOC Golder Associates
Table 4.2
Unitized Process Water Ponds Percolation Rates (gal/acre/day)
Head on Liner, h=6 ft Head on Liner, h=12 ft* Overburden Ponds 3.7x10³ 6.5x10³ Haul Road Ponds 5.0 12.4
Rail Transfer Pond 8.0x10⁻³ 1.1x10⁻² * The application of the Giroud’s (1997) liner leakage equations is restricted to the pond levels up to 10 ft.
Therefore, the percolation results for 12 ft head should be viewed as approximate noting that the liner head exceeds the published threshold value by 20%.
Table 4.3
Unitized WWTF Equalization Ponds Percolation Rates
Head (ft)
Qcircular (m3/s/defect)
Qsquare (m3/s/defect)
Qrectangular (m3/s/defect)
Qavg* (gal/acre/day)
1 2.2E-09 2.3E-09 4.6E-09 0.2 2 7.2E-09 7.4E-09 1.3E-08 0.5 3 1.5E-08 1.5E-08 2.5E-08 1.0 4 2.5E-08 2.5E-08 4.0E-08 1.7 5 3.7E-08 3.8E-08 5.8E-08 2.5 6 5.1E-08 5.2E-08 7.8E-08 3.5 7 6.7E-08 6.9E-08 1.0E-07 4.5 8 8.6E-08 8.8E-08 1.3E-07 5.7 9 1.1E-07 1.1E-07 1.5E-07 7.0
10 1.3E-07 1.3E-07 1.8E-07 8.5 11 1.5E-07 1.6E-07 2.2E-07 10.0 12 1.8E-07 1.8E-07 2.5E-07 11.7
* Assumes 0.83 defects of each type per acre 5.0 CONCLUSIONS
The liner percolation calculations illustrate the effectiveness of the lined and double lined ponds comparatively to the unlined ponds. As indicated in Table 4.2, ponds utilizing a single liner are likely to be over 1000 times more efficient than for the unlined ponds. Similarly, the percolation through the ponds constructed with the secondary containment is likely to be approximately 1000 times smaller than percolation from the ponds using a conventional composite liner. There are minor discrepancies between Table 4.3 and the WWTF percolation rates sent by Barr for Golder’s review (e-mail from Greg Williams on November 26, 2007). These discrepancies are due to:
• Head exponent in Column “O” in Barr’s spreadsheet is 0.9375 vs. the value of 0.9 used by Golder [Equation (1)].
• Head exponent in Column “P” in Barr’s spreadsheet is 0.9375. In addition, there is a factor of 0.976 in front of the equation. This factor is typically used if there is a need to convert Equation (1) to a format using a circular defect diameter but is not recommended for square defects. Equation (2) calls for the head exponent of 0.9.

TECHNICAL MEMORANDUM Barr Engineering December 17, 2007 Miguel Wong -7- 053-2209
I:\05\2209\0100\TM-DFTPERCEST_17DEC07\TM-DFTPERCOLEST-17DEC07.DOC Golder Associates
• Head exponent in Column “Q” equals 0.9375 for both the “square” and the “infinitely long” opening contributions. The head exponents in Equation (3) calls for the value of 0.9 for the “square” opening and 0.45 for the “infinitely long” opening. In addition there is a value of 0.1 using to calculate the gradient factor corresponding to the “infinitely long” opening rather than the value of 0.2 [see Equation (3)].
Effectively, the equations used by Barr are
( )[ ] 74.09375.01.095.0/1.01 ssqo khathCQ += - for circular defects
( )[ ] 74.09375.02.095.0/1.01976.0 ssqo khbthCQ += - for square defects
( )[ ] ( )[ ] 87.09375.01.095.074.09375.02.095.0 )(/1.01/1.01 ssqssqo khbbBthCkhbthCQ −+++= ∞
- for rectangular defects.
6.0 REFERENCES
• Bonaparte, R. Giroud, J.P. and Gross, B.A. (1989). "Rates of Leakage through Landfill Liners,” Proceedings of Geosynthetics '89, Vol. 1, IFAI, San Diego, California, USA, February 1989, pp. 18-29, 1989.
• Foose, G.J., Benson, C.H. and Tucker, B.E. (2001). “Predicting Leakage through Composite Landfill Liners,” Journal of Geotech. and Geoenv. Eng., Vol. 127, No. 6, pp. 510-520.
• Golder Associates Inc. (2007). “Draft RS 49 Stockpile Conceptual Design,” report prepared for PolyMet Mining Inc., February 16.
• Giroud, J.P. (1997). "Equations for Calculating the Rate of Liquid Migration Through Composite Liners Due to Geomembrane Defects,” Geosynthetics International, Vol. 4, Nos. 3-4, pp.335-348.
• Giroud, J.P. and Bonaparte, R. (1989). "Leakage Through Liners Constructed with Geomembranes, Part I,” Geomembrane Liners, Geotextiles and Geomembranes, 8, 1: 27-67.
• Giroud, J.P., Badu-Tweneboah, K. and Soderman, K.L. (1994). "Evaluation of Landfill Liners,” Fifth International Conference on Geotextiles, Geomembranes and Related Products, Singapore, 5-9 September.
• Hutchison, I.P.G., and Ellison, R.D., eds. (1992). “Mine waste management: a resource for mining industry professionals, regulators and consulting engineers,” Lewis Publishers, Inc., 672 p.
• Schroeder, P.R., Dozier, T.S., Zappi, P.A., McEnroe, B.M., Sjostrom, J.W. and Peton, R.L. (1994). " The Hydrologic Evaluation of Landfill Performance (HELP) Model:Engineering Documentation for Version 3,” EPA/600/R-94/168b, US. Environmental Protection Agency, Risk Reduction Engineering Laboratory, Cincinnati, OH.

TECHNICAL MEMORANDUM Golder Associates Inc. 44 Union Blvd., Suite 300 Telephone: 303-980-0540 Lakewood, Colorado 80228 Fax: 303-985-2080
TO: Miguel Wong, Barr Engineering DATE: December 21, 2007
FROM: Gordan Gjerapic P.E., Golder OUR REF.: 053-2209
CC: Brent R. Bronson P.E., Golder
RE: DRAFT PERCOLATION ESTIMATES FOR OVERBURDEN STOCKPILES,
POLYMET PROJECT, MINNESOTA
1.0 INTRODUCTION
Golder Associates Inc. (Golder) has prepared this draft technical memorandum for Barr Engineering (Barr) to present deep percolation estimates for overburden stockpiles. This work was completed based on the authorization provided via e-mail correspondence between Barr and Golder on December 6, 2007. Predicted percolation rates were determined using the HELP model. Material properties for both the stockpiled overburden and foundation materials were estimated based on the available data from geotechnical field investigations by Barr in March, 2005 and Golder in August, 2006 (“Phase I Geotechnical Field Investigation, PolyMet NorthMet Site, Near Babbitt, Minnesota.”)
2.0 FOUNDATION SOILS
Material parameters for the proposed overburden stockpile (Overburden Stockpile and Overburden Storage Pile) were determined based on the available borehole and test pit data. Material properties of the topsoil layer were assumed to have no impact to infiltration as the reported numbers should be viewed as deep percolation estimates. The subsurface data used to estimate foundation properties for the Overburden Storage Pile are summarized in the following table:
Table 2.1 Boreholes Used to Estimate Subsurface Properties of Overburden Storage Pile
Borehole Subsurface Properties
MW-05-02 6.5 feet of sandy clay (CL)
SB-05-03 10.0 ft of sandy clay w/ sand lenses at larger depths
Overburden Stockpile (adjacent to Category 1 and 2 stockpile) was divided into two parts: 1) North Overburden Stockpile containing overburden material with the maximum height of 40 to 80 ft over the engineered liner (k=5 x 10⁻⁷ cm/s). 2) West Overburden Stockpile containing overburden material in excess of 200 ft constructed without an engineered liner. As the North Overburden Stockpile is constructed with an engineered liner, percolation estimates can be determined by using the specified liner permeability for the base permeability. Conversely, the West Overburden Stockpile is unlined

and is likely to exhibit significant variation in foundation material properties. The subsurface data used to estimate foundation properties for the West Overburden Stockpile are summarized in the following table: Table 2.2 Boreholes and Test Pits Used to Estimate Subsurface Properties of West
Overburden Stockpile
Borehole or Test Pit Subsurface Properties
TP-1 Silty sands (SM) to 20 ft (encountered no bedrock)
TP-4 Sily sands (SM) to 13.5 ft TP-5 3.5 feet of clay (CL) over 10 ft of silty sand (SM)
TP-6 Silty sands (SM) and sandy silts (ML) to 20 ft (encountered no bedrock)
Based on the laboratory testing, the lowest amount of fines for the samples collected from the test in Table 2.2 was found in the TP-1 borehole (28.6%). As laboratory data for other test pits in Table 2.2 (TP-4, TP-5 and TP-6) indicate larger fines content, the foundation soil permeabilities for the West Overburden Stockpile were assumed to be dominated by the finer portion of the porous matrix. Hence, the percolation estimates for the West Overburden Stockpile were determined by using the foundation permeability ranging from 10-5 to 10-6 cm/s. Noting that the surface soils from the boreholes closest to the Overburden Storage Pile footprint were classified as sandy clays (see Table 2.1), the same range of permeabilities was used for the Overburden Storage Pile foundation materials. 3.0 STOCKPILED OVERBURDEN MATERIAL
Majority of the stockpiled overburden is likely to consist of glacial tills classified as SM and CL materials. Furthermore, the subsurface investigations by Barr (2005) and Golder (2006) indicate that a portion of the stockpiled overburden is also likely to contain peat and more pervious sands and gravels (see e.g. MW-05-08, MW-05-09, SB-05-10, TP-8, TP-9 and TP-10). The available subsurface data, however, indicate that the majority of the stockpiled overburden is likely to consist of relatively less pervious SM, CL and ML materials. Hence, the effective permeability for the stockpiled overburden materials was assumed to range from 10-4 to 10-5 cm/s. 4.0 INPUTS
Input parameters for HELP modeling were adopted from Schoeder et al. (1994) [" The Hydrologic Evaluation of Landfill Performance (HELP) Model: Engineering Documentation for Version 3", EPA/600/R-94/168b, US. Environmental Protection Agency, Risk Reduction Engineering Laboratory, Cincinnati, OH]. Input parameters are summarized in the following table:
Table 4.1 Input Parameters for HELP model simulations
Materials HELP No. ksat (cm/s)
Thickness (ft)
Foundation - North Overburden Stockpile 16 5.0e-7 1.0
Foundation – West Overburden Stockpile 16 1.0e-05 to 1.0e-6 15
Foundation – Overburden 16 1.0e-05 to 1.0e-6 10

Materials HELP No. ksat (cm/s) Thickness
(ft) Storage Pile
Stockpiled overburden – North Overburden Stockpile 10 1.0e-04 to 1.0e-5 40 to 80
Stockpiled overburden – West Overburden Stockpile 10 1.0e-04 to 1.0e-5 200
Stockpiled overburden – Overburden Storage Pile 10 1.0e-04 to 1.0e-5 40
Overliner* – North Overburden Stockpile 21 3.00e-01 1.0
* assumed 0.2% drainage grade and 100 ft spacing of drainage collection pipes Modeling scenarios are summarized in the following tables:
Table 4.2 Modeling Scenarios – North Overburden Stockpile
Case Scenario ID
Stockpiled Overburden Height
(ft)
Stockpiled Overburden Permeability
(cm/s)
Foundation Permeability
(cm/s) OBN-1 40 1.0e-4 5.0e-7 OBN-2 40 1.0e-5 5.0e-7 OBN-3 80 1.0e-4 5.0e-7 OBN-4 80 1.0e-5 5.0e-7
Table 4.3 Modeling Scenarios – West Overburden Stockpile
Case Scenario ID
Stockpiled Overburden Height
(ft)
Stockpiled Overburden Permeability
(cm/s)
Foundation Permeability
(cm/s) OBW-1 200 1.0e-4 1.0e-5 OBW-2 200 1.0e-4 1.0e-6 OBW-3 200 1.0e-5 1.0e-5 OBW-4 200 1.0e-5 1.0e-6
Table 4.4 Modeling Scenarios – Overburden Storage Pile
Case Scenario ID
Stockpiled Overburden Height
(ft)
Stockpiled Overburden Permeability
(cm/s)
Foundation Permeability
(cm/s) OBS-1 40 1.0e-4 1.0e-5 OBS-2 40 1.0e-4 1.0e-6 OBS-3 40 1.0e-5 1.0e-5 OBS-4 40 1.0e-5 1.0e-6
5.0 RESULTS
HELP simulation results are summarized in the following tables:

Table 5.1 Percolation through North Overburden Stockpile
Case Scenario ID
Average Annual Percolation
(inch)
Average Annual
Percolation (% Precip.)
Average Annual Percolation
(gal/acre/day) OBN-1 5.00 17.1 372 OBN-2 2.19 7.5 163 OBN-3 4.94 16.9 368 OBN-4 1.92 6.6 143
Table 5.2 Percolation through West Overburden Stockpile
Case Scenario ID
Average Annual Percolation
(inch)
Average Annual
Percolation (% Precip.)
Average Annual Percolation
(gal/acre/day) OBW-1 6.43 22.1 478 OBW-2 6.43 22.1 478 OBW-3 5.65 19.4 420 OBW-4 5.65 19.4 420
Table 5.3 Percolation through Overburden Storage Pile
Case Scenario ID
Average Annual Percolation
(inch)
Average Annual
Percolation (% Precip.)
Average Annual Percolation
(gal/acre/day) OBS-1 7.03 24.1 523 OBS-2 7.03 24.1 523 OBS-3 7.20 24.7 535 OBS-4 7.20 24.7 535
6.0 CONCLUSIONS
Based on the estimated overburden material properties, the average annual percolation rates through the Overburden Stockpile and Overburden Storage Pile are likely to range from about 150 to approximately 500 gal/acre/day. The estimated percolation rates are likely to exhibit smaller values for the overburden material placed over the engineered liner with the drainage layer and the solution collection piping system. The estimated average annual percolation rates for the overburden materials placed without the engineered liner, i.e. for the overburden placement directly over the native soils, may exceed 500 gal/acre/day.

DRAFT
TECHNICAL MEMORANDUM
Golder Associates Inc.
44 Union Blvd., Suite 300 Telephone: 303-980-0540
Lakewood, Colorado 80228 Fax: 303-985-2080
TO: Miguel Wong, Barr Engineering DATE: May 20, 2008
FROM: Gordan Gjerapic P.E., GAI OUR REF.: 053-2209
CC: Brent R. Bronson P.E., GAI
RE: DRAFT HELP RUNS FOR SENSITIVITY ANALYSIS OF LINER LEAKAGE
RATES
1.0 INTRODUCTION
Golder Associates Inc. (Golder) has prepared this technical memorandum for Barr
Engineering (Barr) presenting sensitivity analyses of liner leakage rates to be reported in
Draft 02 of RS74 (Water Quality Modeling) as agreed by Barr (Miguel Wong and Christie
Kearney) and MDNR (Paul Eger and John Adams) on May 5. Barr (Miguel Wong, Katie
Wenigmann and Christie Kearney), MDNR (Paul Eger) and Jim Kunkel (Knight Piesold)
decided to expand the number of required analyses on May 20, 2008. This work was
completed based on the authorization provided via e-mail correspondence between Barr and
Golder on May 6 (initial 103 analyses) and May 20, 2008 (additional 13 analyses). The
results in this memorandum were obtained by using the HELP (Hydrologic Evaluation of
Landfill Performance) model calibrated to a range of liner yields agreed upon between Barr
and MNDR. 116 HELP simulations were conducted to evaluate linear leakage sensitivity.
2.0 INPUT PARAMETERS
All simulations use a 100 year weather record for Duluth, Minnesota, synthetically generated
by HELP. The following material parameters were used for HELP simulations:
Table 2.1 Material Parameters for HELP Modeling Scenarios
Materials HELP No.
ksat
(cm/s)
Thickness
(inch)
Drainage grades and
geomembrane defects
Waste rock 21 3.00E-01 480, 1200
Overliner
(with 100 ft drains) 21 3.00E-01 12
0.2%, 0.5% , 1.0% and
2.0% slope
LLDPE 36 4.00E-13 0.08 1, 4 and 8 installation

Materials HELP No.
ksat
(cm/s)
Thickness
(inch)
Drainage grades and
geomembrane defects
defects per acre
Subgrade Cat. 1/2 16
1.00E-07,
5.00E-07,
5.00E-06
12
Subgrade Cat. 3, 4 16
1.00E-05,
1.00E-06,
1.00E-07
12
As indicated in Table 2.1, the lower model boundary for Category 3 and 4 stockpiles consists
of a 80 mil LLDPE placed on a 12 inch thick subgrade material. The proposed liner is
overlain by 12 inches of the overliner material and 100 ft of the stockpile waste rock. HELP
model for Category 1/2 stockpiles assumes 12 inch of subgrade material overlain by 12
inches of the overliner material and 40 ft of the stockpile waste rock.
3.0 MODELING SCENARIOS
To reproduce target yield values, Category 1/2 stockpiles were modeled with a 24 inch thick
surface layer material with varying permeability (see Figure 1). Similarly, Category 3 and 4
stockpiles utilized a 36 inch thick layer of surface material or geomembrane cover overlain
by 18 inches of topsoil. In addition, the calibration process employed varying evaporation
depths, scaling of the average wind speed and solar radiation values, and reduction of the
stockpile areas available to runoff in order to attain target yields. The average annual
precipitation employed for HELP simulations was 29.2 inches.
Figure 1 Modeling Geometry
WASTE ROCK
SURFACE LAYER
LINER SYSTEM
LINER YIELD
PERCOLATION
LATERAL DRAINAGE

The analyzed HELP case scenarios are summarized in the following tables:
Table 3.1 Case Scenarios for Category 1/2 Stockpiles
Case Case Designation
Target Liner
Yield
(inch/year)
Permeability of
Soil Liner in
Liner System
(cm/s)
Slope of
Overliner in
Liner System
1 Cat1_WR-1 20.4 5.00E-06 0.20%
2 Cat1_WR-2 14.7 5.00E-06 0.20%
3 Cat1_WR-3A 14.2 1.00E-07 0.20%
4 Cat1_WR-3B 14.2 5.00E-07 0.20%
5 Cat1_WR-3C 14.2 5.00E-06 0.20%
6 Cat1_WR-3D 14.2 1.00E-07 0.50%
7 Cat1_WR-3E 14.2 5.00E-07 0.50%
8 Cat1_WR-3F 14.2 5.00E-06 0.50%
9 Cat1_WR-4A 10.2 1.00E-07 0.20%
10 Cat1_WR-4B 10.2 5.00E-07 0.20%
11 Cat1_WR-4C 10.2 5.00E-06 0.20%
12 Cat1_WR-4D 10.2 1.00E-07 0.50%
13 Cat1_WR-4E 10.2 5.00E-07 0.50%
14 Cat1_WR-4F 10.2 5.00E-06 0.50%
15 Cat1_WR-5 8.2 1.00E-07 0.50%
16 Cat1_WR-6 4.7 1.00E-07 0.50%
104 Cat1_WR-5_Extra 1 8.2 5.00E-07 0.50%
105 Cat1_WR-5_Extra 2 8.2 5.00E-06 0.20%
106 Cat1_WR-6_Extra 1 4.7 5.00E-07 0.50%
107 Cat1_WR-6_Extra 2 4.7 5.00E-06 0.20%
Table 3.2 Case Scenarios for Category 3/4 Stockpiles, Liner Yield = 14.2 inch/yr
Case Case Designation
Slope of
Overliner in
Liner System
Number of
Geomembrane
Defects
(holes/acre)
Permeability of
Subgrade
Material
(cm/s)
20 Cat3-4_WR-LO-4A 0.50% 1 1.00E-05
21 Cat3-4_WR-LO-4B 1.00% 1 1.00E-05
22 Cat3-4_WR-LO-4C 2.00% 1 1.00E-05
23 Cat3-4_WR-LO-4D 0.50% 4 1.00E-05
24 Cat3-4_WR-LO-4E 1.00% 4 1.00E-05
25 Cat3-4_WR-LO-4F 2.00% 4 1.00E-05
26 Cat3-4_WR-LO-4G 0.50% 8 1.00E-05
27 Cat3-4_WR-LO-4H 1.00% 8 1.00E-05
28 Cat3-4_WR-LO-4I 2.00% 8 1.00E-05
29 Cat3-4_WR-LO-5A 0.50% 1 1.00E-06
30 Cat3-4_WR-LO-5B 1.00% 1 1.00E-06
31 Cat3-4_WR-LO-5C 2.00% 1 1.00E-06

Case Case Designation
Slope of
Overliner in
Liner System
Number of
Geomembrane
Defects
(holes/acre)
Permeability of
Subgrade
Material
(cm/s)
32 Cat3-4_WR-LO-5D 0.50% 4 1.00E-06
33 Cat3-4_WR-LO-5E 1.00% 4 1.00E-06
34 Cat3-4_WR-LO-5F 2.00% 4 1.00E-06
35 Cat3-4_WR-LO-5G 0.50% 8 1.00E-06
36 Cat3-4_WR-LO-5H 1.00% 8 1.00E-06
37 Cat3-4_WR-LO-5I 2.00% 8 1.00E-06
38 Cat3-4_WR-LO-6A 0.50% 1 1.00E-07
39 Cat3-4_WR-LO-6B 1.00% 1 1.00E-07
40 Cat3-4_WR-LO-6C 2.00% 1 1.00E-07
41 Cat3-4_WR-LO-6D 0.50% 4 1.00E-07
42 Cat3-4_WR-LO-6E 1.00% 4 1.00E-07
43 Cat3-4_WR-LO-6F 2.00% 4 1.00E-07
44 Cat3-4_WR-LO-6G 0.50% 8 1.00E-07
45 Cat3-4_WR-LO-6H 1.00% 8 1.00E-07
46 Cat3-4_WR-LO-6I 2.00% 8 1.00E-07
Table 3.3 Case Scenarios for Category 3/4 Stockpiles, Liner Yield = 10.2 inch/yr
Case Case Designation
Slope of
Overliner in
Liner System
Number of
Geomembrane
Defects
(holes/acre)
Permeability of
Subgrade
Material
(cm/s)
47 Cat3-4_WR-LO-7A 0.50% 1 1.00E-05
48 Cat3-4_WR-LO-7B 1.00% 1 1.00E-05
49 Cat3-4_WR-LO-7C 2.00% 1 1.00E-05
50 Cat3-4_WR-LO-7D 0.50% 4 1.00E-05
51 Cat3-4_WR-LO-7E 1.00% 4 1.00E-05
52 Cat3-4_WR-LO-7F 2.00% 4 1.00E-05
53 Cat3-4_WR-LO-7G 0.50% 8 1.00E-05
54 Cat3-4_WR-LO-7H 1.00% 8 1.00E-05
55 Cat3-4_WR-LO-7I 2.00% 8 1.00E-05
56 Cat3-4_WR-LO-8A 0.50% 1 1.00E-06
57 Cat3-4_WR-LO-8B 1.00% 1 1.00E-06
58 Cat3-4_WR-LO-8C 2.00% 1 1.00E-06
59 Cat3-4_WR-LO-8D 0.50% 4 1.00E-06
60 Cat3-4_WR-LO-8E 1.00% 4 1.00E-06
61 Cat3-4_WR-LO-8F 2.00% 4 1.00E-06
62 Cat3-4_WR-LO-8G 0.50% 8 1.00E-06
63 Cat3-4_WR-LO-8H 1.00% 8 1.00E-06
64 Cat3-4_WR-LO-8I 2.00% 8 1.00E-06
65 Cat3-4_WR-LO-9A 0.50% 1 1.00E-07

Case Case Designation
Slope of
Overliner in
Liner System
Number of
Geomembrane
Defects
(holes/acre)
Permeability of
Subgrade
Material
(cm/s)
66 Cat3-4_WR-LO-9B 1.00% 1 1.00E-07
67 Cat3-4_WR-LO-9C 2.00% 1 1.00E-07
68 Cat3-4_WR-LO-9D 0.50% 4 1.00E-07
69 Cat3-4_WR-LO-9E 1.00% 4 1.00E-07
70 Cat3-4_WR-LO-9F 2.00% 4 1.00E-07
71 Cat3-4_WR-LO-9G 0.50% 8 1.00E-07
72 Cat3-4_WR-LO-9H 1.00% 8 1.00E-07
73 Cat3-4_WR-LO-9I 2.00% 8 1.00E-07
Table 3.4 Case Scenarios for Category 3/4 Stockpiles, Liner Yield = 0.3 inch/yr
Case Case Designation
Slope of
Overliner in
Liner System
Number of
Geomembrane
Defects
(holes/acre)
Permeability of
Subgrade
Material
(cm/s)
74 Cat3-4_WR-LO-10A 0.50% 1 1.00E-05
75 Cat3-4_WR-LO-10B 1.00% 1 1.00E-05
76 Cat3-4_WR-LO-10C 2.00% 1 1.00E-05
77 Cat3-4_WR-LO-10D 0.50% 4 1.00E-05
78 Cat3-4_WR-LO-10E 1.00% 4 1.00E-05
79 Cat3-4_WR-LO-10F 2.00% 4 1.00E-05
80 Cat3-4_WR-LO-10G 0.50% 8 1.00E-05
81 Cat3-4_WR-LO-10H 1.00% 8 1.00E-05
82 Cat3-4_WR-LO-10I 2.00% 8 1.00E-05
83 Cat3-4_WR-LO-11A 0.50% 1 1.00E-06
84 Cat3-4_WR-LO-11B 1.00% 1 1.00E-06
85 Cat3-4_WR-LO-11C 2.00% 1 1.00E-06
86 Cat3-4_WR-LO-11D 0.50% 4 1.00E-06
87 Cat3-4_WR-LO-11E 1.00% 4 1.00E-06
88 Cat3-4_WR-LO-11F 2.00% 4 1.00E-06
89 Cat3-4_WR-LO-11G 0.50% 8 1.00E-06
90 Cat3-4_WR-LO-11H 1.00% 8 1.00E-06
91 Cat3-4_WR-LO-11I 2.00% 8 1.00E-06
92 Cat3-4_WR-LO-12A 0.50% 1 1.00E-07
93 Cat3-4_WR-LO-12B 1.00% 1 1.00E-07
94 Cat3-4_WR-LO-12C 2.00% 1 1.00E-07
95 Cat3-4_WR-LO-12D 0.50% 4 1.00E-07
96 Cat3-4_WR-LO-12E 1.00% 4 1.00E-07
97 Cat3-4_WR-LO-12F 2.00% 4 1.00E-07
98 Cat3-4_WR-LO-12G 0.50% 8 1.00E-07
99 Cat3-4_WR-LO-12H 1.00% 8 1.00E-07
100 Cat3-4_WR-LO-12I 2.00% 8 1.00E-07

Table 3.5 Case Scenarios for Category 3 and 4 Stockpiles, Varying Yield
Case Case Designation
Target
Liner
Yield
(inch/year)
Slope of
Overliner in
Liner
System
Number of
Geomembrane
Defects
(holes/acre)
Permeability
of Subgrade
Material
(cm/s)
17 Cat3-4_WR-LO-1 20.4 0.50% 8 1.00E-05
18 Cat3-4_WR-LO-2 14.7 0.50% 8 1.00E-05
19 Cat3-4_WR-LO-3 1.5 0.50% 8 1.00E-05
101 Cat3-4_WR-LO-13 8.2 2.00% 1 1.00E-07
102 Cat3-4_WR-LO-14 4.7 2.00% 1 1.00E-07
103 Cat3-4_WR-LO-15 see Note * 2.00% 1 1.00E-07
108 Cat3-4_WR-LO-13_Extra 1 8.2 1.00% 4 1.00E-05
109 Cat3-4_WR-LO-13_Extra 2 8.2 1.00% 4 1.00E-06
110 Cat3-4_WR-LO-14_Extra 1 4.7 1.00% 4 1.00E-05
111 Cat3-4_WR-LO-15_Extra 1 see Note * 1.00% 4 1.00E-05
112 Cat3-4_WR-LO-14_Extra 2 4.7 1.00% 4 1.00E-06
113 Cat3-4_WR-LO-15_Extra 2 see Note * 1.00% 4 1.00E-06
114 Cat3-4_WR-LO-13_Extra 3 8.2 0.50% 8 1.00E-05
115 Cat3-4_WR-LO-14_Extra 3 4.7 0.50% 8 1.00E-05
116 Cat3-4_WR-LO-15_Extra 3 see Note * 0.50% 8 1.00E-05
* Value corresponds to liner yield reported in Table 3.5, Appendix C, Draft 02 RS49.
4.0 RESULTS
HELP results are summarized in the following tables:
Table 4.1 HELP Results for Category 1/2 Stockpiles (inch/year, inch/day)
Case
Avg. Annual
Lateral Drainage
(inch/year)
Avg. Annual
Percolation
(inch/year)
Max. Daily
Lateral Drainage
(inch/day)
Max. Daily
Percolation
(inch/day)
1 0.297 20.103 0.087 0.197
2 0.108 14.622 0.019 0.178
3 12.897 1.334 0.201 0.004
4 8.239 5.993 0.183 0.021
5 0.107 14.108 0.030 0.182
6 12.939 1.274 0.208 0.004
7 8.484 5.730 0.191 0.020
8 0.256 13.959 0.049 0.178
9 8.907 1.298 0.107 0.004
10 4.503 5.703 0.090 0.020
11 0.052 10.157 0.002 0.165

12 8.966 1.241 0.118 0.004
13 4.725 5.483 0.103 0.019
14 0.129 10.079 0.005 0.171
15 6.971 1.203 0.097 0.004
16 3.618 1.128 0.062 0.004
104 3.109 5.066 0.082 0.018
105 0.035 8.141 0.001 0.165
106 0.755 3.991 0.048 0.018
107 0.013 4.734 0.001 0.068
Table 4.2 HELP Results for Category 3/4 Stockpiles, Liner Yield = 14.2 inch/yr
(inch/year, inch/day)
Case
Avg. Annual
Lateral Drainage
(inch/year)
Avg. Annual
Percolation
(inch/year)
Max. Daily
Lateral Drainage
(inch/day)
Max. Daily
Percolation
(inch/day)
20 14.221 3.11E-03 0.130 2.60E-05
21 14.224 1.66E-03 0.138 1.50E-05
22 14.225 8.90E-04 0.156 9.00E-06
23 14.212 1.23E-02 0.130 1.02E-04
24 14.219 6.58E-03 0.138 5.80E-05
25 14.223 3.52E-03 0.156 3.40E-05
26 14.200 2.46E-02 0.129 2.03E-04
27 14.212 1.31E-02 0.138 1.15E-04
28 14.219 7.02E-03 0.156 6.90E-05
29 14.224 5.90E-04 0.130 5.00E-06
30 14.225 3.10E-04 0.138 3.00E-06
31 14.226 1.70E-04 0.156 2.00E-06
32 14.222 2.27E-03 0.130 1.90E-05
33 14.224 1.21E-03 0.138 1.10E-05
34 14.225 6.50E-04 0.156 6.00E-06
35 14.220 4.51E-03 0.130 3.70E-05
36 14.223 2.40E-03 0.138 2.10E-05
37 14.225 1.28E-03 0.156 1.30E-05
38 14.224 1.30E-04 0.130 1.00E-06
39 14.225 7.00E-05 0.138 1.00E-06
40 14.226 4.00E-05 0.156 <1.00E-06
41 14.224 4.40E-04 0.130 4.00E-06
42 14.225 2.30E-04 0.138 2.00E-06
43 14.226 1.20E-04 0.156 1.00E-06
44 14.223 8.40E-04 0.130 7.00E-06
45 14.225 4.50E-04 0.138 4.00E-06
46 14.226 2.40E-04 0.156 2.00E-06
Table 4.3 HELP Results for Category 3/4 Stockpiles, Liner Yield = 10.2 inch/yr

(inch/year, inch/day)
Case
Avg. Annual
Lateral Drainage
(inch/year)
Avg. Annual
Percolation
(inch/year)
Max. Daily
Lateral Drainage
(inch/day)
Max. Daily
Percolation
(inch/day)
47 10.198 2.30E-03 0.082 1.70E-05
48 10.200 1.23E-03 0.083 9.00E-06
49 10.201 6.60E-04 0.089 5.00E-06
50 10.191 9.14E-03 0.082 6.70E-05
51 10.196 4.88E-03 0.083 3.60E-05
52 10.199 2.61E-03 0.089 2.10E-05
53 10.182 1.83E-02 0.082 1.34E-04
54 10.191 9.75E-03 0.083 7.30E-05
55 10.196 5.21E-03 0.089 4.10E-05
56 10.200 4.40E-04 0.082 3.00E-06
57 10.201 2.30E-04 0.083 2.00E-06
58 10.202 1.20E-04 0.089 1.00E-06
59 10.198 1.68E-03 0.082 1.20E-05
60 10.200 9.00E-04 0.083 7.00E-06
61 10.201 4.80E-04 0.089 4.00E-06
62 10.197 3.34E-03 0.082 2.50E-05
63 10.199 1.78E-03 0.083 1.30E-05
64 10.201 9.50E-04 0.089 8.00E-06
65 10.200 1.00E-04 0.082 1.00E-06
66 10.201 5.00E-05 0.083 <1.00E-06
67 10.202 3.00E-05 0.089 <1.00E-06
68 10.200 3.20E-04 0.082 2.00E-06
69 10.201 1.70E-04 0.083 1.00E-06
70 10.202 9.00E-05 0.089 1.00E-06
71 10.199 6.20E-04 0.082 5.00E-06
72 10.201 3.30E-04 0.083 2.00E-06
73 10.201 1.80E-04 0.089 1.00E-06
Table 4.4 HELP Results for Category 3/4 Stockpiles, Liner Yield = 0.3 inch/yr
(inch/year, inch/day)
Case
Avg. Annual
Lateral Drainage
(inch/year)
Avg. Annual
Percolation
(inch/year)
Max. Daily
Lateral Drainage
(inch/day)
Max. Daily
Percolation
(inch/day)
74 0.305 1.00E-04 0.003 1.00E-06
75 0.305 5.00E-05 0.003 1.00E-06
76 0.305 3.00E-05 0.004 <1.00E-06
77 0.305 3.70E-04 0.003 4.00E-06
78 0.305 2.00E-04 0.003 2.00E-06
79 0.305 1.10E-04 0.004 1.00E-06
80 0.305 7.50E-04 0.003 7.00E-06

Case
Avg. Annual
Lateral Drainage
(inch/year)
Avg. Annual
Percolation
(inch/year)
Max. Daily
Lateral Drainage
(inch/day)
Max. Daily
Percolation
(inch/day)
81 0.305 4.00E-04 0.003 4.00E-06
82 0.305 2.20E-04 0.004 2.00E-06
83 0.305 2.00E-05 0.003 <1.00E-06
84 0.305 1.00E-05 0.003 <1.00E-06
85 0.305 1.00E-05 0.004 <1.00E-06
86 0.305 7.00E-05 0.003 1.00E-06
87 0.305 4.00E-05 0.003 <1.00E-06
88 0.305 2.00E-05 0.004 <1.00E-06
89 0.305 1.40E-04 0.003 1.00E-06
90 0.305 8.00E-05 0.003 1.00E-06
91 0.305 4.00E-05 0.004 <1.00E-06
92 0.305 1.00E-05 0.003 <1.00E-06
93 0.305 1.00E-05 0.003 <1.00E-06
94 0.305 <1.00E-05 0.004 <1.00E-06
95 0.305 2.00E-05 0.003 <1.00E-06
96 0.305 1.00E-05 0.003 <1.00E-06
97 0.305 1.00E-05 0.004 <1.00E-06
98 0.305 3.00E-05 0.003 <1.00E-06
99 0.305 2.00E-05 0.003 <1.00E-06
100 0.305 1.00E-05 0.004 <1.00E-06
Table 4.5 HELP Results for Category 3 and 4 Stockpiles, Varying Yield
(inch/year, inch/day)
Case
Avg. Annual
Lateral Drainage
(inch/year)
Avg. Annual
Percolation
(inch/year)
Max. Daily
Lateral Drainage
(inch/day)
Max. Daily
Percolation
(inch/day)
17 20.354 3.42E-02 0.185 2.73E-04
18 14.687 2.54E-02 0.133 2.08E-04
19 1.475 3.17E-03 0.011 2.20E-05
101 8.199 2.00E-05 0.066 <1.00E-06
102 4.727 2.00E-05 0.039 <1.00E-06
103 1.365 1.00E-05 0.009 <1.00E-06
108 8.195 4.00E-03 0.065 2.90E-05
109 8.198 7.40E-04 0.065 5.00E-06
110 4.725 2.42E-03 0.037 1.80E-05
111 1.365 7.90E-04 0.009 5.00E-06
112 4.727 4.50E-04 0.037 3.00E-06
113 1.365 1.50E-04 0.009 1.00E-06
114 8.183 1.49E-02 0.063 1.07E-04
115 4.718 9.04E-03 0.037 6.50E-05
116 1.362 2.95E-03 0.009 1.80E-05

Table 4.6 HELP Results for Category 1/2 Stockpiles
(gal/acre/day)
Case
Avg. Annual
Lateral Drainage
(gal/acre/day)
Avg. Annual
Percolation
(gal/acre/day)
Max. Daily
Lateral Drainage
(gal/acre/day)
Max. Daily
Percolation
(gal/acre/day)
1 22.1 1.50E+03 2362.8 5.36E+03
2 8.0 1.09E+03 504.5 4.83E+03
3 959.4 9.92E+01 5469.9 1.18E+02
4 612.9 4.46E+02 4964.5 5.83E+02
5 8.0 1.05E+03 804.0 4.94E+03
6 962.5 9.48E+01 5646.9 1.10E+02
7 631.1 4.26E+02 5196.7 5.44E+02
8 19.1 1.04E+03 1329.1 4.84E+03
9 662.6 9.66E+01 2915.4 1.09E+02
10 335.0 4.24E+02 2457.0 5.38E+02
11 3.9 7.56E+02 66.5 4.48E+03
12 667.0 9.23E+01 3199.4 1.03E+02
13 351.5 4.08E+02 2798.1 5.08E+02
14 9.6 7.50E+02 134.7 4.63E+03
15 518.6 8.95E+01 2629.7 1.01E+02
16 269.1 8.39E+01 1679.6 9.80E+01
104 231.3 3.77E+02 2232.7 4.99E+02
105 2.6 6.06E+02 37.5 4.49E+03
106 56.1 2.97E+02 1296.0 4.83E+02
107 0.9 3.52E+02 17.4 1.86E+03
Table 4.7 HELP Results for Category 3/4 Stockpiles, Liner Yield = 14.2 inch/yr
(gal/acre/day)
Case
Avg. Annual
Lateral Drainage
(gal/acre/day)
Avg. Annual
Percolation
(gal/acre/day)
Max. Daily
Lateral Drainage
(gal/acre/day)
Max. Daily
Percolation
(gal/acre/day)
20 1057.9 2.31E-01 3520.3 7.06E-01
21 1058.1 1.23E-01 3744.6 4.07E-01
22 1058.2 6.62E-02 4237.4 2.44E-01
23 1057.2 9.17E-01 3518.4 2.77E+00
24 1057.7 4.89E-01 3743.8 1.57E+00
25 1058.0 2.62E-01 4236.9 9.23E-01
26 1056.3 1.83E+00 3515.7 5.51E+00
27 1057.3 9.77E-01 3742.7 3.12E+00
28 1057.8 5.22E-01 4235.8 1.87E+00
29 1058.1 4.39E-02 3520.9 1.36E-01
30 1058.2 2.31E-02 3744.9 8.15E-02
31 1058.3 1.26E-02 4237.7 5.43E-02
32 1058.0 1.69E-01 3520.6 5.16E-01
33 1058.1 9.00E-02 3744.6 2.99E-01

Case
Avg. Annual
Lateral Drainage
(gal/acre/day)
Avg. Annual
Percolation
(gal/acre/day)
Max. Daily
Lateral Drainage
(gal/acre/day)
Max. Daily
Percolation
(gal/acre/day)
34 1058.2 4.84E-02 4237.4 1.63E-01
35 1057.8 3.35E-01 3520.0 1.00E+00
36 1058.1 1.79E-01 3744.6 5.70E-01
37 1058.2 9.52E-02 4237.4 3.53E-01
38 1058.1 9.67E-03 3521.1 < 1.00E-01
39 1058.2 5.21E-03 3744.9 < 1.00E-01
40 1058.3 2.98E-03 4237.7 < 1.00E-01
41 1058.1 3.27E-02 3520.9 1.09E-01
42 1058.2 1.71E-02 3744.9 5.43E-02
43 1058.3 8.93E-03 4237.7 < 1.00E-01
44 1058.1 6.25E-02 3520.9 1.90E-01
45 1058.2 3.35E-02 3744.9 1.09E-01
46 1058.3 1.79E-02 4237.7 < 1.00E-01
Table 4.8 HELP Results for Category 3/4 Stockpiles, Liner Yield = 10.2 inch/yr
(gal/acre/day)
Case
Avg. Annual
Lateral Drainage
(gal/acre/day)
Avg. Annual
Percolation
(gal/acre/day)
Max. Daily
Lateral Drainage
(gal/acre/day)
Max. Daily
Percolation
(gal/acre/day)
47 758.6 1.71E-01 2219.4 4.62E-01
48 758.8 9.15E-02 2247.9 2.44E-01
49 758.9 4.91E-02 2413.6 1.36E-01
50 758.1 6.80E-01 2218.4 1.82E+00
51 758.5 3.63E-01 2247.1 9.77E-01
52 758.7 1.94E-01 2413.0 5.70E-01
53 757.4 1.36E+00 2216.5 3.64E+00
54 758.1 7.25E-01 2246.3 1.98E+00
55 758.5 3.88E-01 2412.8 1.11E+00
56 758.8 3.27E-02 2220.0 < 1.00E-01
57 758.8 1.71E-02 2248.2 < 1.00E-01
58 758.9 8.93E-03 2413.6 < 1.00E-01
59 758.7 1.25E-01 2219.7 3.26E-01
60 758.8 6.70E-02 2247.9 1.90E-01
61 758.9 3.57E-02 2413.6 1.09E-01
62 758.5 2.48E-01 2219.4 6.79E-01
63 758.7 1.32E-01 2247.9 3.53E-01
64 758.8 7.07E-02 2413.3 2.17E-01
65 758.8 7.44E-03 2220.0 < 1.00E-01
66 758.9 3.72E-03 2248.2 < 1.00E-01
67 758.9 2.23E-03 2413.6 < 1.00E-01
68 758.8 2.38E-02 2220.0 < 1.00E-01

Case
Avg. Annual
Lateral Drainage
(gal/acre/day)
Avg. Annual
Percolation
(gal/acre/day)
Max. Daily
Lateral Drainage
(gal/acre/day)
Max. Daily
Percolation
(gal/acre/day)
69 758.9 1.26E-02 2248.2 < 1.00E-01
70 758.9 6.70E-03 2413.6 < 1.00E-01
71 758.7 4.61E-02 2220.0 1.36E-01
72 758.8 2.45E-02 2248.2 < 1.00E-01
73 758.9 1.34E-02 2413.6 < 1.00E-01
Table 4.9 HELP Results for Category 3/4 Stockpiles, Liner Yield = 0.3 inch/yr
(gal/acre/day)
Case
Avg. Annual
Lateral Drainage
(gal/acre/day)
Avg. Annual
Percolation
(gal/acre/day)
Max. Daily
Lateral Drainage
(gal/acre/day)
Max. Daily
Percolation
(gal/acre/day)
74 22.7 7.44E-03 89.9 < 1.00E-01
75 22.7 3.72E-03 80.9 < 1.00E-01
76 22.7 2.23E-03 95.0 < 1.00E-01
77 22.7 2.75E-02 89.9 1.09E-01
78 22.7 1.49E-02 92.6 < 1.00E-01
79 22.7 8.18E-03 95.0 < 1.00E-01
80 22.7 5.58E-02 89.6 1.90E-01
81 22.7 2.98E-02 92.6 1.09E-01
82 22.7 1.64E-02 95.0 < 1.00E-01
83 22.7 1.49E-03 89.9 < 1.00E-01
84 22.7 <1.00E-03 92.6 < 1.00E-01
85 22.7 <1.00E-03 95.0 < 1.00E-01
86 22.7 5.21E-03 89.9 < 1.00E-01
87 22.7 2.98E-03 92.6 < 1.00E-01
88 22.7 1.49E-03 95.0 < 1.00E-01
89 22.7 1.04E-02 89.9 < 1.00E-01
90 22.7 5.95E-03 92.6 < 1.00E-01
91 22.7 2.98E-03 95.0 < 1.00E-01
92 22.7 <1.00E-03 89.9 < 1.00E-01
93 22.7 <1.00E-03 92.6 < 1.00E-01
94 22.7 <1.00E-03 95.0 < 1.00E-01
95 22.7 1.49E-03 89.9 < 1.00E-01
96 22.7 <1.00E-03 92.6 < 1.00E-01
97 22.7 <1.00E-03 95.0 < 1.00E-01
98 22.7 2.23E-03 89.9 < 1.00E-01
99 22.7 1.49E-03 92.6 < 1.00E-01
100 22.7 <1.00E-03 95.0 < 1.00E-01
Table 4.10 HELP Results for Category 3 and 4 Stockpiles, Varying Yield

(gal/acre/day)
Case
Avg. Annual
Lateral Drainage
(gal/acre/day)
Avg. Annual
Percolation
(gal/acre/day)
Max. Daily
Lateral Drainage
(gal/acre/day)
Max. Daily
Percolation
(gal/acre/day)
17 1514.1 2.54E+00 5014.2 7.41E+00
18 1092.6 1.89E+00 3614.3 5.65E+00
19 109.7 2.36E-01 305.2 5.97E-01
101 610.0 1.49E-03 1796.4 < 1.00E-01
102 351.7 1.49E-03 1072.2 < 1.00E-01
103 101.6 7.44E-04 256.3 < 1.00E-01
108 609.6 2.98E-01 1757.3 7.87E-01
109 609.9 5.50E-02 1757.8 1.36E-01
110 351.5 1.80E-01 1004.9 4.89E-01
111 101.5 5.88E-02 249.0 1.36E-01
112 351.6 3.35E-02 1005.2 8.15E-02
113 101.6 1.12E-02 249.3 2.72E-02
114 608.7 1.11E+00 1722.0 2.91E+00
115 351.0 6.72E-01 992.4 1.76E+00
116 101.3 2.19E-01 237.6 4.89E-01
5.0 CONCLUSIONS
HELP analyses were used to calibrate various stockpile configurations to target annual yield
values. While these simulations may be used as an indicator of liner performance, the actual
performance will be governed by material properties encountered in the field and local
climate conditions. It should be noted that based on the calibrated climate and material
parameters required to attain some of the specified target yield values, a number of the
simulations evaluated are not considered physically realistic.

DRAFT
TECHNICAL MEMORANDUM
Golder Associates Inc.
44 Union Blvd., Suite 300 Telephone: 303-980-0540
Lakewood, Colorado 80228 Fax: 303-985-2080
TO: Miguel Wong, Barr Engineering DATE: May 20, 2008
FROM: Gordan Gjerapic P.E., GAI OUR REF.: 053-2209
CC: Brent R. Bronson P.E., GAI
RE: DRAFT HELP RUNS FOR SENSITIVITY ANALYSIS OF LINER LEAKAGE
RATES
1.0 INTRODUCTION
Golder Associates Inc. (Golder) has prepared this technical memorandum for Barr
Engineering (Barr) presenting sensitivity analyses of liner leakage rates to be reported in
Draft 02 of RS74 (Water Quality Modeling) as agreed by Barr (Miguel Wong and Christie
Kearney) and MDNR (Paul Eger and John Adams) on May 5. Barr (Miguel Wong, Katie
Wenigmann and Christie Kearney), MDNR (Paul Eger) and Jim Kunkel (Knight Piesold)
decided to expand the number of required analyses on May 20, 2008. This work was
completed based on the authorization provided via e-mail correspondence between Barr and
Golder on May 6 (initial 103 analyses) and May 20, 2008 (additional 13 analyses). The
results in this memorandum were obtained by using the HELP (Hydrologic Evaluation of
Landfill Performance) model calibrated to a range of liner yields agreed upon between Barr
and MNDR. 116 HELP simulations were conducted to evaluate linear leakage sensitivity.
2.0 INPUT PARAMETERS
All simulations use a 100 year weather record for Duluth, Minnesota, synthetically generated
by HELP. The following material parameters were used for HELP simulations:
Table 2.1 Material Parameters for HELP Modeling Scenarios
Materials HELP No.
ksat
(cm/s)
Thickness
(inch)
Drainage grades and
geomembrane defects
Waste rock 21 3.00E-01 480, 1200
Overliner
(with 100 ft drains) 21 3.00E-01 12
0.2%, 0.5% , 1.0% and
2.0% slope
LLDPE 36 4.00E-13 0.08 1, 4 and 8 installation

Materials HELP No.
ksat
(cm/s)
Thickness
(inch)
Drainage grades and
geomembrane defects
defects per acre
Subgrade Cat. 1/2 16
1.00E-07,
5.00E-07,
5.00E-06
12
Subgrade Cat. 3, 4 16
1.00E-05,
1.00E-06,
1.00E-07
12
As indicated in Table 2.1, the lower model boundary for Category 3 and 4 stockpiles consists
of a 80 mil LLDPE placed on a 12 inch thick subgrade material. The proposed liner is
overlain by 12 inches of the overliner material and 100 ft of the stockpile waste rock. HELP
model for Category 1/2 stockpiles assumes 12 inch of subgrade material overlain by 12
inches of the overliner material and 40 ft of the stockpile waste rock.
3.0 MODELING SCENARIOS
To reproduce target yield values, Category 1/2 stockpiles were modeled with a 24 inch thick
surface layer material with varying permeability (see Figure 1). Similarly, Category 3 and 4
stockpiles utilized a 36 inch thick layer of surface material or geomembrane cover overlain
by 18 inches of topsoil. In addition, the calibration process employed varying evaporation
depths, scaling of the average wind speed and solar radiation values, and reduction of the
stockpile areas available to runoff in order to attain target yields. The average annual
precipitation employed for HELP simulations was 29.2 inches.
Figure 1 Modeling Geometry
WASTE ROCK
SURFACE LAYER
LINER SYSTEM
LINER YIELD
PERCOLATION
LATERAL DRAINAGE
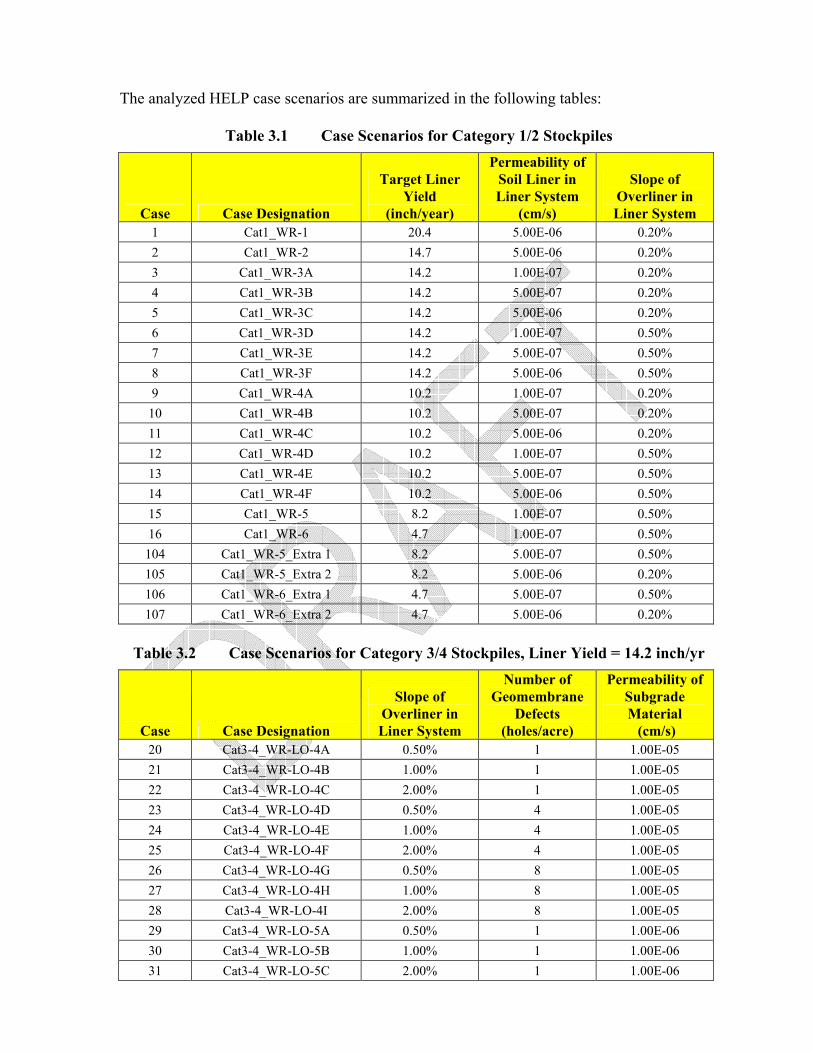
The analyzed HELP case scenarios are summarized in the following tables:
Table 3.1 Case Scenarios for Category 1/2 Stockpiles
Case Case Designation
Target Liner
Yield
(inch/year)
Permeability of
Soil Liner in
Liner System
(cm/s)
Slope of
Overliner in
Liner System
1 Cat1_WR-1 20.4 5.00E-06 0.20%
2 Cat1_WR-2 14.7 5.00E-06 0.20%
3 Cat1_WR-3A 14.2 1.00E-07 0.20%
4 Cat1_WR-3B 14.2 5.00E-07 0.20%
5 Cat1_WR-3C 14.2 5.00E-06 0.20%
6 Cat1_WR-3D 14.2 1.00E-07 0.50%
7 Cat1_WR-3E 14.2 5.00E-07 0.50%
8 Cat1_WR-3F 14.2 5.00E-06 0.50%
9 Cat1_WR-4A 10.2 1.00E-07 0.20%
10 Cat1_WR-4B 10.2 5.00E-07 0.20%
11 Cat1_WR-4C 10.2 5.00E-06 0.20%
12 Cat1_WR-4D 10.2 1.00E-07 0.50%
13 Cat1_WR-4E 10.2 5.00E-07 0.50%
14 Cat1_WR-4F 10.2 5.00E-06 0.50%
15 Cat1_WR-5 8.2 1.00E-07 0.50%
16 Cat1_WR-6 4.7 1.00E-07 0.50%
104 Cat1_WR-5_Extra 1 8.2 5.00E-07 0.50%
105 Cat1_WR-5_Extra 2 8.2 5.00E-06 0.20%
106 Cat1_WR-6_Extra 1 4.7 5.00E-07 0.50%
107 Cat1_WR-6_Extra 2 4.7 5.00E-06 0.20%
Table 3.2 Case Scenarios for Category 3/4 Stockpiles, Liner Yield = 14.2 inch/yr
Case Case Designation
Slope of
Overliner in
Liner System
Number of
Geomembrane
Defects
(holes/acre)
Permeability of
Subgrade
Material
(cm/s)
20 Cat3-4_WR-LO-4A 0.50% 1 1.00E-05
21 Cat3-4_WR-LO-4B 1.00% 1 1.00E-05
22 Cat3-4_WR-LO-4C 2.00% 1 1.00E-05
23 Cat3-4_WR-LO-4D 0.50% 4 1.00E-05
24 Cat3-4_WR-LO-4E 1.00% 4 1.00E-05
25 Cat3-4_WR-LO-4F 2.00% 4 1.00E-05
26 Cat3-4_WR-LO-4G 0.50% 8 1.00E-05
27 Cat3-4_WR-LO-4H 1.00% 8 1.00E-05
28 Cat3-4_WR-LO-4I 2.00% 8 1.00E-05
29 Cat3-4_WR-LO-5A 0.50% 1 1.00E-06
30 Cat3-4_WR-LO-5B 1.00% 1 1.00E-06
31 Cat3-4_WR-LO-5C 2.00% 1 1.00E-06

Case Case Designation
Slope of
Overliner in
Liner System
Number of
Geomembrane
Defects
(holes/acre)
Permeability of
Subgrade
Material
(cm/s)
32 Cat3-4_WR-LO-5D 0.50% 4 1.00E-06
33 Cat3-4_WR-LO-5E 1.00% 4 1.00E-06
34 Cat3-4_WR-LO-5F 2.00% 4 1.00E-06
35 Cat3-4_WR-LO-5G 0.50% 8 1.00E-06
36 Cat3-4_WR-LO-5H 1.00% 8 1.00E-06
37 Cat3-4_WR-LO-5I 2.00% 8 1.00E-06
38 Cat3-4_WR-LO-6A 0.50% 1 1.00E-07
39 Cat3-4_WR-LO-6B 1.00% 1 1.00E-07
40 Cat3-4_WR-LO-6C 2.00% 1 1.00E-07
41 Cat3-4_WR-LO-6D 0.50% 4 1.00E-07
42 Cat3-4_WR-LO-6E 1.00% 4 1.00E-07
43 Cat3-4_WR-LO-6F 2.00% 4 1.00E-07
44 Cat3-4_WR-LO-6G 0.50% 8 1.00E-07
45 Cat3-4_WR-LO-6H 1.00% 8 1.00E-07
46 Cat3-4_WR-LO-6I 2.00% 8 1.00E-07
Table 3.3 Case Scenarios for Category 3/4 Stockpiles, Liner Yield = 10.2 inch/yr
Case Case Designation
Slope of
Overliner in
Liner System
Number of
Geomembrane
Defects
(holes/acre)
Permeability of
Subgrade
Material
(cm/s)
47 Cat3-4_WR-LO-7A 0.50% 1 1.00E-05
48 Cat3-4_WR-LO-7B 1.00% 1 1.00E-05
49 Cat3-4_WR-LO-7C 2.00% 1 1.00E-05
50 Cat3-4_WR-LO-7D 0.50% 4 1.00E-05
51 Cat3-4_WR-LO-7E 1.00% 4 1.00E-05
52 Cat3-4_WR-LO-7F 2.00% 4 1.00E-05
53 Cat3-4_WR-LO-7G 0.50% 8 1.00E-05
54 Cat3-4_WR-LO-7H 1.00% 8 1.00E-05
55 Cat3-4_WR-LO-7I 2.00% 8 1.00E-05
56 Cat3-4_WR-LO-8A 0.50% 1 1.00E-06
57 Cat3-4_WR-LO-8B 1.00% 1 1.00E-06
58 Cat3-4_WR-LO-8C 2.00% 1 1.00E-06
59 Cat3-4_WR-LO-8D 0.50% 4 1.00E-06
60 Cat3-4_WR-LO-8E 1.00% 4 1.00E-06
61 Cat3-4_WR-LO-8F 2.00% 4 1.00E-06
62 Cat3-4_WR-LO-8G 0.50% 8 1.00E-06
63 Cat3-4_WR-LO-8H 1.00% 8 1.00E-06
64 Cat3-4_WR-LO-8I 2.00% 8 1.00E-06
65 Cat3-4_WR-LO-9A 0.50% 1 1.00E-07

Case Case Designation
Slope of
Overliner in
Liner System
Number of
Geomembrane
Defects
(holes/acre)
Permeability of
Subgrade
Material
(cm/s)
66 Cat3-4_WR-LO-9B 1.00% 1 1.00E-07
67 Cat3-4_WR-LO-9C 2.00% 1 1.00E-07
68 Cat3-4_WR-LO-9D 0.50% 4 1.00E-07
69 Cat3-4_WR-LO-9E 1.00% 4 1.00E-07
70 Cat3-4_WR-LO-9F 2.00% 4 1.00E-07
71 Cat3-4_WR-LO-9G 0.50% 8 1.00E-07
72 Cat3-4_WR-LO-9H 1.00% 8 1.00E-07
73 Cat3-4_WR-LO-9I 2.00% 8 1.00E-07
Table 3.4 Case Scenarios for Category 3/4 Stockpiles, Liner Yield = 0.3 inch/yr
Case Case Designation
Slope of
Overliner in
Liner System
Number of
Geomembrane
Defects
(holes/acre)
Permeability of
Subgrade
Material
(cm/s)
74 Cat3-4_WR-LO-10A 0.50% 1 1.00E-05
75 Cat3-4_WR-LO-10B 1.00% 1 1.00E-05
76 Cat3-4_WR-LO-10C 2.00% 1 1.00E-05
77 Cat3-4_WR-LO-10D 0.50% 4 1.00E-05
78 Cat3-4_WR-LO-10E 1.00% 4 1.00E-05
79 Cat3-4_WR-LO-10F 2.00% 4 1.00E-05
80 Cat3-4_WR-LO-10G 0.50% 8 1.00E-05
81 Cat3-4_WR-LO-10H 1.00% 8 1.00E-05
82 Cat3-4_WR-LO-10I 2.00% 8 1.00E-05
83 Cat3-4_WR-LO-11A 0.50% 1 1.00E-06
84 Cat3-4_WR-LO-11B 1.00% 1 1.00E-06
85 Cat3-4_WR-LO-11C 2.00% 1 1.00E-06
86 Cat3-4_WR-LO-11D 0.50% 4 1.00E-06
87 Cat3-4_WR-LO-11E 1.00% 4 1.00E-06
88 Cat3-4_WR-LO-11F 2.00% 4 1.00E-06
89 Cat3-4_WR-LO-11G 0.50% 8 1.00E-06
90 Cat3-4_WR-LO-11H 1.00% 8 1.00E-06
91 Cat3-4_WR-LO-11I 2.00% 8 1.00E-06
92 Cat3-4_WR-LO-12A 0.50% 1 1.00E-07
93 Cat3-4_WR-LO-12B 1.00% 1 1.00E-07
94 Cat3-4_WR-LO-12C 2.00% 1 1.00E-07
95 Cat3-4_WR-LO-12D 0.50% 4 1.00E-07
96 Cat3-4_WR-LO-12E 1.00% 4 1.00E-07
97 Cat3-4_WR-LO-12F 2.00% 4 1.00E-07
98 Cat3-4_WR-LO-12G 0.50% 8 1.00E-07
99 Cat3-4_WR-LO-12H 1.00% 8 1.00E-07
100 Cat3-4_WR-LO-12I 2.00% 8 1.00E-07

Table 3.5 Case Scenarios for Category 3 and 4 Stockpiles, Varying Yield
Case Case Designation
Target
Liner
Yield
(inch/year)
Slope of
Overliner in
Liner
System
Number of
Geomembrane
Defects
(holes/acre)
Permeability
of Subgrade
Material
(cm/s)
17 Cat3-4_WR-LO-1 20.4 0.50% 8 1.00E-05
18 Cat3-4_WR-LO-2 14.7 0.50% 8 1.00E-05
19 Cat3-4_WR-LO-3 1.5 0.50% 8 1.00E-05
101 Cat3-4_WR-LO-13 8.2 2.00% 1 1.00E-07
102 Cat3-4_WR-LO-14 4.7 2.00% 1 1.00E-07
103 Cat3-4_WR-LO-15 see Note * 2.00% 1 1.00E-07
108 Cat3-4_WR-LO-13_Extra 1 8.2 1.00% 4 1.00E-05
109 Cat3-4_WR-LO-13_Extra 2 8.2 1.00% 4 1.00E-06
110 Cat3-4_WR-LO-14_Extra 1 4.7 1.00% 4 1.00E-05
111 Cat3-4_WR-LO-15_Extra 1 see Note * 1.00% 4 1.00E-05
112 Cat3-4_WR-LO-14_Extra 2 4.7 1.00% 4 1.00E-06
113 Cat3-4_WR-LO-15_Extra 2 see Note * 1.00% 4 1.00E-06
114 Cat3-4_WR-LO-13_Extra 3 8.2 0.50% 8 1.00E-05
115 Cat3-4_WR-LO-14_Extra 3 4.7 0.50% 8 1.00E-05
116 Cat3-4_WR-LO-15_Extra 3 see Note * 0.50% 8 1.00E-05
* Value corresponds to liner yield reported in Table 3.5, Appendix C, Draft 02 RS49.
4.0 RESULTS
HELP results are summarized in the following tables:
Table 4.1 HELP Results for Category 1/2 Stockpiles (inch/year, inch/day)
Case
Avg. Annual
Lateral Drainage
(inch/year)
Avg. Annual
Percolation
(inch/year)
Max. Daily
Lateral Drainage
(inch/day)
Max. Daily
Percolation
(inch/day)
1 0.297 20.103 0.087 0.197
2 0.108 14.622 0.019 0.178
3 12.897 1.334 0.201 0.004
4 8.239 5.993 0.183 0.021
5 0.107 14.108 0.030 0.182
6 12.939 1.274 0.208 0.004
7 8.484 5.730 0.191 0.020
8 0.256 13.959 0.049 0.178
9 8.907 1.298 0.107 0.004
10 4.503 5.703 0.090 0.020
11 0.052 10.157 0.002 0.165

12 8.966 1.241 0.118 0.004
13 4.725 5.483 0.103 0.019
14 0.129 10.079 0.005 0.171
15 6.971 1.203 0.097 0.004
16 3.618 1.128 0.062 0.004
104 3.109 5.066 0.082 0.018
105 0.035 8.141 0.001 0.165
106 0.755 3.991 0.048 0.018
107 0.013 4.734 0.001 0.068
Table 4.2 HELP Results for Category 3/4 Stockpiles, Liner Yield = 14.2 inch/yr
(inch/year, inch/day)
Case
Avg. Annual
Lateral Drainage
(inch/year)
Avg. Annual
Percolation
(inch/year)
Max. Daily
Lateral Drainage
(inch/day)
Max. Daily
Percolation
(inch/day)
20 14.221 3.11E-03 0.130 2.60E-05
21 14.224 1.66E-03 0.138 1.50E-05
22 14.225 8.90E-04 0.156 9.00E-06
23 14.212 1.23E-02 0.130 1.02E-04
24 14.219 6.58E-03 0.138 5.80E-05
25 14.223 3.52E-03 0.156 3.40E-05
26 14.200 2.46E-02 0.129 2.03E-04
27 14.212 1.31E-02 0.138 1.15E-04
28 14.219 7.02E-03 0.156 6.90E-05
29 14.224 5.90E-04 0.130 5.00E-06
30 14.225 3.10E-04 0.138 3.00E-06
31 14.226 1.70E-04 0.156 2.00E-06
32 14.222 2.27E-03 0.130 1.90E-05
33 14.224 1.21E-03 0.138 1.10E-05
34 14.225 6.50E-04 0.156 6.00E-06
35 14.220 4.51E-03 0.130 3.70E-05
36 14.223 2.40E-03 0.138 2.10E-05
37 14.225 1.28E-03 0.156 1.30E-05
38 14.224 1.30E-04 0.130 1.00E-06
39 14.225 7.00E-05 0.138 1.00E-06
40 14.226 4.00E-05 0.156 <1.00E-06
41 14.224 4.40E-04 0.130 4.00E-06
42 14.225 2.30E-04 0.138 2.00E-06
43 14.226 1.20E-04 0.156 1.00E-06
44 14.223 8.40E-04 0.130 7.00E-06
45 14.225 4.50E-04 0.138 4.00E-06
46 14.226 2.40E-04 0.156 2.00E-06
Table 4.3 HELP Results for Category 3/4 Stockpiles, Liner Yield = 10.2 inch/yr

(inch/year, inch/day)
Case
Avg. Annual
Lateral Drainage
(inch/year)
Avg. Annual
Percolation
(inch/year)
Max. Daily
Lateral Drainage
(inch/day)
Max. Daily
Percolation
(inch/day)
47 10.198 2.30E-03 0.082 1.70E-05
48 10.200 1.23E-03 0.083 9.00E-06
49 10.201 6.60E-04 0.089 5.00E-06
50 10.191 9.14E-03 0.082 6.70E-05
51 10.196 4.88E-03 0.083 3.60E-05
52 10.199 2.61E-03 0.089 2.10E-05
53 10.182 1.83E-02 0.082 1.34E-04
54 10.191 9.75E-03 0.083 7.30E-05
55 10.196 5.21E-03 0.089 4.10E-05
56 10.200 4.40E-04 0.082 3.00E-06
57 10.201 2.30E-04 0.083 2.00E-06
58 10.202 1.20E-04 0.089 1.00E-06
59 10.198 1.68E-03 0.082 1.20E-05
60 10.200 9.00E-04 0.083 7.00E-06
61 10.201 4.80E-04 0.089 4.00E-06
62 10.197 3.34E-03 0.082 2.50E-05
63 10.199 1.78E-03 0.083 1.30E-05
64 10.201 9.50E-04 0.089 8.00E-06
65 10.200 1.00E-04 0.082 1.00E-06
66 10.201 5.00E-05 0.083 <1.00E-06
67 10.202 3.00E-05 0.089 <1.00E-06
68 10.200 3.20E-04 0.082 2.00E-06
69 10.201 1.70E-04 0.083 1.00E-06
70 10.202 9.00E-05 0.089 1.00E-06
71 10.199 6.20E-04 0.082 5.00E-06
72 10.201 3.30E-04 0.083 2.00E-06
73 10.201 1.80E-04 0.089 1.00E-06
Table 4.4 HELP Results for Category 3/4 Stockpiles, Liner Yield = 0.3 inch/yr
(inch/year, inch/day)
Case
Avg. Annual
Lateral Drainage
(inch/year)
Avg. Annual
Percolation
(inch/year)
Max. Daily
Lateral Drainage
(inch/day)
Max. Daily
Percolation
(inch/day)
74 0.305 1.00E-04 0.003 1.00E-06
75 0.305 5.00E-05 0.003 1.00E-06
76 0.305 3.00E-05 0.004 <1.00E-06
77 0.305 3.70E-04 0.003 4.00E-06
78 0.305 2.00E-04 0.003 2.00E-06
79 0.305 1.10E-04 0.004 1.00E-06
80 0.305 7.50E-04 0.003 7.00E-06

Case
Avg. Annual
Lateral Drainage
(inch/year)
Avg. Annual
Percolation
(inch/year)
Max. Daily
Lateral Drainage
(inch/day)
Max. Daily
Percolation
(inch/day)
81 0.305 4.00E-04 0.003 4.00E-06
82 0.305 2.20E-04 0.004 2.00E-06
83 0.305 2.00E-05 0.003 <1.00E-06
84 0.305 1.00E-05 0.003 <1.00E-06
85 0.305 1.00E-05 0.004 <1.00E-06
86 0.305 7.00E-05 0.003 1.00E-06
87 0.305 4.00E-05 0.003 <1.00E-06
88 0.305 2.00E-05 0.004 <1.00E-06
89 0.305 1.40E-04 0.003 1.00E-06
90 0.305 8.00E-05 0.003 1.00E-06
91 0.305 4.00E-05 0.004 <1.00E-06
92 0.305 1.00E-05 0.003 <1.00E-06
93 0.305 1.00E-05 0.003 <1.00E-06
94 0.305 <1.00E-05 0.004 <1.00E-06
95 0.305 2.00E-05 0.003 <1.00E-06
96 0.305 1.00E-05 0.003 <1.00E-06
97 0.305 1.00E-05 0.004 <1.00E-06
98 0.305 3.00E-05 0.003 <1.00E-06
99 0.305 2.00E-05 0.003 <1.00E-06
100 0.305 1.00E-05 0.004 <1.00E-06
Table 4.5 HELP Results for Category 3 and 4 Stockpiles, Varying Yield
(inch/year, inch/day)
Case
Avg. Annual
Lateral Drainage
(inch/year)
Avg. Annual
Percolation
(inch/year)
Max. Daily
Lateral Drainage
(inch/day)
Max. Daily
Percolation
(inch/day)
17 20.354 3.42E-02 0.185 2.73E-04
18 14.687 2.54E-02 0.133 2.08E-04
19 1.475 3.17E-03 0.011 2.20E-05
101 8.199 2.00E-05 0.066 <1.00E-06
102 4.727 2.00E-05 0.039 <1.00E-06
103 1.365 1.00E-05 0.009 <1.00E-06
108 8.195 4.00E-03 0.065 2.90E-05
109 8.198 7.40E-04 0.065 5.00E-06
110 4.725 2.42E-03 0.037 1.80E-05
111 1.365 7.90E-04 0.009 5.00E-06
112 4.727 4.50E-04 0.037 3.00E-06
113 1.365 1.50E-04 0.009 1.00E-06
114 8.183 1.49E-02 0.063 1.07E-04
115 4.718 9.04E-03 0.037 6.50E-05
116 1.362 2.95E-03 0.009 1.80E-05

Table 4.6 HELP Results for Category 1/2 Stockpiles
(gal/acre/day)
Case
Avg. Annual
Lateral Drainage
(gal/acre/day)
Avg. Annual
Percolation
(gal/acre/day)
Max. Daily
Lateral Drainage
(gal/acre/day)
Max. Daily
Percolation
(gal/acre/day)
1 22.1 1.50E+03 2362.8 5.36E+03
2 8.0 1.09E+03 504.5 4.83E+03
3 959.4 9.92E+01 5469.9 1.18E+02
4 612.9 4.46E+02 4964.5 5.83E+02
5 8.0 1.05E+03 804.0 4.94E+03
6 962.5 9.48E+01 5646.9 1.10E+02
7 631.1 4.26E+02 5196.7 5.44E+02
8 19.1 1.04E+03 1329.1 4.84E+03
9 662.6 9.66E+01 2915.4 1.09E+02
10 335.0 4.24E+02 2457.0 5.38E+02
11 3.9 7.56E+02 66.5 4.48E+03
12 667.0 9.23E+01 3199.4 1.03E+02
13 351.5 4.08E+02 2798.1 5.08E+02
14 9.6 7.50E+02 134.7 4.63E+03
15 518.6 8.95E+01 2629.7 1.01E+02
16 269.1 8.39E+01 1679.6 9.80E+01
104 231.3 3.77E+02 2232.7 4.99E+02
105 2.6 6.06E+02 37.5 4.49E+03
106 56.1 2.97E+02 1296.0 4.83E+02
107 0.9 3.52E+02 17.4 1.86E+03
Table 4.7 HELP Results for Category 3/4 Stockpiles, Liner Yield = 14.2 inch/yr
(gal/acre/day)
Case
Avg. Annual
Lateral Drainage
(gal/acre/day)
Avg. Annual
Percolation
(gal/acre/day)
Max. Daily
Lateral Drainage
(gal/acre/day)
Max. Daily
Percolation
(gal/acre/day)
20 1057.9 2.31E-01 3520.3 7.06E-01
21 1058.1 1.23E-01 3744.6 4.07E-01
22 1058.2 6.62E-02 4237.4 2.44E-01
23 1057.2 9.17E-01 3518.4 2.77E+00
24 1057.7 4.89E-01 3743.8 1.57E+00
25 1058.0 2.62E-01 4236.9 9.23E-01
26 1056.3 1.83E+00 3515.7 5.51E+00
27 1057.3 9.77E-01 3742.7 3.12E+00
28 1057.8 5.22E-01 4235.8 1.87E+00
29 1058.1 4.39E-02 3520.9 1.36E-01
30 1058.2 2.31E-02 3744.9 8.15E-02
31 1058.3 1.26E-02 4237.7 5.43E-02
32 1058.0 1.69E-01 3520.6 5.16E-01
33 1058.1 9.00E-02 3744.6 2.99E-01

Case
Avg. Annual
Lateral Drainage
(gal/acre/day)
Avg. Annual
Percolation
(gal/acre/day)
Max. Daily
Lateral Drainage
(gal/acre/day)
Max. Daily
Percolation
(gal/acre/day)
34 1058.2 4.84E-02 4237.4 1.63E-01
35 1057.8 3.35E-01 3520.0 1.00E+00
36 1058.1 1.79E-01 3744.6 5.70E-01
37 1058.2 9.52E-02 4237.4 3.53E-01
38 1058.1 9.67E-03 3521.1 < 1.00E-01
39 1058.2 5.21E-03 3744.9 < 1.00E-01
40 1058.3 2.98E-03 4237.7 < 1.00E-01
41 1058.1 3.27E-02 3520.9 1.09E-01
42 1058.2 1.71E-02 3744.9 5.43E-02
43 1058.3 8.93E-03 4237.7 < 1.00E-01
44 1058.1 6.25E-02 3520.9 1.90E-01
45 1058.2 3.35E-02 3744.9 1.09E-01
46 1058.3 1.79E-02 4237.7 < 1.00E-01
Table 4.8 HELP Results for Category 3/4 Stockpiles, Liner Yield = 10.2 inch/yr
(gal/acre/day)
Case
Avg. Annual
Lateral Drainage
(gal/acre/day)
Avg. Annual
Percolation
(gal/acre/day)
Max. Daily
Lateral Drainage
(gal/acre/day)
Max. Daily
Percolation
(gal/acre/day)
47 758.6 1.71E-01 2219.4 4.62E-01
48 758.8 9.15E-02 2247.9 2.44E-01
49 758.9 4.91E-02 2413.6 1.36E-01
50 758.1 6.80E-01 2218.4 1.82E+00
51 758.5 3.63E-01 2247.1 9.77E-01
52 758.7 1.94E-01 2413.0 5.70E-01
53 757.4 1.36E+00 2216.5 3.64E+00
54 758.1 7.25E-01 2246.3 1.98E+00
55 758.5 3.88E-01 2412.8 1.11E+00
56 758.8 3.27E-02 2220.0 < 1.00E-01
57 758.8 1.71E-02 2248.2 < 1.00E-01
58 758.9 8.93E-03 2413.6 < 1.00E-01
59 758.7 1.25E-01 2219.7 3.26E-01
60 758.8 6.70E-02 2247.9 1.90E-01
61 758.9 3.57E-02 2413.6 1.09E-01
62 758.5 2.48E-01 2219.4 6.79E-01
63 758.7 1.32E-01 2247.9 3.53E-01
64 758.8 7.07E-02 2413.3 2.17E-01
65 758.8 7.44E-03 2220.0 < 1.00E-01
66 758.9 3.72E-03 2248.2 < 1.00E-01
67 758.9 2.23E-03 2413.6 < 1.00E-01
68 758.8 2.38E-02 2220.0 < 1.00E-01

Case
Avg. Annual
Lateral Drainage
(gal/acre/day)
Avg. Annual
Percolation
(gal/acre/day)
Max. Daily
Lateral Drainage
(gal/acre/day)
Max. Daily
Percolation
(gal/acre/day)
69 758.9 1.26E-02 2248.2 < 1.00E-01
70 758.9 6.70E-03 2413.6 < 1.00E-01
71 758.7 4.61E-02 2220.0 1.36E-01
72 758.8 2.45E-02 2248.2 < 1.00E-01
73 758.9 1.34E-02 2413.6 < 1.00E-01
Table 4.9 HELP Results for Category 3/4 Stockpiles, Liner Yield = 0.3 inch/yr
(gal/acre/day)
Case
Avg. Annual
Lateral Drainage
(gal/acre/day)
Avg. Annual
Percolation
(gal/acre/day)
Max. Daily
Lateral Drainage
(gal/acre/day)
Max. Daily
Percolation
(gal/acre/day)
74 22.7 7.44E-03 89.9 < 1.00E-01
75 22.7 3.72E-03 80.9 < 1.00E-01
76 22.7 2.23E-03 95.0 < 1.00E-01
77 22.7 2.75E-02 89.9 1.09E-01
78 22.7 1.49E-02 92.6 < 1.00E-01
79 22.7 8.18E-03 95.0 < 1.00E-01
80 22.7 5.58E-02 89.6 1.90E-01
81 22.7 2.98E-02 92.6 1.09E-01
82 22.7 1.64E-02 95.0 < 1.00E-01
83 22.7 1.49E-03 89.9 < 1.00E-01
84 22.7 <1.00E-03 92.6 < 1.00E-01
85 22.7 <1.00E-03 95.0 < 1.00E-01
86 22.7 5.21E-03 89.9 < 1.00E-01
87 22.7 2.98E-03 92.6 < 1.00E-01
88 22.7 1.49E-03 95.0 < 1.00E-01
89 22.7 1.04E-02 89.9 < 1.00E-01
90 22.7 5.95E-03 92.6 < 1.00E-01
91 22.7 2.98E-03 95.0 < 1.00E-01
92 22.7 <1.00E-03 89.9 < 1.00E-01
93 22.7 <1.00E-03 92.6 < 1.00E-01
94 22.7 <1.00E-03 95.0 < 1.00E-01
95 22.7 1.49E-03 89.9 < 1.00E-01
96 22.7 <1.00E-03 92.6 < 1.00E-01
97 22.7 <1.00E-03 95.0 < 1.00E-01
98 22.7 2.23E-03 89.9 < 1.00E-01
99 22.7 1.49E-03 92.6 < 1.00E-01
100 22.7 <1.00E-03 95.0 < 1.00E-01
Table 4.10 HELP Results for Category 3 and 4 Stockpiles, Varying Yield

(gal/acre/day)
Case
Avg. Annual
Lateral Drainage
(gal/acre/day)
Avg. Annual
Percolation
(gal/acre/day)
Max. Daily
Lateral Drainage
(gal/acre/day)
Max. Daily
Percolation
(gal/acre/day)
17 1514.1 2.54E+00 5014.2 7.41E+00
18 1092.6 1.89E+00 3614.3 5.65E+00
19 109.7 2.36E-01 305.2 5.97E-01
101 610.0 1.49E-03 1796.4 < 1.00E-01
102 351.7 1.49E-03 1072.2 < 1.00E-01
103 101.6 7.44E-04 256.3 < 1.00E-01
108 609.6 2.98E-01 1757.3 7.87E-01
109 609.9 5.50E-02 1757.8 1.36E-01
110 351.5 1.80E-01 1004.9 4.89E-01
111 101.5 5.88E-02 249.0 1.36E-01
112 351.6 3.35E-02 1005.2 8.15E-02
113 101.6 1.12E-02 249.3 2.72E-02
114 608.7 1.11E+00 1722.0 2.91E+00
115 351.0 6.72E-01 992.4 1.76E+00
116 101.3 2.19E-01 237.6 4.89E-01
5.0 CONCLUSIONS
HELP analyses were used to calibrate various stockpile configurations to target annual yield
values. While these simulations may be used as an indicator of liner performance, the actual
performance will be governed by material properties encountered in the field and local
climate conditions. It should be noted that based on the calibrated climate and material
parameters required to attain some of the specified target yield values, a number of the
simulations evaluated are not considered physically realistic.