Technical Memorandum - WRAPAir.org · Web view2005/04/30 · P.O. Box 1345 El Dorado, CA 95623...
50
PECHAN P.O. Box 1345 El Dorado, CA 95623 530-295-2995 telephone 530-295-2999 facsimile 3622 Lyckan Parkway Suite 2002 Durham, NC 27707 919-493-3144 telephone 919-493-3182 facsimile 5528-B Hempstead Way Springfield, VA 22151 703-813-6700 telephone 703-813-6729 facsimile
Transcript of Technical Memorandum - WRAPAir.org · Web view2005/04/30 · P.O. Box 1345 El Dorado, CA 95623...
PECHAN
P.O. Box 1345El Dorado, CA 95623
530-295-2995 telephone530-295-2999 facsimile
3622 Lyckan ParkwaySuite 2002Durham, NC 27707
919-493-3144 telephone919-493-3182 facsimile
5528-B Hempstead WaySpringfield, VA 22151
703-813-6700 telephone703-813-6729 facsimile
TECHNICAL MEMORANDUM #2:PM10 CANDIDATE AREA DESCRIPTIONS
Prepared for:
Western Governor’s Association1515 Cleveland PlaceSuite 200Denver, Colorado 80202
Prepared by:
Stephen M. RoeMaggie MaE.H. Pechan & Associates, Inc.P.O. Box 1345El Dorado, CA 95623
and
Cassie ArchuletaAir Resource Specialists, Inc.1901 Sharp Point DriveSuite EFort Collins, CO 80525
April 30, 2005

[This page intentionally left blank.]

PECHAN April 30, 2005
CONTENTS
A. INTRODUCTION AND SUMMARY....................................................................................1B. CANDIDATE PM10 AREA SUMMARIES............................................................................9
1. Alaska..........................................................................................................................92. Arizona........................................................................................................................93. California...................................................................................................................114. Colorado....................................................................................................................135. Idaho..........................................................................................................................166. Montana.....................................................................................................................167. Nevada.......................................................................................................................178. Oregon.......................................................................................................................189. Utah............................................................................................................................2010. Washington................................................................................................................2111. Wyoming...................................................................................................................23
C. MONITORING DATA SUMMARY....................................................................................24D. REFERENCES......................................................................................................................26
Table 1. Summary of PM10 Candidate Area Control Measures......................................................3Table 2. Areas Recommended for Further Study...........................................................................5Table 3. PM10 Monitoring Summary............................................................................................25
Figure 1. USGS Physiographic Regions and Class I Areas............................................................2Figure 2. WRAP PM10 Areas..........................................................................................................7Figure 3. Areas Recommended for Further Study..........................................................................8Figure 4. Southern California Air Basins.....................................................................................12
Appendix A. Ambient Monitoring Data for Candidate PM10 Areas
iii Technical Memorandum #2: PM10 Candidate Area Descriptions

[This page intentionally left blank.]

PECHAN April 30, 2005
A. INTRODUCTION AND SUMMARY
Under Task 1 of this project, Pechan developed a list of Western Regional Air Partnership (WRAP) areas that had dealt with particulate matter less than 10 microns (PM10) attainment issues. These areas included present and former non-attainment areas (NAAs) and areas that were never designated as non-attainment. A brief description of each of these 25 candidate PM10
areas is provided in Section B below. These descriptions were assembled from readily-available information, and the reader will note that they are not consistent in the amount of information provided.
Each description in Section B includes information on the location, including the U.S. Geological Service physiographic region. As described in more detail on the Causes of Haze website (DRI, 2005), physiographic regions are areas of similar terrain and are often impacted by PM10 with similar aerosol characteristics (see Figure 1). Also included are descriptions of the primary PM10 contributors and adopted control measures.
Section C of this technical memorandum provides a summary of monitoring data for each area. The data summary includes number of monitoring sites, significant trends in annual PM10 concentrations, seasons with the highest PM10 averages, and other available information. Additional monitoring data are provided in Attachment A.
Table 1 provides a summary of the candidate PM10 areas and the primary control measures implemented in each area. Primary control measures are those thought to be the most important in achieving ambient PM10 reductions in each area.
The areas recommended for further study in this project are identified in Table 3. Figure 2 is a map showing the locations of all WRAP PM10 areas, including the 25 candidate areas from Technical Memorandum #1. In Figure 3, each recommended PM10 area and the locations of WRAP Class I areas is shown. In the selection of these 14 recommended areas, the following criteria were used:
area demonstrates improved/improving PM10 concentrations – these could be negative trends in annual or 24-hr PM10 concentrations, as well as a declining number of annual exceedances of the 24-hr standard;
area has adequate documentation of control measures and their impact – this type of documentation for some areas is lacking;
area has implemented controls that are different from other similar areas – for example, different sources are covered or the same sources are regulated in a different way); and
other factors – these include areas that experience PM10 problems in seasons other than winter, which is the most common planning season in the West; areas where assessment has been made of source contributions from secondary PM sources.
1 Technical Memorandum #2: PM10 Candidate Area Descriptions

PECHAN April 30, 2005
Figure 1. USGS Physiographic Regions and Class I Areas
(Source: DRI, 2005)
2 Technical Memorandum #2: PM10 Candidate Area Descriptions

PECHAN April 30, 2005
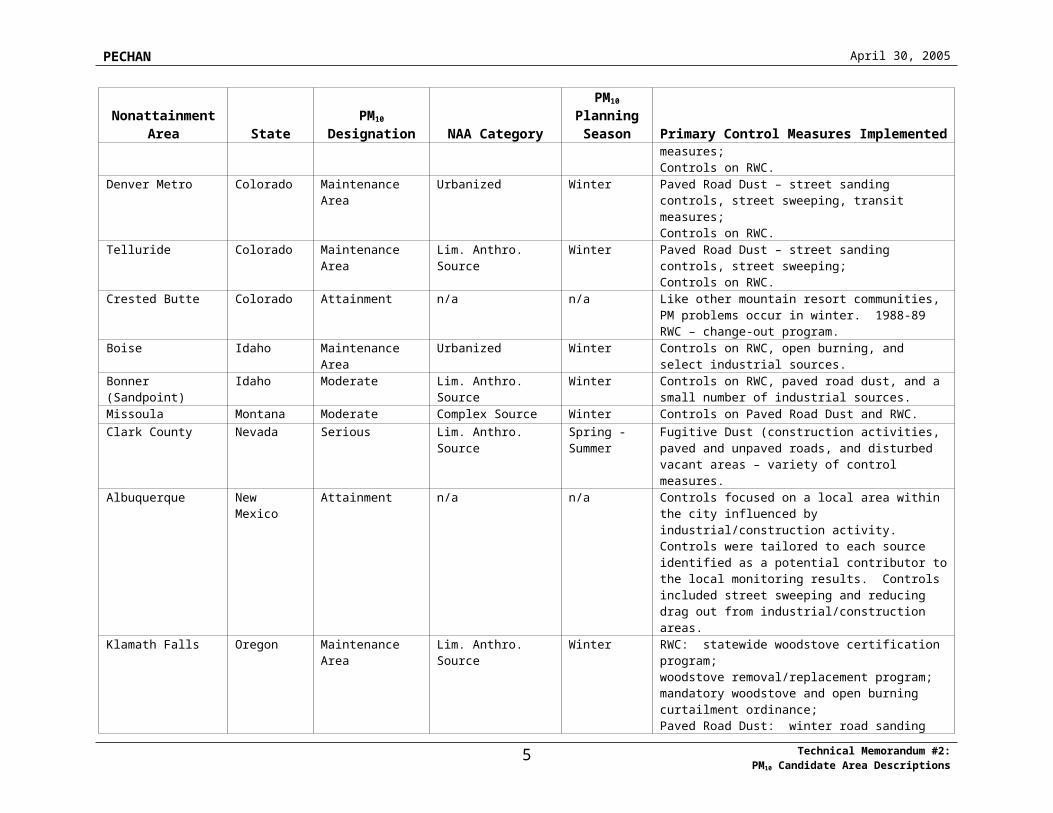
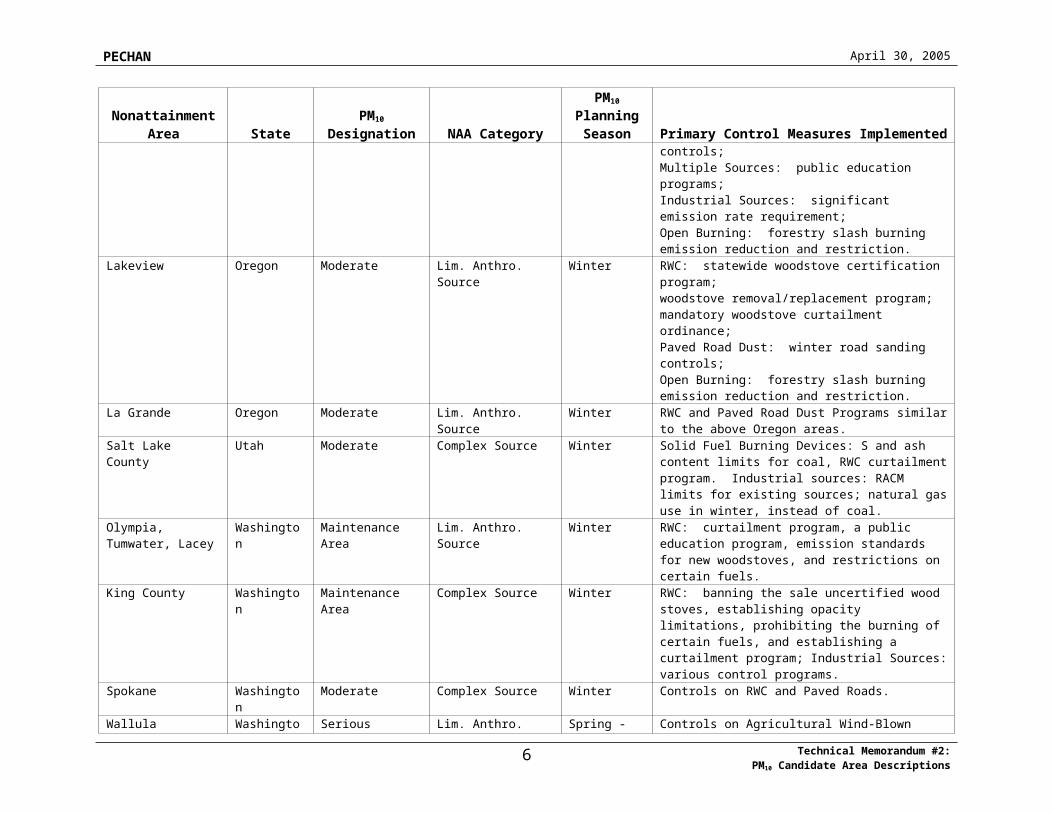
Table 1. Summary of PM10 Candidate Area Control Measures
Nonattainment Area State
PM10
Designation NAA Category
PM10
Planning Season Primary Control Measures Implemented
Juneau Alaska Moderate Lim. Anthro. Source Winter Unpaved Road Dust: road paving. RWC: public education program, episodic curtailment, opacity standard.
Mohave Co. (Bullhead City)
Arizona Maintenance Area Lim. Anthro. Source Spring - Summer
Unpaved Road Dust: road paving;Windblown Dust: control of storage piles.
Phoenix Arizona Serious Urbanized Spring - Summer
Paved Road Dust: street sweeping;Fugitive Dust: wide variety of controls (see Section B2).Other Sources: include commercial charbroiling; reformulated gasoline use.
Yuma Arizona Moderate Natural Events-Driven Spring -Summer
BACM for anthropogenic sources applied to the Salt River Area in Phoenix are being evaluated for use (construction activities, paved/unpaved road dust, onroad vehicles).
Los Angeles South Coast Air Basin
California Serious Urbanized Summer Has targeted both primary and secondary PM sources – primary: paved and unpaved roads, storage piles, disturbed vacant land, and other sources. Secondary PM covered include sources of ammonia, sulfur dioxide, and nitrogen oxides.
Coachella Valley California Serious Lim. Anthro. Source Summer Covered within the South Coast Air Quality Plan. Important sources are fugitive dust – same as those listed above.
Mammoth Lakes California Maintenance Area Lim. Anthro. Source Winter RWC – limit number of RWC appliances; change-out requirement upon sale; public awareness program.Paved Road Dust – street sweeping program.
Aspen Colorado Maintenance Area Lim. Anthro. Source Winter Paved Road Dust – street sanding controls, street sweeping, transit measures;Controls on RWC.
Denver Metro Colorado Maintenance Area Urbanized Winter Paved Road Dust – street sanding controls, street sweeping, transit measures;Controls on RWC.
Telluride Colorado Maintenance Area Lim. Anthro. Source Winter Paved Road Dust – street sanding controls, street sweeping;Controls on RWC.
Crested Butte Colorado Attainment n/a n/a Like other mountain resort communities, PM problems occur in winter. 1988-89 RWC – change-out program.
Boise Idaho Maintenance Area Urbanized Winter Controls on RWC, open burning, and select industrial sources.
Bonner (Sandpoint) Idaho Moderate Lim. Anthro. Source Winter Controls on RWC, paved road dust, and a small number of industrial sources.
Missoula Montana Moderate Complex Source Winter Controls on Paved Road Dust and RWC.
3 Technical Memorandum #2: PM10 Candidate Area Descriptions

PECHAN April 30, 2005
Nonattainment Area State
PM10
Designation NAA Category
PM10
Planning Season Primary Control Measures Implemented
Clark County Nevada Serious Lim. Anthro. Source Spring - Summer
Fugitive Dust (construction activities, paved and unpaved roads, and disturbed vacant areas – variety of control measures.
Albuquerque New Mexico Attainment n/a n/a Controls focused on a local area within the city influenced by industrial/construction activity. Controls were tailored to each source identified as a potential contributor to the local monitoring results. Controls included street sweeping and reducing drag out from industrial/construction areas.
Klamath Falls Oregon Maintenance Area Lim. Anthro. Source Winter RWC: statewide woodstove certification program; woodstove removal/replacement program; mandatory woodstove and open burning curtailment ordinance; Paved Road Dust: winter road sanding controls;Multiple Sources: public education programs;Industrial Sources: significant emission rate requirement;Open Burning: forestry slash burning emission reduction and restriction.
Lakeview Oregon Moderate Lim. Anthro. Source Winter RWC: statewide woodstove certification program; woodstove removal/replacement program; mandatory woodstove curtailment ordinance; Paved Road Dust: winter road sanding controls;Open Burning: forestry slash burning emission reduction and restriction.
La Grande Oregon Moderate Lim. Anthro. Source Winter RWC and Paved Road Dust Programs similar to the above Oregon areas.
Salt Lake County Utah Moderate Complex Source Winter Solid Fuel Burning Devices: S and ash content limits for coal, RWC curtailment program. Industrial sources: RACM limits for existing sources; natural gas use in winter, instead of coal.
Olympia, Tumwater, Lacey
Washington Maintenance Area Lim. Anthro. Source Winter RWC: curtailment program, a public education program, emission standards for new woodstoves, and restrictions on certain fuels.
King County Washington Maintenance Area Complex Source Winter RWC: banning the sale uncertified wood stoves, establishing opacity limitations, prohibiting the burning of certain fuels, and establishing a curtailment program; Industrial Sources: various control programs.
Spokane Washington Moderate Complex Source Winter Controls on RWC and Paved Roads.Wallula Washington Serious Lim. Anthro. Source Spring -
SummerControls on Agricultural Wind-Blown Dust.
Sheridan Wyoming Moderate Lim. Anthro. Source Winter Paved Road Dust: application rates, traction material specifications, street sweeping.
4 Technical Memorandum #2: PM10 Candidate Area Descriptions

PECHAN April 30, 2005
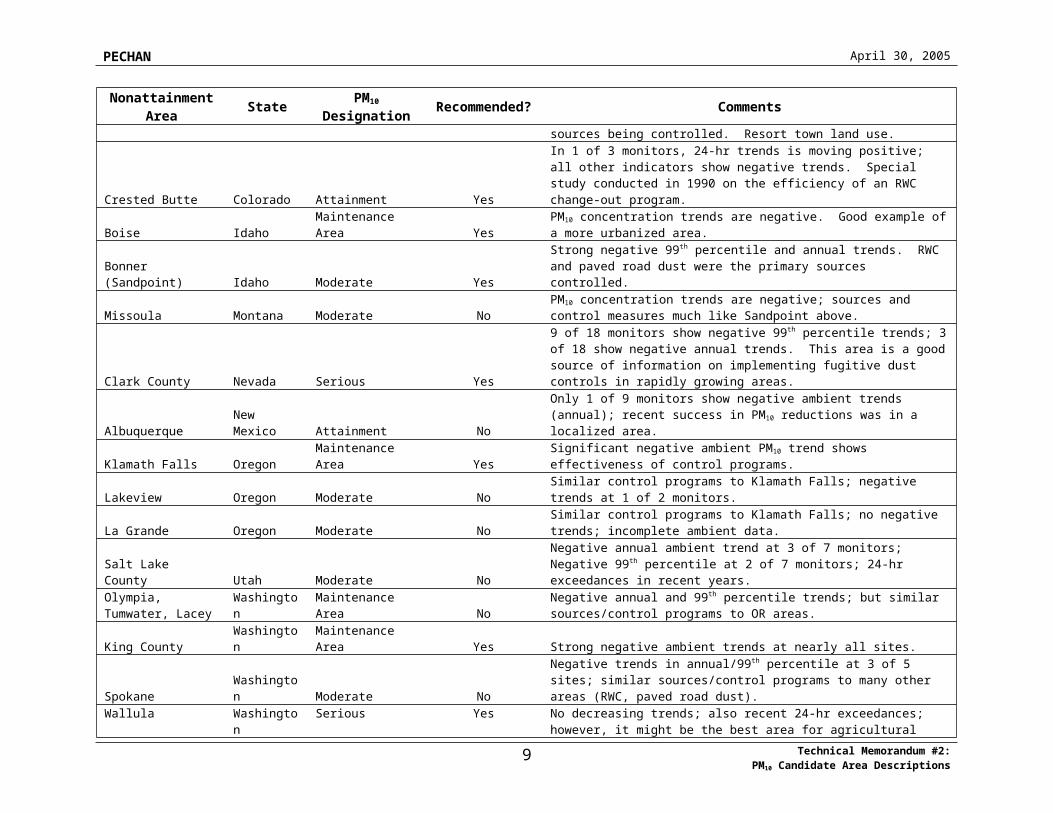
Table 2. Areas Recommended for Further Study
Nonattainment Area State PM10
Designation Recommended? Comments
Juneau Alaska Moderate YesStrong negative ambient trends show effectiveness of unpaved road and RWC controls (primary sources of PM10). Small city to rural land use.
Mohave Co. (Bullhead City) Arizona Maintenance Area No
Positive ambient trends in this rapidly growing area. Fugitive dust (e.g. construction) is the dominant source. Small city to rural land use.
Phoenix Arizona Serious Yes
Most sites do not show negative PM10 trends; however, the area is a rich source for recent control measure information. Fugitive dust sources (especially construction) dominate. Large city land use.
Yuma Arizona Moderate No
No negative ambient trends; control strategies still being formulated. Wind-blown and other fugitive dust sources dominate. Small city to rural land use.
Los Angeles South Coast Air Basin California Serious Yes
Decreasing ambient trends at most sites; only area to look at both primary and secondary PM measures; complex mixture of urban sources; Large city land use.
Coachella Valley California Serious No
No negative ambient trend for the 99th percentile; annual average reductions at 2 of 4 sites could be influenced by better upwind controls; Fugitive dust (e.g. construction) is the primary source. Small city to rural land use.
Mammoth Lakes California Maintenance Area YesNegative ambient trends; residential wood combustion (RWC) and paved road dust are primary sources targeted by controls; Resort town land use.
Aspen Colorado Maintenance Area NoSimilar sources to Telluride; 99th percentile has negative trend, but not annual average; RWC and paved road dust; Resort town land use.
Denver Metro Colorado Maintenance Area Yes
Negative trends in 99th percentile at 6 of 17 sites; only 1 in 17 shows negative annual avg. trend; RWC, paved road dust, vehicles, and industrial sources are the most important and subject to control programs. Large city land use..
Telluride Colorado Maintenance Area Yes
Negative ambient trends both in 99th percentile and annual average. Paved road dust and RWC important sources being controlled. Resort town land use.
Crested Butte Colorado Attainment Yes
In 1 of 3 monitors, 24-hr trends is moving positive; all other indicators show negative trends. Special study conducted in 1990 on the efficiency of an RWC change-out program.
Boise Idaho Maintenance Area YesPM10 concentration trends are negative. Good example of a more urbanized area.
Bonner (Sandpoint) Idaho Moderate YesStrong negative 99th percentile and annual trends. RWC and paved road dust were the primary sources controlled.
Missoula Montana Moderate NoPM10 concentration trends are negative; sources and control measures much like Sandpoint above.
Clark County Nevada Serious Yes
9 of 18 monitors show negative 99th percentile trends; 3 of 18 show negative annual trends. This area is a good source of information on implementing fugitive dust controls in rapidly growing areas.
Albuquerque New Mexico Attainment NoOnly 1 of 9 monitors show negative ambient trends (annual); recent success in PM10 reductions was in a localized area.
5 Technical Memorandum #2: PM10 Candidate Area Descriptions
PECHAN April 30, 2005
Nonattainment Area State PM10
Designation Recommended? Comments
Klamath Falls Oregon Maintenance Area YesSignificant negative ambient PM10 trend shows effectiveness of control programs.
Lakeview Oregon Moderate NoSimilar control programs to Klamath Falls; negative trends at 1 of 2 monitors.
La Grande Oregon Moderate NoSimilar control programs to Klamath Falls; no negative trends; incomplete ambient data.
Salt Lake County Utah Moderate NoNegative annual ambient trend at 3 of 7 monitors; Negative 99th percentile at 2 of 7 monitors; 24-hr exceedances in recent years.
Olympia, Tumwater, Lacey Washington Maintenance Area No
Negative annual and 99th percentile trends; but similar sources/control programs to OR areas.
King County Washington Maintenance Area Yes Strong negative ambient trends at nearly all sites.
Spokane Washington Moderate NoNegative trends in annual/99th percentile at 3 of 5 sites; similar sources/control programs to many other areas (RWC, paved road dust).
Wallula Washington Serious YesNo decreasing trends; also recent 24-hr exceedances; however, it might be the best area for agricultural tilling controls.
Sheridan Wyoming Moderate YesNegative ambient trends (both annual and 99th percentile); good area to establish effectiveness of paved road dust controls.
6 Technical Memorandum #2: PM10 Candidate Area Descriptions
PECHAN April 30, 2005
Figure 2. WRAP PM10 Areas
California
Arizona
Oregon
San Joaquin Valley
South CoastAir Basin
Indian Wells
San Bernardino
Imperial Valley
Olympia, Tumwater, Lacey
Fort Hall Reservation
Utah
Clark
Medford-Ashland
Yuma
Mono Basin
Boise
Sandpoint
Pinehurst
Columbia FallsWhitefish
Kalispell
Polson
Ronan
Libby
Thompson Falls
LaGrande
Eugene-Springfield
LakeviewKlamath Falls
Grants Pass
DouglasPaul Spur
KentTacoma
Yakima
Wallula
Spokane
ButteLame Deer
Coachella Valley
Trona
Sheridan
Yavapai-Apache
Fort Peck
Flathead
Spokane
Northern Cheyenne
Montana
Utah
Idaho
NevadaColorado
Wyoming
Texas
New Mexico
Washington
Nebraska
North Dakota
South Dakota
Kansas
Oklahoma
Ajo
Reno
Ogden
Lamar
Aspen
Hayden
Payson
Nogales
Phoenix
Missoula
Telluride
Canon CitySacramento
Denver Metro
Owens Valley
Crested Butte
Mammoth Lakes
Coso Junction
Bullhead City
Pagosa Springs
Steamboat Springs
AnthonyRillito
Salt Lake
Eagle RiverJuneau
Alaska
NAA Town/City
Counties Containing NAAsMaintenance Area
Moderate
Serious
Class I Areas
Tribal Class I Areas
E.H.Pechan & Associates, IncPrepared by M.Ma
May, 2005
7 Technical Memorandum #2: PM10 Candidate Area Descriptions

PECHAN April 30, 2005
Figure 3. Areas Recommended for Further Study
8 Technical Memorandum #2: PM10 Candidate Area Descriptions

PECHAN April 30, 2005
California
Arizona
Oregon
South CoastAir Basin
Clark County
Boise
Sandpoint
Klamath Falls
King County
Wallula
Sheridan
Montana
Utah
Texas
Idaho
NevadaColorado
Wyoming
New Mexico
Washington
Nebraska
North Dakota
South Dakota
Kansas
Oklahoma
Phoenix
Telluride
Denver Metro
Crested Butte
Mammoth Lakes
Juneau
Alaska
Recommended Areas
Class I Areas
Tribal Class I Areas
E.H.Pechan & Associates, IncPrepared by M.Ma
May, 2005
9 Technical Memorandum #2: PM10 Candidate Area Descriptions
PECHAN April 30, 2005
B. CANDIDATE PM10 AREA SUMMARIES
Brief descriptions of each area are provided below based on readily-available information. The areas are presented by WRAP State. The only candidate area in New Mexico was Albuquerque, New Mexico. Discussions with City of Albuquerque staff indicated that reductions in ambient PM10 had been achieved in a targeted area impacted by industrial and traffic activity. Additional ambient data for Albuquerque are summarized in Section C and Attachment A. These data show that for most of the other monitors operating in Albuquerque, the trends tend to be negative; however, they are not statistically significant. Further, for several sites, data in recent years is often missing. For these reasons, no further analysis of this area was conducted.
1. Alaska
Juneau NAA
This NAA includes area in the City and Borough of Juneau. The area covers 12,000 acres of the Mendenhall Valley in south-central Alaska (AKDEC, 1993). The population of Juneau is about 31,000. Through the 1990s, the population grew by about 15%. In recent years, population growth has been less than 1%/year. The physical geography of the area (river valley surrounded by high peaks) traps pollutants during periods of inversion. The area has exceeded both the annual and daily standards for PM10. High periods of PM tend to occur in the winter season. Violations of the total suspended particulate standard were first measured in 1982.
Categories identified as being significant PM10 contributors include unpaved road dust, paved road dust, and RWC (AKDEC, 1993). Control programs have centered on unpaved road dust and RWC. Many of the unpaved roads in the NAA were paved. Reductions in ambient PM10 in the area during the early 1990’s were attributed to paving unpaved roads. For RWC, early control efforts have included a public outreach program, an opacity standard (backed up with staff working with residents on stove operation), and an episodic curtailment program.
2. Arizona
Bullhead City NAA
Bullhead City is located in Mohave County in northwest Arizona along the Colorado River, which is the border of Arizona and Nevada. This NAA is located in the Southwest Deserts Region. On the west side of the Colorado River, is Laughlin, Nevada. Although Bullhead City developed with the construction of Davis Dam and Lake Mohave in the 1940s, it was not incorporated until 1984. Because of the year-round recreational opportunities and the appeal to retirees, population in this area has grown rapidly. The population is about 34,000. In recent years, the population growth rate has been about 2.3%/year. The area is part of the Colorado River resort area that extends from Lake Mead National Recreation Area south to Yuma. The Bullhead City NAA is more than 200 square miles in size (ADEQ, 2002).
Bullhead City was designated as a moderate PM10 NAA due to two exceedances of the 24-hr standard (one each in 1989 and 1991) and an exceedance of the annual standard in 1989. ADEQ
10 Technical Memorandum #2: PM10 Candidate Area Descriptions
10

PECHAN April 30, 2005
noted that exceptional construction activities contributed to the 1991 exceedance. The primary contributor to PM10 emissions was windblown dust from cleared areas. Paved and unpaved road dust sources were secondary contributors. Control measures included reasonably available control measures (RACM) for fugitive dust (mainly paving unpaved roads, also control of storage piles). Bullhead City also implemented a local grading ordinance that required graded areas to be left in a condition that limits dust emissions.
Phoenix Metro NAA
The Phoenix Metro NAA is really two separate NAAs that include portions of Maricopa and Pinal Counties. Phoenix is located in the Southwest Deserts Region. The population of Phoenix is about 1,300,000. During the 1990’s, the population grew by 34%, and in recent years, the growth rate has been about 1.6%/year. In Maricopa County, there have been exceedances of both the annual and 24-hr PM10 standards. In 1996 and 1997, the annual standard was exceeded in five different locations [Maricopa Association of Governments (MAG), 2005].
A diverse source group impacts the Phoenix Metro NAA. Sources include those representative of urbanized areas (e.g., vehicles, nonroad sources, other combustion, paved road dust), agricultural sources, and windblown dust. ADEQ developed a separate SIP for the Salt River area in south central Phoenix (ADEQ, 2004a). This area was heavily impacted by windblown dust generated in large part from areas disturbed by construction. Although it is still too early to assess the overall success of the SIP measures being applied in the Phoenix Metro NAA, the plan documents are a good source of information on a wide variety of control measures.
Key control measures included in MAG’s Serious PM10 Plan include: Strengthening and Better Enforcement of Fugitive Dust Control Rules; Reduce Particulate Emissions from Unpaved Roads and Alleys; Reduce Particulate Emissions from Unpaved Parking Lots; Reduce Particulate Emissions from Vacant Disturbed Lots; PM10 Efficient Street Sweepers; Curbing, Paving, or Stabilizing Shoulders on Paved Roads; Paving, Vegetating, and Chemically Stabilizing Unpaved Access Points Onto Paved Roads; PM10 Episode Thresholds; Restaurant Charbroiler Controls; Clean Gasoline (long-term and winter fuel reformulation); Pre-1988 Heavy-Duty diesel Commercial Vehicle Standards; and Coordinate Traffic Signal Systems (MAG, 2005).
Yuma NAA
The Yuma Moderate PM10 NAA is contained entirely within Yuma County and is about 456 square miles in size. Yuma County covers 5,522 square miles and is located in the southwestern corner of Arizona in the Southwestern Deserts physiographic region (see Figure 1). The population of Yuma is about 78,000. During the 1990s, the population grew by 41%, and the growth rate in recent years has been about 1.6%/year.
Yuma County is bordered by Maricopa and Pima Counties on the east, La Paz County on the north, California and Mexico on the west, and Mexico on the south. Much of Yuma County is located in the Sonoran Desert with the landscape dominated by desert lowlands and dispersed rugged mountains peaking less than 4,000 feet in elevation. The valley regions, however, contain an abundance of arable land, which is primarily used as irrigated agricultural land. The
11 Technical Memorandum #2: PM10 Candidate Area Descriptions
11

PECHAN April 30, 2005
valleys are irrigated primarily with Colorado River water and some groundwater. The Colorado River Valley, the County’s most productive area, is found in the western edge of the County.
Agriculture, tourism, military installations, and government are the County’s principal economic activities. During the winter months, the population grows considerably with seasonal visitors (ADEQ, 2004b).
Wind-blown dust from disturbed areas is the most important source of PM10 in Yuma. In the Natural Events Action Plan (NEAP), ADEQ showed via a modeling analysis that wind-blown dust on a high wind day contributed 60% of the PM10 measured at the monitoring site. Anthropogenic sources contributed the other 40%. Important anthropogenic sources in Yuma contributing to the modeled PM10 include construction activity, paved and unpaved road dust, and onroad sources. The NEAP addresses the need to flag an exceedance that occurred in August of 2002 as a natural event, thus keeping Yuma from being redesignated to serious for PM10 nonattainment. BACM for significant anthropogenic sources from the Salt River (Phoenix) assessment (see above) are currently being evaluated with Yuma area stakeholders.
Annual PM10 concentrations have been tracking upward in recent years and are near the 50 μg/m3
standard (ADEQ, 2004c). A similar trend was also shown for the highest 24-hr average. This lack of a downward PM10 trend and the still-emerging control program limit the applicability of this area to the needs of this project.
3. California
South Coast Air Basin NAA
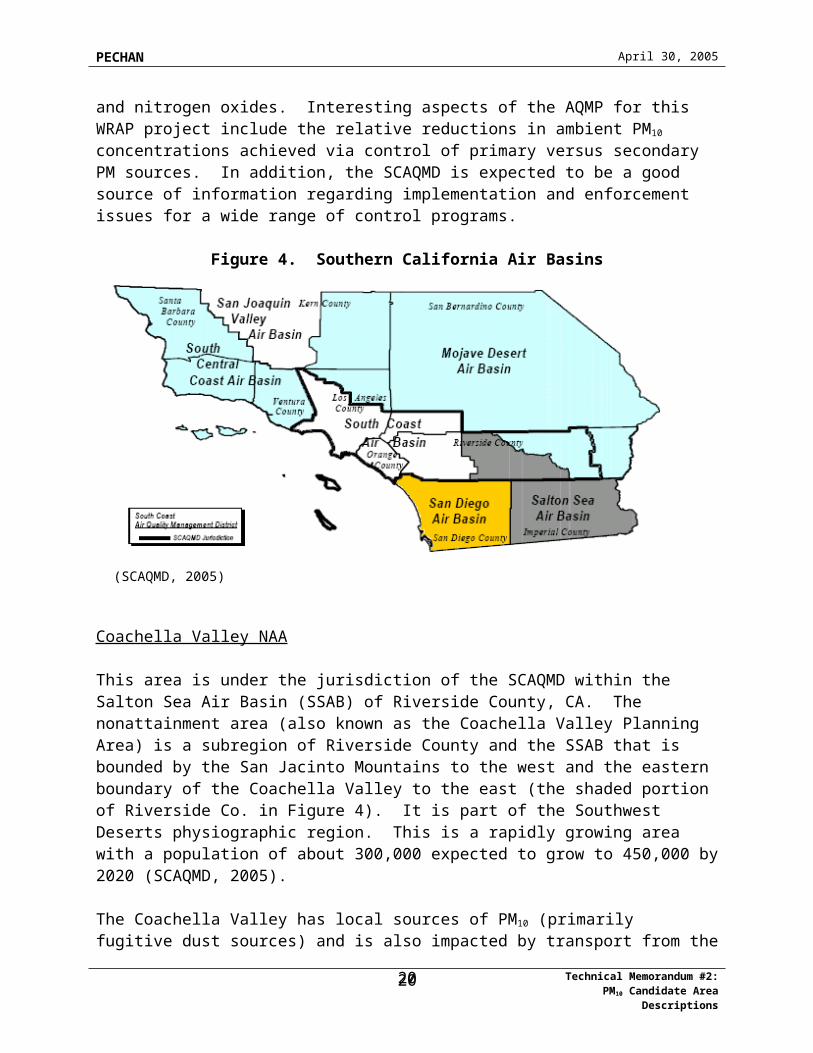
The South Coast Air Basin (the Basin) consists of Orange County and the non-desert portions of Los Angeles, San Bernardino and Riverside Counties in southern California (see Figure 4). This is part of the Southern California Ranges physiographic region. The Basin, which is a subregion of the SCAQMD’s jurisdiction, is bounded by the Pacific Ocean to the west and the San Gabriel, San Bernardino, and San Jacinto mountains to the north and east. For the purposes of this project, it is classified as an urbanized NAA. The population is approximately 13,000,000. Due to its geography, climate, population and industry, the Basin experiences poor air quality. During the summer months, temperature inversions are common, which reduce ventilation and increase air pollutant concentrations.
The South Coast Air Quality Management District (SCAQMD) has made progress toward meeting the annual and 24-hour standards and plans to reach attainment in the Basin by 2006. SCAQMD monitored PM10 concentrations at 18 locations in 2001. This includes the Coachella Valley NAA described below, which is actually part of the Salton Sea Air Basin. In the South Coast Air Basin, exceedances of the annual and 24-hour PM10 standards occurred in monitors located in the eastern portion of the basin in Riverside and San Bernardino Counties (SCAQMD, 2005). Detailed analyses of PM10 chemical composition have been performed for several sites.
12 Technical Memorandum #2: PM10 Candidate Area Descriptions
12

PECHAN April 30, 2005
Control measures have targeted both primary and secondary PM sources. The 2003 Air Quality Management Plan (AQMP) committed to a BACM review of adopted control measures for fugitive dust sources, including paved and unpaved roads, storage piles, disturbed vacant land, and other sources. Secondary PM sources covered by the AQMP include sources of ammonia, sulfur dioxide, and nitrogen oxides. Interesting aspects of the AQMP for this WRAP project include the relative reductions in ambient PM10 concentrations achieved via control of primary versus secondary PM sources. In addition, the SCAQMD is expected to be a good source of information regarding implementation and enforcement issues for a wide range of control programs.
Figure 4. Southern California Air Basins
(SCAQMD, 2005)
Coachella Valley NAA
This area is under the jurisdiction of the SCAQMD within the Salton Sea Air Basin (SSAB) of Riverside County, CA. The nonattainment area (also known as the Coachella Valley Planning Area) is a subregion of Riverside County and the SSAB that is bounded by the San Jacinto Mountains to the west and the eastern boundary of the Coachella Valley to the east (the shaded portion of Riverside Co. in Figure 4). It is part of the Southwest Deserts physiographic region. This is a rapidly growing area with a population of about 300,000 expected to grow to 450,000 by 2020 (SCAQMD, 2005).
The Coachella Valley has local sources of PM10 (primarily fugitive dust sources) and is also impacted by transport from the South Coast Air Basin. The transported pollution is primarily responsible for ozone exceedances, while the local sources are the primary contributors to PM10 nonattainment. Since it is under the jurisdiction of the SCAQMD, the control measures were incorporated as part of the SCAQMD’s Air Quality Plan (SCAQMD, 2005). As mentioned above for the South Coast Air Basin, this plan has covered a wide range of both primary and
13 Technical Memorandum #2: PM10 Candidate Area Descriptions
13

PECHAN April 30, 2005
secondary PM sources. For this area, all of the common fugitive dust sources are covered (paved/unpaved roads, storage piles, construction activities, etc.).
This NAA was originally designated a moderate PM10 NAA and later redesignated as a serious NAA (by not achieving the standard by 1994). The area met the standards during the mid-1990’s, but during the 1999-2001 time-frame, the annual standard was exceeded. In 2001, the 24-hr standard was exceeded, however these samples were all collected on high wind days. Therefore, a 2002 SIP was prepared, which included PM10 control measure enhancements to meet Most Stringent Measure requirements. For the 2003 SIP, the control measures remain the same.
Mammoth Lakes NAA
This NAA is a resort area located at the eastern edge of the Sierra Nevada Range in Mono County, CA at an altitude of 7,800 feet. There are approximately 7,000 year-round residents in Mammoth Lakes. During the 1990s, the population grew by 48%, however, in recent years, the population has been growing at less than 1%/year.
Exceedances of the 24-hr standard have occurred in the winter season. Prior to adoption of the SIP in November of 1990, an average year produced 11 exceedances of the 150 μg/m3 standard. In the five years following adoption of the SIP, there were less than six exceedance days on average. If this area is selected for further study, we will get in touch with the appropriate Great Basin Unified Air Pollution Control District (GBUAPCD) contact to discuss progress made in recent years to attain the standard. The area has been redesignated as a maintenance area for PM10 (the date of redesignation has not been identified).
As with similar resort areas in the west, primary sources of PM10 have been RWC and paved road dust (from material applied for traction control). The GBUAPCD developed rules covering these sources. For RWC, the SIP included measure limited the number of wood-burning appliances to one EPA-certified appliance per dwelling, required change-outs of non-certified equipment upon resale of a dwelling, and instituted no burn days on days that could violate the standard. A public awareness program to encourage compliance with no burn days was also included (GBUAPCD, 1995).
Mammoth Lakes used volcanic cinders on roadways for traction controls. GBUAPCD (1995) reported that re-entrainment of these materials contributed 44% to ambient PM10 on days that violated the standard. Vacuum street sweeping and vehicle-miles traveled (VMT) volume controls were put in place. Street sweeping was estimated to reduce emissions by 68%. GBUAPCD also included a traffic volume limit to keep the emissions from growing with population.
4. Colorado
Aspen NAA
14 Technical Memorandum #2: PM10 Candidate Area Descriptions
14

PECHAN April 30, 2005
Aspen is a mountain resort (ski) community in west central Colorado (Colorado Plateau physiographic region). The elevation of the area is about 7,900 feet, and the population is about 5,900. During the 1990s, the population grew by about 17%, but it has been slightly declining in recent years. In 1987, based on relatively high TSP levels, the Aspen area was designated as a “Group I” area for PM10. The Aspen area was then designated as a “moderate” nonattainment area in 1990 pursuant to section 107(d)(4)(B) of the CAA.
From 1990 to 2000, 1991 was the only year that either the 24-hour or annual NAAQS for PM10 was exceeded. However, the 1991 data are outside of the three-year period used to support the redesignation request. The highest levels of PM10 emissions occur in central Aspen. This is where the majority of residential, commercial, and pedestrian activities occur, and it is the area where the dispersion of pollutants is likely to be the most problematic due to temperature inversions and valley-bottom topography.
The primary contributor to PM10 emissions was fugitive dust from roadways. The improvement in air quality in the Aspen area is due to enforceable control measures adopted as part of the federal SIP. The following are the controls that brought the Aspen area into attainment of the PM10 NAAQS: wood burning and restaurant emission controls, street sanding controls, street sweeping requirements, paid parking requirements, transit and other measures, control of emissions from stationary sources, and federal motor vehicle emission control program.
Denver Metropolitan NAA
Denver is located in north central Colorado (Colorado Plateau physiographic region). It has a population of about 550,000 and lies at an elevation of about 5,300 feet. In 1987, based on relatively high TSP levels, the Denver area was designated as a “Group I” nonattainment area for PM10. The Denver area was then designated a “moderate” nonattainment area in 1990 pursuant to section 107(d)(4)(B) of the CAA. This designation was for the 24-hour PM10 NAAQS; the area has not violated the 24-hour PM10 standard since 1993 and never violated the annual PM10 NAAQS.
The primary contributor to PM10 emissions was fugitive dust from roadways. The Regional Air Quality Council Emission Benefit Analysis and Emission Benefit Study established improved emission reduction credits for various sweeping equipment applied to the sand and dust fractions, when roadways are swept within four days of a sanding event.
With the implementation of emission control programs aimed at reducing re-entrained fugitive dust, automobile and industrial emissions, PM10 concentrations have stabilized at levels well below the NAAQS. The existing control measures that have brought the Denver Metro area into attainment of the 24-hour PM10 standard include a mix of re-entrained fugitive dust controls (restrictions on street sanding and required street sweeping), wood burning restrictions, the state’s vehicle inspection/maintenance program and industrial source control regulations.
15 Technical Memorandum #2: PM10 Candidate Area Descriptions
15

PECHAN April 30, 2005
Telluride NAA
The Town of Telluride is another mountain resort (ski) community in the Colorado Plateau physiographic region. Telluride is located in southwestern Colorado and has a population of about 2,200 (elevation 8,800 ft.). Population grew at about 70% during the 1990’s, and is currently growing at a rate of about 1.4%/year. As with other mountain resort areas, the dispersion of pollutants is likely to be the most problematic due to temperature inversions and pollutant-trapping topography.
The following control measures resulted in the area’s attainment of the PM10 NAAQS, and these measures should ensure continued maintenance of the PM10 NAAQS through the year 2012, which is the duration of the maintenance period.
Woodburning Emission Controls; Street Sanding Controls; Control of Emissions from Stationary Sources; Federal Motor Vehicle Emission Control Program; and Voluntary and State-Only Measures (Street Sweeping, Use of Chemical Deicers,
Paving, Transit, Storm Run Off, Control of Emissions from Unpaved Roads through Paving and Stabilization.
The primary contributor to PM10 emissions was fugitive dust from roadways followed by unpaved roads, and RWC. Chemical mass balance (CMB) analysis shows 80% of contribution was from geological material and 16% from vegetative burning.
Crested Butte
This area is not a PM10 NAA. Crested Butte is a mountain resort (ski) town located in west central Colorado at an elevation of about 8,900 feet (Colorado Plateau physiographic region). The population of Crested Butte is about 1,500. Population grew by about 74% during the 1990’s, but has been on a slight declining trend during recent years.
Ambient PM10 sampling has been conducted in the area since 1985. A special study on the success of a woodstove change-out program was conducted from 1988-1990 (CDPHE, 1990). Chemical mass balance modeling was performed to determine the source contributions as part of this study. The study concluded that reductions had occurred in both ambient PM10 (40%) and light scattering (nearly 60%) concurrently with the woodstove change-out program. Several complicating factors (e.g. differences in meteorology between the two years) made it difficult to fully attribute the reductions to the change-out program.
Other contributing sources in Crested Butte are paved road dust and vehicle exhaust. Paved road dust is believed to be the most important contributor to geologic sources, which contributed an average of 22% of PM10. Motor vehicle exhaust contributed 3%, and nitrate and sulfate particles always contributed less than 6% of PM10 (CDPHE, 1990).
16 Technical Memorandum #2: PM10 Candidate Area Descriptions
16

PECHAN April 30, 2005
5. Idaho
Sandpoint NAA
The Sandpoint NAA is in Bonner County, in northern Idaho, which is in the Columbia Plateau physiographic region (elevation – 2,100). The population of Sandpoint is about 6,800. Through the 1990s, the population grew by 31%, and the growth rate in recent years has been 2.4%/yr. It was designated as an NAA for PM10 and classified as moderate upon enactment of the Clean Air Act Amendments in 1990. Idaho submitted a PM10 attainment plan in May of 1993. On August 16, 1996, Idaho submitted a revised plan, and EPA approved the plan on June 26, 2002 (67 FR 43006).
The control strategies focus on control of residential wood combustion, paved road dust, and a small number of industrial processes.
Boise NAA
The Boise NAA is located in northern Ada County in southwestern Idaho. This area is located in the Columbia Plateau physiographic region (elevation – 2,700 feet). The population of Boise is about 186,000. During the 1990s, the population grew by 48%, however in recent years the growth rate has been less than 1%/year. EPA proposed to approve the Ada County/Boise, Idaho maintenance plan and redesignation request published in a proposed rulemaking in the Federal Register on July 30, 2003 (68 FR 44715). Final action was made by EPA in October of 2003.
Monitoring data have been acquired at four sites in the NAA. Most of the exceedances of the 24-hr standard occurred prior to 1991 during the winter months (Environ, 2002). Despite rapid growth in Ada County, since 1991, there has been only one exceedance (1997), which was influenced by agricultural activity. There has been only one exceedance of the annual standard (1986).
Control measures have targeted RWC and open burning, as well as selected industrial sources.
6. Montana
Missoula NAA
The Missoula urban area, with a population of about 73,000, according to the 1990 census, is the largest urban population (about 57,000) located in and surrounded by the Rocky Mountains. During e 1990s, the population grew by 33%, and the growth rate in recent years has been about 2%/year. Missoula is located in western Montana at the east end of the Missoula valley at the confluence of the Bitterroot and Clark Fork Rivers (elevation 3150 feet). The area is in the Columbia Plateau physiographic region. Missoula is surrounded by mountains on three sides. The mountains rise steeply right outside of town to 5200 feet to the southeast and 4500 feet to the northeast (MDEQ, 1992).
17 Technical Memorandum #2: PM10 Candidate Area Descriptions
17
PECHAN April 30, 2005
Because of Missoula’s location in a mountain valley, frequent temperature inversions occur during the fall and winter months. The mountains also tend to block the prevailing west winds. The resulting light surface winds, when coupled with the fall and winter temperature inversions, lead to air pollution accumulation in the Missoula valley. Late fall, winter and early spring are generally associated with the highest PM10 levels.
Major employers in the area include the wood products industry, light manufacturing, and state, local and federal government agencies. The area is a regional headquarters for the U.S. Forest Service and Missoula is a major regional medical center.
The most important emissions sources (based on the CMB report) were re-entrained road dust and residential wood combustion. Less important sources include automobile exhaust and industrial sources. The control program was designed to control emissions from re-entrained road dust, open burning, residential wood burning, motor vehicle exhaust, incinerators, petroleum storage and other industrial sources (MDEQ, 1992).
7. Nevada
Clark County NAA
The Clark County NAA covers metropolitan Las Vegas, NV. It is also referred to as the Las Vegas Valley Planning Area and is a serious PM10 NAA. It is located in the Southwest Deserts physiographic region (elevation – 2,000 feet). As with some other areas of the southwest, Clark County has experienced rapid growth during the last 15 years. The current population of Las Vegas is around 480,000. During the 1990s, the population grew by 85%, and in recent years the growth rate has been around 2.5%/year. Most of the significant PM10 emission sources (described below) can be attributed to the construction activities associated with this growth.
During the 1997 to 1999 period, five monitors recorded exceedances of the 24-hour standard, while one of these recorded an exceedance of the annual standard (a total of 17 PM10 monitors are operated both within and outside of the NAA). During this three-year period, there were a total of 43 exceedances measured at all five stations. On March 31, 1999, the highest 24-hr average was recorded: 442 ug/m3. The SIP demonstrated that most of the highest concentrations corresponded to periods with high winds (Clark County, 2001). However, during stagnant conditions, some exceedances also occurred.
Inventory work and control strategy analysis focused on primary PM10 sources, since Clark County had determined through receptor modeling that secondary PM made up an insignificant portion of the PM10. In the PM10 SIP, the Clark County Department of Air Quality Management identified fugitive sources as the dominant contributors to emissions (Clark County, 2001). Sources included construction activities, paved and unpaved roads, and vacant areas. The SIP included a Most Stringent Measures (MSM) analysis to show that there were no more stringent methods applicable to the area that were not incorporated into the SIP. The SIP notes that control measures were implemented in 1995-1996, but improved enforcement of these measures
18 Technical Memorandum #2: PM10 Candidate Area Descriptions
18

PECHAN April 30, 2005
began in 1997. EPA Region 9 prepared a Technical Support Document supporting their proposed approval of the PM10 SIP for Clark County, submitted July 25, 2001.
8. Oregon
Klamath Falls NAA
Klamath Falls is located in south central Oregon at an elevation of 4,105 feet. Klamath Falls is located in the Klamath Mountains physiographic region. The city of Klamath Falls is estimated to have a population of about 19,500. During the 1990s, the population grew by 10%, but in recent years, the population has been declining at a rate of less than 1%/year. The city of Klamath Falls serves as an important commercial center for south central Oregon.
The Klamath Basin is a relatively flat area of old lakebed that is drained by the Klamath River. Occasional hills and a system of elongated ridges confine the basin and the greater Klamath Falls area to the east and west. In the wintertime, frigid arctic air masses frequently move down Upper Klamath Lake and invade the Klamath Basin. Temperatures can remain well below freezing for several weeks at a time. Under these conditions, these strong inversions occur over the south suburban area of Klamath Falls.
Primary sources of PM10 include RWC, open burning, paved road dust, and industrial sources. Emission reduction strategies primarily responsible for the area achieving compliance include:
A statewide Woodstove Certification Program; A Woodstove Removal and Heating source replacement program for low income
households; A Klamath County mandatory woodstove and open burning curtailment ordinance; Winter road sanding controls; Public education programs; Industrial - Significant Emission Rate requirement; and Forestry slash burning emission reduction and restriction.
Lakeview NAA
Lakeview is located in southern Oregon about 96 miles east of Klamath Falls at an elevation of about 4,800 feet. This area is at the edge of the Cascade Range and Great Basin physiographic regions. The area is typified by semi-arid climate where annual rainfall is 13 inches. The Lakeview population is estimated at 2,500. During the 1990s, the population declined by 2%, and in recent years the population has continued to decline at a rate of less than 1%/year. The town of Lakeview serves as an important commercial center for Lake County. The Lakeview PM10 NAA is defined by the urban growth boundary, which is approximately five square miles and includes the city limits.
PM10 exceedances occur in the winter due to strong nighttime inversions. According to the emissions inventory, important PM10 contributors have included industrial sources (e.g., a
19 Technical Memorandum #2: PM10 Candidate Area Descriptions
19
PECHAN April 30, 2005
sawmill), RWC and fugitive dust. Other area sources include fuel oil use, paved road dust, forest and agricultural burning, other open burning and other fuel combustion sources. Nonroad sources include sources such as construction equipment and lawnmowers. Onroad sources include motor vehicle emissions, from tailpipe exhaust and road dust. Natural sources include dust from the nearby Goose Lake bed.
PM10 control strategies have been successful in bringing Lakeview into attainment with the 24-hour standard and further decreasing the annual average. Emission reduction strategies primarily responsible for compliance include:
A statewide woodstove certification program; A woodstove removal and heating source replacement program, called “Clearing
Lakeview’s Environment, Air Resources” program, for low income people; A town of Lakeview woodstove and open burning curtailment ordinance that reduced
burning on poor air quality days; Winter road sanding controls; Public education programs; Industrial restrictions - Significant Emission Rate requirement and wood products
requirements to manage future growth; and Forestry slash burning emission reduction and restrictions.
La Grande NAA
La Grande is located in northeast Oregon at an elevation of 2,800 feet (in the Grande Ronde Valley). The area is typified by semi-arid climate where mean annual rainfall is 17.2 inches (43.7 cm). The city of La Grande is estimated to have a population of about 12,300. During the 1990s, the population increased by about 5%. In recent years, the population has declined at a rate of less than 1%/year. The city of La Grande serves as an important commercial center for northeast Oregon. The area is located in the Columbia Plateau physiographic region.
The Grande Ronde Valley is a relatively flat area nestled in a mountainous area drained by the Grande Ronde River. Because of these features, La Grande can experience strong nighttime inversions that break with daytime solar heating. In the wintertime, arctic air masses frequently move into the Grande Ronde Valley. Temperatures can remain well below freezing for several weeks at a time. Winter nights are commonly clear and cool in the valley. Under these conditions, inversion can occur in La Grande.
According to the emissions inventory, major industrial sources include sources like Boise Building Solutions’ sawmill. Area sources include wood stoves/fireplace emissions and fugitive dust, which are the dominant sources of PM10. Other area sources include fuel oil use, road sanding, forest and agricultural burning, open burning and other fuel combustion sources. Nonroad sources include sources such as construction equipment or lawnmowers. Onroad sources include motor vehicle emissions from tailpipe exhaust and road dust.
20 Technical Memorandum #2: PM10 Candidate Area Descriptions
20
PECHAN April 30, 2005
PM10 control strategies have been successful in bringing La Grande into attainment with the 24-hour PM10 standard and further decreasing the annual mean. Emission reduction strategies primarily responsible for compliance include:
A statewide Woodstove Certification Program; A Woodstove Removal and Heating source replacement program for low income
people; A City of La Grande woodstove program and open burning ordinance that reduced
burning on poor air quality days; Winter Road Sanding Controls; Public Education Programs; Industrial restrictions – Offsets and Emission Control Equipment requirements to
manage future growth; and Forestry and agricultural burning growth management strategies.
9. Utah
Salt Lake County NAA
Salt Lake County is in the Great Basin physiographic region (elevation – 4,300 feet). The population of Salt Lake City is about 182,000. During the 1990s, the population grew by 14%, however in recent years the population has been declining at a rate of less than 1%/year. PM10 nonattainment is a winter season problem in this area. No information was readily-available on the NAA history for this area. According to Utah DEQ, the primary man-made sources of PM10 include fugitive dust from motor vehicles, combustion of solid fuels, agricultural activities, and construction activities. Over 80% of PM10 emissions are attributed to motor vehicles in Salt Lake and Weber Counties and 76% in Utah County (UDEQ, 2005). Weber County is north of Salt Lake County, while Utah County is to the south.
Control strategies include the wood burning restrictions program, combustion of natural gas rather than coal in the winter at major industrial sources and the enhanced vehicle inspection and maintenance program. PM controls have focused on industrial sources and residential solid fuel burning devices (both coal and wood). The ash and sulfur content of coal sold for residential heating is limited. For solid fuel burning equipment, including fireplaces, opacity limits are in place. Mandatory no burn periods during high PM episodes and inversions are also in effect for all equipment that is not registered as the sole source of heating equipment. PM emission limits were also set for seven existing stationary sources in Weber County. Emission limits and operating parameters were also set for all existing sources emitting 25 ton/year or more of a combination of (nitrogen oxides, sulfur oxides, and particulate matter) in Salt Lake and Utah Counties.
21 Technical Memorandum #2: PM10 Candidate Area Descriptions
21

PECHAN April 30, 2005
10. Washington
Thurston (Olympia, Tumwater, Lacey) NAA
The Thurston County PM10 area consists of the adjoining cities of Olympia, Lacey, and Tumwater, Washington (elevation – 150 feet). The population is approximately 86,000. During the 1990s, the population grew by over 26%. The annual growth rate has been over 1.0%/year. Geographically, the area is characterized by low rolling terrain with hills rising higher toward its southern and western boundaries. It is located in the Southern Pacific Rainforest physiographic region. Land use is primarily residential and commercial with several office parks and very little industry. The surrounding hills trap pollutants during stable meteorological conditions that occur frequently in the late fall and winter. Residential wood combustion is the largest source of PM10 in the nonattainment area. Resuspended road dust is also a significant, but smaller, source. All other sources are considered insignificant.
The attainment plan and the maintenance plan identify residential wood combustion as the primary source of PM10 emissions in the area, citing a 1986 aerosol characterization study. Chemical mass balance analysis of the filters collected at the Mt. View Elementary School shows that woodsmoke contributes 80–95% of ambient PM10 concentrations on the high pollution days analyzed. The State of Washington concluded that the most important control measures for achieving attainment are those that reduce emissions from residential wood combustion. In response, Thurston County has implemented a residential wood burning curtailment program, a public education program, emission standards for new woodstoves, and restrictions on certain fuels since the submittal of the 1989 SIP. The attainment demonstration (discussed in further detail below) clearly shows that these controls are responsible for the attainment of the NAAQS.
King County (Seattle/Duwamish Valley) NAA
King County is located in the Southern Pacific Rainforests physiographic region (elevation – 350 feet). The Seattle Duwamish Valley PM10 NAA is a well-established industrialized section of Seattle extending north from South Park for approximately seven miles along the Duwamish River Basin to Harbor Island. The width of the area varies from one to two miles across and terminates at the 100-foot level on the hills on the eastern and western boundaries.
Based on past violations of the 24-hr PM10 standard, industrial areas in Seattle, King County, were classified as moderate nonattainment. No exceedances of the annual standard have been recorded in all of the Puget Sound region since the NAAQS was adopted in 1987.
PM10 control measures have targeted residential wood combustion, road dust and industrial sources of PM10:
Wood Smoke Program: the Puget Sound Clean Air Agency and the State of Washington initiated a wood smoke program in 1987 banning the sale uncertified wood stoves, establishing opacity limitations, prohibiting the burning of certain fuels, and establishing a curtailment program;
22 Technical Memorandum #2: PM10 Candidate Area Descriptions
22

PECHAN April 30, 2005
Industrial Source Controls: Industrial sources contribute significantly to emissions in both the Seattle and Tacoma NAAs. Significant reductions in emissions have been achieved through the retirement and shutdown of processes and sources in these two areas. Emission credits have been confiscated from trading banks. Emission limitations have been established for all permitted sources the Seattle and Tacoma areas. The State of Washington has issued regulatory orders, which contain enforceable emission limitations, to the sources in the Seattle and Tacoma area that remain under their regulatory jurisdiction; and
Diesel Programs: Emission reductions have occurred as a result of Federal motor vehicle emission control programs. These reductions are the result of reduction in the sulfur content of diesel fuel from 0.5 percent to 0.05 percent by weight as of October 1, 1993. In addition, EPA recently promulgated rules limiting the amount of sulfur in gasoline. The State of Washington also requires that heavy-duty vehicles registered in the Puget Sound region pass a ‘‘snap idle’’ test in which exhaust opacity is measured while the vehicle is subjected to heavy acceleration. Vehicles which fail the test must be repaired and pass the test before they can be registered for operation.
Spokane NAA
Spokane, Washington, was designated PM10 NAA on November 15, 1990 (elevation – 2,000 feet). Spokane is located in eastern Washington in the Columbia Plateau physiographic region. The population of Spokane is about 196,000. During the 1990s, the population grew by about 10%, and the growth rate in recent years has been less than 1%/year.
The major sources of particulate air pollution are fugitive dust and residential wood combustion. Industrial emissions are a minor source PM10 within the nonattainment area. The approved attainment plan contains specific regulations, which implement control measures for residential wood combustion, paved surfaces, unpaved roads, and other measures. These measures are being fully implemented and the area has not monitored violations of the 24-hour or annual standards since 1994. Some of the control measures the approved SIP are contained in the Spokane County Air Pollution Control Authority (SCAPCA) regulations.
EPA has concluded that agricultural windblown dust, residential wood combustion, and paved and unpaved roads have been reasonably controlled.
Wallula (Walla Walla Co) NAA
This is mainly a rural area located in the Columbia Plateau physiographic region (elevation – 400 feet). The population of Wallula is 200. Air quality data shows that more than half of the PM10 emissions in the Wallula area come from agricultural tilling, when soil is disturbed during plowing, weeding, seeding, and other operations. About 30 percent of emissions come from pulp and paper mill operations. All other sources of emissions are much smaller. An analysis of PM10
filters shows that the material on the filters is mainly geogenic dust.
23 Technical Memorandum #2: PM10 Candidate Area Descriptions
23
PECHAN April 30, 2005
All but one exceedance of the standard since 1997 have been determined to be natural events due to windblown dust caused by high winds. This is significant because, under EPA’s Natural Events Policy, natural events are not considered when determining the attainment status of an area. The one exceedance not due to a natural event was caused mainly by dust from transporting a large quantity of compost from the pulp and paper mill’s composting facility to a nearby fiber farm. However, this transport does not represent normal operation of the composting facility, and the only time it occurred was in July 1997.
In the Wallula NAA, EPA has concluded that the dominant significant source of PM10, agricultural windblown dust, as well as the two less significant sources, Boise Cascade papermill and Simplot Feeders Limited Partnership feedlot, in the nonattainment area have been reasonably controlled.
11. Wyoming
Sheridan
The City of Sheridan Air Quality Maintenance Plan was developed in 1989 (Sheridan, 1989). Sheridan, WY is located in north-central Wyoming in the Central Rocky Mountains physiographic region. The population is approximately 16,000. During the 1990s, population grew by about 14%. In recent years, population has grown at less than 1%/year. No readily-available information on the attainment history of Sheridan was identified.
The Air Quality Maintenance Plan focused on control of emissions from paved road dust. The plan included limits on the amount of road sanding material applied (1 ton/lane-mile), material size and durability, and a street sweeping program. A contingency plan involving the use of deicing chemicals on certain roadways was also developed. A voluntary RWC curtailment program was also included.
24 Technical Memorandum #2: PM10 Candidate Area Descriptions
24

PECHAN April 30, 2005
C. MONITORING DATA SUMMARY
Table 3 and Appendix A provide monitoring statistics for data exported from the EPA’s Air Quality System (AQS) database, which is EPA’s repository of ambient air quality data. The column “# PM10 monitors” indicates the number of PM10 samplers that operated in the respective NAAs between 1990 and 2004 (note that this does not mean that there are a full set of data for all years from each monitor). David Mintz of EPA provided the monitor association with each NAA, and information is current as of November 1, 2004. No monitor association was provided for Crested Butte or Albuquerque, because these areas were never classified as nonattainment. Monitor association for Albuquerque was determined using AQS residence codes that indicated the city of Albuquerque. No samplers were associated with the Crested Butte city code, so monitors residing in Gunnison County, CO were deemed representative of the Crested Butte area.
Table 3 provides a summary of the monitoring site data that are presented in more detail in Appendix A. The column “# PM10 monitors” indicates the total number of PM10 samplers that operated in the respective NAAs between 1990 and 2004, and the number of samplers with at least 5 years of data. The next 6 columns provide a summary of trend and significance information that is provided in the tables in Appendix A. The count indicates the number of monitors for each NAA that displayed decreasing trends at a 15% significance level (p-value<0.15) for the 99th percentile, annual average and quarterly average values. The final column in the table is a list of other parameters that are available from monitors located within each NAA.
Appendix A contains seven tables summarizing PM10 monitoring data for each site within each NAA. Table A-1 indicates the number of 24-hour average PM10 values exceeding the 150 μg/m3 standard per year. Table A-2 indicates the annual 99th percentile (μg/m3) of all values collected at a site. Table A-3 contains the annual average (μg/m3) for each site and for each year. Tables A-4 through A-7 contain the quarterly averages. Quarterly averages are only calculated if at least 75% of the data in a quarter are available, and annual averages are calculated as an average of the quarterly averages if all four quarterly averages for a year are available. Tables A-2 through A-7 contain the mean, Mann-Kendall slope (μg/m3/yr), and the p-value (significance level) for each respective table. A slope and p-value are only calculated for sites with at least five years of data.
All areas with significant trends, with the exception of Albuquerque, display decreasing trends. The LaGrande area only had complete data for the period of 1992-1995, so no trend was calculated. Eleven of the 25 areas have the highest season average in the July-September season, and 8 of the areas averaged highest in the October-December Season. This is an interesting observation, given that most of the PM10 planning period for most candidate areas is the winter season.
25 Technical Memorandum #2: PM10 Candidate Area Descriptions
25

PECHAN April 30, 2005
Table 3. PM10 Monitoring Summary
NAA State
# PM10
MonitorsNumber of Monitors With Decreasing PM10 Trends (15% Significance Level)
Other ParametersTotal > 5
years99th
%-ileAnn. Avg.
Quarterly Averages
Jan-Mar
Apr-Jun
Jul-Sep
Oct-
DecJuneau AK 2 2 2 1 2 1 2 1 Met., PM2.5Mohave Co. AZ 2 2 0 0 0 0 0 0 N/A
Phoenix AZ 23 18 1 5 3 2 1 12Met., Speciated PM2.5, Gaseous Parameters (O3, CO, SO2, NO, NO2, NOX), Various VOCs and Hydrocarbons
Yuma AZ 3 1 0 0 0 0 0 0 N/A
Coachella Valley CA 4 4 0 2 3 1 1 0 Met., Gaseous Parameters (O3, CO, SO2, NO, NO2, NOX), Various VOCs and Hydrocarbons
L.A. South Coast Air Basin CA 25 18 15 16 6 12 13 12 Met., Gaseous Parameters (O3, CO, CS2, SO2,
NO, NO2, NOX)Mammoth Lakes CA 1 1 1 1 1 1 1 1 Met., PM2.5
Aspen CO 3 1 1 0 1 0 0 0 N/ACrested Butte CO 3 3 1 2 2 1 2 2 Met., PM2.5
Denver Metro CO 18 17 6 1 7 3 2 5 Met., O3, Various VOCs and HydrocarbonsTelluride CO 1 1 1 1 1 1 1 1 Met., PM2.5
Boise ID 5 4 4 3 4 4 0 3 Met., PM2.5
Bonner (Sandpoint) ID 1 1 1 1 1 1 1 1 Met., PM10
Missoula MT 2 2 2 2 2 1 1 2 Met., Speciated PM2.5
Clark County NV 20 18 9 3 7 4 5 7 Met., Speciated PM2.5, Gaseous Parameters (O3, CO, SO2, NO, NO2, NOX)
Albuquerque NM 9 9 0 1 2 2 1 2Met., Speciated PM2.5, Gaseous Parameters (O3, CO, NO, NO2, NOX), Various VOCs and Hydrocarbons
Klamath Falls OR 1 1 1 1 1 1 0 1 Met., PM2.5, TspLaGrande OR 1 1 0 0 0 0 0 0 N/ALakeview OR 2 1 1 1 1 1 0 1 Met., PM2.5
Salt Lake County UT 7 7 2 3 4 0 1 4 Met., Speciated PM2.5, Gaseous Parameters (O3, CO, SO2, NO, NO2, NOX)
King County WA 6 5 4 5 5 5 5 3 Met., Speciated PM2.5
Olympia, Tumwater, Lacey WA 2 1 1 1 1 1 1 1 Met., PM2.5
Spokane WA 6 5 3 3 4 1 3 3 Met., PM2.5
Wallula WA 3 1 0 0 1 0 0 0 Met., PM10
26 Technical Memorandum #2: PM10 Candidate Area Descriptions

PECHAN April 30, 2005
Sheridan WY 2 2 2 2 2 2 1 2 Met., PM2.5
27 Technical Memorandum #2: PM10 Candidate Area Descriptions
PECHAN April 30, 2005
D. REFERENCES
ADEQ, 2002. Bullhead City Moderate Area PM10 Maintenance Plan and Request for Redesignation to Attainment, prepared by the Air Quality Division, Arizona Department of Environmental Quality, February 2002.
ADEQ, 2004a. FINAL, Revised PM10 State Implementation Plan for the Salt River Area, Air Quality Division, Arizona Department of Environmental Quality, August 2004.
ADEQ, 2004b. Natural Events Action Plan for the Yuma PM10 Nonattainment Area, Arizona Department of Environmental Quality, February 17, 2004.
ADEQ, 2004c. Technical Support Document Yuma, Arizona Natural Events Action Plan for a PM10 Exceedance on August 18, 2002, Air Assessment Section, Arizona Department of Environmental Quality, February 17, 2004.
AKDEQ, 1993. Control Plan for the Mendenhall Valley of Juneau, Alaska Department of Environmental Quality, 1993.
CDPHE, 1990. Crested Butte Woodstove Replacement Study Ambient Monitoring Report, Air Pollution Control Division, Colorado Department of Public Health and Environment, October 31, 1990.
Clark County, 2001. PM10 State Implementation Plan for Clark County, prepared by the Clark County Department of Air Quality Management, June 2001.
DRI, 2005. Causes of Haze Website, maintained by the Desert Research Institute, http://www.coha.dri.edu/web/general/analysisbyregion.html, accessed March 2005.
Environ, 2002. Northern Ada County PM10 SIP Maintenance Plan and Redesignation Request, Environ International Corporation, prepared for the Idaho Department of Environmental Quality, September 25, 2002.
GBUAPCD, 1995. Progress Report on the Implementation of the Mammoth Lakes Air Quality Management Plan, Great Basin Unified Air Pollution Control District, April 1995.
MAG, 2005. Revised MAG 1999 Serious Area Particulate Plan for PM10 for the Maricopa County Nonattainment Area, Executive Summary, Maricopa Association of Governments, downloaded from http://www.mag.maricopa.gov/resources.cms, January 2005.
MDEQ, 1992. State of Montana Air Quality Control Implementation Plan, Montana Department of Environmental Quality, January 24, 1992.
SCAQMD, 2005. Final 2003Air Quality Management Plan, prepared by the South Coast Air Quality Management District, accessed from http://www.aqmd.gov/aqmp/AQMD03AQMP.htm, February 2005.
28 Technical Memorandum #2: PM10 Candidate Area Descriptions
28
PECHAN April 30, 2005
Sheridan, 1989. City of Sheridan – Air Quality Maintenance Plan, City of Sheridan, WY, February 1, 1989.
UDEQ, 2005. Information obtained from the Utah Department of Environmental Quality website: http://www.airquality.utah.gov/PLANNING/Nonattpm.htm, accessed April 2005.
29 Technical Memorandum #2: PM10 Candidate Area Descriptions
29