Technical Memorandum No. 1.2.2 – RAINFALL - Pajaro River · The third objective is to establish a...
40
RAINFALL -1- November, 2001 Technical Memorandum No. 1.2.2 – RAINFALL Task: Collection and Analysis of Rainfall Data To: PRWFPA Staff Working Group Prepared by: J. Schaaf Reviewed by: R. Raines Date: November 13, 2001 Introduction This Technical Memorandum (TM) deals with the rainfall aspects of the proposed hydrologic model. Rainfall is a necessary input into any hydrologic model. This TM will describe the rainfall data collected in and near the Pajaro River watershed, present precipitation totals and temporal distributions for specific storms from 1994 to 1999, establish statistical relationships for rainfall in the watershed, and show the development of the elements for the design storm to be used as part of the hydrologic model. Project Scope and Background The Pajaro River Watershed Flood Prevention Authority was formed to develop flood protection strategies in the Pajaro River Watershed. The first phase in developing the strategies is to construct a stream flow model. The model shall address a number of key issues, including the following: • What are the causes of flooding on the Pajaro River? • Has rainfall runoff increased downstream with increasing development upstream? • Has the improvement and/or maintenance of streams affected flooding? • Has erosion or sedimentation in the streams affected flooding? • Have upstream retention basins reduced or mitigated the degree of flooding? • How will future conditions change the degree of flooding? Answering these and other related questions regarding Pajaro River flooding requires the development of hydrologic and sediment models for the Pajaro River and its tributaries. in association with Pajaro River Watershed Study
-
Upload
nguyenhanh -
Category
Documents
-
view
213 -
download
0
Transcript of Technical Memorandum No. 1.2.2 – RAINFALL - Pajaro River · The third objective is to establish a...

RAINFALL -1- November, 2001
Technical Memorandum No. 1.2.2 – RAINFALL Task: Collection and Analysis of Rainfall Data To: PRWFPA Staff Working Group Prepared by: J. Schaaf Reviewed by: R. Raines Date: November 13, 2001 Introduction This Technical Memorandum (TM) deals with the rainfall aspects of the proposed hydrologic model. Rainfall is a necessary input into any hydrologic model. This TM will describe the rainfall data collected in and near the Pajaro River watershed, present precipitation totals and temporal distributions for specific storms from 1994 to 1999, establish statistical relationships for rainfall in the watershed, and show the development of the elements for the design storm to be used as part of the hydrologic model. Project Scope and Background The Pajaro River Watershed Flood Prevention Authority was formed to develop flood protection strategies in the Pajaro River Watershed. The first phase in developing the strategies is to construct a stream flow model. The model shall address a number of key issues, including the following: • What are the causes of flooding on the Pajaro River? • Has rainfall runoff increased downstream with increasing development upstream? • Has the improvement and/or maintenance of streams affected flooding? • Has erosion or sedimentation in the streams affected flooding? • Have upstream retention basins reduced or mitigated the degree of flooding? • How will future conditions change the degree of flooding? Answering these and other related questions regarding Pajaro River flooding requires the development of hydrologic and sediment models for the Pajaro River and its tributaries.
in association with
Pajaro River Watershed Study

RAINFALL -2- November, 2001
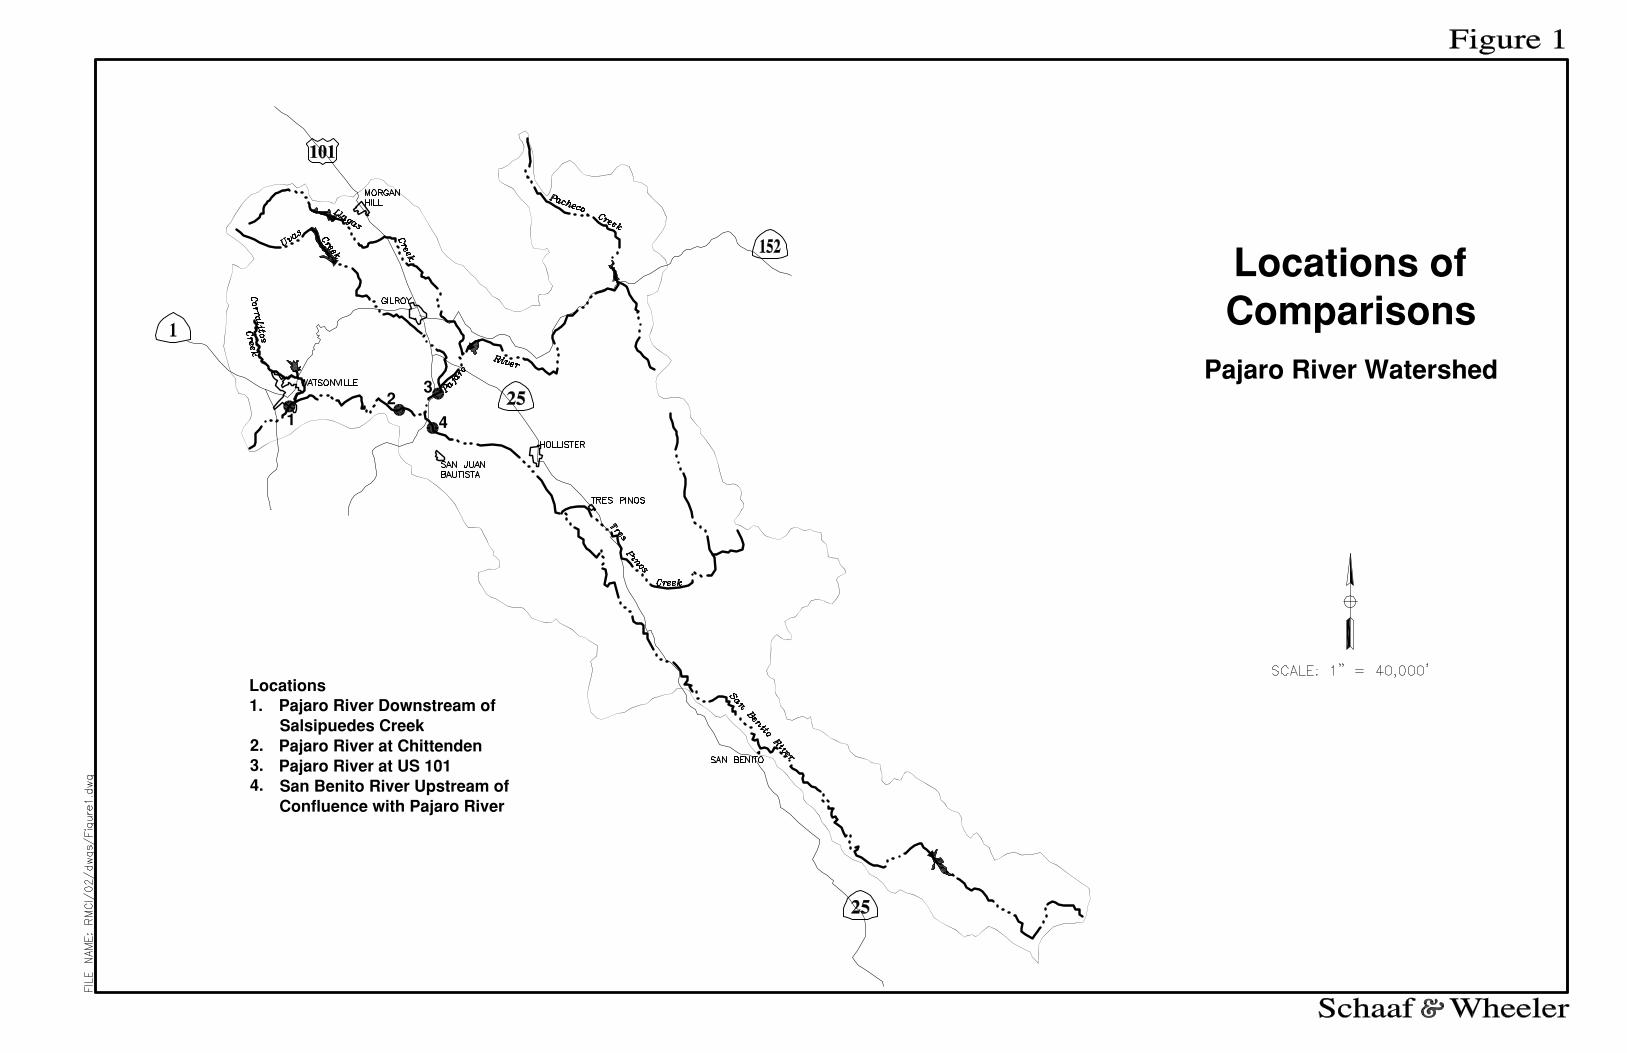
Setting The Pajaro River drains an area of approximately 1,300 square miles of the coastal plains and mountains of Central California. A tributary of Monterey Bay, the watershed drains portions of Santa Cruz, Monterey, Santa Clara and San Benito Counties. As shown in Figure 1 (previously submitted with TM1.2.1) the watershed is somewhat elongated toward the southeast. The lower portions of the Pajaro River from Murphy’s Crossing to the Pacific Ocean are protected by a Corps of Engineers levee project constructed between 1949 and 1952. Four miles above this federal project is the USGS stream gage – Pajaro River at Chittenden, CA. This gage has been in continuous operation since the 1939 water year. The drainage area at this gage is 1,186 square miles. Two miles above the Chittenden gage site, the San Benito River is confluent to the Pajaro. At this point the San Benito River drains 661 square miles - slightly more than half the drainage area at the Chittenden gage. The Pajaro River at the outlet to Soap Lake – a low-lying area of Santa Clara and San Benito Counties – has a drainage area of approximately 500 square miles. Objectives of this TM Rainfall data from twenty nine gages (twelve recording and seventeen non-recording) in or near the Pajaro River watershed are reported by the National Weather Service (NWS) and thus are included in the NWS publications and data sets. The Santa Clara Valley Water District (SCVWD) collects data from seven recording gages in and near the watershed. Of those gages six are in the watershed. The locations of all the gages are shown in Figure 2.1. Given the wealth and yet paucity of rainfall data, the first objective of this TM is to establish a Mean Annual Precipitation (MAP) relationship for the watershed. This relationship is usually in the form of a map showing the watershed area along with accompanying isohyets (in inches) of MAP. MAP will be used to transpose storm amounts from gaged locations to those locations in the watershed, which have no gages. The second objective is to establish rainfall patterns and depths in the watershed for use by the hydrologic model when calibrating to 1994 to 1999 high water events at the Chittenden stream gage. The third objective is to establish a design storm for the watershed. TM 1.2.1 (Establish a Basis of Comparison) recommends using frequency curves to form the basis upon which to compare watershed changes. Therefore, a design storm must be established as input to the hydrologic model. The model’s predicted runoff from the design storms of

RAINFALL -3- November, 2001
various frequencies will then be used to formulate the information needed to enable comparisons of the flood control consequences of selected watershed conditions. The development of a design storm involves defining five elements:
a transposition mechanism (like MAP), the duration of the design storm,
a depth versus duration versus frequency relationship, a drainage area versus rainfall reduction relationship, and
the temporal distribution of the design storm’s rainfall depth. Mean Annual Precipitation Three existing maps were considered for the MAP map. The first was a San Francisco District US Army Corps of Engineers Normal Annual Precipitation Map with rainfall from 1906 to 1956. The series of three maps which covered the entire San Francisco District’s jurisdiction was at an approximate scale of 1” = 8 miles. The second map was produced by the United States Geological Survey in 1969 and covered the State of California at an approximate scale of 1” = 16 miles. The final map was from the SCVWD. This map was produced in 1989 and covered much of the Counties of Santa Clara, San Benito, Monterey, Santa Cruz, Alameda, San Mateo, San Francisco, Contra Costa and Marin. The map was produced at an approximate scale of 1” = 4 miles. As outlined in the October 1989 Hydrology Open File Report, the SCVWD used data from 255 recording and non-recording stations to prepare the MAP map. A careful analysis of the data was performed. This included a double mass analysis to ensure consistency between stations. It is well known that annual rainfall totals in the region vary with elevation. Higher elevations exhibit higher MAP. According to the SCVWD report this orographic effect was considered when drawing the MAP isohyets. The report states that care was taken to conform to general topographic features particularly in areas of sparse recorded rainfall data. Because the SCVWD map was the most recent it was decided to use this MAP map for future rainfall transpositions needed for this hydrologic model. The MAP map is shown in Figure 2.2. Using Figure 2.2 it was determined that the overall, area-weighted MAP for the entire watershed is approximately 19 inches.

RAINFALL -4- November, 2001
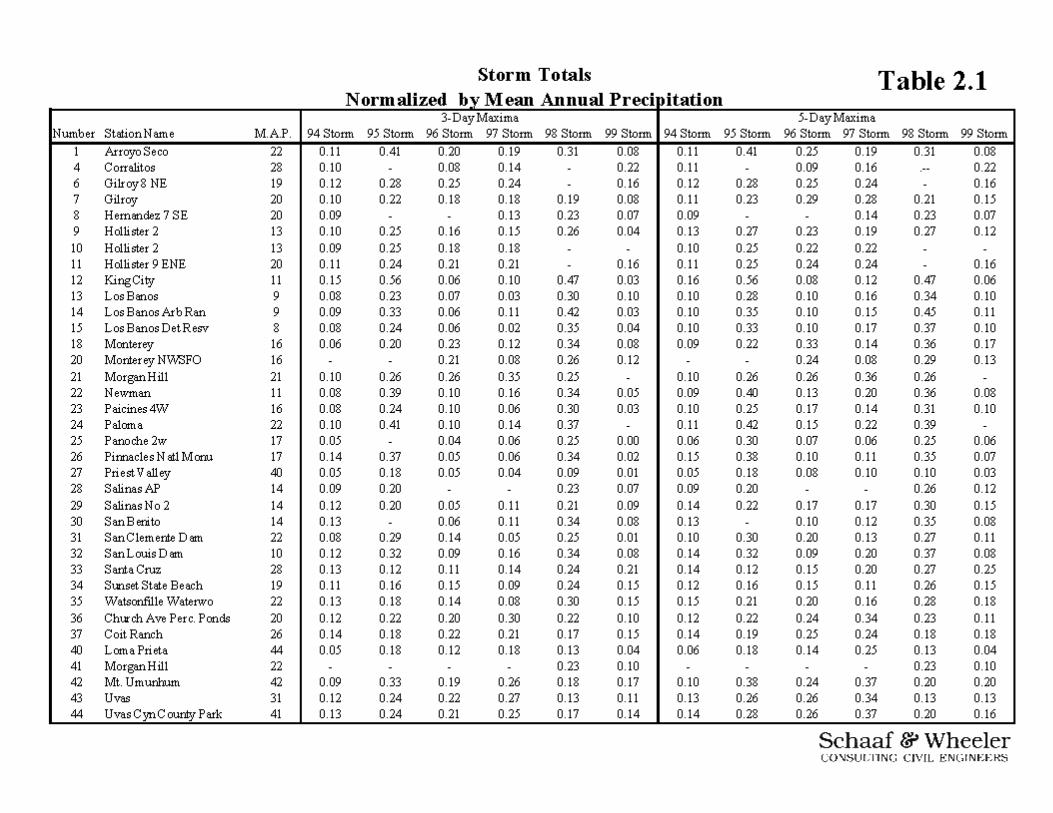
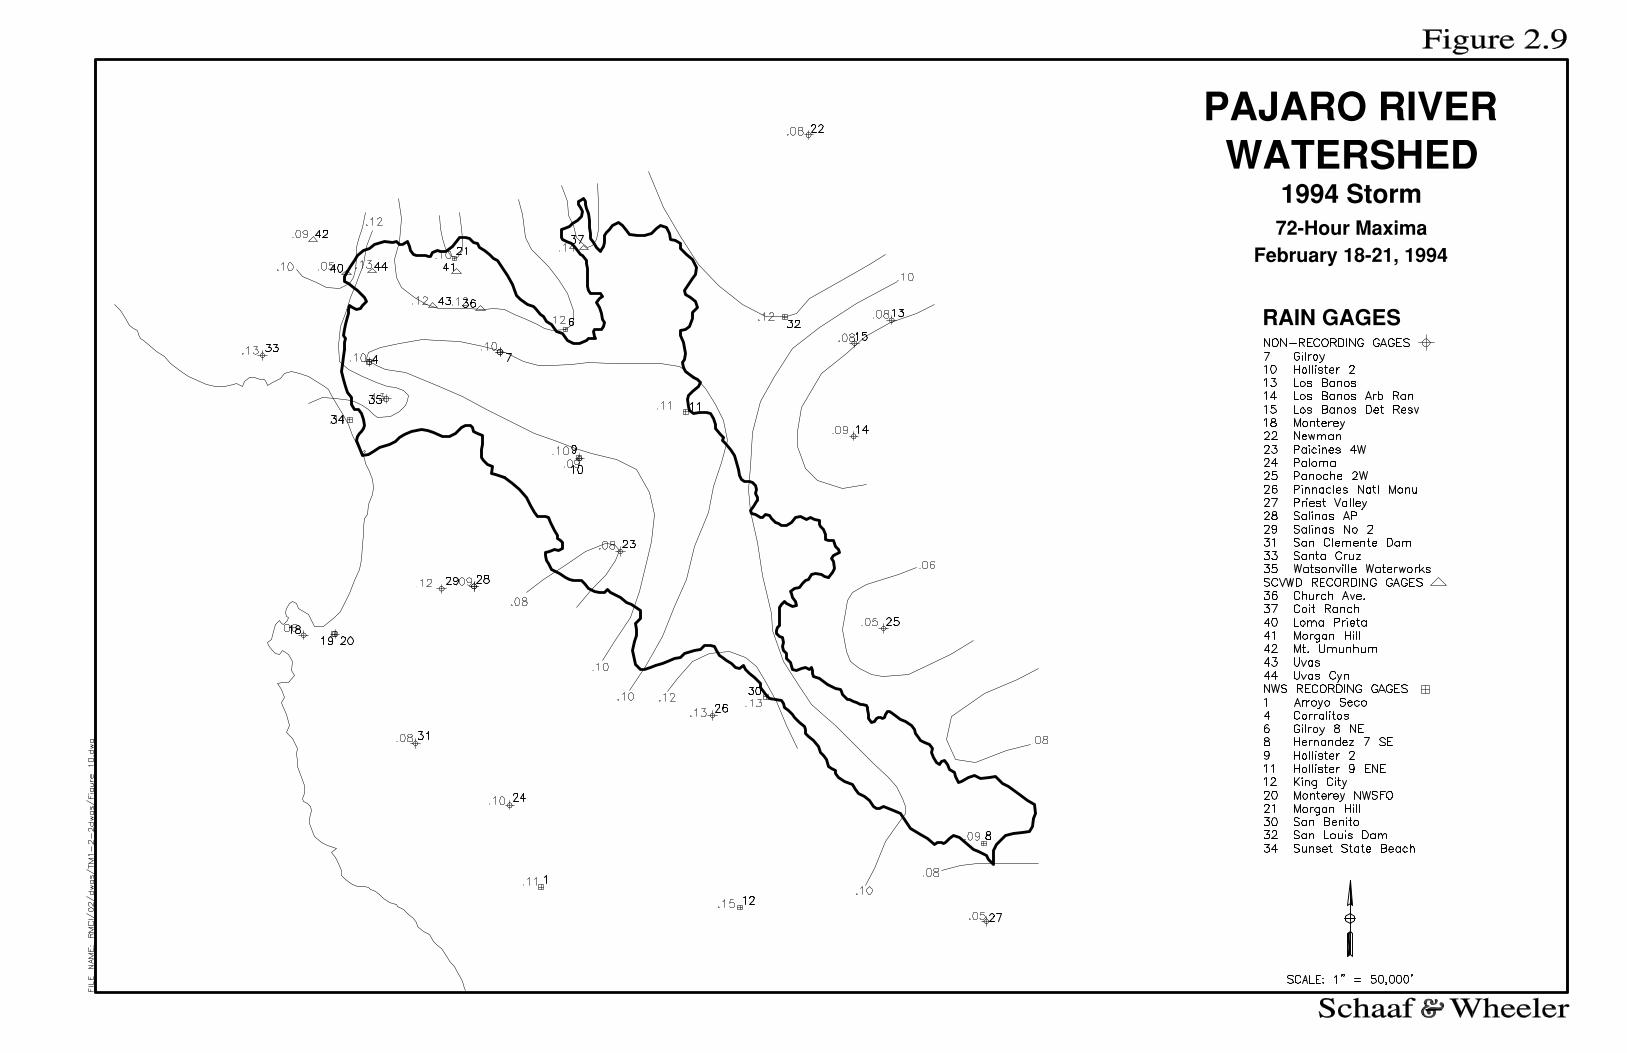
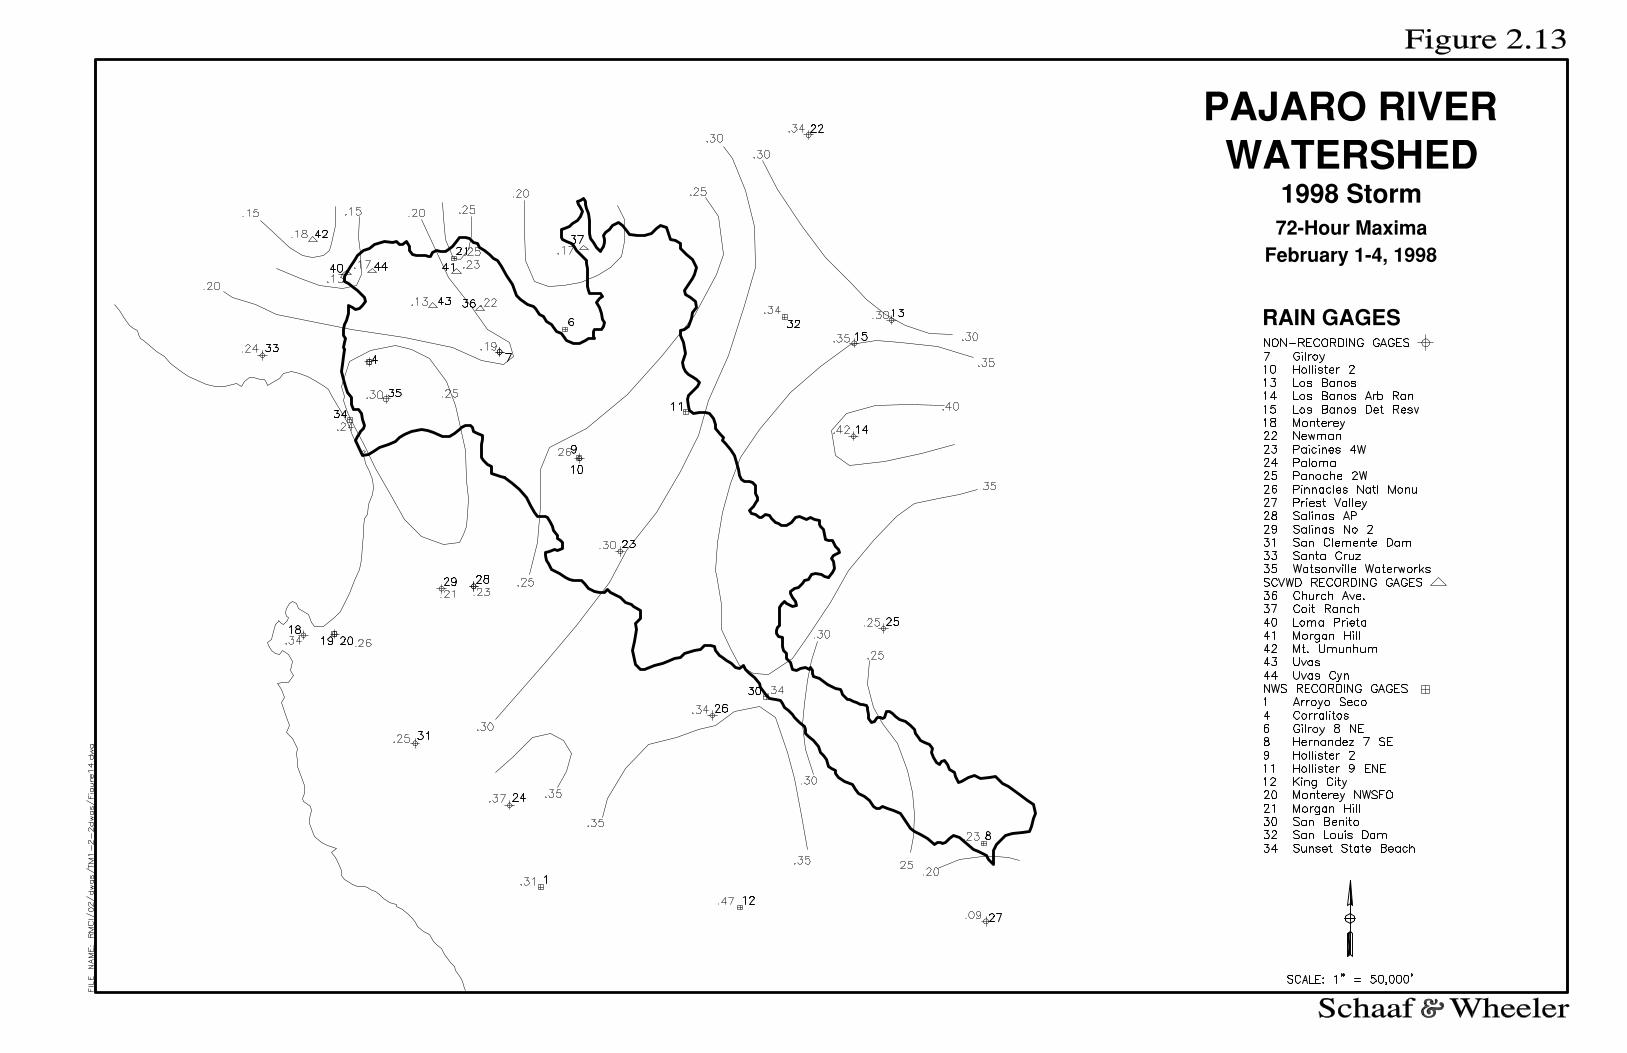
Rainfall Depths and Patterns 1994 to 1999 Rainfall Depths The maximum instantaneous peak discharge at the Pajaro River at Chittenden stream gage for water years 1994 to and including 1999 were determined from USGS stream gage records. The rainfall depths from all gages shown in Figure 2.1 were totaled for storms that produced the annual maximum peak discharges on the Pajaro River. Shown in Figures 2.3 to 2.8 are the accumulations of rainfall as a function of time at the recording stations as well as the non-recording stations. The data from recording stations are shown with continuous lines but the non-recording stations are shown as a series of symbols representing the cumulative depth of rainfall after each daily reading of the non-recording gages. The MAP of each station was estimated and the 3-day and 5-day rainfall totals were normalized to MAP. The results are shown in Table 2.1. Extending the duration to 5 days does not significantly increase the depth of rainfall over that measured in 3 days. Therefore, only the 3-day duration will be used in the remainder of the analysis of the six rainfall events. Figures 2.9 to 2.14 show isohyets of 72-hour rainfall normalized by MAP for each of the six storm events. It can be readily seen that 1995 and 1998 were much greater storms than the other four and that of the six storms considered, the 1994 and 1999 storms contained the least amounts of rainfall. Figure 2.15 is a normalized isohyetal map of the December 1955 storm. The isohyets were based on published Corps of Engineers maps showing the isohyets to the north of Hollister. Isohyets in the areas south of Hollister were added to 2.15 by determining the depths that fell in December 1955 at stations in and very near the watershed and normalizing those depths by MAP. It is quite clear when viewing the normalized rainfall totals that the 1955 storm produced greater depths of rainfall over larger areas of the watershed than did the February 1998 storm or the March 1995 storm. Even though the 1995 and 1998 storms were large they were not as large as the “Christmas storm” of December 1955. The relationship of normalized storm totals to area covered by the storm is important to quantify because it provides a constraint on just how large flood-producing storms are likely to be in the watershed. This relationship is normally shown as a ratio of rainfall at a point (for instance a rain gage) to rainfall over larger and larger areas. A typical relationship is shown in Figure 2.16 taken from the NWS Precipitation-Frequency Atlas for the Western United States. Note that the shorter the duration the quicker and more rapidly the point rainfall drops off with area. The NWS Depth-Area curve only extends to 400 square miles, an area too small for use in the Pajaro watershed with a total drainage area of approximately 1300 square miles.

RAINFALL -5- November, 2001
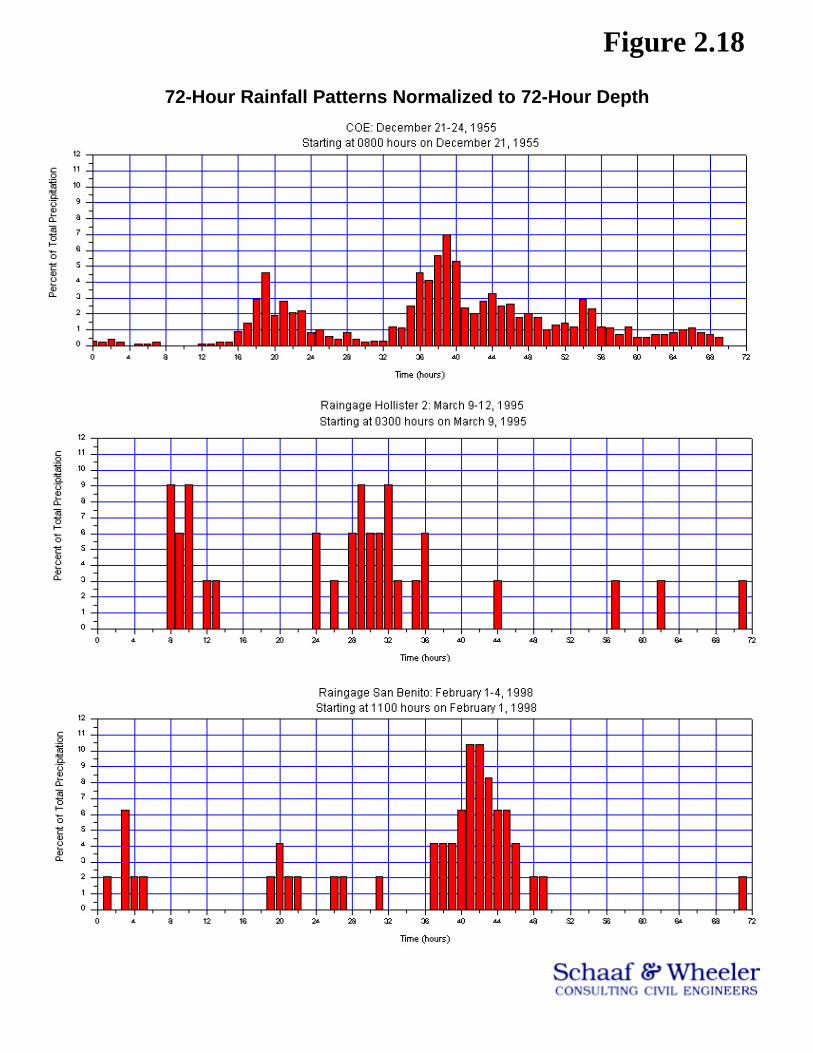
Figure 2.17 shows the Corps of Engineers depth-area curve for the December 1955 storm centered in the watershed. The depths are 72-hour maximum depths that have been normalized to MAP. Superimposed on Figure 2.17 are the NWS Depth-Area relationships set to a point value of 53.4 percent so that the curves all can start at the same y-axis value. The overlaying of the curves provides an indication of how rapidly (or how slowly) storm centers have historically dissipated over larger and larger watershed areas. Figure 2.17 also superimposes the depth-area curves restricted to Pajaro River watershed areas for the 1994 to 1999 storms and the December 1955 storm as shown in Figure 2.15. It is clear that the December 1955 storm was far greater in areal extent than were the storms of 1995 and 1998. It is also clear that the December 1955 storm was centered over only a part of the Pajaro River watershed. Use of the Corps of Engineers depth-area curve for the Pajaro River watershed hydrologic model means that the model will assume that more of the storm is centered in the watershed than actually occurred during the large December 1955 storm The Corps of Engineers depth-area curve for the 1955 storm will be used as part of the hydrologic model. Rainfall Patterns Seventy-two-hour rainfall patterns are shown in Figure 2.18 for the December 1955, March 1995 and February 1998 storms. All three patterns show hourly precipitation as a percent of 72-hour total rainfall. The December 1955 pattern is from Corps of Engineers reports and is based on the December 21 to 24, 1955 rainfall. Hourly depths at three recording stations – Freedom 8NNW, Hollister and Stayton Mine - were averaged to produce this pattern. The rainfall pattern from the April 10 to 12, 1995 storm was recorded at the Hollister 2 recording rain gage. The rainfall pattern from February 1 to 3, 1998 was recorded at the San Benito recording rain gage. All patterns are similar and any one could be used as a design storm pattern. Since the December 1955 storm has been used so extensively by the Corps of Engineers in all its past work in the watershed, this same pattern will be used as the basis for the design storm for the hydrologic model. Rainfall Statistics The SCVWD has produced a set of equations to determine depth of rainfall given the MAP, the duration and the frequency. These equations are shown in Hydrology Procedures published in December 1998. The equation of interest is called the Return Period-Duration-Specific (TDS) Regional Equation. The basic form of the TDS equation is:

RAINFALL -6- November, 2001
XT,D = AT,D + BT,D MAP
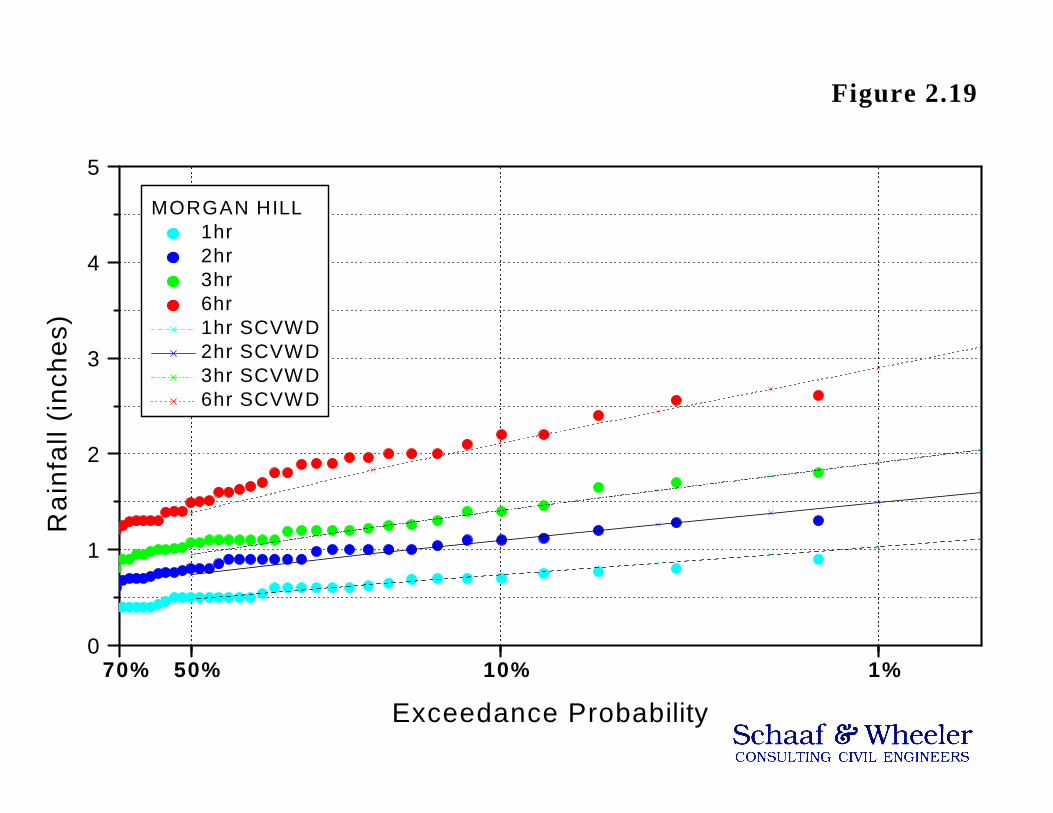
where: XT,D = Rainfall depth in inches for a specific return period, T, for a Specific duration, D AT,D = Equation intercept for return period T and duration D BT,D = Equation slope for return period T and duration D MAP = Mean Annual Precipitation Hydrology Procedures contains tables of slopes and intercepts for durations ranging from 5-minutes to 60-days. The return periods included in the tables are: 2-, 5-, 10-, 25-, 50-, 100-, 200-, 500-, 1000-, and 10000-years. The TDS equation appears to be useful for the hydrologic model because it uses MAP as an independent variable, a quantity that has been mapped for the Pajaro River watershed. To determine how well the SCVWD TDS equations fit the rain gage data in the Pajaro River watershed a comparison was made between recorded data and TDS results. Three stations were used for the comparison: Morgan Hill, Hollister 2 and Hernandez 7SE. These three stations were selected because they were recording stations, were well distributed throughout the watershed and varied in MAP from 13 inches at Hollister 2 to 20 inches at Hernandez 7SE and 21 inches at Morgan Hill. Shorter Durations Figures 2.19, 2.20 and 2.21 show the 1-, 2-, 3-, and 6-hour rainfall depths measured at the gages and the corresponding predicted depths of rainfall from the TDS equation. The data from the gages was plotted using the Median Plotting Position formula. As can be seen in the figures, the TDS equation fits the data well. The worst fit is that for the Morgan Hill gage where the data between exceedance probabilities of 10 to 50 percent seem a little high compared to the TDS frequency curve. The SCVWD report contains information on the measure of “the goodness of fit” for the TDS equation. For the 6-hour duration the Standard Error for the 100-year depth (1 percent exceedance probability) is 0.28 inches. This means that the “true” 100-year six-hour depth is within the value predicted by the TDS equation plus or minus 0.28 inches 67 percent of the time. Or it is within plus or minus 0.56 inches 90 percent of the time. The Standard Errors for the 10-year and 2-year depths are 0.31 inches and 0.18 inches respectively. It appears that all data points are within plus or minus one Standard Error for the 6-hour duration. The comparison between station data and the TDS equation shows that for the shorter durations the equation provides an adequate representation of the frequency response of rainfall in the Pajaro River watershed. One interesting feature of the TDS equation is that the longer the duration the faster rainfall depths increase with MAP. Referring to Figures 2.20 and 2.21 the 1 percent 1-hour depth only changes from 0.9 to 1.0 inches (an 11 percent increase) as MAP varies
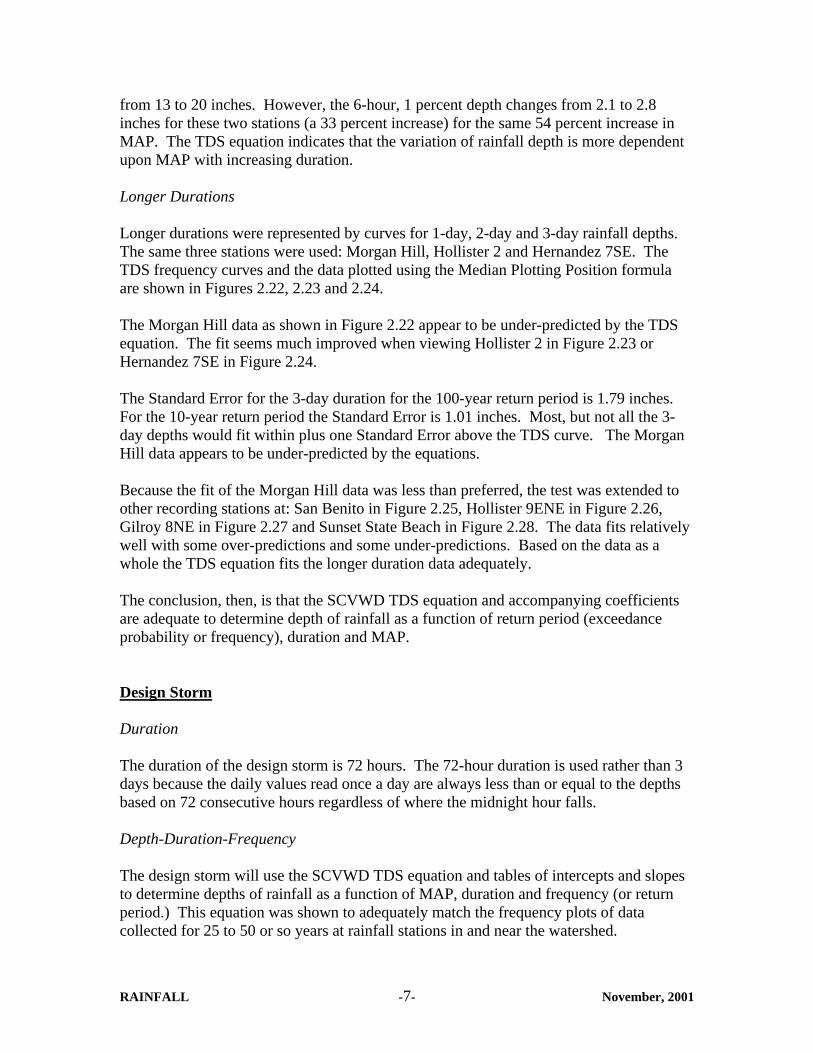
RAINFALL -7- November, 2001
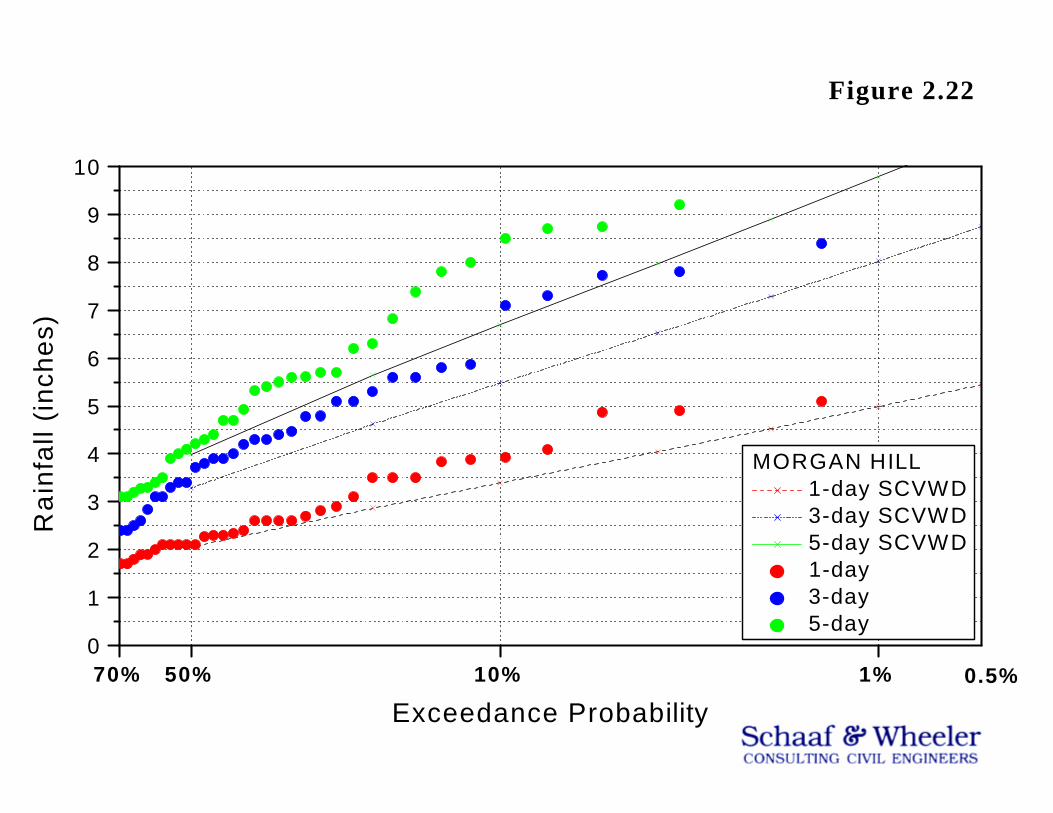
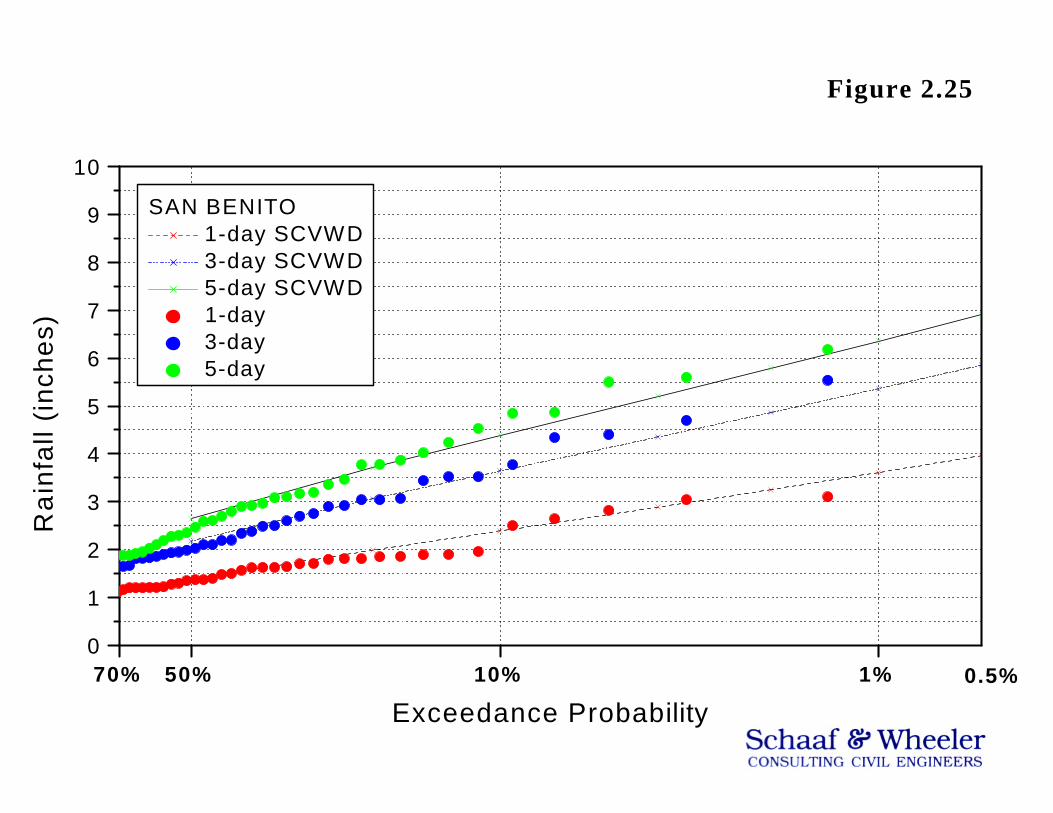
from 13 to 20 inches. However, the 6-hour, 1 percent depth changes from 2.1 to 2.8 inches for these two stations (a 33 percent increase) for the same 54 percent increase in MAP. The TDS equation indicates that the variation of rainfall depth is more dependent upon MAP with increasing duration. Longer Durations Longer durations were represented by curves for 1-day, 2-day and 3-day rainfall depths. The same three stations were used: Morgan Hill, Hollister 2 and Hernandez 7SE. The TDS frequency curves and the data plotted using the Median Plotting Position formula are shown in Figures 2.22, 2.23 and 2.24. The Morgan Hill data as shown in Figure 2.22 appear to be under-predicted by the TDS equation. The fit seems much improved when viewing Hollister 2 in Figure 2.23 or Hernandez 7SE in Figure 2.24. The Standard Error for the 3-day duration for the 100-year return period is 1.79 inches. For the 10-year return period the Standard Error is 1.01 inches. Most, but not all the 3-day depths would fit within plus one Standard Error above the TDS curve. The Morgan Hill data appears to be under-predicted by the equations. Because the fit of the Morgan Hill data was less than preferred, the test was extended to other recording stations at: San Benito in Figure 2.25, Hollister 9ENE in Figure 2.26, Gilroy 8NE in Figure 2.27 and Sunset State Beach in Figure 2.28. The data fits relatively well with some over-predictions and some under-predictions. Based on the data as a whole the TDS equation fits the longer duration data adequately. The conclusion, then, is that the SCVWD TDS equation and accompanying coefficients are adequate to determine depth of rainfall as a function of return period (exceedance probability or frequency), duration and MAP. Design Storm Duration The duration of the design storm is 72 hours. The 72-hour duration is used rather than 3 days because the daily values read once a day are always less than or equal to the depths based on 72 consecutive hours regardless of where the midnight hour falls. Depth-Duration-Frequency The design storm will use the SCVWD TDS equation and tables of intercepts and slopes to determine depths of rainfall as a function of MAP, duration and frequency (or return period.) This equation was shown to adequately match the frequency plots of data collected for 25 to 50 or so years at rainfall stations in and near the watershed.

RAINFALL -8- November, 2001
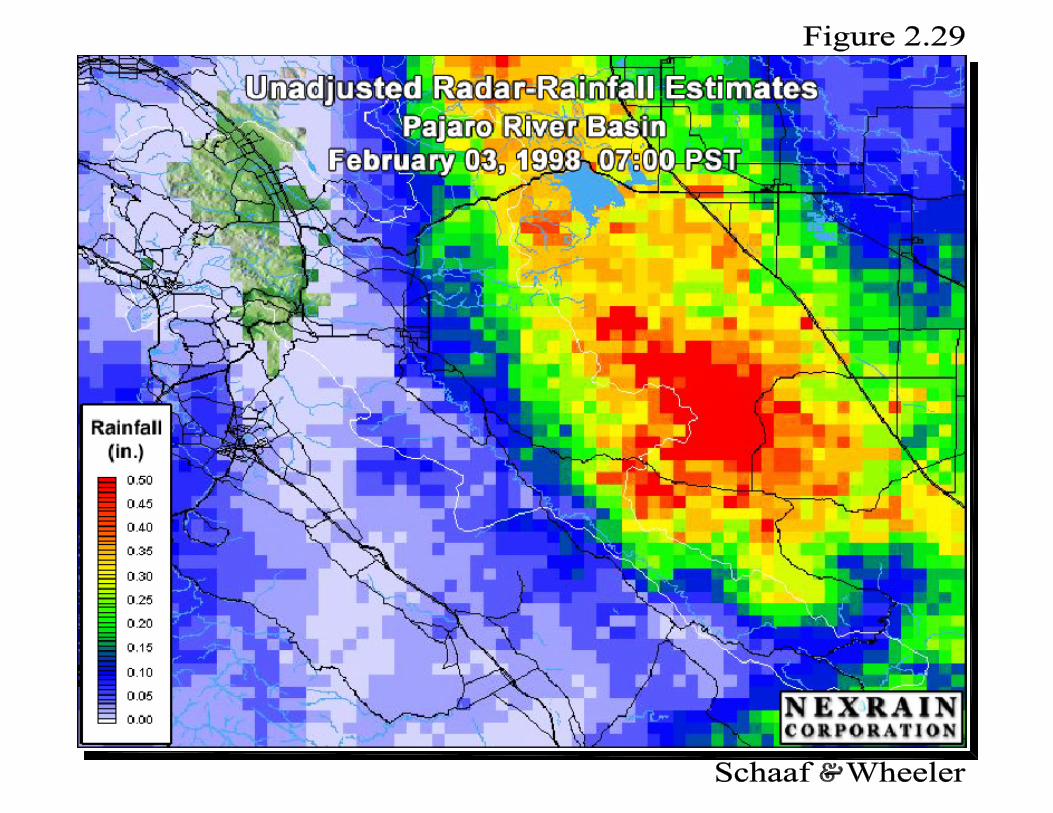
Depth-Area Reduction The depth-area reduction factor will be based on the Corps of Engineers analysis of the December 1955 storm. As the drainage area to any given catch point (i.e. point of interest along the stream network in the watershed) gets larger the storm must be reduced to account for the fact that historic storms have decayed as larger and larger areas are considered. The storms have had centers of higher rainfall surrounded by areas of lower rainfall. For example, Figure 2.29 is a cel from radar images that shows the relative amount of rain that fell during the hour ending at 7 a.m. on February 3, 1998. The storm totals for that hour were greatest just east of the Tres Pinos Creek watershed over the hills in Fresno County. This can be seen in Figure 2.29 by focusing on the area in red where the storm was most intense for that hour. As larger and larger areas are considered in Figure 2.29, it can be seen that the storm totals drop off. This same centering concept will be used in the hydrologic model. As larger and larger drainage areas are considered, the storm will be centered in one location and the Corps of Engineers depth-area relationship as shown in Figure 2.17 will be used to adjust the rainfall depths to reflect the historic centering of large storms in the watershed. Pattern The December 1955 storm pattern is to be used for the temporal distribution for all designated storm return periods from 2 years to 200 years. However, the pattern will be adjusted so that it reflects the rain gage statistics predicted by the SCVWD TDS equations. Figure 2.30 shows the original 1955 pattern as presented by the Corps of Engineers along with the “balanced” patterns at Hollister 2 (13 inches MAP) and Morgan Hill (21 inches MAP) for the 100-year storm. Balancing is normally done by “rubberbanding” the rainfall patter to fit specified values. In this case the values specified were the percentages of 72-hour rainfall that fell during the following durations: 48, 24, 6 and 3 hours. Depths of rainfall for each duration were predicted by using the SCVWD TDS equations. As can be seen in Figure 2.30 the design pattern is shifted somewhat for the balanced storms. However, the “balanced” storm reflects the rainfall statistics as represented by the SCVWD TDS equations. Conclusion A balanced design storm has been developed for the hydrologic model. That storm is 72 hours in duration, uses MAP to predict the depth of rainfall for any frequency storm from the SCVWD TDS equation, uses a pattern based on the December 1955 storm but is “balanced” to reflect probabilities of rainfall depths, and uses the Corps of Engineers December 1955 storm depth-area curve as an areal reduction coefficient for rainfall depth.
Pajaro River Downstream of Salsipuedes CreekPajaro River at ChittendenPajaro River at US 101San Benito River Upstream of Confluence with Pajaro River
Locations1. 2. 3. 4.
12
3
4
Pajaro River Watershed
Locations of Comparisons
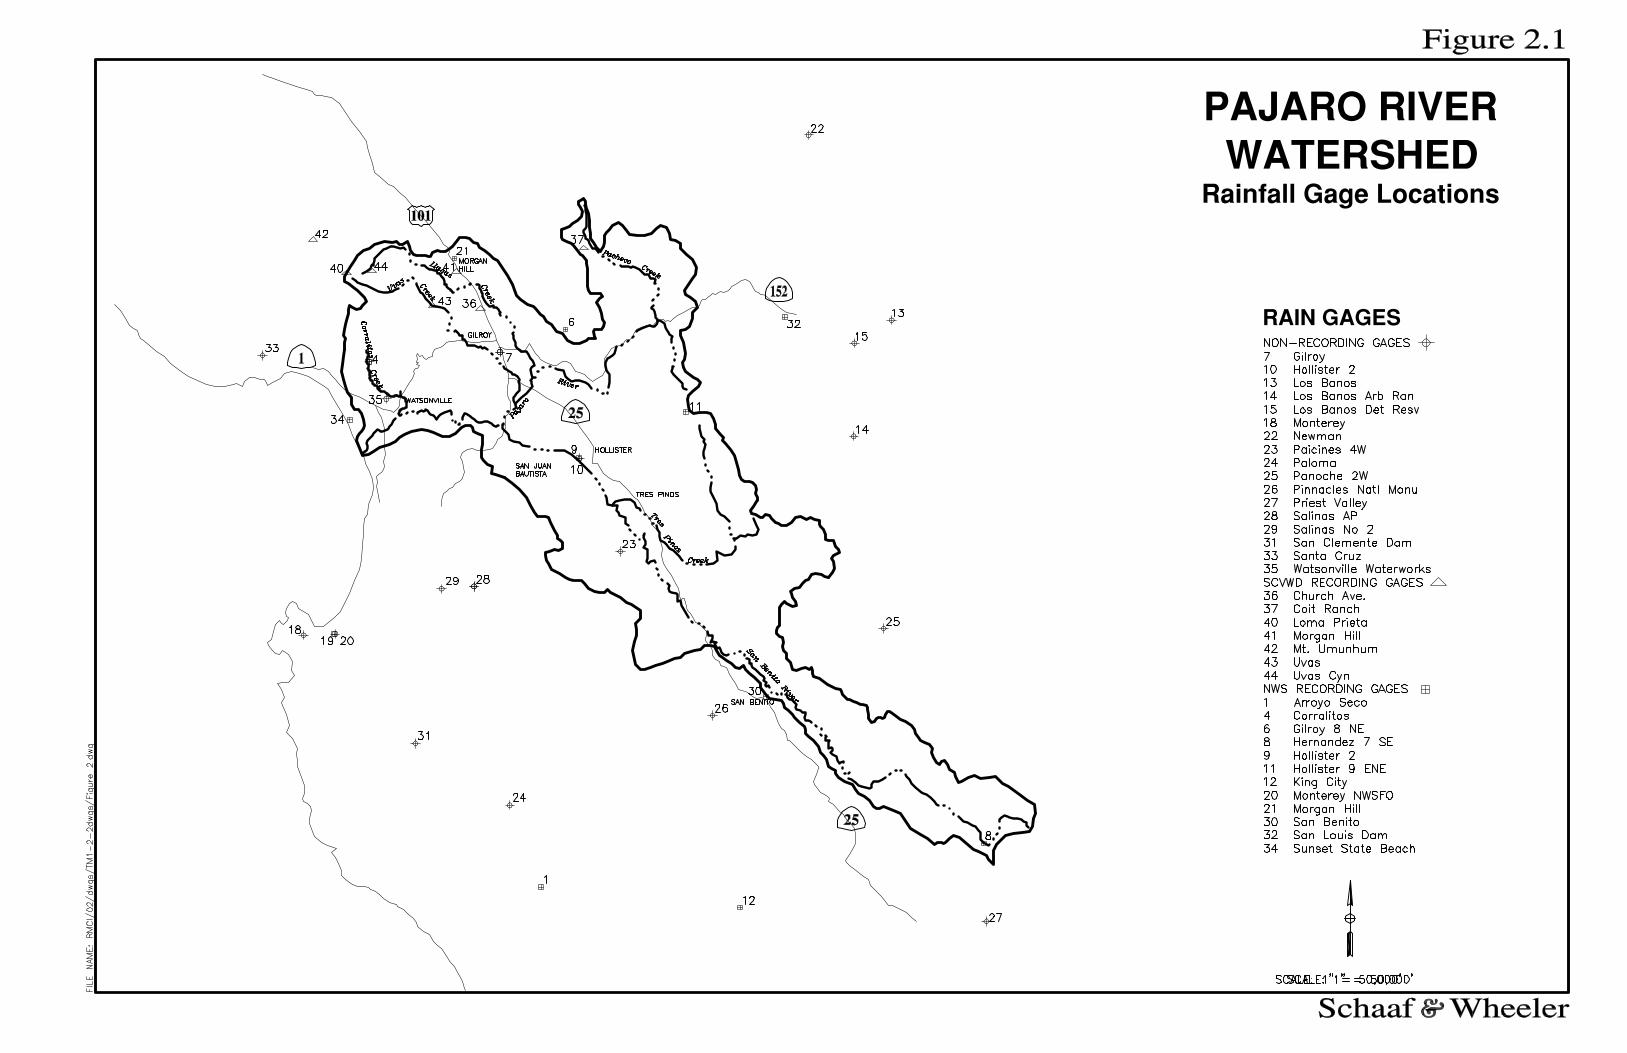
RAIN GAGES
PAJARO RIVER WATERSHED
Rainfall Gage Locations

PAJARO RIVER WATERSHED
Mean Annual Precipitation(in inches)
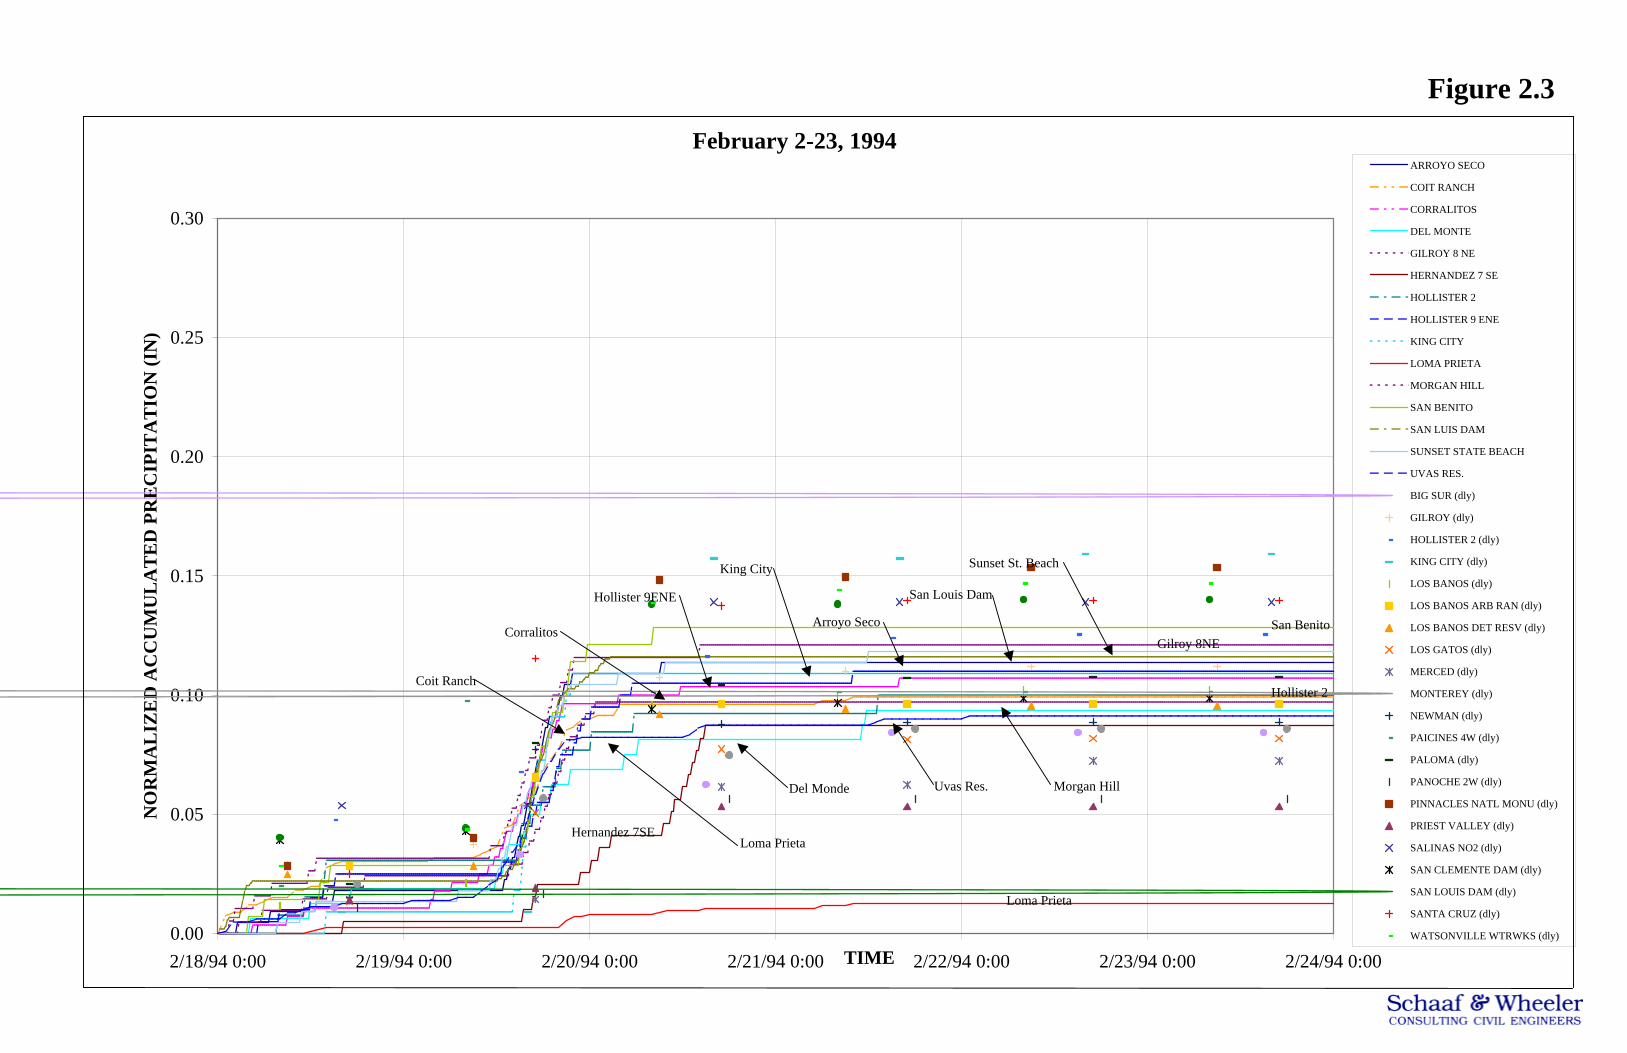
Figure 2.3
February 2-23, 1994
0.00
0.05
0.10
0.15
0.20
0.25
0.30
2/18/94 0:00 2/19/94 0:00 2/20/94 0:00 2/21/94 0:00 2/22/94 0:00 2/23/94 0:00 2/24/94 0:00TIME
NO
RM
AL
IZE
D A
CC
UM
UL
AT
ED
PR
EC
IPIT
AT
ION
(IN
)ARROYO SECO
COIT RANCH
CORRALITOS
DEL MONTE
GILROY 8 NE
HERNANDEZ 7 SE
HOLLISTER 2
HOLLISTER 9 ENE
KING CITY
LOMA PRIETA
MORGAN HILL
SAN BENITO
SAN LUIS DAM
SUNSET STATE BEACH
UVAS RES.
BIG SUR (dly)
GILROY (dly)
HOLLISTER 2 (dly)
KING CITY (dly)
LOS BANOS (dly)
LOS BANOS ARB RAN (dly)
LOS BANOS DET RESV (dly)
LOS GATOS (dly)
MERCED (dly)
MONTEREY (dly)
NEWMAN (dly)
PAICINES 4W (dly)
PALOMA (dly)
PANOCHE 2W (dly)
PINNACLES NATL MONU (dly)
PRIEST VALLEY (dly)
SALINAS NO2 (dly)
SAN CLEMENTE DAM (dly)
SAN LOUIS DAM (dly)
SANTA CRUZ (dly)
WATSONVILLE WTRWKS (dly)
Loma Prieta
Arroyo Seco
San Louis Dam
Sunset St. Beach
Coit Ranch
Hollister 9ENE
King City
Gilroy 8NE
Hernandez 7SE
San Benito
Hollister 2
Morgan HillDel Monde
Corralitos
Loma Prieta
Uvas Res.
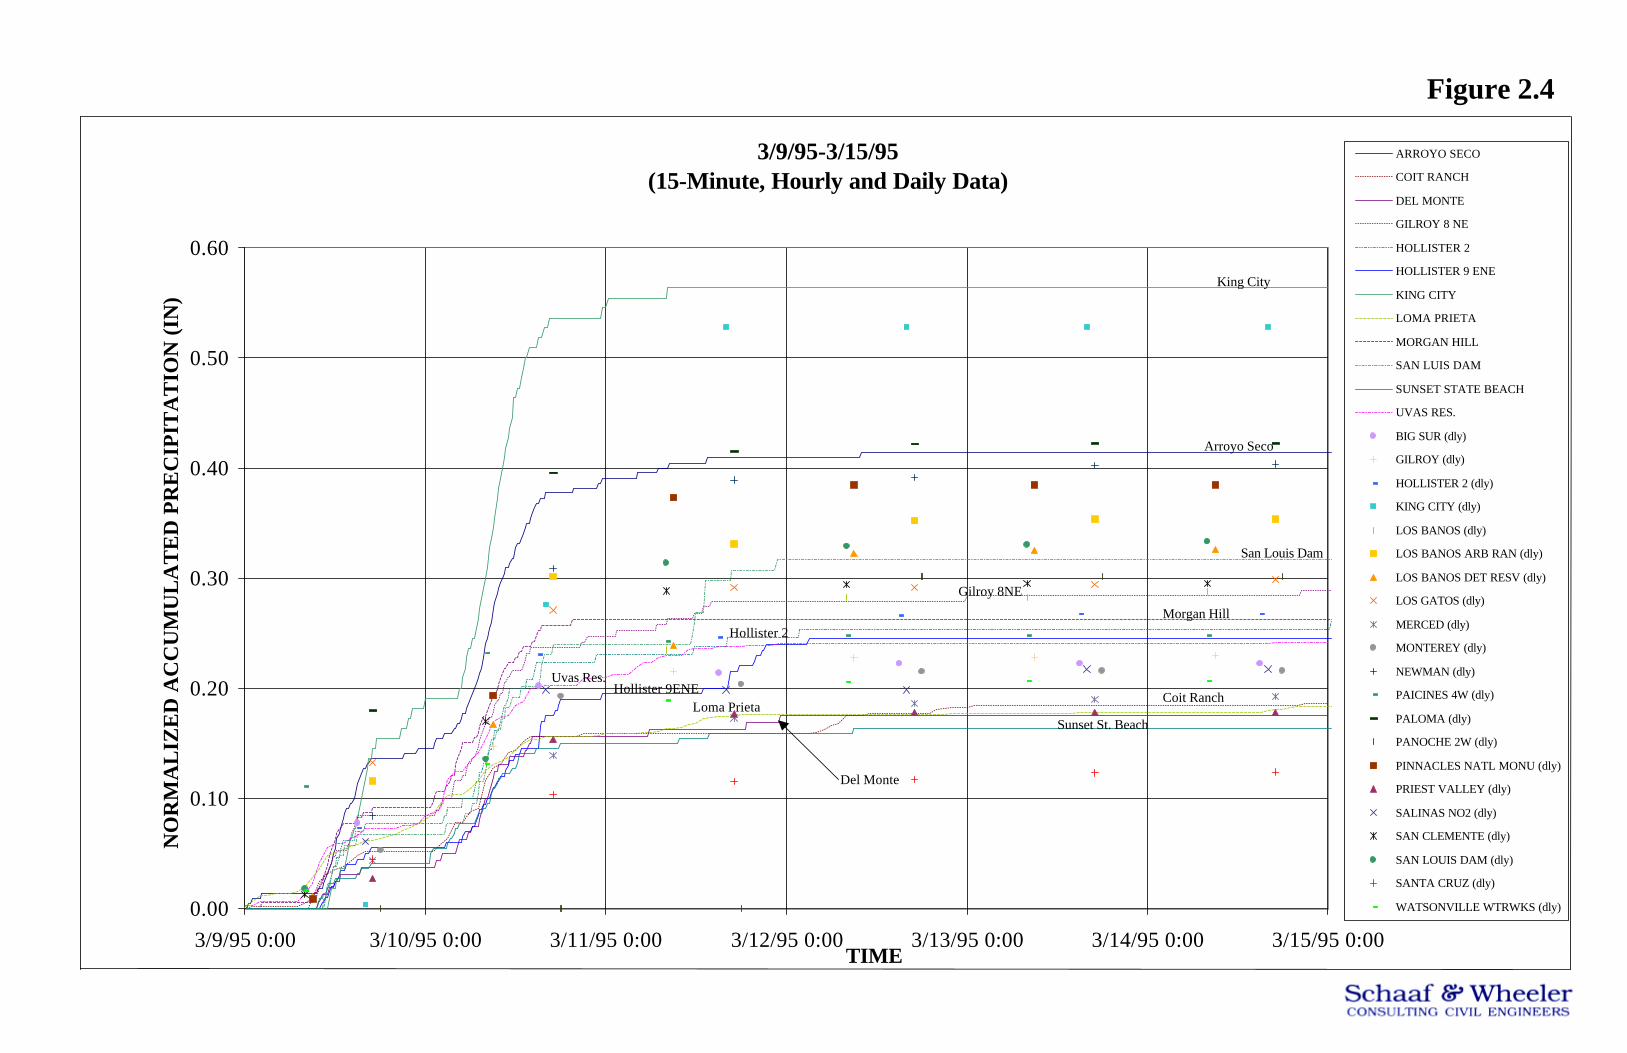
Figure 2.4
3/9/95-3/15/95(15-Minute, Hourly and Daily Data)
0.00
0.10
0.20
0.30
0.40
0.50
0.60
3/9/95 0:00 3/10/95 0:00 3/11/95 0:00 3/12/95 0:00 3/13/95 0:00 3/14/95 0:00 3/15/95 0:00TIME
NO
RM
AL
IZE
D A
CC
UM
UL
AT
ED
PR
EC
IPIT
AT
ION
(IN
)ARROYO SECO
COIT RANCH
DEL MONTE
GILROY 8 NE
HOLLISTER 2
HOLLISTER 9 ENE
KING CITY
LOMA PRIETA
MORGAN HILL
SAN LUIS DAM
SUNSET STATE BEACH
UVAS RES.
BIG SUR (dly)
GILROY (dly)
HOLLISTER 2 (dly)
KING CITY (dly)
LOS BANOS (dly)
LOS BANOS ARB RAN (dly)
LOS BANOS DET RESV (dly)
LOS GATOS (dly)
MERCED (dly)
MONTEREY (dly)
NEWMAN (dly)
PAICINES 4W (dly)
PALOMA (dly)
PANOCHE 2W (dly)
PINNACLES NATL MONU (dly)
PRIEST VALLEY (dly)
SALINAS NO2 (dly)
SAN CLEMENTE (dly)
SAN LOUIS DAM (dly)
SANTA CRUZ (dly)
WATSONVILLE WTRWKS (dly)
Sunset St. Beach
King City
Arroyo Seco
Uvas Res.
San Louis Dam
Hollister 2
Hollister 9ENELoma Prieta
Coit Ranch
Morgan Hill
Gilroy 8NE
Del Monte

Figure 2.5
February 18-24, 1996(15-Minute & Daily Data)
0.00
0.10
0.20
0.30
0.40
0.50
0.60
2/18/96 0:00 2/19/96 0:00 2/20/96 0:00 2/21/96 0:00 2/22/96 0:00 2/23/96 0:00 2/24/96 0:00TIME
NO
RM
AL
IZE
D A
CC
UM
UL
AT
ED
PR
EC
IPIT
AT
ION
(IN
)
ARROYO SECO
COIT RANCH
CORRALITOS
GILROY 8 NE
HOLLISTER 2
HOLLISTER 9 ENE
KING CITY
LOMA PRIETA
MORGAN HILL
SAN BENITO
SAN LUIS DAM
SUNSET STATE BEACH
UVAS RES.
BIG SUR (dly)
GILROY (dly)
HOLLISTER 2 (dly)
KING CITY (dly)
LOS BANOS (dly)
LOS BANOS ARB RAN (dly)
LOS BANOS DET RESV (dly)
LOS GATOS (dly)
MERCED (dly)
MONTEREY (dly)
MONTEREY NWSFO (dly)
NEWMAN (dly)
PAICINES 4W (dly)
PALOMA (dly)
PANOCHE 2W (dly)
PINNACLES NATL MONU (dly)
PRIEST VALLEY (dly)
SALINAS NO2 (dly)
SAN CLEMENTE DAM (dly)
SAN LOUIS DAM (dly)
SANTA CRUZ (dly)
WATSONVILLE WTRWKS (dly)
Uvas Res.
Coit Ranch
Hollister 9ENE
Morgan Hill
Gilroy 8
Arroyo Seco
Hollister 2
Sunset St. BeachLoma Prieta
San Benito
King CitySan Louis Dam
Corralito

Figure 2.6
December 29, 1996 - January 6, 1997(15-Minute & Daily Data)
0.00
0.10
0.20
0.30
0.40
0.50
0.60
12/29/96 0:00 12/30/96 0:00 12/31/96 0:00 1/1/97 0:00 1/2/97 0:00 1/3/97 0:00 1/4/97 0:00TIME
NO
RM
AL
IZE
D A
CC
UM
UL
AT
ED
PR
EC
IPIT
AT
ION
(IN
)ARROYO SECO
COIT RANCH
CORRALITOS
GILROY 8 NE
HERNANDEZ 7 SE
HOLLISTER 2
HOLLISTER 9 ENE
KING CITY
LOMA PRIETA
MORGAN HILL
SAN BENITO
SAN LUIS DAM
SUNSET STATE BEACH
UVAS RES.
BIG SUR (dly)
GILROY (dly)
HOLLISTER 2 (dly)
KING CITY (dly)
LOS BANOS (dly)
LOS BANOS ARB RAN (dly)
LOS BANOS DET RES (dly)
LOS GATOS (dly)
MERCED (dly)
MONTEREY (dly)
MONTEREY NWSFO (dly)
NEWMAN (dly)
PALOMA (dly)
PANOCHE 2W (dly)
PIACINES 4W (dly)
PINNACLES NATL MONU (dly)
PRIEST VALLEY (dly)
SALINAS NO2 (dly)
SAN CLEMENTE DAM (dly)
SAN LOUIS DAM (dly)
SANTA CRUZ (dly)
WATSONVILLE WTRWKS (dly)
San Benito
Arroryo Seco
King City
Morgan Hill
Hollister 2
Loma Prieta
Hollister 9ENE
Uvas Res.
Gilroy 8NE
Coit Ranch
Corralitos
San Louis DamHernandez 7SE
Sunset St. Beach
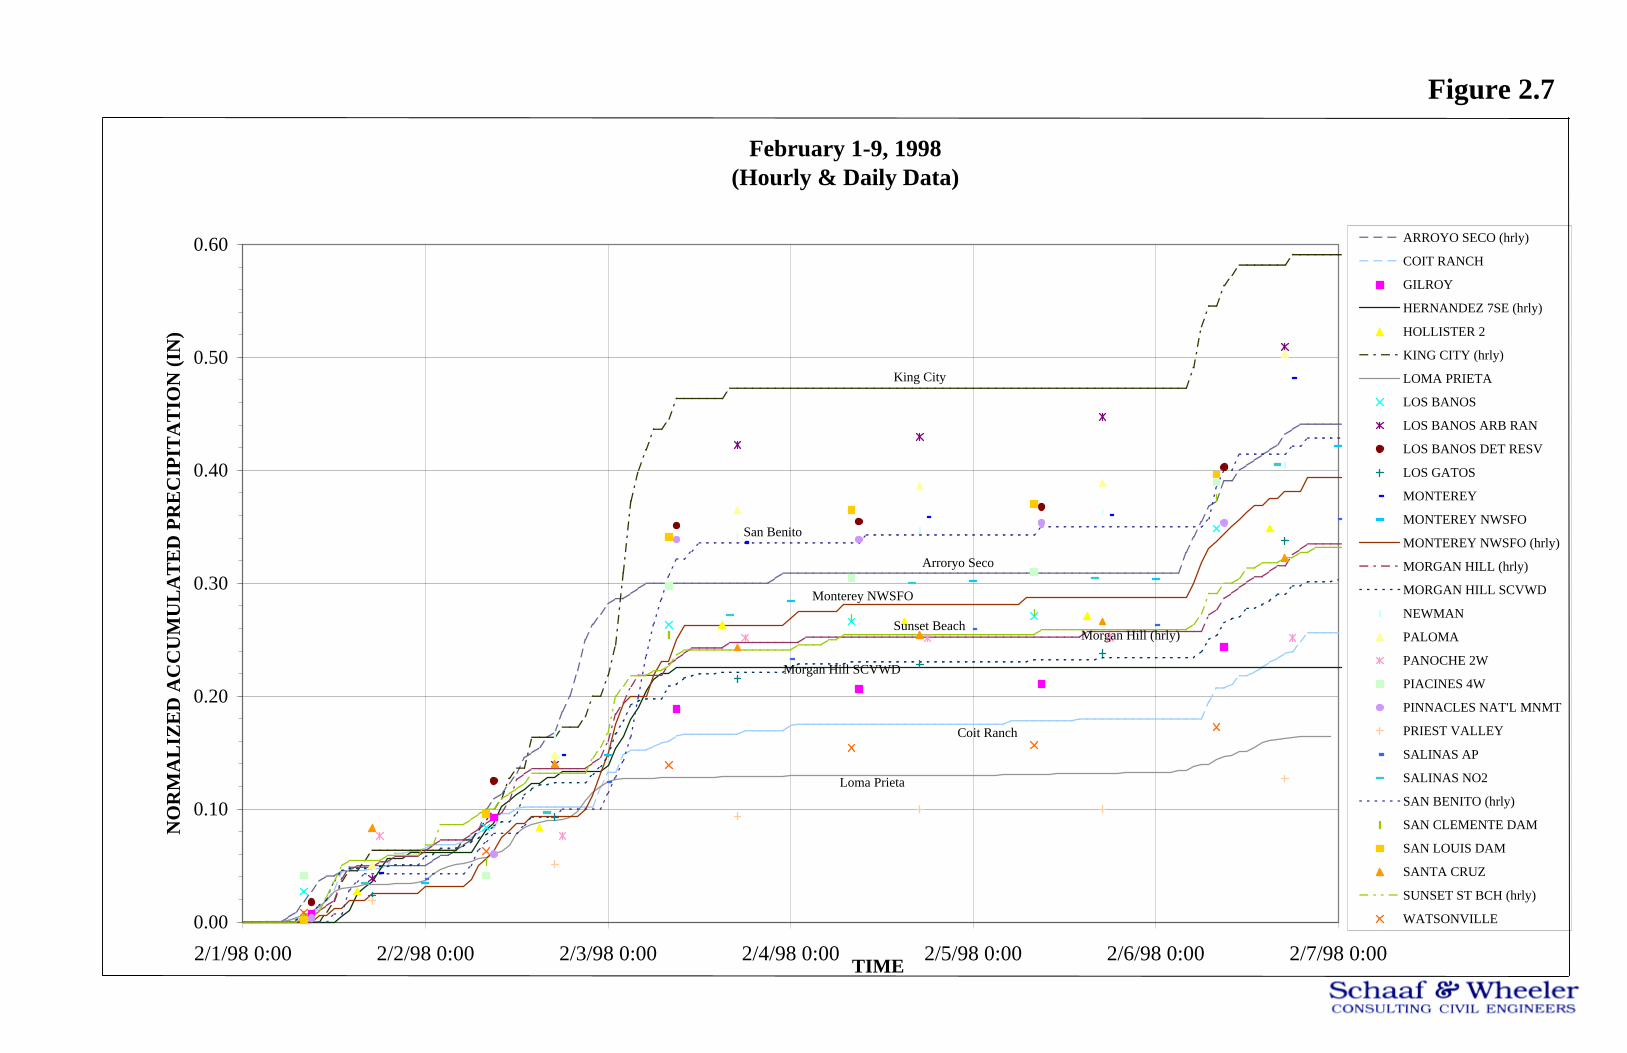
Figure 2.7
February 1-9, 1998(Hourly & Daily Data)
0.00
0.10
0.20
0.30
0.40
0.50
0.60
2/1/98 0:00 2/2/98 0:00 2/3/98 0:00 2/4/98 0:00 2/5/98 0:00 2/6/98 0:00 2/7/98 0:00TIME
NO
RM
AL
IZE
D A
CC
UM
UL
AT
ED
PR
EC
IPIT
AT
ION
(IN
)
ARROYO SECO (hrly)
COIT RANCH
GILROY
HERNANDEZ 7SE (hrly)
HOLLISTER 2
KING CITY (hrly)
LOMA PRIETA
LOS BANOS
LOS BANOS ARB RAN
LOS BANOS DET RESV
LOS GATOS
MONTEREY
MONTEREY NWSFO
MONTEREY NWSFO (hrly)
MORGAN HILL (hrly)
MORGAN HILL SCVWD
NEWMAN
PALOMA
PANOCHE 2W
PIACINES 4W
PINNACLES NAT'L MNMT
PRIEST VALLEY
SALINAS AP
SALINAS NO2
SAN BENITO (hrly)
SAN CLEMENTE DAM
SAN LOUIS DAM
SANTA CRUZ
SUNSET ST BCH (hrly)
WATSONVILLE
King City
San Benito
Arroryo Seco
Monterey NWSFO
Morgan Hill (hrly)Sunset Beach
Morgan Hill SCVWD
Coit Ranch
Loma Prieta
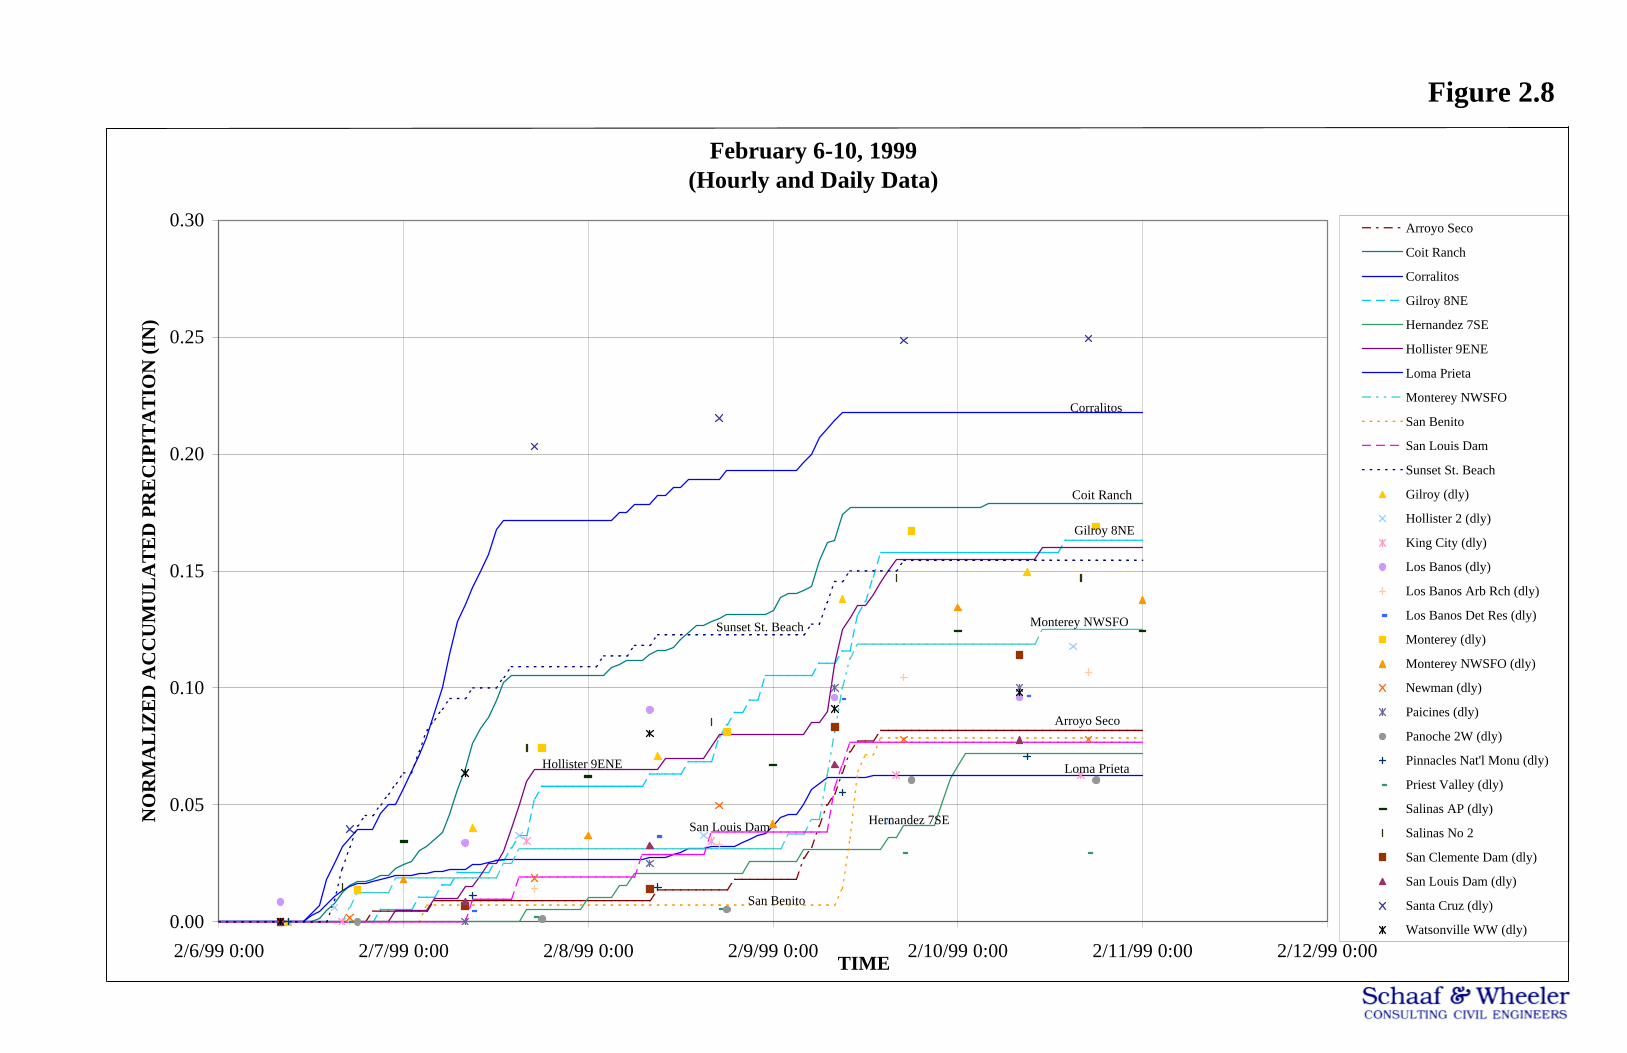
Figure 2.8
February 6-10, 1999(Hourly and Daily Data)
0.00
0.05
0.10
0.15
0.20
0.25
0.30
2/6/99 0:00 2/7/99 0:00 2/8/99 0:00 2/9/99 0:00 2/10/99 0:00 2/11/99 0:00 2/12/99 0:00TIME
NO
RM
AL
IZE
D A
CC
UM
UL
AT
ED
PR
EC
IPIT
AT
ION
(IN
)
Arroyo Seco
Coit Ranch
Corralitos
Gilroy 8NE
Hernandez 7SE
Hollister 9ENE
Loma Prieta
Monterey NWSFO
San Benito
San Louis Dam
Sunset St. Beach
Gilroy (dly)
Hollister 2 (dly)
King City (dly)
Los Banos (dly)
Los Banos Arb Rch (dly)
Los Banos Det Res (dly)
Monterey (dly)
Monterey NWSFO (dly)
Newman (dly)
Paicines (dly)
Panoche 2W (dly)
Pinnacles Nat'l Monu (dly)
Priest Valley (dly)
Salinas AP (dly)
Salinas No 2
San Clemente Dam (dly)
San Louis Dam (dly)
Santa Cruz (dly)
Watsonville WW (dly)
Corralitos
Sunset St. Beach
Hollister 9ENE
Gilroy 8NE
Monterey NWSFO
Arroyo Seco
San Benito
San Louis Dam Hernandez 7SE
Coit Ranch
Loma Prieta
RAIN GAGES
PAJARO RIVER WATERSHED
1994 Storm72−Hour Maxima
February 18−21, 1994

RAIN GAGES
PAJARO RIVER WATERSHED
1995 Storm72−Hour MaximaMarch 9−12, 1995

RAIN GAGES
PAJARO RIVER WATERSHED
1996 Storm72−Hour Maxima
February 18−21, 1991

RAIN GAGES
PAJARO RIVER WATERSHED
1997 Storm72−Hour Maxima
December 31, 1996−January 3,1997
RAIN GAGES
PAJARO RIVER WATERSHED
1998 Storm72−Hour Maxima
February 1−4, 1998

RAIN GAGES
PAJARO RIVER WATERSHED
1999 Storm72−Hour Maxima
February 6−9, 1999

RAIN GAGES
PAJARO RIVER WATERSHED
1955 Storm72−Hour Maxima
December 21−24, 1955

0 50 100 150 200 250 300 350 400
50
60
70
80
90
100
Figure 2.16
NWS DEPTH-AREA CURVE
1-Hour
3-Hour
6-Hour
24-Hour
30-Minutes
Per
cen
t o
f P
reci
pit
atio
n f
or
Giv
en A
rea
Area (Square Miles)

Figure 2.17
DEPTH-AREA CURVEPajaro River Basin
0%
10%
20%
30%
40%
50%
60%
1 10 100 1000 10000Area (Square Miles)
72-H
our
Pre
cip
itat
ion
(Per
cen
t of
Mea
n A
nn
ual
Pre
cip
itat
ion
)
Corps 1955
24-Hr NWS
6-Hr NWS
3-Hr NWS
1-Hr NWS
1955 Storm
1994 Storm
1995 Storm
1996 Storm
1997 Storm
1998 Storm
1999 Storm
72-Hour Rainfall Patterns Normalized to 72-Hour Depth
Figure 2.18
70% 50% 10% 1%0
1
2
3
4
5
MORGAN HILL 1hr 2hr 3hr 6hr 1hr SCVWD 2hr SCVWD 3hr SCVWD 6hr SCVWD
Figure 2.19R
ain
fall
(in
che
s)
Exceedance Probability

70% 50% 10% 1%0
1
2
3
4
5
Figure 2.20R
ain
fall
(in
che
s)
Exceedance Probability
HOLLISTER 2 1hr 2hr 3hr 6hr 1hr SCVWD 2hr SCVWD 3hr SCVWD 6hr SCVWD

70% 50% 10% 1%0
1
2
3
4
5
Figure 2.21R
ain
fall
(in
che
s)
Exceedance Probability
HERNANDEZ 7SE 1hr 2hr 3hr 6hr 1hr SCVWD 2hr SCVWD 3hr SCVWD 6hr SCVWD
70% 50% 10% 1%0
1
2
3
4
5
6
7
8
9
10
0.5%
Figure 2.22
Ra
infa
ll (i
nch
es)
Exceedance Probability
MORGAN HILL 1-day SCVWD 3-day SCVWD 5-day SCVWD 1-day 3-day 5-day

70% 50% 10% 1%0
1
2
3
4
5
6
7
8
9
10
0.5%
Figures 2.23
Ra
infa
ll (i
nch
es)
Exceedance Probability
HERNANDEZ 7SE 1-day SCVWD 3-day SCVWD 5-day SCVWD 1-day 3-day 5-day

70% 50% 10% 1%0
1
2
3
4
5
6
7
8
9
10
0.5%
Figure 2.24
Ra
infa
ll (
inch
es)
Exceedance Probability
HOLLISTER 2 1-day SCVWD 3-day SCVWD 5-day SCVWD 1-day 3-day 5-day
70% 50% 10% 1%0
1
2
3
4
5
6
7
8
9
10
0.5%
Figure 2.25
Ra
infa
ll (i
nch
es)
Exceedance Probability
SAN BENITO 1-day SCVWD 3-day SCVWD 5-day SCVWD 1-day 3-day 5-day

70% 50% 10% 1%0
1
2
3
4
5
6
7
8
9
10
0.5%
Figure 2.26
Ra
infa
ll (i
nch
es)
Exceedance Probability
HOLLISTER 9ENE 1-day SCVWD 3-day SCVWD 5-day SCVWD 1-day 3-day 5-day

70% 50% 10% 1%0
1
2
3
4
5
6
7
8
9
10
0.5%
Figure 2.27
Ra
infa
ll (i
nch
es)
Exceedance Probability
GILROY 8NE 1-day SCVWD 3-day SCVWD 5-day SCVWD 1-day 3-day 5-day

70% 50% 10% 1%0
1
2
3
4
5
6
7
8
9
10
0.5%
Figure 2.28
Ra
infa
ll (i
nch
es)
Exceedance Probability
SUNSET STATE BEACH 1-day SCVWD 3-day SCVWD 5-day SCVWD 1-day 3-day 5-day

72-Hour Rainfall Patterns Normalized to 72-Hour Depth
Figure 2.30