
Technical Guidance - Greenhouse Gas Protocol · Technical Guidance for Calculating Scope 3...
182
Technical Guidance for Calculating Scope 3 Emissions Supplement to the Corporate Value Chain (Scope 3) Accounting & Reporting Standard ness travel investments (version 1.0)
Transcript of Technical Guidance - Greenhouse Gas Protocol · Technical Guidance for Calculating Scope 3...
Technical Guidance for Calculating Scope 3 Emissions
Supplement to the Corporate Value Chain (Scope 3)Accounting & Reporting Standard
CO 2
CH 4
SF 6
N 2O
HFCs
PFCs
purchase
d ele
ctric
ity, s
team
,
heating &
coolin
g for o
wn use
purchase
d
goods and
serv
ices
capita
l goods
fuel a
nd
energy r
elate
d
activi
ties
transp
ortatio
n
and d
istrib
ution
waste
generate
d in
operatio
nsbusin
ess
trav
el
transp
ortatio
n
and d
istrib
ution
proce
ssin
g of
sold
pro
ducts
use o
f sold
product
s
end-of-l
ife
treat
ment o
f
sold
pro
ducts
lease
d assets
franch
ises
emplo
yee
com
mutin
g
lease
d assets
inve
stm
ents
com
pany
facil
ities
com
pany
vehicl
es
(version 1.0)
This document was developed in partnership with the Carbon Trust.
GHG Protocol and Carbon Trust TeamMartin Barrow, Carbon Trust
Benedict Buckley, World Resources Institute
Tom Caldicott, Carbon Trust
Tom Cumberlege, Carbon Trust
John Hsu, Carbon Trust
Scott Kaufman, Carbon Trust
Kevin Ramm, Carbon Trust
David Rich, World Resources Institute
Will Temple-Smith, Carbon Trust
World Resources Institute ContributorsCynthia Cummis, World Resources Institute
Laura Draucker, World Resources Institute
Sofia Khan, World Resources Institute
Janet Ranganathan, World Resources Institute
Mary Sotos, World Resources Institute
Copyright © World Resources Institute & World Business Council for Sustainable Development, 2013

Technical Guidance for Calculating Scope 3 Emissions [03]
Acknowledgments
The GHG Protocol is grateful to the following people and organizations
for providing written comments on an earlier draft of this document:
Gorm Kjærbøll, AB Electrolux
Katrina Destree Cochran, Alcatel-Lucent
Isabel Bodlak, Allianz SE
Arturo Cepeda, Artequim.com Ltd
George Vergoulas, Arup
Nicola Paczkowski, BASF SE
Will Schreiber, Best Food Forward
Ricardo Teixeira and Sara Pax, Bluehorse Associates
Marshall Chase, BSR Clean Cargo Working Group
Frances Way, Carbon Disclosure Project
Peggy Foran, The Climate Registry
Christopher Gleadle, The CMG Consultancy
Michael Van Brunt, Covanta Energy Corporation
Dr. Klaus Hufschlag and Patric Pütz, Deutsche Post DHL
Rob Rouse, The Dow Chemical Company
Dawn Rittenhouse, DuPont
Chris Brown and Bernhard Grünauer, E.ON AG
Corinne Reich-Weiser, Enviance
Daniel Hall, ForestEthics
Concepción Jiménez-González, GlaxoSmithKline
Thaddeus Owen, Herman Miller
Don Adams, Keystone Foods
Dr. John Andrews, Landcare Research
Maria Atkinson, Lend Lease Sustainability Solutions
Jordi Avelleneda and Mads Stensen, Maersk Line and Damco
David B. Goldstein, Natural Resources Defense Council
Johannes Partl and Duncan Noble, PE International and Five Winds International
Jorge Alberto Plauchu Alcantara, Plauchu Consultores
Nick Shufro, PricewaterhouseCoopers LLP
William Lau, SGS-CSTC Standards Technical Services Co., Ltd
Zoltán Hajdu, Soltub Ltd.
Erika Kloow, TetraPak
Yoshikazu Kato, The Japanese Gas Association
Yutaka Yoshida, Tokyo Gas Co., Ltd.
Alice Douglas, UK Department of Environment, Food and Rural Affairs (Defra)
Matt Clouse, John Sottong, and Jesse Miller, U.S. Environmental Protection Agency
Bryan Steverson, U.S. General Services Administration
Keith James, Waste & Resources Action Programme (WRAP)
Nisitha Dasanayake
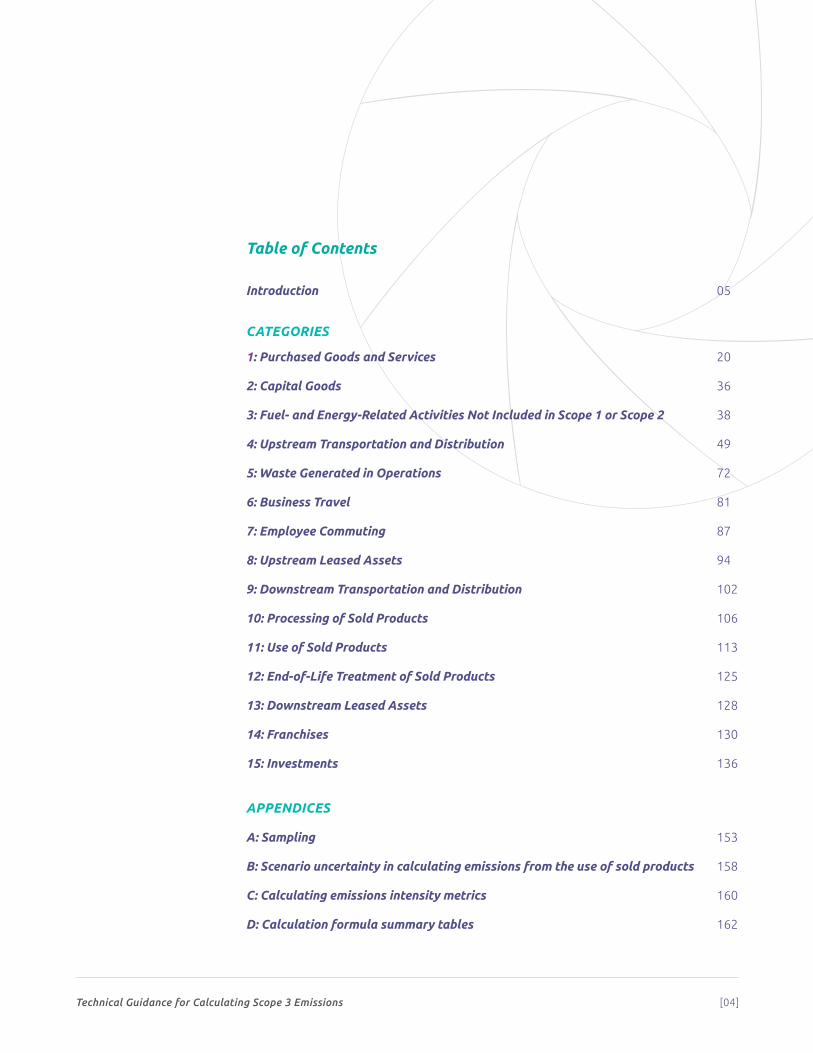
Table of Contents
Introduction 05
CATEGORIES
1: Purchased Goods and Services 20
2: Capital Goods 36
3: Fuel- and Energy-Related Activities Not Included in Scope 1 or Scope 2 38
4: Upstream Transportation and Distribution 49
5: Waste Generated in Operations 72
6: Business Travel 81
7: Employee Commuting 87
8: Upstream Leased Assets 94
9: Downstream Transportation and Distribution 102
10: Processing of Sold Products 106
11: Use of Sold Products 113
12: End-of-Life Treatment of Sold Products 125
13: Downstream Leased Assets 128
14: Franchises 130
15: Investments 136
APPENDICES
A: Sampling 153
B: Scenario uncertainty in calculating emissions from the use of sold products 158
C: Calculating emissions intensity metrics 160
D: Calculation formula summary tables 162
Technical Guidance for Calculating Scope 3 Emissions [04]

Technical Guidance for Calculating Scope 3 Emissions [05]
Introduction
An effective corporate climate change strategy requires a detailed under-
standing of a company’s greenhouse gas (GHG) emissions. Until recently,
companies have focused on emissions from their own operations under
scope 1 and scope 2 of the GHG Protocol. Increasingly companies understand the
need to also account for GHG emissions along their value chains and product
portfolios to comprehensively manage GHG-related risks and opportunities.
The GHG Protocol Corporate Value Chain (Scope 3) Accounting and Reporting
Standard (referred to as the Scope 3 Standard), the parent document to this
guidance, offers an internationally accepted method to enable GHG management
of companies’ value chains. This guidance document serves as a companion to
the Scope 3 Standard to offer companies practical guidance on calculating their
scope 3 emissions. It provides information not contained in the Scope 3 Standard,
such as methods for calculating GHG emissions for each of the 15 scope 3 categories,
data sources, and worked examples.
Please refer to the Scope 3 Standard for requirements and guidance related to
scope 3 accounting and reporting.
Introduction
Technical Guidance for Calculating Scope 3 Emissions [06]
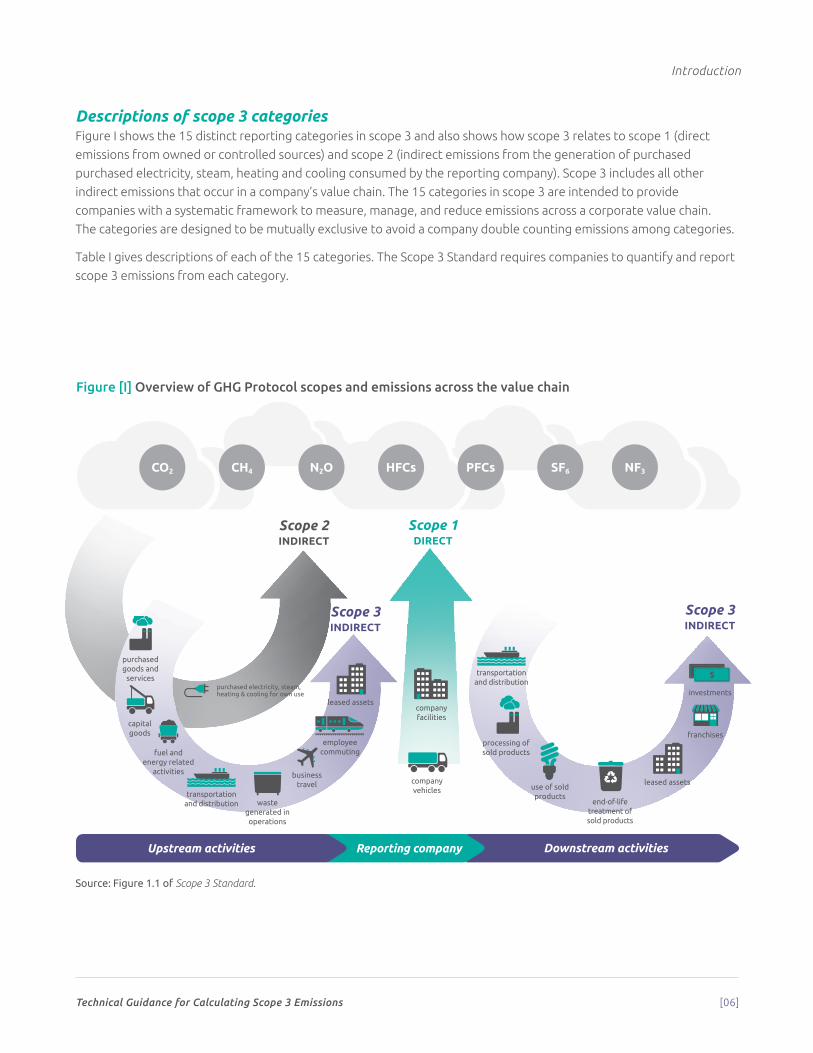
Figure [I] Overview of GHG Protocol scopes and emissions across the value chain
CO2 CH4 SF6N2O HFCs PFCs
purchased electricity, steam, heating & cooling for own use
purchased goods and
services
capital goods
fuel and energy related
activities
transportation and distribution
waste generated in operations
business travel
transportation and distribution
processing of sold products
use of sold products
end-of-life treatment of sold products
leased assets franchisesemployee commuting
leased assets investments
company facilities
company vehicles
NF3
Scope 3 INDIRECT
CO2 CH4 SF6N2O HFCs PFCs
purchased electricity, steam, heating & cooling for own use
purchased goods and
services
capital goods
fuel and energy related
activities
transportation and distribution
waste generated in operations
business travel
transportation and distribution
processing of sold products
use of sold products
end-of-life treatment of sold products
leased assets franchisesemployee commuting
leased assets investments
company facilities
company vehicles
Reporting companyUpstream activities Downstream activities
CO2 CH4 SF6N2O HFCs PFCs
purchased electricity, steam, heating & cooling for own use
purchased goods and
services
capital goods
fuel and energy related
activities
transportation and distribution
waste generated in operations
business travel
transportation and distribution
processing of sold products
use of sold products
end-of-life treatment of sold products
leased assets franchisesemployee commuting
leased assets investments
company facilities
company vehicles
Scope 1 DIRECT
Scope 2 INDIRECT
Scope 3 INDIRECT
CO2 CH4 SF6N2O HFCs PFCs
purchased electricity, steam, heating & cooling for own use
purchased goods and
services
capital goods
fuel and energy related
activities
transportation and distribution
waste generated in operations
business travel
transportation and distribution
processing of sold products
use of sold products
end-of-life treatment of sold products
leased assets franchisesemployee commuting
leased assets investments
company facilities
company vehicles
CO2 CH4 SF6N2O HFCs PFCs
purchased electricity, steam, heating & cooling for own use
purchased goods and
services
capital goods
fuel and energy related
activities
transportation and distribution
waste generated in operations
business travel
transportation and distribution
processing of sold products
use of sold products
end-of-life treatment of sold products
leased assets franchisesemployee commuting
leased assets investments
company facilities
company vehicles
CO2 CH4 SF6N2O HFCs PFCs
purchased electricity, steam, heating & cooling for own use
purchased goods and
services
capital goods
fuel and energy related
activities
transportation and distribution
waste generated in operations
business travel
transportation and distribution
processing of sold products
use of sold products
end-of-life treatment of sold products
leased assets franchisesemployee commuting
leased assets investments
company facilities
company vehicles
CO2 CH4 SF6N2O HFCs PFCs
purchased electricity, steam, heating & cooling for own use
purchased goods and
services
capital goods
fuel and energy related
activities
transportation and distribution
waste generated in operations
business travel
transportation and distribution
processing of sold products
use of sold products
end-of-life treatment of sold products
leased assets franchisesemployee commuting
leased assets investments
company facilities
company vehicles
CO2 CH4 SF6N2O HFCs PFCs
purchased electricity, steam, heating & cooling for own use
purchased goods and
services
capital goods
fuel and energy related
activities
transportation and distribution
waste generated in operations
business travel
transportation and distribution
processing of sold products
use of sold products
end-of-life treatment of sold products
leased assets franchisesemployee commuting
leased assets investments
company facilities
company vehicles
CO2 CH4 SF6N2O HFCs PFCs
purchased electricity, steam, heating & cooling for own use
purchased goods and
services
capital goods
fuel and energy related
activities
transportation and distribution
waste generated in operations
business travel
transportation and distribution
processing of sold products
use of sold products
end-of-life treatment of sold products
leased assets franchisesemployee commuting
leased assets investments
company facilities
company vehicles
CO2 CH4 SF6N2O HFCs PFCs
purchased electricity, steam, heating & cooling for own use
purchased goods and
services
capital goods
fuel and energy related
activities
transportation and distribution
waste generated in operations
business travel
transportation and distribution
processing of sold products
use of sold products
end-of-life treatment of sold products
leased assets franchisesemployee commuting
leased assets investments
company facilities
company vehicles
Source: Figure 1.1 of Scope 3 Standard.
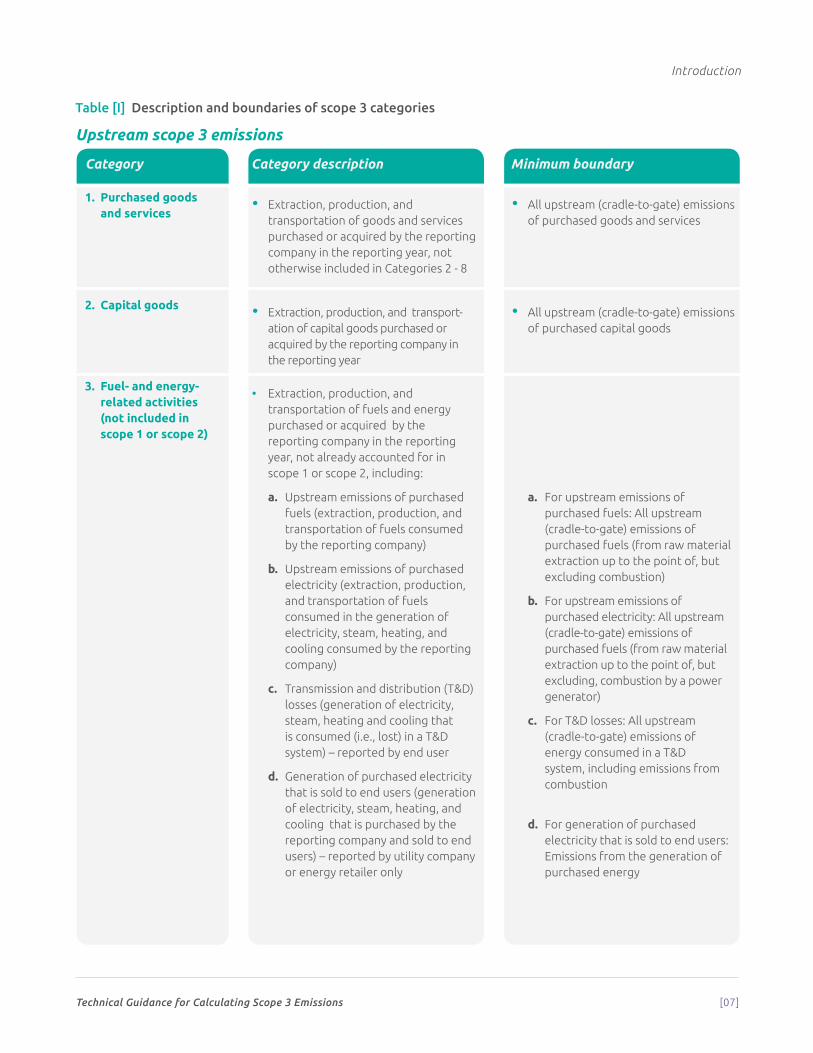
Descriptions of scope 3 categoriesFigure I shows the 15 distinct reporting categories in scope 3 and also shows how scope 3 relates to scope 1 (direct
emissions from owned or controlled sources) and scope 2 (indirect emissions from the generation of purchased
purchased electricity, steam, heating and cooling consumed by the reporting company). Scope 3 includes all other
indirect emissions that occur in a company’s value chain. The 15 categories in scope 3 are intended to provide
companies with a systematic framework to measure, manage, and reduce emissions across a corporate value chain.
The categories are designed to be mutually exclusive to avoid a company double counting emissions among categories.
Table I gives descriptions of each of the 15 categories. The Scope 3 Standard requires companies to quantify and report
scope 3 emissions from each category.
Introduction
Technical Guidance for Calculating Scope 3 Emissions [07]
Category Category description Minimum boundary
1. Purchased goods and services
• Extraction, production, and transportation of goods and services purchased or acquired by the reporting company in the reporting year, not otherwise included in Categories 2 - 8
• All upstream (cradle-to-gate) emissions of purchased goods and services
2. Capital goods • Extraction, production, and transport-ation of capital goods purchased or acquired by the reporting company in the reporting year
• All upstream (cradle-to-gate) emissions of purchased capital goods
3. Fuel- and energy- related activities (not included in scope 1 or scope 2)
• Extraction, production, and transportation of fuels and energy purchased or acquired by the reporting company in the reporting year, not already accounted for in scope 1 or scope 2, including:
a. Upstream emissions of purchased fuels (extraction, production, and transportation of fuels consumed by the reporting company)
b. Upstream emissions of purchased electricity (extraction, production, and transportation of fuels consumed in the generation of electricity, steam, heating, and cooling consumed by the reporting company)
c. Transmission and distribution (T&D) losses (generation of electricity, steam, heating and cooling that is consumed (i.e., lost) in a T&D system) – reported by end user
d. Generation of purchased electricity that is sold to end users (generation of electricity, steam, heating, and cooling that is purchased by the reporting company and sold to end users) – reported by utility company or energy retailer only
a. For upstream emissions of purchased fuels: All upstream (cradle-to-gate) emissions of purchased fuels (from raw material extraction up to the point of, but excluding combustion)
b. For upstream emissions of purchased electricity: All upstream (cradle-to-gate) emissions of purchased fuels (from raw material extraction up to the point of, but excluding, combustion by a power generator)
c. For T&D losses: All upstream (cradle-to-gate) emissions of energy consumed in a T&D system, including emissions from combustion
d. For generation of purchased electricity that is sold to end users: Emissions from the generation of purchased energy
Upstream scope 3 emissions
Table [I] Description and boundaries of scope 3 categories
Introduction
Technical Guidance for Calculating Scope 3 Emissions [08]
Category Category description Minimum boundary
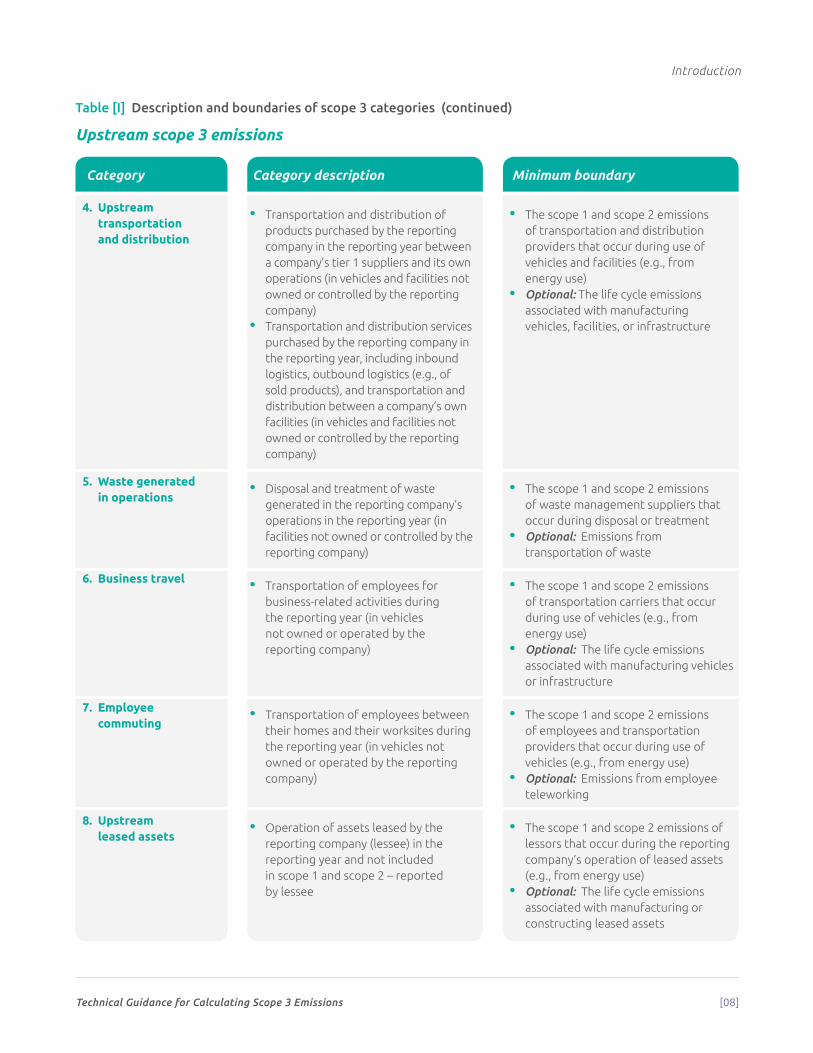
4. Upstream transportation and distribution
• Transportation and distribution of products purchased by the reporting company in the reporting year between a company’s tier 1 suppliers and its own operations (in vehicles and facilities not owned or controlled by the reporting company)
• Transportation and distribution services purchased by the reporting company in the reporting year, including inbound logistics, outbound logistics (e.g., of sold products), and transportation and distribution between a company’s own facilities (in vehicles and facilities not owned or controlled by the reporting company)
• The scope 1 and scope 2 emissions of transportation and distribution providers that occur during use of vehicles and facilities (e.g., from energy use)
• Optional: The life cycle emissions associated with manufacturing vehicles, facilities, or infrastructure
5. Waste generated in operations
• Disposal and treatment of waste generated in the reporting company’s operations in the reporting year (in facilities not owned or controlled by the reporting company)
• The scope 1 and scope 2 emissions of waste management suppliers that occur during disposal or treatment
• Optional: Emissions from transportation of waste
6. Business travel • Transportation of employees for business-related activities during the reporting year (in vehicles not owned or operated by the reporting company)
• The scope 1 and scope 2 emissions of transportation carriers that occur during use of vehicles (e.g., from energy use)
• Optional: The life cycle emissions associated with manufacturing vehicles or infrastructure
7. Employee commuting
• Transportation of employees between their homes and their worksites during the reporting year (in vehicles not owned or operated by the reporting company)
• The scope 1 and scope 2 emissions of employees and transportation providers that occur during use of vehicles (e.g., from energy use)
• Optional: Emissions from employee teleworking
8. Upstream leased assets
• Operation of assets leased by the reporting company (lessee) in the reporting year and not included in scope 1 and scope 2 – reported by lessee
• The scope 1 and scope 2 emissions of lessors that occur during the reporting company’s operation of leased assets (e.g., from energy use)
• Optional: The life cycle emissions associated with manufacturing or constructing leased assets
Upstream scope 3 emissions
Table [I] Description and boundaries of scope 3 categories (continued)
Introduction
Technical Guidance for Calculating Scope 3 Emissions [09]
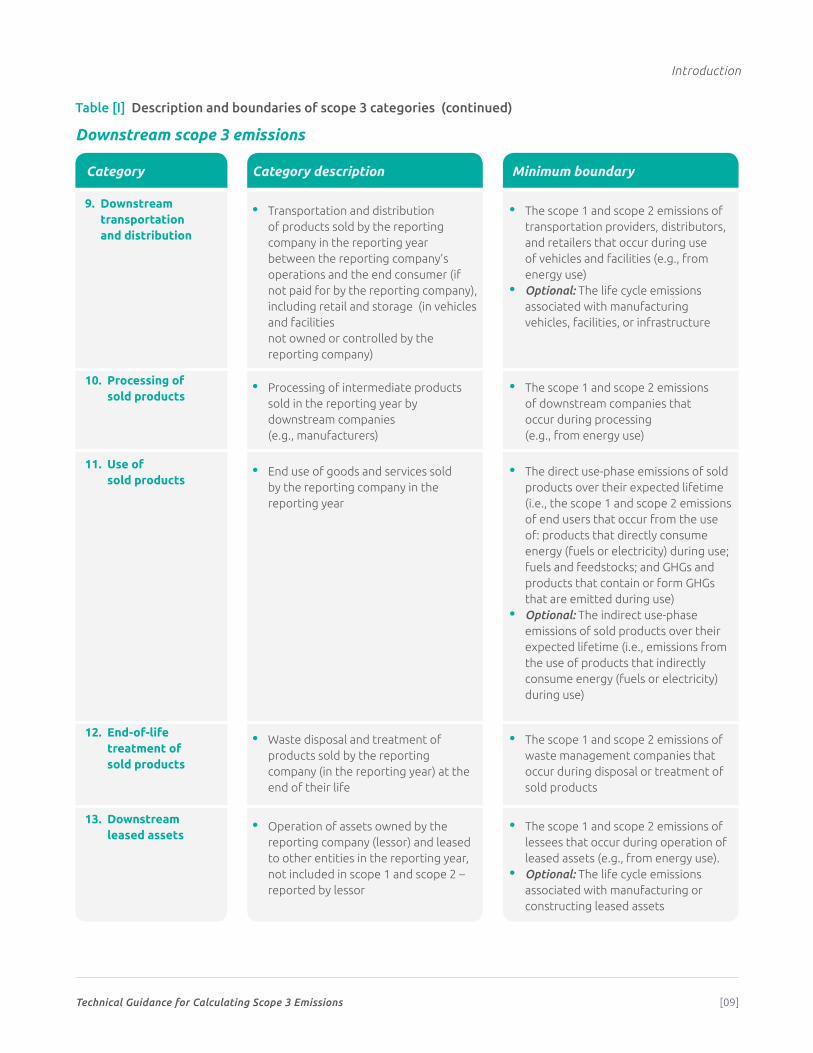
Downstream scope 3 emissions
Table [I] Description and boundaries of scope 3 categories (continued)
Category Category description Minimum boundary
9. Downstream transportation and distribution
• Transportation and distribution of products sold by the reporting company in the reporting year between the reporting company’s operations and the end consumer (if not paid for by the reporting company), including retail and storage (in vehicles and facilities not owned or controlled by the reporting company)
• The scope 1 and scope 2 emissions of transportation providers, distributors, and retailers that occur during use of vehicles and facilities (e.g., from energy use)
• Optional: The life cycle emissions associated with manufacturing vehicles, facilities, or infrastructure
10. Processing of sold products
• Processing of intermediate products sold in the reporting year by downstream companies (e.g., manufacturers)
• The scope 1 and scope 2 emissions of downstream companies that occur during processing (e.g., from energy use)
11. Use of sold products
• End use of goods and services sold by the reporting company in the reporting year
• The direct use-phase emissions of sold products over their expected lifetime (i.e., the scope 1 and scope 2 emissions of end users that occur from the use of: products that directly consume energy (fuels or electricity) during use; fuels and feedstocks; and GHGs and products that contain or form GHGs that are emitted during use)
• Optional: The indirect use-phase emissions of sold products over their expected lifetime (i.e., emissions from the use of products that indirectly consume energy (fuels or electricity) during use)
12. End-of-life treatment of sold products
• Waste disposal and treatment of products sold by the reporting company (in the reporting year) at the end of their life
• The scope 1 and scope 2 emissions of waste management companies that occur during disposal or treatment of sold products
13. Downstream leased assets
• Operation of assets owned by the reporting company (lessor) and leased to other entities in the reporting year, not included in scope 1 and scope 2 – reported by lessor
• The scope 1 and scope 2 emissions of lessees that occur during operation of leased assets (e.g., from energy use).
• Optional: The life cycle emissions associated with manufacturing or constructing leased assets
Introduction
Technical Guidance for Calculating Scope 3 Emissions [10]
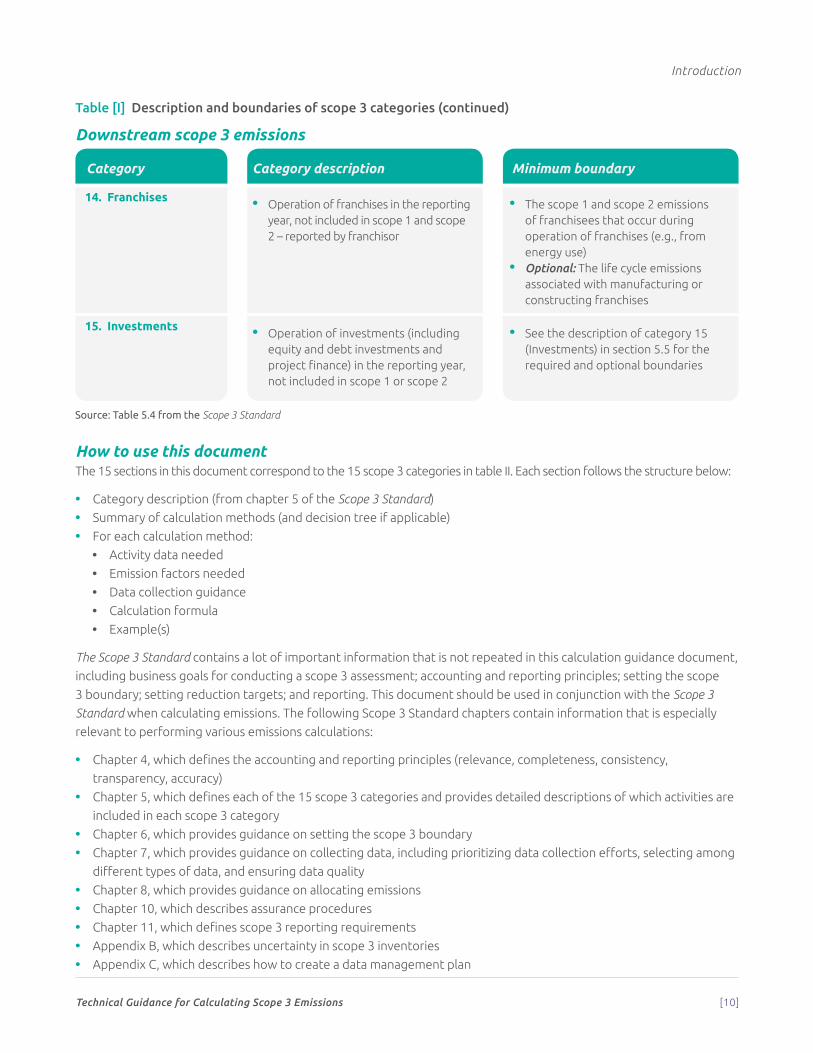
Downstream scope 3 emissions
Table [I] Description and boundaries of scope 3 categories (continued)
Category Category description Minimum boundary
14. Franchises • Operation of franchises in the reporting year, not included in scope 1 and scope 2 – reported by franchisor
• The scope 1 and scope 2 emissions of franchisees that occur during operation of franchises (e.g., from energy use)
• Optional: The life cycle emissions associated with manufacturing or constructing franchises
15. Investments • Operation of investments (including equity and debt investments and project finance) in the reporting year, not included in scope 1 or scope 2
• See the description of category 15 (Investments) in section 5.5 for the required and optional boundaries
How to use this documentThe 15 sections in this document correspond to the 15 scope 3 categories in table II. Each section follows the structure below:
• Category description (from chapter 5 of the Scope 3 Standard)
• Summary of calculation methods (and decision tree if applicable)
• For each calculation method:
• Activity data needed
• Emission factors needed
• Data collection guidance
• Calculation formula
• Example(s)
The Scope 3 Standard contains a lot of important information that is not repeated in this calculation guidance document,
including business goals for conducting a scope 3 assessment; accounting and reporting principles; setting the scope
3 boundary; setting reduction targets; and reporting. This document should be used in conjunction with the Scope 3
Standard when calculating emissions. The following Scope 3 Standard chapters contain information that is especially
relevant to performing various emissions calculations:
• Chapter 4, which defines the accounting and reporting principles (relevance, completeness, consistency,
transparency, accuracy)
• Chapter 5, which defines each of the 15 scope 3 categories and provides detailed descriptions of which activities are
included in each scope 3 category
• Chapter 6, which provides guidance on setting the scope 3 boundary
• Chapter 7, which provides guidance on collecting data, including prioritizing data collection efforts, selecting among
different types of data, and ensuring data quality
• Chapter 8, which provides guidance on allocating emissions
• Chapter 10, which describes assurance procedures
• Chapter 11, which defines scope 3 reporting requirements
• Appendix B, which describes uncertainty in scope 3 inventories
• Appendix C, which describes how to create a data management plan
Source: Table 5.4 from the Scope 3 Standard
Technical Guidance for Calculating Scope 3 Emissions [11]
Introduction
Selecting calculation methodsFor most scope 3 categories, this document offers multiple calculation methods. Within each section, the calculation
methods are ranked in order of specificity,1 from most to least specific to a company’s actual activities. In general, more
specific methods yield higher quality scope 3 emissions data whereas less specific methods yield lower quality scope
3 emissions data. However, the more specific methods are often more time and labor intensive. The best method for
each category depends on factors described below.
Companies should select calculation methods for each scope 3 activity within a category based on the following criteria:
• The relative size of the emissions from the scope 3 activity
• The company’s business goals (see chapter 2 of the Scope 3 Standard)
• Data availability
• Data quality
• The cost and effort required to apply each method
• Other criteria identified by the company.
Companies should select calculation methods that ensure that the inventory appropriately reflects the GHG emissions
of the activities and serves the decision-making needs of users, both internal and external to the company.
Note that each scope 3 category may contain multiple activities (for example air travel and road travel could be
two different activities within category 6, Business travel). If appropriate, different calculation methods can be
used to calculate emissions from different activities within a category. This guide uses the term “should” to indicate
recommendations for calculations.
Companies are required to report a description of the methodologies used to calculate emissions for each scope 3
category (see chapter 9 of the Scope 3 Standard).
Screening to prioritize data collectionThe Scope 3 Standard recommends that companies identify which scope 3 activities are expected to have the most
significant GHG emissions, offer the most significant GHG reduction opportunities, and are most relevant to the
company’s business goals. Companies should begin by conducting a screening process, using less specific data, to
determine the size of GHG emissions in each of the 15 categories. Then each category can be examined to determine
whether to further refine its emission estimates.
This document offers guidance on how to decide which categories require a more precise, and often more labor-intensive,
method of data collection, and which might be adequately served by a less precise method. In most cases, the categories
that generate the largest amount of emissions should receive the most precise data collection treatment, however,
some smaller categories that are important to customers or employees may benefit from more precise treatment as
well. Categories most relevant to the company’s business goals may also receive more attention. The business goals most
frequently cited by companies as reasons for developing a scope 3 inventory were to: (1) identify and understand the risks
and opportunities associated with value chain emissions; (2) identify GHG reduction opportunities, set reduction targets,
and track performance; and (3) engage value chain partners in GHG management. See chapter 2 of the Scope 3 Standard.
1 If a calculation method is specific to a company’s activity, the calculation is based on data relating directly to the particular activity in
question, such as data collected from a transport provider relating to journeys carried out. In contrast, less specific methods use data that
does not directly relate to the activity, such as industry average emission factors.
Technical Guidance for Calculating Scope 3 Emissions [12]
Introduction
Collecting higher quality data for priority activities allows companies to focus resources on the most significant GHG
emissions in the value chain, more effectively set reduction targets, and track and demonstrate GHG reductions over time.
As a result of the screening, a company might decide that, in addition to using more precise data for activities with the
most emissions, it will seek higher quality data for activities that present the most significant risks and opportunities in
the value chain, and for activities where more accurate data can be easily obtained. Conversely, it may choose to rely
on relatively less accurate data for activities that are expected to have insignificant emissions or where accurate data is
difficult to obtain.
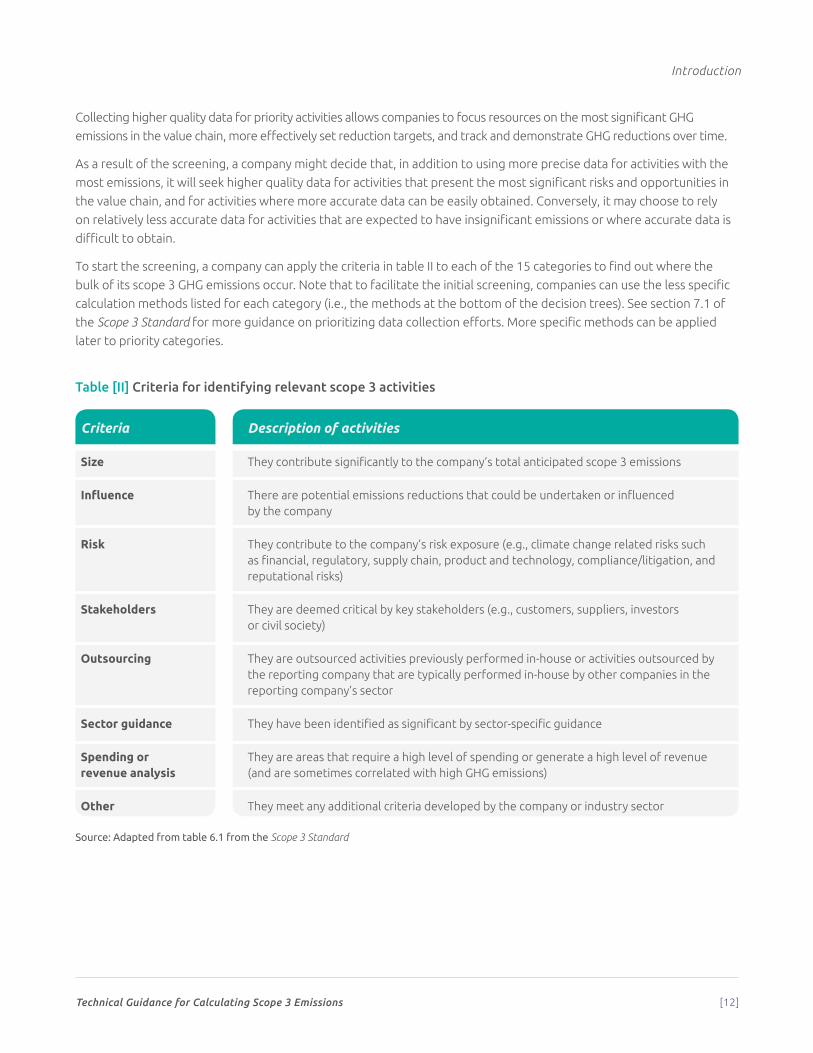
To start the screening, a company can apply the criteria in table II to each of the 15 categories to find out where the
bulk of its scope 3 GHG emissions occur. Note that to facilitate the initial screening, companies can use the less specific
calculation methods listed for each category (i.e., the methods at the bottom of the decision trees). See section 7.1 of
the Scope 3 Standard for more guidance on prioritizing data collection efforts. More specific methods can be applied
later to priority categories.
Table [II] Criteria for identifying relevant scope 3 activities
Criteria Description of activities
Size They contribute significantly to the company’s total anticipated scope 3 emissions
Influence There are potential emissions reductions that could be undertaken or influencedby the company
Risk They contribute to the company’s risk exposure (e.g., climate change related risks such as financial, regulatory, supply chain, product and technology, compliance/litigation, and reputational risks)
Stakeholders They are deemed critical by key stakeholders (e.g., customers, suppliers, investors or civil society)
Outsourcing They are outsourced activities previously performed in-house or activities outsourced by the reporting company that are typically performed in-house by other companies in the reporting company’s sector
Sector guidance They have been identified as significant by sector-specific guidance
Spending or revenue analysis
They are areas that require a high level of spending or generate a high level of revenue (and are sometimes correlated with high GHG emissions)
Other They meet any additional criteria developed by the company or industry sector
Source: Adapted from table 6.1 from the Scope 3 Standard
Technical Guidance for Calculating Scope 3 Emissions [13]
Introduction
Using a combination of calculation methodsCompanies may use a combination of calculation methods for various scope 3 categories throughout the inventory,
as well as for various scope 3 activities within each scope 3 category. For example, within each scope 3 category, a
company may use more specific methods for the activities that contribute most to emissions and less specific methods
for the activities that contribute least to emissions.
Companies should take practical approaches to reduce costs and complexity without overly compromising quality.
These may include:
• Applying more accurate data/calculations for large contributors
• Applying less accurate data/calculations for small contributors
• Grouping or combining similar activity data (e.g., goods and services)
• Obtaining data from representative samples and extrapolating the results to the whole
• Using proxy techniques.
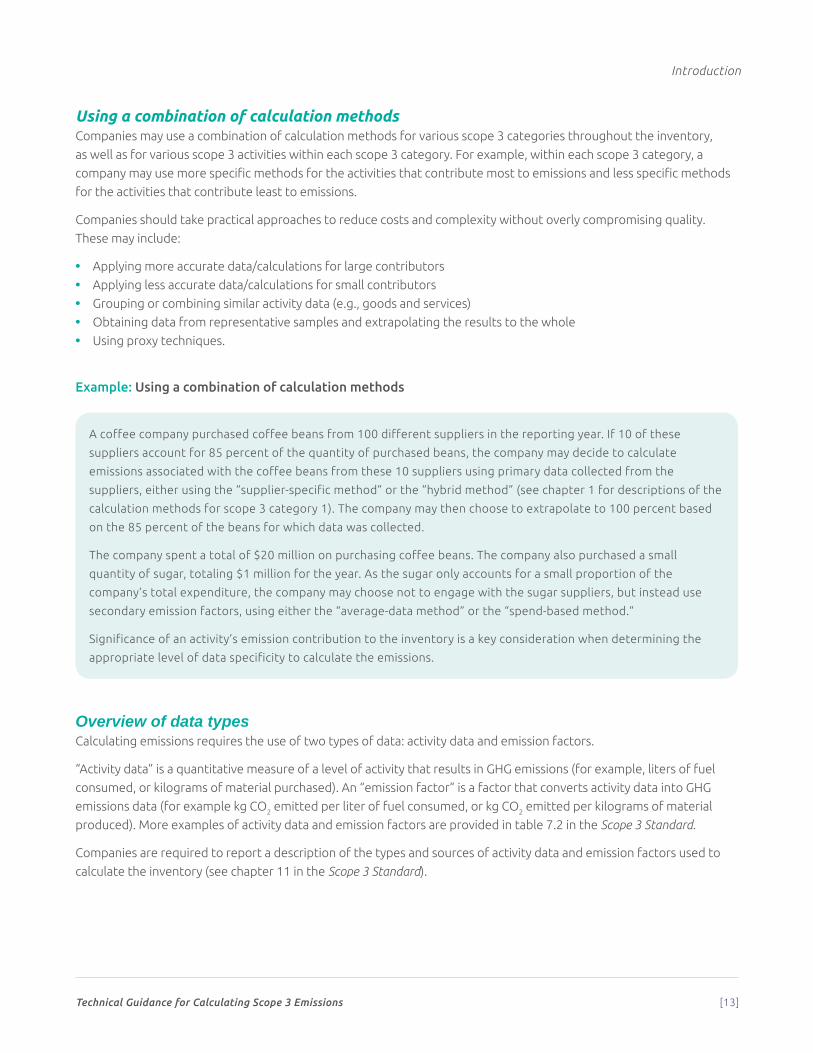
Example: Using a combination of calculation methods
A coffee company purchased coffee beans from 100 different suppliers in the reporting year. If 10 of these
suppliers account for 85 percent of the quantity of purchased beans, the company may decide to calculate
emissions associated with the coffee beans from these 10 suppliers using primary data collected from the
suppliers, either using the “supplier-specific method” or the “hybrid method” (see chapter 1 for descriptions of the
calculation methods for scope 3 category 1). The company may then choose to extrapolate to 100 percent based
on the 85 percent of the beans for which data was collected.
The company spent a total of $20 million on purchasing coffee beans. The company also purchased a small
quantity of sugar, totaling $1 million for the year. As the sugar only accounts for a small proportion of the
company’s total expenditure, the company may choose not to engage with the sugar suppliers, but instead use
secondary emission factors, using either the “average-data method” or the “spend-based method.”
Significance of an activity’s emission contribution to the inventory is a key consideration when determining the
appropriate level of data specificity to calculate the emissions.
Overview of data typesCalculating emissions requires the use of two types of data: activity data and emission factors.
“Activity data” is a quantitative measure of a level of activity that results in GHG emissions (for example, liters of fuel
consumed, or kilograms of material purchased). An “emission factor” is a factor that converts activity data into GHG
emissions data (for example kg CO2 emitted per liter of fuel consumed, or kg CO2 emitted per kilograms of material
produced). More examples of activity data and emission factors are provided in table 7.2 in the Scope 3 Standard.
Companies are required to report a description of the types and sources of activity data and emission factors used to
calculate the inventory (see chapter 11 in the Scope 3 Standard).
Technical Guidance for Calculating Scope 3 Emissions [14]
Introduction
Material/product emission factors in scope 3 accountingTwo types of emission factors can be used for calculating emissions associated with a material or product:
• Life cycle emission factors, which include emissions that occur at every stage of a material/product’s life, from raw
material acquisition or generation of natural resource to end of life
• Cradle-to-gate (sometimes referred to as “upstream”) emission factors, which include all emissions that occur
in the life cycle of a material/product up to the point of sale by the producer.
In general, cradle-to-gate emission factors should be used to calculate emissions associated with goods or services (e.g.
category 1 (Purchased goods and services) and category 2 (Capital goods).
Energy emission factors in scope 3 accountingTwo types of emission factors are used to convert energy activity data into emissions data:
• Life cycle emission factors, which include not only the emissions that occur from combusting the fuel, but all other
emissions that occur in the life cycle of the fuel such as emissions from extraction, processing, and transportation
• Combustion emission factors, which include only the emissions that occur from combusting the fuel.
Companies should use life cycle emission factors to calculate scope 3 emissions related to fuels and energy consumed
in the reporting company’s value chain, except for category 3 (Fuel- and energy-related activities not included in scope
1 or scope 2). Combustion emission factors are used to calculate scope 1 emissions (in the case of fuels) and scope 2
emissions (in the case of electricity).
Two activities within scope 3 category 3 require special consideration when selecting emission factors:
• Upstream emissions of purchased fuels (i.e., extraction, production, and transportation of fuels consumed by the
reporting company)
• Upstream emissions of purchased electricity (i.e., extraction, production, and transportation of fuels consumed
in the generation of electricity, steam, heating, and cooling that is consumed by the reporting company).
To calculate emissions from these two activities, companies should use emission factors that include upstream
emissions (i.e., extraction, production, and transportation) but exclude emissions from combustion, since emissions
from combustion are accounted for in scope 1 (in the case of fuels), in scope 2 (in the case of electricity), and in a
separate memo item (in the case of direct CO2 emissions from combustion of biomass or biofuels). See Chapter 3 of the
Scope 3 Standard.
These emission factors that exclude combustion are referred to as “upstream emission factors,” since they include all
life cycle stages of the fuel up to but excluding the final stage – combustion.
Applicable greenhouse gases and global warming potential values For each of the 15 scope 3 categories, companies are required to calculate emissions of all the GHGs required by the
United Nations Framework Convention on Climate Change (UNFCCC)/Kyoto Protocol at the time the inventory is
being compiled. National reporting guidelines under the UNFCCC and the Kyoto Protocol require that specific GHGs
be included in national GHG emissions inventories. To remain consistent with national inventory practices, the GHG
Protocol requires that these same GHGs also be reported in corporate GHG emissions inventories. Originally, the
requirements of the UNFCCC/Kyoto Protocol, and therefore of the GHG Protocol, were limited to a set of six individual
GHGs or classes of GHGs: carbon dioxide (CO2), methane (CH4), nitrous oxide (N2O), hydrofluorocarbons (HFCs),
perfluorocarbons (PFCs), sulphur hexafluoride (SF6). However, changes to international accounting and reporting rules
under the UNFCCC/Kyoto Protocol now also require the reporting of another GHG, nitrogen trifluoride (NF3).
Technical Guidance for Calculating Scope 3 Emissions [15]
Introduction
As the Scope 3 Standard was released before NF3 was added to the list of GHGs covered by UNFCCC/Kyoto Protocol,
reporting NF3 was not originally included as a requirement in the Scope 3 Standard. However an amendment has been
published on the GHG Protocol website (http://www.ghgprotocol.org/) which supersedes the original requirements of
the Scope 3 Standard and it is now a requirement that NF3 be included.
In this document, carbon dioxide equivalent (CO2e) emissions represent emissions of all greenhouse gases, aggregated
and converted to units of CO2e using global warming potential (GWP) values.
GWP values describe the radiative forcing impact (or degree of harm to the atmosphere) of one unit of a given GHG
relative to one unit of carbon dioxide. GWP values convert GHG emissions data for non-CO2 gases into units of CO2e.
Companies may either use the Intergovernmental Panel on Climate Change (IPCC) GWP values agreed to by United
Nations Framework Convention on Climate Change (UNFCCC) or the most recent GWP values published by the IPCC.
GWP values should be based on a 100-year time horizon. See section 7.2 of the Scope 3 Standard for more information
on GWP values. Companies are required to disclose the source of GWP values used to calculate the inventory (see
chapter 11 of the Scope 3 Standard).
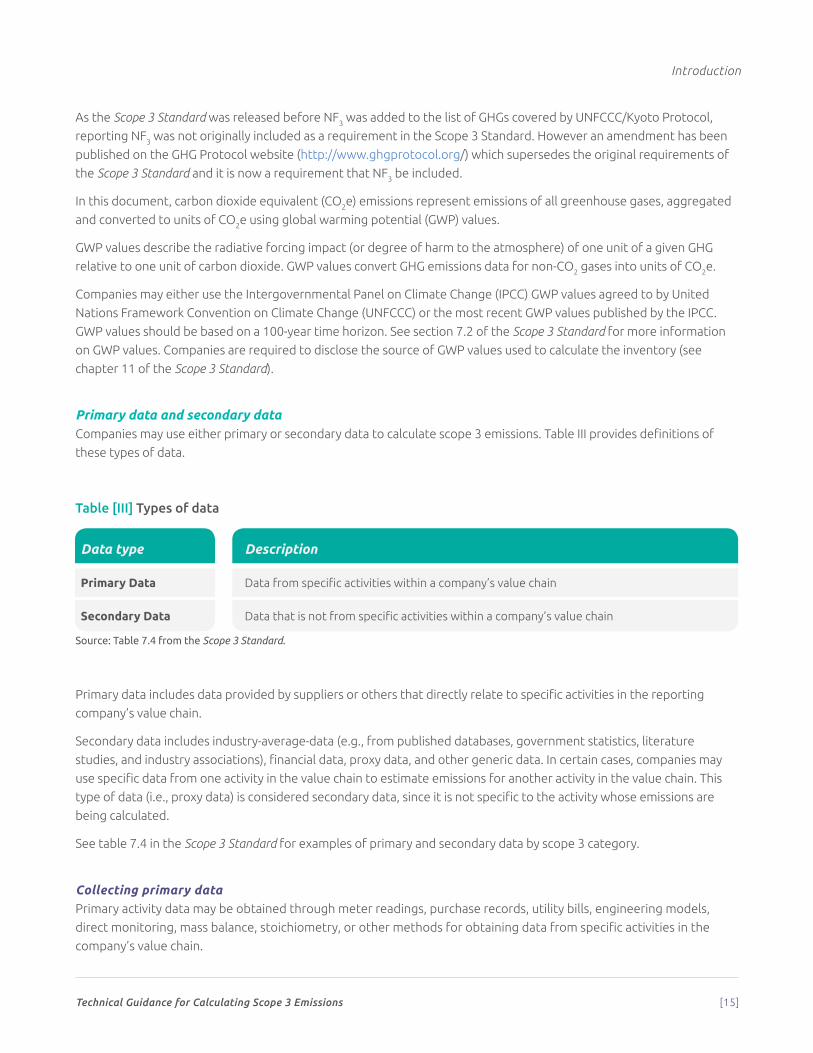
Primary data and secondary data Companies may use either primary or secondary data to calculate scope 3 emissions. Table III provides definitions of
these types of data.
Table [III] Types of data
Data type Description
Primary Data Data from specific activities within a company’s value chain
Secondary Data Data that is not from specific activities within a company’s value chain
Source: Table 7.4 from the Scope 3 Standard.
Primary data includes data provided by suppliers or others that directly relate to specific activities in the reporting
company’s value chain.
Secondary data includes industry-average-data (e.g., from published databases, government statistics, literature
studies, and industry associations), financial data, proxy data, and other generic data. In certain cases, companies may
use specific data from one activity in the value chain to estimate emissions for another activity in the value chain. This
type of data (i.e., proxy data) is considered secondary data, since it is not specific to the activity whose emissions are
being calculated.
See table 7.4 in the Scope 3 Standard for examples of primary and secondary data by scope 3 category.
Collecting primary dataPrimary activity data may be obtained through meter readings, purchase records, utility bills, engineering models,
direct monitoring, mass balance, stoichiometry, or other methods for obtaining data from specific activities in the
company’s value chain.
Technical Guidance for Calculating Scope 3 Emissions [16]
Introduction
If possible, companies should collect energy or emissions data from suppliers and other value chain partners to obtain
site-specific data for priority scope 3 categories and activities (see “Screening to prioritize data collection,” above, for
guidance on identifying priority categories). To do so, companies should identify relevant suppliers from which to seek
GHG data. Suppliers may include contract manufacturers, materials and parts suppliers, capital equipment suppliers,
fuel suppliers, third-party logistics providers, waste management companies, and other companies that provide goods
and services to the reporting company.
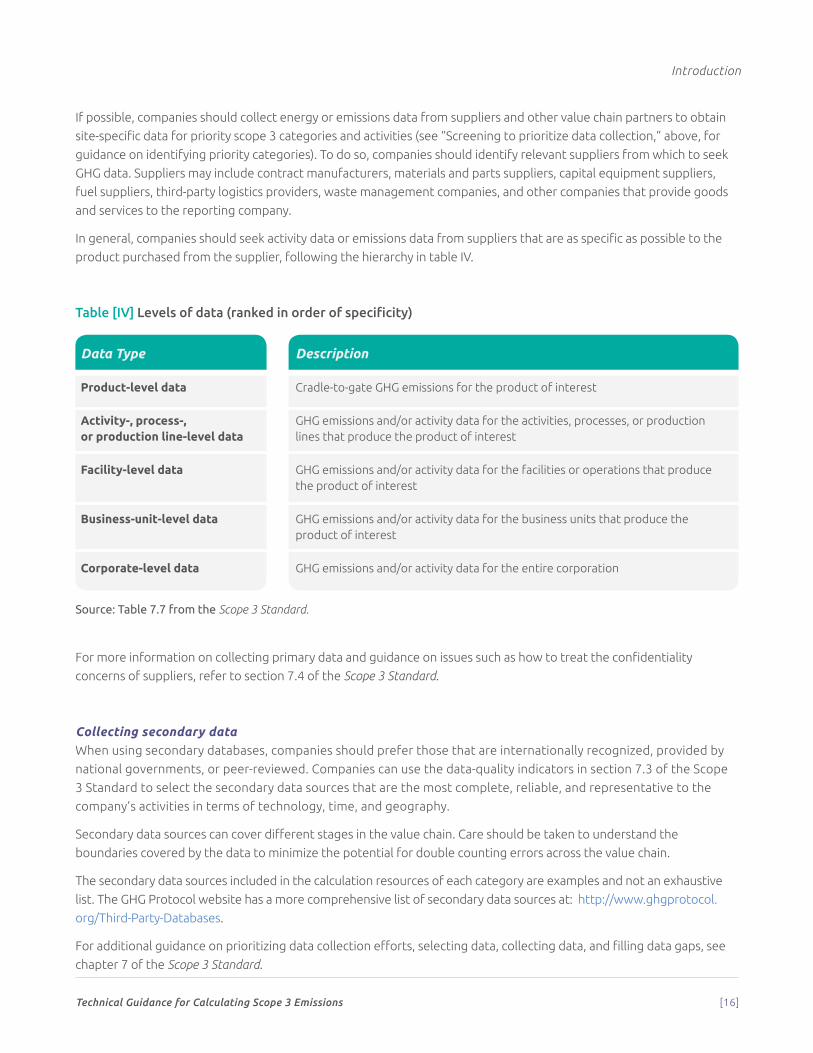
In general, companies should seek activity data or emissions data from suppliers that are as specific as possible to the
product purchased from the supplier, following the hierarchy in table IV.
Table [IV] Levels of data (ranked in order of specificity)
Data Type Description
Product-level data Cradle-to-gate GHG emissions for the product of interest
Activity-, process-, or production line-level data
GHG emissions and/or activity data for the activities, processes, or production lines that produce the product of interest
Facility-level data GHG emissions and/or activity data for the facilities or operations that produce the product of interest
Business-unit-level data GHG emissions and/or activity data for the business units that produce the product of interest
Corporate-level data GHG emissions and/or activity data for the entire corporation
Source: Table 7.7 from the Scope 3 Standard.
For more information on collecting primary data and guidance on issues such as how to treat the confidentiality
concerns of suppliers, refer to section 7.4 of the Scope 3 Standard.
Collecting secondary data When using secondary databases, companies should prefer those that are internationally recognized, provided by
national governments, or peer-reviewed. Companies can use the data-quality indicators in section 7.3 of the Scope
3 Standard to select the secondary data sources that are the most complete, reliable, and representative to the
company’s activities in terms of technology, time, and geography.
Secondary data sources can cover different stages in the value chain. Care should be taken to understand the
boundaries covered by the data to minimize the potential for double counting errors across the value chain.
The secondary data sources included in the calculation resources of each category are examples and not an exhaustive
list. The GHG Protocol website has a more comprehensive list of secondary data sources at: http://www.ghgprotocol.
org/Third-Party-Databases.
For additional guidance on prioritizing data collection efforts, selecting data, collecting data, and filling data gaps, see
chapter 7 of the Scope 3 Standard.
Technical Guidance for Calculating Scope 3 Emissions [17]
Introduction
Environmentally-extended input output (EEIO) data
Environmentally-extended input output (EEIO) models estimate energy use and/or GHG emissions resulting from the
production and upstream supply chain activities of different sectors and products in an economy. The resulting EEIO
emissions factors can be used to estimate cradle-to-gate GHG emissions for a given industry or product category. EEIO data
are particularly useful in screening emissions sources when prioritizing data collection efforts. EEIO models are derived by
allocating national GHG emissions to groups of finished products based on economic flows between industry sectors.
The output of EEIO models is typically a quantity of GHGs emitted per unit of revenue in a particular industry sector. For
example, an EEIO model may estimate that the sector “paper mills” emits 1,520 tonnes CO2e per $1 million revenue,
meaning that, on average, 1,520 tonnes of CO2e are emitted during all upstream supply chain activities associated with
generating $1 million revenue from that sector.
The advantages of EEIO data include:
• Comprehensive coverage of the entire economy (i.e., no emissions sources are excluded from the system boundary)
• Simplicity of method and application
• Time and cost savings as data requirements are less onerous than in a process-based approach.
The disadvantages of EEIO data include:
• Broad sector averages may not represent nuances of unique processes and products, especially for non-
homogenous sectors
• Assumption of linear attribution between monetary and environmental flows provides only indicative results (i.e.,
EEIO models cannot distinguish between products of different monetary value within a single sector)
• Lacks specificity and accuracy of process-based approaches
• Difficult to measure and demonstrate results of reduction efforts
• EEIO databases are generally limited to a specific geographic region, (e.g., United States) and are not available in
some world regions.
Process-based data
Process-based data is derived from assessing all the known energy and environmental inputs of a particular process
and calculating the direct emissions associated with the outputs of the process. It is particularly applicable for unique
processes and individual product level analysis.
The advantages of process-based data include:
• High level of specificity and focus
• Detailed analysis and possibility of unique insights to particular processes
• Straightforward concept.
The disadvantages of process based data include:
• Collection of data may be time, cost, and labor intensive
• Lack of comparability as the system boundary and the data are selected by the practitioner
• Data requirements may render large-scale, multi-product analysis impractical.
Technical Guidance for Calculating Scope 3 Emissions [18]
Introduction
Combining EEIO and process-based data
Companies may combine the top down EEIO approach with the bottom-up, process-based approach to leverage the
benefits of both approaches. For example, the upstream emissions of purchased goods could be calculated using an EEIO
approach, whereas downstream emissions from use and end-of-life could be calculated using a process-based approach.
Companies are required to report a description of the types and sources of data used to calculate emissions for each
scope 3 category (see chapter 11 of the Scope 3 Standard).
Using proxy data to fill data gaps
Companies should use the guidance in section 7.3 of the Scope 3 Standard, “Guidance for selecting data” to assess the
quality of available data. If data of sufficient quality are not available, companies may use proxy data to fill data gaps.
Proxy data is data from a similar activity that is used as a stand-in for the given activity. Proxy data can be extrapolated,
scaled up, or customized to be more representative of the given activity (e.g., partial data for an activity can be
extrapolated or scaled up to represent 100 percent of the activity).
If a large company has access to 80 out of 100 manufacturing facilities it can extrapolate this information to fill the gap.
It would first group the activity data by similar characteristics, such as facility type or location, then calculate an intensity
ratio for a group of facilities where data is available (e.g., quantity of emissions per unit of production output). This
figure can then be applied to the unknown facilities in that group.
Section 7.5 of the Scope 3 Standard “Guidance for collecting secondary data and filling data gaps” provides more
information on the use of proxy data and its advantages and disadvantages.
If data are unavailable for a large number of sites or if a company needs to collect a large quantity of data for a scope
3 category, but finds it impractical or impossible to collect data from each individual activity, the company may use
appropriate sampling techniques to extrapolate data from a representative sample of activities. See Appendix A for
guidance on sampling methods.
Improving data quality over timeCollecting data, assessing data quality, and improving data quality is an iterative process. When selecting data sources,
companies should first apply data quality indicators and assess data quality, then review the quality of the collected
data, using the same data quality assessment approach. In their initial years of scope 3 data collection, companies may
need to use data of relatively low quality due to limited availability. Over time, companies should seek to improve
the data quality of the inventory by replacing lower quality data with higher quality data as it becomes available. In
particular, companies should prioritize data quality improvement for activities that have:
• Relatively low data quality
• Relatively high emissions.
Companies are required to provide a description of the data quality of reported scope 3 emissions data to ensure
transparency and avoid misinterpretation of data (see chapter 11 of the Scope 3 Standard). Refer to section 7.3
for guidance on describing data quality; Appendix B for guidance on uncertainty; and section 9.3 for guidance on
recalculating base year emissions when making improvements in data quality over time.

Technical Guidance for Calculating Scope 3 Emissions [19]
Introduction
It is unlikely that all of a company’s relevant suppliers will be able to provide it with GHG inventory data. (See table 7.8
of the Scope 3 Standard for a list of challenges and guidance for collecting primary data from suppliers.) In such cases,
companies should encourage suppliers to develop GHG inventories in the future and may communicate their efforts to
encourage more suppliers to provide GHG emissions data in the public report.
If changes in data quality result in significant differences in emissions estimates, companies are required to recalculate
base year emissions applying the new data sources. Refer to page 106 of the Scope 3 Standard for guidance on base
year recalculations for improvements in data accuracy over time. Appendix C of the Scope 3 Standard also provides a
useful resource for developing a data management plan and improving data management.
GHG Protocol publications and toolsSeveral GHG publications and calculation tools offer help in calculating emissions from various scope 3 categories. In
particular, several cross-sector and sector-specific calculation tools available on the GHG Protocol website (http://www.
ghgprotocol.org/calculation-tools/all-tools) provide step-by-step guidance together with electronic worksheets to help
companies calculate GHG emissions from specific sources or sectors.
Technical Guidance for Calculating Scope 3 Emissions [20]
1
Category 1: Purchased Goods and ServicesCategory description
T his category includes all upstream (i.e., cradle-to-gate) emissions from the production
of products purchased or acquired by the reporting company in the reporting year.
Products include both goods (tangible products) and services (intangible products).
Category 1 includes emissions from all purchased goods and services not otherwise included in the other categories
of upstream scope 3 emissions (i.e., category 2 through category 8). Specific categories of upstream emissions are
separately reported in category 2 through category 8 to enhance the transparency and consistency of scope 3 reports.
Emissions from the transportation of purchased products from a tier one (direct) supplier to the reporting company (in
vehicles not owned or controlled by the reporting company) are accounted for in category 4 (Upstream transportation
and distribution).
Companies may find it useful to differentiate between purchases of production-related products (e.g., materials,
components, and parts) and non-production-related products (e.g., office furniture, office supplies, and IT support). This
distinction may be aligned with procurement practices and therefore may be a useful way to more efficiently organize
and collect data (see box 5.2 of the Scope 3 Standard).
Summary of methods for calculating emissions from purchased goods and servicesCompanies may use the methods listed below to calculate scope 3 emissions from purchased goods and services. The first
two methods – supplier-specific and hybrid – require the reporting company to collect data from the suppliers, whereas the
second two methods – average-data and spend-based – use secondary data (i.e. industry average data). These methods are
listed in order of how specific2 the calculation is to the individual supplier of a good or service. However, companies need
not always use the most specific method as a first preference (see figure 1.1 and box 1.1).
2 See Box 1.1 for further explanation of the data specificity and data accuracy
1
Technical Guidance for Calculating Scope 3 Emissions [21]
CATEGORY 1 Purchased Goods and Services
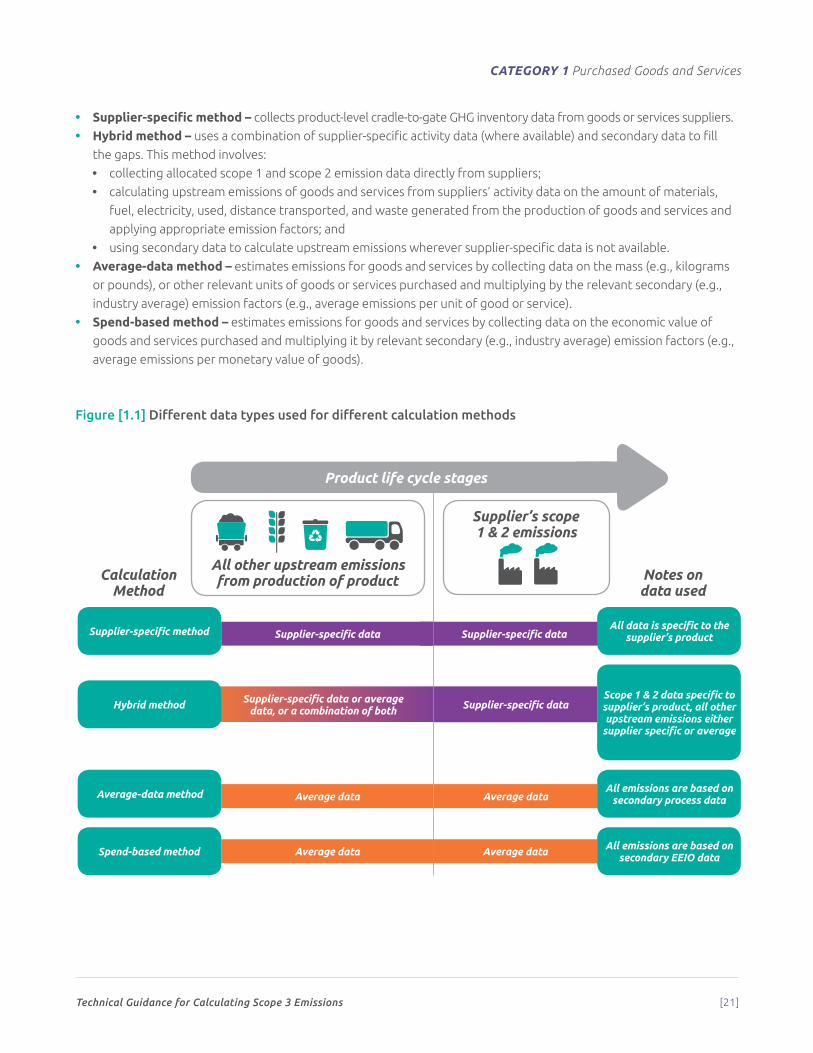
• Supplier-specific method – collects product-level cradle-to-gate GHG inventory data from goods or services suppliers.
• Hybrid method – uses a combination of supplier-specific activity data (where available) and secondary data to fill
the gaps. This method involves:
• collecting allocated scope 1 and scope 2 emission data directly from suppliers;
• calculating upstream emissions of goods and services from suppliers’ activity data on the amount of materials,
fuel, electricity, used, distance transported, and waste generated from the production of goods and services and
applying appropriate emission factors; and
• using secondary data to calculate upstream emissions wherever supplier-specific data is not available.
• Average-data method – estimates emissions for goods and services by collecting data on the mass (e.g., kilograms
or pounds), or other relevant units of goods or services purchased and multiplying by the relevant secondary (e.g.,
industry average) emission factors (e.g., average emissions per unit of good or service).
• Spend-based method – estimates emissions for goods and services by collecting data on the economic value of
goods and services purchased and multiplying it by relevant secondary (e.g., industry average) emission factors (e.g.,
average emissions per monetary value of goods).
Figure [1.1] Different data types used for different calculation methods
Supplier-specific data or average data, or a combination of both
Supplier-specific dataSupplier-specific data
Average dataAverage data
Average dataAverage data
All other upstream emissions from production of product
Supplier-specific method
Hybrid method
Average-data method
Spend-based method
All data is specific to the supplier’s product
Scope 1 & 2 data specific to supplier’s product, all other upstream emissions either
supplier specific or average
All emissions are based on secondary process data
All emissions are based on secondary EEIO data
Supplier-specific data
Supplier’s scope 1 & 2 emissions
Calculation Method
Notes on data used
1 2 3
4 5 6
7 8 9
10 11 12
13 14 15
16 17
1. wheat2. tree3. mountains4. glass bottle5. plastic bottle6. aluminium can7. factory8. lorry9. cloud10. recycling bin11. recycling bin (colours reversed)12. wind turbines13. chicken14. cow 115. cow 216. shop17. factory showing carbon emissions (carbon emissions are shown in orange)
Product life cycle stages
Technical Guidance for Calculating Scope 3 Emissions [22]
CATEGORY 1 Purchased Goods and Services
Collecting data directly from suppliers adds considerable time and cost burden to conducting a scope 3 inventory, so
companies should first carry out a screening (see Introduction, “Screening to prioritize data collection”) to prioritize
data collection and decide which calculation method is most appropriate to achieve their business goals.
Box [1.1] The difference between data specificity and data accuracy
Even though the supplier-specific and hybrid methods are more specific to the individual supplier than the average-data
and spend-based methods, they may not produce results that are a more accurate reflection of the product’s contribution
to the reporting company’s scope 3 emissions. In fact, data collected from a supplier may actually be less accurate than
industry-average data for a particular product. Accuracy derives from the granularity of the emissions data, the reliability
of the supplier’s data sources, and which, if any, allocation techniques were used. The need to allocate the supplier’s
emissions to the specific products it sells to the company can add a considerable degree of uncertainty, depending on the
allocation methods used (for more information on allocation, see chapter 8 of the Scope 3 Standard).
Figure 1.2 provides a decision tree to help companies determine the most appropriate calculation method for
estimating their category 1 emissions. Companies may use different calculation methods for different types of
purchased goods and services within category 1. For example, they can use more specific methods for categories of
goods and services that contribute the most to total emissions. The choice of calculation method depends on several
factors outlined in the Introduction, including the company’s business goals, the significance (relative to total emissions)
of goods and services within category 1, the availability of data, and the quality of available data. See sections 7.3 and
7.4 of the Scope 3 Standard for guidance on assessing data quality.
Technical Guidance for Calculating Scope 3 Emissions [23]
CATEGORY 1 Purchased Goods and Services
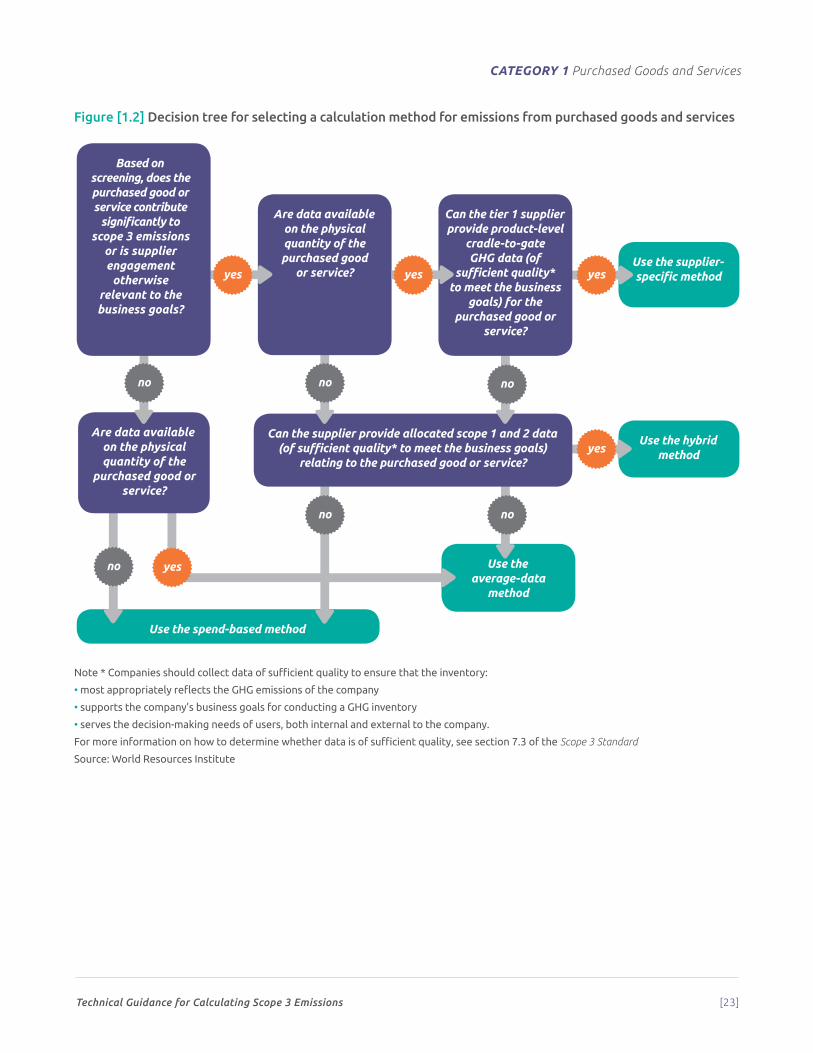
Figure [1.2] Decision tree for selecting a calculation method for emissions from purchased goods and services
Note * Companies should collect data of sufficient quality to ensure that the inventory:
• most appropriately reflects the GHG emissions of the company
• supports the company’s business goals for conducting a GHG inventory
• serves the decision-making needs of users, both internal and external to the company.
For more information on how to determine whether data is of sufficient quality, see section 7.3 of the Scope 3 Standard
Source: World Resources Institute
Use the average-data
method
Use the spend-based method
Use the hybrid method
Use the supplier-specific method
Can the supplier provide allocated scope 1 and 2 data (of sufficient quality* to meet the business goals)
relating to the purchased good or service?
Are data available on the physical quantity of the purchased good
or service?
Can the tier 1 supplier provide product-level
cradle-to-gate GHG data (of
sufficient quality* to meet the business
goals) for the purchased good or
service?
Are data available on the physical quantity of the
purchased good or service?
Based on screening, does the purchased good or service contribute
significantly to scope 3 emissions
or is supplier engagement
otherwise relevant to the business goals?
no no
no
no
no
no
yes
yes
yes yes
yes
Technical Guidance for Calculating Scope 3 Emissions [24]
CATEGORY 1 Purchased Goods and Services
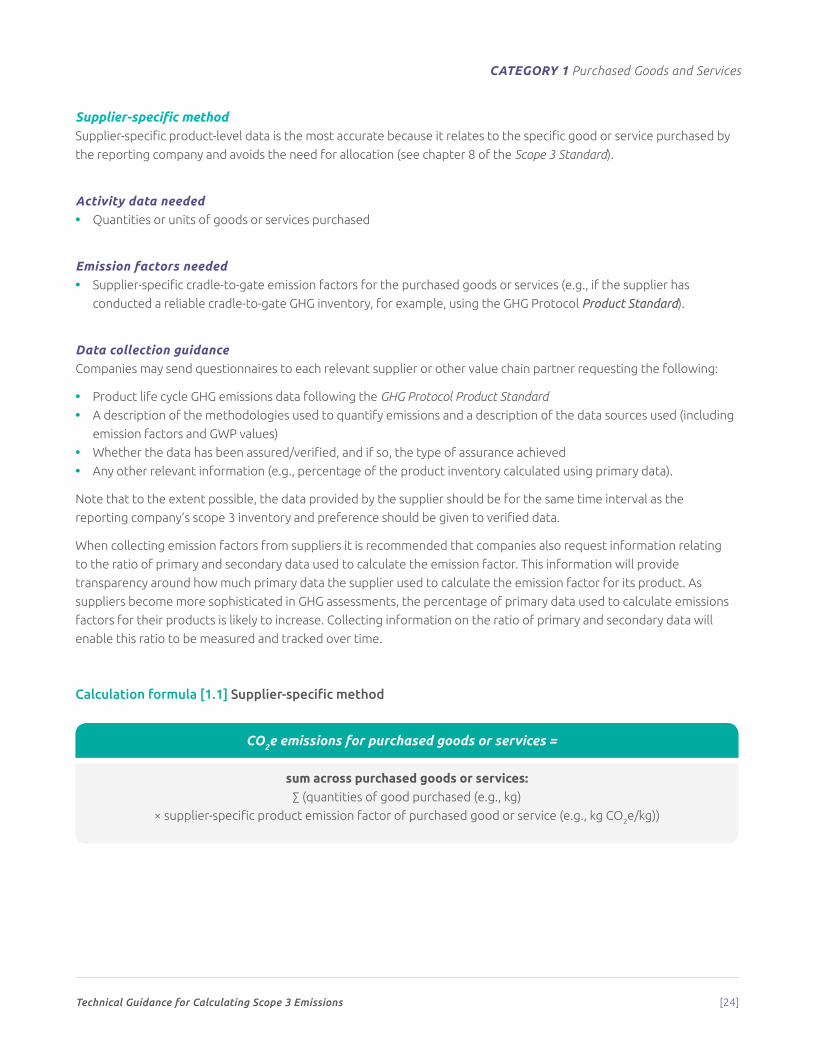
Supplier-specific methodSupplier-specific product-level data is the most accurate because it relates to the specific good or service purchased by
the reporting company and avoids the need for allocation (see chapter 8 of the Scope 3 Standard).
Activity data needed • Quantities or units of goods or services purchased
Emission factors needed • Supplier-specific cradle-to-gate emission factors for the purchased goods or services (e.g., if the supplier has
conducted a reliable cradle-to-gate GHG inventory, for example, using the GHG Protocol Product Standard).
Data collection guidanceCompanies may send questionnaires to each relevant supplier or other value chain partner requesting the following:
• Product life cycle GHG emissions data following the GHG Protocol Product Standard
• A description of the methodologies used to quantify emissions and a description of the data sources used (including
emission factors and GWP values)
• Whether the data has been assured/verified, and if so, the type of assurance achieved
• Any other relevant information (e.g., percentage of the product inventory calculated using primary data).
Note that to the extent possible, the data provided by the supplier should be for the same time interval as the
reporting company’s scope 3 inventory and preference should be given to verified data.
When collecting emission factors from suppliers it is recommended that companies also request information relating
to the ratio of primary and secondary data used to calculate the emission factor. This information will provide
transparency around how much primary data the supplier used to calculate the emission factor for its product. As
suppliers become more sophisticated in GHG assessments, the percentage of primary data used to calculate emissions
factors for their products is likely to increase. Collecting information on the ratio of primary and secondary data will
enable this ratio to be measured and tracked over time.
Calculation formula [1.1] Supplier-specific method
CO2e emissions for purchased goods or services =
sum across purchased goods or services:∑ (quantities of good purchased (e.g., kg)
× supplier-specific product emission factor of purchased good or service (e.g., kg CO2e/kg))
Technical Guidance for Calculating Scope 3 Emissions [25]
CATEGORY 1 Purchased Goods and Services
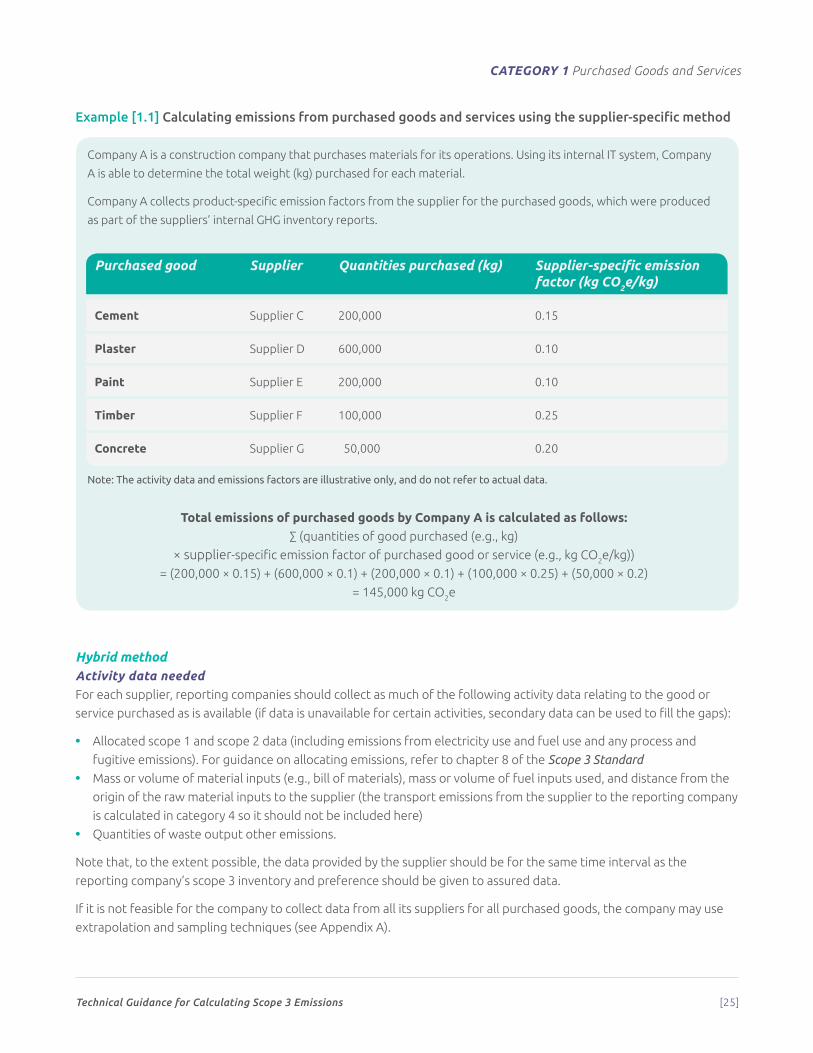
Example [1.1] Calculating emissions from purchased goods and services using the supplier-specific method
Company A is a construction company that purchases materials for its operations. Using its internal IT system, Company
A is able to determine the total weight (kg) purchased for each material.
Company A collects product-specific emission factors from the supplier for the purchased goods, which were produced
as part of the suppliers’ internal GHG inventory reports.
Note: The activity data and emissions factors are illustrative only, and do not refer to actual data.
Total emissions of purchased goods by Company A is calculated as follows:∑ (quantities of good purchased (e.g., kg)
× supplier-specific emission factor of purchased good or service (e.g., kg CO2e/kg))
= (200,000 × 0.15) + (600,000 × 0.1) + (200,000 × 0.1) + (100,000 × 0.25) + (50,000 × 0.2)
= 145,000 kg CO2e
Hybrid methodActivity data neededFor each supplier, reporting companies should collect as much of the following activity data relating to the good or
service purchased as is available (if data is unavailable for certain activities, secondary data can be used to fill the gaps):
• Allocated scope 1 and scope 2 data (including emissions from electricity use and fuel use and any process and
fugitive emissions). For guidance on allocating emissions, refer to chapter 8 of the Scope 3 Standard
• Mass or volume of material inputs (e.g., bill of materials), mass or volume of fuel inputs used, and distance from the
origin of the raw material inputs to the supplier (the transport emissions from the supplier to the reporting company
is calculated in category 4 so it should not be included here)
• Quantities of waste output other emissions.
Note that, to the extent possible, the data provided by the supplier should be for the same time interval as the
reporting company’s scope 3 inventory and preference should be given to assured data.
If it is not feasible for the company to collect data from all its suppliers for all purchased goods, the company may use
extrapolation and sampling techniques (see Appendix A).
Purchased good Supplier Quantities purchased (kg) Supplier-specific emission factor (kg CO2e/kg)
Cement Supplier C 200,000 0.15
Plaster Supplier D 600,000 0.10
Paint Supplier E 200,000 0.10
Timber Supplier F 100,000 0.25
Concrete Supplier G 50,000 0.20

Technical Guidance for Calculating Scope 3 Emissions [26]
CATEGORY 1 Purchased Goods and Services
If a supplier cannot provide data on some or all of the items in the list above, the reporting company may combine the
available supplier-specific data with secondary data for the other activities.
Companies should also collect either:
• Mass or number of units of purchased goods or services (e.g., kg, m3, hours spent, etc.)
• Amount spent on purchased goods or services, by product type, using market values (e.g., dollars).
Emission factors neededDepending what activity data has been collected from the supplier, companies may need to collect:
• Cradle-to-gate emission factors for materials used by tier 1 supplier to produce purchased goods (Note: these
emission factors can either be supplier-specific emission factors provided by the supplier, or industry-average
emission factors sourced from a secondary database. In general, preference should be given to more specific and
verified emission factors)
• Life cycle emission factors for fuel used by incoming transport of input materials to tier 1 supplier
• Emission factors for waste outputs by tier 1 suppliers to produce purchased goods
• Other emission factors as applicable (e.g., process emissions).
The secondary emission factors required will also depend on what data is available for the purchased good. Companies
will need to collect either:
• Cradle-to-gate emission factors of the purchased goods or services per unit of mass or unit of product
(e.g., kg CO2e/kg or kg CO2e/hour spent)
• Cradle-to-gate emission factors of the purchased goods or services per unit of economic value (e.g., kg CO2e/$).
Data collection guidanceTo combine the primary data collected from the supplier with secondary data (to fill the gaps), the secondary emission
factors must be disaggregated so the necessary elements can be overwritten with the supplier-specific data. For
example, if a company collects only scope 1, scope 2, and waste data from the supplier, all other upstream emissions
need to be estimated using secondary data (see example 1.3 below).
The reporting company may request the following information from suppliers to assist calculation:
• Internal data systems (e.g., bill of materials, freight distance of incoming raw materials)
• Public GHG inventory reports accessible through GHG reporting programs.
Data sources for emission factors include:
• The data sources on the GHG Protocol website (http://www.ghgprotocol.org/Third-Party-Databases). Additional
databases may be added periodically, so continue to check the website
• Company- or supplier-developed emission factors (e.g., if the supplier has conducted a reliable cradle-to-gate
product GHG inventory or internal LCA report)
• Life cycle databases
• Industry associations
• Government agencies (e.g., Defra provides emission factors for the United Kingdom)
• For activity data, emission factors, and formulas for process and fugitive emissions, see the GHG Protocol website
(http://www.ghgprotocol.org/calculation-tools/all-tools) and the IPCC 2006 Guidelines (http://www.ipcc-nggip.iges.
or.jp/public/2006gl/index.html).
Technical Guidance for Calculating Scope 3 Emissions [27]
CATEGORY 1 Purchased Goods and Services
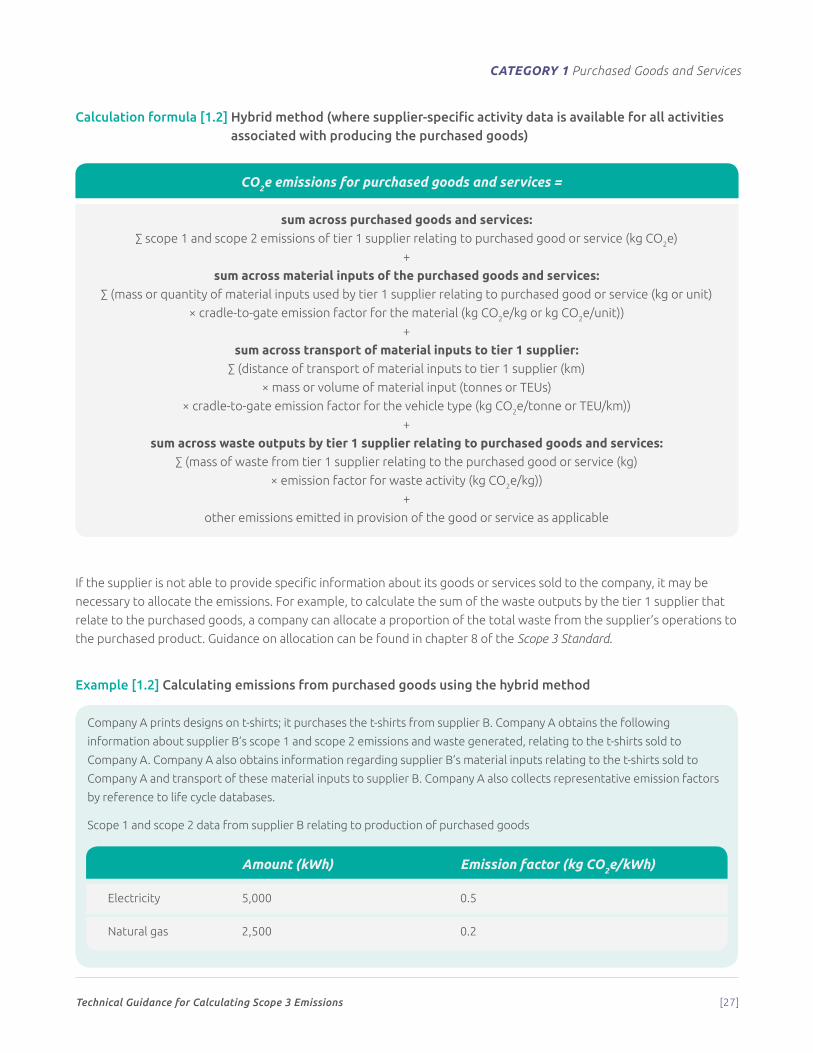
Calculation formula [1.2] Hybrid method (where supplier-specific activity data is available for all activities associated with producing the purchased goods)
CO2e emissions for purchased goods and services =
sum across purchased goods and services:∑ scope 1 and scope 2 emissions of tier 1 supplier relating to purchased good or service (kg CO2e)
+
sum across material inputs of the purchased goods and services:∑ (mass or quantity of material inputs used by tier 1 supplier relating to purchased good or service (kg or unit)
× cradle-to-gate emission factor for the material (kg CO2e/kg or kg CO2e/unit))
+
sum across transport of material inputs to tier 1 supplier:∑ (distance of transport of material inputs to tier 1 supplier (km)
× mass or volume of material input (tonnes or TEUs)
× cradle-to-gate emission factor for the vehicle type (kg CO2e/tonne or TEU/km))
+
sum across waste outputs by tier 1 supplier relating to purchased goods and services:∑ (mass of waste from tier 1 supplier relating to the purchased good or service (kg)
× emission factor for waste activity (kg CO2e/kg))
+
other emissions emitted in provision of the good or service as applicable
If the supplier is not able to provide specific information about its goods or services sold to the company, it may be
necessary to allocate the emissions. For example, to calculate the sum of the waste outputs by the tier 1 supplier that
relate to the purchased goods, a company can allocate a proportion of the total waste from the supplier’s operations to
the purchased product. Guidance on allocation can be found in chapter 8 of the Scope 3 Standard.
Example [1.2] Calculating emissions from purchased goods using the hybrid method
Company A prints designs on t-shirts; it purchases the t-shirts from supplier B. Company A obtains the following
information about supplier B’s scope 1 and scope 2 emissions and waste generated, relating to the t-shirts sold to
Company A. Company A also obtains information regarding supplier B’s material inputs relating to the t-shirts sold to
Company A and transport of these material inputs to supplier B. Company A also collects representative emission factors
by reference to life cycle databases.
Scope 1 and scope 2 data from supplier B relating to production of purchased goods
Amount (kWh) Emission factor (kg CO2e/kWh)
Electricity 5,000 0.5
Natural gas 2,500 0.2
Technical Guidance for Calculating Scope 3 Emissions [28]
CATEGORY 1 Purchased Goods and Services
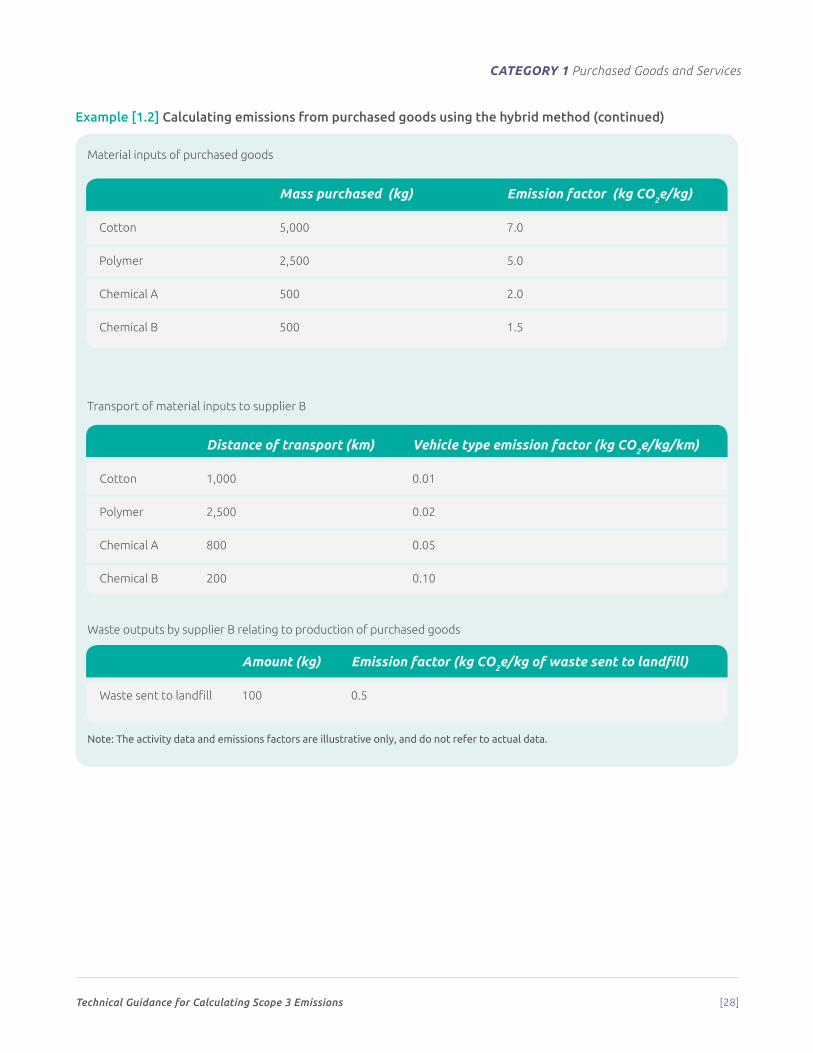
Example [1.2] Calculating emissions from purchased goods using the hybrid method (continued)
Material inputs of purchased goods
Transport of material inputs to supplier B
Waste outputs by supplier B relating to production of purchased goods
Note: The activity data and emissions factors are illustrative only, and do not refer to actual data.
Mass purchased (kg) Emission factor (kg CO2e/kg)
Cotton 5,000 7.0
Polymer 2,500 5.0
Chemical A 500 2.0
Chemical B 500 1.5
Distance of transport (km) Vehicle type emission factor (kg CO2e/kg/km)
Cotton 1,000 0.01
Polymer 2,500 0.02
Chemical A 800 0.05
Chemical B 200 0.10
Amount (kg) Emission factor (kg CO2e/kg of waste sent to landfill)
Waste sent to landfill 100 0.5
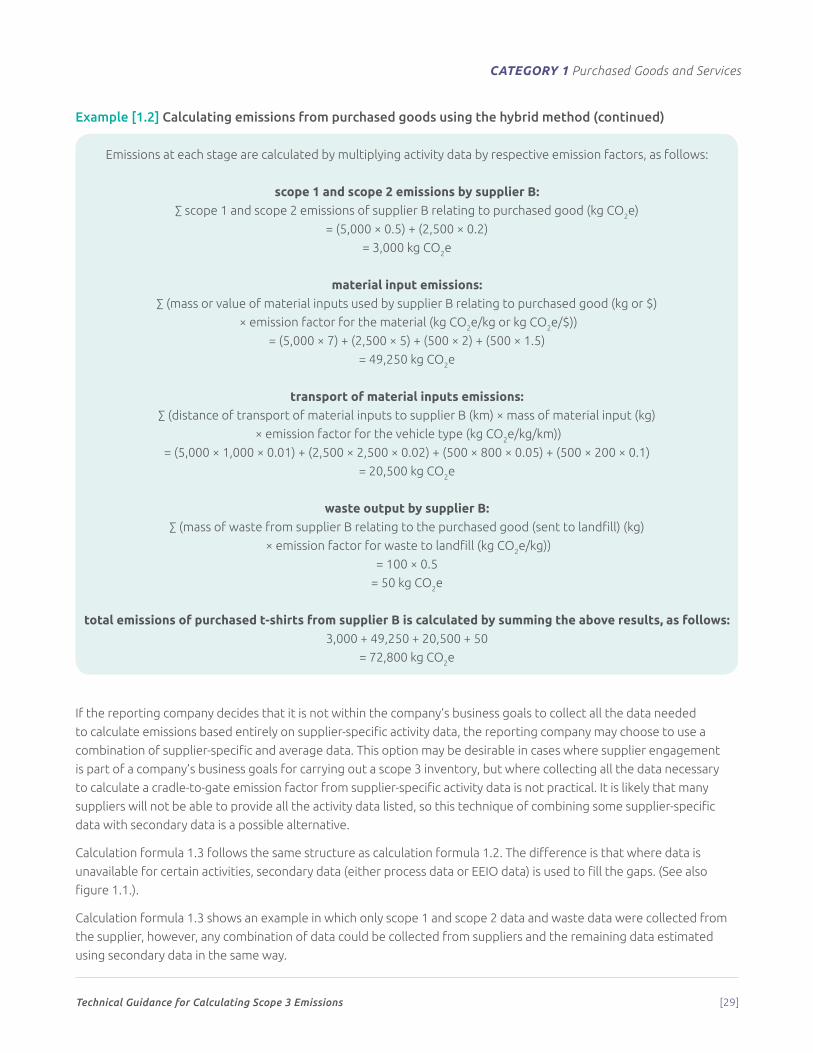
Technical Guidance for Calculating Scope 3 Emissions [29]
CATEGORY 1 Purchased Goods and Services
Emissions at each stage are calculated by multiplying activity data by respective emission factors, as follows:
scope 1 and scope 2 emissions by supplier B:∑ scope 1 and scope 2 emissions of supplier B relating to purchased good (kg CO2e)
= (5,000 × 0.5) + (2,500 × 0.2)
= 3,000 kg CO2e
material input emissions:∑ (mass or value of material inputs used by supplier B relating to purchased good (kg or $)
× emission factor for the material (kg CO2e/kg or kg CO2e/$))
= (5,000 × 7) + (2,500 × 5) + (500 × 2) + (500 × 1.5)
= 49,250 kg CO2e
transport of material inputs emissions:∑ (distance of transport of material inputs to supplier B (km) × mass of material input (kg)
× emission factor for the vehicle type (kg CO2e/kg/km))
= (5,000 × 1,000 × 0.01) + (2,500 × 2,500 × 0.02) + (500 × 800 × 0.05) + (500 × 200 × 0.1)
= 20,500 kg CO2e
waste output by supplier B:∑ (mass of waste from supplier B relating to the purchased good (sent to landfill) (kg)
× emission factor for waste to landfill (kg CO2e/kg))
= 100 × 0.5
= 50 kg CO2e
total emissions of purchased t-shirts from supplier B is calculated by summing the above results, as follows:3,000 + 49,250 + 20,500 + 50
= 72,800 kg CO2e
If the reporting company decides that it is not within the company’s business goals to collect all the data needed
to calculate emissions based entirely on supplier-specific activity data, the reporting company may choose to use a
combination of supplier-specific and average data. This option may be desirable in cases where supplier engagement
is part of a company’s business goals for carrying out a scope 3 inventory, but where collecting all the data necessary
to calculate a cradle-to-gate emission factor from supplier-specific activity data is not practical. It is likely that many
suppliers will not be able to provide all the activity data listed, so this technique of combining some supplier-specific
data with secondary data is a possible alternative.
Calculation formula 1.3 follows the same structure as calculation formula 1.2. The difference is that where data is
unavailable for certain activities, secondary data (either process data or EEIO data) is used to fill the gaps. (See also
figure 1.1.).
Calculation formula 1.3 shows an example in which only scope 1 and scope 2 data and waste data were collected from
the supplier, however, any combination of data could be collected from suppliers and the remaining data estimated
using secondary data in the same way.
Example [1.2] Calculating emissions from purchased goods using the hybrid method (continued)
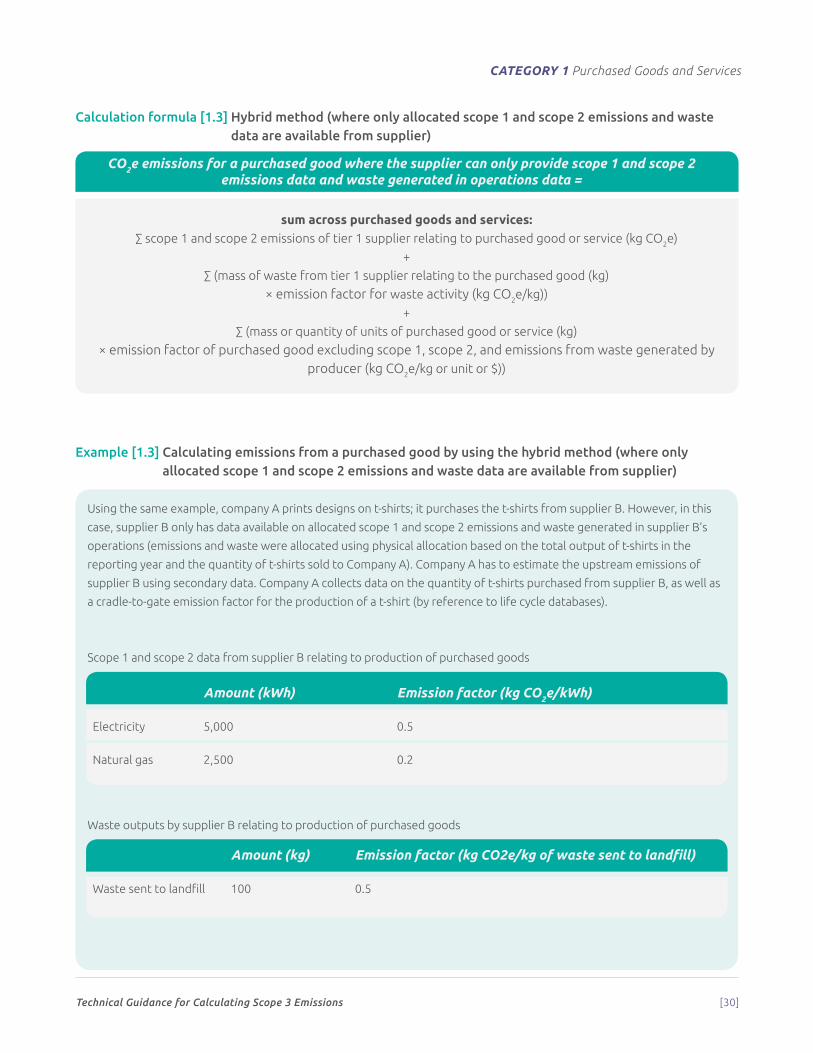
Technical Guidance for Calculating Scope 3 Emissions [30]
CATEGORY 1 Purchased Goods and Services
Calculation formula [1.3] Hybrid method (where only allocated scope 1 and scope 2 emissions and waste data are available from supplier)
CO2e emissions for a purchased good where the supplier can only provide scope 1 and scope 2 emissions data and waste generated in operations data =
sum across purchased goods and services:∑ scope 1 and scope 2 emissions of tier 1 supplier relating to purchased good or service (kg CO2e)
+
∑ (mass of waste from tier 1 supplier relating to the purchased good (kg)
× emission factor for waste activity (kg CO2e/kg))
+
∑ (mass or quantity of units of purchased good or service (kg)
× emission factor of purchased good excluding scope 1, scope 2, and emissions from waste generated by producer (kg CO2e/kg or unit or $))
Example [1.3] Calculating emissions from a purchased good by using the hybrid method (where only allocated scope 1 and scope 2 emissions and waste data are available from supplier)
Using the same example, company A prints designs on t-shirts; it purchases the t-shirts from supplier B. However, in this
case, supplier B only has data available on allocated scope 1 and scope 2 emissions and waste generated in supplier B’s
operations (emissions and waste were allocated using physical allocation based on the total output of t-shirts in the
reporting year and the quantity of t-shirts sold to Company A). Company A has to estimate the upstream emissions of
supplier B using secondary data. Company A collects data on the quantity of t-shirts purchased from supplier B, as well as
a cradle-to-gate emission factor for the production of a t-shirt (by reference to life cycle databases).
Scope 1 and scope 2 data from supplier B relating to production of purchased goods
Amount (kWh) Emission factor (kg CO2e/kWh)
Electricity 5,000 0.5
Natural gas 2,500 0.2
Waste outputs by supplier B relating to production of purchased goods
Amount (kg) Emission factor (kg CO2e/kg of waste sent to landfill)
Waste sent to landfill 100 0.5
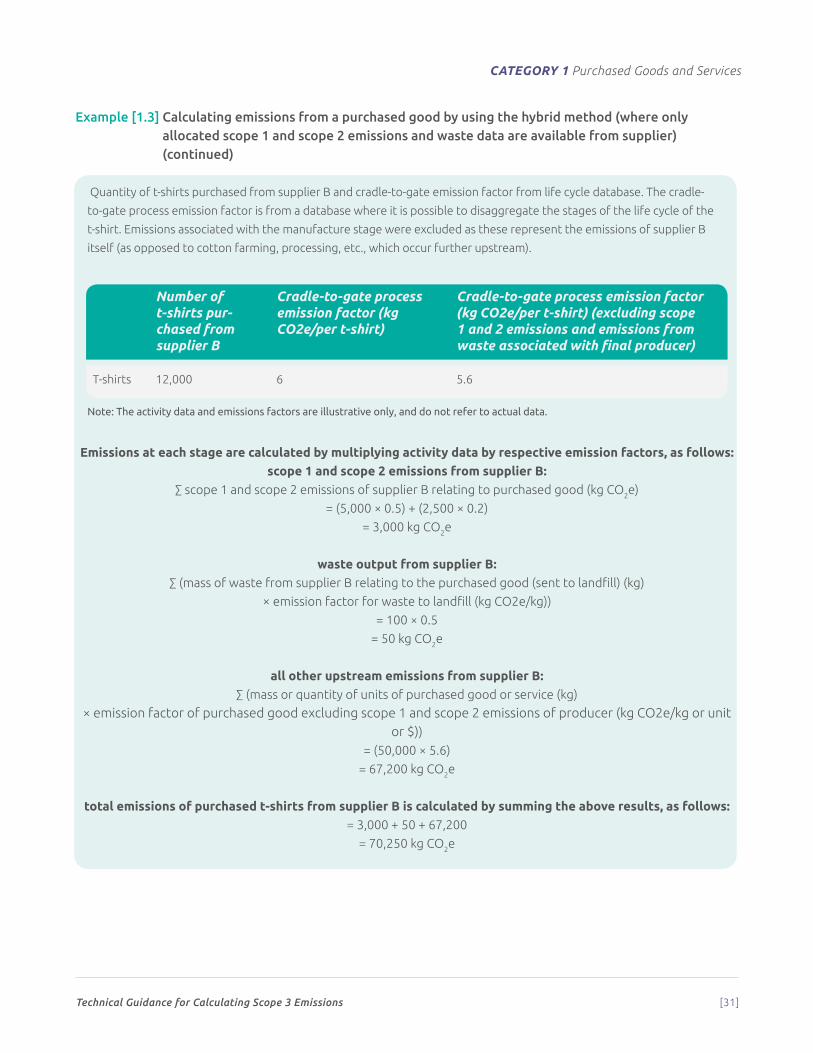
Technical Guidance for Calculating Scope 3 Emissions [31]
CATEGORY 1 Purchased Goods and Services
Example [1.3] Calculating emissions from a purchased good by using the hybrid method (where only allocated scope 1 and scope 2 emissions and waste data are available from supplier) (continued)
Quantity of t-shirts purchased from supplier B and cradle-to-gate emission factor from life cycle database. The cradle-
to-gate process emission factor is from a database where it is possible to disaggregate the stages of the life cycle of the
t-shirt. Emissions associated with the manufacture stage were excluded as these represent the emissions of supplier B
itself (as opposed to cotton farming, processing, etc., which occur further upstream).
Number of t-shirts pur-chased from supplier B
Cradle-to-gate process emission factor (kg CO2e/per t-shirt)
Cradle-to-gate process emission factor (kg CO2e/per t-shirt) (excluding scope 1 and 2 emissions and emissions from waste associated with final producer)
T-shirts 12,000 6 5.6
Note: The activity data and emissions factors are illustrative only, and do not refer to actual data.
Emissions at each stage are calculated by multiplying activity data by respective emission factors, as follows:scope 1 and scope 2 emissions from supplier B:
∑ scope 1 and scope 2 emissions of supplier B relating to purchased good (kg CO2e)
= (5,000 × 0.5) + (2,500 × 0.2)
= 3,000 kg CO2e
waste output from supplier B:∑ (mass of waste from supplier B relating to the purchased good (sent to landfill) (kg)
× emission factor for waste to landfill (kg CO2e/kg))
= 100 × 0.5
= 50 kg CO2e
all other upstream emissions from supplier B:∑ (mass or quantity of units of purchased good or service (kg)
× emission factor of purchased good excluding scope 1 and scope 2 emissions of producer (kg CO2e/kg or unit or $))
= (50,000 × 5.6)
= 67,200 kg CO2e
total emissions of purchased t-shirts from supplier B is calculated by summing the above results, as follows:= 3,000 + 50 + 67,200
= 70,250 kg CO2e
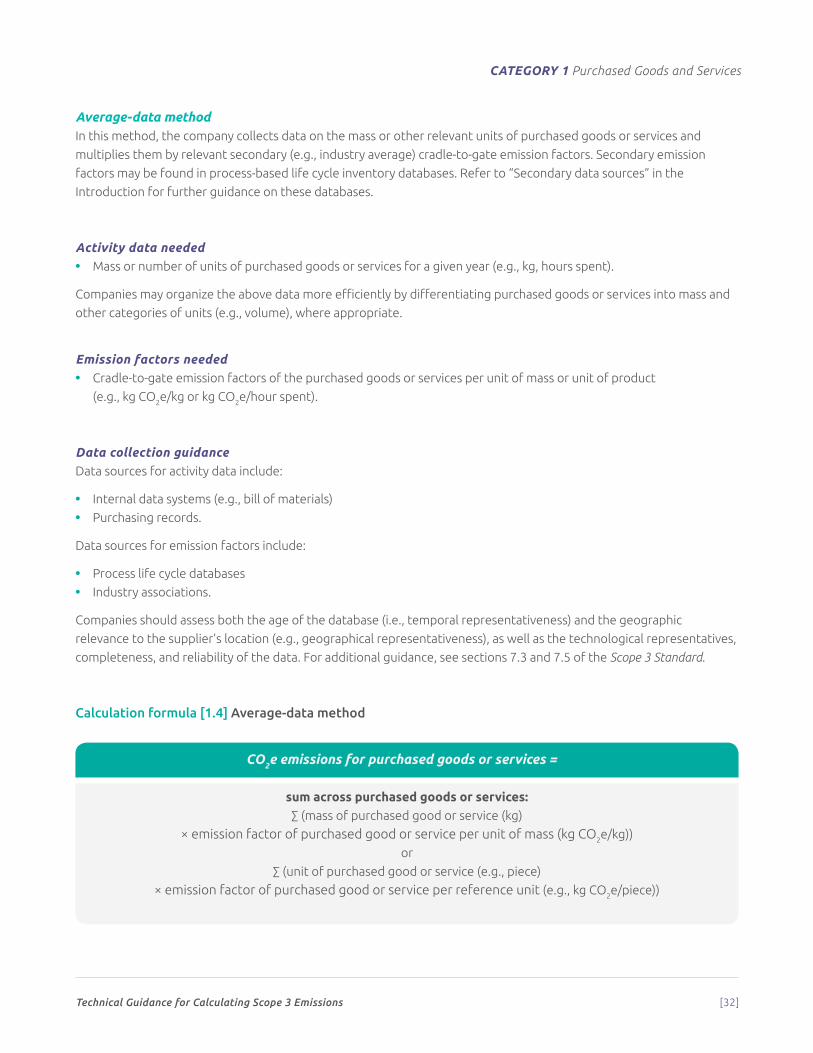
Technical Guidance for Calculating Scope 3 Emissions [32]
CATEGORY 1 Purchased Goods and Services
Average-data methodIn this method, the company collects data on the mass or other relevant units of purchased goods or services and
multiplies them by relevant secondary (e.g., industry average) cradle-to-gate emission factors. Secondary emission
factors may be found in process-based life cycle inventory databases. Refer to “Secondary data sources” in the
Introduction for further guidance on these databases.
Activity data needed • Mass or number of units of purchased goods or services for a given year (e.g., kg, hours spent).
Companies may organize the above data more efficiently by differentiating purchased goods or services into mass and
other categories of units (e.g., volume), where appropriate.
Emission factors needed • Cradle-to-gate emission factors of the purchased goods or services per unit of mass or unit of product
(e.g., kg CO2e/kg or kg CO2e/hour spent).
Data collection guidanceData sources for activity data include:
• Internal data systems (e.g., bill of materials)
• Purchasing records.
Data sources for emission factors include:
• Process life cycle databases
• Industry associations.
Companies should assess both the age of the database (i.e., temporal representativeness) and the geographic
relevance to the supplier’s location (e.g., geographical representativeness), as well as the technological representatives,
completeness, and reliability of the data. For additional guidance, see sections 7.3 and 7.5 of the Scope 3 Standard.
Calculation formula [1.4] Average-data method
CO2e emissions for purchased goods or services =
sum across purchased goods or services:∑ (mass of purchased good or service (kg)
× emission factor of purchased good or service per unit of mass (kg CO2e/kg))
or
∑ (unit of purchased good or service (e.g., piece)
× emission factor of purchased good or service per reference unit (e.g., kg CO2e/piece))
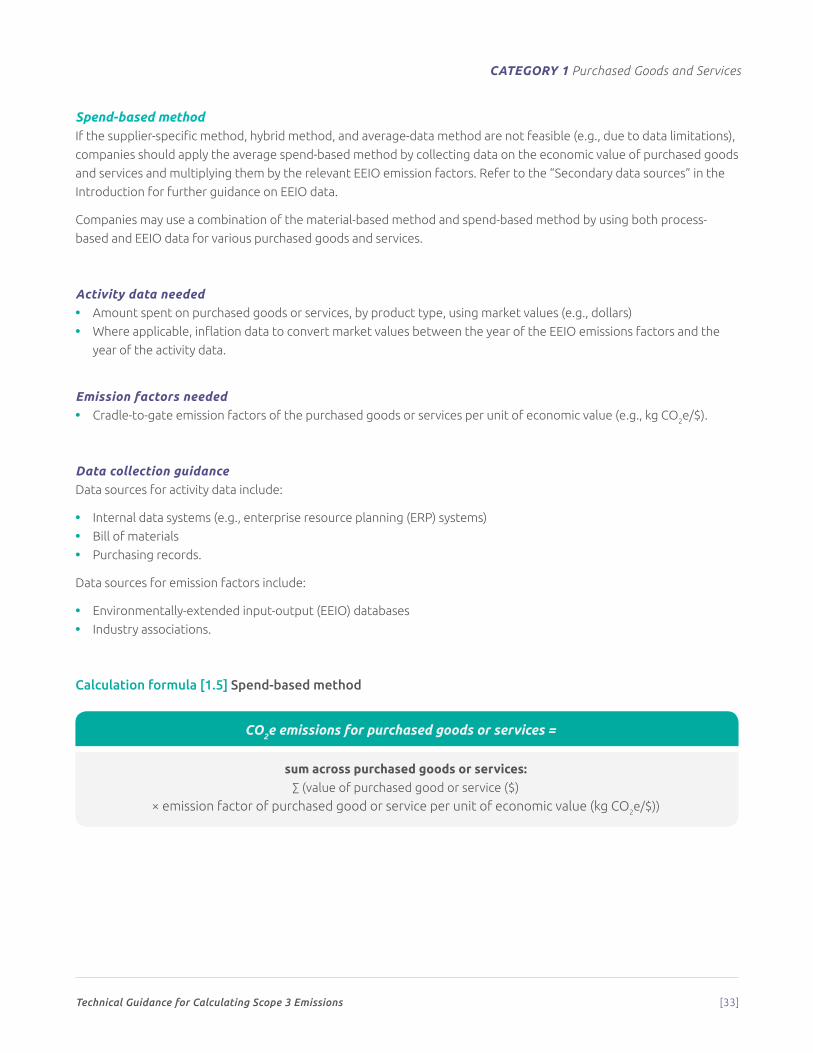
Technical Guidance for Calculating Scope 3 Emissions [33]
CATEGORY 1 Purchased Goods and Services
Spend-based method If the supplier-specific method, hybrid method, and average-data method are not feasible (e.g., due to data limitations),
companies should apply the average spend-based method by collecting data on the economic value of purchased goods
and services and multiplying them by the relevant EEIO emission factors. Refer to the “Secondary data sources” in the
Introduction for further guidance on EEIO data.
Companies may use a combination of the material-based method and spend-based method by using both process-
based and EEIO data for various purchased goods and services.
Activity data needed • Amount spent on purchased goods or services, by product type, using market values (e.g., dollars)
• Where applicable, inflation data to convert market values between the year of the EEIO emissions factors and the
year of the activity data.
Emission factors needed • Cradle-to-gate emission factors of the purchased goods or services per unit of economic value (e.g., kg CO2e/$).
Data collection guidanceData sources for activity data include:
• Internal data systems (e.g., enterprise resource planning (ERP) systems)
• Bill of materials
• Purchasing records.
Data sources for emission factors include:
• Environmentally-extended input-output (EEIO) databases
• Industry associations.
Calculation formula [1.5] Spend-based method
CO2e emissions for purchased goods or services =
sum across purchased goods or services:∑ (value of purchased good or service ($)
× emission factor of purchased good or service per unit of economic value (kg CO2e/$))
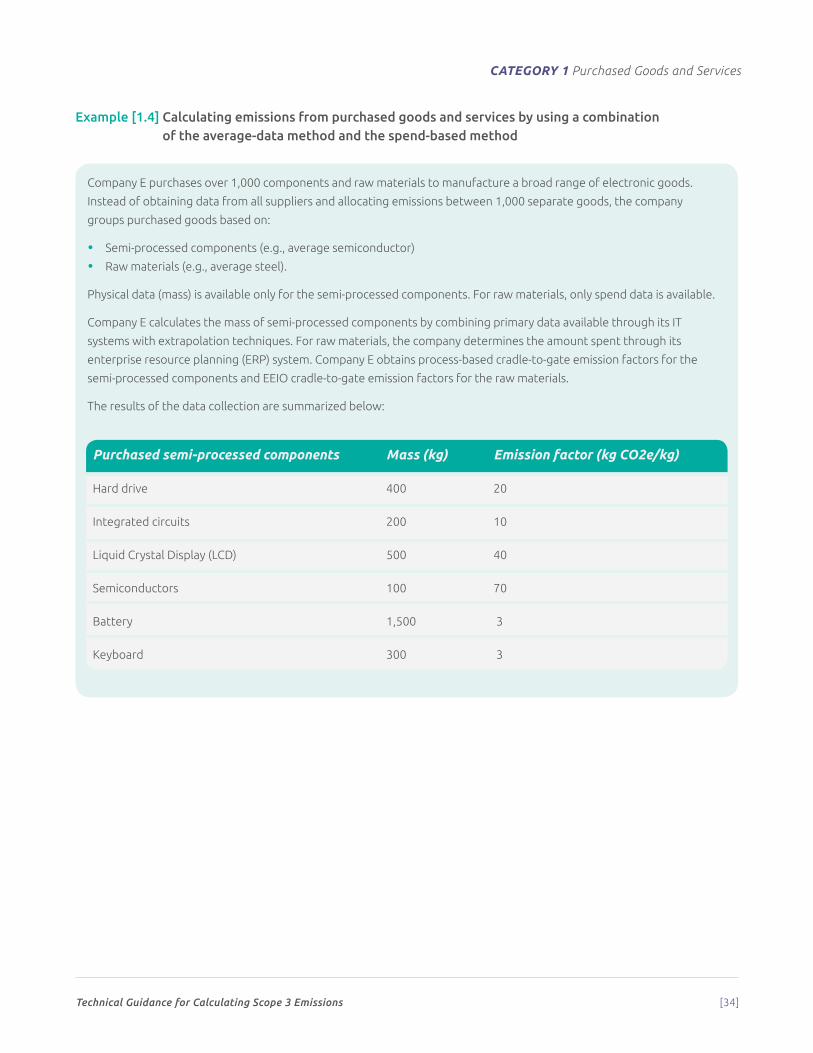
Technical Guidance for Calculating Scope 3 Emissions [34]
CATEGORY 1 Purchased Goods and Services
Example [1.4] Calculating emissions from purchased goods and services by using a combination of the average-data method and the spend-based method
Company E purchases over 1,000 components and raw materials to manufacture a broad range of electronic goods.
Instead of obtaining data from all suppliers and allocating emissions between 1,000 separate goods, the company
groups purchased goods based on:
• Semi-processed components (e.g., average semiconductor)
• Raw materials (e.g., average steel).
Physical data (mass) is available only for the semi-processed components. For raw materials, only spend data is available.
Company E calculates the mass of semi-processed components by combining primary data available through its IT
systems with extrapolation techniques. For raw materials, the company determines the amount spent through its
enterprise resource planning (ERP) system. Company E obtains process-based cradle-to-gate emission factors for the
semi-processed components and EEIO cradle-to-gate emission factors for the raw materials.
The results of the data collection are summarized below:
Purchased semi-processed components Mass (kg) Emission factor (kg CO2e/kg)
Hard drive 400 20
Integrated circuits 200 10
Liquid Crystal Display (LCD) 500 40
Semiconductors 100 70
Battery 1,500 3
Keyboard 300 3
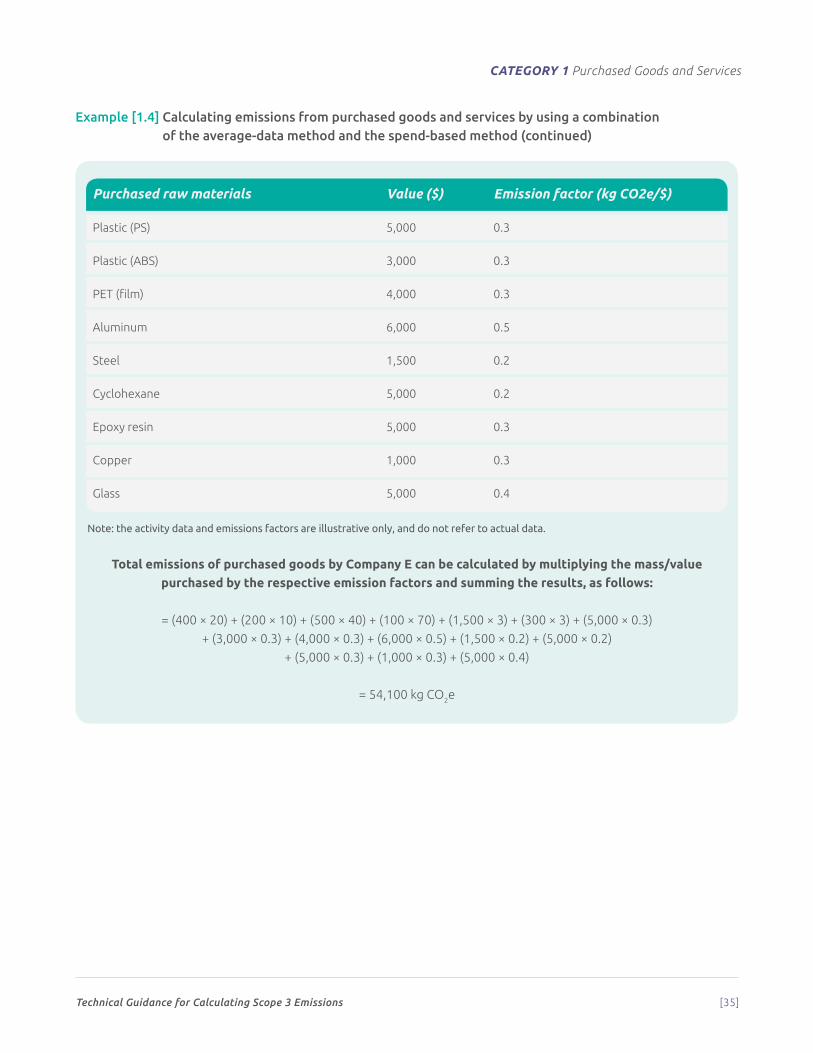
Technical Guidance for Calculating Scope 3 Emissions [35]
CATEGORY 1 Purchased Goods and Services
Purchased raw materials Value ($) Emission factor (kg CO2e/$)
Plastic (PS) 5,000 0.3
Plastic (ABS) 3,000 0.3
PET (film) 4,000 0.3
Aluminum 6,000 0.5
Steel 1,500 0.2
Cyclohexane 5,000 0.2
Epoxy resin 5,000 0.3
Copper 1,000 0.3
Glass 5,000 0.4
Note: the activity data and emissions factors are illustrative only, and do not refer to actual data.
Total emissions of purchased goods by Company E can be calculated by multiplying the mass/value purchased by the respective emission factors and summing the results, as follows:
= (400 × 20) + (200 × 10) + (500 × 40) + (100 × 70) + (1,500 × 3) + (300 × 3) + (5,000 × 0.3)
+ (3,000 × 0.3) + (4,000 × 0.3) + (6,000 × 0.5) + (1,500 × 0.2) + (5,000 × 0.2)
+ (5,000 × 0.3) + (1,000 × 0.3) + (5,000 × 0.4)
= 54,100 kg CO2e
Example [1.4] Calculating emissions from purchased goods and services by using a combination of the average-data method and the spend-based method (continued)
Technical Guidance for Calculating Scope 3 Emissions [36]
2
Category 2: Capital Goods
Category description
T his category includes all upstream (i.e., cradle-to-gate) emissions from the
production of capital goods purchased or acquired by the reporting company in the
reporting year. Emissions from the use of capital goods by the reporting company
are accounted for in either scope 1 (e.g., for fuel use) or scope 2 (e.g., for electricity use),
rather than in scope 3.
Capital goods are final products that have an extended life and are used by the company to manufacture a product;
provide a service; or sell, store, and deliver merchandise. In financial accounting, capital goods are treated as fixed
assets or as plant, property, and equipment (PP&E). Examples of capital goods include equipment, machinery, buildings,
facilities, and vehicles.
In certain cases, there may be ambiguity over whether a particular purchased product is a capital good (to be reported
in category 2) or a purchased good (to be reported in category 1). Companies should follow their own financial
accounting procedures to determine whether to account for a purchased product as a capital good in this category or
as a purchased good or service in category 1. Companies should not double count emissions between category 1 and
category 2. See box 2.1 for accounting for emissions from capital goods.
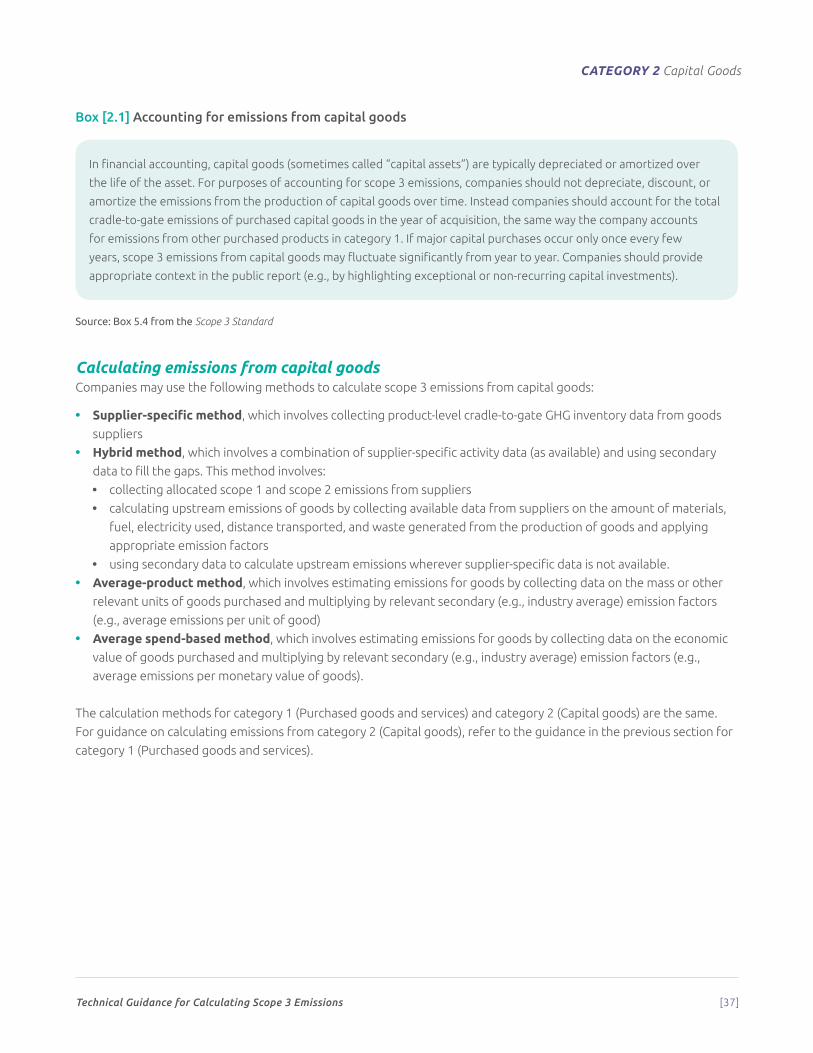
Technical Guidance for Calculating Scope 3 Emissions [37]
CATEGORY 2 Capital Goods
Box [2.1] Accounting for emissions from capital goods
In financial accounting, capital goods (sometimes called “capital assets”) are typically depreciated or amortized over
the life of the asset. For purposes of accounting for scope 3 emissions, companies should not depreciate, discount, or
amortize the emissions from the production of capital goods over time. Instead companies should account for the total
cradle-to-gate emissions of purchased capital goods in the year of acquisition, the same way the company accounts
for emissions from other purchased products in category 1. If major capital purchases occur only once every few
years, scope 3 emissions from capital goods may fluctuate significantly from year to year. Companies should provide
appropriate context in the public report (e.g., by highlighting exceptional or non-recurring capital investments).
Source: Box 5.4 from the Scope 3 Standard
Calculating emissions from capital goodsCompanies may use the following methods to calculate scope 3 emissions from capital goods:
• Supplier-specific method, which involves collecting product-level cradle-to-gate GHG inventory data from goods
suppliers
• Hybrid method, which involves a combination of supplier-specific activity data (as available) and using secondary
data to fill the gaps. This method involves:
• collecting allocated scope 1 and scope 2 emissions from suppliers
• calculating upstream emissions of goods by collecting available data from suppliers on the amount of materials,
fuel, electricity used, distance transported, and waste generated from the production of goods and applying
appropriate emission factors
• using secondary data to calculate upstream emissions wherever supplier-specific data is not available.
• Average-product method, which involves estimating emissions for goods by collecting data on the mass or other
relevant units of goods purchased and multiplying by relevant secondary (e.g., industry average) emission factors
(e.g., average emissions per unit of good)
• Average spend-based method, which involves estimating emissions for goods by collecting data on the economic
value of goods purchased and multiplying by relevant secondary (e.g., industry average) emission factors (e.g.,
average emissions per monetary value of goods).
The calculation methods for category 1 (Purchased goods and services) and category 2 (Capital goods) are the same.
For guidance on calculating emissions from category 2 (Capital goods), refer to the guidance in the previous section for
category 1 (Purchased goods and services).
Technical Guidance for Calculating Scope 3 Emissions [38]
3
Category 3: Fuel- and Energy-Related Activities Not Included in Scope 1 or Scope 2
Category description
T his category includes emissions related to the production of fuels and energy
purchased and consumed by the reporting company in the reporting year that are
not included in scope 1 or scope 2.
Category 3 excludes emissions from the combustion of fuels or electricity consumed by the reporting company because
they are already included in scope 1 or scope 2. Scope 1 includes emissions from the combustion of fuels by sources
owned or controlled by the reporting company. Scope 2 includes the emissions from the combustion of fuels to
generate electricity, steam, heating, and cooling purchased and consumed by the reporting company.
This category includes emissions from four activities (see table 3.1).
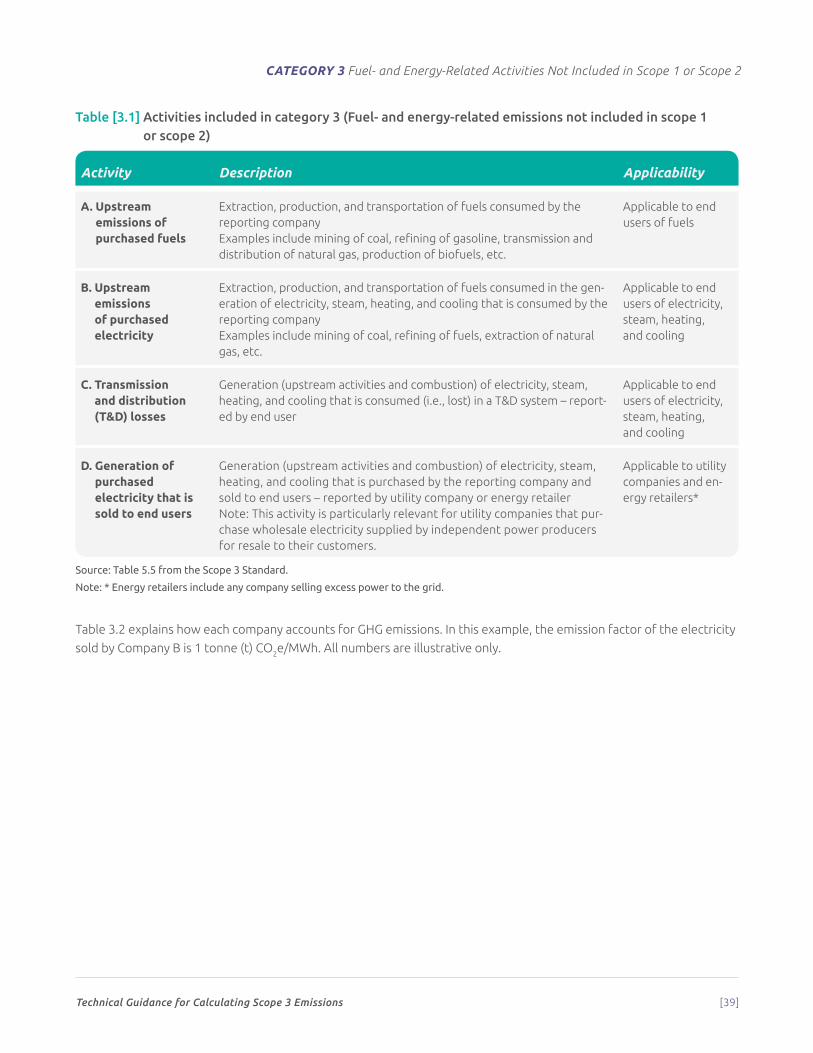
Technical Guidance for Calculating Scope 3 Emissions [39]
CATEGORY 3 Fuel- and Energy-Related Activities Not Included in Scope 1 or Scope 2
Table [3.1] Activities included in category 3 (Fuel- and energy-related emissions not included in scope 1 or scope 2)
Activity Description Applicability
A. Upstream emissions of purchased fuels
Extraction, production, and transportation of fuels consumed by the reporting companyExamples include mining of coal, refining of gasoline, transmission and distribution of natural gas, production of biofuels, etc.
Applicable to end users of fuels
B. Upstream emissions of purchased electricity
Extraction, production, and transportation of fuels consumed in the gen-eration of electricity, steam, heating, and cooling that is consumed by the reporting companyExamples include mining of coal, refining of fuels, extraction of natural gas, etc.
Applicable to end users of electricity, steam, heating, and cooling
C. Transmission and distribution (T&D) losses
Generation (upstream activities and combustion) of electricity, steam, heating, and cooling that is consumed (i.e., lost) in a T&D system – report-ed by end user
Applicable to end users of electricity, steam, heating, and cooling
D. Generation of purchased electricity that is sold to end users
Generation (upstream activities and combustion) of electricity, steam, heating, and cooling that is purchased by the reporting company and sold to end users – reported by utility company or energy retailerNote: This activity is particularly relevant for utility companies that pur-chase wholesale electricity supplied by independent power producers for resale to their customers.
Applicable to utility companies and en-ergy retailers*
Source: Table 5.5 from the Scope 3 Standard.
Note: * Energy retailers include any company selling excess power to the grid.
Table 3.2 explains how each company accounts for GHG emissions. In this example, the emission factor of the electricity
sold by Company B is 1 tonne (t) CO2e/MWh. All numbers are illustrative only.
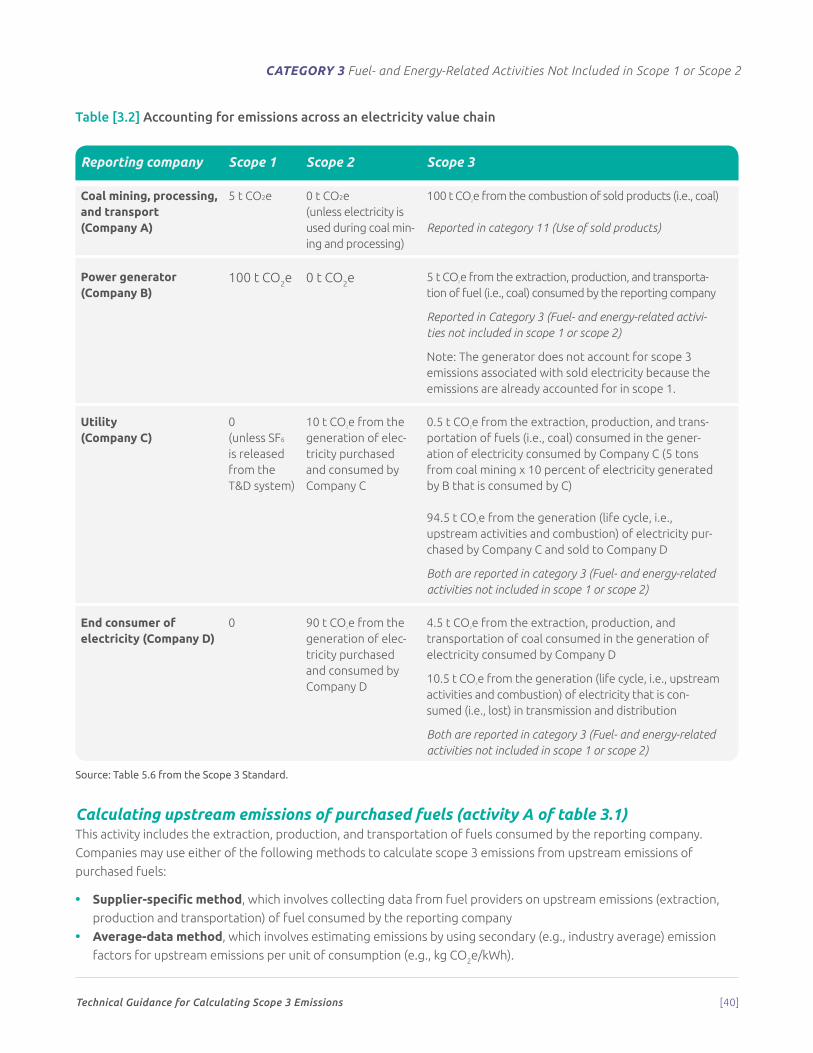
Technical Guidance for Calculating Scope 3 Emissions [40]
CATEGORY 3 Fuel- and Energy-Related Activities Not Included in Scope 1 or Scope 2
Table [3.2] Accounting for emissions across an electricity value chain
Reporting company Scope 1 Scope 2 Scope 3
Coal mining, processing, and transport (Company A)
5 t CO2e 0 t CO2e(unless electricity is used during coal min-ing and processing)
100 t CO2e from the combustion of sold products (i.e., coal)
Reported in category 11 (Use of sold products)
Power generator(Company B)
100 t CO2e 0 t CO2e 5 t CO2e from the extraction, production, and transporta-tion of fuel (i.e., coal) consumed by the reporting company
Reported in Category 3 (Fuel- and energy-related activi-ties not included in scope 1 or scope 2)
Note: The generator does not account for scope 3 emissions associated with sold electricity because the emissions are already accounted for in scope 1.
Utility(Company C)
0 (unless SF6
is released from the T&D system)
10 t CO2e from the generation of elec-tricity purchased and consumed by Company C
0.5 t CO2e from the extraction, production, and trans-portation of fuels (i.e., coal) consumed in the gener-ation of electricity consumed by Company C (5 tons from coal mining x 10 percent of electricity generated by B that is consumed by C)
94.5 t CO2e from the generation (life cycle, i.e., upstream activities and combustion) of electricity pur-chased by Company C and sold to Company D
Both are reported in category 3 (Fuel- and energy-related activities not included in scope 1 or scope 2)
End consumer of electricity (Company D)
0 90 t CO2e from the generation of elec-tricity purchased and consumed by Company D
4.5 t CO2e from the extraction, production, and transportation of coal consumed in the generation of electricity consumed by Company D
10.5 t CO2e from the generation (life cycle, i.e., upstream activities and combustion) of electricity that is con-sumed (i.e., lost) in transmission and distribution
Both are reported in category 3 (Fuel- and energy-related activities not included in scope 1 or scope 2)
Source: Table 5.6 from the Scope 3 Standard.
Calculating upstream emissions of purchased fuels (activity A of table 3.1)This activity includes the extraction, production, and transportation of fuels consumed by the reporting company.
Companies may use either of the following methods to calculate scope 3 emissions from upstream emissions of
purchased fuels:
• Supplier-specific method, which involves collecting data from fuel providers on upstream emissions (extraction,
production and transportation) of fuel consumed by the reporting company
• Average-data method, which involves estimating emissions by using secondary (e.g., industry average) emission
factors for upstream emissions per unit of consumption (e.g., kg CO2e/kWh).
Technical Guidance for Calculating Scope 3 Emissions [41]
CATEGORY 3 Fuel- and Energy-Related Activities Not Included in Scope 1 or Scope 2
Activity data neededCompanies should collect data on:
• Quantities and types of fuel consumed.
Emission factors neededTo calculate emissions from this activity, companies should use life cycle emission factors that exclude emissions from
combustion, since emissions from combustion are accounted for in scope 1 (in the case of fossil fuels) or in a separate
memo item (in the case of direct CO2 emissions from combustion of biomass or biofuels).
If using the supplier-specific method, companies should use fuel-provider-specific emission factors for extraction,
production, and transportation of fuels per unit of fuel consumed (e.g., kg CO2e/kWh), by fuel type and country/region.
If using the average-data method, companies should use average emission factors for upstream emissions per unit of
consumption (e.g., kg CO2e/kWh).
Data collection guidanceCompanies may obtain data by:
• Reference to their scope 1 GHG inventory, including quantities, sources and types of fuels consumed
• Collecting data from their fuel procurement departments
• If necessary, collecting data from fuel suppliers
• Reference to life cycle databases.
A list of third-party databases is on the GHG Protocol website (http://www.ghgprotocol.org/Third-Party-Databases).
Additional databases may be added periodically, so continue to check the website.
Some sources of emission factors may provide upstream emissions of purchased fuels, excluding emissions from
combustion. If this is not the case, companies should determine upstream emissions from purchased fuels (excluding
emissions from combustion) using the following formula.
Calculation formula [3.1] Upstream emissions of purchased fuels
Upstream CO2e emissions of purchased fuels (extraction, production, and transportation of fuels consumed by the reporting company) =
sum across each fuel type consumed:∑ (fuel consumed (e.g., kWh) × upstream fuel emission factor (kg CO2e)/kWh))
where:upstream fuel emission factor = life cycle emission factor – combustion emission factor.
Technical Guidance for Calculating Scope 3 Emissions [42]
CATEGORY 3 Fuel- and Energy-Related Activities Not Included in Scope 1 or Scope 2
If possible, the combustion and life cycle emission factors should be from the same temporal, technical, and geographic
representativeness (see table 7.6 of the Scope 3 Standard).
Calculating upstream emissions of purchased electricity (activity B of table 3.1)This activity includes the extraction, production, and transportation of fuels consumed in the generation of electricity,
steam, heating, and cooling that is consumed by the reporting company. Companies may use either of the following
methods to calculate scope 3 emissions from upstream emissions of purchased electricity:
• Supplier-specific method, which involves collecting data from electricity providers on upstream emissions
(extraction, production, and transportation) of electricity consumed by the reporting company
• Average-data method, which involves estimating emissions by using secondary (e.g., industry average) emission
factors for upstream emissions per unit of consumption (e.g., kg CO2e/kWh).
Activity data neededCompanies should collect data on:
• Total quantities of electricity, steam, heating, and cooling purchased and consumed per unit of consumption (e.g.,
MWh), broken down by supplier, grid region, or country.
Emission factors neededTo calculate emissions from this activity, companies should use life cycle emission factors that exclude emissions from
combustion, since emissions from combustion are accounted for in scope 2 (in the case of electricity).
Companies should select an emission factor using one of the following approaches:
Supplier-specific method
• Utility-specific emission factors for extraction, production and transportation of fuels consumed per MWh of
electricity, steam, heating, or cooling generated.
If data for the above is not available or applicable, companies should use the following approach:
Average-data method
• Grid-region, country, or regional emission factors for extraction, production, and transportation of fuels per unit of
consumption (e.g., kg CO2e/kWh) of electricity, steam, heating, or cooling generated.
Companies should ensure that emission factors used to calculate upstream emissions of purchased electricity do not
include emissions from combustion because emissions from combustion to generate electricity are accounted for in
scope 2 (see figure 3.1).
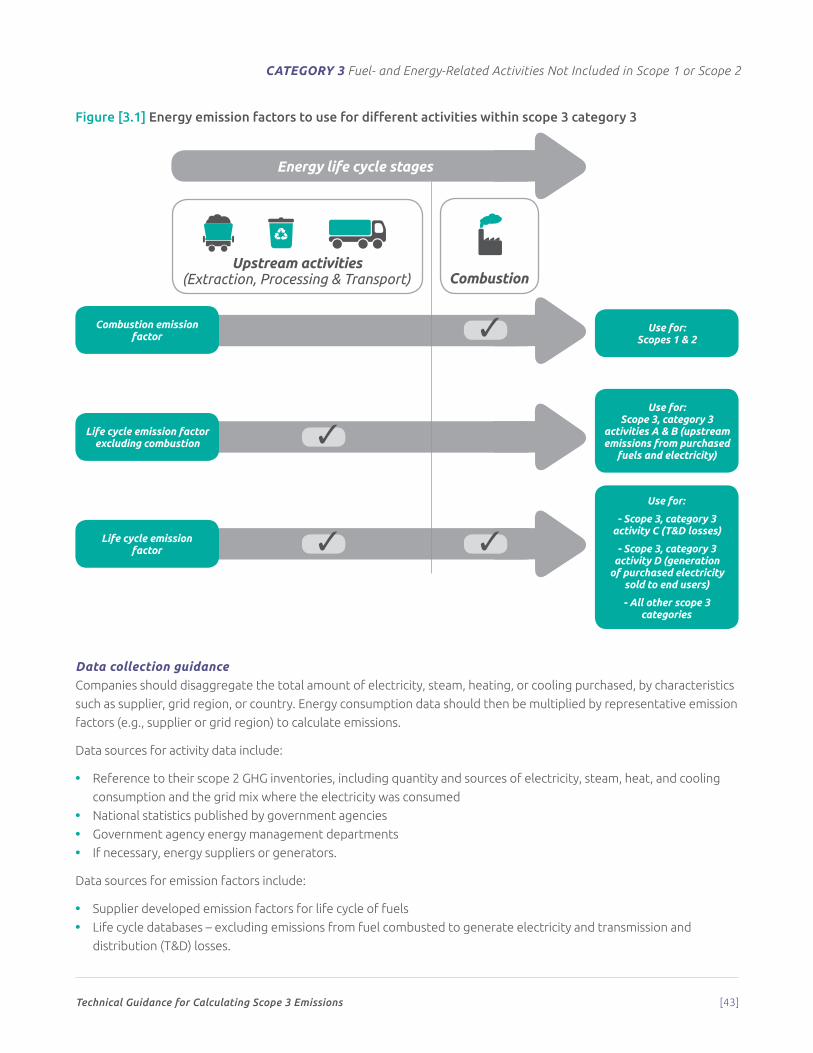
Technical Guidance for Calculating Scope 3 Emissions [43]
CATEGORY 3 Fuel- and Energy-Related Activities Not Included in Scope 1 or Scope 2
Figure [3.1] Energy emission factors to use for different activities within scope 3 category 3
Data collection guidanceCompanies should disaggregate the total amount of electricity, steam, heating, or cooling purchased, by characteristics
such as supplier, grid region, or country. Energy consumption data should then be multiplied by representative emission
factors (e.g., supplier or grid region) to calculate emissions.
Data sources for activity data include:
• Reference to their scope 2 GHG inventories, including quantity and sources of electricity, steam, heat, and cooling
consumption and the grid mix where the electricity was consumed
• National statistics published by government agencies
• Government agency energy management departments
• If necessary, energy suppliers or generators.
Data sources for emission factors include:
• Supplier developed emission factors for life cycle of fuels
• Life cycle databases – excluding emissions from fuel combusted to generate electricity and transmission and
distribution (T&D) losses.
Upstream activities (Extraction, Processing & Transport)
Combustion emission factor
Life cycle emission factor excluding combustion
Life cycle emission factor
Use for: Scopes 1 & 2
Use for:Scope 3, category 3
activities A & B (upstream emissions from purchased
fuels and electricity)
Use for:
- Scope 3, category 3 activity C (T&D losses)
- Scope 3, category 3 activity D (generation
of purchased electricity sold to end users)
- All other scope 3 categories
Combustion
1 2 3
4 5 6
7 8 9
10 11 12
13 14 15
16 17
1. wheat2. tree3. mountains4. glass bottle5. plastic bottle6. aluminium can7. factory8. lorry9. cloud10. recycling bin11. recycling bin (colours reversed)12. wind turbines13. chicken14. cow 115. cow 216. shop17. factory showing carbon emissions (carbon emissions are shown in orange)
Energy life cycle stages
Technical Guidance for Calculating Scope 3 Emissions [44]
CATEGORY 3 Fuel- and Energy-Related Activities Not Included in Scope 1 or Scope 2
The combustion and life cycle emission factors should be from the same temporal, technical, and geographic
representativeness (see table 7.6 of the Scope 3 Standard).
Scope 2 includes emissions from the generation of purchased electricity, steam, heating, and cooling consumed by the
reporting company. In some regions, electricity emission factors include life cycle activities related to electricity, such
as transmission and distribution of electricity, or extraction, processing and transportation of fuels used to generate
electricity. Non-generation activities related to electricity are accounted for in scope 3, category 3 (Fuel- and energy-
related activities not included in scope 1 or scope 2), rather than in scope 2. As a result, companies should seek (and
emission factor developers should provide) transparent, disaggregated electricity emission factors that allow separate
accounting of emissions from electricity generation in scope 2 and non-generation activities related to electricity in
scope 3. Proper accounting creates consistency in scope 2 accounting and reporting among companies and avoids
double counting of the same emission within scope 2 by more than one company. See figure 7.2 in the Scope 3 Standard
for more information on different types of electricity emission factors.
Calculation formula [3.2] Upstream emissions of purchased electricity
Upstream CO2e emissions of purchased electricity (Extraction, production, and transportation of fuels consumed in the generation of electricity, steam,
heating, and cooling that is consumed by the reporting company) =
sum across suppliers, regions, or countries:∑ (electricity consumed (kWh) × upstream electricity emission factor (kgCO2e)/kWh))
+ (steam consumed (kWh) × upstream steam emission factor (kg CO2e)/kWh))
+ (heating consumed (kWh) × upstream heating emission factor (kg CO2e)/kWh))
+ (cooling consumed (kWh) × upstream cooling emission factor (kg CO2e)/kWh))
where:upstream emission factor = life cycle emission factor – combustion emissions factor – T&D losses
Note: T&D losses need to be subtracted only if they are included in the life cycle emission factor.
Companies should check the emission factor to establish whether or not T&D losses have been taken into account.
Calculating emissions from transmission and distribution losses (activity C in table 3.1)This activity includes the lifecycle emissions of electricity, steam, heating, and cooling that is consumed (i.e., lost) in a
transmission and distribution (T&D) system.
Companies may use the following methods to calculate scope 3 emissions from T&D losses:
• Supplier-specific method, which involves collecting data from electricity providers on T&D loss rates of grids where
electricity is consumed by the reporting company
• Average-data method, which involves estimating emissions by using average T&D loss rates (e.g., national, regional,
or global averages, depending on data availability).
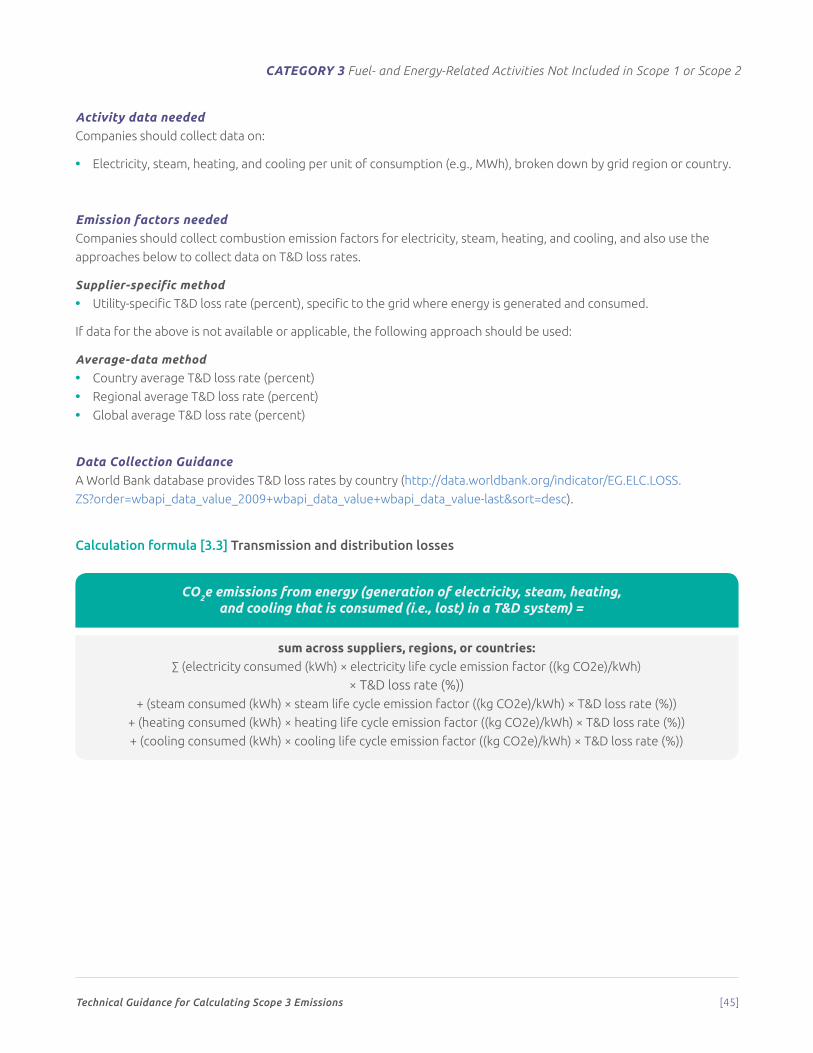
Technical Guidance for Calculating Scope 3 Emissions [45]
CATEGORY 3 Fuel- and Energy-Related Activities Not Included in Scope 1 or Scope 2
Activity data neededCompanies should collect data on:
• Electricity, steam, heating, and cooling per unit of consumption (e.g., MWh), broken down by grid region or country.
Emission factors neededCompanies should collect combustion emission factors for electricity, steam, heating, and cooling, and also use the
approaches below to collect data on T&D loss rates.
Supplier-specific method
• Utility-specific T&D loss rate (percent), specific to the grid where energy is generated and consumed.
If data for the above is not available or applicable, the following approach should be used:
Average-data method
• Country average T&D loss rate (percent)
• Regional average T&D loss rate (percent)
• Global average T&D loss rate (percent)
Data Collection GuidanceA World Bank database provides T&D loss rates by country (http://data.worldbank.org/indicator/EG.ELC.LOSS.
ZS?order=wbapi_data_value_2009+wbapi_data_value+wbapi_data_value-last&sort=desc).
Calculation formula [3.3] Transmission and distribution losses
CO2e emissions from energy (generation of electricity, steam, heating, and cooling that is consumed (i.e., lost) in a T&D system) =
sum across suppliers, regions, or countries:∑ (electricity consumed (kWh) × electricity life cycle emission factor ((kg CO2e)/kWh)
× T&D loss rate (%))+ (steam consumed (kWh) × steam life cycle emission factor ((kg CO2e)/kWh) × T&D loss rate (%))
+ (heating consumed (kWh) × heating life cycle emission factor ((kg CO2e)/kWh) × T&D loss rate (%))
+ (cooling consumed (kWh) × cooling life cycle emission factor ((kg CO2e)/kWh) × T&D loss rate (%))
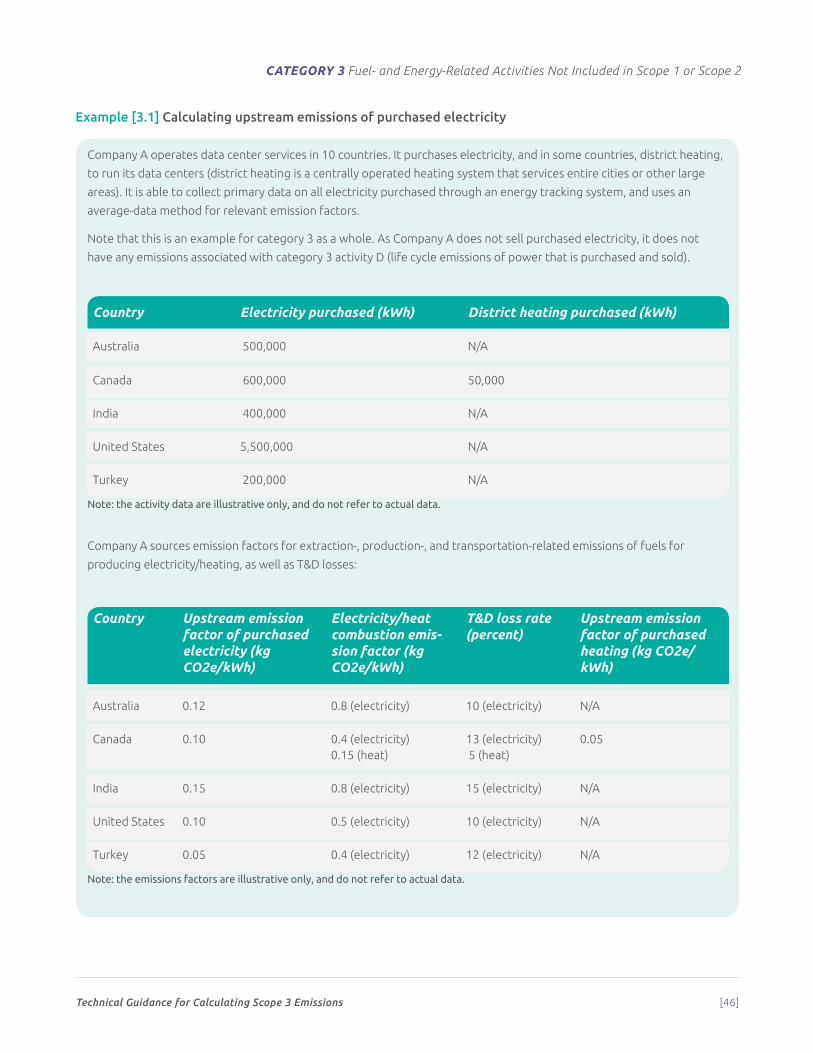
Technical Guidance for Calculating Scope 3 Emissions [46]
CATEGORY 3 Fuel- and Energy-Related Activities Not Included in Scope 1 or Scope 2
Example [3.1] Calculating upstream emissions of purchased electricity
Company A operates data center services in 10 countries. It purchases electricity, and in some countries, district heating,
to run its data centers (district heating is a centrally operated heating system that services entire cities or other large
areas). It is able to collect primary data on all electricity purchased through an energy tracking system, and uses an
average-data method for relevant emission factors.
Note that this is an example for category 3 as a whole. As Company A does not sell purchased electricity, it does not
have any emissions associated with category 3 activity D (life cycle emissions of power that is purchased and sold).
Country Electricity purchased (kWh) District heating purchased (kWh)
Australia 500,000 N/A
Canada 600,000 50,000
India 400,000 N/A
United States 5,500,000 N/A
Turkey 200,000 N/A
Note: the activity data are illustrative only, and do not refer to actual data.
Company A sources emission factors for extraction-, production-, and transportation-related emissions of fuels for
producing electricity/heating, as well as T&D losses:
Country Upstream emission factor of purchased electricity (kg CO2e/kWh)
Electricity/heatcombustion emis-sion factor (kg CO2e/kWh)
T&D loss rate (percent)
Upstream emission factor of purchased heating (kg CO2e/kWh)
Australia 0.12 0.8 (electricity) 10 (electricity) N/A
Canada 0.10 0.4 (electricity)0.15 (heat)
13 (electricity) 5 (heat)
0.05
India 0.15 0.8 (electricity) 15 (electricity) N/A
United States 0.10 0.5 (electricity) 10 (electricity) N/A
Turkey 0.05 0.4 (electricity) 12 (electricity) N/A
Note: the emissions factors are illustrative only, and do not refer to actual data.
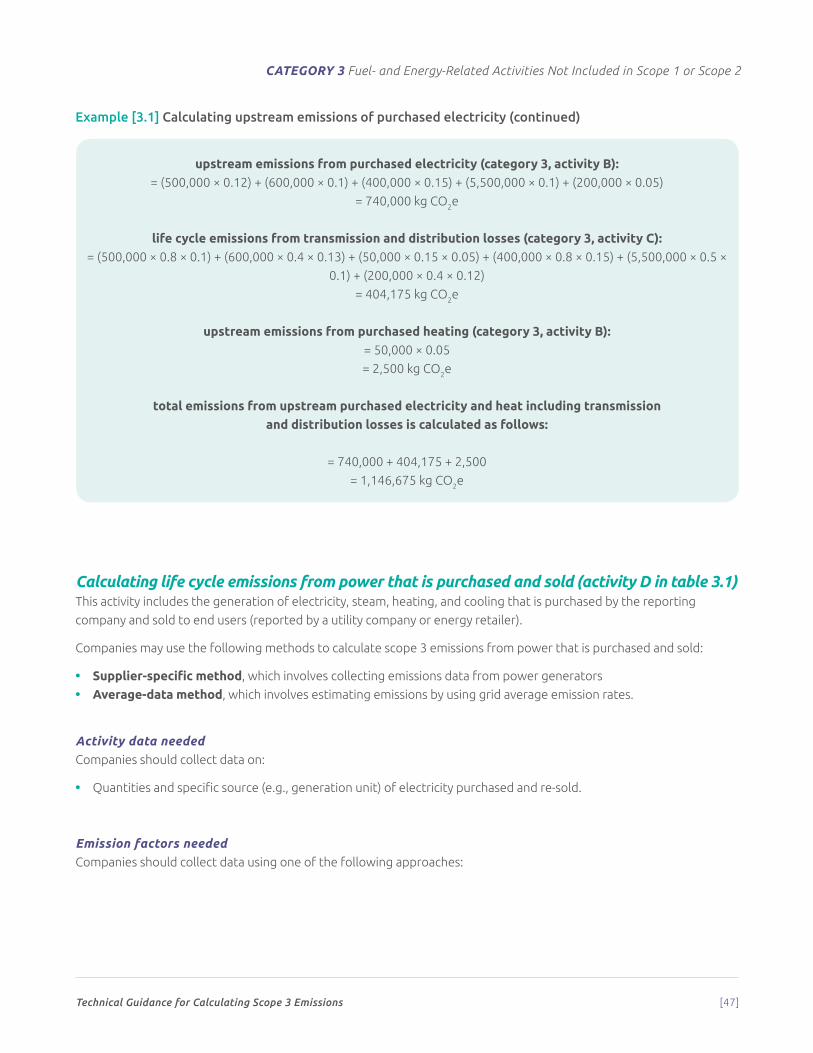
Technical Guidance for Calculating Scope 3 Emissions [47]
CATEGORY 3 Fuel- and Energy-Related Activities Not Included in Scope 1 or Scope 2
upstream emissions from purchased electricity (category 3, activity B):= (500,000 × 0.12) + (600,000 × 0.1) + (400,000 × 0.15) + (5,500,000 × 0.1) + (200,000 × 0.05)
= 740,000 kg CO2e
life cycle emissions from transmission and distribution losses (category 3, activity C):= (500,000 × 0.8 × 0.1) + (600,000 × 0.4 × 0.13) + (50,000 × 0.15 × 0.05) + (400,000 × 0.8 × 0.15) + (5,500,000 × 0.5 ×
0.1) + (200,000 × 0.4 × 0.12)
= 404,175 kg CO2e
upstream emissions from purchased heating (category 3, activity B):= 50,000 × 0.05
= 2,500 kg CO2e
total emissions from upstream purchased electricity and heat including transmission and distribution losses is calculated as follows:
= 740,000 + 404,175 + 2,500
= 1,146,675 kg CO2e
Calculating life cycle emissions from power that is purchased and sold (activity D in table 3.1) This activity includes the generation of electricity, steam, heating, and cooling that is purchased by the reporting
company and sold to end users (reported by a utility company or energy retailer).
Companies may use the following methods to calculate scope 3 emissions from power that is purchased and sold:
• Supplier-specific method, which involves collecting emissions data from power generators
• Average-data method, which involves estimating emissions by using grid average emission rates.
Activity data neededCompanies should collect data on:
• Quantities and specific source (e.g., generation unit) of electricity purchased and re-sold.
Emission factors neededCompanies should collect data using one of the following approaches:
Example [3.1] Calculating upstream emissions of purchased electricity (continued)
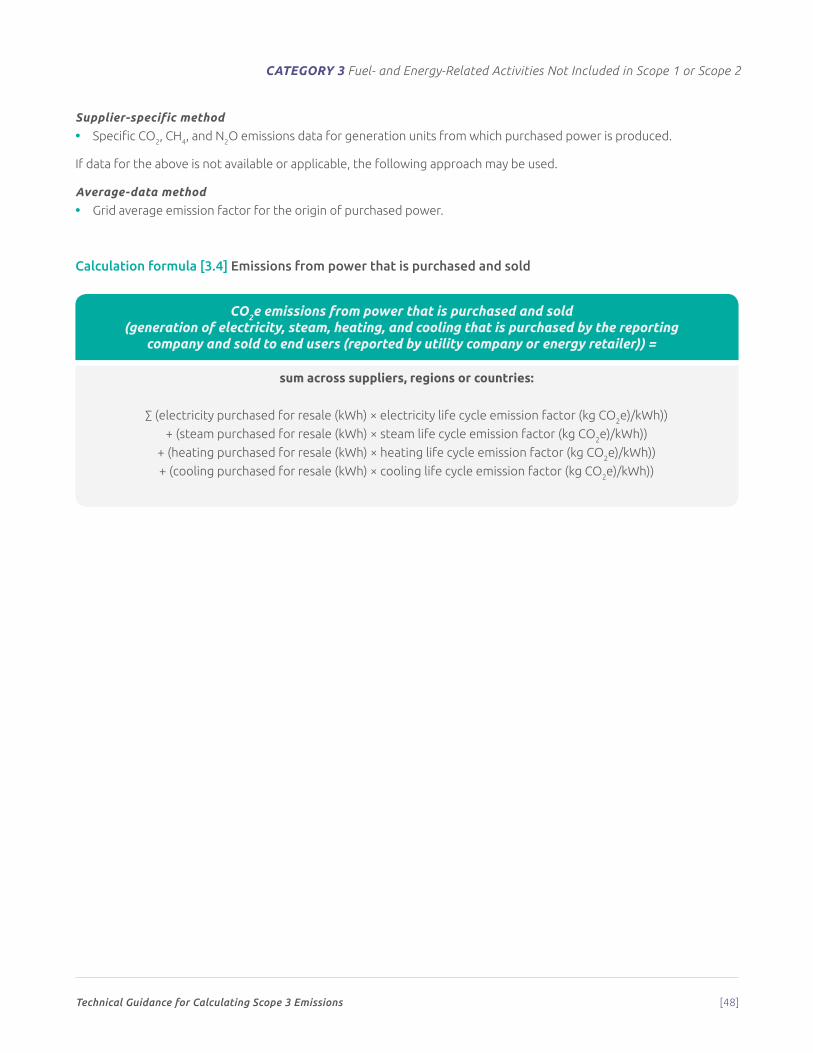
Technical Guidance for Calculating Scope 3 Emissions [48]
CATEGORY 3 Fuel- and Energy-Related Activities Not Included in Scope 1 or Scope 2
Supplier-specific method
• Specific CO2, CH4, and N2O emissions data for generation units from which purchased power is produced.
If data for the above is not available or applicable, the following approach may be used.
Average-data method
• Grid average emission factor for the origin of purchased power.
Calculation formula [3.4] Emissions from power that is purchased and sold
CO2e emissions from power that is purchased and sold (generation of electricity, steam, heating, and cooling that is purchased by the reporting
company and sold to end users (reported by utility company or energy retailer)) =
sum across suppliers, regions or countries:
∑ (electricity purchased for resale (kWh) × electricity life cycle emission factor (kg CO2e)/kWh))
+ (steam purchased for resale (kWh) × steam life cycle emission factor (kg CO2e)/kWh))
+ (heating purchased for resale (kWh) × heating life cycle emission factor (kg CO2e)/kWh))
+ (cooling purchased for resale (kWh) × cooling life cycle emission factor (kg CO2e)/kWh))
Technical Guidance for Calculating Scope 3 Emissions [49]
4
Category 4: Upstream Transportation and Distribution
Category descriptionCategory 4 includes emissions from:
• Transportation and distribution of products purchased in the reporting year, between a company’s tier 1 suppliers3
and its own operations in vehicles not owned or operated by the reporting company (including multi-modal shipping
where multiple carriers are involved in the delivery of a product, but excluding fuel and energy products)
• Third-party transportation and distribution services purchased by the reporting company in the reporting year
(either directly or through an intermediary), including inbound logistics, outbound logistics (e.g., of sold products),
and third-party transportation and distribution between a company’s own facilities.
Emissions may arise from the following transportation and distribution activities throughout the value chain:
• Air transport
• Rail transport
• Road transport
• Marine transport
• Storage of purchased products in warehouses, distribution centers, and retail facilities.
Outbound logistics services purchased by the reporting company are categorized as upstream because they are a
purchased service. Emissions from transportation and distribution of purchased products upstream of the reporting
company’s tier 1 suppliers (e.g., transportation between a company’s tier 2 and tier 1 suppliers) are accounted for in
scope 3, category 1 (Purchased goods and services). Table 4.1 shows the scope and category of emissions where each
type of transportation and distribution activity should be accounted for.
3 Tier 1 suppliers are companies with which the reporting company has a purchase order for goods or services (e.g., materials, parts, components, etc.).
Tier 2 suppliers are companies with which tier 1 suppliers have a purchase order for goods and services (see figure 7.3 in the Scope 3 Standard).
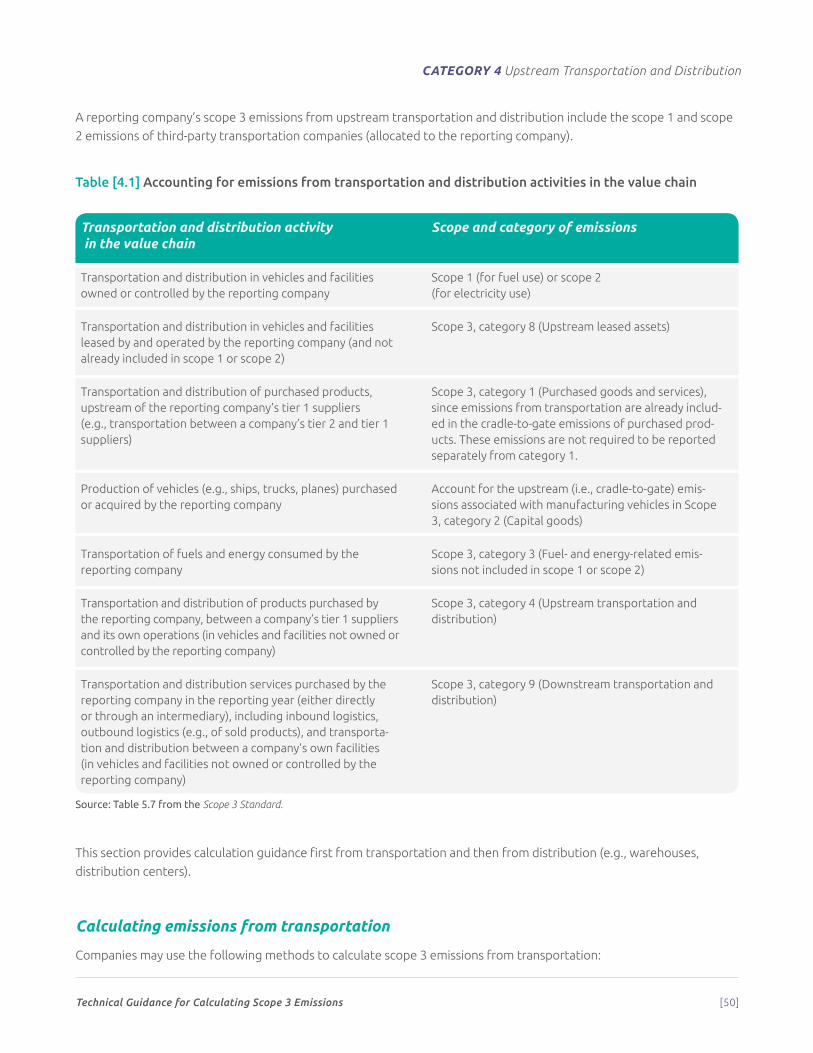
Technical Guidance for Calculating Scope 3 Emissions [50]
CATEGORY 4 Upstream Transportation and Distribution
A reporting company’s scope 3 emissions from upstream transportation and distribution include the scope 1 and scope
2 emissions of third-party transportation companies (allocated to the reporting company).
Table [4.1] Accounting for emissions from transportation and distribution activities in the value chain
Transportation and distribution activity in the value chain
Scope and category of emissions
Transportation and distribution in vehicles and facilities owned or controlled by the reporting company
Scope 1 (for fuel use) or scope 2 (for electricity use)
Transportation and distribution in vehicles and facilities leased by and operated by the reporting company (and not already included in scope 1 or scope 2)
Scope 3, category 8 (Upstream leased assets)
Transportation and distribution of purchased products, upstream of the reporting company’s tier 1 suppliers (e.g., transportation between a company’s tier 2 and tier 1 suppliers)
Scope 3, category 1 (Purchased goods and services), since emissions from transportation are already includ-ed in the cradle-to-gate emissions of purchased prod-ucts. These emissions are not required to be reported separately from category 1.
Production of vehicles (e.g., ships, trucks, planes) purchased or acquired by the reporting company
Account for the upstream (i.e., cradle-to-gate) emis-sions associated with manufacturing vehicles in Scope 3, category 2 (Capital goods)
Transportation of fuels and energy consumed by the reporting company
Scope 3, category 3 (Fuel- and energy-related emis-sions not included in scope 1 or scope 2)
Transportation and distribution of products purchased by the reporting company, between a company’s tier 1 suppliers and its own operations (in vehicles and facilities not owned or controlled by the reporting company)
Scope 3, category 4 (Upstream transportation and distribution)
Transportation and distribution services purchased by the reporting company in the reporting year (either directly or through an intermediary), including inbound logistics, outbound logistics (e.g., of sold products), and transporta-tion and distribution between a company’s own facilities (in vehicles and facilities not owned or controlled by the reporting company)
Scope 3, category 9 (Downstream transportation and distribution)
Source: Table 5.7 from the Scope 3 Standard.
This section provides calculation guidance first from transportation and then from distribution (e.g., warehouses,
distribution centers).
Calculating emissions from transportation
Companies may use the following methods to calculate scope 3 emissions from transportation:
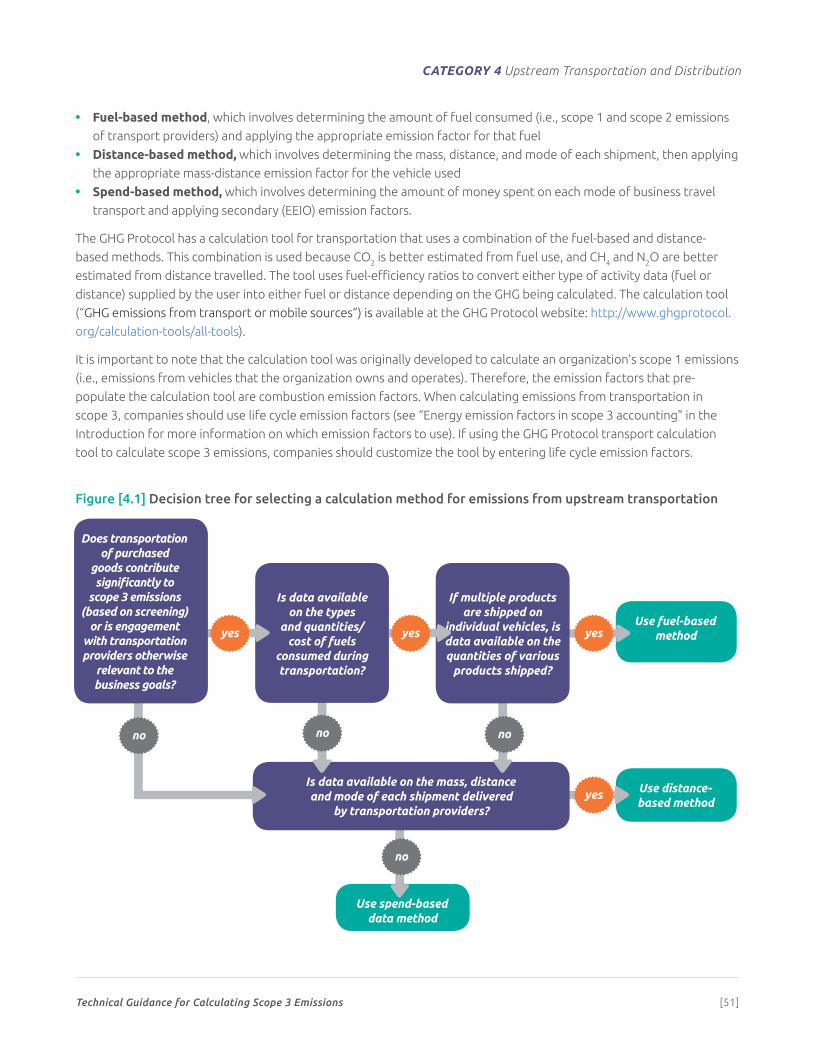
Technical Guidance for Calculating Scope 3 Emissions [51]
CATEGORY 4 Upstream Transportation and Distribution
• Fuel-based method, which involves determining the amount of fuel consumed (i.e., scope 1 and scope 2 emissions
of transport providers) and applying the appropriate emission factor for that fuel
• Distance-based method, which involves determining the mass, distance, and mode of each shipment, then applying
the appropriate mass-distance emission factor for the vehicle used
• Spend-based method, which involves determining the amount of money spent on each mode of business travel
transport and applying secondary (EEIO) emission factors.
The GHG Protocol has a calculation tool for transportation that uses a combination of the fuel-based and distance-
based methods. This combination is used because CO2 is better estimated from fuel use, and CH4 and N2O are better
estimated from distance travelled. The tool uses fuel-efficiency ratios to convert either type of activity data (fuel or
distance) supplied by the user into either fuel or distance depending on the GHG being calculated. The calculation tool
(“GHG emissions from transport or mobile sources”) is available at the GHG Protocol website: http://www.ghgprotocol.
org/calculation-tools/all-tools).
It is important to note that the calculation tool was originally developed to calculate an organization’s scope 1 emissions
(i.e., emissions from vehicles that the organization owns and operates). Therefore, the emission factors that pre-
populate the calculation tool are combustion emission factors. When calculating emissions from transportation in
scope 3, companies should use life cycle emission factors (see “Energy emission factors in scope 3 accounting” in the
Introduction for more information on which emission factors to use). If using the GHG Protocol transport calculation
tool to calculate scope 3 emissions, companies should customize the tool by entering life cycle emission factors.
Figure [4.1] Decision tree for selecting a calculation method for emissions from upstream transportation
Use spend-based data method
Use distance- based method
Use fuel-based method
Is data available on the mass, distance and mode of each shipment delivered
by transportation providers?
Is data available on the types
and quantities/cost of fuels
consumed during transportation?
If multiple products are shipped on
individual vehicles, is data available on the quantities of various
products shipped?
Does transportation of purchased
goods contribute significantly to
scope 3 emissions (based on screening)
or is engagement with transportation providers otherwise
relevant to the business goals?
no no no
no
yes yes yes
yes
Technical Guidance for Calculating Scope 3 Emissions [52]
CATEGORY 4 Upstream Transportation and Distribution
Fuel-based method (transportation)The fuel-based method should be used when companies can obtain data for fuel use from transport providers (and, if
applicable, refrigerant leakage due to refrigeration of products) from vehicle fleets (e.g., trucks, trains, planes, vessels).
Companies should also take into account any additional energy used and account for fugitive emissions (e.g., refrigerant
loss or air-conditioning). Companies may optionally calculate any emissions from unladen backhaul (i.e., the return
journey of the empty vehicle).
Where fuel use data is unavailable, the company may derive fuel use by using the:
• Amount spent on fuels and the average price of fuels
• Distance travelled and the vehicle’s fuel efficiency
• Amount spent on transportation services, fuel cost share (as percent of total cost of transportation services) and the
average price of fuels.
For calculating CO2, the fuel-based method is more accurate than the distance-based method because fuel
consumption is directly related to emissions.
The fuel-based method is best applied if the vehicle exclusively ships the reporting company’s purchased goods (i.e.,
exclusive use or truckload shipping, rather than less-than-truckload (LTL) shipping). Otherwise, emissions should be
allocated between goods shipped for the reporting company and goods shipped for other companies. See chapter 8 of
the Scope 3 Standard for further guidance on allocating emissions.
Companies should allocate emissions based on the following default limiting factors for each transportation mode,
unless more accurate data is available to show that another factor is the limiting factor:
• Road transport: Truck capacity is typically limited by mass, so mass-based allocation should be used
• Marine transport: Vessel capacity is typically limited by volume, so volume-based allocation should be used
• Air transport: Aircraft capacity is typically limited by mass, so mass-based allocation should be used
• Rail transport: Rail capacity is typically limited by mass, so mass-based allocation should be used.
If there are multiple shipments on a transport leg, distance should also be used as a means for allocation. (For more
information, see the Deutsche Post DHL example in this section.)
If data required for allocation is not available or reliable due to the variety of goods transported in one vehicle at the
same time, the distance-based method should be used to calculate scope 3 emissions.
Activity data neededCompanies should collect data on:
• Quantities of fuel (e.g., diesel, gasoline, jet fuel, biofuels) consumed
• Amount spent on fuels
• Quantities of fugitive emissions (e.g., from air conditioning and refrigeration).
If applicable:
• Distance travelled
• Average fuel efficiency of the vehicle, expressed in units of liters of fuel consumed per tonne per kilometer
transported
• Cost of fuels
• Volume and/or mass of purchased goods in the vehicle
• Information on whether the products are refrigerated in transport.

Technical Guidance for Calculating Scope 3 Emissions [53]
CATEGORY 4 Upstream Transportation and Distribution
Emission factors neededCompanies should collect:
• Fuel emission factors, expressed in units of emissions per unit of energy consumed (e.g., kg CO2e/liters, CO2e/Btu)
• For electric vehicles (if applicable), electricity emission factors, expressed in units of emissions per unit of electricity
consumed (e.g., kg CO2e/kWh)
• Fugitive emission factors, expressed in units of emissions per unit (e.g., kg CO2e/kg refrigerant leakage)
Emission factors should at a minimum include emissions from fuel combustion, and should, where possible, include
cradle-to-gate emissions of the fuel (i.e., from extraction, processing, and transportation to the point of use).
Note: For air travel emission factors, multipliers or other corrections to account for radiative forcing may be applied to
the GWP of emissions arising from aircraft transport. If applied, companies should disclose the specific factor used.
Data collection guidanceData sources for activity data include:
• Aggregated fuel receipts
• Purchase records (provided by transportation providers)
• Internal transport management systems.
Data sources for emission factors include:
• Transportation carriers
• Government agencies (e.g., Defra provides emission factors for the United Kingdom)
• The GHG Protocol website (http://www.ghgprotocol.org/calculation-tools/all-tools and http://www.ghgprotocol.
org/standards/scope-3-standard)
• Industry associations
• Additional sources in table 4.2.
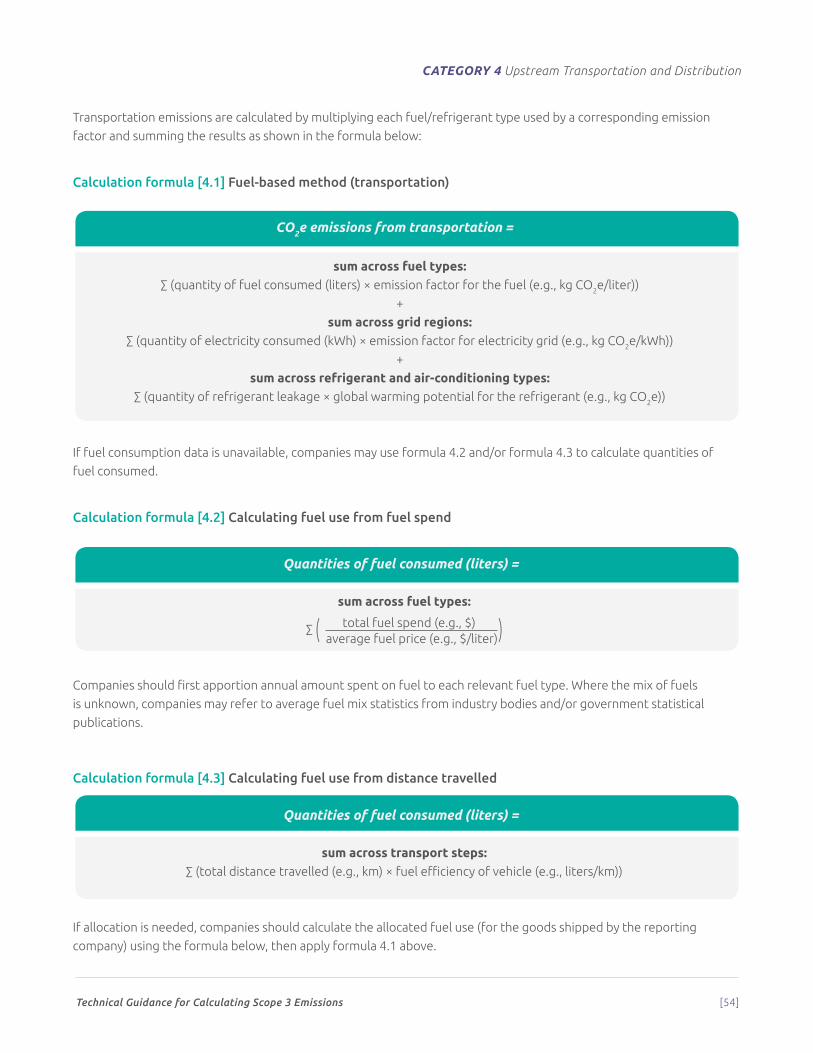
Technical Guidance for Calculating Scope 3 Emissions [54]
CATEGORY 4 Upstream Transportation and Distribution
Transportation emissions are calculated by multiplying each fuel/refrigerant type used by a corresponding emission
factor and summing the results as shown in the formula below:
Calculation formula [4.1] Fuel-based method (transportation)
CO2e emissions from transportation =
sum across fuel types:∑ (quantity of fuel consumed (liters) × emission factor for the fuel (e.g., kg CO2e/liter))
+
sum across grid regions:∑ (quantity of electricity consumed (kWh) × emission factor for electricity grid (e.g., kg CO2e/kWh))
+
sum across refrigerant and air-conditioning types:∑ (quantity of refrigerant leakage × global warming potential for the refrigerant (e.g., kg CO2e))
If fuel consumption data is unavailable, companies may use formula 4.2 and/or formula 4.3 to calculate quantities of
fuel consumed.
Calculation formula [4.2] Calculating fuel use from fuel spend
Quantities of fuel consumed (liters) =
sum across fuel types:
∑ ( total fuel spend (e.g., $) )
Companies should first apportion annual amount spent on fuel to each relevant fuel type. Where the mix of fuels
is unknown, companies may refer to average fuel mix statistics from industry bodies and/or government statistical
publications.
Calculation formula [4.3] Calculating fuel use from distance travelled
Quantities of fuel consumed (liters) =
sum across transport steps:∑ (total distance travelled (e.g., km) × fuel efficiency of vehicle (e.g., liters/km))
If allocation is needed, companies should calculate the allocated fuel use (for the goods shipped by the reporting
company) using the formula below, then apply formula 4.1 above.
average fuel price (e.g., $/liter)

Technical Guidance for Calculating Scope 3 Emissions [55]
CATEGORY 4 Upstream Transportation and Distribution
Calculation formula [4.4] Allocating fuel use
Allocated fuel use =
= total fuel consumed (liters) x ( mass/volume of company’s goods )
Companies may optionally substitute mass of goods by volume with dimensional mass or chargeable mass
where data is available to prove that the alternative method is more suitable.
Dimensional mass is a calculated mass that takes into account packaging volume as well as the actual mass of
the goods.
Chargeable mass is the higher value of either the actual or the dimensional mass of the goods.
Companies may optionally calculate emissions from unladen backhaul (i.e., the return journey of the empty vehicle)
using the following formula:
Calculation formula [4.5] Calculating emissions from unladen backhaul
CO2e emissions from unladen backhaul =
for each fuel type:∑ (quantity of fuel consumed from backhaul × emission factor for the fuel (e.g., kg CO2e/liter))
where: quantity of fuel consumed from backhaul
= average efficiency of vehicles unladed (l/km) × total distance travelled unladen.
mass/volume of goods transported
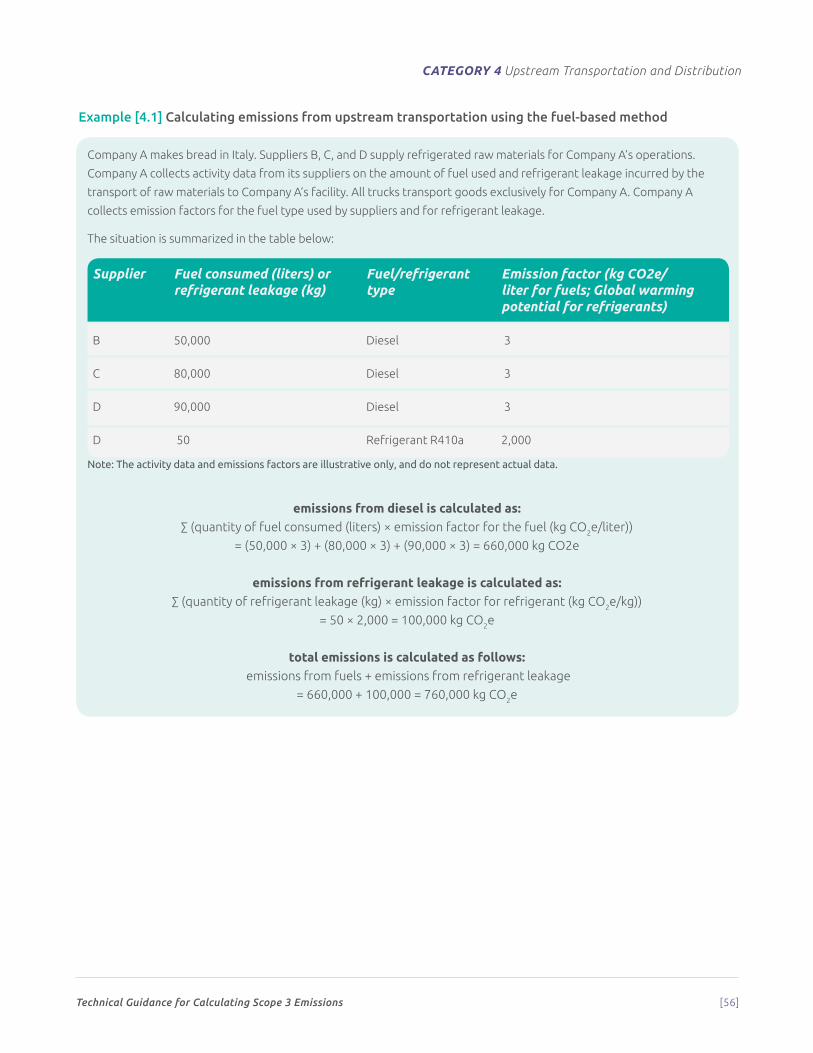
Technical Guidance for Calculating Scope 3 Emissions [56]
CATEGORY 4 Upstream Transportation and Distribution
Example [4.1] Calculating emissions from upstream transportation using the fuel-based method
Company A makes bread in Italy. Suppliers B, C, and D supply refrigerated raw materials for Company A’s operations.
Company A collects activity data from its suppliers on the amount of fuel used and refrigerant leakage incurred by the
transport of raw materials to Company A’s facility. All trucks transport goods exclusively for Company A. Company A
collects emission factors for the fuel type used by suppliers and for refrigerant leakage.
The situation is summarized in the table below:
Supplier Fuel consumed (liters) or refrigerant leakage (kg)
Fuel/refrigerant type
Emission factor (kg CO2e/ liter for fuels; Global warming potential for refrigerants)
B 50,000 Diesel 3
C 80,000 Diesel 3
D 90,000 Diesel 3
D 50 Refrigerant R410a 2,000
Note: The activity data and emissions factors are illustrative only, and do not represent actual data.
emissions from diesel is calculated as:∑ (quantity of fuel consumed (liters) × emission factor for the fuel (kg CO2e/liter))
= (50,000 × 3) + (80,000 × 3) + (90,000 × 3) = 660,000 kg CO2e
emissions from refrigerant leakage is calculated as:∑ (quantity of refrigerant leakage (kg) × emission factor for refrigerant (kg CO2e/kg))
= 50 × 2,000 = 100,000 kg CO2e
total emissions is calculated as follows: emissions from fuels + emissions from refrigerant leakage
= 660,000 + 100,000 = 760,000 kg CO2e
Technical Guidance for Calculating Scope 3 Emissions [57]
CATEGORY 4 Upstream Transportation and Distribution
Distance-based method (transportation)In this method, distance is multiplied by mass or volume of goods transported and relevant emission factors that
incorporate average fuel consumption, average utilization, average size and mass or volume of the goods and the
vehicles, and their associated GHG emissions.
Emission factors for this method are typically represented in grams or kilograms of carbon dioxide equivalent per
tonne-kilometer or TEU-kilometer. Tonne-kilometer is a unit of measure representing one tonne of goods transported
over 1 kilometer. TEU-kilometer is a unit of measure representing one twenty-foot container equivalent of goods
transported over 1 kilometer.
The distance-based method is especially useful for an organization that does not have access to fuel or mileage records
from the transport vehicles, or has shipments smaller than those that would consume an entire vehicle or vessel.
If sub-contractor fuel data cannot be easily obtained in order to use the fuel-based method, then the distance-based
method should be used. Distance can be tracked using internal management systems or, if these are unavailable, online
maps. However, accuracy is generally lower than the fuel-based method as assumptions are made about the average
fuel consumption, mass or volume of goods, and loading of vehicles.
Activity data neededCompanies should collect data on the distance travelled by transportation suppliers. This data may be obtained by:
• Mass or volume of the products sold
• Actual distances provided by transportation supplier (if actual distance is unavailable, companies may use the
shortest theoretical distance)
• Online maps or calculators
• Published port-to-port travel distances.
The actual distances should be used when available, and each leg of the transportation supply chain should be
collected separately.
Emission factors neededCompanies should collect:
• Emission factor by mode of transport (e.g., rail, air, road) or vehicle types (e.g., articulated lorry, container vessel),
expressed in units of greenhouse gas (CO2, CH4, N2O, or CO2e) per unit of mass (e.g., tonne) or volume (e.g., TEU)
travelled (e.g., kilometer).
Common forms of emission factors are kg CO2e/tonne/km for road transport or kg CO2e/TEU/km for sea transport.
Note: For air travel emission factors, multipliers or other corrections to account for radiative forcing may be applied to
the GWP of emissions arising from aircraft transport. If applied, companies should disclose the specific factor used.

Technical Guidance for Calculating Scope 3 Emissions [58]
CATEGORY 4 Upstream Transportation and Distribution
Data collection guidanceCompanies may obtain activity data from:
• Purchase orders
• Specific carrier or mode operator
• Internal management systems
• Industry associations
• Online maps and calculators.
Companies may obtain emission factors from:
• Transportation carriers
• Government agencies (e.g., Defra provides emission factors for the United Kingdom)
• The GHG Protocol website (http://www.ghgprotocol.org/calculation-tools/all-tools and http://www.ghgprotocol.
org/standards/scope-3-standard)
• Industry associations
• Additional sources in table 4.2.
When collecting emission factors, it is important to note that they may be vehicle, regional, or country specific.
Calculation resources include:
• GHG Protocol Calculation Tool, “Mobile Combustion GHG Emissions Calculation Tool. Version 2.0. June 2009,”
developed by World Resources Institute, available at http://www.ghgprotocol.org/calculation-tools/all-tools.
• U.S. EPA Climate Leaders GHG Inventory Protocol, “Optional Emissions from Commuting, Business Travel and
Product Transport,” available at: http://www.epa.gov/stateply/documents/resources/commute_travel_product.pdf
• UK Defra, “Guidance on Measuring and Reporting GHG Emissions from Freight Transport Operations,” available at
http://www.defra.gov.uk/environment/economy/business-efficiency/reporting/
• UK Defra GHG Conversion Factors, developed by the United Kingdom Department of Environment, Food and Rural
Affairs (Defra), available at http://www.defra.gov.uk/environment/economy/business-efficiency/reporting/
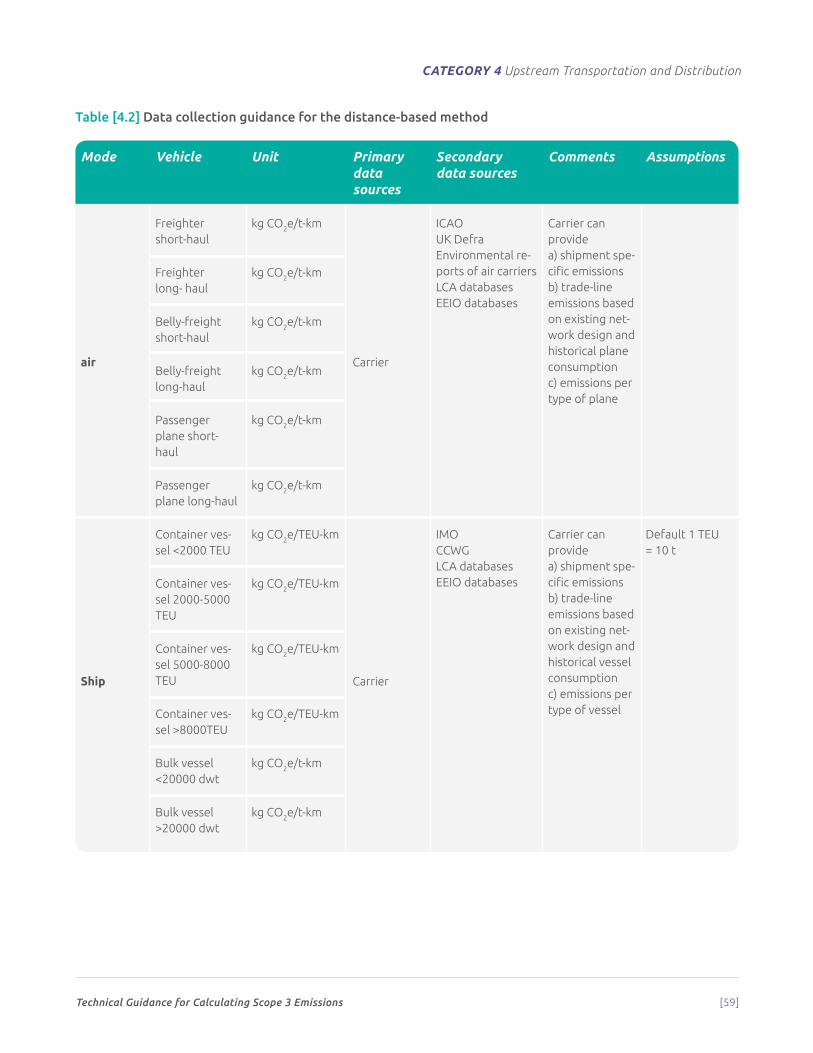
Technical Guidance for Calculating Scope 3 Emissions [59]
CATEGORY 4 Upstream Transportation and Distribution
Table [4.2] Data collection guidance for the distance-based method
Mode Vehicle Unit Primary data sources
Secondary data sources
Comments Assumptions
air
Freighter short-haul
kg CO2e/t-km
Carrier
ICAO UK DefraEnvironmental re-ports of air carriers LCA databasesEEIO databases
Carrier can provide a) shipment spe-cific emissions b) trade-line emissions based on existing net-work design and historical plane consumption c) emissions per type of plane
Freighter long- haul
kg CO2e/t-km
Belly-freight short-haul
kg CO2e/t-km
Belly-freight long-haul
kg CO2e/t-km
Passenger plane short-haul
kg CO2e/t-km
Passenger plane long-haul
kg CO2e/t-km
Ship
Container ves-sel <2000 TEU
kg CO2e/TEU-km
Carrier
IMO CCWG LCA databasesEEIO databases
Carrier can provide a) shipment spe-cific emissions b) trade-line emissions based on existing net-work design and historical vessel consumption c) emissions per type of vessel
Default 1 TEU = 10 t
Container ves-sel 2000-5000 TEU
kg CO2e/TEU-km
Container ves-sel 5000-8000 TEU
kg CO2e/TEU-km
Container ves-sel >8000TEU
kg CO2e/TEU-km
Bulk vessel <20000 dwt
kg CO2e/t-km
Bulk vessel >20000 dwt
kg CO2e/t-km
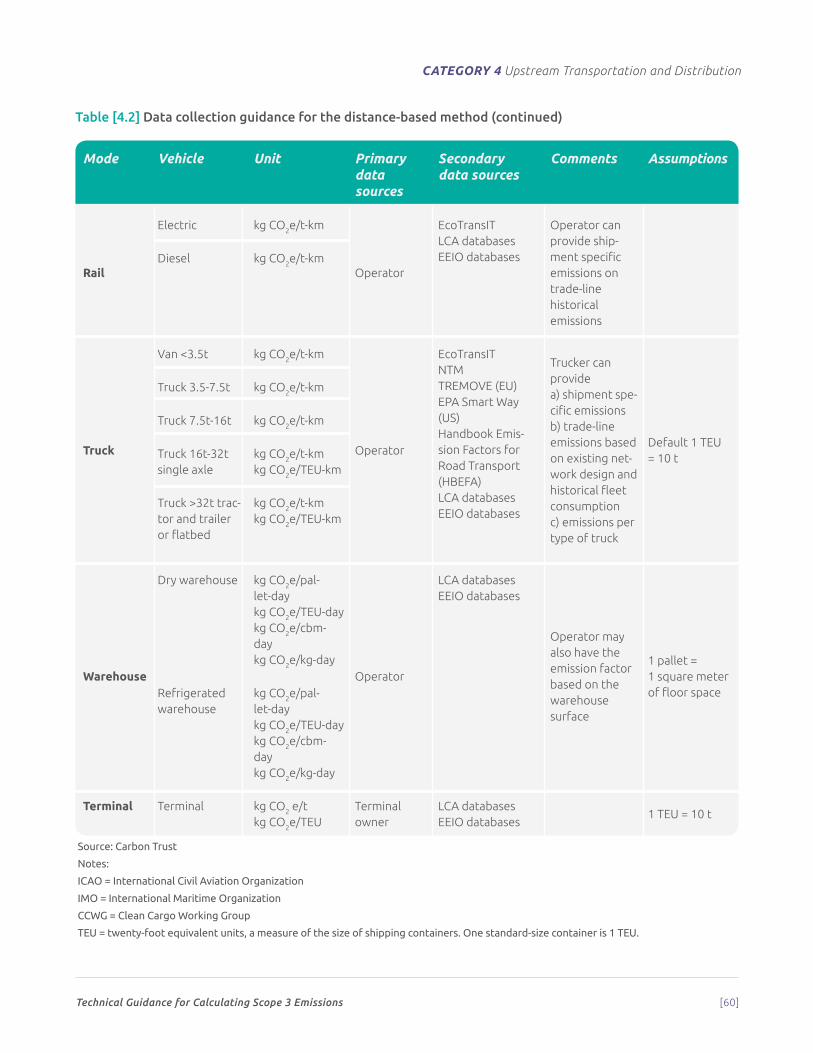
Technical Guidance for Calculating Scope 3 Emissions [60]
CATEGORY 4 Upstream Transportation and Distribution
Table [4.2] Data collection guidance for the distance-based method (continued)
Mode Vehicle Unit Primary data sources
Secondary data sources
Comments Assumptions
Rail
Electric kg CO2e/t-km
Operator
EcoTransIT LCA databasesEEIO databases
Operator can provide ship-ment specific emissions on trade-line historical emissions
Diesel kg CO2e/t-km
Truck
Van <3.5t kg CO2e/t-km
Operator
EcoTransIT NTM TREMOVE (EU) EPA Smart Way (US) Handbook Emis-sion Factors for Road Transport (HBEFA)LCA databasesEEIO databases
Trucker can provide a) shipment spe-cific emissions b) trade-line emissions based on existing net-work design and historical fleet consumption c) emissions per type of truck
Default 1 TEU = 10 t
Truck 3.5-7.5t kg CO2e/t-km
Truck 7.5t-16t kg CO2e/t-km
Truck 16t-32t single axle
kg CO2e/t-km kg CO2e/TEU-km
Truck >32t trac-tor and trailer or flatbed
kg CO2e/t-km kg CO2e/TEU-km
Warehouse
Dry warehouse kg CO2e/pal-let-day kg CO2e/TEU-day kg CO2e/cbm-day kg CO2e/kg-day
Operator
LCA databasesEEIO databases
Operator may also have the emission factor based on the warehouse surface
1 pallet = 1 square meter of floor spaceRefrigerated
warehousekg CO2e/pal-let-day kg CO2e/TEU-day kg CO2e/cbm-day kg CO2e/kg-day
Terminal Terminal kg CO2 e/tkg CO2e/TEU
Terminal owner
LCA databasesEEIO databases
1 TEU = 10 t
Source: Carbon Trust
Notes:
ICAO = International Civil Aviation Organization
IMO = International Maritime Organization
CCWG = Clean Cargo Working Group
TEU = twenty-foot equivalent units, a measure of the size of shipping containers. One standard-size container is 1 TEU.

Technical Guidance for Calculating Scope 3 Emissions [61]
CATEGORY 4 Upstream Transportation and Distribution
To calculate emissions, companies should multiply the quantity of goods purchased in mass (including packaging and
pallets) or volume by the distance travelled in the transport leg and then multiply that by an emission factor specific to
the transport leg (usually a transport mode- or vehicle type- specific emission factor).
Because each transport mode or vehicle type has a different emission factor, the transport legs should be calculated
separately and total emissions aggregated.
The following formula can be applied to all modes of transport and/or vehicle types to calculate emissions from
transportation:
Calculation formula [4.6] Distance-based method (transportation)
CO2e emissions from transportation =
sum across transport modes and/or vehicle types:= ∑ (mass of goods purchased (tonnes or volume ) × distance travelled in transport leg (km)
× emission factor of transport mode or vehicle type (kg CO2e/tonne or volume/km))
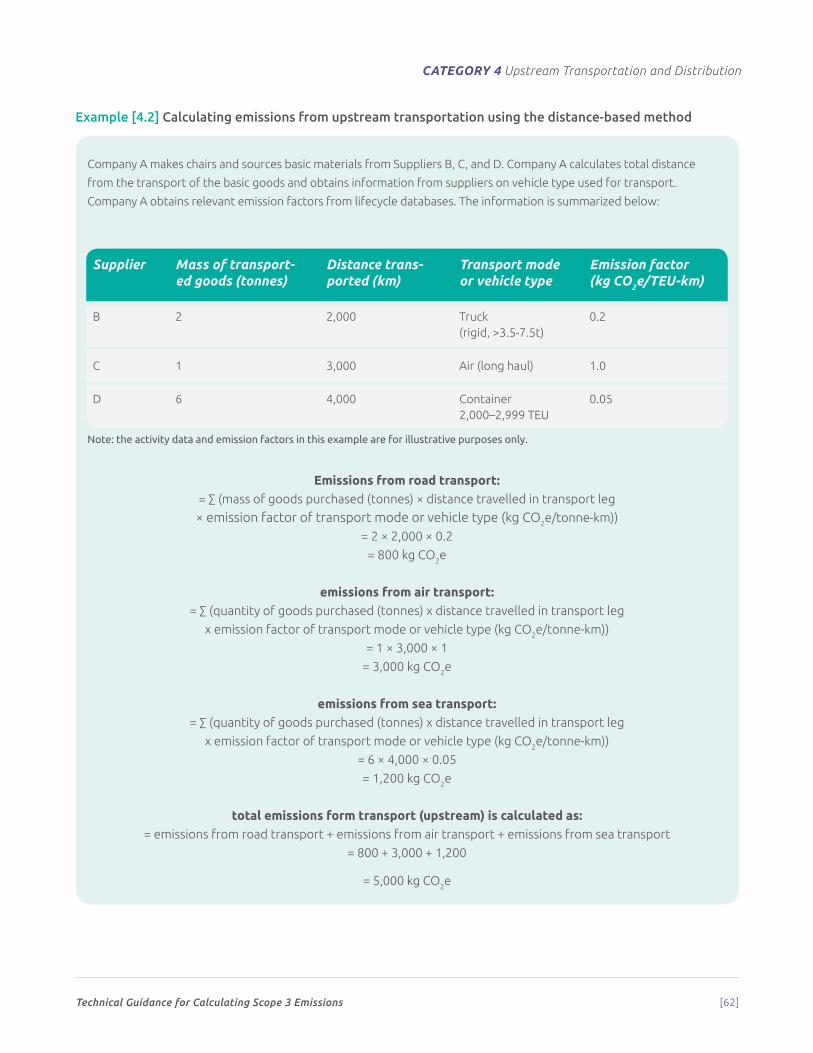
Technical Guidance for Calculating Scope 3 Emissions [62]
CATEGORY 4 Upstream Transportation and Distribution
Example [4.2] Calculating emissions from upstream transportation using the distance-based method
Company A makes chairs and sources basic materials from Suppliers B, C, and D. Company A calculates total distance
from the transport of the basic goods and obtains information from suppliers on vehicle type used for transport.
Company A obtains relevant emission factors from lifecycle databases. The information is summarized below:
Supplier Mass of transport-ed goods (tonnes)
Distance trans-ported (km)
Transport mode or vehicle type
Emission factor(kg CO2e/TEU-km)
B 2 2,000 Truck (rigid, >3.5-7.5t)
0.2
C 1 3,000 Air (long haul) 1.0
D 6 4,000 Container 2,000–2,999 TEU
0.05
Note: the activity data and emission factors in this example are for illustrative purposes only.
Emissions from road transport:= ∑ (mass of goods purchased (tonnes) × distance travelled in transport leg
× emission factor of transport mode or vehicle type (kg CO2e/tonne-km))
= 2 × 2,000 × 0.2
= 800 kg CO2e
emissions from air transport:= ∑ (quantity of goods purchased (tonnes) x distance travelled in transport leg
x emission factor of transport mode or vehicle type (kg CO2e/tonne-km))
= 1 × 3,000 × 1
= 3,000 kg CO2e
emissions from sea transport:= ∑ (quantity of goods purchased (tonnes) x distance travelled in transport leg
x emission factor of transport mode or vehicle type (kg CO2e/tonne-km))
= 6 × 4,000 × 0.05
= 1,200 kg CO2e
total emissions form transport (upstream) is calculated as:= emissions from road transport + emissions from air transport + emissions from sea transport
= 800 + 3,000 + 1,200
= 5,000 kg CO2e
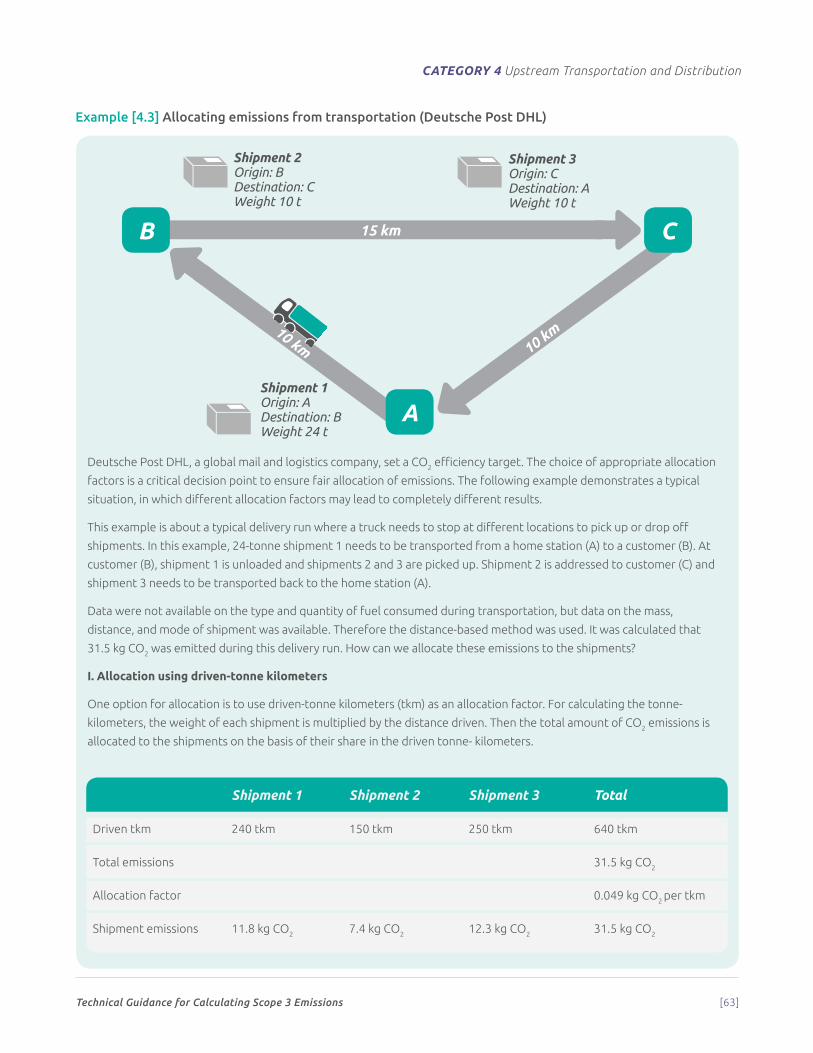
Technical Guidance for Calculating Scope 3 Emissions [63]
CATEGORY 4 Upstream Transportation and Distribution
Example [4.3] Allocating emissions from transportation (Deutsche Post DHL)
Deutsche Post DHL, a global mail and logistics company, set a CO2 efficiency target. The choice of appropriate allocation
factors is a critical decision point to ensure fair allocation of emissions. The following example demonstrates a typical
situation, in which different allocation factors may lead to completely different results.
This example is about a typical delivery run where a truck needs to stop at different locations to pick up or drop off
shipments. In this example, 24-tonne shipment 1 needs to be transported from a home station (A) to a customer (B). At
customer (B), shipment 1 is unloaded and shipments 2 and 3 are picked up. Shipment 2 is addressed to customer (C) and
shipment 3 needs to be transported back to the home station (A).
Data were not available on the type and quantity of fuel consumed during transportation, but data on the mass,
distance, and mode of shipment was available. Therefore the distance-based method was used. It was calculated that
31.5 kg CO2 was emitted during this delivery run. How can we allocate these emissions to the shipments?
I. Allocation using driven-tonne kilometers
One option for allocation is to use driven-tonne kilometers (tkm) as an allocation factor. For calculating the tonne-
kilometers, the weight of each shipment is multiplied by the distance driven. Then the total amount of CO2 emissions is
allocated to the shipments on the basis of their share in the driven tonne- kilometers.
Shipment 1 Shipment 2 Shipment 3 Total
Driven tkm 240 tkm 150 tkm 250 tkm 640 tkm
Total emissions 31.5 kg CO2
Allocation factor 0.049 kg CO2 per tkm
Shipment emissions 11.8 kg CO2 7.4 kg CO2 12.3 kg CO2 31.5 kg CO2
15 kmB C
10 km 10 km
Shipment 1Origin: ADestination: BWeight 24 t
Shipment 2Origin: BDestination: CWeight 10 t
Shipment 3Origin: CDestination: AWeight 10 t
1
2
3
4
5
6
7
8
9
10
11
12
13
14
15
16
17
1. wheat
2. tree
3. mounta
ins
4. glass bottl
e
5. plastic
bottle
6. aluminium can
7. facto
ry
8. lorry
9. cloud
10. recyclin
g bin
11. recyclin
g bin (colours
re
versed)
12. wind tu
rbines
13. chicken
14. cow 1
15. cow 2
16. shop
17. facto
ry showing carbon
emissions (c
arbon
emissions are shown in
ora
nge)
A
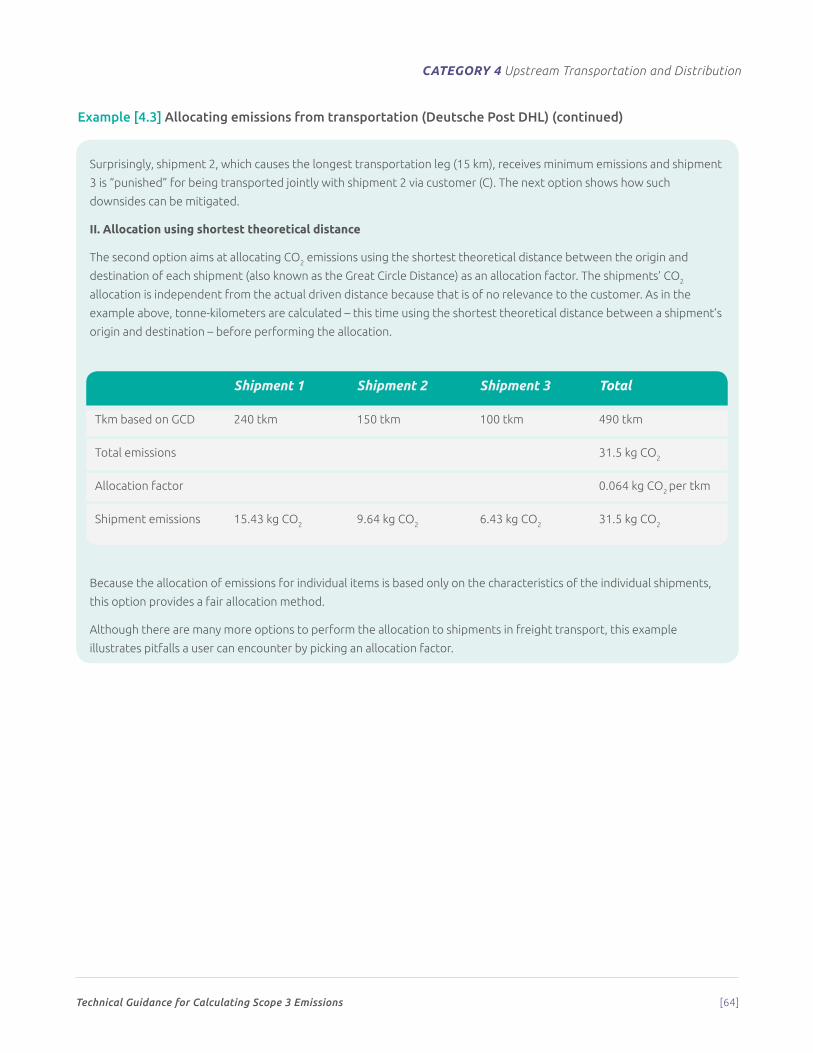
Technical Guidance for Calculating Scope 3 Emissions [64]
CATEGORY 4 Upstream Transportation and Distribution
Surprisingly, shipment 2, which causes the longest transportation leg (15 km), receives minimum emissions and shipment
3 is “punished” for being transported jointly with shipment 2 via customer (C). The next option shows how such
downsides can be mitigated.
II. Allocation using shortest theoretical distance
The second option aims at allocating CO2 emissions using the shortest theoretical distance between the origin and
destination of each shipment (also known as the Great Circle Distance) as an allocation factor. The shipments’ CO2
allocation is independent from the actual driven distance because that is of no relevance to the customer. As in the
example above, tonne-kilometers are calculated – this time using the shortest theoretical distance between a shipment’s
origin and destination – before performing the allocation.
Shipment 1 Shipment 2 Shipment 3 Total
Tkm based on GCD 240 tkm 150 tkm 100 tkm 490 tkm
Total emissions 31.5 kg CO2
Allocation factor 0.064 kg CO2 per tkm
Shipment emissions 15.43 kg CO2 9.64 kg CO2 6.43 kg CO2 31.5 kg CO2
Because the allocation of emissions for individual items is based only on the characteristics of the individual shipments,
this option provides a fair allocation method.
Although there are many more options to perform the allocation to shipments in freight transport, this example
illustrates pitfalls a user can encounter by picking an allocation factor.
Example [4.3] Allocating emissions from transportation (Deutsche Post DHL) (continued)
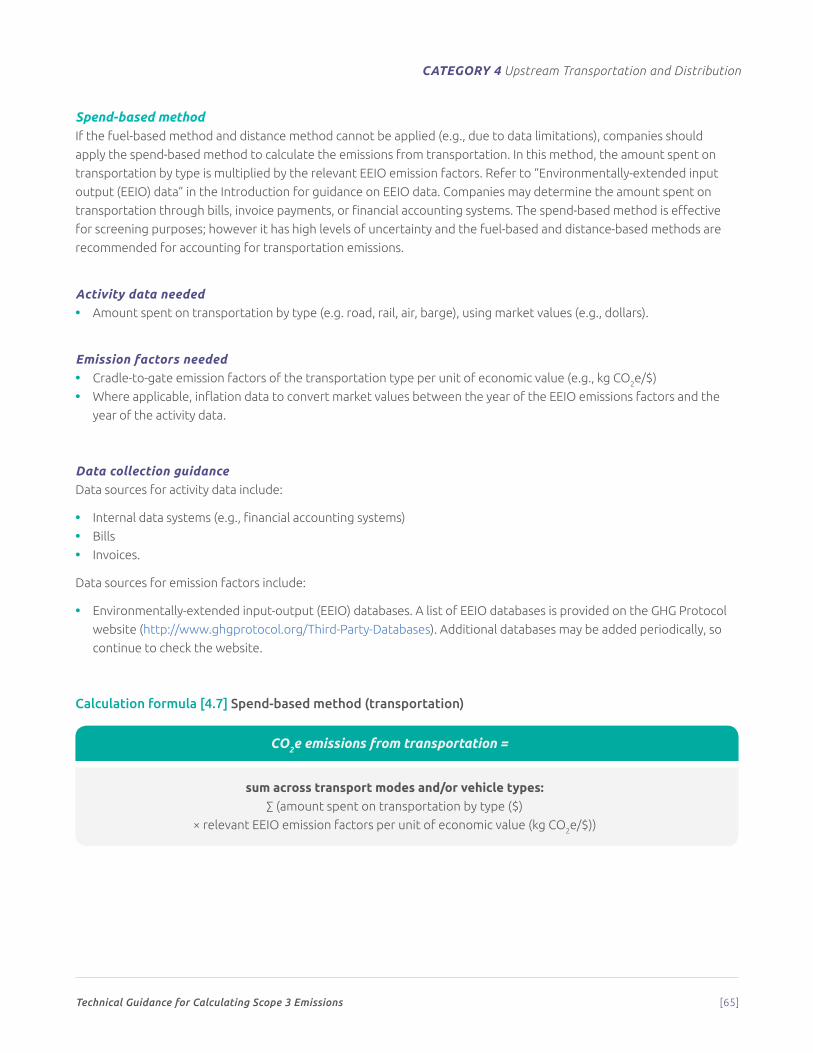
Technical Guidance for Calculating Scope 3 Emissions [65]
CATEGORY 4 Upstream Transportation and Distribution
Spend-based methodIf the fuel-based method and distance method cannot be applied (e.g., due to data limitations), companies should
apply the spend-based method to calculate the emissions from transportation. In this method, the amount spent on
transportation by type is multiplied by the relevant EEIO emission factors. Refer to “Environmentally-extended input
output (EEIO) data” in the Introduction for guidance on EEIO data. Companies may determine the amount spent on
transportation through bills, invoice payments, or financial accounting systems. The spend-based method is effective
for screening purposes; however it has high levels of uncertainty and the fuel-based and distance-based methods are
recommended for accounting for transportation emissions.
Activity data needed • Amount spent on transportation by type (e.g. road, rail, air, barge), using market values (e.g., dollars).
Emission factors needed • Cradle-to-gate emission factors of the transportation type per unit of economic value (e.g., kg CO2e/$)
• Where applicable, inflation data to convert market values between the year of the EEIO emissions factors and the
year of the activity data.
Data collection guidanceData sources for activity data include:
• Internal data systems (e.g., financial accounting systems)
• Bills
• Invoices.
Data sources for emission factors include:
• Environmentally-extended input-output (EEIO) databases. A list of EEIO databases is provided on the GHG Protocol
website (http://www.ghgprotocol.org/Third-Party-Databases). Additional databases may be added periodically, so
continue to check the website.
Calculation formula [4.7] Spend-based method (transportation)
CO2e emissions from transportation =
sum across transport modes and/or vehicle types: ∑ (amount spent on transportation by type ($)
× relevant EEIO emission factors per unit of economic value (kg CO2e/$))
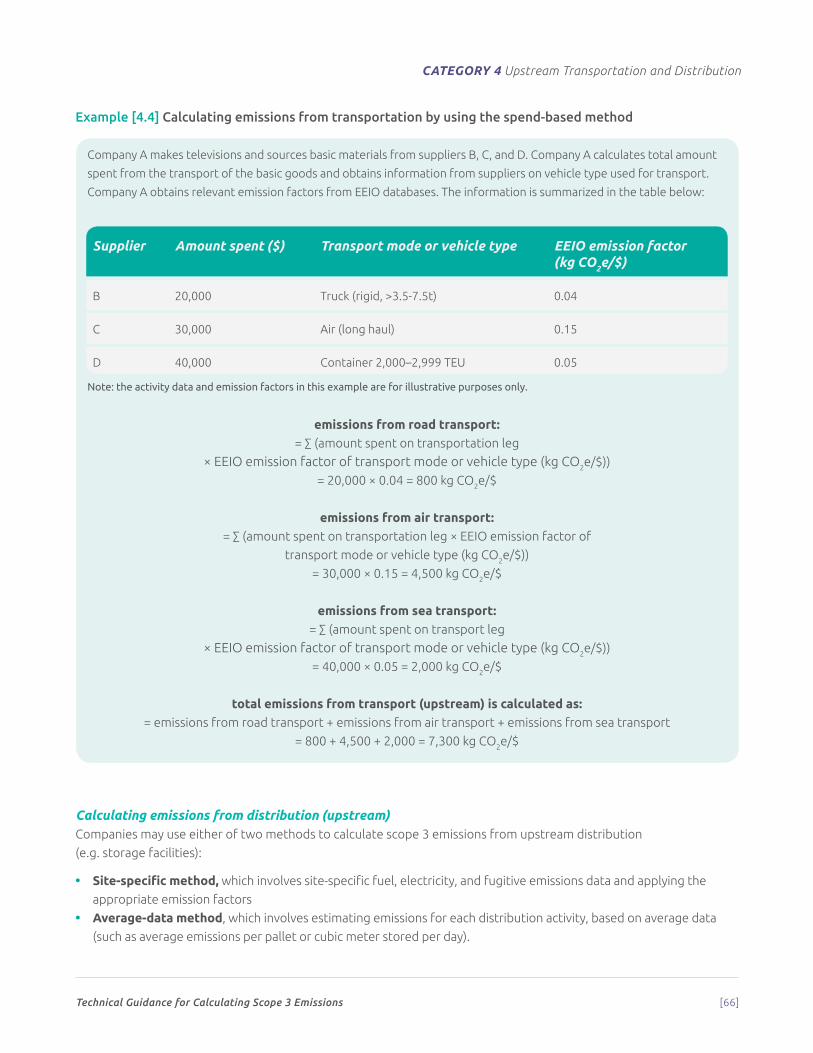
Technical Guidance for Calculating Scope 3 Emissions [66]
CATEGORY 4 Upstream Transportation and Distribution
Example [4.4] Calculating emissions from transportation by using the spend-based method
Company A makes televisions and sources basic materials from suppliers B, C, and D. Company A calculates total amount
spent from the transport of the basic goods and obtains information from suppliers on vehicle type used for transport.
Company A obtains relevant emission factors from EEIO databases. The information is summarized in the table below:
Supplier Amount spent ($) Transport mode or vehicle type EEIO emission factor(kg CO2e/$)
B 20,000 Truck (rigid, >3.5-7.5t) 0.04
C 30,000 Air (long haul) 0.15
D 40,000 Container 2,000–2,999 TEU 0.05
Note: the activity data and emission factors in this example are for illustrative purposes only.
emissions from road transport:= ∑ (amount spent on transportation leg
× EEIO emission factor of transport mode or vehicle type (kg CO2e/$))
= 20,000 × 0.04 = 800 kg CO2e/$
emissions from air transport:= ∑ (amount spent on transportation leg × EEIO emission factor of
transport mode or vehicle type (kg CO2e/$))
= 30,000 × 0.15 = 4,500 kg CO2e/$
emissions from sea transport:= ∑ (amount spent on transport leg
× EEIO emission factor of transport mode or vehicle type (kg CO2e/$))
= 40,000 × 0.05 = 2,000 kg CO2e/$
total emissions from transport (upstream) is calculated as:= emissions from road transport + emissions from air transport + emissions from sea transport
= 800 + 4,500 + 2,000 = 7,300 kg CO2e/$
Calculating emissions from distribution (upstream)Companies may use either of two methods to calculate scope 3 emissions from upstream distribution
(e.g. storage facilities):
• Site-specific method, which involves site-specific fuel, electricity, and fugitive emissions data and applying the
appropriate emission factors
• Average-data method, which involves estimating emissions for each distribution activity, based on average data
(such as average emissions per pallet or cubic meter stored per day).
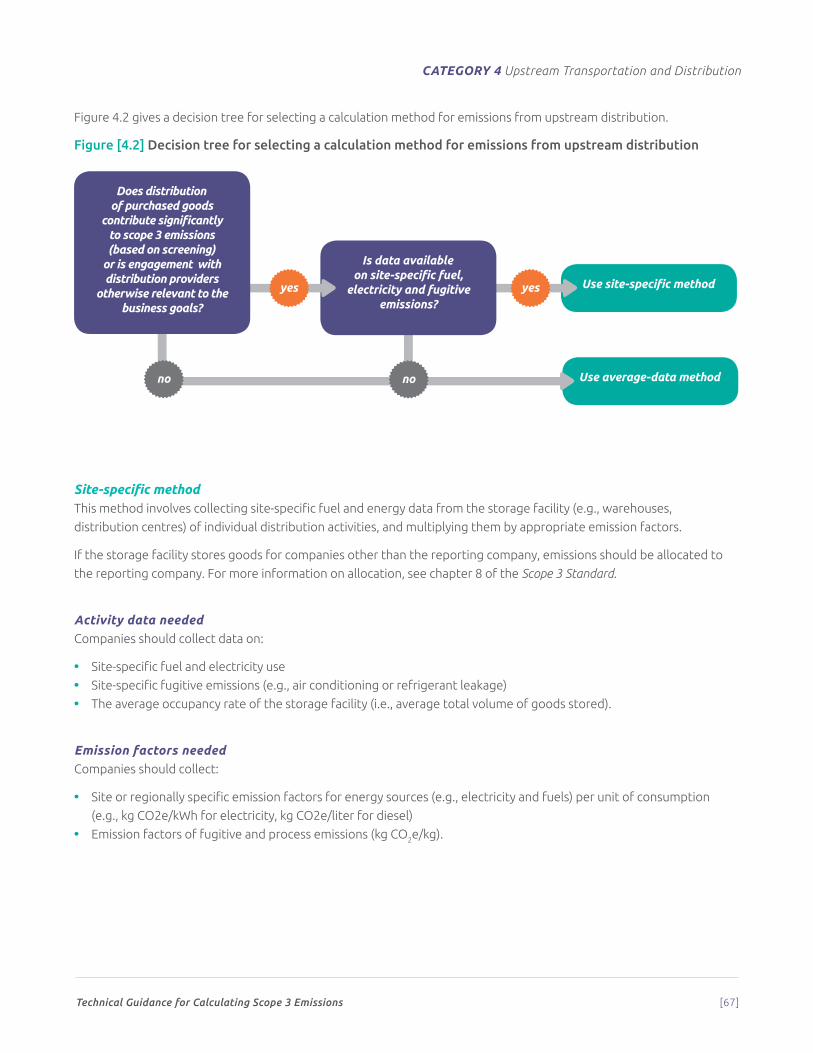
Technical Guidance for Calculating Scope 3 Emissions [67]
CATEGORY 4 Upstream Transportation and Distribution
Figure 4.2 gives a decision tree for selecting a calculation method for emissions from upstream distribution.
Figure [4.2] Decision tree for selecting a calculation method for emissions from upstream distribution
Site-specific methodThis method involves collecting site-specific fuel and energy data from the storage facility (e.g., warehouses,
distribution centres) of individual distribution activities, and multiplying them by appropriate emission factors.
If the storage facility stores goods for companies other than the reporting company, emissions should be allocated to
the reporting company. For more information on allocation, see chapter 8 of the Scope 3 Standard.
Activity data neededCompanies should collect data on:
• Site-specific fuel and electricity use
• Site-specific fugitive emissions (e.g., air conditioning or refrigerant leakage)
• The average occupancy rate of the storage facility (i.e., average total volume of goods stored).
Emission factors neededCompanies should collect:
• Site or regionally specific emission factors for energy sources (e.g., electricity and fuels) per unit of consumption
(e.g., kg CO2e/kWh for electricity, kg CO2e/liter for diesel)
• Emission factors of fugitive and process emissions (kg CO2e/kg).
Use average-data method
Use site-specific method
no no
Is data available on site-specific fuel,
electricity and fugitive emissions?
yesyes
Does distribution of purchased goods
contribute significantly to scope 3 emissions (based on screening)
or is engagement with distribution providers
otherwise relevant to the business goals?
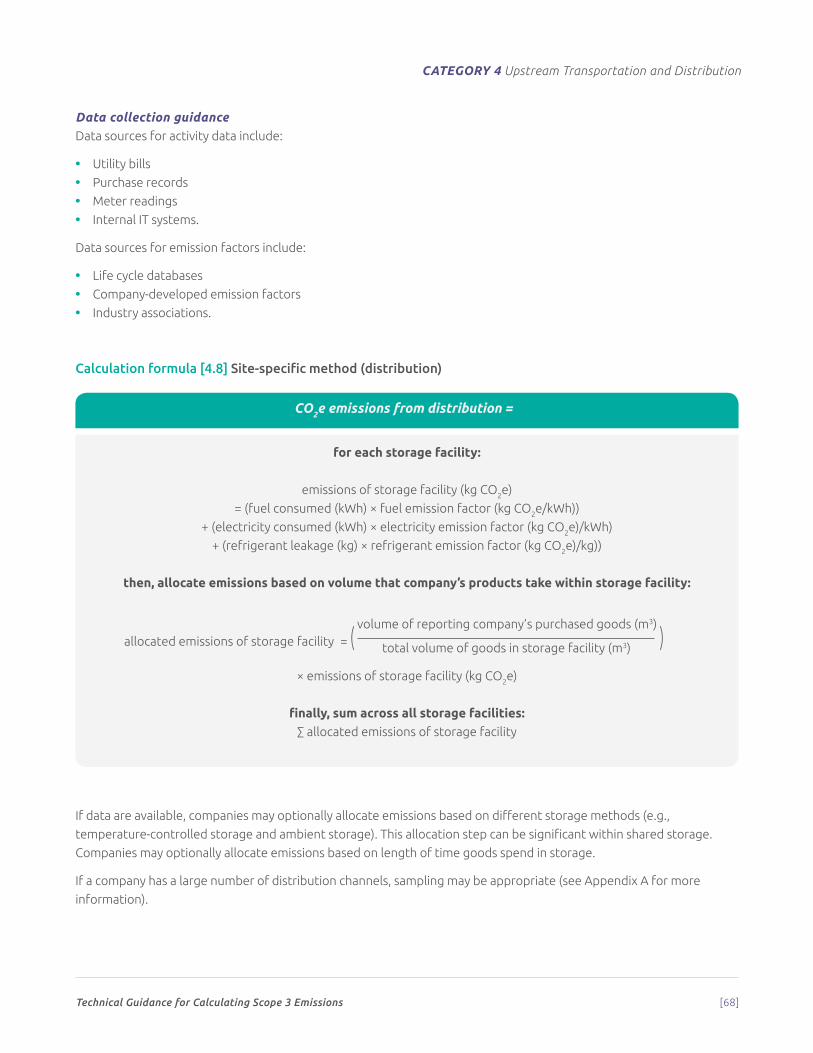
Technical Guidance for Calculating Scope 3 Emissions [68]
CATEGORY 4 Upstream Transportation and Distribution
Data collection guidanceData sources for activity data include:
• Utility bills
• Purchase records
• Meter readings
• Internal IT systems.
Data sources for emission factors include:
• Life cycle databases
• Company-developed emission factors
• Industry associations.
Calculation formula [4.8] Site-specific method (distribution)
CO2e emissions from distribution =
for each storage facility:
emissions of storage facility (kg CO2e)
= (fuel consumed (kWh) × fuel emission factor (kg CO2e/kWh))
+ (electricity consumed (kWh) × electricity emission factor (kg CO2e)/kWh)
+ (refrigerant leakage (kg) × refrigerant emission factor (kg CO2e)/kg))
then, allocate emissions based on volume that company’s products take within storage facility:
= ( volume of reporting company’s purchased goods (m3) )
× emissions of storage facility (kg CO2e)
finally, sum across all storage facilities:∑ allocated emissions of storage facility
If data are available, companies may optionally allocate emissions based on different storage methods (e.g.,
temperature-controlled storage and ambient storage). This allocation step can be significant within shared storage.
Companies may optionally allocate emissions based on length of time goods spend in storage.
If a company has a large number of distribution channels, sampling may be appropriate (see Appendix A for more
information).
total volume of goods in storage facility (m3) allocated emissions of storage facility
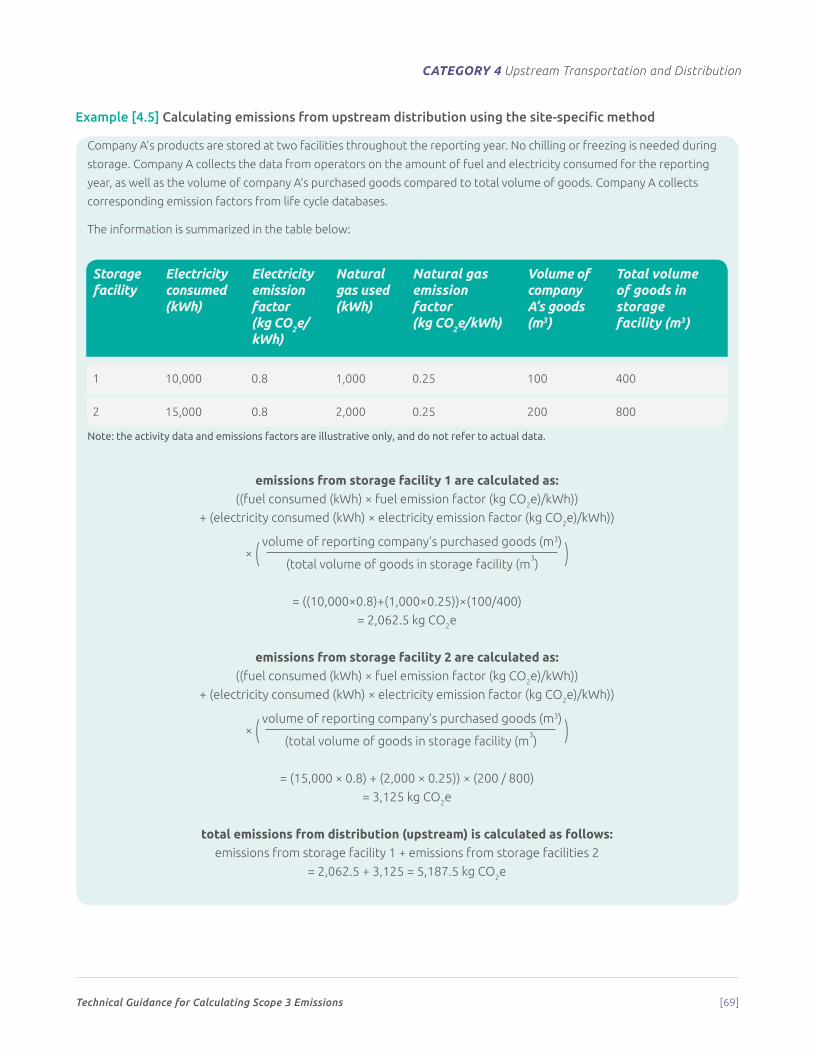
Technical Guidance for Calculating Scope 3 Emissions [69]
CATEGORY 4 Upstream Transportation and Distribution
Example [4.5] Calculating emissions from upstream distribution using the site-specific method
Company A’s products are stored at two facilities throughout the reporting year. No chilling or freezing is needed during
storage. Company A collects the data from operators on the amount of fuel and electricity consumed for the reporting
year, as well as the volume of company A’s purchased goods compared to total volume of goods. Company A collects
corresponding emission factors from life cycle databases.
The information is summarized in the table below:
Storage facility
Electricity consumed (kWh)
Electricity emission factor (kg CO2e/kWh)
Natural gas used (kWh)
Natural gas emission factor(kg CO2e/kWh)
Volume of company A’s goods (m3)
Total volume of goods in storage facility (m3)
1 10,000 0.8 1,000 0.25 100 400
2 15,000 0.8 2,000 0.25 200 800
Note: the activity data and emissions factors are illustrative only, and do not refer to actual data.
emissions from storage facility 1 are calculated as:((fuel consumed (kWh) × fuel emission factor (kg CO2e)/kWh))
+ (electricity consumed (kWh) × electricity emission factor (kg CO2e)/kWh))
× (
volume of reporting company’s purchased goods (m3) )
= ((10,000×0.8)+(1,000×0.25))×(100/400)
= 2,062.5 kg CO2e
emissions from storage facility 2 are calculated as:((fuel consumed (kWh) × fuel emission factor (kg CO2e)/kWh))
+ (electricity consumed (kWh) × electricity emission factor (kg CO2e)/kWh))
× (
volume of reporting company’s purchased goods (m3) )
= (15,000 × 0.8) + (2,000 × 0.25)) × (200 / 800)
= 3,125 kg CO2e
total emissions from distribution (upstream) is calculated as follows:emissions from storage facility 1 + emissions from storage facilities 2
= 2,062.5 + 3,125 = 5,187.5 kg CO2e
(total volume of goods in storage facility (m3)
(total volume of goods in storage facility (m3)
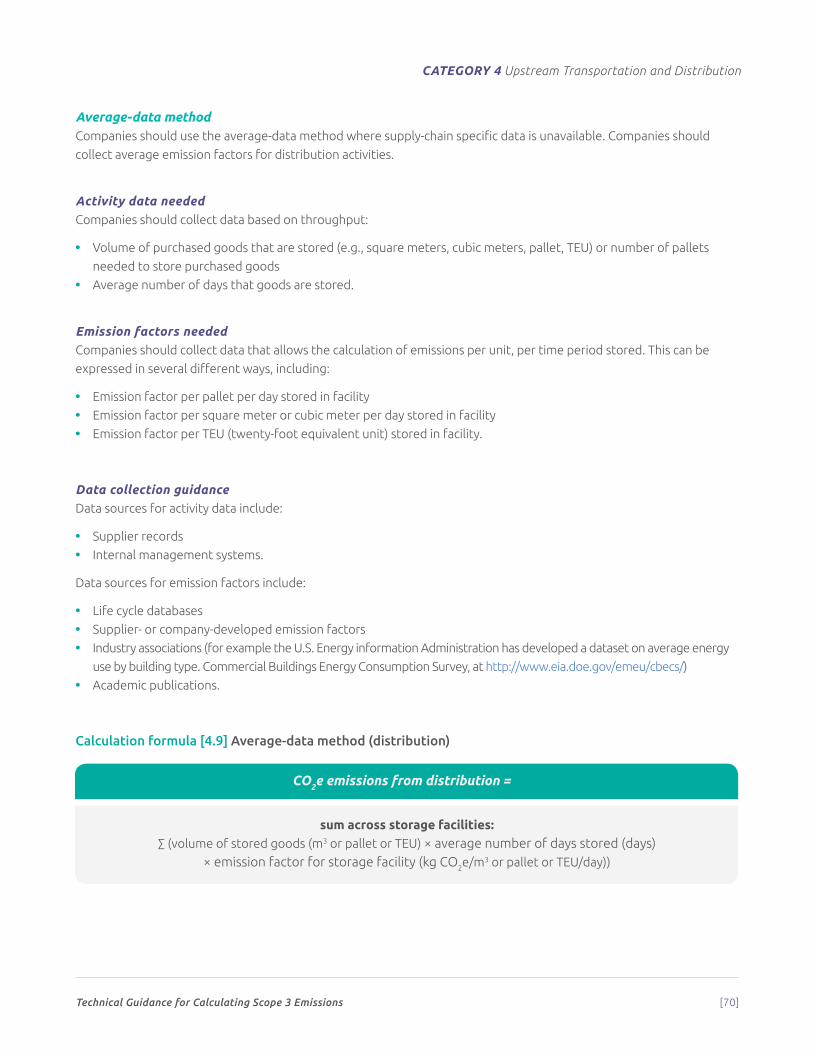
Technical Guidance for Calculating Scope 3 Emissions [70]
CATEGORY 4 Upstream Transportation and Distribution
Average-data methodCompanies should use the average-data method where supply-chain specific data is unavailable. Companies should
collect average emission factors for distribution activities.
Activity data neededCompanies should collect data based on throughput:
• Volume of purchased goods that are stored (e.g., square meters, cubic meters, pallet, TEU) or number of pallets
needed to store purchased goods
• Average number of days that goods are stored.
Emission factors neededCompanies should collect data that allows the calculation of emissions per unit, per time period stored. This can be
expressed in several different ways, including:
• Emission factor per pallet per day stored in facility
• Emission factor per square meter or cubic meter per day stored in facility
• Emission factor per TEU (twenty-foot equivalent unit) stored in facility.
Data collection guidanceData sources for activity data include:
• Supplier records
• Internal management systems.
Data sources for emission factors include:
• Life cycle databases
• Supplier- or company-developed emission factors
• Industry associations (for example the U.S. Energy information Administration has developed a dataset on average energy
use by building type. Commercial Buildings Energy Consumption Survey, at http://www.eia.doe.gov/emeu/cbecs/)
• Academic publications.
Calculation formula [4.9] Average-data method (distribution)
CO2e emissions from distribution =
sum across storage facilities:∑ (volume of stored goods (m3 or pallet or TEU) × average number of days stored (days)
× emission factor for storage facility (kg CO2e/m3 or pallet or TEU/day))
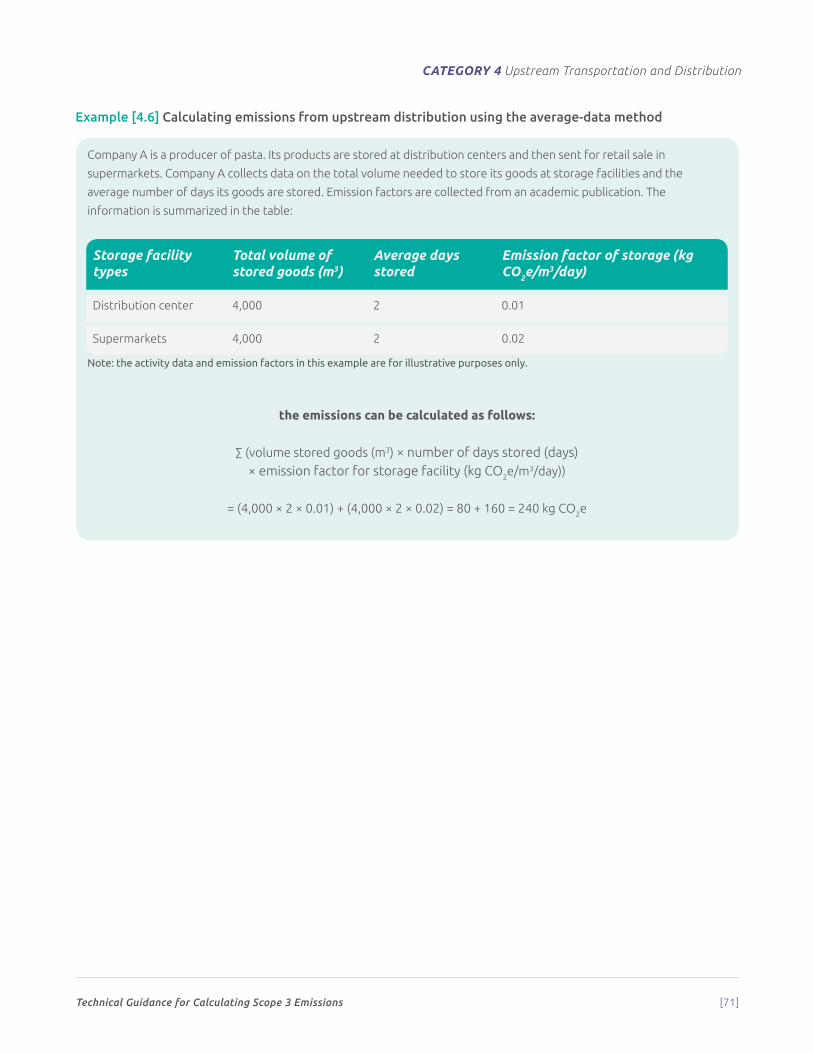
Technical Guidance for Calculating Scope 3 Emissions [71]
CATEGORY 4 Upstream Transportation and Distribution
Example [4.6] Calculating emissions from upstream distribution using the average-data method
Company A is a producer of pasta. Its products are stored at distribution centers and then sent for retail sale in
supermarkets. Company A collects data on the total volume needed to store its goods at storage facilities and the
average number of days its goods are stored. Emission factors are collected from an academic publication. The
information is summarized in the table:
Storage facility types
Total volume of stored goods (m3)
Average days stored
Emission factor of storage (kg CO2e/m3/day)
Distribution center 4,000 2 0.01
Supermarkets 4,000 2 0.02
Note: the activity data and emission factors in this example are for illustrative purposes only.
the emissions can be calculated as follows:
∑ (volume stored goods (m3) × number of days stored (days)× emission factor for storage facility (kg CO2e/m3/day))
= (4,000 × 2 × 0.01) + (4,000 × 2 × 0.02) = 80 + 160 = 240 kg CO2e
Technical Guidance for Calculating Scope 3 Emissions [72]
5
Category 5: Waste Generated in OperationsCategory description
C ategory 5 includes emissions from third-party disposal and treatment of waste
generated in the reporting company’s owned or controlled operations in the
reporting year. This category includes emissions from disposal of both solid
waste and wastewater.
Only waste treatment in facilities owned or operated by third parties is included in scope 3. Waste treatment at facilities
owned or controlled by the reporting company is accounted for in scope 1 and scope 2. Treatment of waste generated
in operations is categorized as an upstream scope 3 category because waste management services are purchased by
the reporting company.
This category includes all future emissions that result from waste generated in the reporting year. (See chapter 5.4 of
the Scope 3 Standard for more information on the time boundary of scope 3 categories.)
Waste treatment activities may include:
• Disposal in a landfill
• Disposal in a landfill with landfill-gas-to-energy (LFGTE) – that is, combustion of landfill gas to generate electricity
• Recovery for recycling
• Incineration
• Composting
• Waste-to-energy (WTE) or energy-from-waste (EfW) – that is, combustion of municipal solid waste (MSW) to generate electricity
• Wastewater treatment.
A reporting company’s scope 3 emissions from waste generated in operations derive from the scope 1 and scope 2
emissions of solid waste and wastewater management companies. Companies may optionally include emissions from
transportation of waste in vehicles operated by a third party.
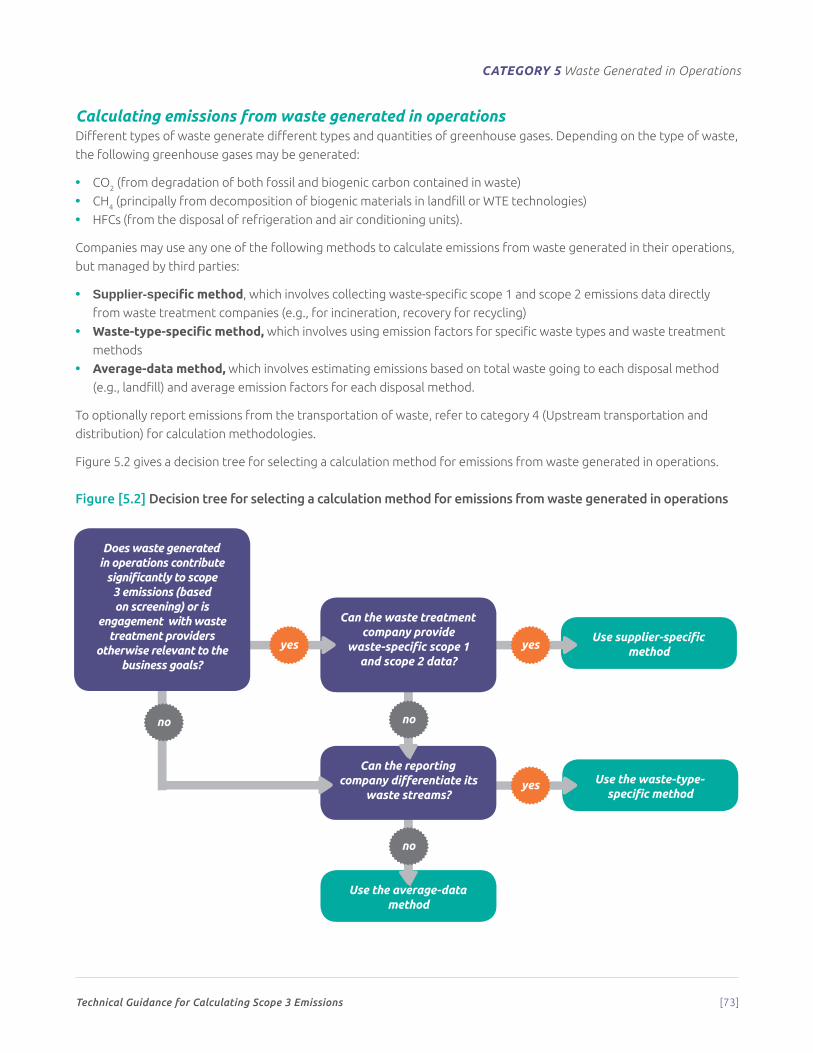
Technical Guidance for Calculating Scope 3 Emissions [73]
CATEGORY 5 Waste Generated in Operations
Calculating emissions from waste generated in operationsDifferent types of waste generate different types and quantities of greenhouse gases. Depending on the type of waste,
the following greenhouse gases may be generated:
• CO2 (from degradation of both fossil and biogenic carbon contained in waste)
• CH4 (principally from decomposition of biogenic materials in landfill or WTE technologies)
• HFCs (from the disposal of refrigeration and air conditioning units).
Companies may use any one of the following methods to calculate emissions from waste generated in their operations,
but managed by third parties:
• Supplier-specific method, which involves collecting waste-specific scope 1 and scope 2 emissions data directly
from waste treatment companies (e.g., for incineration, recovery for recycling)
• Waste-type-specific method, which involves using emission factors for specific waste types and waste treatment
methods
• Average-data method, which involves estimating emissions based on total waste going to each disposal method
(e.g., landfill) and average emission factors for each disposal method.
To optionally report emissions from the transportation of waste, refer to category 4 (Upstream transportation and
distribution) for calculation methodologies.
Figure 5.2 gives a decision tree for selecting a calculation method for emissions from waste generated in operations.
Figure [5.2] Decision tree for selecting a calculation method for emissions from waste generated in operations
Use the average-data method
no
Use the waste-type- specific method
Can the reporting company differentiate its
waste streams?
Use supplier-specific method
no no
Can the waste treatment company provide
waste-specific scope 1 and scope 2 data?
yes
yes
yes
Does waste generated in operations contribute
significantly to scope 3 emissions (based on screening) or is
engagement with waste treatment providers
otherwise relevant to the business goals?

Technical Guidance for Calculating Scope 3 Emissions [74]
CATEGORY 5 Waste Generated in Operations
Supplier-specific methodIn certain cases, third party waste-treatment companies may be able to provide waste-specific scope 1 and scope 2
emissions data directly to customers (e.g., for incineration, recovery for recycling).
Activity data neededCompanies should collect:
• Allocated scope 1 and scope 2 emissions of the waste-treatment company (allocated to the waste collected from
the reporting company).
Emission factors neededIf using the supplier-specific method, the reporting company collects emissions data from waste treatment
companies, so no emission factors are required (the company would have already used emission factors to calculate
the emissions).
Calculation formula [5.1] Supplier-specific method
CO2e emissions from waste generated in operations =
sum across waste treatment providers:∑ allocated scope 1 and scope 2 emissions of waste treatment company
Waste-type-specific methodEmissions from waste depend on the type of waste being disposed of, and the waste diversion method. Therefore,
companies should try to differentiate waste based on its type (e.g., cardboard, food-waste, wastewater) and the waste
treatment method (e.g., incinerated, landfilled, recycled, wastewater).
Activity data neededCompanies should collect:
• Waste produced (e.g., tonne/ cubic meter) and type of waste generated in operations
• For each waste type, specific waste treatment method applied (e.g., landfilled, incinerated, recycled).
Because many waste operators charge for waste disposal by the method used, disposal methods may be identified on
utility bills. The information may also be stored on internal IT systems. Companies with leased facilities may have difficulty
obtaining primary data. Guidance on improving data collection can be found in chapter 7 of the Scope 3 Standard.
Emission factors neededCompanies should collect:
• Waste type-specific and waste treatment-specific emission factors. The emission factors should include end-of-life
processes only. Emission factors may include emissions from transportation of waste.
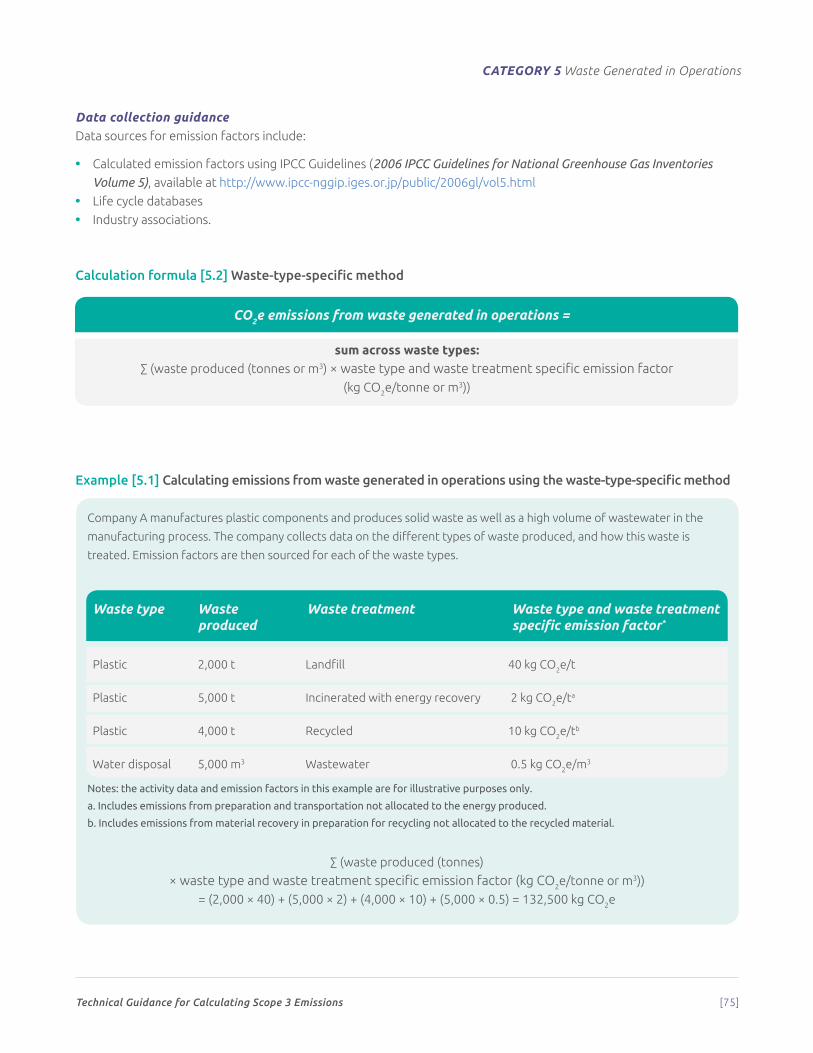
Technical Guidance for Calculating Scope 3 Emissions [75]
CATEGORY 5 Waste Generated in Operations
Data collection guidanceData sources for emission factors include:
• Calculated emission factors using IPCC Guidelines (2006 IPCC Guidelines for National Greenhouse Gas Inventories
Volume 5), available at http://www.ipcc-nggip.iges.or.jp/public/2006gl/vol5.html
• Life cycle databases
• Industry associations.
Calculation formula [5.2] Waste-type-specific method
CO2e emissions from waste generated in operations =
sum across waste types:∑ (waste produced (tonnes or m3) × waste type and waste treatment specific emission factor
(kg CO2e/tonne or m3))
Example [5.1] Calculating emissions from waste generated in operations using the waste-type-specific method
Company A manufactures plastic components and produces solid waste as well as a high volume of wastewater in the
manufacturing process. The company collects data on the different types of waste produced, and how this waste is
treated. Emission factors are then sourced for each of the waste types.
Waste type Waste produced
Waste treatment Waste type and waste treatment specific emission factor*
Plastic 2,000 t Landfill 40 kg CO2e/t
Plastic 5,000 t Incinerated with energy recovery 2 kg CO2e/ta
Plastic 4,000 t Recycled 10 kg CO2e/tb
Water disposal 5,000 m3 Wastewater 0.5 kg CO2e/m3
Notes: the activity data and emission factors in this example are for illustrative purposes only.
a. Includes emissions from preparation and transportation not allocated to the energy produced.
b. Includes emissions from material recovery in preparation for recycling not allocated to the recycled material.
∑ (waste produced (tonnes)
× waste type and waste treatment specific emission factor (kg CO2e/tonne or m3))
= (2,000 × 40) + (5,000 × 2) + (4,000 × 10) + (5,000 × 0.5) = 132,500 kg CO2e
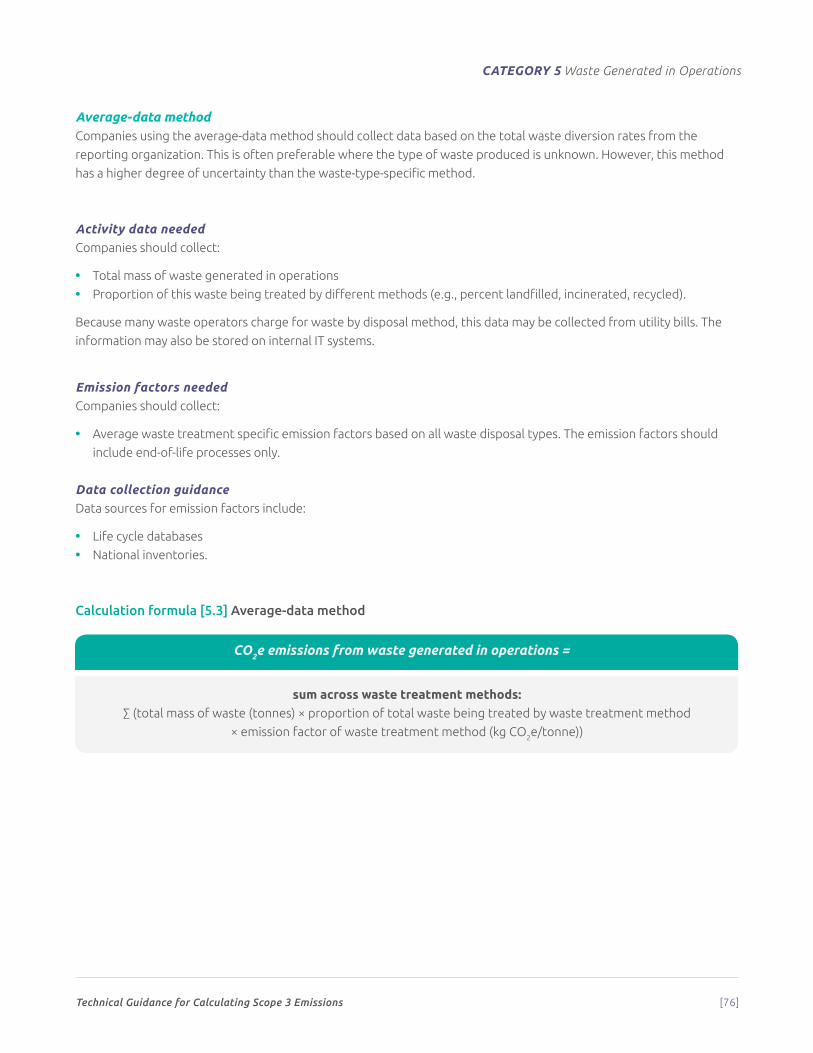
Technical Guidance for Calculating Scope 3 Emissions [76]
CATEGORY 5 Waste Generated in Operations
Average-data methodCompanies using the average-data method should collect data based on the total waste diversion rates from the
reporting organization. This is often preferable where the type of waste produced is unknown. However, this method
has a higher degree of uncertainty than the waste-type-specific method.
Activity data neededCompanies should collect:
• Total mass of waste generated in operations
• Proportion of this waste being treated by different methods (e.g., percent landfilled, incinerated, recycled).
Because many waste operators charge for waste by disposal method, this data may be collected from utility bills. The
information may also be stored on internal IT systems.
Emission factors neededCompanies should collect:
• Average waste treatment specific emission factors based on all waste disposal types. The emission factors should
include end-of-life processes only.
Data collection guidanceData sources for emission factors include:
• Life cycle databases
• National inventories.
Calculation formula [5.3] Average-data method
CO2e emissions from waste generated in operations =
sum across waste treatment methods:∑ (total mass of waste (tonnes) × proportion of total waste being treated by waste treatment method
× emission factor of waste treatment method (kg CO2e/tonne))
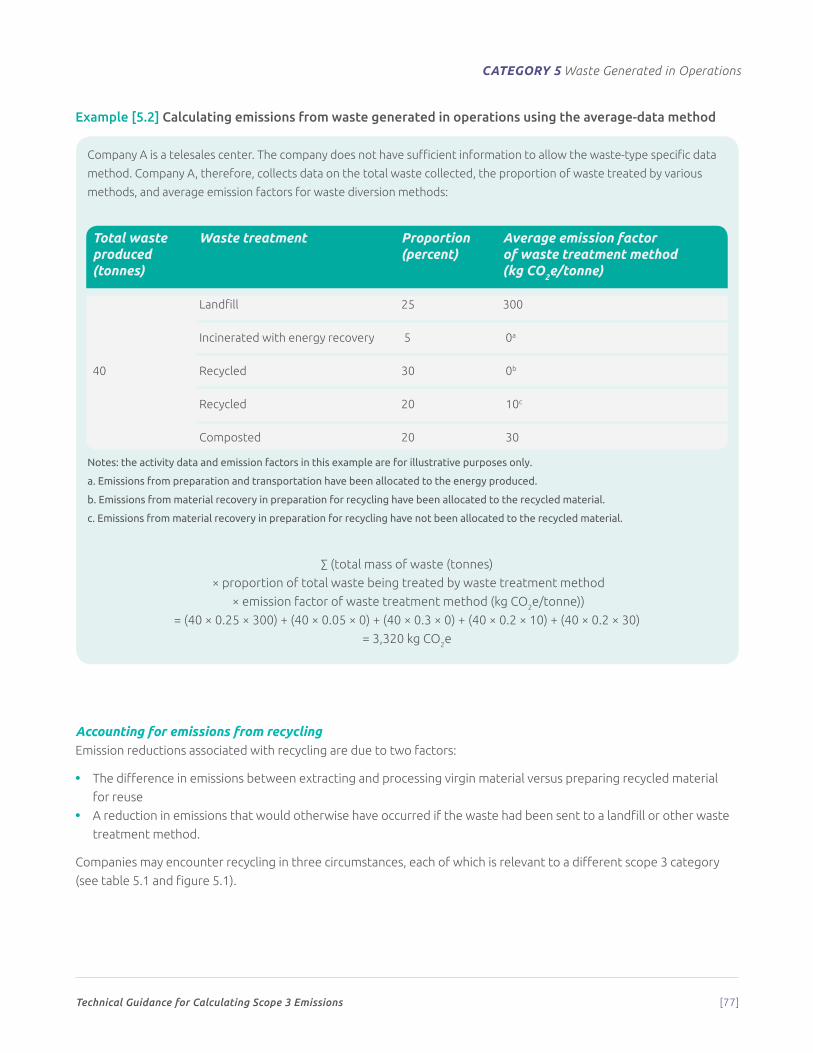
Technical Guidance for Calculating Scope 3 Emissions [77]
CATEGORY 5 Waste Generated in Operations
Example [5.2] Calculating emissions from waste generated in operations using the average-data method
Company A is a telesales center. The company does not have sufficient information to allow the waste-type specific data
method. Company A, therefore, collects data on the total waste collected, the proportion of waste treated by various
methods, and average emission factors for waste diversion methods:
Total waste produced (tonnes)
Waste treatment Proportion (percent)
Average emission factor of waste treatment method (kg CO2e/tonne)
40
Landfill 25 300
Incinerated with energy recovery 5 0a
Recycled 30 0b
Recycled 20 10c
Composted 20 30
Notes: the activity data and emission factors in this example are for illustrative purposes only.
a. Emissions from preparation and transportation have been allocated to the energy produced.
b. Emissions from material recovery in preparation for recycling have been allocated to the recycled material.
c. Emissions from material recovery in preparation for recycling have not been allocated to the recycled material.
∑ (total mass of waste (tonnes)
× proportion of total waste being treated by waste treatment method
× emission factor of waste treatment method (kg CO2e/tonne))
= (40 × 0.25 × 300) + (40 × 0.05 × 0) + (40 × 0.3 × 0) + (40 × 0.2 × 10) + (40 × 0.2 × 30)
= 3,320 kg CO2e
Accounting for emissions from recyclingEmission reductions associated with recycling are due to two factors:
• The difference in emissions between extracting and processing virgin material versus preparing recycled material
for reuse
• A reduction in emissions that would otherwise have occurred if the waste had been sent to a landfill or other waste
treatment method.
Companies may encounter recycling in three circumstances, each of which is relevant to a different scope 3 category
(see table 5.1 and figure 5.1).
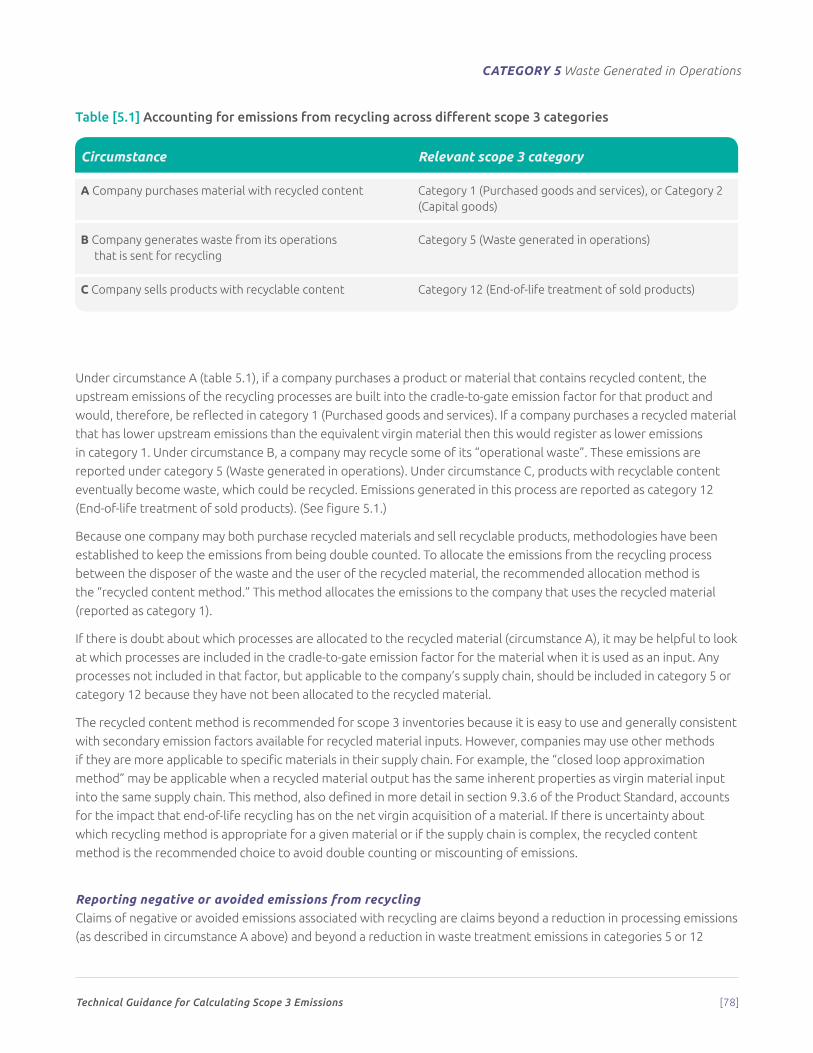
Technical Guidance for Calculating Scope 3 Emissions [78]
CATEGORY 5 Waste Generated in Operations
Table [5.1] Accounting for emissions from recycling across different scope 3 categories
Circumstance Relevant scope 3 category
A Company purchases material with recycled content Category 1 (Purchased goods and services), or Category 2 (Capital goods)
B Company generates waste from its operations that is sent for recycling
Category 5 (Waste generated in operations)
C Company sells products with recyclable content Category 12 (End-of-life treatment of sold products)
Under circumstance A (table 5.1), if a company purchases a product or material that contains recycled content, the
upstream emissions of the recycling processes are built into the cradle-to-gate emission factor for that product and
would, therefore, be reflected in category 1 (Purchased goods and services). If a company purchases a recycled material
that has lower upstream emissions than the equivalent virgin material then this would register as lower emissions
in category 1. Under circumstance B, a company may recycle some of its “operational waste”. These emissions are
reported under category 5 (Waste generated in operations). Under circumstance C, products with recyclable content
eventually become waste, which could be recycled. Emissions generated in this process are reported as category 12
(End-of-life treatment of sold products). (See figure 5.1.)
Because one company may both purchase recycled materials and sell recyclable products, methodologies have been
established to keep the emissions from being double counted. To allocate the emissions from the recycling process
between the disposer of the waste and the user of the recycled material, the recommended allocation method is
the “recycled content method.” This method allocates the emissions to the company that uses the recycled material
(reported as category 1).
If there is doubt about which processes are allocated to the recycled material (circumstance A), it may be helpful to look
at which processes are included in the cradle-to-gate emission factor for the material when it is used as an input. Any
processes not included in that factor, but applicable to the company’s supply chain, should be included in category 5 or
category 12 because they have not been allocated to the recycled material.
The recycled content method is recommended for scope 3 inventories because it is easy to use and generally consistent
with secondary emission factors available for recycled material inputs. However, companies may use other methods
if they are more applicable to specific materials in their supply chain. For example, the “closed loop approximation
method” may be applicable when a recycled material output has the same inherent properties as virgin material input
into the same supply chain. This method, also defined in more detail in section 9.3.6 of the Product Standard, accounts
for the impact that end-of-life recycling has on the net virgin acquisition of a material. If there is uncertainty about
which recycling method is appropriate for a given material or if the supply chain is complex, the recycled content
method is the recommended choice to avoid double counting or miscounting of emissions.
Reporting negative or avoided emissions from recyclingClaims of negative or avoided emissions associated with recycling are claims beyond a reduction in processing emissions
(as described in circumstance A above) and beyond a reduction in waste treatment emissions in categories 5 or 12
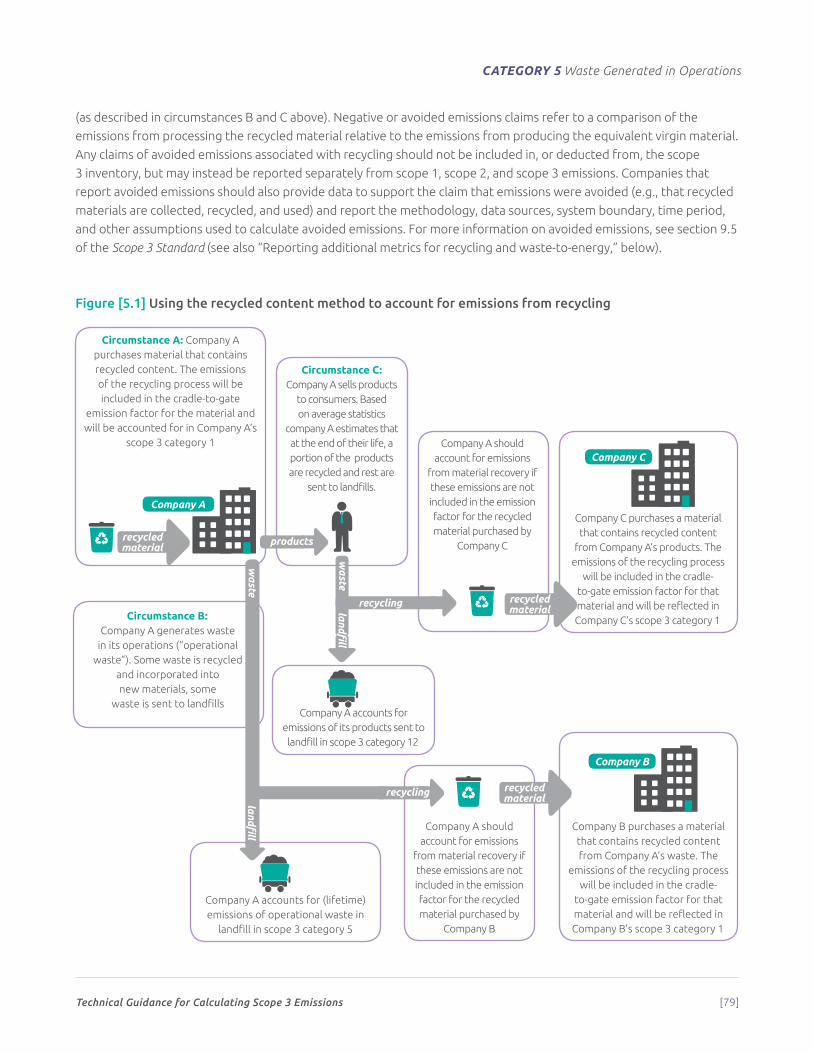
Technical Guidance for Calculating Scope 3 Emissions [79]
CATEGORY 5 Waste Generated in Operations
(as described in circumstances B and C above). Negative or avoided emissions claims refer to a comparison of the
emissions from processing the recycled material relative to the emissions from producing the equivalent virgin material.
Any claims of avoided emissions associated with recycling should not be included in, or deducted from, the scope
3 inventory, but may instead be reported separately from scope 1, scope 2, and scope 3 emissions. Companies that
report avoided emissions should also provide data to support the claim that emissions were avoided (e.g., that recycled
materials are collected, recycled, and used) and report the methodology, data sources, system boundary, time period,
and other assumptions used to calculate avoided emissions. For more information on avoided emissions, see section 9.5
of the Scope 3 Standard (see also “Reporting additional metrics for recycling and waste-to-energy,” below).
Figure [5.1] Using the recycled content method to account for emissions from recycling
Circumstance A: Company A purchases material that contains recycled content. The emissions of the recycling process will be included in the cradle-to-gate
emission factor for the material and will be accounted for in Company A’s
scope 3 category 1
Circumstance B: Company A generates waste
in its operations (“operational waste”). Some waste is recycled
and incorporated into new materials, some
waste is sent to landfills
Company A accounts for (lifetime) emissions of operational waste in
landfill in scope 3 category 5
1 2 3
4 5 6
7 8 9
10 11 12
13 14 15
16 17
1. wheat2. tree3. mountains4. glass bottle5. plastic bottle6. aluminium can7. factory8. lorry9. cloud10. recycling bin11. recycling bin (colours reversed)12. wind turbines13. chicken14. cow 115. cow 216. shop17. factory showing carbon emissions (carbon emissions are shown in orange)
Company A
Circumstance C: Company A sells products
to consumers. Based on average statistics
company A estimates that at the end of their life, a portion of the products are recycled and rest are
sent to landfills.
Company A should account for emissions
from material recovery if these emissions are not included in the emission factor for the recycled material purchased by
Company B
1 2 3
4 5 6
7 8 9
10 11 12
13 14 15
16 17
1. wheat2. tree3. mountains4. glass bottle5. plastic bottle6. aluminium can7. factory8. lorry9. cloud10. recycling bin11. recycling bin (colours reversed)12. wind turbines13. chicken14. cow 115. cow 216. shop17. factory showing carbon emissions (carbon emissions are shown in orange)
Company C purchases a material that contains recycled content
from Company A’s products. The emissions of the recycling process
will be included in the cradle-to-gate emission factor for that material and will be reflected in Company C’s scope 3 category 1
Company C
Company B purchases a material that contains recycled content from Company A’s waste. The
emissions of the recycling process will be included in the cradle-
to-gate emission factor for that material and will be reflected in Company B’s scope 3 category 1
Company B
Company A accounts for emissions of its products sent to
landfill in scope 3 category 12
products
recycling
recycling
landfill
waste landfi
ll
waste
Company A should account for emissions
from material recovery if these emissions are not included in the emission factor for the recycled material purchased by
Company Crecycled material
recycled material
recycled material
Technical Guidance for Calculating Scope 3 Emissions [80]
CATEGORY 5 Waste Generated in Operations
Accounting for emissions from incineration with energy recovery (waste-to-energy)Attributing emissions from waste-to-energy is similar to the approach taken for recycling. Companies may both generate
waste that is incinerated with energy recovery (waste-to-energy) and consume energy that is generated by waste-to-energy
processes. If a company purchases energy from the same facility that it sends its waste to, then accounting for emissions
from the waste-to-energy combustion process both upstream and downstream would double count the emissions. To avoid
double counting, a company should account for upstream emissions from purchased energy generated from waste in scope
2. (In most cases, the emissions associated with combustion of waste to produce energy will be included in the grid average
emission factor). Companies should account for emissions from preparing and transporting waste that will be combusted in
a waste-to-energy facility in category 5, but should not account for emissions from the waste-to-energy combustion process
itself. These emissions should be included in scope 2 by the consumers of energy generated from waste.
If waste from operations is incinerated and used for energy on-site and under operational or financial control, the
emissions associated with the incineration are included as scope 1 (and scope 2 would decrease as a result of a
reduction in purchased energy). Companies should not report negative or avoided emissions associated with waste-to-
energy in the inventory.
This guidance does not apply to accounting for emissions from waste that is incinerated without energy recovery. All
emissions from combusting waste without energy recovery are reported by the company generating the waste under
scope 3, category 5 (Waste generated in operations).
Reporting additional information for recycling and waste-to-energyUnder the accounting methodology described above, emissions from recycling and waste-to-energy both appear
to have a similar effect on the reporting company’s scope 3 category 5 emissions (i.e., emissions from both will be
reported as close to zero) based on the scope 3 boundary definition. It is, therefore, suggested that companies
separately report additional information to help identify the full GHG impacts within and outside their inventory
boundary and make informed decisions about the best options for waste treatment (e.g. recycling compared to
waste-to-energy).
If electricity is generated from waste-to-energy, companies may report separately the emissions per unit of net electrical
generation from the combustion stage of waste-to-energy relative to the local grid average electricity emission factor
(tonnes CO2e per kWh). For example incinerating plastic waste is likely to be more carbon-intensive per kWh of electricity
generated than the grid average. Reporting this metric would help companies understand whether sending their waste to a
waste-to-energy facility is leading to more- or less-carbon-intensive electricity for the region.
Similarly in the case of recycling, it is suggested that companies report separately the recycling emissions relative to the
emissions from producing the equivalent virgin material. This number will often be a negative emissions figure (as recycled
material inputs generally have lower upstream emissions than virgin materials). If reported, this figure must be reported
separately to the scope 3 inventory.
Accounting for emissions from wastewaterEmissions from wastewater are highly variable depending on how much processing is needed to treat the water
(determined by biological oxygen demand [BOD] and/or chemical oxygen demand [COD]). The following industries
often have higher emissions from wastewater (where wastewater is not treated onsite): starch refining; alcohol
refining; pulp and paper; vegetables, fruits, and juices; and food processing. Companies in these industries should
calculate emissions from wastewater using methods provided in the 2006 IPCC Guidelines for National Greenhouse Gas
Inventories Volume 5 Waste, available at http://www.ipcc-nggip.iges.or.jp/public/2006gl/vol5.html.

Technical Guidance for Calculating Scope 3 Emissions [81]
6
Category 6: Business TravelCategory description
T his category includes emissions from the transportation of employees for business-
related activities in vehicles owned or operated by third parties, such as aircraft,
trains, buses, and passenger cars.
Emissions from transportation in vehicles owned or controlled by the reporting company are accounted for in either
scope 1 (for fuel use), or in the case of electric vehicles, scope 2 (for electricity use). Emissions from leased vehicles
operated by the reporting company not included in scope 1 or scope 2 are accounted for in scope 3, category 8
(Upstream leased assets). Emissions from transportation of employees to and from work are accounted for in scope 3,
category 7 (Employee commuting). See table 6.1.
Emissions from business travel may arise from:
• Air travel
• Rail travel
• Bus travel
• Automobile travel (e.g., business travel in rental cars or employee-owned vehicles other than employee commuting
to and from work)
• Other modes of travel.
Companies may optionally include emissions from business travelers staying in hotels.
A reporting company’s scope 3 emissions from business travel include the scope 1 and scope 2 emissions of
transportation companies (e.g., airlines).
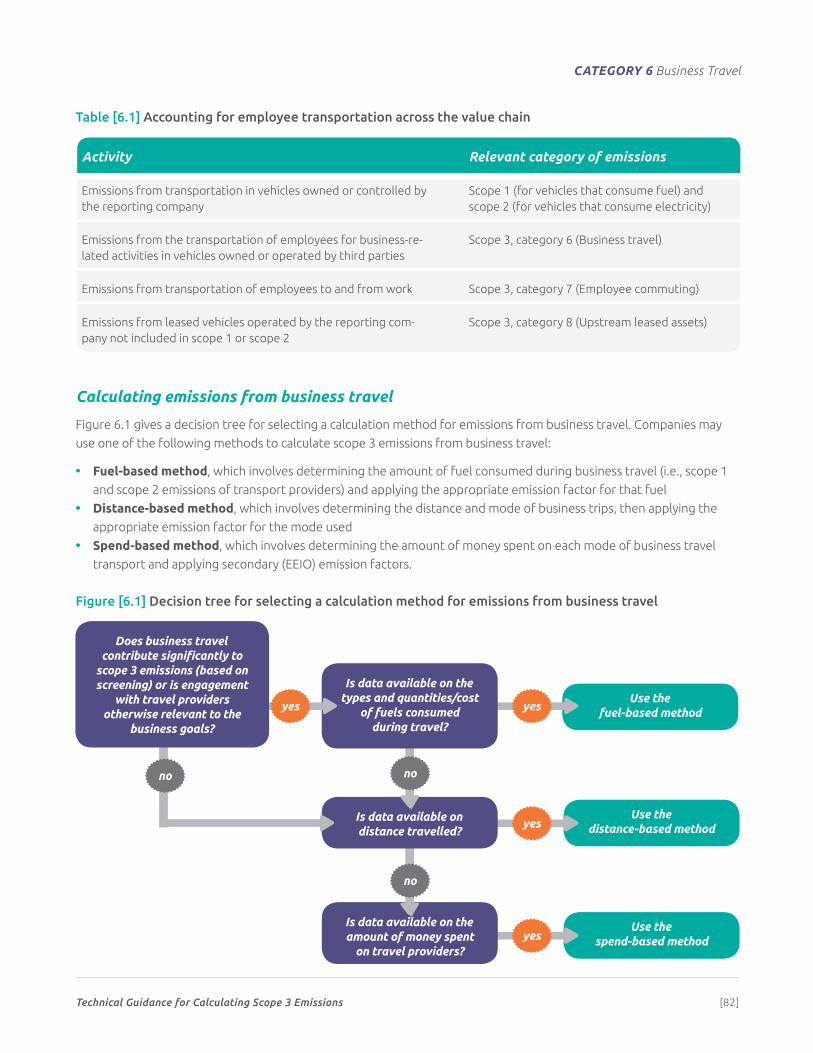
Technical Guidance for Calculating Scope 3 Emissions [82]
CATEGORY 6 Business Travel
Use the spend-based methodyes
Is data available on the amount of money spent
on travel providers?
no
Use the distance-based method
Is data available on distance travelled?
Use the fuel-based method
no no
Is data available on the types and quantities/cost
of fuels consumed during travel?
yes
yes
yes
Does business travel contribute significantly to
scope 3 emissions (based on screening) or is engagement
with travel providers otherwise relevant to the
business goals?
Table [6.1] Accounting for employee transportation across the value chain
Activity Relevant category of emissions
Emissions from transportation in vehicles owned or controlled by the reporting company
Scope 1 (for vehicles that consume fuel) and scope 2 (for vehicles that consume electricity)
Emissions from the transportation of employees for business-re-lated activities in vehicles owned or operated by third parties
Scope 3, category 6 (Business travel)
Emissions from transportation of employees to and from work Scope 3, category 7 (Employee commuting)
Emissions from leased vehicles operated by the reporting com-pany not included in scope 1 or scope 2
Scope 3, category 8 (Upstream leased assets)
Calculating emissions from business travel
Figure 6.1 gives a decision tree for selecting a calculation method for emissions from business travel. Companies may
use one of the following methods to calculate scope 3 emissions from business travel:
• Fuel-based method, which involves determining the amount of fuel consumed during business travel (i.e., scope 1
and scope 2 emissions of transport providers) and applying the appropriate emission factor for that fuel
• Distance-based method, which involves determining the distance and mode of business trips, then applying the
appropriate emission factor for the mode used
• Spend-based method, which involves determining the amount of money spent on each mode of business travel
transport and applying secondary (EEIO) emission factors.
Figure [6.1] Decision tree for selecting a calculation method for emissions from business travel
Technical Guidance for Calculating Scope 3 Emissions [83]
CATEGORY 6 Business Travel
Fuel-based methodThe calculation methodology for the fuel-based method does not differ from the fuel-based method in category 4
(Upstream transport and distribution). For guidance on calculating emissions using this method, refer to the guidance
for category 4 (Upstream transport and distribution). Companies may optionally collect data on the number of hotel
nights incurred during business travel by hotel type. Under this method, they add the number of hotel nights and the
emissions factor of the hotel (as shown in the distance-based method below) to the fuel-based method in category 4
(Upstream transport and distribution).
Distance-based methodIf data on fuel use is unavailable, companies may use the distance-based method.
The distance-based method involves multiplying activity data (i.e., vehicle-kilometers or person-kilometers travelled by
vehicle type) by emission factors (typically default national emission factors by vehicle type). Vehicle types include all
categories of aircraft, rail, subway, bus, automobile, etc.
Activity data neededCompanies should collect data on:
• Total distance travelled by each mode of transport (air, train, bus, car, etc.) for employees in the reporting year.
Where possible, companies should also collect data on:
• Countries of travel (since transportation emission factors vary by country)
• Specific types of vehicles used for travel (since transportation emission factors vary by vehicle types)
from transport providers
• The specific passenger vehicle type and the relevant emission factor.
Companies may optionally collect data on the number of hotel nights incurred during business travel by hotel type.
Activity data should be expressed as the number of kilometers travelled or kilometers travelled per person for a
particular vehicle type (e.g., passenger-kilometer). The activity data should be summed to obtain total annual kilometers
or person-kilometers travelled by each vehicle type used by the company.
Emission factors neededCompanies should collect:
• Emission factors for each mode of transport (e.g., aircraft, rail, metro, bus, taxi, bus), expressed in units of
greenhouse gas (CO2, CH4, N2O, HFC, or CO2e) emitted per kilometer or per passenger-kilometer travelled.
Companies may optionally use emission factors for hotel stays by hotel type (e.g., kilograms of CO2e emitted per hotel night).
Note: For air travel emission factors, multipliers or other corrections to account for radiative forcing may be applied to
the GWP of emissions arising from aircraft transport. If applied, companies should disclose the specific factor used.
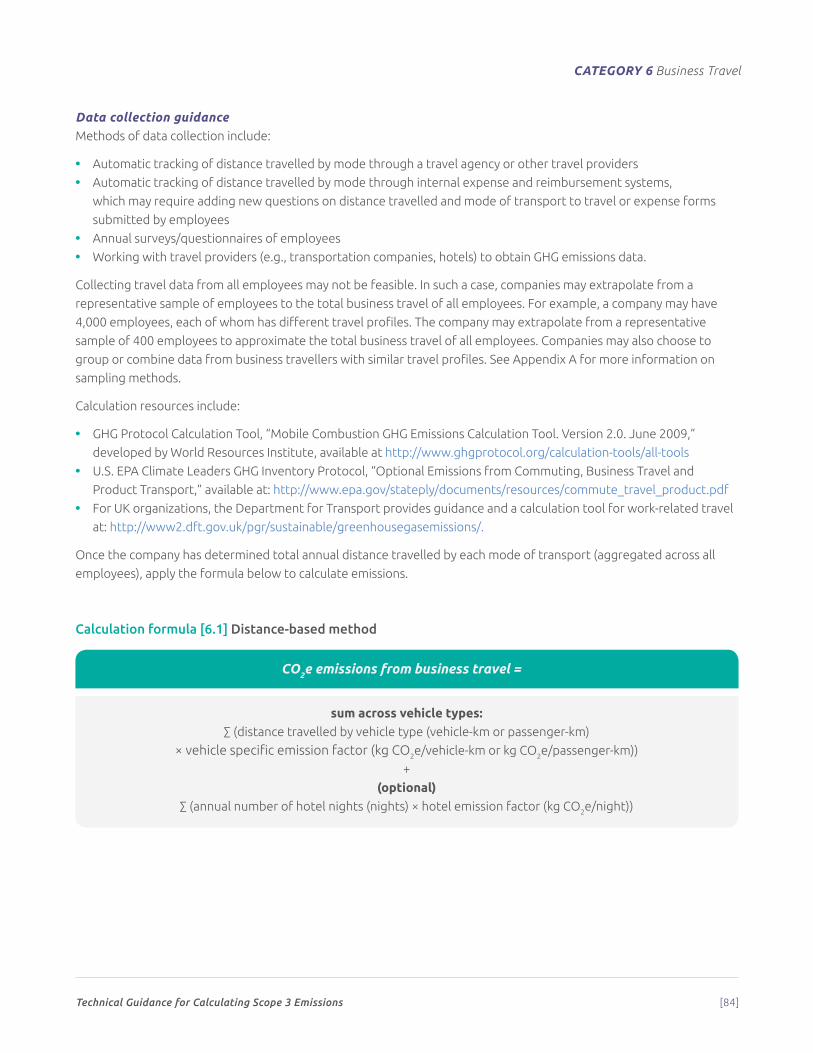
Technical Guidance for Calculating Scope 3 Emissions [84]
CATEGORY 6 Business Travel
Data collection guidanceMethods of data collection include:
• Automatic tracking of distance travelled by mode through a travel agency or other travel providers
• Automatic tracking of distance travelled by mode through internal expense and reimbursement systems,
which may require adding new questions on distance travelled and mode of transport to travel or expense forms
submitted by employees
• Annual surveys/questionnaires of employees
• Working with travel providers (e.g., transportation companies, hotels) to obtain GHG emissions data.
Collecting travel data from all employees may not be feasible. In such a case, companies may extrapolate from a
representative sample of employees to the total business travel of all employees. For example, a company may have
4,000 employees, each of whom has different travel profiles. The company may extrapolate from a representative
sample of 400 employees to approximate the total business travel of all employees. Companies may also choose to
group or combine data from business travellers with similar travel profiles. See Appendix A for more information on
sampling methods.
Calculation resources include:
• GHG Protocol Calculation Tool, “Mobile Combustion GHG Emissions Calculation Tool. Version 2.0. June 2009,”
developed by World Resources Institute, available at http://www.ghgprotocol.org/calculation-tools/all-tools
• U.S. EPA Climate Leaders GHG Inventory Protocol, “Optional Emissions from Commuting, Business Travel and
Product Transport,” available at: http://www.epa.gov/stateply/documents/resources/commute_travel_product.pdf
• For UK organizations, the Department for Transport provides guidance and a calculation tool for work-related travel
at: http://www2.dft.gov.uk/pgr/sustainable/greenhousegasemissions/.
Once the company has determined total annual distance travelled by each mode of transport (aggregated across all
employees), apply the formula below to calculate emissions.
Calculation formula [6.1] Distance-based method
CO2e emissions from business travel =
sum across vehicle types:∑ (distance travelled by vehicle type (vehicle-km or passenger-km)
× vehicle specific emission factor (kg CO2e/vehicle-km or kg CO2e/passenger-km))
+
(optional)∑ (annual number of hotel nights (nights) × hotel emission factor (kg CO2e/night))
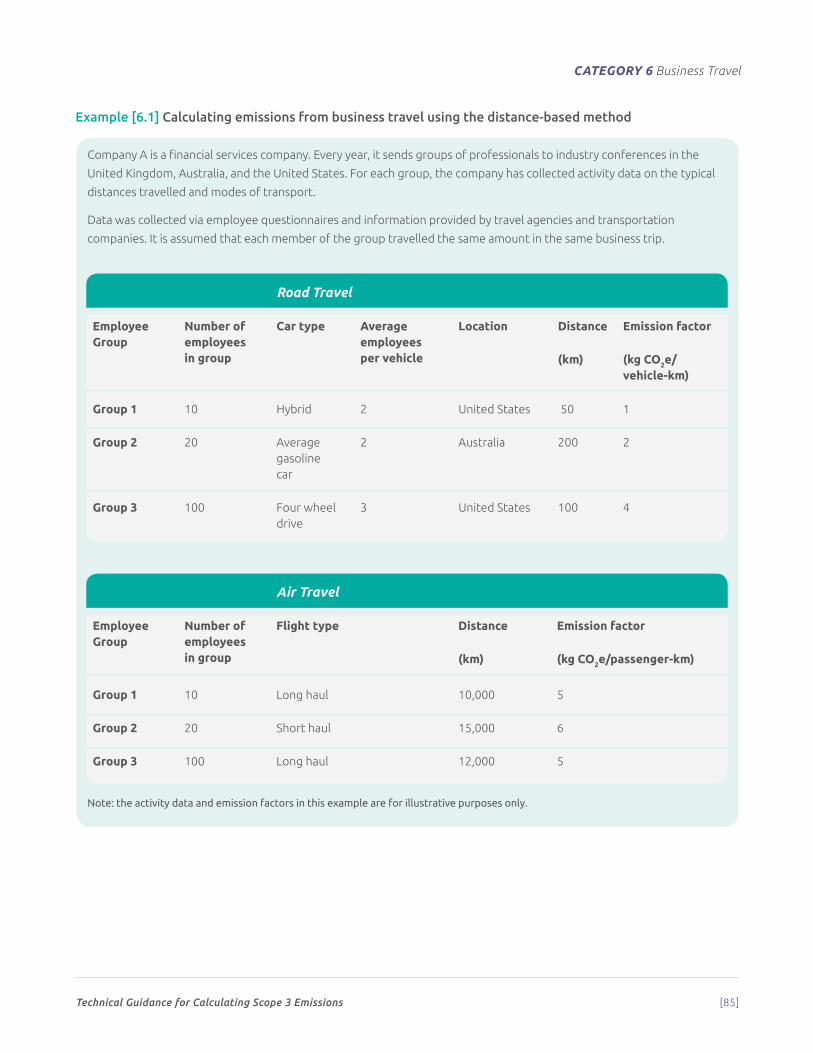
Technical Guidance for Calculating Scope 3 Emissions [85]
CATEGORY 6 Business Travel
Example [6.1] Calculating emissions from business travel using the distance-based method
Company A is a financial services company. Every year, it sends groups of professionals to industry conferences in the
United Kingdom, Australia, and the United States. For each group, the company has collected activity data on the typical
distances travelled and modes of transport.
Data was collected via employee questionnaires and information provided by travel agencies and transportation
companies. It is assumed that each member of the group travelled the same amount in the same business trip.
Road Travel
Employee Group
Number of employees in group
Car type Average employees per vehicle
Location Distance Emission factor
(km) (kg CO2e/ vehicle-km)
Group 1 10 Hybrid 2 United States 50 1
Group 2 20 Average gasolinecar
2 Australia 200 2
Group 3 100 Four wheel drive
3 United States 100 4
Air Travel
Employee Group
Number of employees in group
Flight type Distance Emission factor
(km) (kg CO2e/passenger-km)
Group 1 10 Long haul 10,000 5
Group 2 20 Short haul 15,000 6
Group 3 100 Long haul 12,000 5
Note: the activity data and emission factors in this example are for illustrative purposes only.
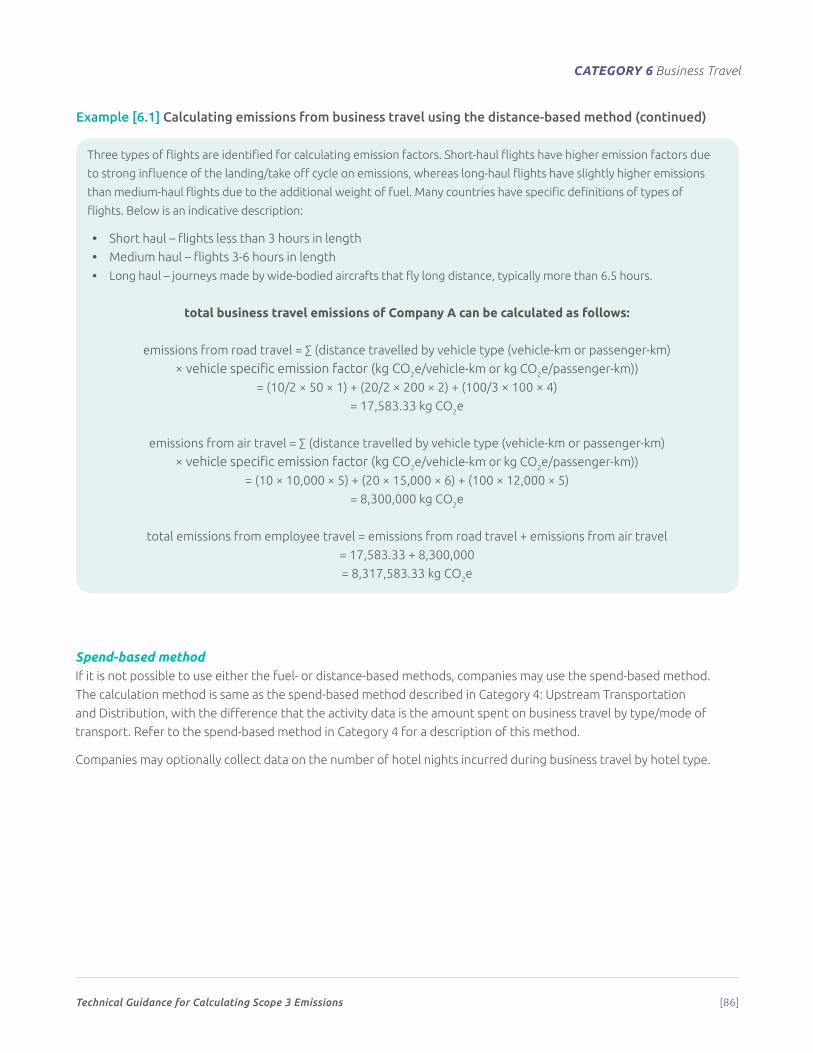
Technical Guidance for Calculating Scope 3 Emissions [86]
CATEGORY 6 Business Travel
Three types of flights are identified for calculating emission factors. Short-haul flights have higher emission factors due
to strong influence of the landing/take off cycle on emissions, whereas long-haul flights have slightly higher emissions
than medium-haul flights due to the additional weight of fuel. Many countries have specific definitions of types of
flights. Below is an indicative description:
• Short haul – flights less than 3 hours in length
• Medium haul – flights 3-6 hours in length
• Long haul – journeys made by wide-bodied aircrafts that fly long distance, typically more than 6.5 hours.
total business travel emissions of Company A can be calculated as follows:
emissions from road travel = ∑ (distance travelled by vehicle type (vehicle-km or passenger-km)
× vehicle specific emission factor (kg CO2e/vehicle-km or kg CO2e/passenger-km))
= (10/2 × 50 × 1) + (20/2 × 200 × 2) + (100/3 × 100 × 4)
= 17,583.33 kg CO2e
emissions from air travel = ∑ (distance travelled by vehicle type (vehicle-km or passenger-km)
× vehicle specific emission factor (kg CO2e/vehicle-km or kg CO2e/passenger-km))
= (10 × 10,000 × 5) + (20 × 15,000 × 6) + (100 × 12,000 × 5)
= 8,300,000 kg CO2e
total emissions from employee travel = emissions from road travel + emissions from air travel
= 17,583.33 + 8,300,000
= 8,317,583.33 kg CO2e
Spend-based methodIf it is not possible to use either the fuel- or distance-based methods, companies may use the spend-based method.
The calculation method is same as the spend-based method described in Category 4: Upstream Transportation
and Distribution, with the difference that the activity data is the amount spent on business travel by type/mode of
transport. Refer to the spend-based method in Category 4 for a description of this method.
Companies may optionally collect data on the number of hotel nights incurred during business travel by hotel type.
Example [6.1] Calculating emissions from business travel using the distance-based method (continued)
Technical Guidance for Calculating Scope 3 Emissions [87]
7
Category 7: Employee CommutingCategory descriptionThis category includes emissions from the transportation of employees4 between their homes and their worksites.
Emissions from employee commuting may arise from:
• Automobile travel
• Bus travel
• Rail travel
• Air travel
• Other modes of transportation (e.g., subway, bicycling, walking).
Companies may include emissions from teleworking (i.e., employees working remotely) in this category.
A reporting company’s scope 3 emissions from employee commuting include the scope 1 and scope 2 emissions of
employees and third-party transportation providers.
Calculating emissions from employee commutingFigure 7.1 offers a decision tree for selecting a calculation method for scope 3 emissions from employee commuting.
Companies may use one of the following methods:
• Fuel-based method, which involves determining the amount of fuel consumed during commuting and applying the
appropriate emission factor for that fuel
• Distance-based method, which involves collecting data from employees on commuting patterns (e.g., distance
travelled and mode used for commuting) and applying appropriate emission factors for the modes used
• Average-data method, which involves estimating emissions from employee commuting based on average
(e.g., national) data on commuting patterns.
4 “Employees” refers to employees of entities and facilities owned, operated, or leased by the reporting company. Companies may include
employees of other relevant entities (e.g., franchises or outsourced operations) in this category, as well as consultants, contractors, and
other individuals who are not employees of the company, but commute to facilities owned and operated by the company.
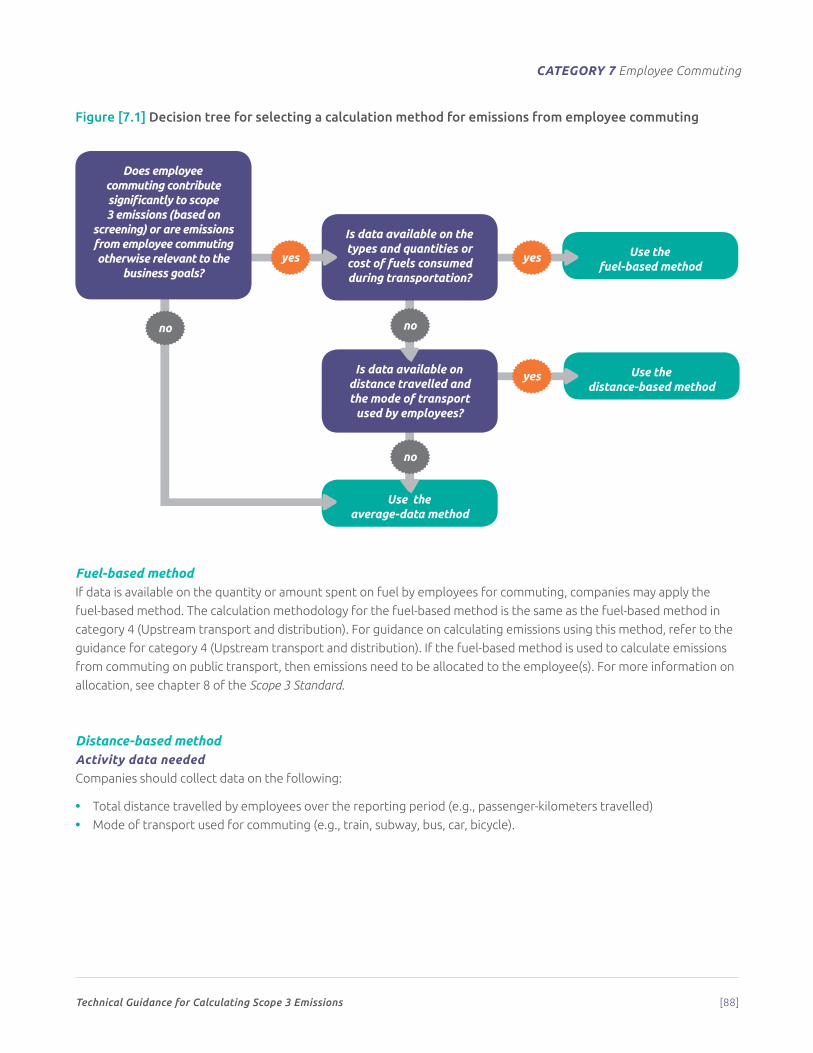
Technical Guidance for Calculating Scope 3 Emissions [88]
CATEGORY 7 Employee Commuting
Figure [7.1] Decision tree for selecting a calculation method for emissions from employee commuting
Fuel-based methodIf data is available on the quantity or amount spent on fuel by employees for commuting, companies may apply the
fuel-based method. The calculation methodology for the fuel-based method is the same as the fuel-based method in
category 4 (Upstream transport and distribution). For guidance on calculating emissions using this method, refer to the
guidance for category 4 (Upstream transport and distribution). If the fuel-based method is used to calculate emissions
from commuting on public transport, then emissions need to be allocated to the employee(s). For more information on
allocation, see chapter 8 of the Scope 3 Standard.
Distance-based methodActivity data neededCompanies should collect data on the following:
• Total distance travelled by employees over the reporting period (e.g., passenger-kilometers travelled)
• Mode of transport used for commuting (e.g., train, subway, bus, car, bicycle).
Use the average-data method
no
Use the distance-based method
Is data available on distance travelled and the mode of transport
used by employees?
Use the fuel-based method
no no
Is data available on the types and quantities or cost of fuels consumed during transportation?
yes
yes
yes
Does employee commuting contribute significantly to scope 3 emissions (based on
screening) or are emissions from employee commuting otherwise relevant to the
business goals?
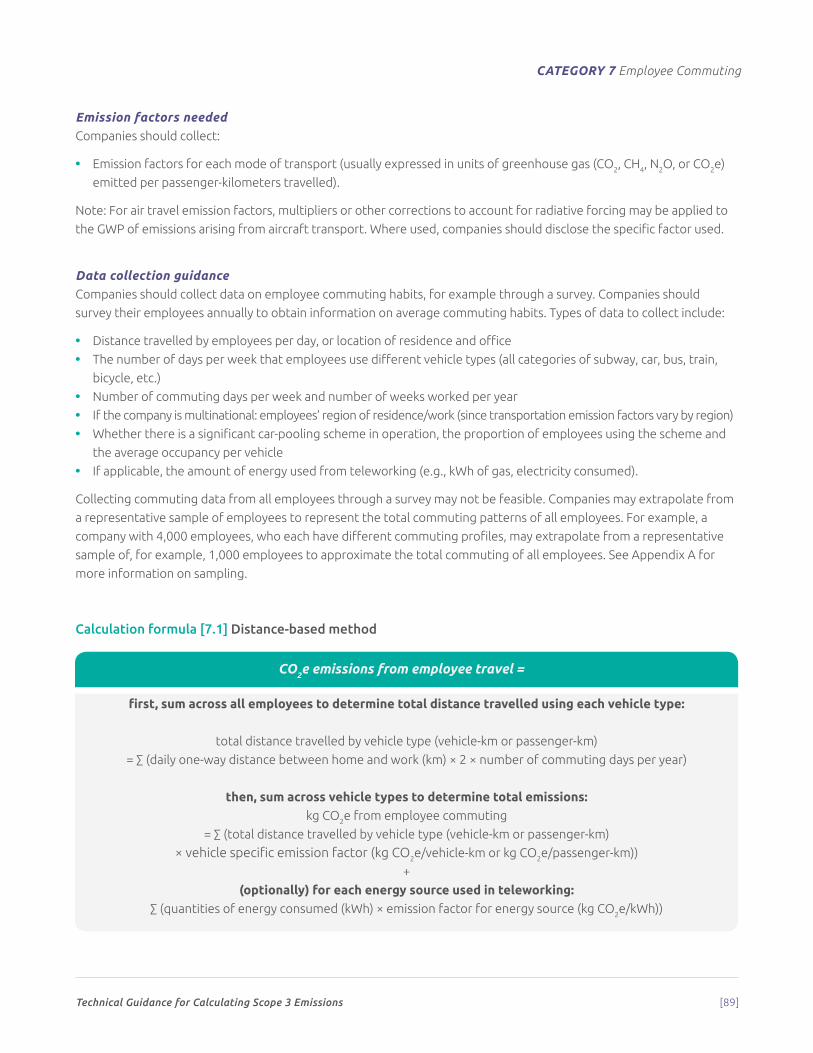
Technical Guidance for Calculating Scope 3 Emissions [89]
CATEGORY 7 Employee Commuting
Emission factors neededCompanies should collect:
• Emission factors for each mode of transport (usually expressed in units of greenhouse gas (CO2, CH4, N2O, or CO2e)
emitted per passenger-kilometers travelled).
Note: For air travel emission factors, multipliers or other corrections to account for radiative forcing may be applied to
the GWP of emissions arising from aircraft transport. Where used, companies should disclose the specific factor used.
Data collection guidanceCompanies should collect data on employee commuting habits, for example through a survey. Companies should
survey their employees annually to obtain information on average commuting habits. Types of data to collect include:
• Distance travelled by employees per day, or location of residence and office
• The number of days per week that employees use different vehicle types (all categories of subway, car, bus, train,
bicycle, etc.)
• Number of commuting days per week and number of weeks worked per year
• If the company is multinational: employees’ region of residence/work (since transportation emission factors vary by region)
• Whether there is a significant car-pooling scheme in operation, the proportion of employees using the scheme and
the average occupancy per vehicle
• If applicable, the amount of energy used from teleworking (e.g., kWh of gas, electricity consumed).
Collecting commuting data from all employees through a survey may not be feasible. Companies may extrapolate from
a representative sample of employees to represent the total commuting patterns of all employees. For example, a
company with 4,000 employees, who each have different commuting profiles, may extrapolate from a representative
sample of, for example, 1,000 employees to approximate the total commuting of all employees. See Appendix A for
more information on sampling.
Calculation formula [7.1] Distance-based method
CO2e emissions from employee travel =
first, sum across all employees to determine total distance travelled using each vehicle type:
total distance travelled by vehicle type (vehicle-km or passenger-km)
= ∑ (daily one-way distance between home and work (km) × 2 × number of commuting days per year)
then, sum across vehicle types to determine total emissions:kg CO2e from employee commuting
= ∑ (total distance travelled by vehicle type (vehicle-km or passenger-km)
× vehicle specific emission factor (kg CO2e/vehicle-km or kg CO2e/passenger-km))
+
(optionally) for each energy source used in teleworking:∑ (quantities of energy consumed (kWh) × emission factor for energy source (kg CO2e/kWh))
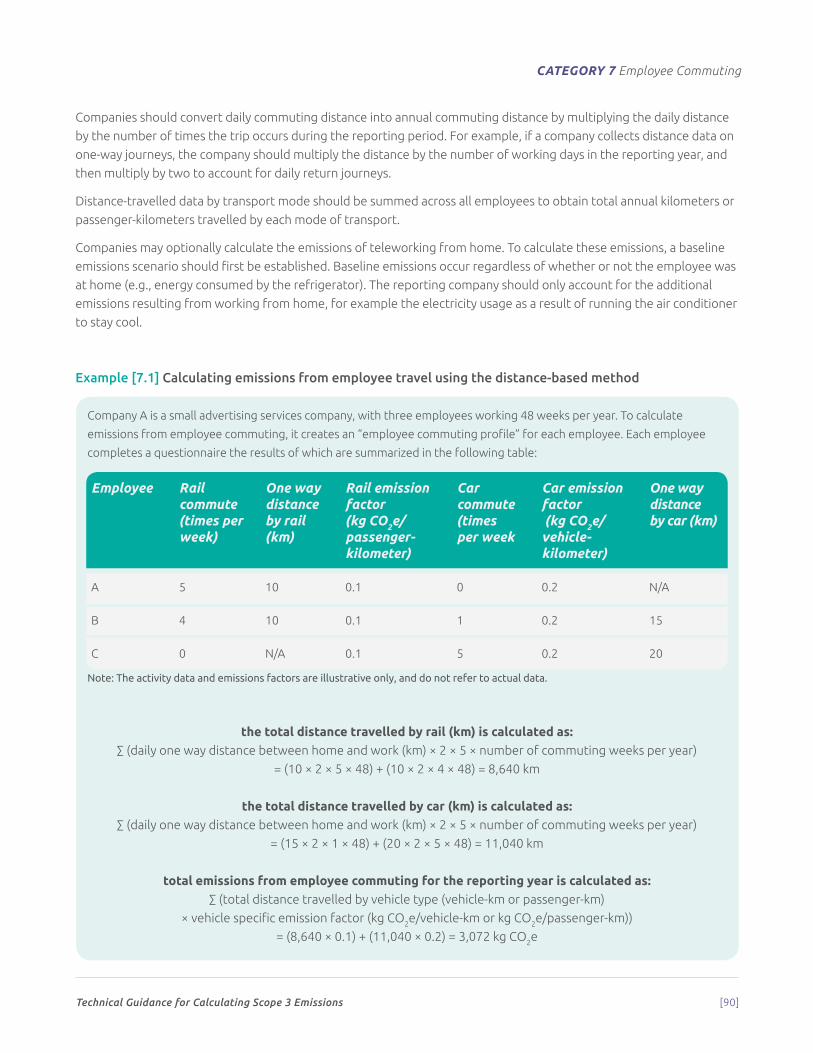
Technical Guidance for Calculating Scope 3 Emissions [90]
CATEGORY 7 Employee Commuting
Companies should convert daily commuting distance into annual commuting distance by multiplying the daily distance
by the number of times the trip occurs during the reporting period. For example, if a company collects distance data on
one-way journeys, the company should multiply the distance by the number of working days in the reporting year, and
then multiply by two to account for daily return journeys.
Distance-travelled data by transport mode should be summed across all employees to obtain total annual kilometers or
passenger-kilometers travelled by each mode of transport.
Companies may optionally calculate the emissions of teleworking from home. To calculate these emissions, a baseline
emissions scenario should first be established. Baseline emissions occur regardless of whether or not the employee was
at home (e.g., energy consumed by the refrigerator). The reporting company should only account for the additional
emissions resulting from working from home, for example the electricity usage as a result of running the air conditioner
to stay cool.
Example [7.1] Calculating emissions from employee travel using the distance-based method
Company A is a small advertising services company, with three employees working 48 weeks per year. To calculate
emissions from employee commuting, it creates an “employee commuting profile” for each employee. Each employee
completes a questionnaire the results of which are summarized in the following table:
Employee Rail commute (times per week)
One way distance by rail (km)
Rail emission factor (kg CO2e/ passenger- kilometer)
Car commute (times per week
Car emission factor (kg CO2e/vehicle- kilometer)
One way distance by car (km)
A 5 10 0.1 0 0.2 N/A
B 4 10 0.1 1 0.2 15
C 0 N/A 0.1 5 0.2 20
Note: The activity data and emissions factors are illustrative only, and do not refer to actual data.
the total distance travelled by rail (km) is calculated as:∑ (daily one way distance between home and work (km) × 2 × 5 × number of commuting weeks per year)
= (10 × 2 × 5 × 48) + (10 × 2 × 4 × 48) = 8,640 km
the total distance travelled by car (km) is calculated as:∑ (daily one way distance between home and work (km) × 2 × 5 × number of commuting weeks per year)
= (15 × 2 × 1 × 48) + (20 × 2 × 5 × 48) = 11,040 km
total emissions from employee commuting for the reporting year is calculated as:∑ (total distance travelled by vehicle type (vehicle-km or passenger-km)
× vehicle specific emission factor (kg CO2e/vehicle-km or kg CO2e/passenger-km))
= (8,640 × 0.1) + (11,040 × 0.2) = 3,072 kg CO2e
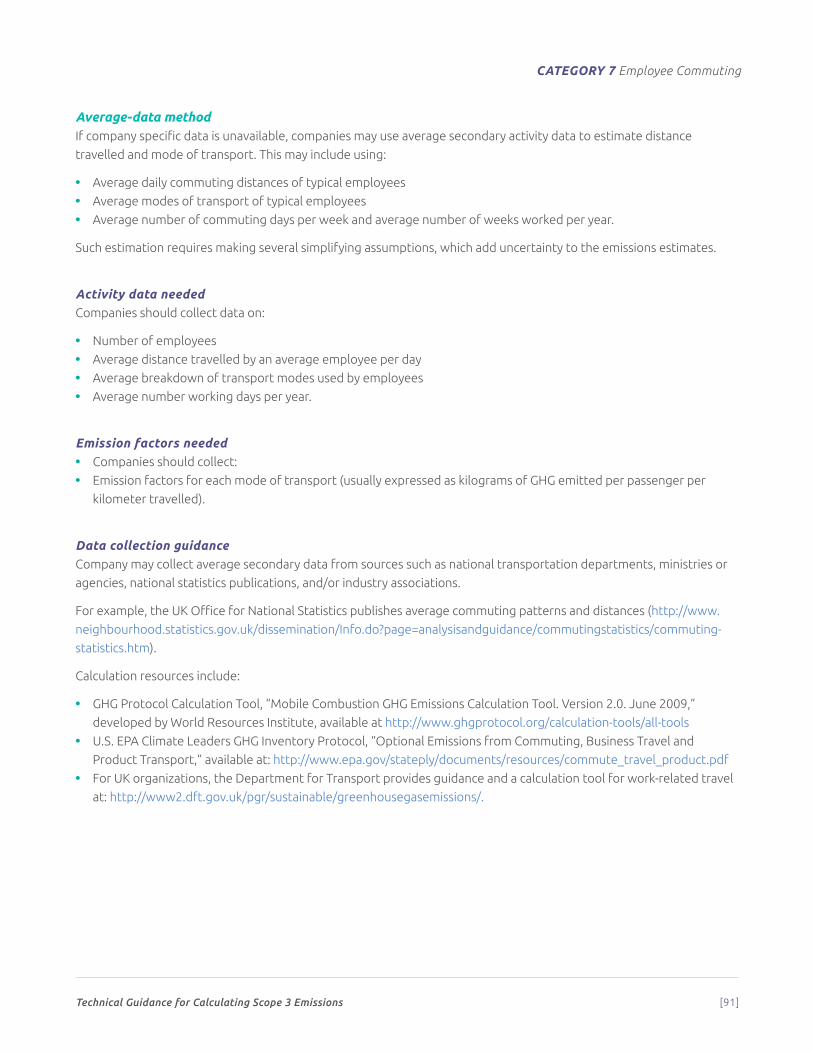
Technical Guidance for Calculating Scope 3 Emissions [91]
CATEGORY 7 Employee Commuting
Average-data methodIf company specific data is unavailable, companies may use average secondary activity data to estimate distance
travelled and mode of transport. This may include using:
• Average daily commuting distances of typical employees
• Average modes of transport of typical employees
• Average number of commuting days per week and average number of weeks worked per year.
Such estimation requires making several simplifying assumptions, which add uncertainty to the emissions estimates.
Activity data neededCompanies should collect data on:
• Number of employees
• Average distance travelled by an average employee per day
• Average breakdown of transport modes used by employees
• Average number working days per year.
Emission factors needed • Companies should collect:
• Emission factors for each mode of transport (usually expressed as kilograms of GHG emitted per passenger per
kilometer travelled).
Data collection guidanceCompany may collect average secondary data from sources such as national transportation departments, ministries or
agencies, national statistics publications, and/or industry associations.
For example, the UK Office for National Statistics publishes average commuting patterns and distances (http://www.
neighbourhood.statistics.gov.uk/dissemination/Info.do?page=analysisandguidance/commutingstatistics/commuting-
statistics.htm).
Calculation resources include:
• GHG Protocol Calculation Tool, “Mobile Combustion GHG Emissions Calculation Tool. Version 2.0. June 2009,”
developed by World Resources Institute, available at http://www.ghgprotocol.org/calculation-tools/all-tools
• U.S. EPA Climate Leaders GHG Inventory Protocol, “Optional Emissions from Commuting, Business Travel and
Product Transport,” available at: http://www.epa.gov/stateply/documents/resources/commute_travel_product.pdf
• For UK organizations, the Department for Transport provides guidance and a calculation tool for work-related travel
at: http://www2.dft.gov.uk/pgr/sustainable/greenhousegasemissions/.
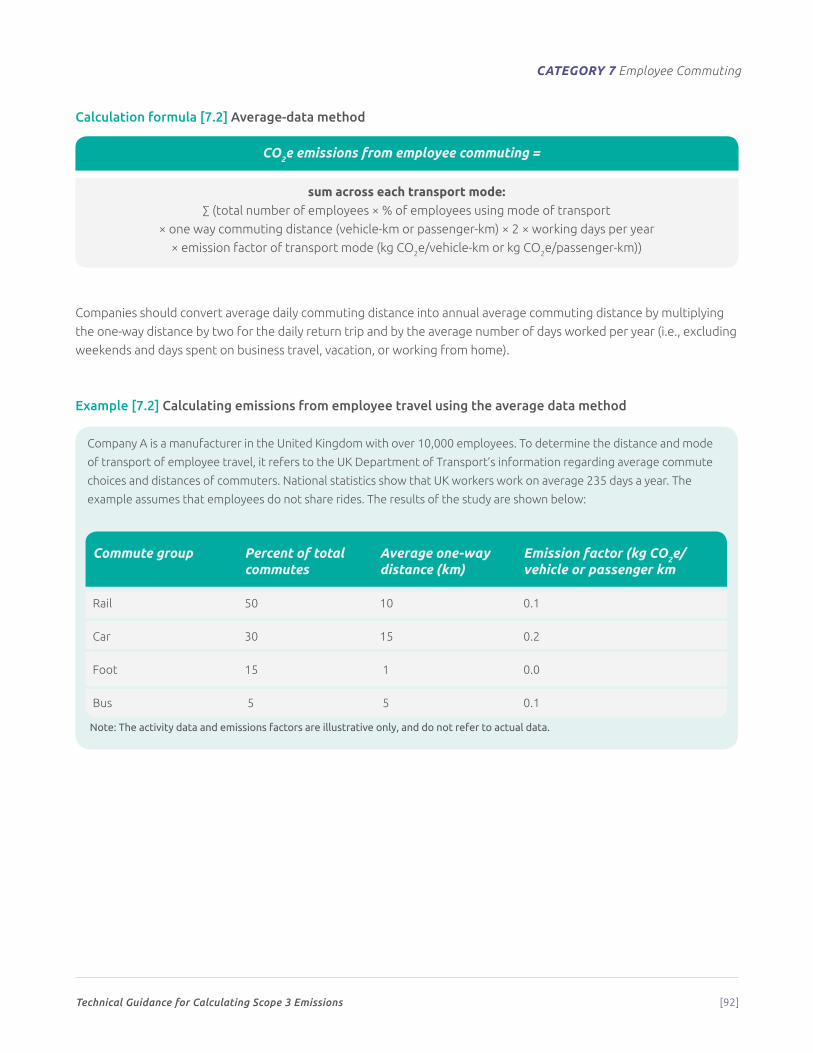
Technical Guidance for Calculating Scope 3 Emissions [92]
CATEGORY 7 Employee Commuting
Calculation formula [7.2] Average-data method
CO2e emissions from employee commuting =
sum across each transport mode:∑ (total number of employees × % of employees using mode of transport
× one way commuting distance (vehicle-km or passenger-km) × 2 × working days per year
× emission factor of transport mode (kg CO2e/vehicle-km or kg CO2e/passenger-km))
Companies should convert average daily commuting distance into annual average commuting distance by multiplying
the one-way distance by two for the daily return trip and by the average number of days worked per year (i.e., excluding
weekends and days spent on business travel, vacation, or working from home).
Example [7.2] Calculating emissions from employee travel using the average data method
Company A is a manufacturer in the United Kingdom with over 10,000 employees. To determine the distance and mode
of transport of employee travel, it refers to the UK Department of Transport’s information regarding average commute
choices and distances of commuters. National statistics show that UK workers work on average 235 days a year. The
example assumes that employees do not share rides. The results of the study are shown below:
Commute group Percent of total commutes
Average one-way distance (km)
Emission factor (kg CO2e/vehicle or passenger km
Rail 50 10 0.1
Car 30 15 0.2
Foot 15 1 0.0
Bus 5 5 0.1
Note: The activity data and emissions factors are illustrative only, and do not refer to actual data.
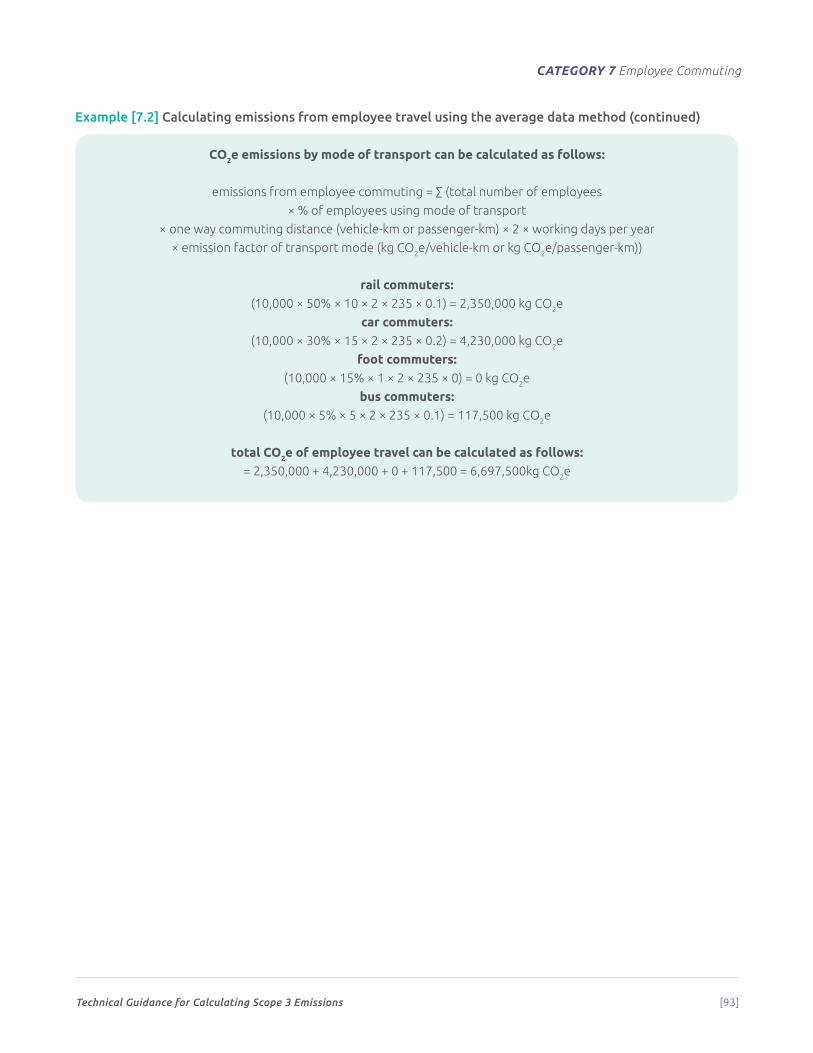
Technical Guidance for Calculating Scope 3 Emissions [93]
CATEGORY 7 Employee Commuting
CO2e emissions by mode of transport can be calculated as follows:
emissions from employee commuting = ∑ (total number of employees
× % of employees using mode of transport
× one way commuting distance (vehicle-km or passenger-km) × 2 × working days per year
× emission factor of transport mode (kg CO2e/vehicle-km or kg CO2e/passenger-km))
rail commuters:(10,000 × 50% × 10 × 2 × 235 × 0.1) = 2,350,000 kg CO2e
car commuters:(10,000 × 30% × 15 × 2 × 235 × 0.2) = 4,230,000 kg CO2e
foot commuters:(10,000 × 15% × 1 × 2 × 235 × 0) = 0 kg CO2e
bus commuters:(10,000 × 5% × 5 × 2 × 235 × 0.1) = 117,500 kg CO2e
total CO2e of employee travel can be calculated as follows:= 2,350,000 + 4,230,000 + 0 + 117,500 = 6,697,500kg CO2e
Example [7.2] Calculating emissions from employee travel using the average data method (continued)
Technical Guidance for Calculating Scope 3 Emissions [94]
8
Category 8: Upstream Leased AssetsCategory description
C ategory 8 includes emissions from the operation of assets that are leased by the
reporting company in the reporting year and not already included in the reporting
company’s scope 1 or scope 2 inventories. This category is applicable only to companies
that operate leased assets (i.e., lessees). For companies that own and lease assets to others
(i.e., lessors), see category 13 (Downstream leased assets).
Leased assets may be included in a company’s scope 1 or scope 2 inventory depending on the type of lease and the
consolidation approach the company uses to define its organizational boundaries (see section 5.2 of the Scope 3 Standard).
If the reporting company leases an asset for only part of the reporting year, it should account for emissions for the
portion of the year that the asset was leased. A reporting company’s scope 3 emissions from upstream leased assets
include the scope 1 and scope 2 emissions of lessors (depending on the lessor’s consolidation approach).
See Appendix A of the Scope 3 Standard for more information on accounting for emissions from leased assets.
Calculating emissions from leased assetsFigure 8.1 shows a decision tree for selecting a calculation method for emissions from upstream leased assets.
Companies may use one of the following methods:
• Asset-specific method, which involves collecting asset-specific (e.g., site-specific) fuel and energy use data and
process and fugitive emissions data or scope 1 and scope 2 emissions data from individual leased assets
• Lessor-specific method, which involves collecting the scope 1 and scope 2 emissions from lessor(s) and allocating
emissions to the relevant leased asset(s)
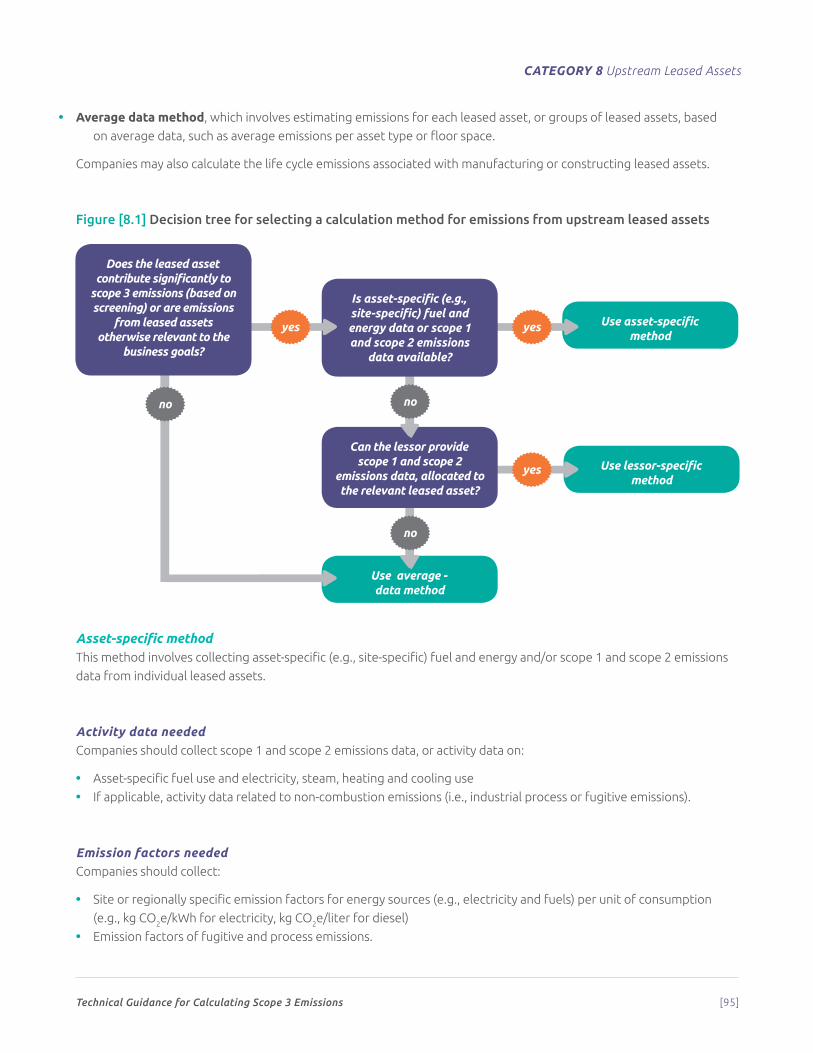
Technical Guidance for Calculating Scope 3 Emissions [95]
CATEGORY 8 Upstream Leased Assets
• Average data method, which involves estimating emissions for each leased asset, or groups of leased assets, based
on average data, such as average emissions per asset type or floor space.
Companies may also calculate the life cycle emissions associated with manufacturing or constructing leased assets.
Figure [8.1] Decision tree for selecting a calculation method for emissions from upstream leased assets
Asset-specific methodThis method involves collecting asset-specific (e.g., site-specific) fuel and energy and/or scope 1 and scope 2 emissions
data from individual leased assets.
Activity data neededCompanies should collect scope 1 and scope 2 emissions data, or activity data on:
• Asset-specific fuel use and electricity, steam, heating and cooling use
• If applicable, activity data related to non-combustion emissions (i.e., industrial process or fugitive emissions).
Emission factors neededCompanies should collect:
• Site or regionally specific emission factors for energy sources (e.g., electricity and fuels) per unit of consumption
(e.g., kg CO2e/kWh for electricity, kg CO2e/liter for diesel)
• Emission factors of fugitive and process emissions.
Use average - data method
no
Use lessor-specific method
Can the lessor provide scope 1 and scope 2
emissions data, allocated to the relevant leased asset?
Use asset-specific method
no no
Is asset-specific (e.g., site-specific) fuel and energy data or scope 1 and scope 2 emissions
data available?
yes
yes
yes
Does the leased asset contribute significantly to
scope 3 emissions (based on screening) or are emissions
from leased assets otherwise relevant to the
business goals?

Technical Guidance for Calculating Scope 3 Emissions [96]
CATEGORY 8 Upstream Leased Assets
To optionally calculate emissions associated with manufacturing or construction of leased assets, companies should
use life cycle emission factors that include manufacturing and construction.
Data collection guidanceData sources for activity data may include:
• Utility bills
• Purchase records
• Meter readings
• Internal IT systems.
Data sources for emission factors include:
• Life cycle databases. A list of life cycle databases is provided on the GHG Protocol website (http://www.ghgprotocol.
org/Third-Party-Databases). Additional databases may be added periodically, so continue to check the website.
• Company-developed emission factors
• Government agencies (e.g., Defra provides emission factors for the UK)
• Industry associations
• For activity data, emission factors, and formulas for process and fugitive emissions, see the GHG Protocol website
(http://www.ghgprotocol.org/calculation-tools/all-tools ) and the IPCC 2006 Guidelines (http://www.ipcc-nggip.iges.
or.jp/public/2006gl/index.html).
To calculate scope 3 emissions from leased assets, aggregate the scope 1 and scope 2 emissions across all of the
reporting company’s leased assets, using this formula:
Calculation formula [8.1] Asset-specific method
CO2e emissions from upstream leased assets =
calculate the scope 1 and scope 2 emissions associated with each leased asset:
scope 1 emissions of leased asset
= ∑ (quantity of fuel consumed (e.g., liter) × emission factor for fuel source (e.g., kg CO2e/liter))
+ ∑ ((quantity of refrigerant leakage (kg) × emission factor for refrigerant (kg CO2e/kg))
+ process emissions)
scope 2 emissions of leased asset
= ∑ (quantity of electricity, steam, heating, cooling consumed (e.g., kWh)
× emission factor for electricity, steam, heating, cooling (e.g., kg CO2e/kWh))
then sum across leased assets:
∑ scope 1 and scope 2 emissions of each leased asset
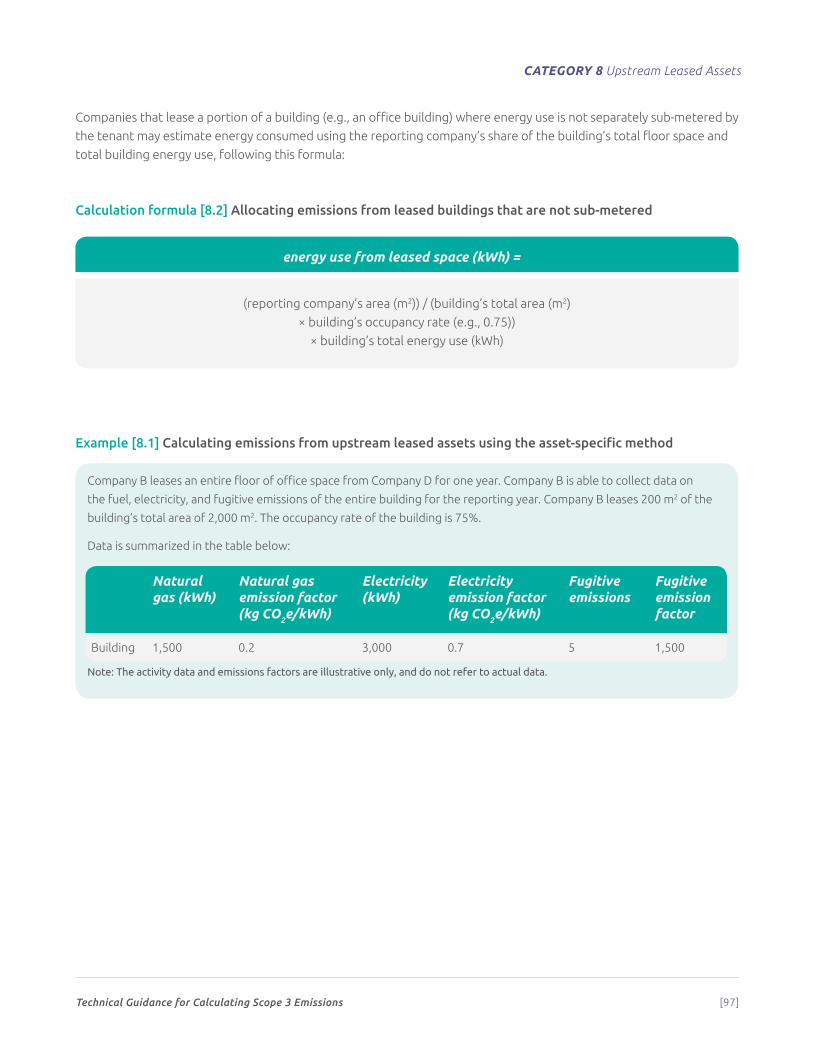
Technical Guidance for Calculating Scope 3 Emissions [97]
CATEGORY 8 Upstream Leased Assets
Companies that lease a portion of a building (e.g., an office building) where energy use is not separately sub-metered by
the tenant may estimate energy consumed using the reporting company’s share of the building’s total floor space and
total building energy use, following this formula:
Calculation formula [8.2] Allocating emissions from leased buildings that are not sub-metered
energy use from leased space (kWh) =
(reporting company’s area (m2)) / (building’s total area (m2)
× building’s occupancy rate (e.g., 0.75))
× building’s total energy use (kWh)
Example [8.1] Calculating emissions from upstream leased assets using the asset-specific method
Company B leases an entire floor of office space from Company D for one year. Company B is able to collect data on
the fuel, electricity, and fugitive emissions of the entire building for the reporting year. Company B leases 200 m2 of the
building’s total area of 2,000 m2. The occupancy rate of the building is 75%.
Data is summarized in the table below:
Natural gas (kWh)
Natural gas emission factor (kg CO2e/kWh)
Electricity (kWh)
Electricity emission factor (kg CO2e/kWh)
Fugitive emissions
Fugitive emission factor
Building 1,500 0.2 3,000 0.7 5 1,500
Note: The activity data and emissions factors are illustrative only, and do not refer to actual data.
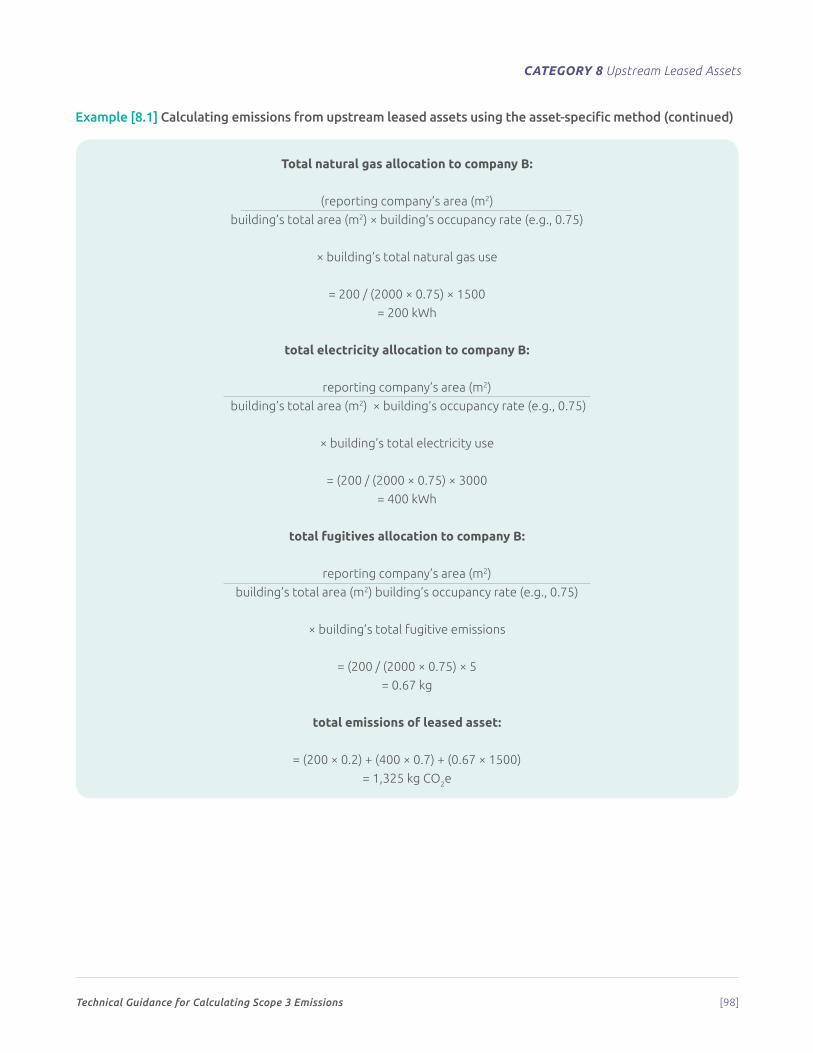
Technical Guidance for Calculating Scope 3 Emissions [98]
CATEGORY 8 Upstream Leased Assets
Total natural gas allocation to company B:
(reporting company’s area (m2)
building’s total area (m2) × building’s occupancy rate (e.g., 0.75)
× building’s total natural gas use
= 200 / (2000 × 0.75) × 1500
= 200 kWh
total electricity allocation to company B:
reporting company’s area (m2)
building’s total area (m2) × building’s occupancy rate (e.g., 0.75)
× building’s total electricity use
= (200 / (2000 × 0.75) × 3000
= 400 kWh
total fugitives allocation to company B:
reporting company’s area (m2)
building’s total area (m2) building’s occupancy rate (e.g., 0.75)
× building’s total fugitive emissions
= (200 / (2000 × 0.75) × 5
= 0.67 kg
total emissions of leased asset:
= (200 × 0.2) + (400 × 0.7) + (0.67 × 1500)
= 1,325 kg CO2e
Example [8.1] Calculating emissions from upstream leased assets using the asset-specific method (continued)

Technical Guidance for Calculating Scope 3 Emissions [99]
CATEGORY 8 Upstream Leased Assets
Lessor-specific methodThe lessor-specific method involves collecting the scope 1 and scope 2 emissions from lessor(s) and allocating
emissions to the relevant leased asset(s). This method is relevant in cases where, for example, office space is leased in
a building that is not sub-metered. If the lessor company has data available at the building- or company-level, allocation
techniques can be used to apportion emissions to the office space leased by the reporting company.
Activity data neededCompanies should collect lessors’ total scope 1 and scope 2 emissions data, or activity data on:
• Lessor’s total fuel use and electricity use
• Lessor’s fugitive emissions (e.g., from refrigerants)
• Lessor’s process emissions (if applicable).
Emission factors needed • Site or regionally specific emission factors for energy sources (e.g., electricity and fuels) per unit of consumption
(e.g., kg CO2e/kWh for electricity, kg CO2e/liter for diesel)
• Emission factors of fugitive and process emissions.
To allocate emissions, companies should collect data on:
• Total area/volume/quantity of lessors’ assets
• Total area/volume/quantity of the reporting company’s leased assets.
For guidance on allocating emissions, refer to chapter 8 of the Scope 3 Standard.

Technical Guidance for Calculating Scope 3 Emissions [100]
CATEGORY 8 Upstream Leased Assets
Calculation formula [8.3] Lessor-specific method
CO2e emissions from leased assets =
calculate the scope 1 and scope 2 emissions associated with each lessor:
scope 1 emissions of lessor
= ∑ (quantity of fuel consumed (e.g., liter) × emission factor for fuel source (e.g., kg CO2e/liter))
+ ∑ (quantity of refrigerant leakage (kg) × emission factor for refrigerant (kg CO2e/kg))
+ process emissions
scope 2 emissions of lessor
= ∑ (quantity of electricity, steam, heating, cooling consumed (e.g., kWh)
× emission factor for electricity, steam, heating, cooling (e.g., kg CO2e/kWh))
then allocate emissions from each lessor and then sum across lessors:
∑ (scope 1 and scope 2 emissions of lessor (kg CO2e)
× ( area, volume, quantity, etc., of the leased asset
total area, volume, quantity, etc., of lessor assets
Average-data methodThe average-data method involves estimating emissions for each leased asset, or groups of leased assets, based on
average statistics and secondary data, such as average emissions per asset type or floor space. The average-data
method should be used when purchase records, electricity bills, or meter readings of fuel or energy use are not
available or applicable. Approaches include:
• Estimated emissions based on occupied floor space by asset/building type (for leased buildings)
• Estimated emissions based on number and type of leased assets.
Note that the average-data method is less accurate than the lessor-specific method and limits the ability of companies
to track their performance of GHG reduction actions.
Activity data neededCompanies should collect data on:
• Floor space of each leased building
• Number of leased buildings, by building type (e.g., office, retail, warehouse, factory, etc.)
• Number and type of leased assets other than buildings that give rise to scope 1 or scope 2 emissions (e.g., company
cars, trucks).
)
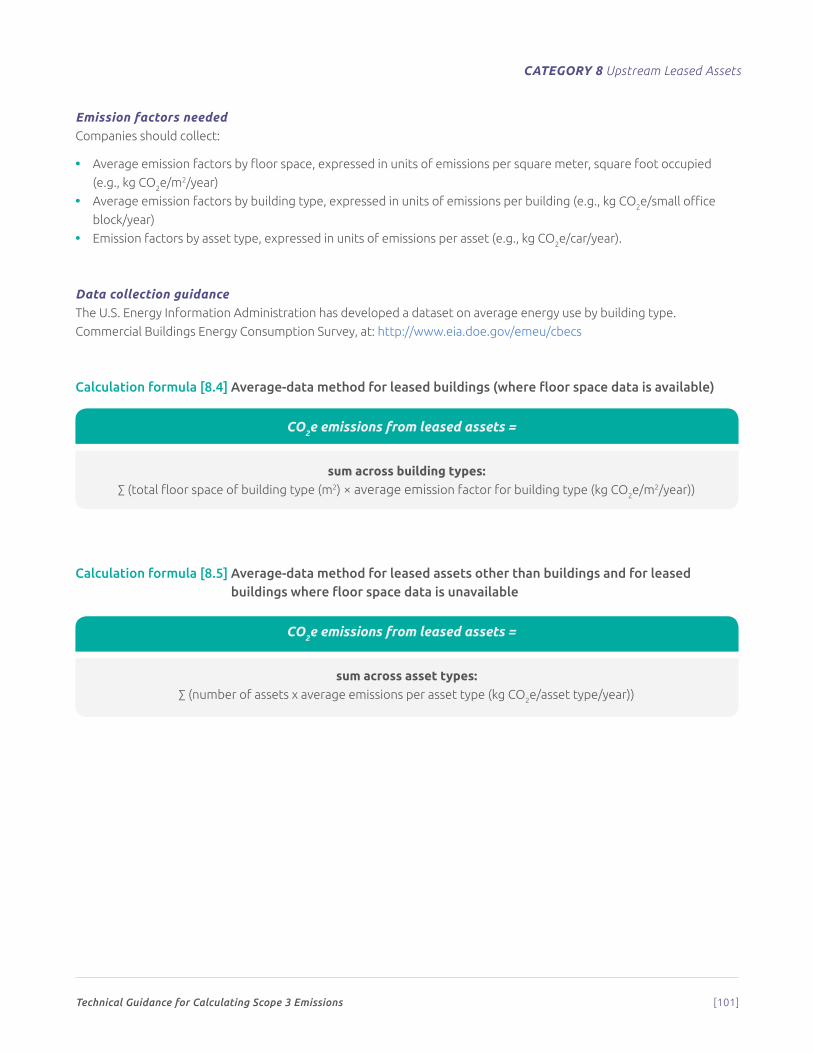
Technical Guidance for Calculating Scope 3 Emissions [101]
CATEGORY 8 Upstream Leased Assets
Emission factors neededCompanies should collect:
• Average emission factors by floor space, expressed in units of emissions per square meter, square foot occupied
(e.g., kg CO2e/m2/year)
• Average emission factors by building type, expressed in units of emissions per building (e.g., kg CO2e/small office
block/year)
• Emission factors by asset type, expressed in units of emissions per asset (e.g., kg CO2e/car/year).
Data collection guidanceThe U.S. Energy Information Administration has developed a dataset on average energy use by building type.
Commercial Buildings Energy Consumption Survey, at: http://www.eia.doe.gov/emeu/cbecs
Calculation formula [8.4] Average-data method for leased buildings (where floor space data is available)
CO2e emissions from leased assets =
sum across building types:∑ (total floor space of building type (m2) × average emission factor for building type (kg CO2e/m2/year))
Calculation formula [8.5] Average-data method for leased assets other than buildings and for leased buildings where floor space data is unavailable
CO2e emissions from leased assets =
sum across asset types:∑ (number of assets x average emissions per asset type (kg CO2e/asset type/year))
Technical Guidance for Calculating Scope 3 Emissions [102]
9
Category 9: Downstream Transportation and Distribution
Category description
T his category includes emissions that occur in the reporting year from transportation
and distribution of sold products in vehicles and facilities not owned or controlled by
the reporting company.
This category also includes emissions from retail and storage. Outbound transportation and distribution services
that are purchased by the reporting company are excluded from category 9 and included in category 4 (Upstream
transportation and distribution) because the reporting company purchases the service. Category 9 includes only
emissions from transportation and distribution of products after the point of sale. See table 5.7 in the Scope 3 Standard for guidance in accounting for emissions from transportation and distribution in the value chain.
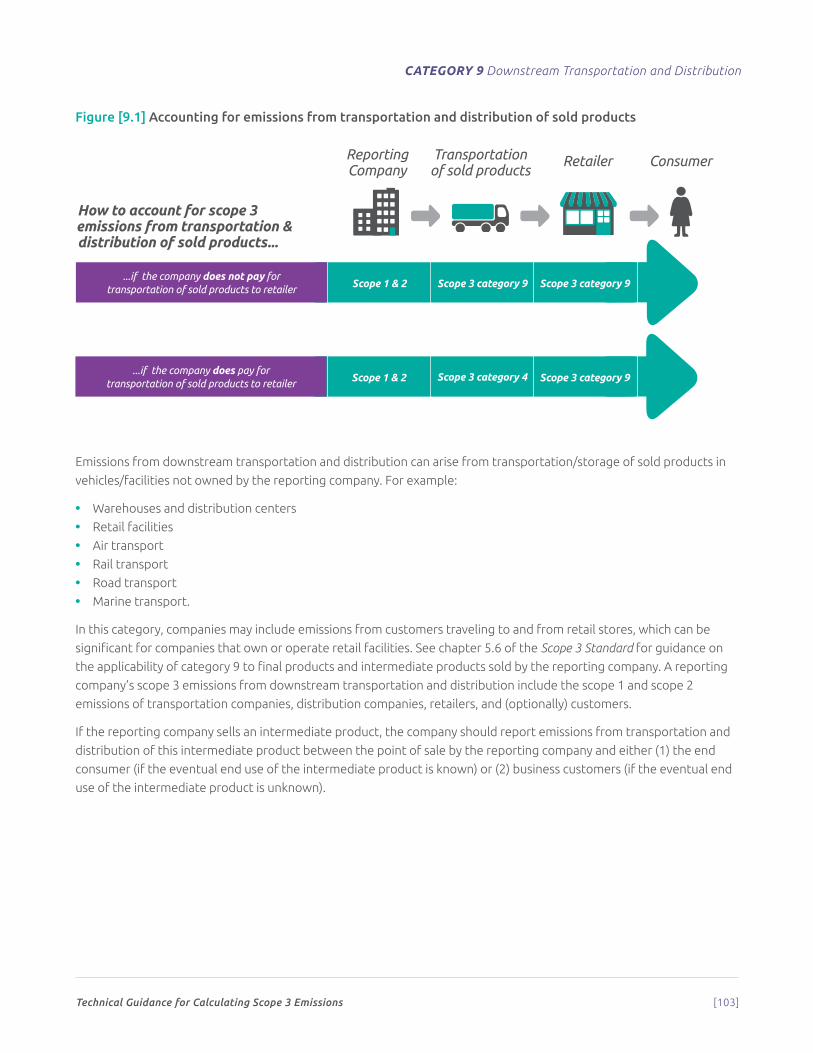
Technical Guidance for Calculating Scope 3 Emissions [103]
CATEGORY 9 Downstream Transportation and Distribution
Figure [9.1] Accounting for emissions from transportation and distribution of sold products
Emissions from downstream transportation and distribution can arise from transportation/storage of sold products in
vehicles/facilities not owned by the reporting company. For example:
• Warehouses and distribution centers
• Retail facilities
• Air transport
• Rail transport
• Road transport
• Marine transport.
In this category, companies may include emissions from customers traveling to and from retail stores, which can be
significant for companies that own or operate retail facilities. See chapter 5.6 of the Scope 3 Standard for guidance on
the applicability of category 9 to final products and intermediate products sold by the reporting company. A reporting
company’s scope 3 emissions from downstream transportation and distribution include the scope 1 and scope 2
emissions of transportation companies, distribution companies, retailers, and (optionally) customers.
If the reporting company sells an intermediate product, the company should report emissions from transportation and
distribution of this intermediate product between the point of sale by the reporting company and either (1) the end
consumer (if the eventual end use of the intermediate product is known) or (2) business customers (if the eventual end
use of the intermediate product is unknown).
How to account for scope 3 emissions from transportation & distribution of sold products...
1 2 3
4 5 6
7 8 9
10 11 12
13 14 15
16 17
1. wheat2. tree3. mountains4. glass bottle5. plastic bottle6. aluminium can7. factory8. lorry9. cloud10. recycling bin11. recycling bin (colours reversed)12. wind turbines13. chicken14. cow 115. cow 216. shop17. factory showing carbon emissions (carbon emissions are shown in orange)
...if the company does not pay for transportation of sold products to retailer
...if the company does pay for transportation of sold products to retailer
1 2 3
4 5 6
7 8 9
10 11 12
13 14 15
16 17
1. wheat2. tree3. mountains4. glass bottle5. plastic bottle6. aluminium can7. factory8. lorry9. cloud10. recycling bin11. recycling bin (colours reversed)12. wind turbines13. chicken14. cow 115. cow 216. shop17. factory showing carbon emissions (carbon emissions are shown in orange)
Reporting Company
Transportation of sold products
Retailer Consumer
Scope 1 & 2 Scope 3 category 9 Scope 3 category 9
Scope 1 & 2 Scope 3 category 4 Scope 3 category 9
Technical Guidance for Calculating Scope 3 Emissions [104]
CATEGORY 9 Downstream Transportation and Distribution
Calculating emissions from transportation (downstream)The emissions from downstream transportation should follow the calculation methods described in category 4
(Upstream transportation and distribution). Figure 9.1 shows how to determine how to account for emissions from
transportation and distribution of sold products. Companies may use either the fuel-based, distance-based or spend-
based method.
Activity data neededThe major difference between calculating upstream and downstream emissions of transportation is likely to be the
availability and quality of activity data. Transportation data may be easier to obtain from upstream suppliers than from
downstream customers and transportation companies. Therefore, companies may need to use the distance-based
method to calculate downstream transportation emissions.
If the actual transportation distances are not known, the reporting company may estimate downstream distances by
using a combination of:
• Government, academic, or industry publications
• Online maps and calculators
• Published port-to-port travel distances.
Emission factors needed • See emission factors guidance for category 4 (Upstream transportation and distribution).
Data collection guidanceThe UK government produces average freight distances for the economy’s main categories of goods (see http://www.
dft.gov.uk/pgr/statistics/datatablespublications/freight/). This database may be used in the absence of purchaser-
specific or region-specific data.
A list of life cycle databases is provided on the GHG Protocol website (http://www.ghgprotocol.org/Third-Party-
Databases). Additional databases may be added periodically, so continue to check the website.
Calculating emissions from distribution (downstream)The emissions from downstream distribution should follow the calculation methods described in category 4 (Upstream
transportation and distribution). Companies may use either the site-specific method or the average-data method. For
the reasons outlined above, companies are more likely to apply the average-data method.
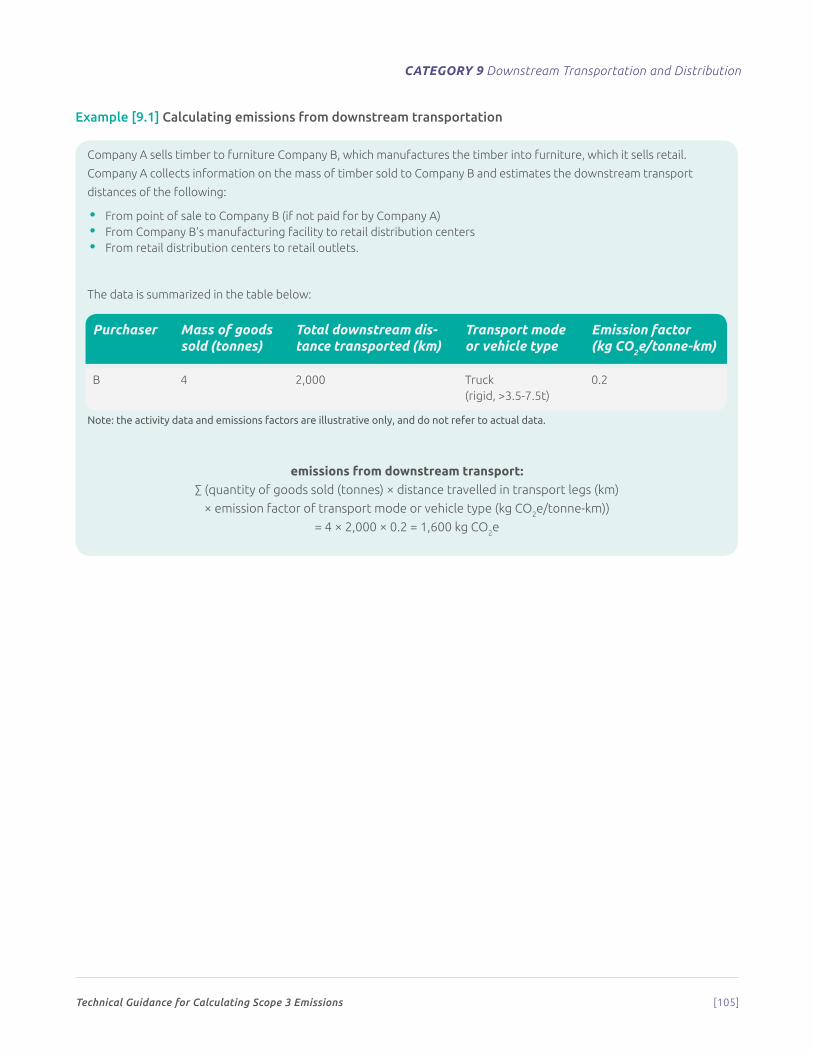
Technical Guidance for Calculating Scope 3 Emissions [105]
CATEGORY 9 Downstream Transportation and Distribution
Example [9.1] Calculating emissions from downstream transportation
Company A sells timber to furniture Company B, which manufactures the timber into furniture, which it sells retail.
Company A collects information on the mass of timber sold to Company B and estimates the downstream transport
distances of the following:
• From point of sale to Company B (if not paid for by Company A)• From Company B’s manufacturing facility to retail distribution centers• From retail distribution centers to retail outlets.
The data is summarized in the table below:
Purchaser Mass of goods sold (tonnes)
Total downstream dis-tance transported (km)
Transport mode or vehicle type
Emission factor (kg CO2e/tonne-km)
B 4 2,000 Truck (rigid, >3.5-7.5t)
0.2
Note: the activity data and emissions factors are illustrative only, and do not refer to actual data.
emissions from downstream transport:∑ (quantity of goods sold (tonnes) × distance travelled in transport legs (km)
× emission factor of transport mode or vehicle type (kg CO2e/tonne-km))
= 4 × 2,000 × 0.2 = 1,600 kg CO2e
Technical Guidance for Calculating Scope 3 Emissions [106]
10
Category 10:
Processing of Sold Products
Category description
C ategory 10 includes emissions from processing of sold intermediate products
by third parties (e.g., manufacturers) subsequent to sale by the reporting
company. Intermediate products are products that require further processing,
transformation, or inclusion in another product before use (see box 5.3 of the Scope 3
Standard), and therefore result in emissions from processing subsequent to sale by the
reporting company and before use by the end consumer. Emissions from processing should
be allocated to the intermediate product.
In certain cases, the eventual end use of sold intermediate products may be unknown. For example, a company that
produces an intermediate product with many potential downstream applications, each of which has a different GHG
emissions profile, may be unable to reasonably estimate the downstream emissions associated with these various
end uses. See section 6.4 of the Scope 3 Standard for guidance in cases where downstream emissions associated
with sold intermediate products are unknown.
See section 5.6 of the Scope 3 Standard for guidance on the applicability of category 10 to final products and
intermediate products sold by the reporting company. A reporting company’s scope 3 emissions from processing
of sold intermediate products include the scope 1 and scope 2 emissions of downstream value chain partners
(e.g., manufacturers).
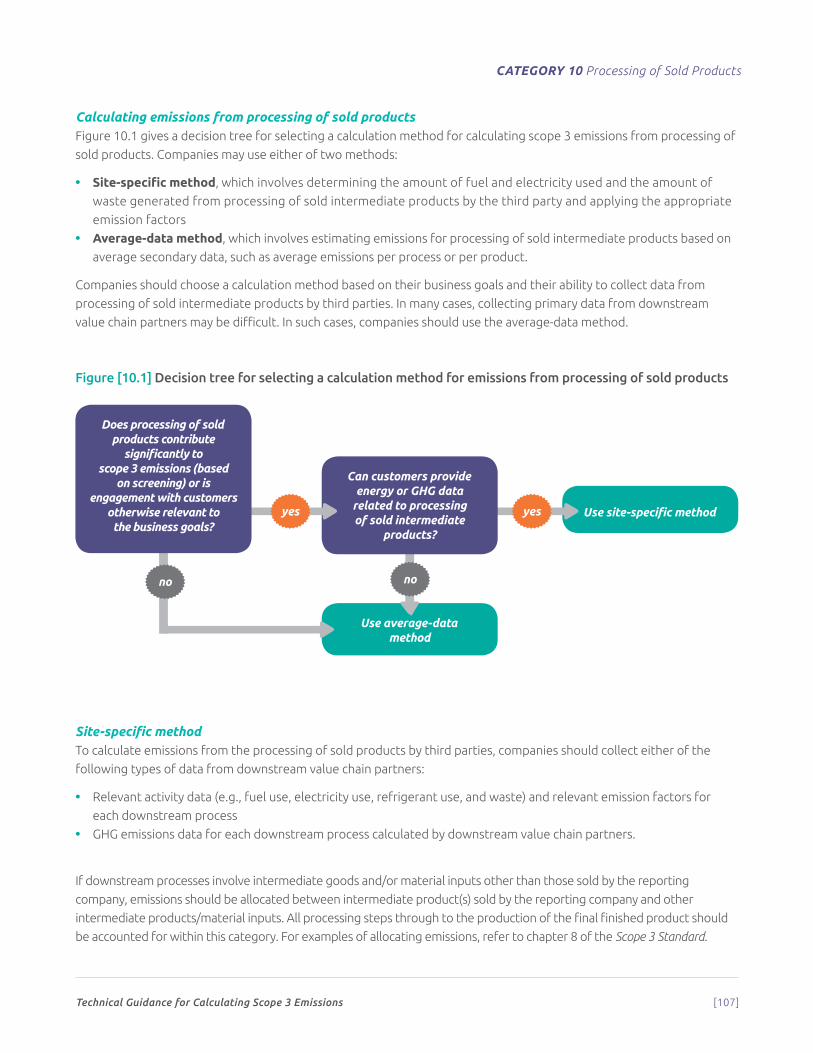
Technical Guidance for Calculating Scope 3 Emissions [107]
CATEGORY 10 Processing of Sold Products
Calculating emissions from processing of sold productsFigure 10.1 gives a decision tree for selecting a calculation method for calculating scope 3 emissions from processing of
sold products. Companies may use either of two methods:
• Site-specific method, which involves determining the amount of fuel and electricity used and the amount of
waste generated from processing of sold intermediate products by the third party and applying the appropriate
emission factors
• Average-data method, which involves estimating emissions for processing of sold intermediate products based on
average secondary data, such as average emissions per process or per product.
Companies should choose a calculation method based on their business goals and their ability to collect data from
processing of sold intermediate products by third parties. In many cases, collecting primary data from downstream
value chain partners may be difficult. In such cases, companies should use the average-data method.
Figure [10.1] Decision tree for selecting a calculation method for emissions from processing of sold products
Site-specific methodTo calculate emissions from the processing of sold products by third parties, companies should collect either of the
following types of data from downstream value chain partners:
• Relevant activity data (e.g., fuel use, electricity use, refrigerant use, and waste) and relevant emission factors for
each downstream process
• GHG emissions data for each downstream process calculated by downstream value chain partners.
If downstream processes involve intermediate goods and/or material inputs other than those sold by the reporting
company, emissions should be allocated between intermediate product(s) sold by the reporting company and other
intermediate products/material inputs. All processing steps through to the production of the final finished product should
be accounted for within this category. For examples of allocating emissions, refer to chapter 8 of the Scope 3 Standard.
Use average-data method
Use site-specific method
no no
Can customers provide energy or GHG data
related to processing of sold intermediate
products?
yesyes
Does processing of sold products contribute
significantly to scope 3 emissions (based
on screening) or is engagement with customers
otherwise relevant to the business goals?
Technical Guidance for Calculating Scope 3 Emissions [108]
CATEGORY 10 Processing of Sold Products
If data cannot be obtained from downstream third party partners, the average data method should be used.
Activity data neededCompanies should first collect data on the types and quantities of intermediate goods sold by the reporting company.
Companies should then collect either site-specific GHG emissions data provided by downstream value chain partners or
site-specific activity data from downstream processes, including:
• Quantities of energy (including electricity and fuels) consumed in process(es)
• To the extent possible, mass of waste generated in process(es)
• If applicable, activity data related to non-combustion emissions (i.e., industrial process or fugitive emissions).
Emission factors neededIf site-specific activity data is collected, companies should also collect:
• Emission factors for fuels
• Emission factors for electricity
• To the extent possible, emission factors for waste outputs
• If applicable, emission factors related to non-combustion emissions (i.e., industrial process or fugitive emissions).
Data collection guidanceCompanies should collect data on the types and mass of intermediate goods sold by the reporting company from
internal records.
Companies should request either GHG emissions data or activity data from downstream processes from the downstream
value chain partners that control those processes. Downstream partners can obtain this data from, for example:
• Internal IT systems
• Utility bills
• Purchase receipts
• Meter readings.
Data sources for emission factors include:
• The list of data sources provided on the GHG Protocol website (www.ghgprotocol.org/standards/scope-3-standard)
• Company or manufacturer developed emission factors
• Industry associations
• For activity data, emission factors, and formulas for process and fugitive emissions, see the GHG Protocol website
(http://www.ghgprotocol.org/calculation-tools/all-tools) and the IPCC 2006 Guidelines (http://www.ipcc-nggip.iges.
or.jp/public/2006gl/index.html).
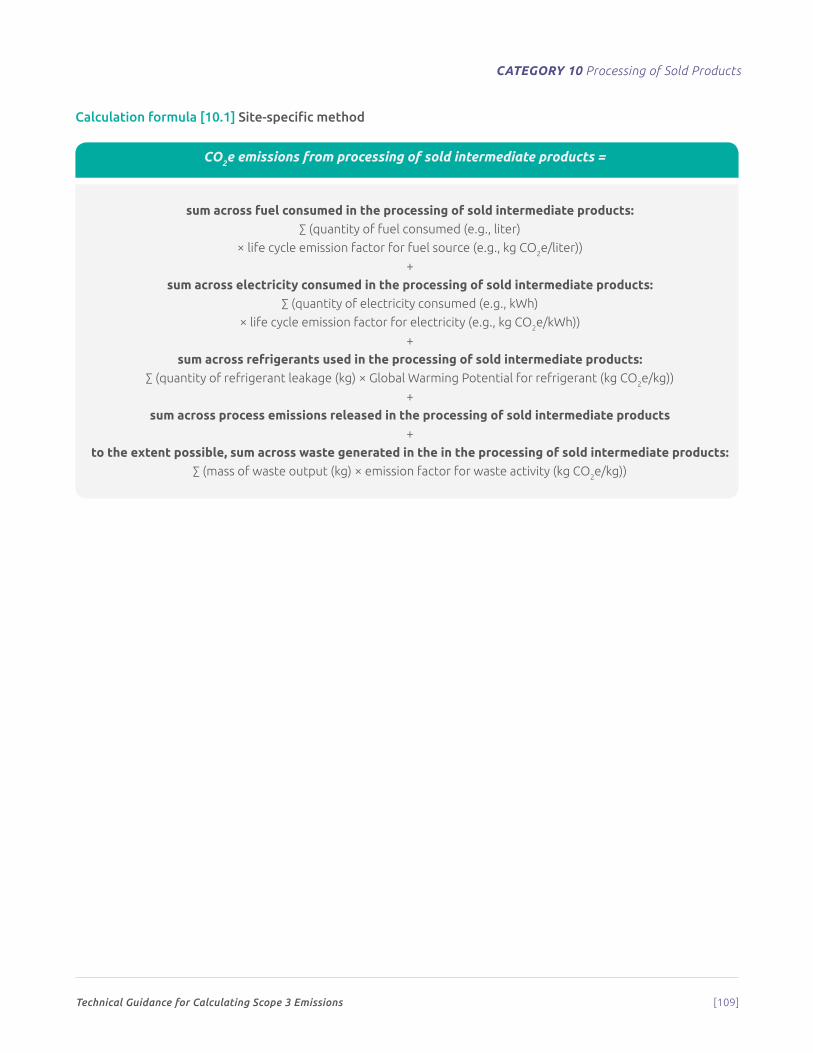
Technical Guidance for Calculating Scope 3 Emissions [109]
CATEGORY 10 Processing of Sold Products
Calculation formula [10.1] Site-specific method
CO2e emissions from processing of sold intermediate products =
sum across fuel consumed in the processing of sold intermediate products:∑ (quantity of fuel consumed (e.g., liter)
× life cycle emission factor for fuel source (e.g., kg CO2e/liter))
+
sum across electricity consumed in the processing of sold intermediate products:∑ (quantity of electricity consumed (e.g., kWh)
× life cycle emission factor for electricity (e.g., kg CO2e/kWh))
+
sum across refrigerants used in the processing of sold intermediate products:∑ (quantity of refrigerant leakage (kg) × Global Warming Potential for refrigerant (kg CO2e/kg))
+
sum across process emissions released in the processing of sold intermediate products+
to the extent possible, sum across waste generated in the in the processing of sold intermediate products:∑ (mass of waste output (kg) × emission factor for waste activity (kg CO2e/kg))
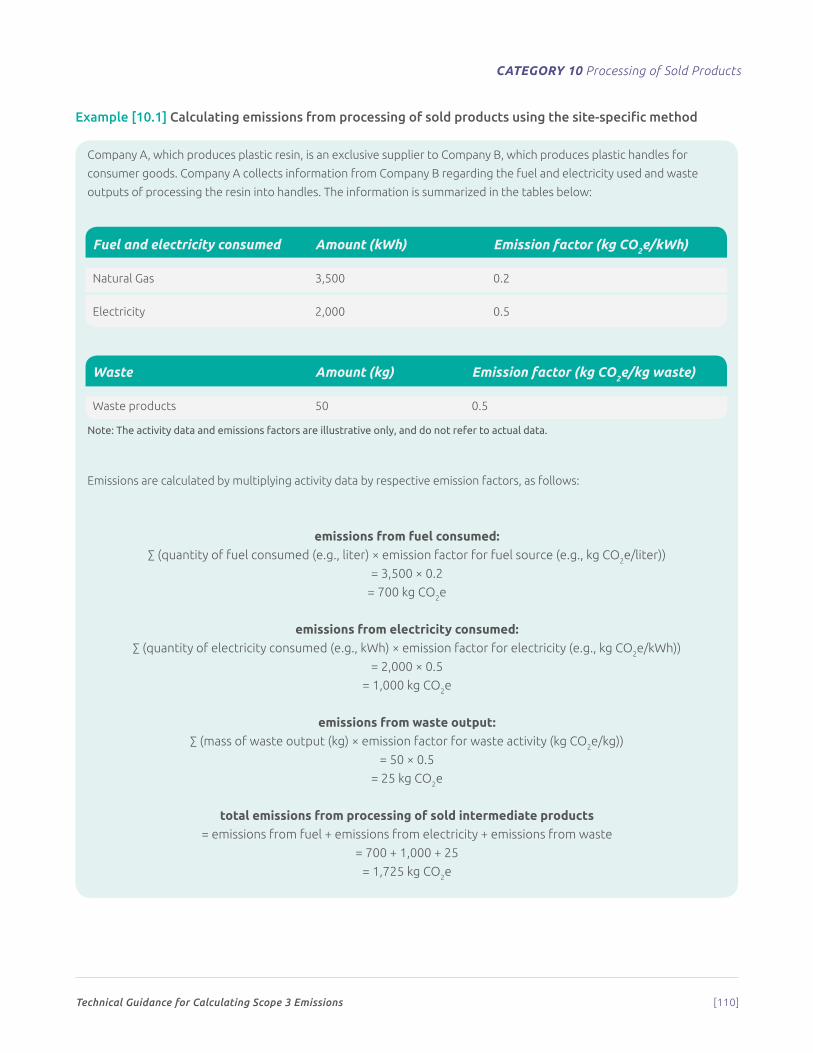
Technical Guidance for Calculating Scope 3 Emissions [110]
CATEGORY 10 Processing of Sold Products
Example [10.1] Calculating emissions from processing of sold products using the site-specific method
Company A, which produces plastic resin, is an exclusive supplier to Company B, which produces plastic handles for
consumer goods. Company A collects information from Company B regarding the fuel and electricity used and waste
outputs of processing the resin into handles. The information is summarized in the tables below:
Fuel and electricity consumed Amount (kWh) Emission factor (kg CO2e/kWh)
Natural Gas 3,500 0.2
Electricity 2,000 0.5
Waste Amount (kg) Emission factor (kg CO2e/kg waste)
Waste products 50 0.5
Note: The activity data and emissions factors are illustrative only, and do not refer to actual data.
Emissions are calculated by multiplying activity data by respective emission factors, as follows:
emissions from fuel consumed:∑ (quantity of fuel consumed (e.g., liter) × emission factor for fuel source (e.g., kg CO2e/liter))
= 3,500 × 0.2
= 700 kg CO2e
emissions from electricity consumed:∑ (quantity of electricity consumed (e.g., kWh) × emission factor for electricity (e.g., kg CO2e/kWh))
= 2,000 × 0.5
= 1,000 kg CO2e
emissions from waste output:∑ (mass of waste output (kg) × emission factor for waste activity (kg CO2e/kg))
= 50 × 0.5
= 25 kg CO2e
total emissions from processing of sold intermediate products= emissions from fuel + emissions from electricity + emissions from waste
= 700 + 1,000 + 25
= 1,725 kg CO2e
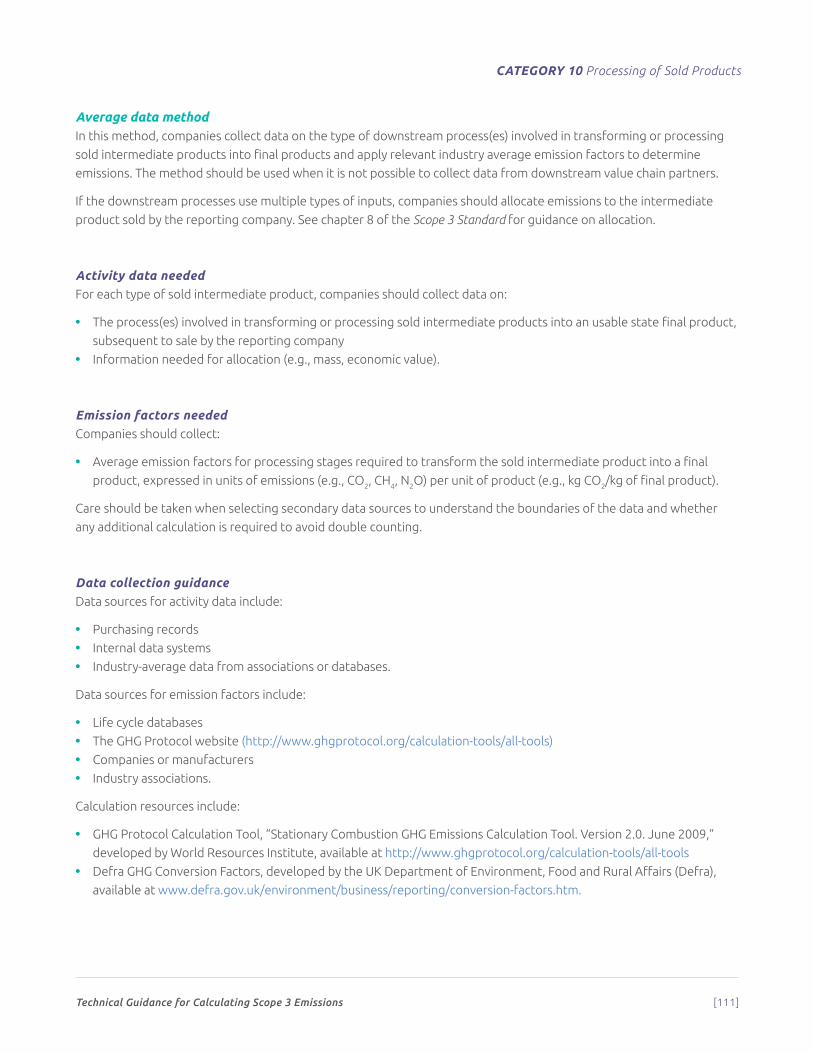
Technical Guidance for Calculating Scope 3 Emissions [111]
CATEGORY 10 Processing of Sold Products
Average data methodIn this method, companies collect data on the type of downstream process(es) involved in transforming or processing
sold intermediate products into final products and apply relevant industry average emission factors to determine
emissions. The method should be used when it is not possible to collect data from downstream value chain partners.
If the downstream processes use multiple types of inputs, companies should allocate emissions to the intermediate
product sold by the reporting company. See chapter 8 of the Scope 3 Standard for guidance on allocation.
Activity data neededFor each type of sold intermediate product, companies should collect data on:
• The process(es) involved in transforming or processing sold intermediate products into an usable state final product,
subsequent to sale by the reporting company
• Information needed for allocation (e.g., mass, economic value).
Emission factors neededCompanies should collect:
• Average emission factors for processing stages required to transform the sold intermediate product into a final
product, expressed in units of emissions (e.g., CO2, CH4, N2O) per unit of product (e.g., kg CO2/kg of final product).
Care should be taken when selecting secondary data sources to understand the boundaries of the data and whether
any additional calculation is required to avoid double counting.
Data collection guidanceData sources for activity data include:
• Purchasing records
• Internal data systems
• Industry-average data from associations or databases.
Data sources for emission factors include:
• Life cycle databases
• The GHG Protocol website (http://www.ghgprotocol.org/calculation-tools/all-tools)
• Companies or manufacturers
• Industry associations.
Calculation resources include:
• GHG Protocol Calculation Tool, “Stationary Combustion GHG Emissions Calculation Tool. Version 2.0. June 2009,”
developed by World Resources Institute, available at http://www.ghgprotocol.org/calculation-tools/all-tools
• Defra GHG Conversion Factors, developed by the UK Department of Environment, Food and Rural Affairs (Defra),
available at www.defra.gov.uk/environment/business/reporting/conversion-factors.htm.
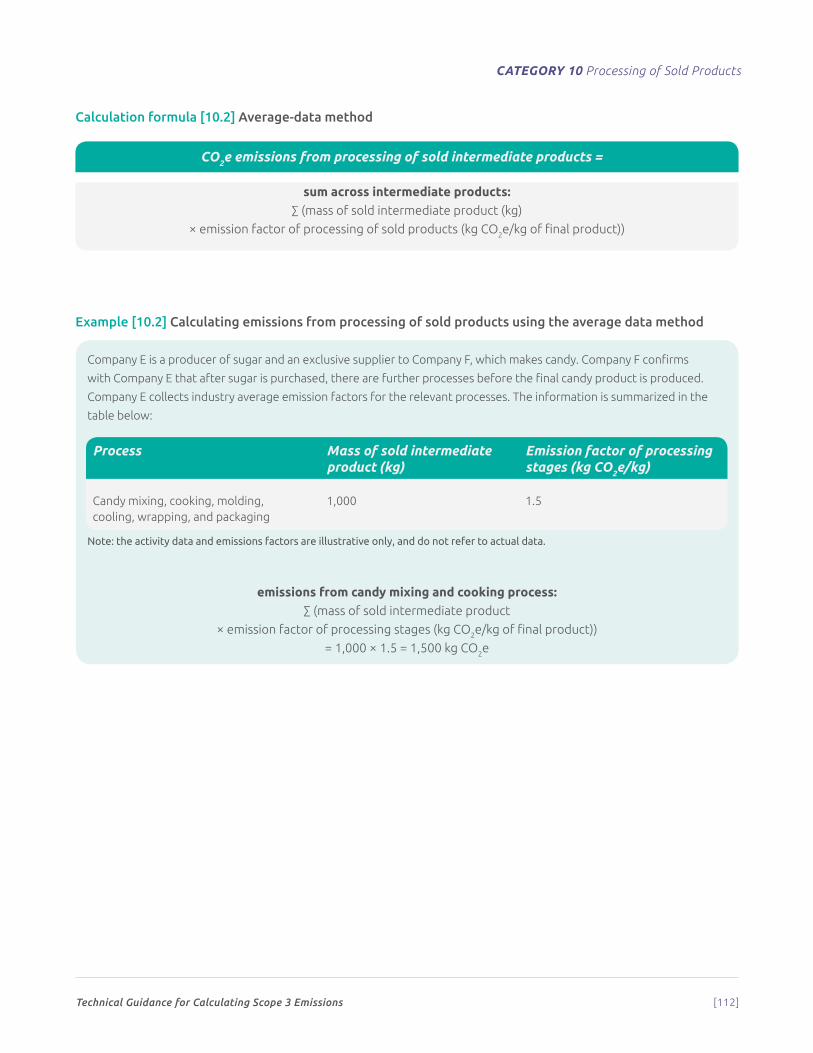
Technical Guidance for Calculating Scope 3 Emissions [112]
CATEGORY 10 Processing of Sold Products
Calculation formula [10.2] Average-data method
CO2e emissions from processing of sold intermediate products =
sum across intermediate products:∑ (mass of sold intermediate product (kg)
× emission factor of processing of sold products (kg CO2e/kg of final product))
Example [10.2] Calculating emissions from processing of sold products using the average data method
Company E is a producer of sugar and an exclusive supplier to Company F, which makes candy. Company F confirms
with Company E that after sugar is purchased, there are further processes before the final candy product is produced.
Company E collects industry average emission factors for the relevant processes. The information is summarized in the
table below:
Process Mass of sold intermediate product (kg)
Emission factor of processing stages (kg CO2e/kg)
Candy mixing, cooking, molding, cooling, wrapping, and packaging
1,000 1.5
Note: the activity data and emissions factors are illustrative only, and do not refer to actual data.
emissions from candy mixing and cooking process:∑ (mass of sold intermediate product
× emission factor of processing stages (kg CO2e/kg of final product))
= 1,000 × 1.5 = 1,500 kg CO2e
Technical Guidance for Calculating Scope 3 Emissions [113]
11
Category 11: Use of Sold ProductsCategory description
T his category includes emissions from the use of goods and services sold by the reporting
company in the reporting year. A reporting company’s scope 3 emissions from use of
sold products include the scope 1 and scope 2 emissions of end users. End users include
bothconsumersandbusinesscustomersthatusefinalproducts.
The Scope 3 Standard divides emissions from the use of sold products into two types (see also table 11.1):
• Direct use-phase emissions
• Indirect use-phase emissions.
In category 11, companies are required to include direct use-phase emissions of sold products. Companies may also
account for indirect use-phase emissions of sold products, and should do so when indirect use-phase emissions are
expected to be significant. See table 11.1 for descriptions and examples of direct and indirect use-phase emissions.
Category 11 includes the total expected lifetime emissions from all relevant products sold in the reporting year across
the company’s product portfolio. (Refer to chapter 5.4 of the Scope 3 Standard for more information on the time
boundary of scope 3 categories.) See box 11.1 in this chapter for an example of reporting product lifetime emissions
and box 11.2 for guidance related to product lifetime and durability. The GHG Protocol Product Standard provides
information on accounting for life cycle GHG emissions from individual products.
Companies may optionally include emissions associated with maintenance of sold products during use.
See section 5.6 of the Scope 3 Standard for guidance on the applicability of category 11 to final products and
intermediate products sold by the reporting company.
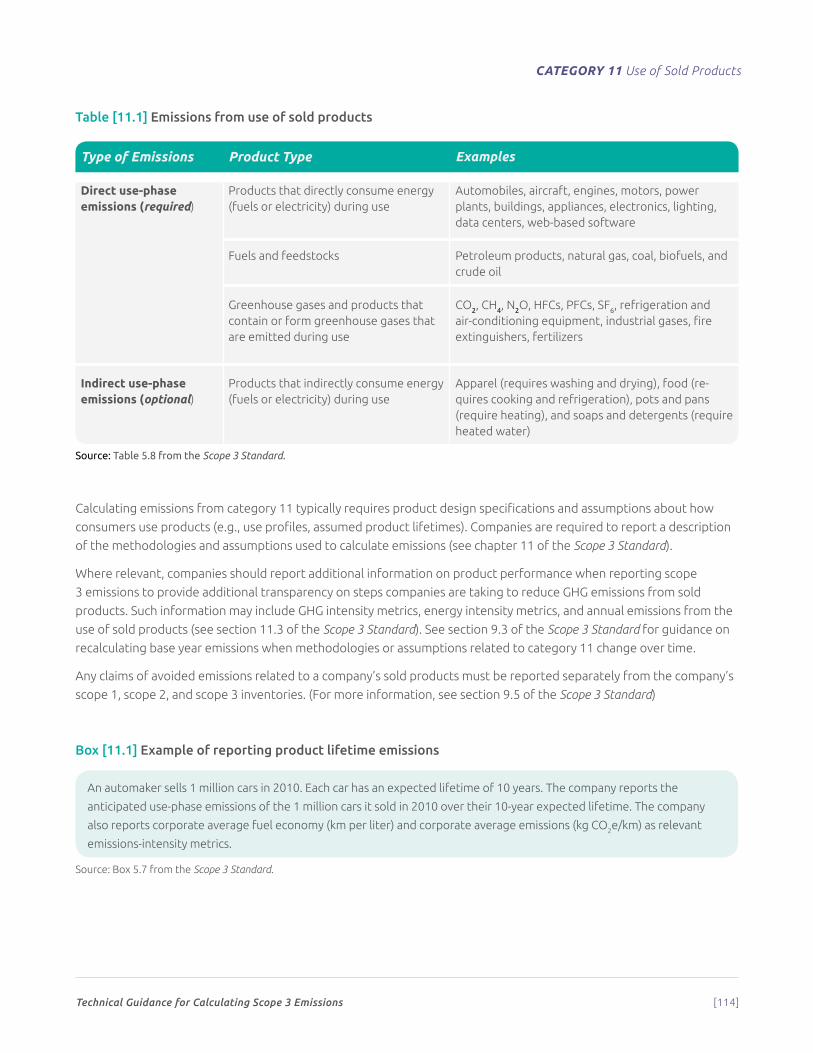
Technical Guidance for Calculating Scope 3 Emissions [114]
CATEGORY 11 Use of Sold Products
Table [11.1] Emissions from use of sold products
Type of Emissions Product Type Examples
Direct use-phase emissions (required)
Products that directly consume energy (fuels or electricity) during use
Automobiles, aircraft, engines, motors, power plants, buildings, appliances, electronics, lighting, data centers, web-based software
Fuels and feedstocks Petroleum products, natural gas, coal, biofuels, and crude oil
Greenhouse gases and products that contain or form greenhouse gases that are emitted during use
CO2, CH4, N2O, HFCs, PFCs, SF6, refrigeration and air-conditioning equipment, industrial gases, fire extinguishers, fertilizers
Indirect use-phase emissions (optional)
Products that indirectly consume energy (fuels or electricity) during use
Apparel (requires washing and drying), food (re-quires cooking and refrigeration), pots and pans (require heating), and soaps and detergents (require heated water)
Source: Table 5.8 from the Scope 3 Standard.
Calculating emissions from category 11 typically requires product design specifications and assumptions about how
consumers use products (e.g., use profiles, assumed product lifetimes). Companies are required to report a description
of the methodologies and assumptions used to calculate emissions (see chapter 11 of the Scope 3 Standard).
Where relevant, companies should report additional information on product performance when reporting scope
3 emissions to provide additional transparency on steps companies are taking to reduce GHG emissions from sold
products. Such information may include GHG intensity metrics, energy intensity metrics, and annual emissions from the
use of sold products (see section 11.3 of the Scope 3 Standard). See section 9.3 of the Scope 3 Standard for guidance on
recalculating base year emissions when methodologies or assumptions related to category 11 change over time.
Any claims of avoided emissions related to a company’s sold products must be reported separately from the company’s
scope 1, scope 2, and scope 3 inventories. (For more information, see section 9.5 of the Scope 3 Standard)
Box [11.1] Example of reporting product lifetime emissions
An automaker sells 1 million cars in 2010. Each car has an expected lifetime of 10 years. The company reports the
anticipated use-phase emissions of the 1 million cars it sold in 2010 over their 10-year expected lifetime. The company
also reports corporate average fuel economy (km per liter) and corporate average emissions (kg CO2e/km) as relevant
emissions-intensity metrics.
Source: Box 5.7 from the Scope 3 Standard.
Technical Guidance for Calculating Scope 3 Emissions [115]
CATEGORY 11 Use of Sold Products
Box [11.2] Product lifetime and durability
Because the scope 3 inventory accounts for total lifetime emissions of sold products, companies that produce more
durable products with longer lifetimes could appear to be penalized because, as product lifetimes increase, scope
3 emissions increase, assuming all else is constant. To reduce the potential for emissions data to be misinterpreted,
companies should also report relevant information such as product lifetimes and emissions intensity metrics to
demonstrate product performance over time. Relevant emissions intensity metrics may include annual emissions
per product, energy efficiency per product, emissions per hour of use, emissions per kilometer driven, emissions per
functional unit, etc.
Source: Box 5.8 from the Scope 3 Standard.
This section provides guidance of the following:
• What should be included in the emissions from use of sold products
• Guidance on what to include in a use profile
• Reporting guidance
• Guidance on how to assess uncertainty on the product’s use profile.
Calculating emissions from use of sold productsThis guidance provides calculation methods to calculate a company’s:
• Direct use-phase emissions
• Indirect use-phase emissions.
Calculation methods for direct use-phase emissionsCompanies should first determine in which categories their products belong. The following products have direct-use
phase emissions:
• Products that directly consume energy (fuels or electricity) during use: involves breaking down the use phase,
measuring emissions per product, and aggregating emissions
• Fuels and feedstocks: involves collecting fuel use data and multiplying them by representative fuel emission
factors
• Greenhouse gases and products that contain or form greenhouse gases that are emitted during use: involves
collecting data on the GHG contained in the product and multiplying them by the percent of GHGs released and GHG
emission factors.
If a company sells a large selection of products, or if the use phase of multiple products is similar, it may choose to
group similar products and use average statistics for a typical product in the product group. For example, a fast-moving
consumer goods company selling carbonated drinks may decide to group products by packaging types and treat all
products within that group with the same use profile.
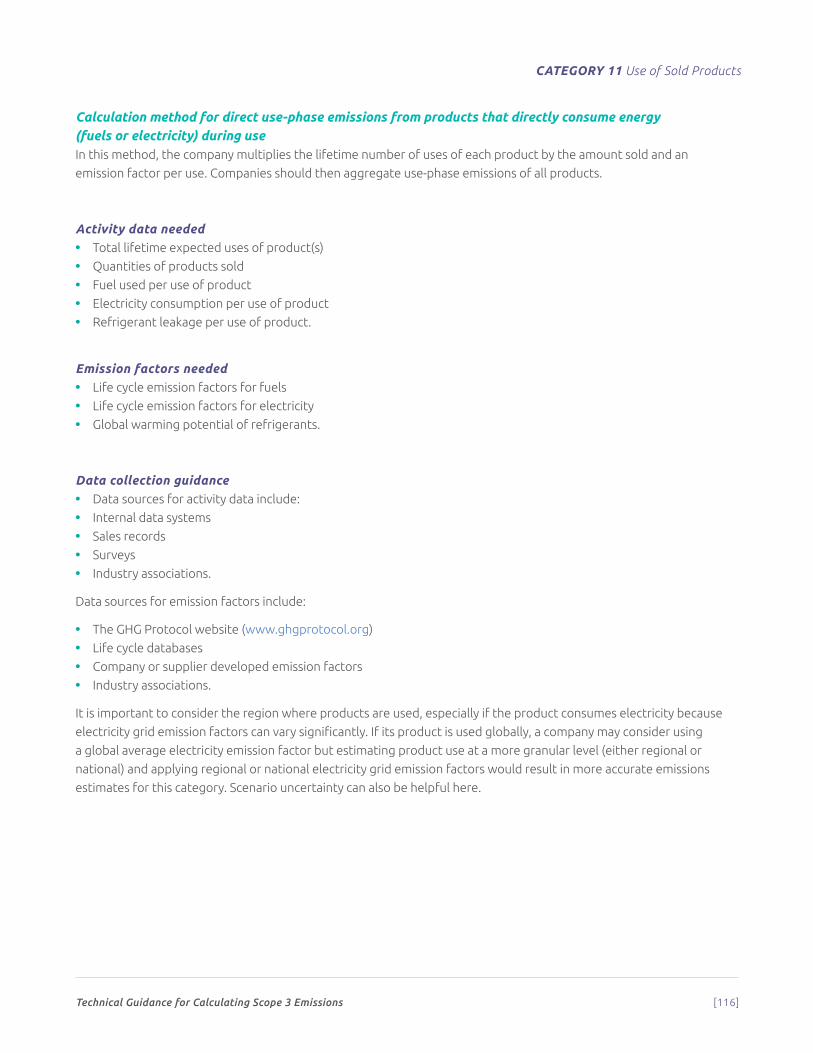
Technical Guidance for Calculating Scope 3 Emissions [116]
CATEGORY 11 Use of Sold Products
Calculation method for direct use-phase emissions from products that directly consume energy (fuels or electricity) during useIn this method, the company multiplies the lifetime number of uses of each product by the amount sold and an
emission factor per use. Companies should then aggregate use-phase emissions of all products.
Activity data needed • Total lifetime expected uses of product(s)
• Quantities of products sold
• Fuel used per use of product
• Electricity consumption per use of product
• Refrigerant leakage per use of product.
Emission factors needed • Life cycle emission factors for fuels
• Life cycle emission factors for electricity
• Global warming potential of refrigerants.
Data collection guidance • Data sources for activity data include:
• Internal data systems
• Sales records
• Surveys
• Industry associations.
Data sources for emission factors include:
• The GHG Protocol website (www.ghgprotocol.org)
• Life cycle databases
• Company or supplier developed emission factors
• Industry associations.
It is important to consider the region where products are used, especially if the product consumes electricity because
electricity grid emission factors can vary significantly. If its product is used globally, a company may consider using
a global average electricity emission factor but estimating product use at a more granular level (either regional or
national) and applying regional or national electricity grid emission factors would result in more accurate emissions
estimates for this category. Scenario uncertainty can also be helpful here.
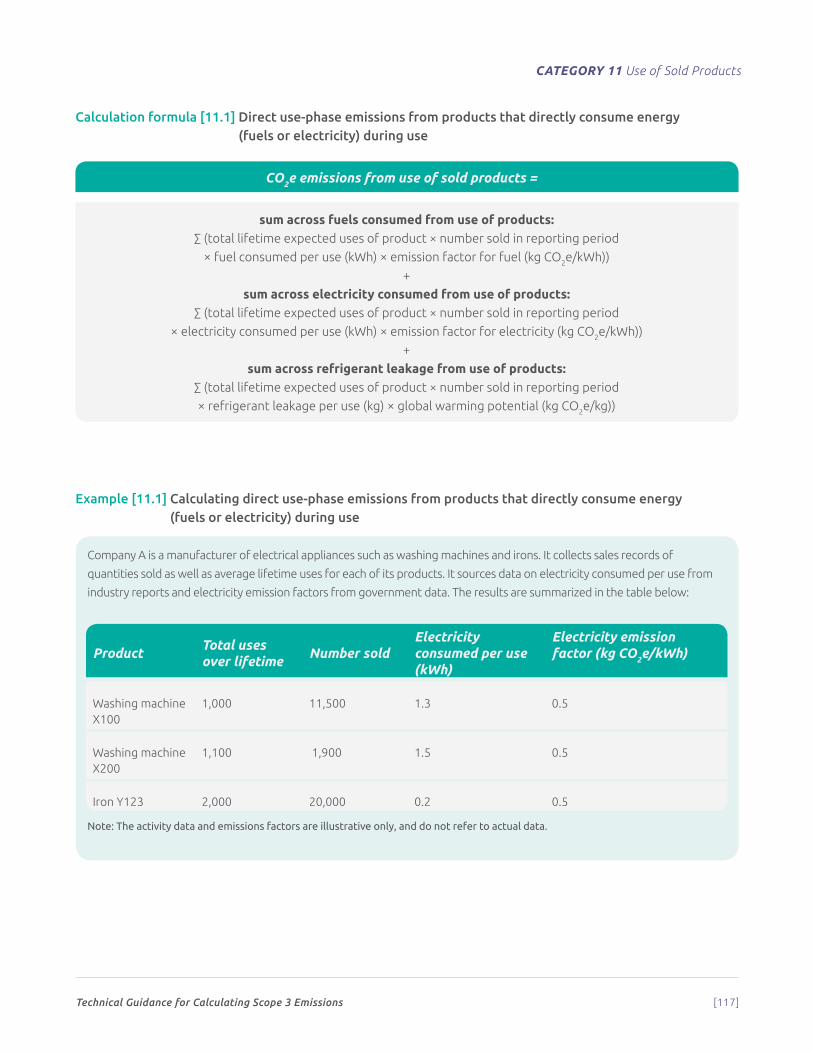
Technical Guidance for Calculating Scope 3 Emissions [117]
CATEGORY 11 Use of Sold Products
Calculation formula [11.1] Direct use-phase emissions from products that directly consume energy (fuels or electricity) during use
CO2e emissions from use of sold products =
sum across fuels consumed from use of products:∑ (total lifetime expected uses of product × number sold in reporting period
× fuel consumed per use (kWh) × emission factor for fuel (kg CO2e/kWh))
+
sum across electricity consumed from use of products:∑ (total lifetime expected uses of product × number sold in reporting period
× electricity consumed per use (kWh) × emission factor for electricity (kg CO2e/kWh))
+
sum across refrigerant leakage from use of products:∑ (total lifetime expected uses of product × number sold in reporting period
× refrigerant leakage per use (kg) × global warming potential (kg CO2e/kg))
Example [11.1] Calculating direct use-phase emissions from products that directly consume energy (fuels or electricity) during use
Company A is a manufacturer of electrical appliances such as washing machines and irons. It collects sales records of
quantities sold as well as average lifetime uses for each of its products. It sources data on electricity consumed per use from
industry reports and electricity emission factors from government data. The results are summarized in the table below:
ProductTotal uses over lifetime
Number soldElectricity consumed per use (kWh)
Electricity emission factor (kg CO2e/kWh)
Washing machine X100
1,000 11,500 1.3 0.5
Washing machine X200
1,100 1,900 1.5 0.5
Iron Y123 2,000 20,000 0.2 0.5
Note: The activity data and emissions factors are illustrative only, and do not refer to actual data.

Technical Guidance for Calculating Scope 3 Emissions [118]
CATEGORY 11 Use of Sold Products
Emissions for each product are calculated using the following formula:
∑ (total lifetime expected uses of product × number sold in reporting period
× electricity consumed per use (kWh) × emission factor for electricity (kg CO2e/kWh))
Washing machine X100:= 1,000 × 11,500 × 1.3 × 0.5 = 7,475,000 kg CO2e
Washing machine X200:= 1,100 × 1,900 × 1.5 × 0.5 = 1,567,500 kg CO2e
Iron Y123:= 2,000 × 20,000 × 0.2 × 0.5 = 4,000,000 kg CO2e
total emissions from use of sold products= emissions from X100 + emissions from X200 + emissions from Y123
= 7,475,000 + 1,567,500 + 4,000,000 = 13,042,500 kg CO2e
Calculation method for direct use-phase emissions from fuels and feedstocksFeedstock refers to starting materials that are used to make fuels, power and/or products. These may include biomass
for producing power, crops for producing biofuels, or crude oil for producing plastic products. If the reporting company
is a producer of fuels and/or feedstocks, the use-phase emissions are calculated by multiplying the quantities of fuels/
feedstocks by the combustion emission factors for the fuels/feedstocks. If the feedstock is not combusted during the
use phase, no emissions should be calculated.
Note that only the combustion emissions should be reported in this category, not the upstream emissions associated with
the feedstock/fuel. This method avoids double counting as the upstream emissions associated with the production of the
feedstock/fuel were already included in the reporting company’s scope 1 and scope 2, as well as other scope 3 categories.
Activity data needed • Total quantities of fuels/feedstocks sold.
Emission factors needed • Combustion emission factors of fuel/feedstock.
Example [11.1] Calculating direct use-phase emissions from products that directly consume energy (fuels or electricity) during use (continued)
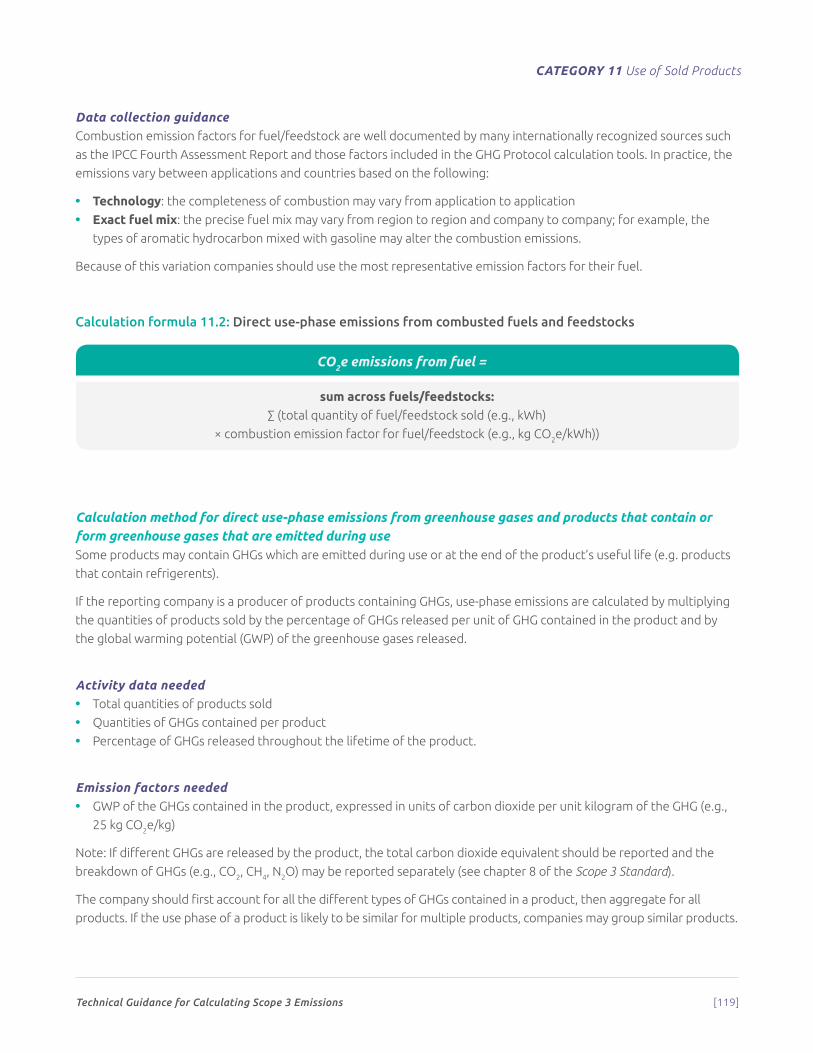
Technical Guidance for Calculating Scope 3 Emissions [119]
CATEGORY 11 Use of Sold Products
Data collection guidanceCombustion emission factors for fuel/feedstock are well documented by many internationally recognized sources such
as the IPCC Fourth Assessment Report and those factors included in the GHG Protocol calculation tools. In practice, the
emissions vary between applications and countries based on the following:
• Technology: the completeness of combustion may vary from application to application
• Exact fuel mix: the precise fuel mix may vary from region to region and company to company; for example, the
types of aromatic hydrocarbon mixed with gasoline may alter the combustion emissions.
Because of this variation companies should use the most representative emission factors for their fuel.
Calculation formula 11.2: Direct use-phase emissions from combusted fuels and feedstocks
CO2e emissions from fuel =
sum across fuels/feedstocks:∑ (total quantity of fuel/feedstock sold (e.g., kWh)
× combustion emission factor for fuel/feedstock (e.g., kg CO2e/kWh))
Calculation method for direct use-phase emissions from greenhouse gases and products that contain or form greenhouse gases that are emitted during useSome products may contain GHGs which are emitted during use or at the end of the product’s useful life (e.g. products
that contain refrigerents).
If the reporting company is a producer of products containing GHGs, use-phase emissions are calculated by multiplying
the quantities of products sold by the percentage of GHGs released per unit of GHG contained in the product and by
the global warming potential (GWP) of the greenhouse gases released.
Activity data needed • Total quantities of products sold
• Quantities of GHGs contained per product
• Percentage of GHGs released throughout the lifetime of the product.
Emission factors needed • GWP of the GHGs contained in the product, expressed in units of carbon dioxide per unit kilogram of the GHG (e.g.,
25 kg CO2e/kg)
Note: If different GHGs are released by the product, the total carbon dioxide equivalent should be reported and the
breakdown of GHGs (e.g., CO2, CH4, N2O) may be reported separately (see chapter 8 of the Scope 3 Standard).
The company should first account for all the different types of GHGs contained in a product, then aggregate for all
products. If the use phase of a product is likely to be similar for multiple products, companies may group similar products.
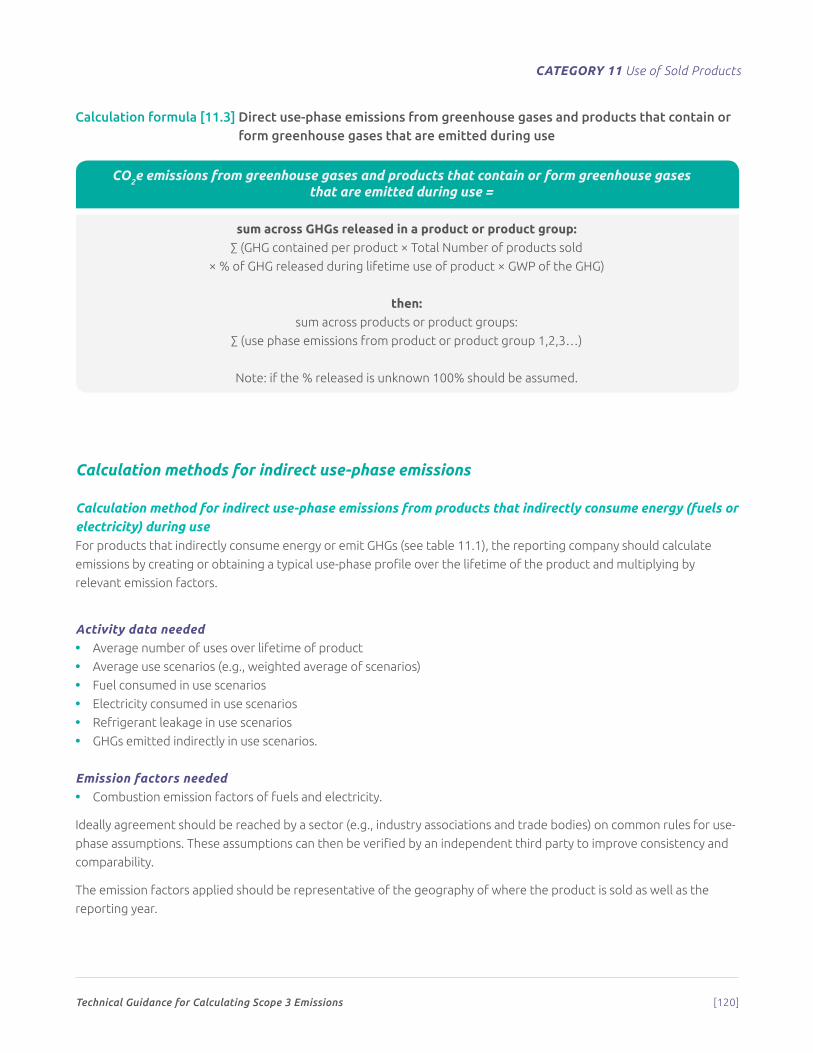
Technical Guidance for Calculating Scope 3 Emissions [120]
CATEGORY 11 Use of Sold Products
Calculation formula [11.3] Direct use-phase emissions from greenhouse gases and products that contain or form greenhouse gases that are emitted during use
CO2e emissions from greenhouse gases and products that contain or form greenhouse gases that are emitted during use =
sum across GHGs released in a product or product group:∑ (GHG contained per product × Total Number of products sold
× % of GHG released during lifetime use of product × GWP of the GHG)
then:sum across products or product groups:
∑ (use phase emissions from product or product group 1,2,3…)
Note: if the % released is unknown 100% should be assumed.
Calculation methods for indirect use-phase emissions
Calculation method for indirect use-phase emissions from products that indirectly consume energy (fuels or electricity) during useFor products that indirectly consume energy or emit GHGs (see table 11.1), the reporting company should calculate
emissions by creating or obtaining a typical use-phase profile over the lifetime of the product and multiplying by
relevant emission factors.
Activity data needed • Average number of uses over lifetime of product
• Average use scenarios (e.g., weighted average of scenarios)
• Fuel consumed in use scenarios
• Electricity consumed in use scenarios
• Refrigerant leakage in use scenarios
• GHGs emitted indirectly in use scenarios.
Emission factors needed • Combustion emission factors of fuels and electricity.
Ideally agreement should be reached by a sector (e.g., industry associations and trade bodies) on common rules for use-
phase assumptions. These assumptions can then be verified by an independent third party to improve consistency and
comparability.
The emission factors applied should be representative of the geography of where the product is sold as well as the
reporting year.
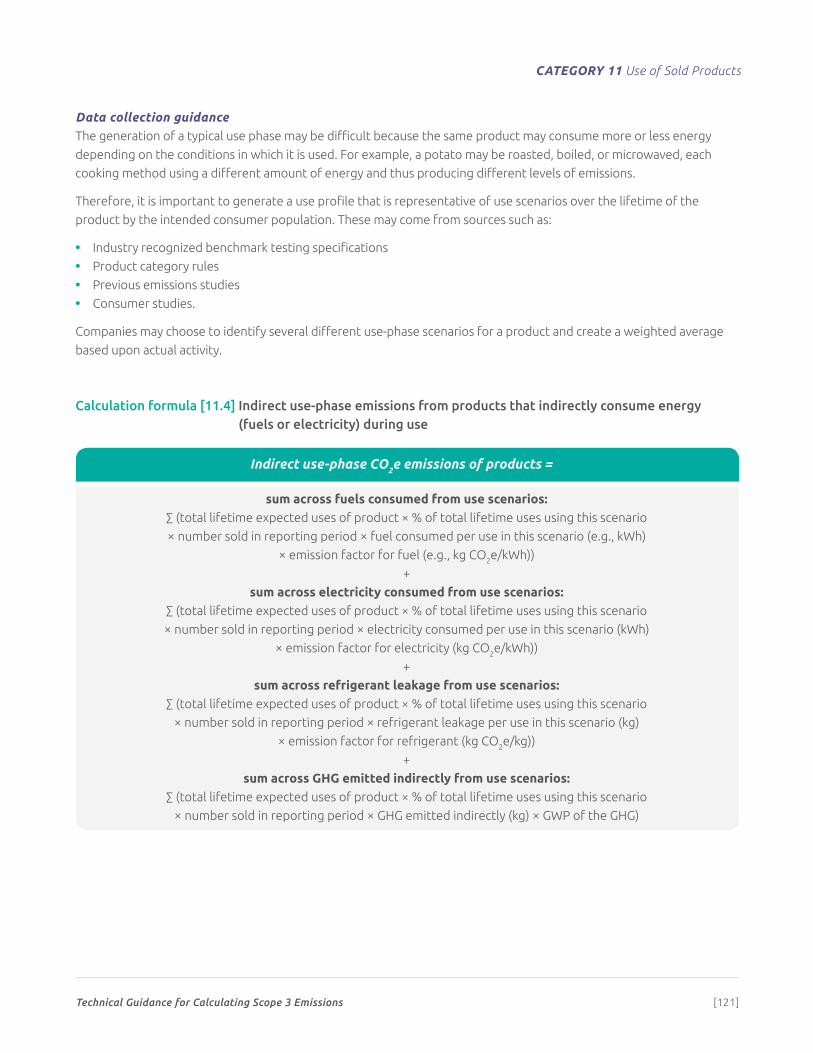
Technical Guidance for Calculating Scope 3 Emissions [121]
CATEGORY 11 Use of Sold Products
Data collection guidanceThe generation of a typical use phase may be difficult because the same product may consume more or less energy
depending on the conditions in which it is used. For example, a potato may be roasted, boiled, or microwaved, each
cooking method using a different amount of energy and thus producing different levels of emissions.
Therefore, it is important to generate a use profile that is representative of use scenarios over the lifetime of the
product by the intended consumer population. These may come from sources such as:
• Industry recognized benchmark testing specifications
• Product category rules
• Previous emissions studies
• Consumer studies.
Companies may choose to identify several different use-phase scenarios for a product and create a weighted average
based upon actual activity.
Calculation formula [11.4] Indirect use-phase emissions from products that indirectly consume energy (fuels or electricity) during use
Indirect use-phase CO2e emissions of products =
sum across fuels consumed from use scenarios:∑ (total lifetime expected uses of product × % of total lifetime uses using this scenario
× number sold in reporting period × fuel consumed per use in this scenario (e.g., kWh)
× emission factor for fuel (e.g., kg CO2e/kWh))
+
sum across electricity consumed from use scenarios:∑ (total lifetime expected uses of product × % of total lifetime uses using this scenario
× number sold in reporting period × electricity consumed per use in this scenario (kWh)
× emission factor for electricity (kg CO2e/kWh))
+
sum across refrigerant leakage from use scenarios:∑ (total lifetime expected uses of product × % of total lifetime uses using this scenario
× number sold in reporting period × refrigerant leakage per use in this scenario (kg)
× emission factor for refrigerant (kg CO2e/kg))
+
sum across GHG emitted indirectly from use scenarios:∑ (total lifetime expected uses of product × % of total lifetime uses using this scenario
× number sold in reporting period × GHG emitted indirectly (kg) × GWP of the GHG)
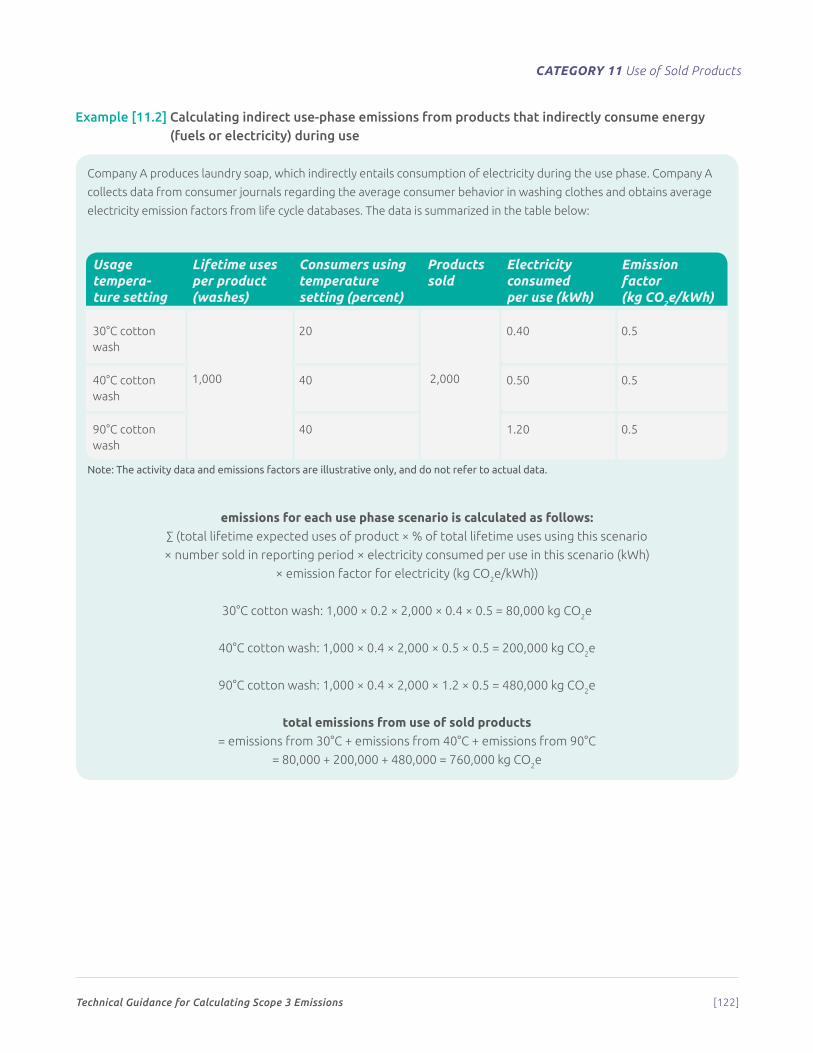
Technical Guidance for Calculating Scope 3 Emissions [122]
CATEGORY 11 Use of Sold Products
Example [11.2] Calculating indirect use-phase emissions from products that indirectly consume energy (fuels or electricity) during use
Company A produces laundry soap, which indirectly entails consumption of electricity during the use phase. Company A
collects data from consumer journals regarding the average consumer behavior in washing clothes and obtains average
electricity emission factors from life cycle databases. The data is summarized in the table below:
Usage tempera-ture setting
Lifetime uses per product (washes)
Consumers using temperature setting (percent)
Products sold
Electricity consumed per use (kWh)
Emission factor (kg CO2e/kWh)
30°C cotton wash
1,000
20
2,000
0.40 0.5
40°C cotton wash
40 0.50 0.5
90°C cotton wash
40 1.20 0.5
Note: The activity data and emissions factors are illustrative only, and do not refer to actual data.
emissions for each use phase scenario is calculated as follows:∑ (total lifetime expected uses of product × % of total lifetime uses using this scenario
× number sold in reporting period × electricity consumed per use in this scenario (kWh)
× emission factor for electricity (kg CO2e/kWh))
30°C cotton wash: 1,000 × 0.2 × 2,000 × 0.4 × 0.5 = 80,000 kg CO2e
40°C cotton wash: 1,000 × 0.4 × 2,000 × 0.5 × 0.5 = 200,000 kg CO2e
90°C cotton wash: 1,000 × 0.4 × 2,000 × 1.2 × 0.5 = 480,000 kg CO2e
total emissions from use of sold products= emissions from 30°C + emissions from 40°C + emissions from 90°C
= 80,000 + 200,000 + 480,000 = 760,000 kg CO2e
Technical Guidance for Calculating Scope 3 Emissions [123]
CATEGORY 11 Use of Sold Products
Calculation method for sold intermediate productsWhen a company sells an intermediate product that directly emits GHGs in its use phase, it is required to account for
direct use-phase emissions of the intermediate product by the end user, (i.e., emissions resulting from: the use of the
sold intermediate product that directly consumes fuel or electricity during use; fuels and feedstocks; GHGs released
during product use). Companies may optionally include the indirect use-phase emissions of sold intermediate products.
In certain cases, the eventual end use of sold intermediate products may be unknown. For example, a company
may produce an intermediate product with many potential downstream applications, each of which has a different
GHG emissions profile and be unable to reasonably estimate the downstream emissions associated with the various
possible end uses. In such a case, companies may disclose and justify the exclusion of all downstream emissions
related to sold intermediate products. For more information, see section 6.4 of the Scope 3 Standard (Accounting for
downstream emissions).
Activity data needed • Type(s) of final product(s) produced from reporting company’s intermediate product(s)
• Percentage of reporting company’s intermediate product sales going to each type of final product
• Activity data required to calculate the use-phase emission of the final product will be the same as described
previously in this chapter.
Emission factors needed • Depending on the type of final product, emission factors required will be the same as described earlier in
this chapter.
Calculation formula [11.5] Use-phase emissions from sold intermediate products
Use-phase CO2e emissions of sold intermediate products =
sum across sold intermediate products total use phase emissions:∑ (total intermediate products sold × total lifetime uses of final sold product
× emissions per use of sold intermediate product (kg CO2e/use))
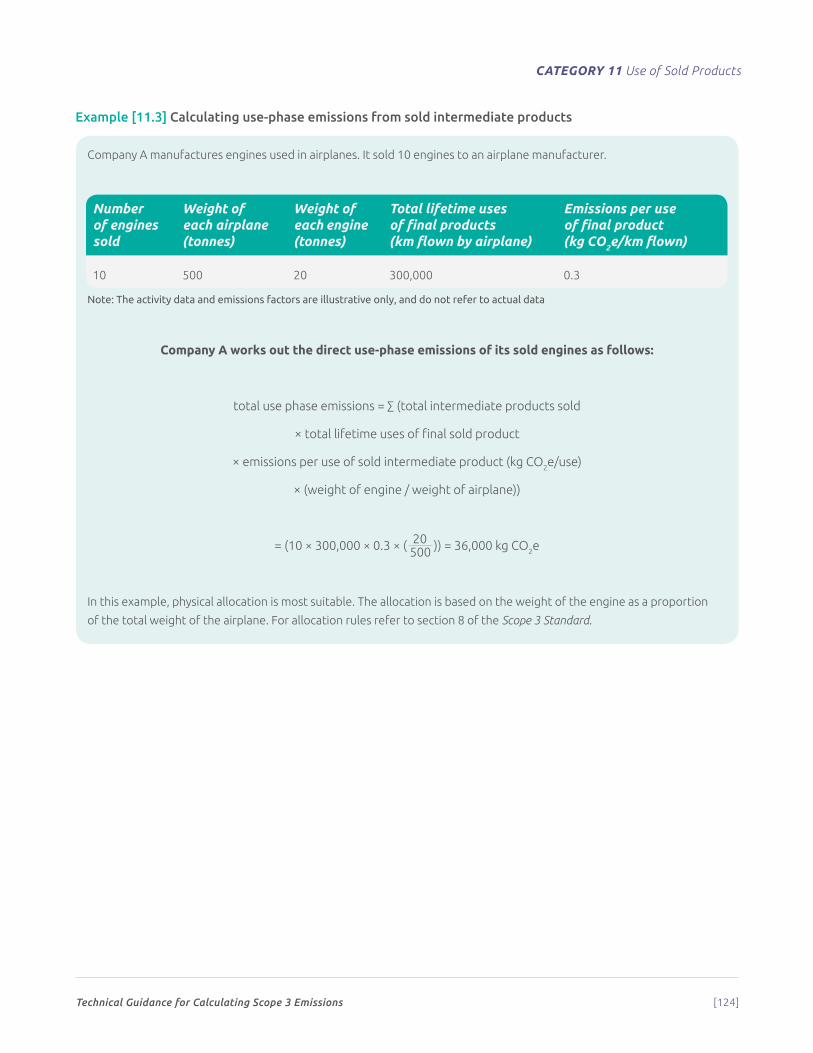
Technical Guidance for Calculating Scope 3 Emissions [124]
CATEGORY 11 Use of Sold Products
Example [11.3] Calculating use-phase emissions from sold intermediate products
Company A manufactures engines used in airplanes. It sold 10 engines to an airplane manufacturer.
Number of engines sold
Weight of each airplane (tonnes)
Weight of each engine (tonnes)
Total lifetime uses of final products (km flown by airplane)
Emissions per use of final product (kg CO2e/km flown)
10 500 20 300,000 0.3
Note: The activity data and emissions factors are illustrative only, and do not refer to actual data
Company A works out the direct use-phase emissions of its sold engines as follows:
total use phase emissions = ∑ (total intermediate products sold
× total lifetime uses of final sold product
× emissions per use of sold intermediate product (kg CO2e/use)
× (weight of engine / weight of airplane))
= (10 × 300,000 × 0.3 × ( 500 )) = 36,000 kg CO2e
In this example, physical allocation is most suitable. The allocation is based on the weight of the engine as a proportion
of the total weight of the airplane. For allocation rules refer to section 8 of the Scope 3 Standard.
20
Technical Guidance for Calculating Scope 3 Emissions [125]
12
Category 12: End-of-Life Treatment of Sold ProductsCategory description
C ategory 12 includes emissions from the waste disposal and treatment of products
sold by the reporting company (in the reporting year) at the end of their life. This
category includes the total expected end-of-life emissions from all products sold in
the reporting year. (See section 5.4 of the Scope 3 Standard for more information on the time
boundary of scope 3 categories.)
End-of-life treatment methods (e.g., landfilling, incineration, and recycling) are described in category 5 (Waste
generated in operations) and apply to both category 5 and category 12. Calculating emissions from category 12
requires assumptions about the end-of-life treatment methods used by consumers. Companies are required to report a
description of the methodologies and assumptions used to calculate emissions (see chapter 11 of the Scope 3 Standard).
For sold intermediate products, companies should account for the emissions from disposing of the intermediate
product at the end of its life, not the final product.
Technical Guidance for Calculating Scope 3 Emissions [126]
CATEGORY 12 End-of-Life Treatment of Sold Products
Calculating emissions from end-of-life treatment of sold productsThe emissions from downstream end-of-life treatment of sold products should follow the calculation methods in
category 5 (Waste generated in operations), with the difference that instead of collecting data on total mass of waste
generated in operations, companies should collect data on total mass of sold products (and packaging) from the point
of sale by the reporting company through the end of life after use by consumers.
The major difference between calculating upstream and downstream emissions of waste treatment is likely to be the
availability and quality of waste activity data. Whereas the reporting company is likely have specific waste type and
waste treatment data from its own operations, this information is likely to be more difficult to obtain for sold products.
Although the reporting company may know the product’s components, it may not know how the waste-disposal
behavior of consumers and retailers varies across geographic regions.
If the reporting company sells intermediate products, it is required to account for emissions from disposing of the sold
intermediate products at the end of their life.
Activity data neededCompanies should collect:
• Total mass of sold products and packaging from the point of sale by the reporting company to the end-of-life after
consumer use (e.g., packaging used to transport products through to the point of retail and any packaging that is
disposed of prior to the end-of-life of the final product
• Proportion of this waste being treated by different methods (e.g., percent landfilled, incinerated, recycled).
Emission factors neededCompanies should collect:
• Average waste-treatment specific-emission factors based on all waste treatment types.
Data collection guidance
When collecting data on total waste produced, the reporting company should collect data on the waste type(s) and
amounts after it sells the products through to the end-of-life disposal by consumers. This data should include any
packaging and product waste. For food and drink items, companies should refer to average proportion of food/drinks
wasted. In many cases, total waste will be equal to the total products sold in reporting year. However, if the product
is actually consumed (e.g., food and drink) the total waste is likely to be lower, and in other cases, such as products
combusted to generate energy, could even be zero.
When collecting data on the proportion of waste treated by different methods, companies may refer to:
• Company’s own research and internal data on how its products are treated after consumption
• Specific government directives on waste treatment of certain products (e.g., the European Union’s “Waste Electrical
and Electronic Equipment Directive”)
• Industry associations or organizations that have conducted research into consumer disposal patterns of specific products
• Average data on waste treatment from the point that the products are sold by the reporting company through to
the end of life after consumer use.
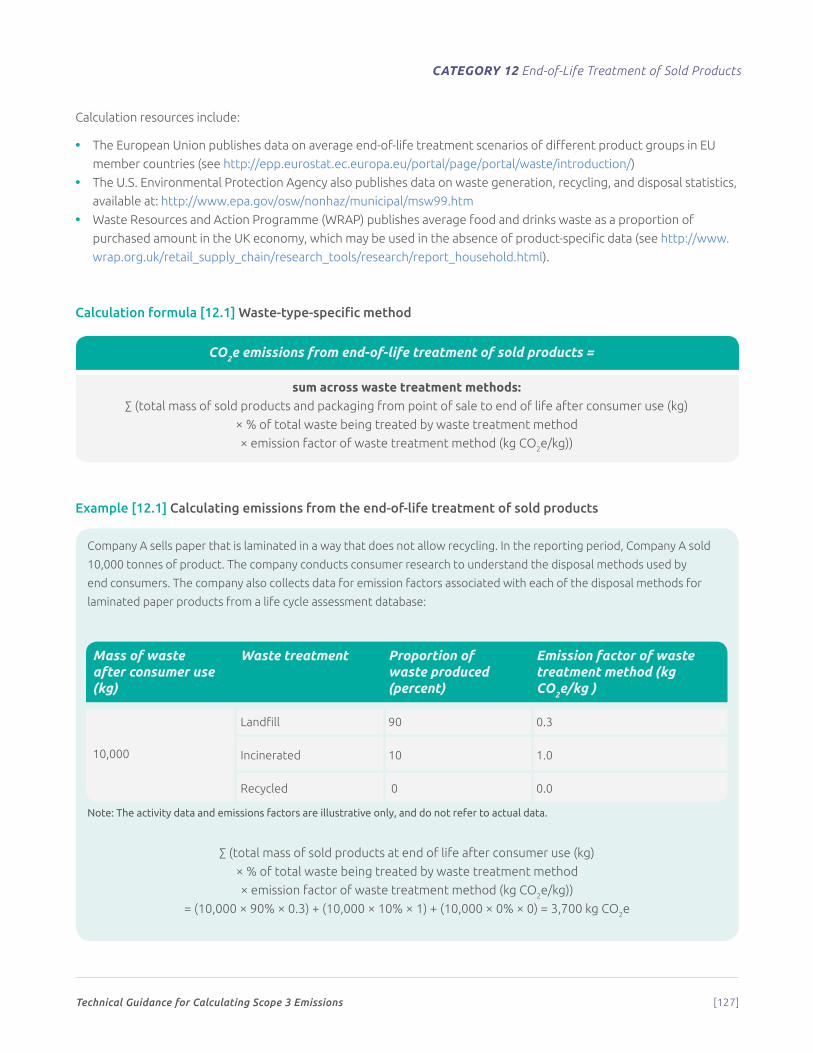
Technical Guidance for Calculating Scope 3 Emissions [127]
CATEGORY 12 End-of-Life Treatment of Sold Products
Calculation resources include:
• The European Union publishes data on average end-of-life treatment scenarios of different product groups in EU
member countries (see http://epp.eurostat.ec.europa.eu/portal/page/portal/waste/introduction/)
• The U.S. Environmental Protection Agency also publishes data on waste generation, recycling, and disposal statistics,
available at: http://www.epa.gov/osw/nonhaz/municipal/msw99.htm
• Waste Resources and Action Programme (WRAP) publishes average food and drinks waste as a proportion of
purchased amount in the UK economy, which may be used in the absence of product-specific data (see http://www.
wrap.org.uk/retail_supply_chain/research_tools/research/report_household.html).
Calculation formula [12.1] Waste-type-specific method
CO2e emissions from end-of-life treatment of sold products =
sum across waste treatment methods:∑ (total mass of sold products and packaging from point of sale to end of life after consumer use (kg)
× % of total waste being treated by waste treatment method
× emission factor of waste treatment method (kg CO2e/kg))
Example [12.1] Calculating emissions from the end-of-life treatment of sold products
Company A sells paper that is laminated in a way that does not allow recycling. In the reporting period, Company A sold
10,000 tonnes of product. The company conducts consumer research to understand the disposal methods used by
end consumers. The company also collects data for emission factors associated with each of the disposal methods for
laminated paper products from a life cycle assessment database:
Mass of waste after consumer use (kg)
Waste treatment Proportion of waste produced (percent)
Emission factor of waste treatment method (kg CO2e/kg )
10,000
Landfill 90 0.3
Incinerated 10 1.0
Recycled 0 0.0
Note: The activity data and emissions factors are illustrative only, and do not refer to actual data.
∑ (total mass of sold products at end of life after consumer use (kg)
× % of total waste being treated by waste treatment method
× emission factor of waste treatment method (kg CO2e/kg))
= (10,000 × 90% × 0.3) + (10,000 × 10% × 1) + (10,000 × 0% × 0) = 3,700 kg CO2e
Technical Guidance for Calculating Scope 3 Emissions [128]
13
Category 13: Downstream Leased Assets
Category description
T his category includes emissions from the operation of assets that are owned by the
reporting company (acting as lessor) and leased to other entities in the reporting
year that are not already included in scope 1 or scope 2. This category is applicable to
lessors (i.e., companies that receive payments from lessees). Companies that operate leased
assets (i.e., lessees) should refer to category 8 (Upstream leased assets).
Leased assets may be included in a company’s scope 1 or scope 2 inventory depending on the type of lease and the
consolidation approach the company uses to define its organizational boundaries. (See section 5.2 of the Scope 3
Standard for more information.) If the reporting company leases an asset for only part of the reporting year, the
reporting company should account for emissions from the portion of the year that the asset was leased. See Appendix
A of the Scope 3 Standard for more information on accounting for emissions from leased assets.
In some cases, companies may not find value in distinguishing between products sold to customers (accounted for in
category 11) and products leased to customers (accounted for in category 13). A company may account for products
leased to customers in the same way it accounts for products sold to customers (i.e., by accounting for the total
expected lifetime emissions from all relevant products leased to other entities in the reporting year). Companies should
report emissions from leased products in category 11 (Use of sold products), rather than category 13 (Downstream
leased assets) and avoid double counting between categories.
A reporting company’s scope 3 emissions from downstream leased assets include the scope 1 and scope 2 emissions of
lessees (depending on the lessee’s consolidation approach).
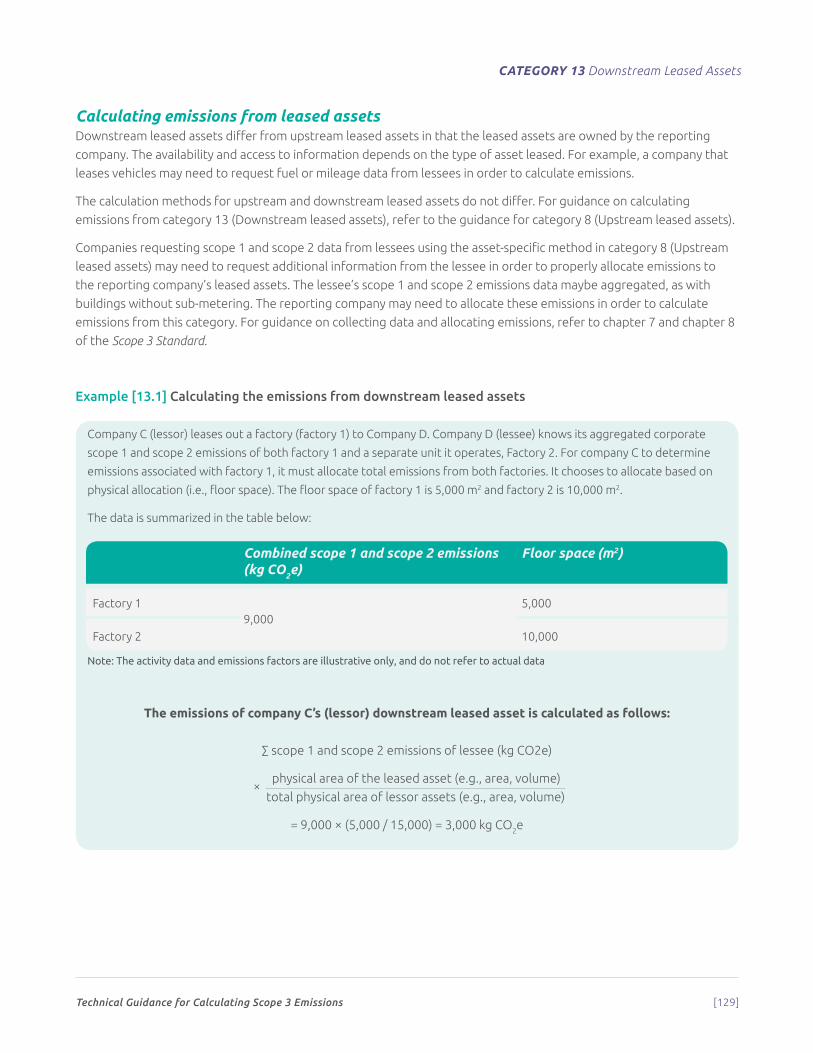
Technical Guidance for Calculating Scope 3 Emissions [129]
CATEGORY 13 Downstream Leased Assets
Calculating emissions from leased assetsDownstream leased assets differ from upstream leased assets in that the leased assets are owned by the reporting
company. The availability and access to information depends on the type of asset leased. For example, a company that
leases vehicles may need to request fuel or mileage data from lessees in order to calculate emissions.
The calculation methods for upstream and downstream leased assets do not differ. For guidance on calculating
emissions from category 13 (Downstream leased assets), refer to the guidance for category 8 (Upstream leased assets).
Companies requesting scope 1 and scope 2 data from lessees using the asset-specific method in category 8 (Upstream
leased assets) may need to request additional information from the lessee in order to properly allocate emissions to
the reporting company’s leased assets. The lessee’s scope 1 and scope 2 emissions data maybe aggregated, as with
buildings without sub-metering. The reporting company may need to allocate these emissions in order to calculate
emissions from this category. For guidance on collecting data and allocating emissions, refer to chapter 7 and chapter 8
of the Scope 3 Standard.
Example [13.1] Calculating the emissions from downstream leased assets
Company C (lessor) leases out a factory (factory 1) to Company D. Company D (lessee) knows its aggregated corporate
scope 1 and scope 2 emissions of both factory 1 and a separate unit it operates, Factory 2. For company C to determine
emissions associated with factory 1, it must allocate total emissions from both factories. It chooses to allocate based on
physical allocation (i.e., floor space). The floor space of factory 1 is 5,000 m2 and factory 2 is 10,000 m2.
The data is summarized in the table below:
Combined scope 1 and scope 2 emissions (kg CO2e)
Floor space (m2)
Factory 19,000
5,000
Factory 2 10,000
Note: The activity data and emissions factors are illustrative only, and do not refer to actual data
The emissions of company C’s (lessor) downstream leased asset is calculated as follows:
∑ scope 1 and scope 2 emissions of lessee (kg CO2e)
× physical area of the leased asset (e.g., area, volume)
total physical area of lessor assets (e.g., area, volume)
= 9,000 × (5,000 / 15,000) = 3,000 kg CO2e
Technical Guidance for Calculating Scope 3 Emissions [130]
14
Category 14: FranchisesCategory description
C ategory 14 includes emissions from the operation of franchises not included in scope
1 or scope 2. A franchise is a business operating under a license to sell or distribute
another company’s goods or services within a certain location. This category is
applicable to franchisors (i.e., companies that grant licenses to other entities to sell or distribute
its goods or services in return for payments, such as royalties for the use of trademarks and
other services). Franchisors should account for emissions that occur from the operation of
franchises (i.e., the scope 1 and scope 2 emissions of franchisees) in this category.
Franchisees (i.e., companies that operate franchises and pay fees to a franchisor) should include emissions from
operations under their control in this category if they have not included those emissions in scope 1 and scope 2 due to
their choice of consolidation approach. Franchisees may optionally report upstream scope 3 emissions associated with
the franchisor’s operations (i.e., the scope 1 and scope 2 emissions of the franchisor) in category 1 (Purchased goods
and services).
Calculating emissions from franchisesCompanies may use either of two methods to calculate emissions from franchises:
• Franchise-specific method, which involves collecting site-specific activity data or scope 1 and scope 2 emissions
data from franchisees
• Average-data method, which involves estimating emissions for each franchise, or groups of franchises, based on
average statistics, such as average emissions per franchise type or floor space.
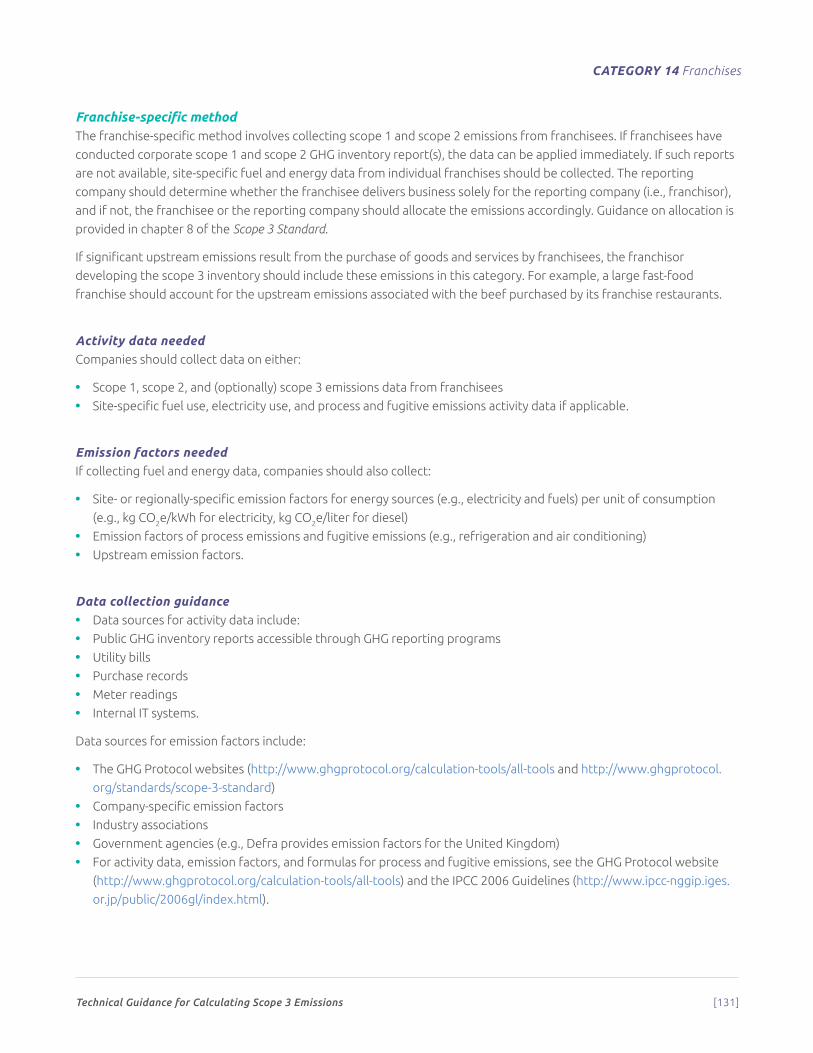
Technical Guidance for Calculating Scope 3 Emissions [131]
CATEGORY 14 Franchises
Franchise-specific method The franchise-specific method involves collecting scope 1 and scope 2 emissions from franchisees. If franchisees have
conducted corporate scope 1 and scope 2 GHG inventory report(s), the data can be applied immediately. If such reports
are not available, site-specific fuel and energy data from individual franchises should be collected. The reporting
company should determine whether the franchisee delivers business solely for the reporting company (i.e., franchisor),
and if not, the franchisee or the reporting company should allocate the emissions accordingly. Guidance on allocation is
provided in chapter 8 of the Scope 3 Standard.
If significant upstream emissions result from the purchase of goods and services by franchisees, the franchisor
developing the scope 3 inventory should include these emissions in this category. For example, a large fast-food
franchise should account for the upstream emissions associated with the beef purchased by its franchise restaurants.
Activity data neededCompanies should collect data on either:
• Scope 1, scope 2, and (optionally) scope 3 emissions data from franchisees
• Site-specific fuel use, electricity use, and process and fugitive emissions activity data if applicable.
Emission factors neededIf collecting fuel and energy data, companies should also collect:
• Site- or regionally-specific emission factors for energy sources (e.g., electricity and fuels) per unit of consumption
(e.g., kg CO2e/kWh for electricity, kg CO2e/liter for diesel)
• Emission factors of process emissions and fugitive emissions (e.g., refrigeration and air conditioning)
• Upstream emission factors.
Data collection guidance • Data sources for activity data include:
• Public GHG inventory reports accessible through GHG reporting programs
• Utility bills
• Purchase records
• Meter readings
• Internal IT systems.
Data sources for emission factors include:
• The GHG Protocol websites (http://www.ghgprotocol.org/calculation-tools/all-tools and http://www.ghgprotocol.
org/standards/scope-3-standard)
• Company-specific emission factors
• Industry associations
• Government agencies (e.g., Defra provides emission factors for the United Kingdom)
• For activity data, emission factors, and formulas for process and fugitive emissions, see the GHG Protocol website
(http://www.ghgprotocol.org/calculation-tools/all-tools) and the IPCC 2006 Guidelines (http://www.ipcc-nggip.iges.
or.jp/public/2006gl/index.html).
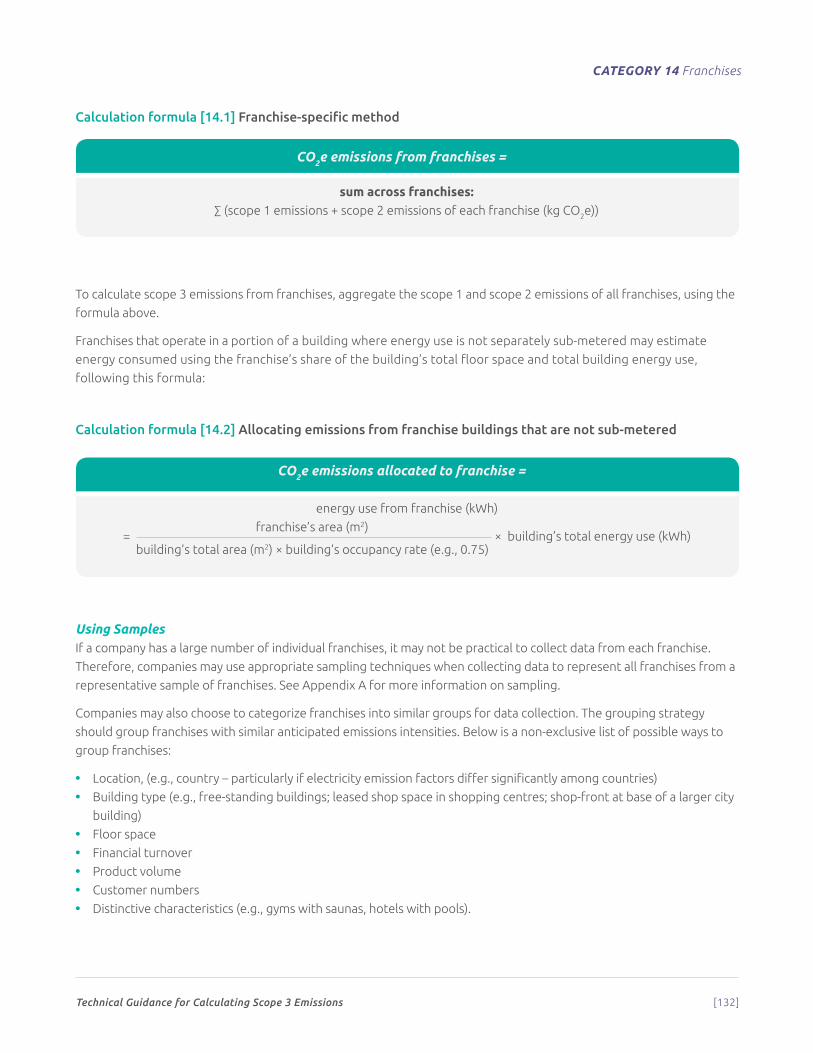
Technical Guidance for Calculating Scope 3 Emissions [132]
CATEGORY 14 Franchises
Calculation formula [14.1] Franchise-specific method
CO2e emissions from franchises =
sum across franchises:∑ (scope 1 emissions + scope 2 emissions of each franchise (kg CO2e))
To calculate scope 3 emissions from franchises, aggregate the scope 1 and scope 2 emissions of all franchises, using the
formula above.
Franchises that operate in a portion of a building where energy use is not separately sub-metered may estimate
energy consumed using the franchise’s share of the building’s total floor space and total building energy use,
following this formula:
Calculation formula [14.2] Allocating emissions from franchise buildings that are not sub-metered
CO2e emissions allocated to franchise =
energy use from franchise (kWh)
= building’s total area (m2) × building’s occupancy rate (e.g., 0.75)
× building’s total energy use (kWh)
Using SamplesIf a company has a large number of individual franchises, it may not be practical to collect data from each franchise.
Therefore, companies may use appropriate sampling techniques when collecting data to represent all franchises from a
representative sample of franchises. See Appendix A for more information on sampling.
Companies may also choose to categorize franchises into similar groups for data collection. The grouping strategy
should group franchises with similar anticipated emissions intensities. Below is a non-exclusive list of possible ways to
group franchises:
• Location, (e.g., country – particularly if electricity emission factors differ significantly among countries)
• Building type (e.g., free-standing buildings; leased shop space in shopping centres; shop-front at base of a larger city
building)
• Floor space
• Financial turnover
• Product volume
• Customer numbers
• Distinctive characteristics (e.g., gyms with saunas, hotels with pools).
franchise’s area (m2)

Technical Guidance for Calculating Scope 3 Emissions [133]
CATEGORY 14 Franchises
Calculation formula [14.3] Extrapolating emissions from sample groups
CO2e emissions from franchises =
Step 1: aggregation of franchise emissions per group:
total emissions from sampled franchises within group
× total number of franchises within group
number of franchises sampled within group
Step 2: aggregation of total franchise emissions across all groups:
∑ total scope 1 and scope 2 emissions from each asset group
Companies that extrapolate from a representative sample within a franchise group should use the formula 14.2
to calculate emissions from sampled franchises within a group, then apply the formula in Step 1 above to estimate
emissions for a franchise group. Companies should then use the formula in Step 2 above to aggregate franchise groups
to the company’s total emissions from franchises.
Example [14.1] Calculating the emissions from franchises using the franchise-specific method
Company A has multiple franchisees that operate restaurants. Company A requests the total scope 1 and scope 2
emissions of each of the franchisees:
Franchisee Scope 1 emissions (kg CO2e) Scope 2 emissions (kg CO2e)
1 100,000 20,000
2 25,000 10,000
3 30,000 10,000
4 90,000 30,000
5 30,000 10,000
Note: emissions are for illustrative purposes only, and do not refer to actual data.
company A can then perform the following calculation:∑ total scope 1 and scope 2 emissions from franchisees (kg CO2e)
= (100,000 + 20,000) + (25,000 + 10,000) + (30,000 + 10,000) + (90,000 + 30,000) + (30,000 + 10,000)
= 355,000 kg CO2e
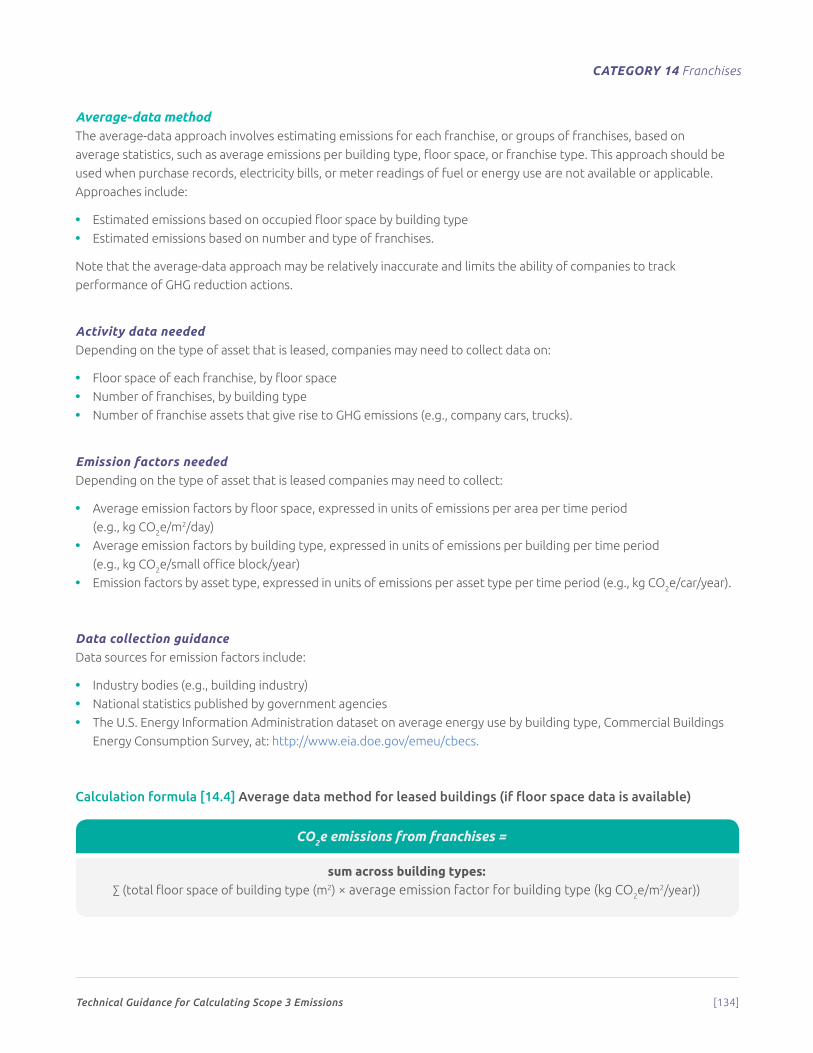
Technical Guidance for Calculating Scope 3 Emissions [134]
CATEGORY 14 Franchises
Average-data methodThe average-data approach involves estimating emissions for each franchise, or groups of franchises, based on
average statistics, such as average emissions per building type, floor space, or franchise type. This approach should be
used when purchase records, electricity bills, or meter readings of fuel or energy use are not available or applicable.
Approaches include:
• Estimated emissions based on occupied floor space by building type
• Estimated emissions based on number and type of franchises.
Note that the average-data approach may be relatively inaccurate and limits the ability of companies to track
performance of GHG reduction actions.
Activity data neededDepending on the type of asset that is leased, companies may need to collect data on:
• Floor space of each franchise, by floor space
• Number of franchises, by building type
• Number of franchise assets that give rise to GHG emissions (e.g., company cars, trucks).
Emission factors neededDepending on the type of asset that is leased companies may need to collect:
• Average emission factors by floor space, expressed in units of emissions per area per time period
(e.g., kg CO2e/m2/day)
• Average emission factors by building type, expressed in units of emissions per building per time period
(e.g., kg CO2e/small office block/year)
• Emission factors by asset type, expressed in units of emissions per asset type per time period (e.g., kg CO2e/car/year).
Data collection guidanceData sources for emission factors include:
• Industry bodies (e.g., building industry)
• National statistics published by government agencies
• The U.S. Energy Information Administration dataset on average energy use by building type, Commercial Buildings
Energy Consumption Survey, at: http://www.eia.doe.gov/emeu/cbecs.
Calculation formula [14.4] Average data method for leased buildings (if floor space data is available)
CO2e emissions from franchises =
sum across building types:∑ (total floor space of building type (m2) × average emission factor for building type (kg CO2e/m2/year))
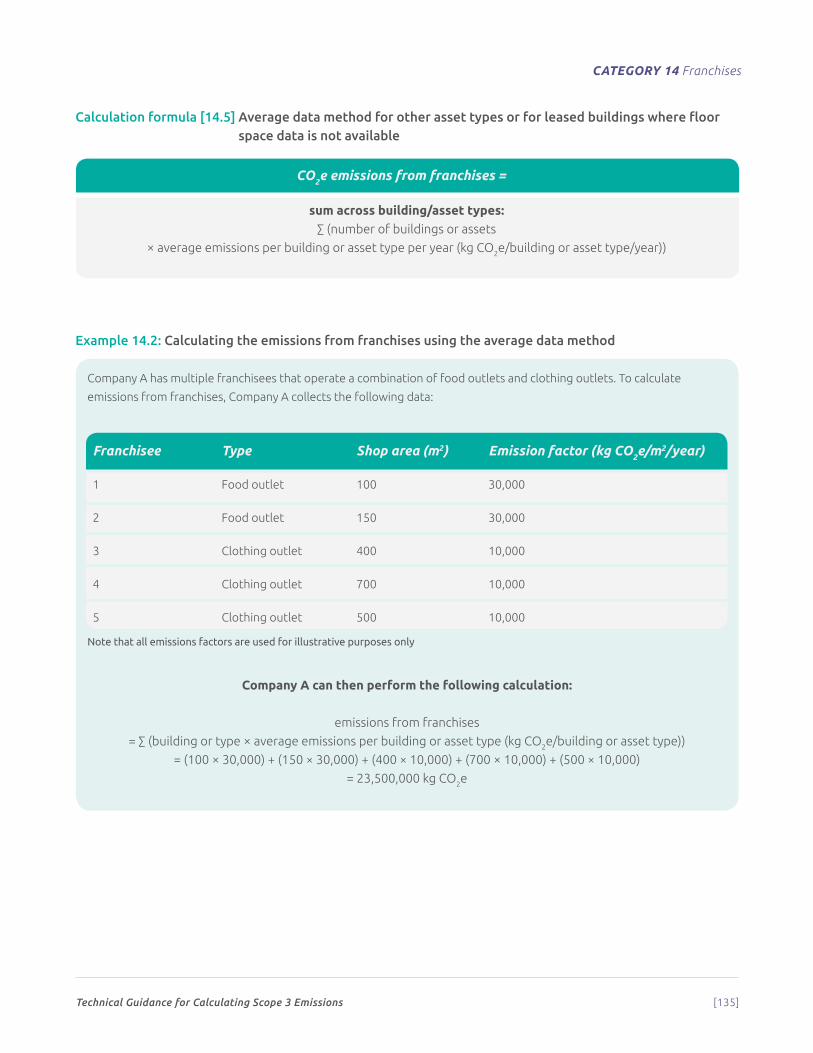
Technical Guidance for Calculating Scope 3 Emissions [135]
CATEGORY 14 Franchises
Calculation formula [14.5] Average data method for other asset types or for leased buildings where floor space data is not available
CO2e emissions from franchises =
sum across building/asset types:∑ (number of buildings or assets
× average emissions per building or asset type per year (kg CO2e/building or asset type/year))
Example 14.2: Calculating the emissions from franchises using the average data method
Company A has multiple franchisees that operate a combination of food outlets and clothing outlets. To calculate
emissions from franchises, Company A collects the following data:
Franchisee Type Shop area (m2) Emission factor (kg CO2e/m2/year)
1 Food outlet 100 30,000
2 Food outlet 150 30,000
3 Clothing outlet 400 10,000
4 Clothing outlet 700 10,000
5 Clothing outlet 500 10,000
Note that all emissions factors are used for illustrative purposes only
Company A can then perform the following calculation:
emissions from franchises
= ∑ (building or type × average emissions per building or asset type (kg CO2e/building or asset type))
= (100 × 30,000) + (150 × 30,000) + (400 × 10,000) + (700 × 10,000) + (500 × 10,000)
= 23,500,000 kg CO2e
Technical Guidance for Calculating Scope 3 Emissions [136]
15
Category 15: InvestmentsCategory description
T his category includes scope 3 emissions associated with the reporting company’s
investments in the reporting year, not already included in scope 1 or scope 2.
This category is applicable to investors (i.e., companies that make an investment
withtheobjectiveofmakingaprofit)andcompaniesthatprovidefinancialservices.This
categoryalsoappliestoinvestorsthatarenotprofitdriven(e.g.multilateraldevelopment
banks), and the same calculation methods should be used. Investments are categorized as
adownstreamscope3categorybecauseprovidingcapitalorfinancingisaserviceprovided
by the reporting company.
Category 15 is designed primarily for private financial institutions (e.g., commercial banks), but is also relevant to public
financial institutions (e.g., multilateral development banks, export credit agencies) and other entities with investments
not included in scope 1 and scope 2.
Investments may be included in a company’s scope 1 or scope 2 inventory depending on how the company defines its
organizational boundaries. For example, companies that use the equity-share approach include emissions from equity
investments in scope 1 and scope 2. Companies that use a control approach account only for those equity investments
that are under the company’s control in scope 1 and scope 2. Investments not included in the company’s scope 1 or
scope 2 emissions are included in scope 3, in this category. A reporting company’s scope 3 emissions from investments
are the scope 1 and scope 2 emissions of investees.
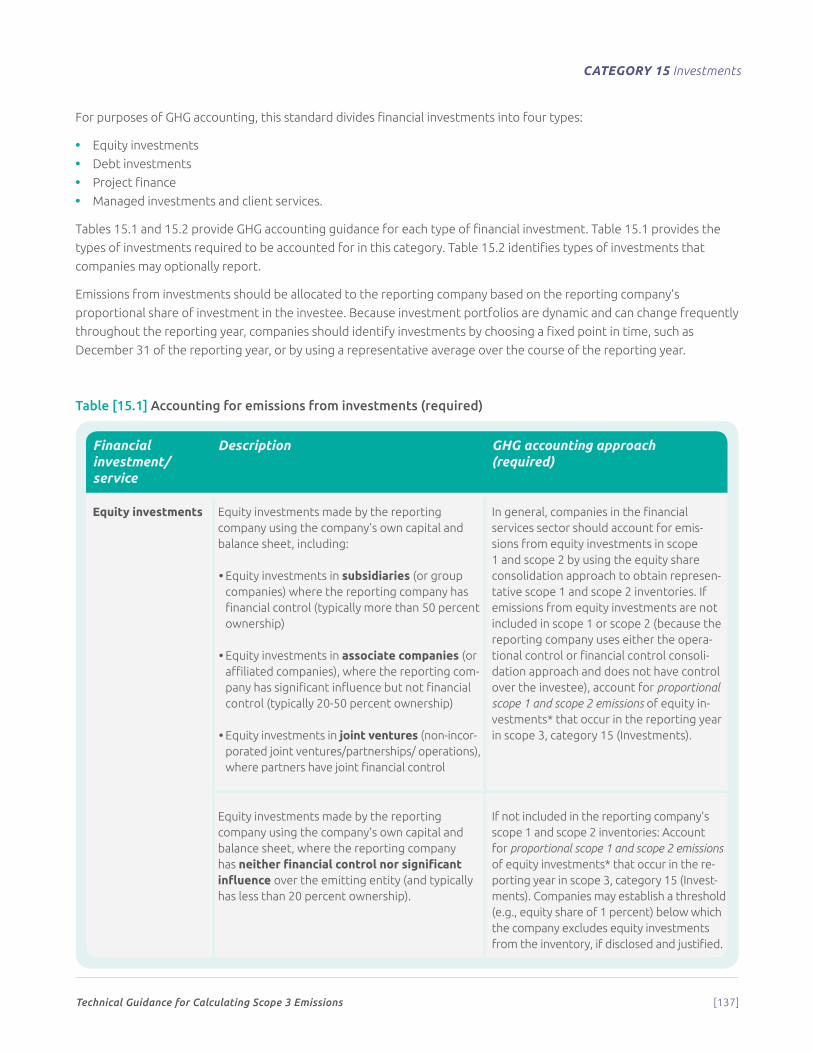
Technical Guidance for Calculating Scope 3 Emissions [137]
CATEGORY 15 Investments
For purposes of GHG accounting, this standard divides financial investments into four types:
• Equity investments
• Debt investments
• Project finance
• Managed investments and client services.
Tables 15.1 and 15.2 provide GHG accounting guidance for each type of financial investment. Table 15.1 provides the
types of investments required to be accounted for in this category. Table 15.2 identifies types of investments that
companies may optionally report.
Emissions from investments should be allocated to the reporting company based on the reporting company’s
proportional share of investment in the investee. Because investment portfolios are dynamic and can change frequently
throughout the reporting year, companies should identify investments by choosing a fixed point in time, such as
December 31 of the reporting year, or by using a representative average over the course of the reporting year.
Table [15.1] Accounting for emissions from investments (required)
Financial investment/ service
Description GHG accounting approach (required)
Equity investments Equity investments made by the reporting company using the company’s own capital and balance sheet, including:
• Equity investments in subsidiaries (or group companies) where the reporting company has financial control (typically more than 50 percent ownership)
• Equity investments in associate companies (or affiliated companies), where the reporting com-pany has significant influence but not financial control (typically 20-50 percent ownership)
• Equity investments in joint ventures (non-incor-porated joint ventures/partnerships/ operations), where partners have joint financial control
In general, companies in the financial services sector should account for emis-sions from equity investments in scope 1 and scope 2 by using the equity share consolidation approach to obtain represen-tative scope 1 and scope 2 inventories. If emissions from equity investments are not included in scope 1 or scope 2 (because the reporting company uses either the opera-tional control or financial control consoli-dation approach and does not have control over the investee), account for proportional scope 1 and scope 2 emissions of equity in-vestments* that occur in the reporting year in scope 3, category 15 (Investments).
Equity investments made by the reporting company using the company’s own capital and balance sheet, where the reporting company has neither financial control nor significant influence over the emitting entity (and typically has less than 20 percent ownership).
If not included in the reporting company’s scope 1 and scope 2 inventories: Account for proportional scope 1 and scope 2 emissions of equity investments* that occur in the re-porting year in scope 3, category 15 (Invest-ments). Companies may establish a threshold (e.g., equity share of 1 percent) below which the company excludes equity investments from the inventory, if disclosed and justified.
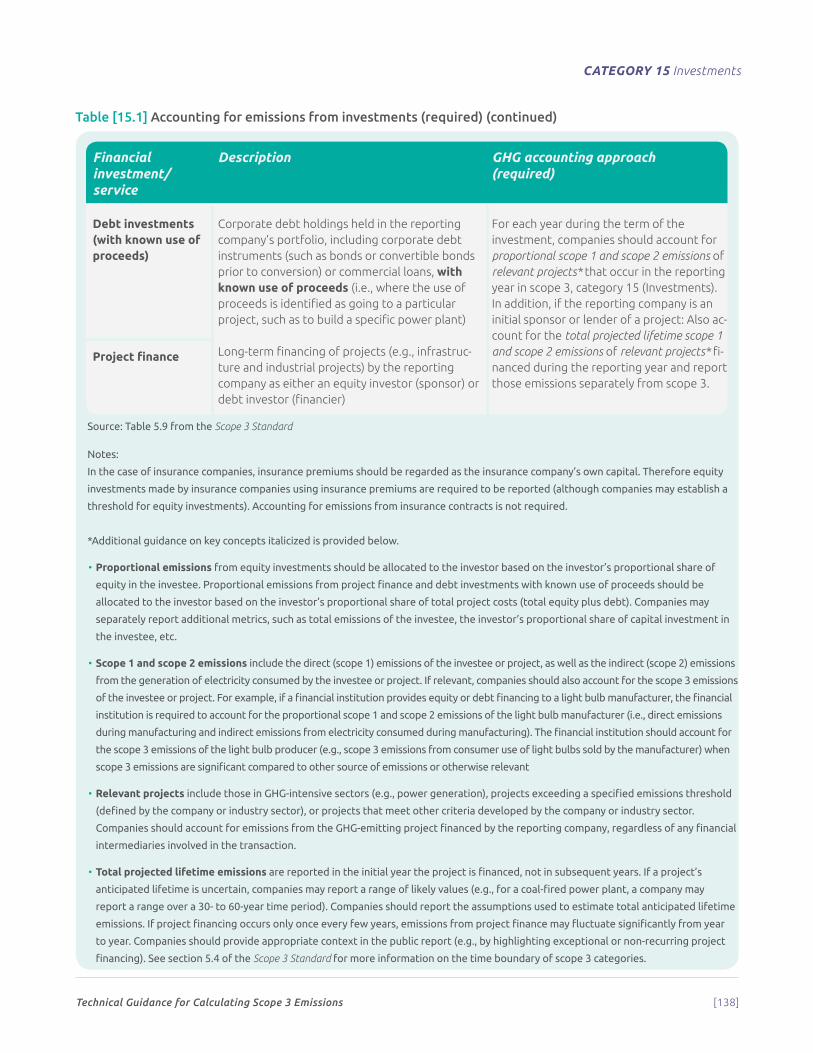
Technical Guidance for Calculating Scope 3 Emissions [138]
CATEGORY 15 Investments
Financial investment/ service
Description GHG accounting approach (required)
Debt investments (with known use of proceeds)
Corporate debt holdings held in the reporting company’s portfolio, including corporate debt instruments (such as bonds or convertible bonds prior to conversion) or commercial loans, with known use of proceeds (i.e., where the use of proceeds is identified as going to a particular project, such as to build a specific power plant)
Long-term financing of projects (e.g., infrastruc-ture and industrial projects) by the reporting company as either an equity investor (sponsor) or debt investor (financier)
For each year during the term of the investment, companies should account for proportional scope 1 and scope 2 emissions of relevant projects* that occur in the reporting year in scope 3, category 15 (Investments). In addition, if the reporting company is an initial sponsor or lender of a project: Also ac-count for the total projected lifetime scope 1 and scope 2 emissions of relevant projects* fi-nanced during the reporting year and report those emissions separately from scope 3.
Project finance
Source: Table 5.9 from the Scope 3 Standard
Notes:
In the case of insurance companies, insurance premiums should be regarded as the insurance company’s own capital. Therefore equity
investments made by insurance companies using insurance premiums are required to be reported (although companies may establish a
threshold for equity investments). Accounting for emissions from insurance contracts is not required.
*Additional guidance on key concepts italicized is provided below.
• Proportional emissions from equity investments should be allocated to the investor based on the investor’s proportional share of
equity in the investee. Proportional emissions from project finance and debt investments with known use of proceeds should be
allocated to the investor based on the investor’s proportional share of total project costs (total equity plus debt). Companies may
separately report additional metrics, such as total emissions of the investee, the investor’s proportional share of capital investment in
the investee, etc.
• Scope 1 and scope 2 emissions include the direct (scope 1) emissions of the investee or project, as well as the indirect (scope 2) emissions
from the generation of electricity consumed by the investee or project. If relevant, companies should also account for the scope 3 emissions
of the investee or project. For example, if a financial institution provides equity or debt financing to a light bulb manufacturer, the financial
institution is required to account for the proportional scope 1 and scope 2 emissions of the light bulb manufacturer (i.e., direct emissions
during manufacturing and indirect emissions from electricity consumed during manufacturing). The financial institution should account for
the scope 3 emissions of the light bulb producer (e.g., scope 3 emissions from consumer use of light bulbs sold by the manufacturer) when
scope 3 emissions are significant compared to other source of emissions or otherwise relevant
• Relevant projects include those in GHG-intensive sectors (e.g., power generation), projects exceeding a specified emissions threshold
(defined by the company or industry sector), or projects that meet other criteria developed by the company or industry sector.
Companies should account for emissions from the GHG-emitting project financed by the reporting company, regardless of any financial
intermediaries involved in the transaction.
• Total projected lifetime emissions are reported in the initial year the project is financed, not in subsequent years. If a project’s
anticipated lifetime is uncertain, companies may report a range of likely values (e.g., for a coal-fired power plant, a company may
report a range over a 30- to 60-year time period). Companies should report the assumptions used to estimate total anticipated lifetime
emissions. If project financing occurs only once every few years, emissions from project finance may fluctuate significantly from year
to year. Companies should provide appropriate context in the public report (e.g., by highlighting exceptional or non-recurring project
financing). See section 5.4 of the Scope 3 Standard for more information on the time boundary of scope 3 categories.
Table [15.1] Accounting for emissions from investments (required) (continued)
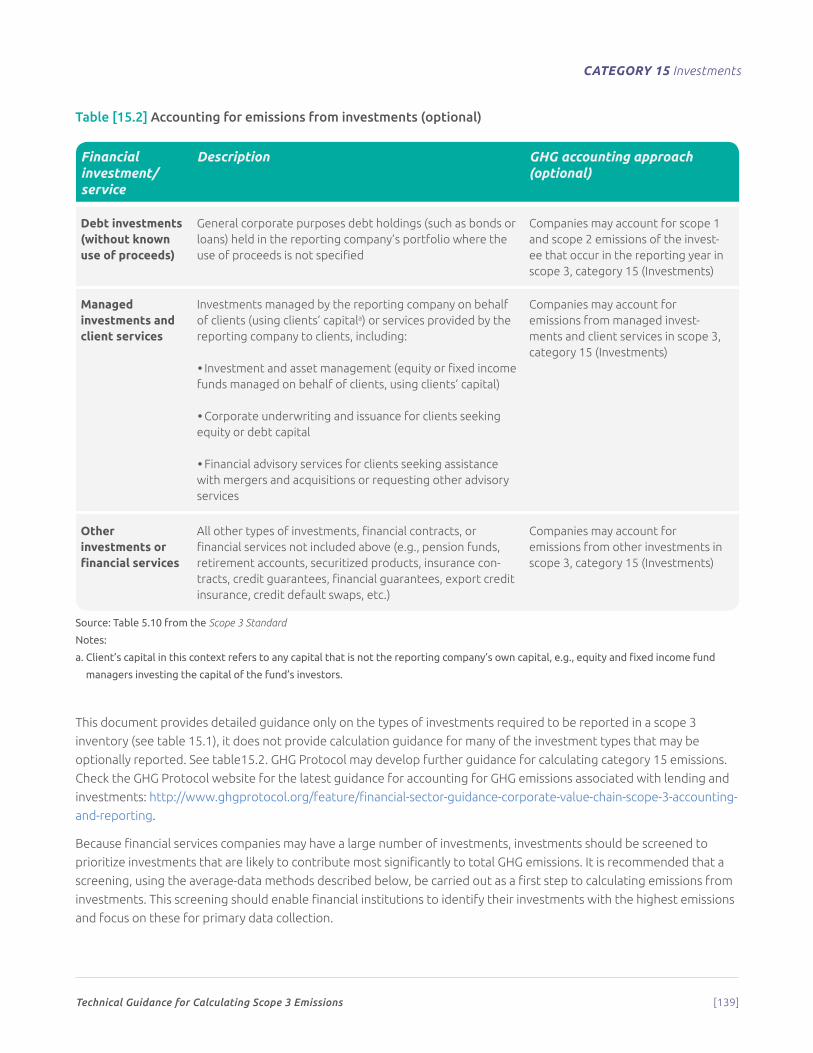
Technical Guidance for Calculating Scope 3 Emissions [139]
CATEGORY 15 Investments
Table [15.2] Accounting for emissions from investments (optional)
Financial investment/ service
Description GHG accounting approach (optional)
Debt investments(without known use of proceeds)
General corporate purposes debt holdings (such as bonds or loans) held in the reporting company’s portfolio where the use of proceeds is not specified
Companies may account for scope 1 and scope 2 emissions of the invest-ee that occur in the reporting year in scope 3, category 15 (Investments)
Managed investments and client services
Investments managed by the reporting company on behalf of clients (using clients’ capitala) or services provided by the reporting company to clients, including:
• Investment and asset management (equity or fixed income funds managed on behalf of clients, using clients’ capital)
• Corporate underwriting and issuance for clients seeking equity or debt capital
• Financial advisory services for clients seeking assistance with mergers and acquisitions or requesting other advisory services
Companies may account for emissions from managed invest-ments and client services in scope 3, category 15 (Investments)
Other investments or financial services
All other types of investments, financial contracts, or financial services not included above (e.g., pension funds, retirement accounts, securitized products, insurance con-tracts, credit guarantees, financial guarantees, export credit insurance, credit default swaps, etc.)
Companies may account for emissions from other investments in scope 3, category 15 (Investments)
Source: Table 5.10 from the Scope 3 Standard
Notes:
a. Client’s capital in this context refers to any capital that is not the reporting company’s own capital, e.g., equity and fixed income fund
managers investing the capital of the fund’s investors.
This document provides detailed guidance only on the types of investments required to be reported in a scope 3
inventory (see table 15.1), it does not provide calculation guidance for many of the investment types that may be
optionally reported. See table15.2. GHG Protocol may develop further guidance for calculating category 15 emissions.
Check the GHG Protocol website for the latest guidance for accounting for GHG emissions associated with lending and
investments: http://www.ghgprotocol.org/feature/financial-sector-guidance-corporate-value-chain-scope-3-accounting-
and-reporting.
Because financial services companies may have a large number of investments, investments should be screened to
prioritize investments that are likely to contribute most significantly to total GHG emissions. It is recommended that a
screening, using the average-data methods described below, be carried out as a first step to calculating emissions from
investments. This screening should enable financial institutions to identify their investments with the highest emissions
and focus on these for primary data collection.
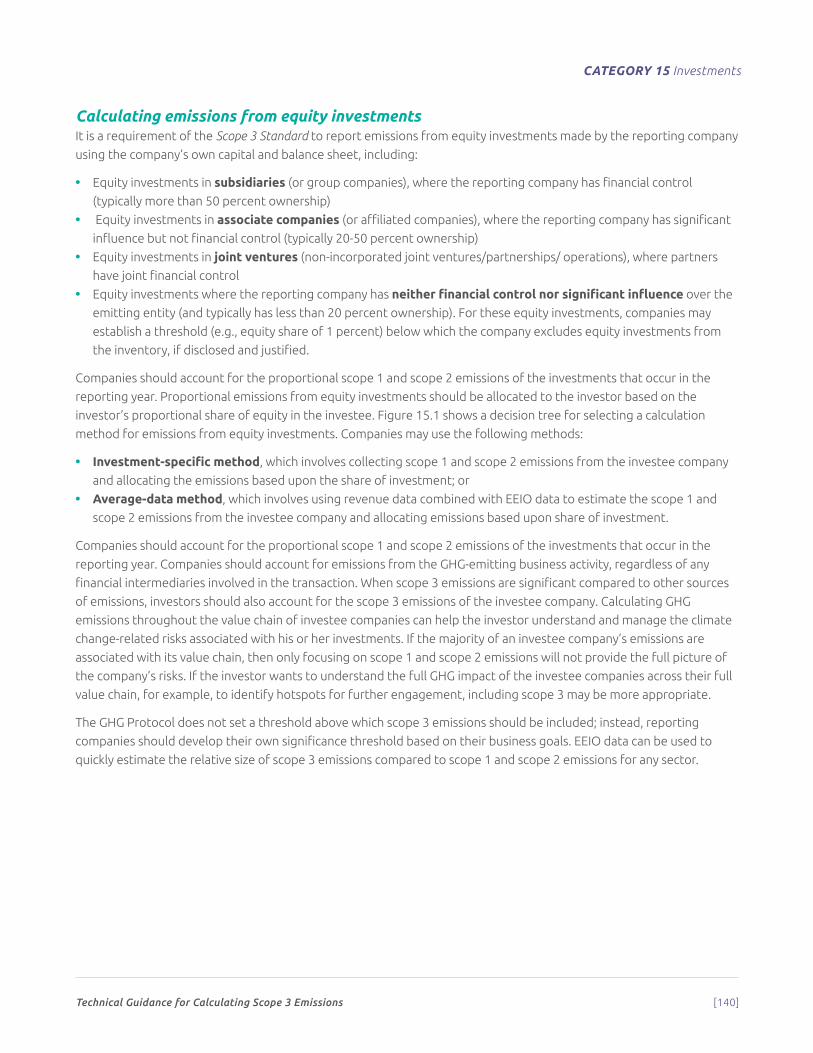
Technical Guidance for Calculating Scope 3 Emissions [140]
CATEGORY 15 Investments
Calculating emissions from equity investmentsIt is a requirement of the Scope 3 Standard to report emissions from equity investments made by the reporting company
using the company’s own capital and balance sheet, including:
• Equity investments in subsidiaries (or group companies), where the reporting company has financial control
(typically more than 50 percent ownership)
• Equity investments in associate companies (or affiliated companies), where the reporting company has significant
influence but not financial control (typically 20-50 percent ownership)
• Equity investments in joint ventures (non-incorporated joint ventures/partnerships/ operations), where partners
have joint financial control
• Equity investments where the reporting company has neither financial control nor significant influence over the
emitting entity (and typically has less than 20 percent ownership). For these equity investments, companies may
establish a threshold (e.g., equity share of 1 percent) below which the company excludes equity investments from
the inventory, if disclosed and justified.
Companies should account for the proportional scope 1 and scope 2 emissions of the investments that occur in the
reporting year. Proportional emissions from equity investments should be allocated to the investor based on the
investor’s proportional share of equity in the investee. Figure 15.1 shows a decision tree for selecting a calculation
method for emissions from equity investments. Companies may use the following methods:
• Investment-specific method, which involves collecting scope 1 and scope 2 emissions from the investee company
and allocating the emissions based upon the share of investment; or
• Average-data method, which involves using revenue data combined with EEIO data to estimate the scope 1 and
scope 2 emissions from the investee company and allocating emissions based upon share of investment.
Companies should account for the proportional scope 1 and scope 2 emissions of the investments that occur in the
reporting year. Companies should account for emissions from the GHG-emitting business activity, regardless of any
financial intermediaries involved in the transaction. When scope 3 emissions are significant compared to other sources
of emissions, investors should also account for the scope 3 emissions of the investee company. Calculating GHG
emissions throughout the value chain of investee companies can help the investor understand and manage the climate
change-related risks associated with his or her investments. If the majority of an investee company’s emissions are
associated with its value chain, then only focusing on scope 1 and scope 2 emissions will not provide the full picture of
the company’s risks. If the investor wants to understand the full GHG impact of the investee companies across their full
value chain, for example, to identify hotspots for further engagement, including scope 3 may be more appropriate.
The GHG Protocol does not set a threshold above which scope 3 emissions should be included; instead, reporting
companies should develop their own significance threshold based on their business goals. EEIO data can be used to
quickly estimate the relative size of scope 3 emissions compared to scope 1 and scope 2 emissions for any sector.
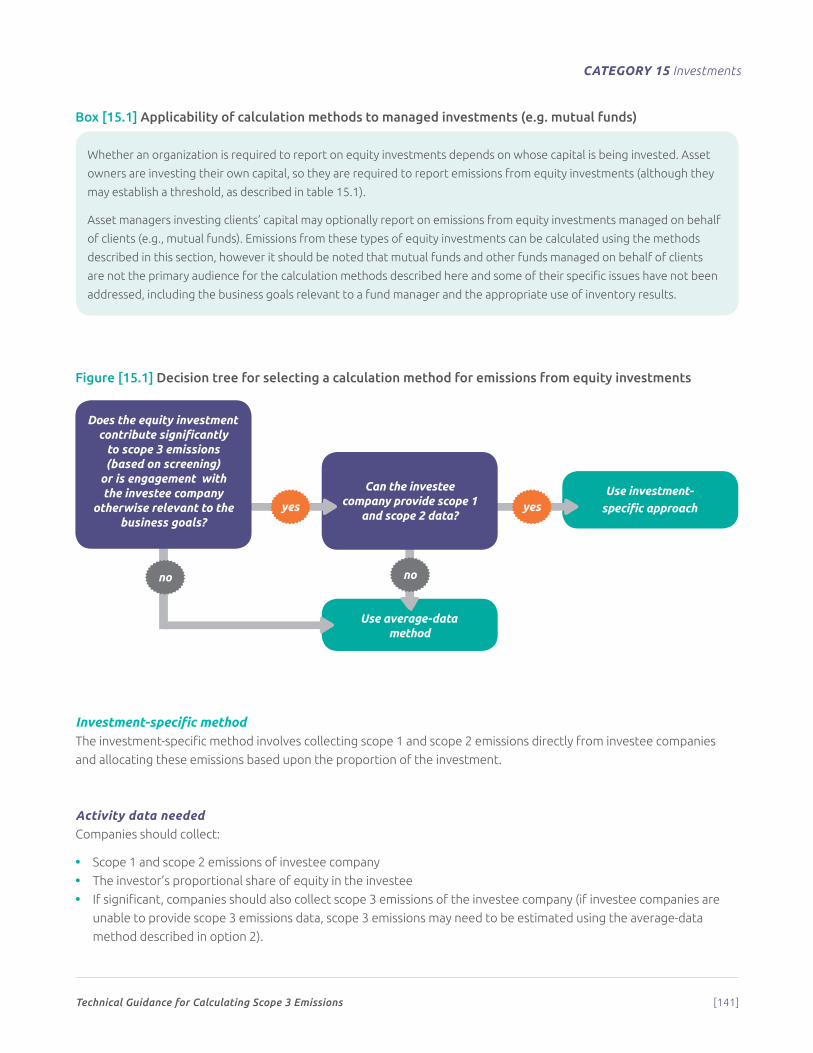
Technical Guidance for Calculating Scope 3 Emissions [141]
CATEGORY 15 Investments
Box [15.1] Applicability of calculation methods to managed investments (e.g. mutual funds)
Whether an organization is required to report on equity investments depends on whose capital is being invested. Asset
owners are investing their own capital, so they are required to report emissions from equity investments (although they
may establish a threshold, as described in table 15.1).
Asset managers investing clients’ capital may optionally report on emissions from equity investments managed on behalf
of clients (e.g., mutual funds). Emissions from these types of equity investments can be calculated using the methods
described in this section, however it should be noted that mutual funds and other funds managed on behalf of clients
are not the primary audience for the calculation methods described here and some of their specific issues have not been
addressed, including the business goals relevant to a fund manager and the appropriate use of inventory results.
Figure [15.1] Decision tree for selecting a calculation method for emissions from equity investments
Investment-specific methodThe investment-specific method involves collecting scope 1 and scope 2 emissions directly from investee companies
and allocating these emissions based upon the proportion of the investment.
Activity data neededCompanies should collect:
• Scope 1 and scope 2 emissions of investee company
• The investor’s proportional share of equity in the investee
• If significant, companies should also collect scope 3 emissions of the investee company (if investee companies are
unable to provide scope 3 emissions data, scope 3 emissions may need to be estimated using the average-data
method described in option 2).
Use average-data method
Use investment- specific approach
no no
Can the investee company provide scope 1
and scope 2 data?yesyes
Does the equity investment contribute significantly
to scope 3 emissions (based on screening)
or is engagement with the investee company
otherwise relevant to the business goals?
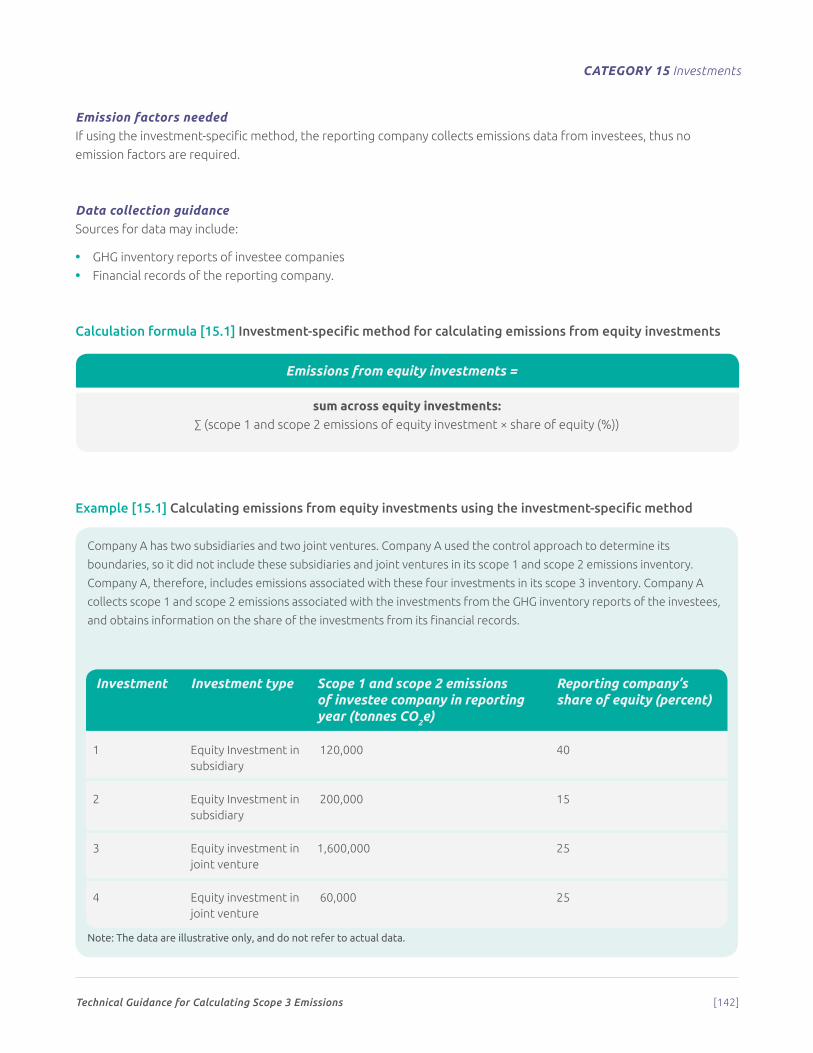
Technical Guidance for Calculating Scope 3 Emissions [142]
CATEGORY 15 Investments
Emission factors neededIf using the investment-specific method, the reporting company collects emissions data from investees, thus no
emission factors are required.
Data collection guidanceSources for data may include:
• GHG inventory reports of investee companies
• Financial records of the reporting company.
Calculation formula [15.1] Investment-specific method for calculating emissions from equity investments
Emissions from equity investments =
sum across equity investments:∑ (scope 1 and scope 2 emissions of equity investment × share of equity (%))
Example [15.1] Calculating emissions from equity investments using the investment-specific method
Company A has two subsidiaries and two joint ventures. Company A used the control approach to determine its
boundaries, so it did not include these subsidiaries and joint ventures in its scope 1 and scope 2 emissions inventory.
Company A, therefore, includes emissions associated with these four investments in its scope 3 inventory. Company A
collects scope 1 and scope 2 emissions associated with the investments from the GHG inventory reports of the investees,
and obtains information on the share of the investments from its financial records.
Investment Investment type Scope 1 and scope 2 emissions of investee company in reporting year (tonnes CO2e)
Reporting company’s share of equity (percent)
1 Equity Investment in subsidiary
120,000 40
2 Equity Investment in subsidiary
200,000 15
3 Equity investment in joint venture
1,600,000 25
4 Equity investment in joint venture
60,000 25
Note: The data are illustrative only, and do not refer to actual data.
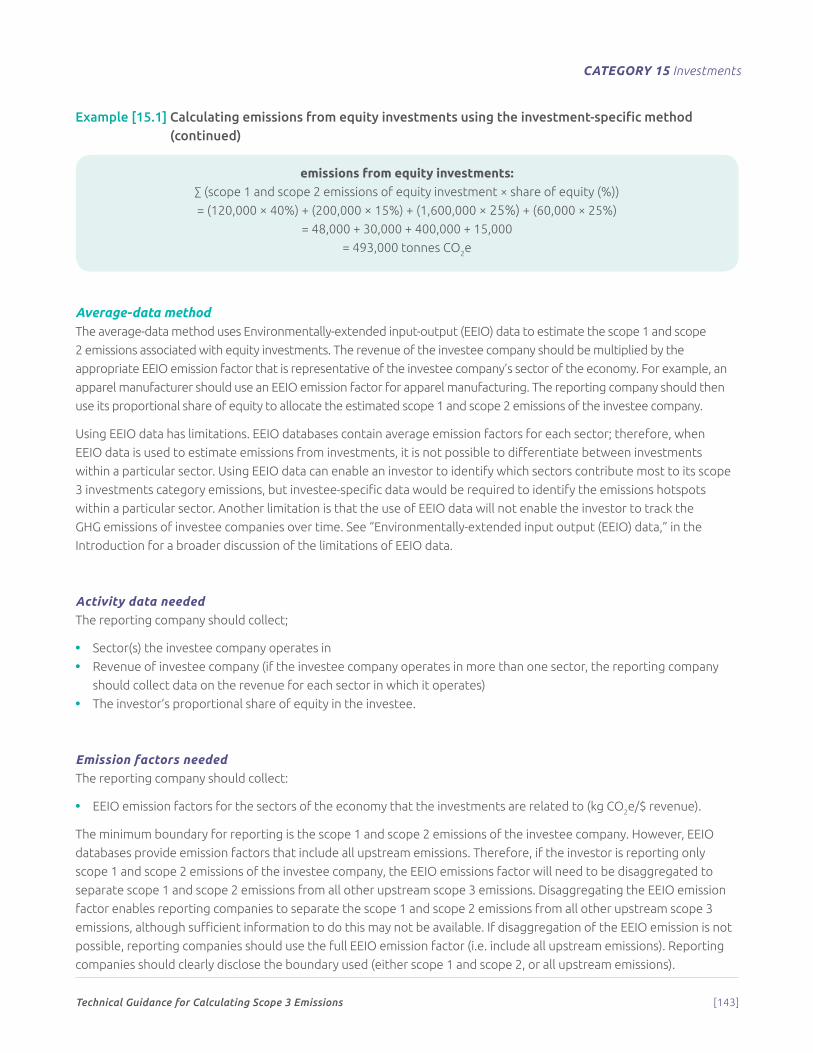
Technical Guidance for Calculating Scope 3 Emissions [143]
CATEGORY 15 Investments
emissions from equity investments:∑ (scope 1 and scope 2 emissions of equity investment × share of equity (%))
= (120,000 × 40%) + (200,000 × 15%) + (1,600,000 × 25%) + (60,000 × 25%)
= 48,000 + 30,000 + 400,000 + 15,000
= 493,000 tonnes CO2e
Average-data methodThe average-data method uses Environmentally-extended input-output (EEIO) data to estimate the scope 1 and scope
2 emissions associated with equity investments. The revenue of the investee company should be multiplied by the
appropriate EEIO emission factor that is representative of the investee company’s sector of the economy. For example, an
apparel manufacturer should use an EEIO emission factor for apparel manufacturing. The reporting company should then
use its proportional share of equity to allocate the estimated scope 1 and scope 2 emissions of the investee company.
Using EEIO data has limitations. EEIO databases contain average emission factors for each sector; therefore, when
EEIO data is used to estimate emissions from investments, it is not possible to differentiate between investments
within a particular sector. Using EEIO data can enable an investor to identify which sectors contribute most to its scope
3 investments category emissions, but investee-specific data would be required to identify the emissions hotspots
within a particular sector. Another limitation is that the use of EEIO data will not enable the investor to track the
GHG emissions of investee companies over time. See “Environmentally-extended input output (EEIO) data,” in the
Introduction for a broader discussion of the limitations of EEIO data.
Activity data neededThe reporting company should collect;
• Sector(s) the investee company operates in
• Revenue of investee company (if the investee company operates in more than one sector, the reporting company
should collect data on the revenue for each sector in which it operates)
• The investor’s proportional share of equity in the investee.
Emission factors neededThe reporting company should collect:
• EEIO emission factors for the sectors of the economy that the investments are related to (kg CO2e/$ revenue).
The minimum boundary for reporting is the scope 1 and scope 2 emissions of the investee company. However, EEIO
databases provide emission factors that include all upstream emissions. Therefore, if the investor is reporting only
scope 1 and scope 2 emissions of the investee company, the EEIO emissions factor will need to be disaggregated to
separate scope 1 and scope 2 emissions from all other upstream scope 3 emissions. Disaggregating the EEIO emission
factor enables reporting companies to separate the scope 1 and scope 2 emissions from all other upstream scope 3
emissions, although sufficient information to do this may not be available. If disaggregation of the EEIO emission is not
possible, reporting companies should use the full EEIO emission factor (i.e. include all upstream emissions). Reporting
companies should clearly disclose the boundary used (either scope 1 and scope 2, or all upstream emissions).
Example [15.1] Calculating emissions from equity investments using the investment-specific method (continued)

Technical Guidance for Calculating Scope 3 Emissions [144]
CATEGORY 15 Investments
When scope 3 emissions are significant compared with other sources of emissions, investors should also account for the
scope 3 emissions of the investee company. Including upstream scope 3 emissions is simple when using EEIO databases
because the EEIO emission factors include all upstream emissions.
Reporting companies should account for any significant changes in exchange rates and inflation rates over time. If
possible, the EEIO data should be representative of the geographic region in which the investee company is located.
Data collection guidanceData may be collected from the following sources:
• Revenue data and equity share data will be available from financial records of the reporting company and the investee company
• Emission factors are available from EEIO databases (a list of databases is provided on the GHG Protocol website
(http://www.ghgprotocol.org/Third-Party-Databases). Additional databases may be added periodically, so continue
to check the website.
Calculation formula [15.2] Average-data method for calculating emissions from equity investments
Emissions from equity investments =
sum across equity investments:∑ ((investee company total revenue ($) × emission factor for investee’s sector (kg CO2e/$ revenue))
× share of equity (%))
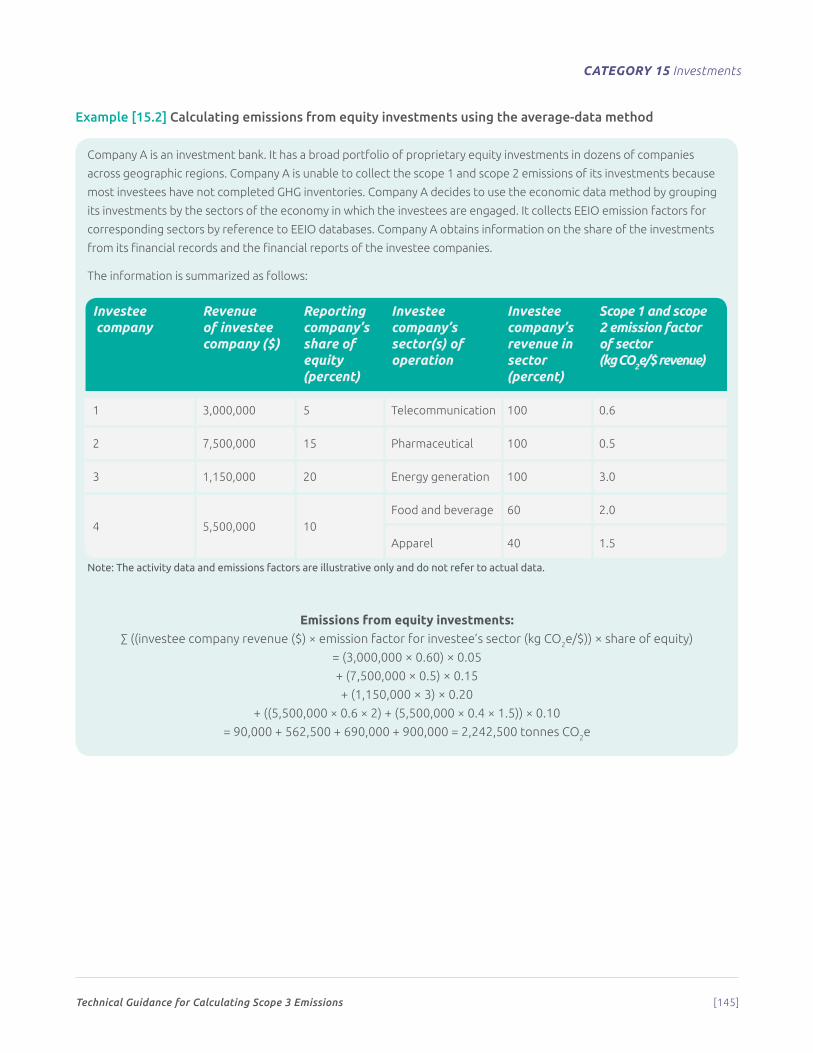
Technical Guidance for Calculating Scope 3 Emissions [145]
CATEGORY 15 Investments
Example [15.2] Calculating emissions from equity investments using the average-data method
Company A is an investment bank. It has a broad portfolio of proprietary equity investments in dozens of companies
across geographic regions. Company A is unable to collect the scope 1 and scope 2 emissions of its investments because
most investees have not completed GHG inventories. Company A decides to use the economic data method by grouping
its investments by the sectors of the economy in which the investees are engaged. It collects EEIO emission factors for
corresponding sectors by reference to EEIO databases. Company A obtains information on the share of the investments
from its financial records and the financial reports of the investee companies.
The information is summarized as follows:
Investee company
Revenue of investee company ($)
Reporting company’s share of equity (percent)
Investee company’s sector(s) of operation
Investee company’s revenue in sector(percent)
Scope 1 and scope 2 emission factor of sector (kg CO2e/$ revenue)
1 3,000,000 5 Telecommunication 100 0.6
2 7,500,000 15 Pharmaceutical 100 0.5
3 1,150,000 20 Energy generation 100 3.0
4 5,500,000 10Food and beverage 60 2.0
Apparel 40 1.5
Note: The activity data and emissions factors are illustrative only and do not refer to actual data.
Emissions from equity investments: ∑ ((investee company revenue ($) × emission factor for investee’s sector (kg CO2e/$)) × share of equity)
= (3,000,000 × 0.60) × 0.05
+ (7,500,000 × 0.5) × 0.15
+ (1,150,000 × 3) × 0.20
+ ((5,500,000 × 0.6 × 2) + (5,500,000 × 0.4 × 1.5)) × 0.10
= 90,000 + 562,500 + 690,000 + 900,000 = 2,242,500 tonnes CO2e
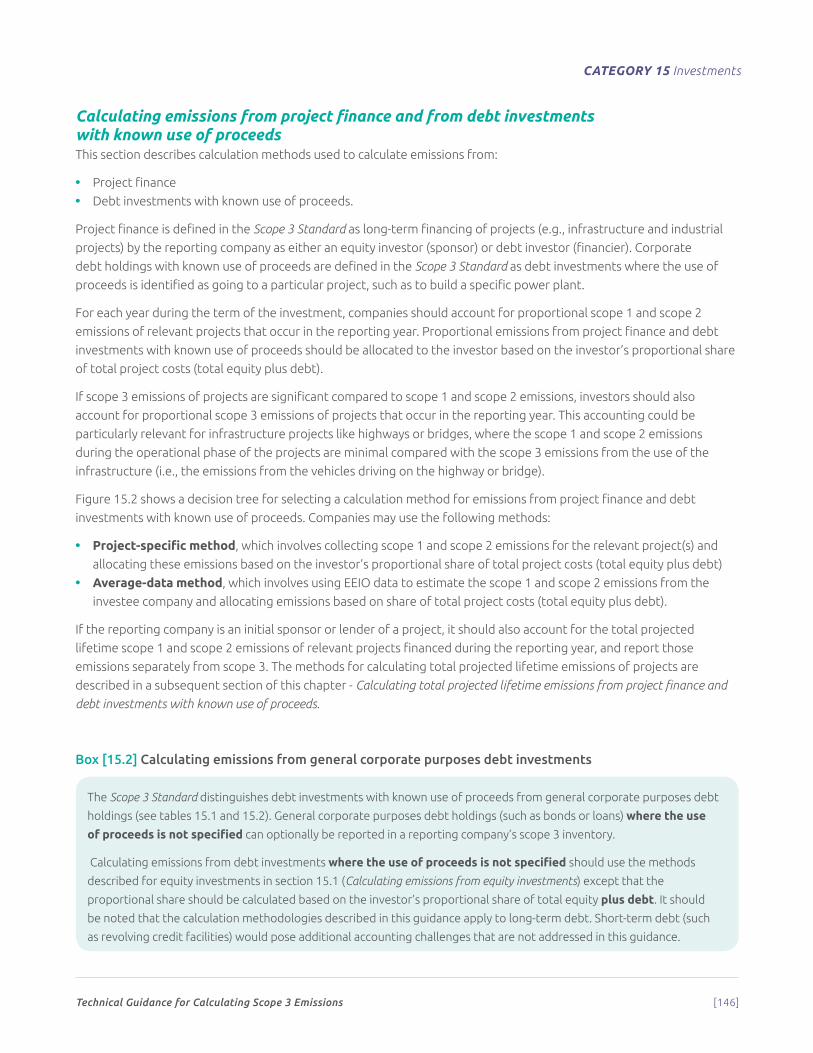
Technical Guidance for Calculating Scope 3 Emissions [146]
CATEGORY 15 Investments
Calculating emissions from project finance and from debt investments with known use of proceedsThis section describes calculation methods used to calculate emissions from:
• Project finance
• Debt investments with known use of proceeds.
Project finance is defined in the Scope 3 Standard as long-term financing of projects (e.g., infrastructure and industrial
projects) by the reporting company as either an equity investor (sponsor) or debt investor (financier). Corporate
debt holdings with known use of proceeds are defined in the Scope 3 Standard as debt investments where the use of
proceeds is identified as going to a particular project, such as to build a specific power plant.
For each year during the term of the investment, companies should account for proportional scope 1 and scope 2
emissions of relevant projects that occur in the reporting year. Proportional emissions from project finance and debt
investments with known use of proceeds should be allocated to the investor based on the investor’s proportional share
of total project costs (total equity plus debt).
If scope 3 emissions of projects are significant compared to scope 1 and scope 2 emissions, investors should also
account for proportional scope 3 emissions of projects that occur in the reporting year. This accounting could be
particularly relevant for infrastructure projects like highways or bridges, where the scope 1 and scope 2 emissions
during the operational phase of the projects are minimal compared with the scope 3 emissions from the use of the
infrastructure (i.e., the emissions from the vehicles driving on the highway or bridge).
Figure 15.2 shows a decision tree for selecting a calculation method for emissions from project finance and debt
investments with known use of proceeds. Companies may use the following methods:
• Project-specific method, which involves collecting scope 1 and scope 2 emissions for the relevant project(s) and
allocating these emissions based on the investor’s proportional share of total project costs (total equity plus debt)
• Average-data method, which involves using EEIO data to estimate the scope 1 and scope 2 emissions from the
investee company and allocating emissions based on share of total project costs (total equity plus debt).
If the reporting company is an initial sponsor or lender of a project, it should also account for the total projected
lifetime scope 1 and scope 2 emissions of relevant projects financed during the reporting year, and report those
emissions separately from scope 3. The methods for calculating total projected lifetime emissions of projects are
described in a subsequent section of this chapter - Calculating total projected lifetime emissions from project finance and
debt investments with known use of proceeds.
Box [15.2] Calculating emissions from general corporate purposes debt investments
The Scope 3 Standard distinguishes debt investments with known use of proceeds from general corporate purposes debt
holdings (see tables 15.1 and 15.2). General corporate purposes debt holdings (such as bonds or loans) where the use
of proceeds is not specified can optionally be reported in a reporting company’s scope 3 inventory.
Calculating emissions from debt investments where the use of proceeds is not specified should use the methods
described for equity investments in section 15.1 (Calculating emissions from equity investments) except that the
proportional share should be calculated based on the investor’s proportional share of total equity plus debt. It should
be noted that the calculation methodologies described in this guidance apply to long-term debt. Short-term debt (such
as revolving credit facilities) would pose additional accounting challenges that are not addressed in this guidance.
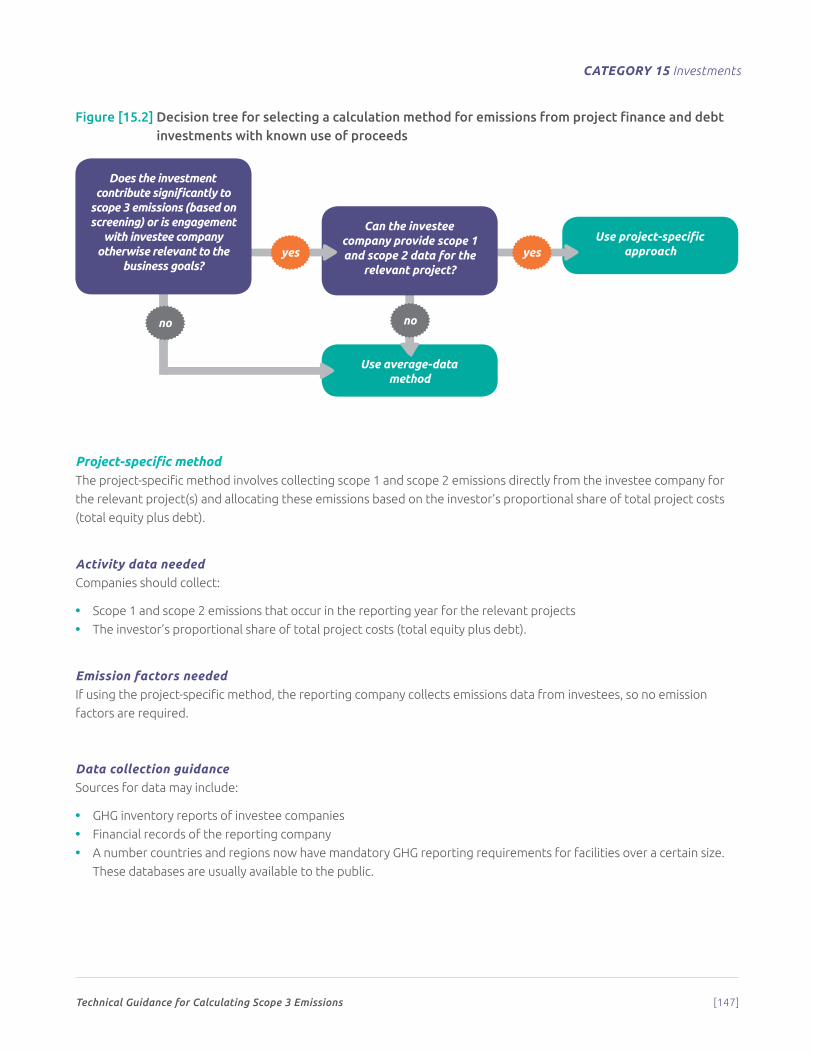
Technical Guidance for Calculating Scope 3 Emissions [147]
CATEGORY 15 Investments
Figure [15.2] Decision tree for selecting a calculation method for emissions from project finance and debt investments with known use of proceeds
Use average-data method
Use project-specific approach
no no
Can the investee company provide scope 1 and scope 2 data for the
relevant project?yesyes
Does the investment contribute significantly to
scope 3 emissions (based on screening) or is engagement
with investee company otherwise relevant to the
business goals?
Project-specific methodThe project-specific method involves collecting scope 1 and scope 2 emissions directly from the investee company for
the relevant project(s) and allocating these emissions based on the investor’s proportional share of total project costs
(total equity plus debt).
Activity data neededCompanies should collect:
• Scope 1 and scope 2 emissions that occur in the reporting year for the relevant projects
• The investor’s proportional share of total project costs (total equity plus debt).
Emission factors neededIf using the project-specific method, the reporting company collects emissions data from investees, so no emission
factors are required.
Data collection guidanceSources for data may include:
• GHG inventory reports of investee companies
• Financial records of the reporting company
• A number countries and regions now have mandatory GHG reporting requirements for facilities over a certain size.
These databases are usually available to the public.
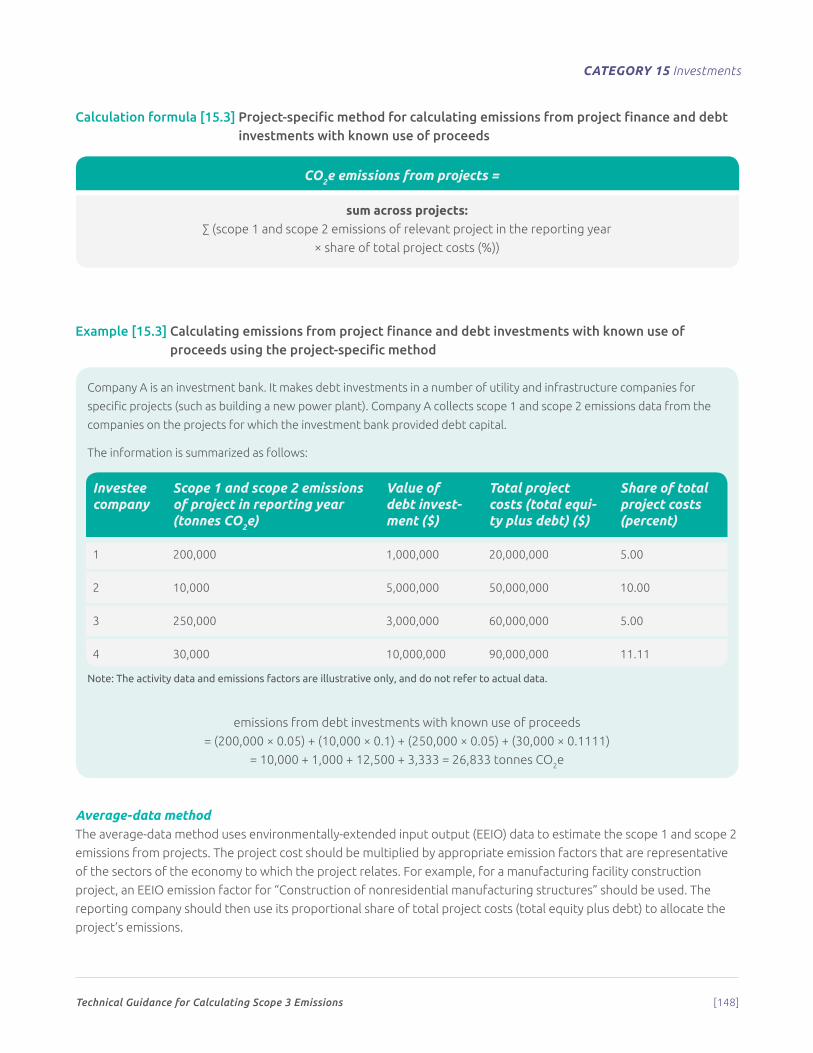
Technical Guidance for Calculating Scope 3 Emissions [148]
CATEGORY 15 Investments
Calculation formula [15.3] Project-specific method for calculating emissions from project finance and debt investments with known use of proceeds
CO2e emissions from projects =
sum across projects:∑ (scope 1 and scope 2 emissions of relevant project in the reporting year
× share of total project costs (%))
Example [15.3] Calculating emissions from project finance and debt investments with known use of proceeds using the project-specific method
Company A is an investment bank. It makes debt investments in a number of utility and infrastructure companies for
specific projects (such as building a new power plant). Company A collects scope 1 and scope 2 emissions data from the
companies on the projects for which the investment bank provided debt capital.
The information is summarized as follows:
Investee company
Scope 1 and scope 2 emissions of project in reporting year (tonnes CO2e)
Value of debt invest-ment ($)
Total project costs (total equi-ty plus debt) ($)
Share of total project costs (percent)
1 200,000 1,000,000 20,000,000 5.00
2 10,000 5,000,000 50,000,000 10.00
3 250,000 3,000,000 60,000,000 5.00
4 30,000 10,000,000 90,000,000 11.11
Note: The activity data and emissions factors are illustrative only, and do not refer to actual data.
emissions from debt investments with known use of proceeds
= (200,000 × 0.05) + (10,000 × 0.1) + (250,000 × 0.05) + (30,000 × 0.1111)
= 10,000 + 1,000 + 12,500 + 3,333 = 26,833 tonnes CO2e
Average-data methodThe average-data method uses environmentally-extended input output (EEIO) data to estimate the scope 1 and scope 2
emissions from projects. The project cost should be multiplied by appropriate emission factors that are representative
of the sectors of the economy to which the project relates. For example, for a manufacturing facility construction
project, an EEIO emission factor for “Construction of nonresidential manufacturing structures” should be used. The
reporting company should then use its proportional share of total project costs (total equity plus debt) to allocate the
project’s emissions.
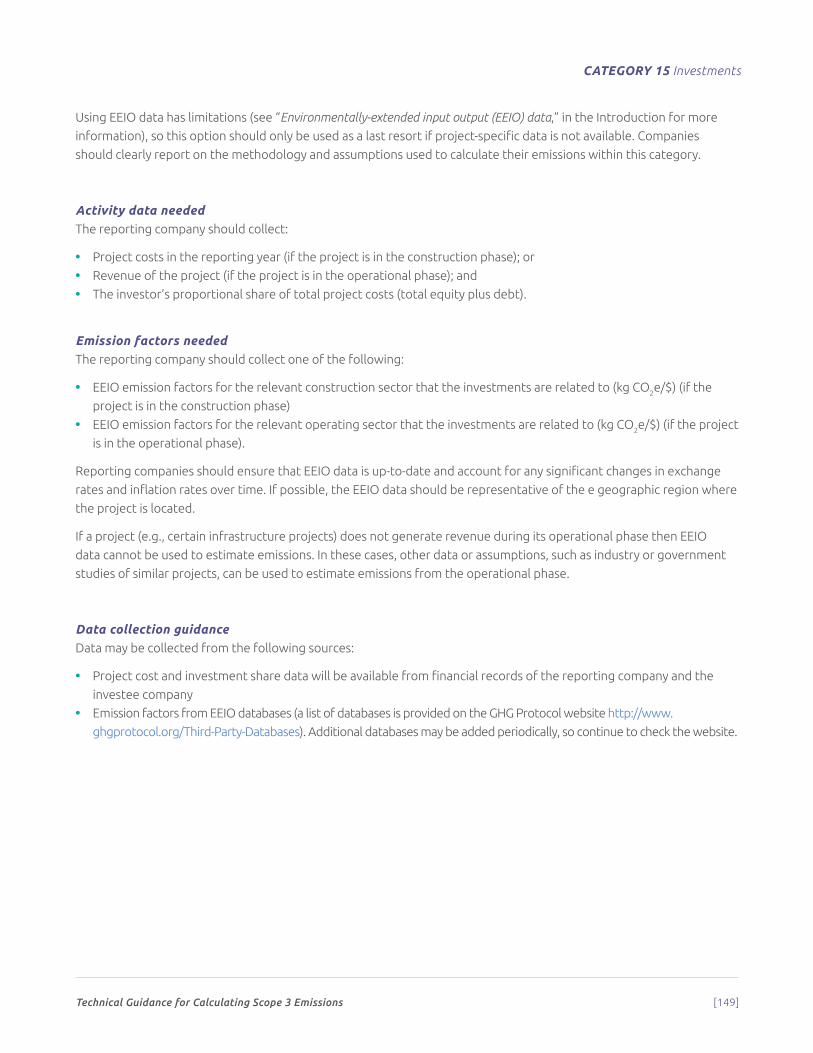
Technical Guidance for Calculating Scope 3 Emissions [149]
CATEGORY 15 Investments
Using EEIO data has limitations (see “Environmentally-extended input output (EEIO) data,” in the Introduction for more
information), so this option should only be used as a last resort if project-specific data is not available. Companies
should clearly report on the methodology and assumptions used to calculate their emissions within this category.
Activity data neededThe reporting company should collect:
• Project costs in the reporting year (if the project is in the construction phase); or
• Revenue of the project (if the project is in the operational phase); and
• The investor’s proportional share of total project costs (total equity plus debt).
Emission factors neededThe reporting company should collect one of the following:
• EEIO emission factors for the relevant construction sector that the investments are related to (kg CO2e/$) (if the
project is in the construction phase)
• EEIO emission factors for the relevant operating sector that the investments are related to (kg CO2e/$) (if the project
is in the operational phase).
Reporting companies should ensure that EEIO data is up-to-date and account for any significant changes in exchange
rates and inflation rates over time. If possible, the EEIO data should be representative of the e geographic region where
the project is located.
If a project (e.g., certain infrastructure projects) does not generate revenue during its operational phase then EEIO
data cannot be used to estimate emissions. In these cases, other data or assumptions, such as industry or government
studies of similar projects, can be used to estimate emissions from the operational phase.
Data collection guidanceData may be collected from the following sources:
• Project cost and investment share data will be available from financial records of the reporting company and the
investee company
• Emission factors from EEIO databases (a list of databases is provided on the GHG Protocol website http://www.
ghgprotocol.org/Third-Party-Databases). Additional databases may be added periodically, so continue to check the website.
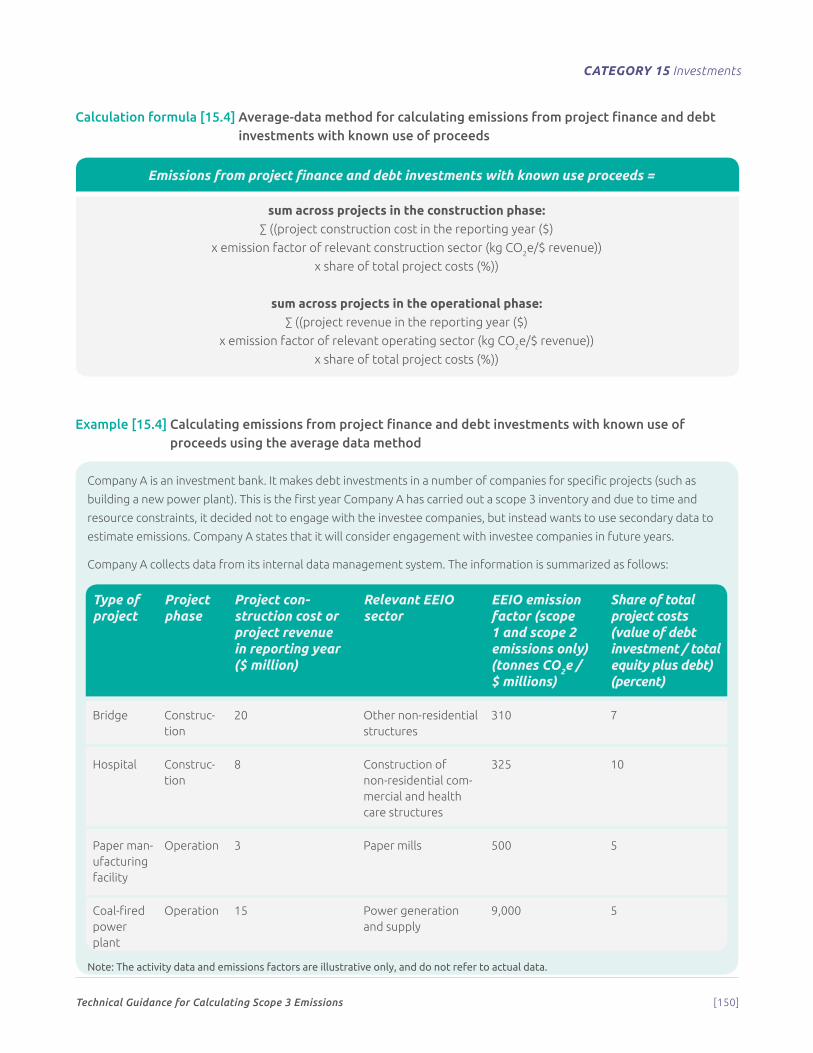
Technical Guidance for Calculating Scope 3 Emissions [150]
CATEGORY 15 Investments
Calculation formula [15.4] Average-data method for calculating emissions from project finance and debt investments with known use of proceeds
Emissions from project finance and debt investments with known use proceeds =
sum across projects in the construction phase:∑ ((project construction cost in the reporting year ($)
x emission factor of relevant construction sector (kg CO2e/$ revenue))
x share of total project costs (%))
sum across projects in the operational phase:∑ ((project revenue in the reporting year ($)
x emission factor of relevant operating sector (kg CO2e/$ revenue))
x share of total project costs (%))
Example [15.4] Calculating emissions from project finance and debt investments with known use of proceeds using the average data method
Company A is an investment bank. It makes debt investments in a number of companies for specific projects (such as
building a new power plant). This is the first year Company A has carried out a scope 3 inventory and due to time and
resource constraints, it decided not to engage with the investee companies, but instead wants to use secondary data to
estimate emissions. Company A states that it will consider engagement with investee companies in future years.
Company A collects data from its internal data management system. The information is summarized as follows:
Type of project
Project phase
Project con-struction cost or project revenue in reporting year ($ million)
Relevant EEIO sector
EEIO emission factor (scope 1 and scope 2 emissions only) (tonnes CO2e / $ millions)
Share of total project costs (value of debt investment / total equity plus debt) (percent)
Bridge Construc-tion
20 Other non-residential structures
310 7
Hospital Construc-tion
8 Construction of non-residential com-mercial and health care structures
325 10
Paper man-ufacturing facility
Operation 3 Paper mills 500 5
Coal-fired power plant
Operation 15 Power generation and supply
9,000 5
Note: The activity data and emissions factors are illustrative only, and do not refer to actual data.
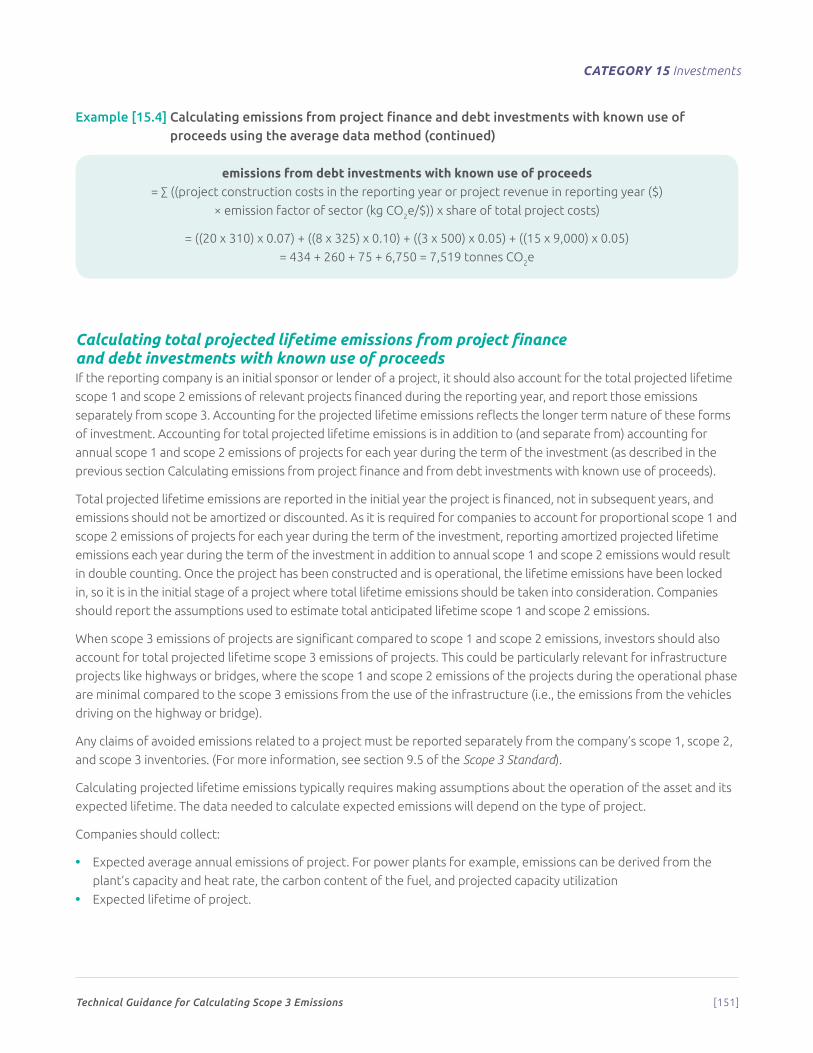
Technical Guidance for Calculating Scope 3 Emissions [151]
CATEGORY 15 Investments
Example [15.4] Calculating emissions from project finance and debt investments with known use of proceeds using the average data method (continued)
emissions from debt investments with known use of proceeds= ∑ ((project construction costs in the reporting year or project revenue in reporting year ($)
× emission factor of sector (kg CO2e/$)) x share of total project costs)
= ((20 x 310) x 0.07) + ((8 x 325) x 0.10) + ((3 x 500) x 0.05) + ((15 x 9,000) x 0.05)
= 434 + 260 + 75 + 6,750 = 7,519 tonnes CO2e
Calculating total projected lifetime emissions from project finance and debt investments with known use of proceedsIf the reporting company is an initial sponsor or lender of a project, it should also account for the total projected lifetime
scope 1 and scope 2 emissions of relevant projects financed during the reporting year, and report those emissions
separately from scope 3. Accounting for the projected lifetime emissions reflects the longer term nature of these forms
of investment. Accounting for total projected lifetime emissions is in addition to (and separate from) accounting for
annual scope 1 and scope 2 emissions of projects for each year during the term of the investment (as described in the
previous section Calculating emissions from project finance and from debt investments with known use of proceeds).
Total projected lifetime emissions are reported in the initial year the project is financed, not in subsequent years, and
emissions should not be amortized or discounted. As it is required for companies to account for proportional scope 1 and
scope 2 emissions of projects for each year during the term of the investment, reporting amortized projected lifetime
emissions each year during the term of the investment in addition to annual scope 1 and scope 2 emissions would result
in double counting. Once the project has been constructed and is operational, the lifetime emissions have been locked
in, so it is in the initial stage of a project where total lifetime emissions should be taken into consideration. Companies
should report the assumptions used to estimate total anticipated lifetime scope 1 and scope 2 emissions.
When scope 3 emissions of projects are significant compared to scope 1 and scope 2 emissions, investors should also
account for total projected lifetime scope 3 emissions of projects. This could be particularly relevant for infrastructure
projects like highways or bridges, where the scope 1 and scope 2 emissions of the projects during the operational phase
are minimal compared to the scope 3 emissions from the use of the infrastructure (i.e., the emissions from the vehicles
driving on the highway or bridge).
Any claims of avoided emissions related to a project must be reported separately from the company’s scope 1, scope 2,
and scope 3 inventories. (For more information, see section 9.5 of the Scope 3 Standard).
Calculating projected lifetime emissions typically requires making assumptions about the operation of the asset and its
expected lifetime. The data needed to calculate expected emissions will depend on the type of project.
Companies should collect:
• Expected average annual emissions of project. For power plants for example, emissions can be derived from the
plant’s capacity and heat rate, the carbon content of the fuel, and projected capacity utilization
• Expected lifetime of project.
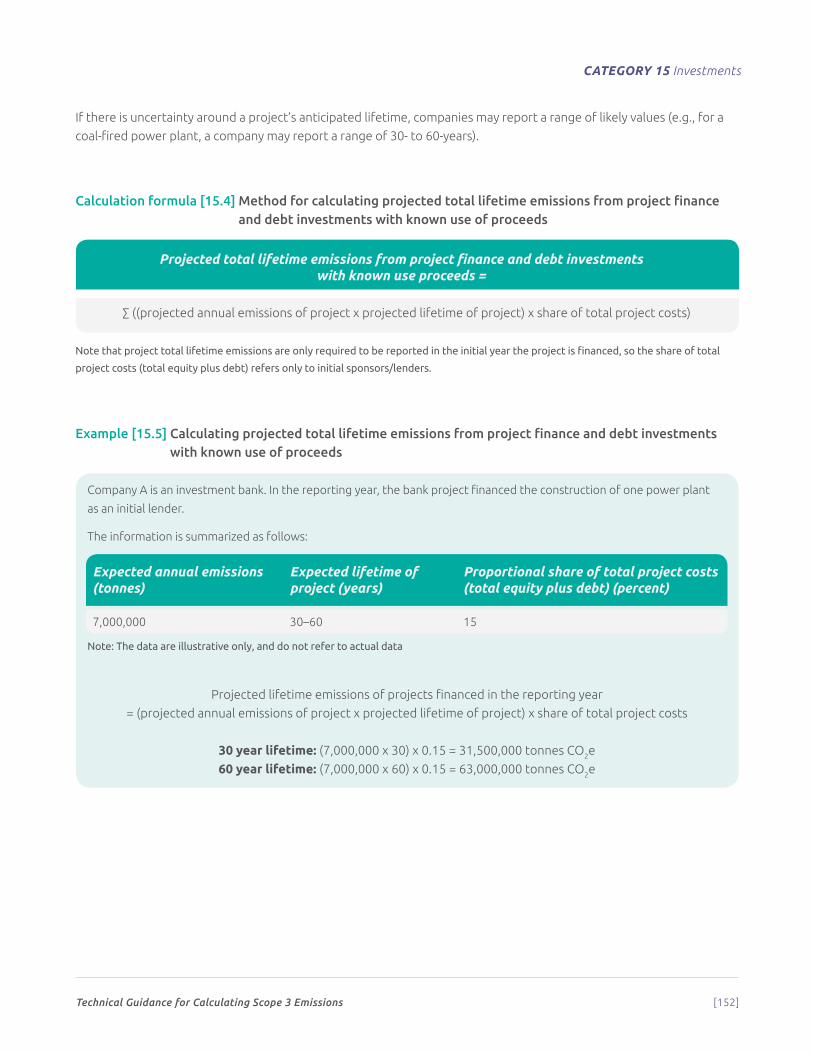
Technical Guidance for Calculating Scope 3 Emissions [152]
CATEGORY 15 Investments
If there is uncertainty around a project’s anticipated lifetime, companies may report a range of likely values (e.g., for a
coal-fired power plant, a company may report a range of 30- to 60-years).
Calculation formula [15.4] Method for calculating projected total lifetime emissions from project finance and debt investments with known use of proceeds
Projected total lifetime emissions from project finance and debt investments with known use proceeds =
∑ ((projected annual emissions of project x projected lifetime of project) x share of total project costs)
Note that project total lifetime emissions are only required to be reported in the initial year the project is financed, so the share of total
project costs (total equity plus debt) refers only to initial sponsors/lenders.
Example [15.5] Calculating projected total lifetime emissions from project finance and debt investments with known use of proceeds
Company A is an investment bank. In the reporting year, the bank project financed the construction of one power plant
as an initial lender.
The information is summarized as follows:
Expected annual emissions (tonnes)
Expected lifetime of project (years)
Proportional share of total project costs (total equity plus debt) (percent)
7,000,000 30–60 15
Note: The data are illustrative only, and do not refer to actual data
Projected lifetime emissions of projects financed in the reporting year
= (projected annual emissions of project x projected lifetime of project) x share of total project costs
30 year lifetime: (7,000,000 x 30) x 0.15 = 31,500,000 tonnes CO2e
60 year lifetime: (7,000,000 x 60) x 0.15 = 63,000,000 tonnes CO2e
Technical Guidance for Calculating Scope 3 Emissions [153]
A
Appendix A: Sampling
A company needing to collect a large quantity of data for a particular scope 3 category
mayfinditimpracticalorimpossibletocollectthedatafromeachactivityinthe
category. In such cases, companies may use appropriate sampling techniques to
extrapolate data from a representative sample of activities within the category.
Companies may also choose to categorize activities into similar groups for data collection. This strategy should group
activities with similar anticipated emissions intensities. For example:
• Companies with a large number of leased assets (Categories 8 and 13) or franchises (Category 14) may group
buildings by building type or floor area and vehicles by vehicle type
• Companies with a large number of employees collecting data on employee commuting (Category 7) may wish to
extrapolate data from a representative sample of employees
• Companies with a large number of distribution channels may use sampling when calculating the emissions
associated with Categories 4 and 9 (Transportation and Distribution).
Companies should choose a sampling method that aligns with their business goals and document and justify their
choice. The choice of sampling method will depend on factors including, but not limited to:
• Available resources
• Number of data points
• Expected level of homogeneity between samples
• Geographical spread of data points
• Ease of data collection
• Timeframe available.
Ultimately, the use of sampling and choice of a specific sampling method aims to optimize the trade-off between cost
and accurately representing all emission sources in the scope 3 category. Companies may use a variety of sampling
methods, as appropriate for each specific emissions activity.
Technical Guidance for Calculating Scope 3 Emissions [154]
APPENDIX A Sampling
Sampling methodsSampling methods available to companies include, but are not limited to:
• Simple random sampling
• Systematic sampling
• Stratified sampling
Each approach is summarized below. Alternative methods for sampling may also be used.
Simple Random SamplingSimple random sampling involves randomly selecting activities (i.e., a sample) from a larger set of activities (i.e., the
entire population).
If the total number of activities from which a sample is selected is small, simple random sampling may be performed at
its most basic level by selecting activities at random. If the total number of activities is large, for example with hundreds
or thousands of activities, then random sampling is better performed by computer.
Advantages of simple random sampling include:
• With an appropriate sample size, simple random sampling creates a representative view of the entire population.
(For example, if a company has fifty employees located within a close geographical area and wants to determine
the average commuting distance, it may choose to collect data from ten randomly selected employees as a
representative sample.)
• It is relatively straightforward to construct the sample.
Disadvantages of simple random sampling include:
• The sample size needed to generate appropriately representative results may be prohibitively large and
cumbersome to sample. (For example, if a retail organization has thousands of stores in many countries, randomly
selecting individual stores may result in a difficult and time-consuming data collection process.)
• It may not be possible to obtain a complete list of all activities from the sample size, which is a prerequisite for
simple random sampling. (For example, if a distribution company wants to determine the average backhaul capacity
of its trucks, it would have to list every journey before a random sample could be selected.)
Systematic SamplingSystematic sampling involves randomly selecting the first item to sample and then selecting subsequent activities at
regular intervals.
An appropriate sampling interval should be chosen so that the company achieves the desired sample size. For example,
if a company sourced agricultural products from 100 farms but only wanted to sample 20 farms, an appropriate
sampling interval would be every 5 farms. If the first farm to be sampled was picked as Farm 3, the company would
subsequently sample from Farms 8, 13, 18, 23,…, 93, 98.
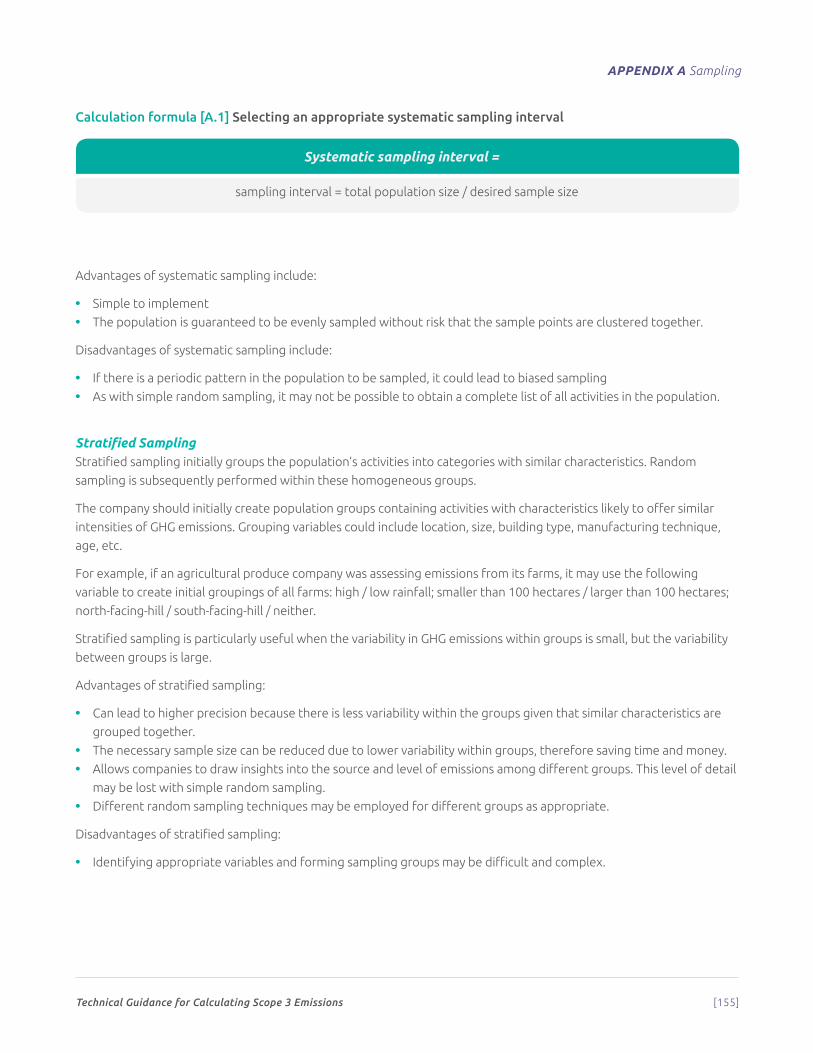
Technical Guidance for Calculating Scope 3 Emissions [155]
APPENDIX A Sampling
Calculation formula [A.1] Selecting an appropriate systematic sampling interval
Systematic sampling interval =
sampling interval = total population size / desired sample size
Advantages of systematic sampling include:
• Simple to implement
• The population is guaranteed to be evenly sampled without risk that the sample points are clustered together.
Disadvantages of systematic sampling include:
• If there is a periodic pattern in the population to be sampled, it could lead to biased sampling
• As with simple random sampling, it may not be possible to obtain a complete list of all activities in the population.
Stratified SamplingStratified sampling initially groups the population’s activities into categories with similar characteristics. Random
sampling is subsequently performed within these homogeneous groups.
The company should initially create population groups containing activities with characteristics likely to offer similar
intensities of GHG emissions. Grouping variables could include location, size, building type, manufacturing technique,
age, etc.
For example, if an agricultural produce company was assessing emissions from its farms, it may use the following
variable to create initial groupings of all farms: high / low rainfall; smaller than 100 hectares / larger than 100 hectares;
north-facing-hill / south-facing-hill / neither.
Stratified sampling is particularly useful when the variability in GHG emissions within groups is small, but the variability
between groups is large.
Advantages of stratified sampling:
• Can lead to higher precision because there is less variability within the groups given that similar characteristics are
grouped together.
• The necessary sample size can be reduced due to lower variability within groups, therefore saving time and money.
• Allows companies to draw insights into the source and level of emissions among different groups. This level of detail
may be lost with simple random sampling.
• Different random sampling techniques may be employed for different groups as appropriate.
Disadvantages of stratified sampling:
• Identifying appropriate variables and forming sampling groups may be difficult and complex.
Technical Guidance for Calculating Scope 3 Emissions [156]
APPENDIX A Sampling
Sample SizeDetermining sample size is fundamental to any sampling activity. The choice of sample size will be influenced by several
factors, including the likely significance of GHG emissions from the sources in question, the size of the population, the
variability of the emission sources, and the necessary degree of precision.
Determining sample sizeThere are several approaches to determining sample size. In particular, four alternative approaches may prove useful
for companies:
• Using the sample size of a similar inventory
• Using online calculators
• Using published tables
• Using formulas.
Using the sample size of a similar inventoryCompanies may refer to similar inventories for guidance on appropriate sample size and sampling technique. When using
this approach, companies should justify the similarity and appropriateness for the comparison. Companies may refer to
similar inventories that have been externally verified for guidance on appropriate sample size and sampling technique.
Using online calculatorsOnline calculators are a quick and easy way to assess sample size.
For example:
• http://www.research-advisors.com/tools/SampleSize.htm provides a downloadable spreadsheet to calculate
necessary sample size with the ability to tailor the sampling criteria.
• http://www.surveysystem.com/sscalc.htm provides an interactive online calculator for sample size; however, the
choices for confidence level are fixed.
Using published tablesMany published tables give the necessary sample size for a specific set of criteria. Such criteria include precision,
confidence levels, and variability for a given population size.
Users should refer to standard statistics texts or search online for a table matching their specific sampling criteria.
Using formulasCompanies that want greater assurance for their choice of sample size may turn to established formulas. Formulas for
the calculation of sample size are available in all standard statistics and sampling text books, as well as via the internet.
When applying sample size formulas, users may find it advantageous to seek the advice of a person with experience of
statistics.

Technical Guidance for Calculating Scope 3 Emissions [157]
APPENDIX A Sampling
Level of accuracyThe level of accuracy is related to the sample size, sampling strategy, and the measurement system. Assuming a
normal distribution, increasing the sample size is likely to reduce the sampling error using the relationship v = √n. In this
relationship “v” represents the variability of the data values. It is important to recognize that all measurements contain
some level of uncertainty. An estimate of the measurement uncertainty should be obtained, particularly for parts of the
assessment that contribute significantly to the organization and/ or if subsequent investment decisions are made based
on the measurement.
Confidence levelAn estimate of the uncertainty, which should include both precision and bias from random error and systematic error
respectively, will enable an interpretation of the measurement. For example, a level of uncertainty of ±5 percent would
imply for an emissions estimate of 100 tonnes CO2e, that the actual emissions lie somewhere between 95 and 105
tonnes CO2e. The confidence level associated with the uncertainty normally corresponds to a 95 percent confidence
level, that is, 2 standard deviations. For example, the true value lies in the range of 95 and 105 tonnes with 95 percent
confidence.
VariabilityVariability refers to the degree of difference between activities within the population. A population that is more
heterogeneous (more variable) will require a larger sample size. A variability of 50 percent is the maximum level of
variability in a population. Therefore, a variability assumption of 0.5 is often used as a conservative estimate.
Technical Guidance for Calculating Scope 3 Emissions [158]
B
Appendix B:Scenario uncertainty in calculating emissions from the use of sold products
S cenario uncertainty assessment (also known as sensitivity analysis) is a useful tool
to understand how changes in the product’s design, use, and disposal could impact
inventory results. It can be thought of as the impact of potential situations other
than the conditions and assumptions made in the product’s inventory results and report.
Example [B.1] Scenario analysis: measuring uncertainty in calculating emissions from the use of sold products
Company A produces electric fans for residential consumers. The electric fan has a wattage of 300. Company data
indicates that consumers use the electric fan an average of 40 days a year, with an average use of 6 hours/day for a total
of 5 years of use before disposing of the fan.
To calculate use-phase emissions, the company made the following calculations:
total lifetime usage = 40 x 6 x 5 = 1,200 hours
CO2e emissions per hour of use = wattage x electricity grid factor = 300 x 0.45 = 0.135 kg CO2e/hour use
the company sold 1,000 units in the reporting year, so total use-phase emissions for the reporting company
= 1,200 x 0.135 x 1,000 = 162,000 kg CO2e = 162 tonnes CO2e
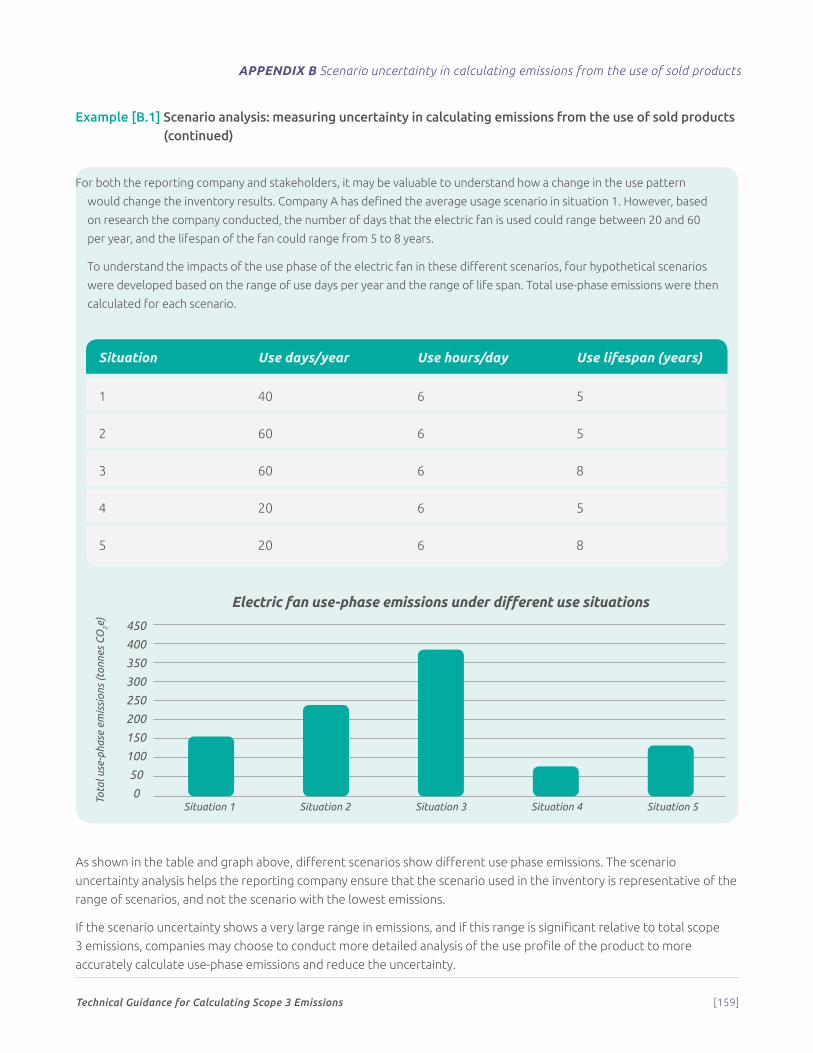
Technical Guidance for Calculating Scope 3 Emissions [159]
APPENDIX B Scenario uncertainty in calculating emissions from the use of sold products
Example [B.1] Scenario analysis: measuring uncertainty in calculating emissions from the use of sold products (continued)
For both the reporting company and stakeholders, it may be valuable to understand how a change in the use pattern
would change the inventory results. Company A has defined the average usage scenario in situation 1. However, based
on research the company conducted, the number of days that the electric fan is used could range between 20 and 60
per year, and the lifespan of the fan could range from 5 to 8 years.
To understand the impacts of the use phase of the electric fan in these different scenarios, four hypothetical scenarios
were developed based on the range of use days per year and the range of life span. Total use-phase emissions were then
calculated for each scenario.
Situation Use days/year Use hours/day Use lifespan (years)
1 40 6 5
2 60 6 5
3 60 6 8
4 20 6 5
5 20 6 8
As shown in the table and graph above, different scenarios show different use phase emissions. The scenario
uncertainty analysis helps the reporting company ensure that the scenario used in the inventory is representative of the
range of scenarios, and not the scenario with the lowest emissions.
If the scenario uncertainty shows a very large range in emissions, and if this range is significant relative to total scope
3 emissions, companies may choose to conduct more detailed analysis of the use profile of the product to more
accurately calculate use-phase emissions and reduce the uncertainty.
Situation 1 Situation 2 Situation 3 Situation 4 Situation 5
450
400
350
300
250
200
150
100
50
0
Electric fan use-phase emissions under different use situations
Tota
l use
-pha
se e
mis
sion
s (t
onne
s CO
2e)
Technical Guidance for Calculating Scope 3 Emissions [160]
C
Appendix C: Calculating emissions intensity metrics
T he Scope 3 Standard states that companies may report emissions intensity metrics
to avoid misinterpretation of emission results as more durable products with longer
lifetimeswouldatfirstappeartohavehigherlifetimeuse-phaseemissions.
To convert absolute emissions to an emissions intensity metric, companies should calculate emissions per a relevant
unit of measure. Examples of emissions intensity metrics are given in table C.1.
Table [C.1] Examples of emissions intensity metrics using different units of measure
Product Emissions intensity metric
Can of cola kg CO2e per 330ml can
Washing machine kg CO2e per wash
Television kg CO2e per hour of viewing
Car kg CO2e per kilometer driven
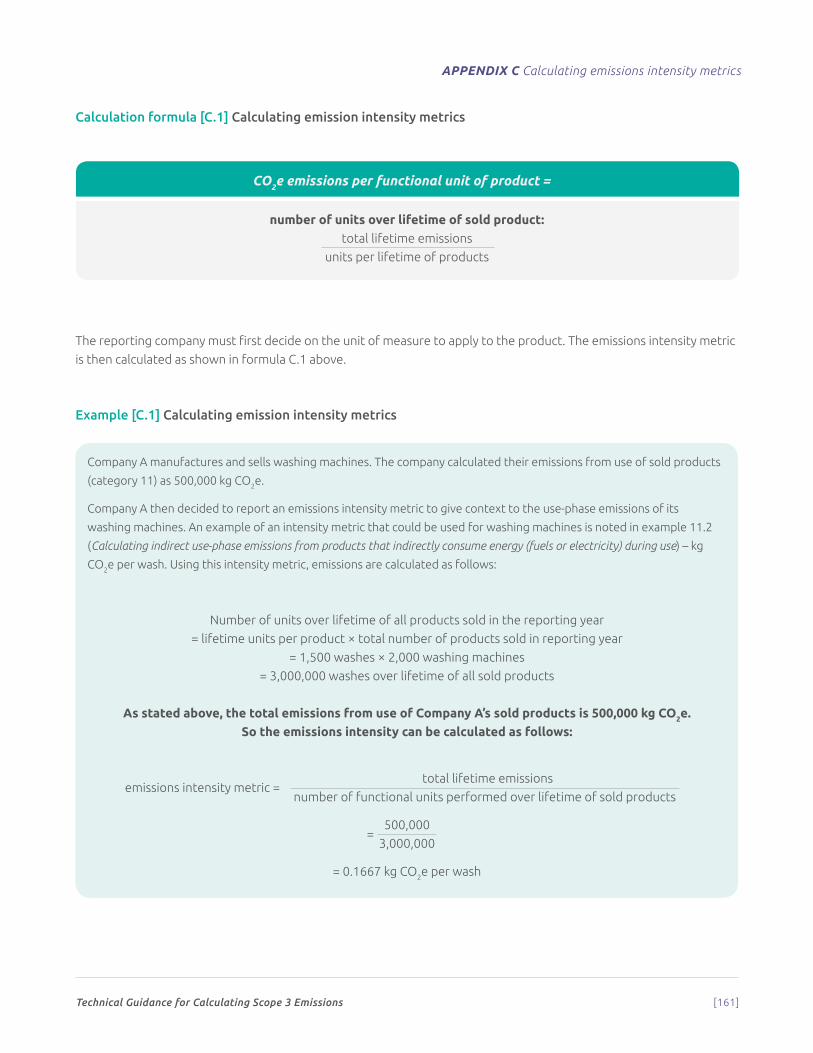
Technical Guidance for Calculating Scope 3 Emissions [161]
APPENDIX C Calculating emissions intensity metrics
Calculation formula [C.1] Calculating emission intensity metrics
CO2e emissions per functional unit of product =
number of units over lifetime of sold product:total lifetime emissions
units per lifetime of products
The reporting company must first decide on the unit of measure to apply to the product. The emissions intensity metric
is then calculated as shown in formula C.1 above.
Example [C.1] Calculating emission intensity metrics
Company A manufactures and sells washing machines. The company calculated their emissions from use of sold products
(category 11) as 500,000 kg CO2e.
Company A then decided to report an emissions intensity metric to give context to the use-phase emissions of its
washing machines. An example of an intensity metric that could be used for washing machines is noted in example 11.2
(Calculating indirect use-phase emissions from products that indirectly consume energy (fuels or electricity) during use) – kg
CO2e per wash. Using this intensity metric, emissions are calculated as follows:
Number of units over lifetime of all products sold in the reporting year
= lifetime units per product × total number of products sold in reporting year
= 1,500 washes × 2,000 washing machines
= 3,000,000 washes over lifetime of all sold products
As stated above, the total emissions from use of Company A’s sold products is 500,000 kg CO2e. So the emissions intensity can be calculated as follows:
total lifetime emissions
number of functional units performed over lifetime of sold products
500,000
3,000,000
= 0.1667 kg CO2e per wash
=
emissions intensity metric =
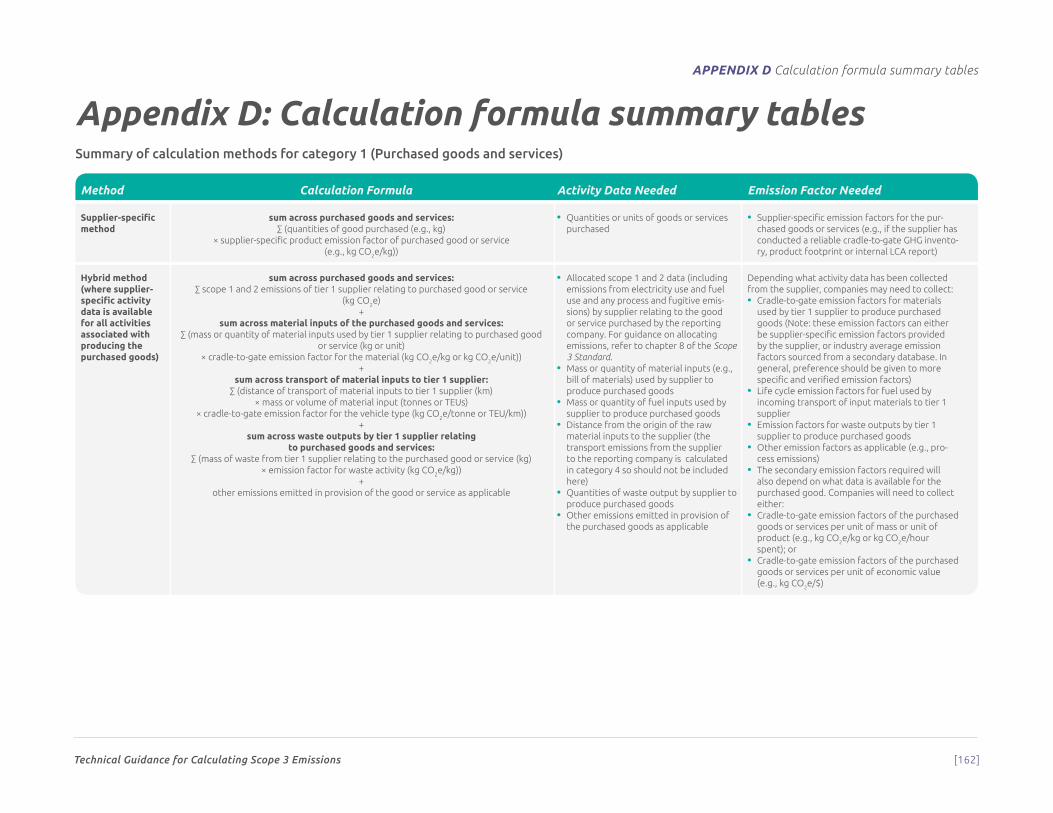
Appendix d Calculation formula summary tables
Technical Guidance for Calculating Scope 3 Emissions [162]
Appendix D: Calculation formula summary tablesSummary of calculation methods for category 1 (Purchased goods and services)
Method Calculation Formula Activity Data Needed Emission Factor Needed
Supplier-specific method
sum across purchased goods and services:∑ (quantities of good purchased (e.g., kg)
× supplier-specific product emission factor of purchased good or service (e.g., kg CO2e/kg))
• Quantities or units of goods or services purchased
• Supplier-specific emission factors for the pur-chased goods or services (e.g., if the supplier has conducted a reliable cradle-to-gate GHG invento-ry, product footprint or internal LCA report)
Hybrid method (where supplier- specific activity data is available for all activities associated with producing the purchased goods)
sum across purchased goods and services:∑ scope 1 and 2 emissions of tier 1 supplier relating to purchased good or service
(kg CO2e)
+ sum across material inputs of the purchased goods and services:
∑ (mass or quantity of material inputs used by tier 1 supplier relating to purchased good or service (kg or unit)
× cradle-to-gate emission factor for the material (kg CO2e/kg or kg CO2e/unit))+
sum across transport of material inputs to tier 1 supplier:∑ (distance of transport of material inputs to tier 1 supplier (km)
× mass or volume of material input (tonnes or TEUs) × cradle-to-gate emission factor for the vehicle type (kg CO2e/tonne or TEU/km))
+sum across waste outputs by tier 1 supplier relating
to purchased goods and services:∑ (mass of waste from tier 1 supplier relating to the purchased good or service (kg)
× emission factor for waste activity (kg CO2e/kg))+
other emissions emitted in provision of the good or service as applicable
• Allocated scope 1 and 2 data (including emissions from electricity use and fuel use and any process and fugitive emis-sions) by supplier relating to the good or service purchased by the reporting company. For guidance on allocating emissions, refer to chapter 8 of the Scope 3 Standard.
• Mass or quantity of material inputs (e.g., bill of materials) used by supplier to produce purchased goods
• Mass or quantity of fuel inputs used by supplier to produce purchased goods
• Distance from the origin of the raw material inputs to the supplier (the transport emissions from the supplier to the reporting company is calculated in category 4 so should not be included here)
• Quantities of waste output by supplier to produce purchased goods
• Other emissions emitted in provision of the purchased goods as applicable
Depending what activity data has been collected from the supplier, companies may need to collect:• Cradle-to-gate emission factors for materials
used by tier 1 supplier to produce purchased goods (Note: these emission factors can either be supplier-specific emission factors provided by the supplier, or industry average emission factors sourced from a secondary database. In general, preference should be given to more specific and verified emission factors)
• Life cycle emission factors for fuel used by incoming transport of input materials to tier 1 supplier
• Emission factors for waste outputs by tier 1 supplier to produce purchased goods
• Other emission factors as applicable (e.g., pro-cess emissions)
• The secondary emission factors required will also depend on what data is available for the purchased good. Companies will need to collect either:
• Cradle-to-gate emission factors of the purchased goods or services per unit of mass or unit of product (e.g., kg CO2e/kg or kg CO2e/hour spent); or
• Cradle-to-gate emission factors of the purchased goods or services per unit of economic value (e.g., kg CO2e/$)
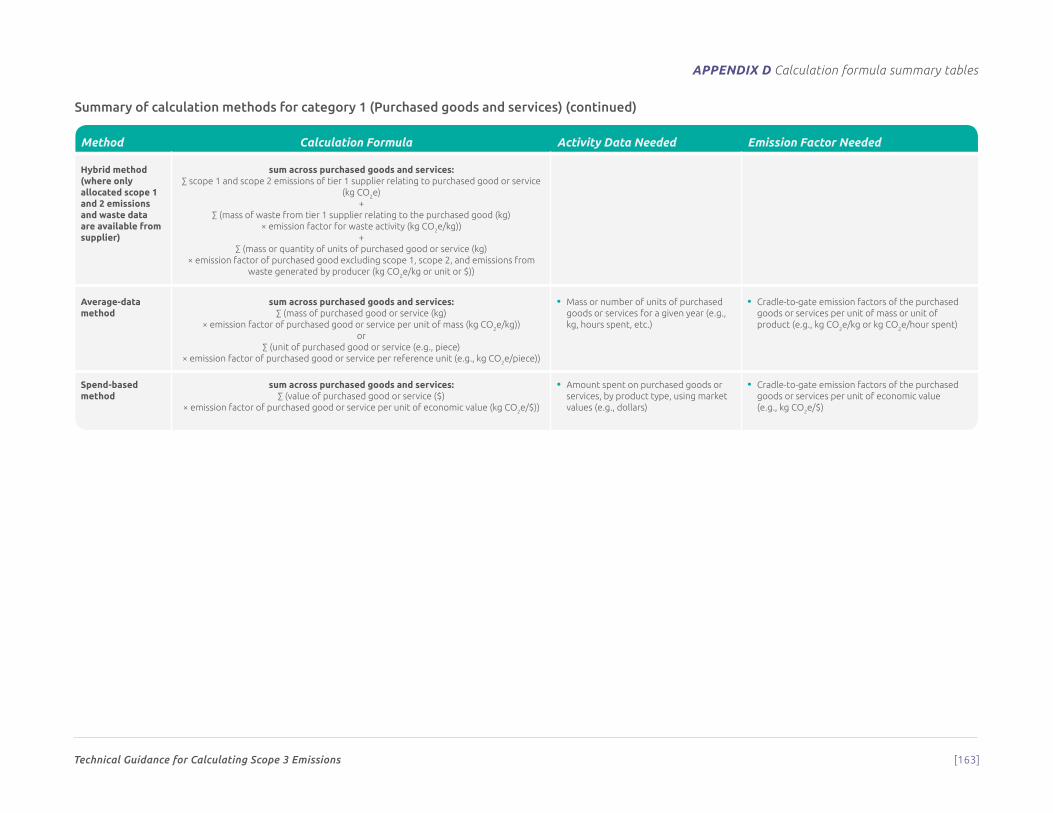
Appendix d Calculation formula summary tables
Technical Guidance for Calculating Scope 3 Emissions [163]
Method Calculation Formula Activity Data Needed Emission Factor Needed
Hybrid method (where only allocated scope 1 and 2 emissions and waste data are available from supplier)
sum across purchased goods and services:∑ scope 1 and scope 2 emissions of tier 1 supplier relating to purchased good or service
(kg CO2e)+
∑ (mass of waste from tier 1 supplier relating to the purchased good (kg)× emission factor for waste activity (kg CO2e/kg))
+∑ (mass or quantity of units of purchased good or service (kg)
× emission factor of purchased good excluding scope 1, scope 2, and emissions from waste generated by producer (kg CO2e/kg or unit or $))
Average-data method
sum across purchased goods and services:∑ (mass of purchased good or service (kg)
× emission factor of purchased good or service per unit of mass (kg CO2e/kg))or
∑ (unit of purchased good or service (e.g., piece)× emission factor of purchased good or service per reference unit (e.g., kg CO2e/piece))
• Mass or number of units of purchased goods or services for a given year (e.g., kg, hours spent, etc.)
• Cradle-to-gate emission factors of the purchased goods or services per unit of mass or unit of product (e.g., kg CO2e/kg or kg CO2e/hour spent)
Spend-based method
sum across purchased goods and services:∑ (value of purchased good or service ($)
× emission factor of purchased good or service per unit of economic value (kg CO2e/$))
• Amount spent on purchased goods or services, by product type, using market values (e.g., dollars)
• Cradle-to-gate emission factors of the purchased goods or services per unit of economic value (e.g., kg CO2e/$)
Summary of calculation methods for category 1 (Purchased goods and services) (continued)
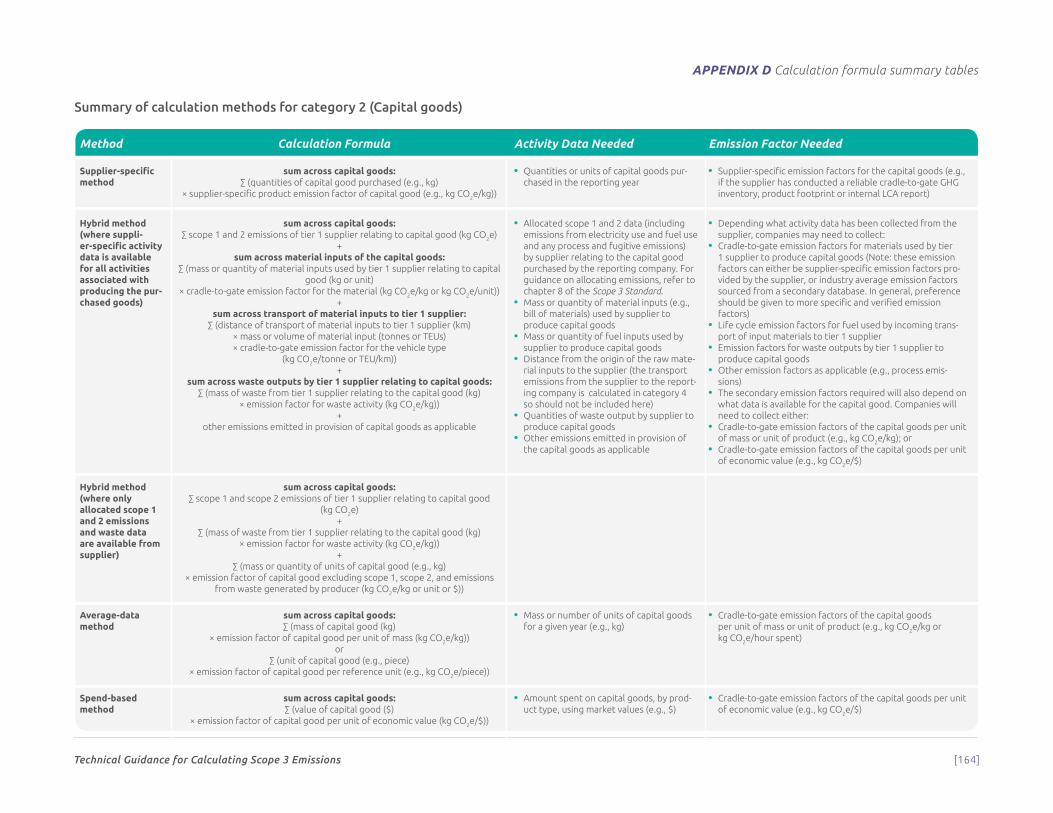
Appendix d Calculation formula summary tables
Technical Guidance for Calculating Scope 3 Emissions [164]
Summary of calculation methods for category 2 (Capital goods)
Method Calculation Formula Activity Data Needed Emission Factor Needed
Supplier-specific method
sum across capital goods:∑ (quantities of capital good purchased (e.g., kg)
× supplier-specific product emission factor of capital good (e.g., kg CO2e/kg))
• Quantities or units of capital goods pur-chased in the reporting year
• Supplier-specific emission factors for the capital goods (e.g., if the supplier has conducted a reliable cradle-to-gate GHG inventory, product footprint or internal LCA report)
Hybrid method (where suppli-er-specific activity data is available for all activities associated with producing the pur-chased goods)
sum across capital goods:∑ scope 1 and 2 emissions of tier 1 supplier relating to capital good (kg CO2e)
+ sum across material inputs of the capital goods:
∑ (mass or quantity of material inputs used by tier 1 supplier relating to capital good (kg or unit)
× cradle-to-gate emission factor for the material (kg CO2e/kg or kg CO2e/unit))+
sum across transport of material inputs to tier 1 supplier:∑ (distance of transport of material inputs to tier 1 supplier (km)
× mass or volume of material input (tonnes or TEUs) × cradle-to-gate emission factor for the vehicle type
(kg CO2e/tonne or TEU/km))+
sum across waste outputs by tier 1 supplier relating to capital goods:∑ (mass of waste from tier 1 supplier relating to the capital good (kg)
× emission factor for waste activity (kg CO2e/kg))+
other emissions emitted in provision of capital goods as applicable
• Allocated scope 1 and 2 data (including emissions from electricity use and fuel use and any process and fugitive emissions) by supplier relating to the capital good purchased by the reporting company. For guidance on allocating emissions, refer to chapter 8 of the Scope 3 Standard.
• Mass or quantity of material inputs (e.g., bill of materials) used by supplier to produce capital goods
• Mass or quantity of fuel inputs used by supplier to produce capital goods
• Distance from the origin of the raw mate-rial inputs to the supplier (the transport emissions from the supplier to the report-ing company is calculated in category 4 so should not be included here)
• Quantities of waste output by supplier to produce capital goods
• Other emissions emitted in provision of the capital goods as applicable
• Depending what activity data has been collected from the supplier, companies may need to collect:
• Cradle-to-gate emission factors for materials used by tier 1 supplier to produce capital goods (Note: these emission factors can either be supplier-specific emission factors pro-vided by the supplier, or industry average emission factors sourced from a secondary database. In general, preference should be given to more specific and verified emission factors)
• Life cycle emission factors for fuel used by incoming trans-port of input materials to tier 1 supplier
• Emission factors for waste outputs by tier 1 supplier to produce capital goods
• Other emission factors as applicable (e.g., process emis-sions)
• The secondary emission factors required will also depend on what data is available for the capital good. Companies will need to collect either:
• Cradle-to-gate emission factors of the capital goods per unit of mass or unit of product (e.g., kg CO2e/kg); or
• Cradle-to-gate emission factors of the capital goods per unit of economic value (e.g., kg CO2e/$)
Hybrid method (where only allocated scope 1 and 2 emissions and waste data are available from supplier)
sum across capital goods:∑ scope 1 and scope 2 emissions of tier 1 supplier relating to capital good
(kg CO2e)+
∑ (mass of waste from tier 1 supplier relating to the capital good (kg)× emission factor for waste activity (kg CO2e/kg))
+∑ (mass or quantity of units of capital good (e.g., kg)
× emission factor of capital good excluding scope 1, scope 2, and emissions from waste generated by producer (kg CO2e/kg or unit or $))
Average-data method
sum across capital goods:∑ (mass of capital good (kg)
× emission factor of capital good per unit of mass (kg CO2e/kg))or
∑ (unit of capital good (e.g., piece)× emission factor of capital good per reference unit (e.g., kg CO2e/piece))
• Mass or number of units of capital goods for a given year (e.g., kg)
• Cradle-to-gate emission factors of the capital goods per unit of mass or unit of product (e.g., kg CO2e/kg or kg CO2e/hour spent)
Spend-based method
sum across capital goods:∑ (value of capital good ($)
× emission factor of capital good per unit of economic value (kg CO2e/$))
• Amount spent on capital goods, by prod-uct type, using market values (e.g., $)
• Cradle-to-gate emission factors of the capital goods per unit of economic value (e.g., kg CO2e/$)
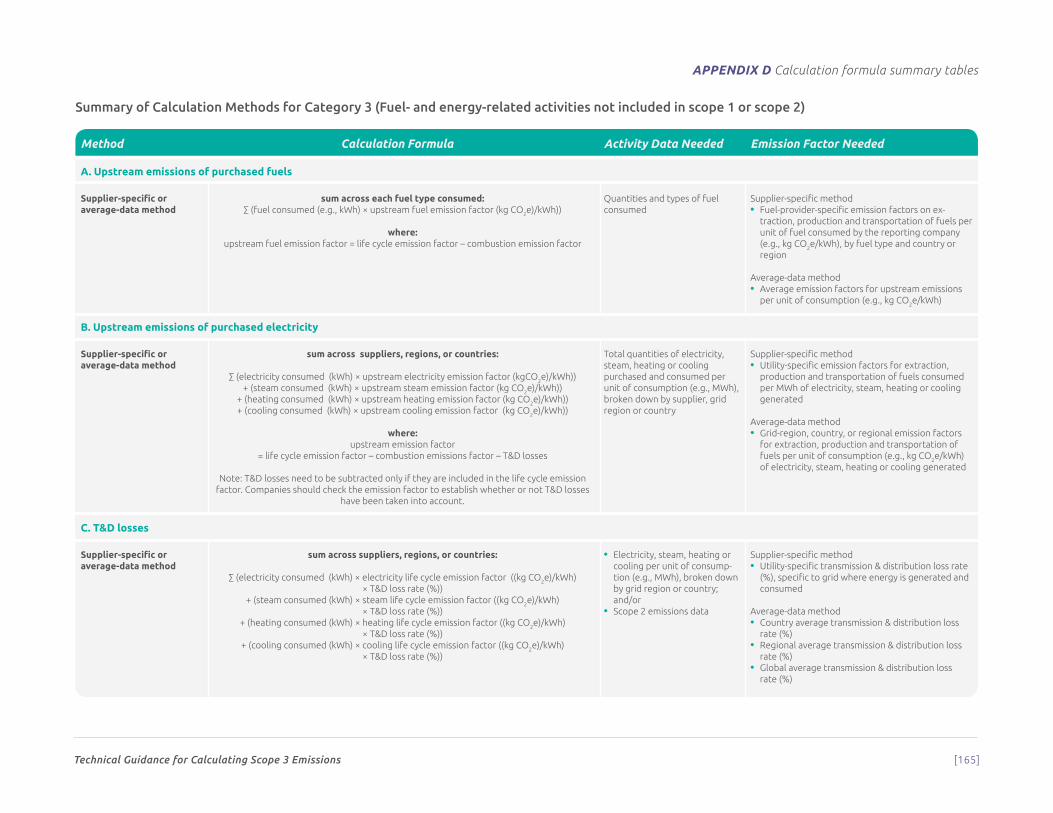
Appendix d Calculation formula summary tables
Technical Guidance for Calculating Scope 3 Emissions [165]
Summary of Calculation Methods for Category 3 (Fuel- and energy-related activities not included in scope 1 or scope 2)
Method Calculation Formula Activity Data Needed Emission Factor Needed
A. Upstream emissions of purchased fuels
Supplier-specific or average-data method
sum across each fuel type consumed:∑ (fuel consumed (e.g., kWh) × upstream fuel emission factor (kg CO2e)/kWh))
where:upstream fuel emission factor = life cycle emission factor – combustion emission factor
Quantities and types of fuel consumed
Supplier-specific method• Fuel-provider-specific emission factors on ex-
traction, production and transportation of fuels per unit of fuel consumed by the reporting company (e.g., kg CO2e/kWh), by fuel type and country or region
Average-data method• Average emission factors for upstream emissions
per unit of consumption (e.g., kg CO2e/kWh)
B. Upstream emissions of purchased electricity
Supplier-specific or average-data method
sum across suppliers, regions, or countries:
∑ (electricity consumed (kWh) × upstream electricity emission factor (kgCO2e)/kWh))+ (steam consumed (kWh) × upstream steam emission factor (kg CO2e)/kWh))
+ (heating consumed (kWh) × upstream heating emission factor (kg CO2e)/kWh))+ (cooling consumed (kWh) × upstream cooling emission factor (kg CO2e)/kWh))
where:upstream emission factor
= life cycle emission factor – combustion emissions factor – T&D losses
Note: T&D losses need to be subtracted only if they are included in the life cycle emission factor. Companies should check the emission factor to establish whether or not T&D losses
have been taken into account.
Total quantities of electricity, steam, heating or cooling purchased and consumed per unit of consumption (e.g., MWh), broken down by supplier, grid region or country
Supplier-specific method• Utility-specific emission factors for extraction,
production and transportation of fuels consumed per MWh of electricity, steam, heating or cooling generated
Average-data method• Grid-region, country, or regional emission factors
for extraction, production and transportation of fuels per unit of consumption (e.g., kg CO2e/kWh) of electricity, steam, heating or cooling generated
C. T&D losses
Supplier-specific or average-data method
sum across suppliers, regions, or countries:
∑ (electricity consumed (kWh) × electricity life cycle emission factor ((kg CO2e)/kWh)× T&D loss rate (%))
+ (steam consumed (kWh) × steam life cycle emission factor ((kg CO2e)/kWh) × T&D loss rate (%))
+ (heating consumed (kWh) × heating life cycle emission factor ((kg CO2e)/kWh) × T&D loss rate (%))
+ (cooling consumed (kWh) × cooling life cycle emission factor ((kg CO2e)/kWh) × T&D loss rate (%))
• Electricity, steam, heating or cooling per unit of consump-tion (e.g., MWh), broken down by grid region or country; and/or
• Scope 2 emissions data
Supplier-specific method• Utility-specific transmission & distribution loss rate
(%), specific to grid where energy is generated and consumed
Average-data method• Country average transmission & distribution loss
rate (%)• Regional average transmission & distribution loss
rate (%)• Global average transmission & distribution loss
rate (%)
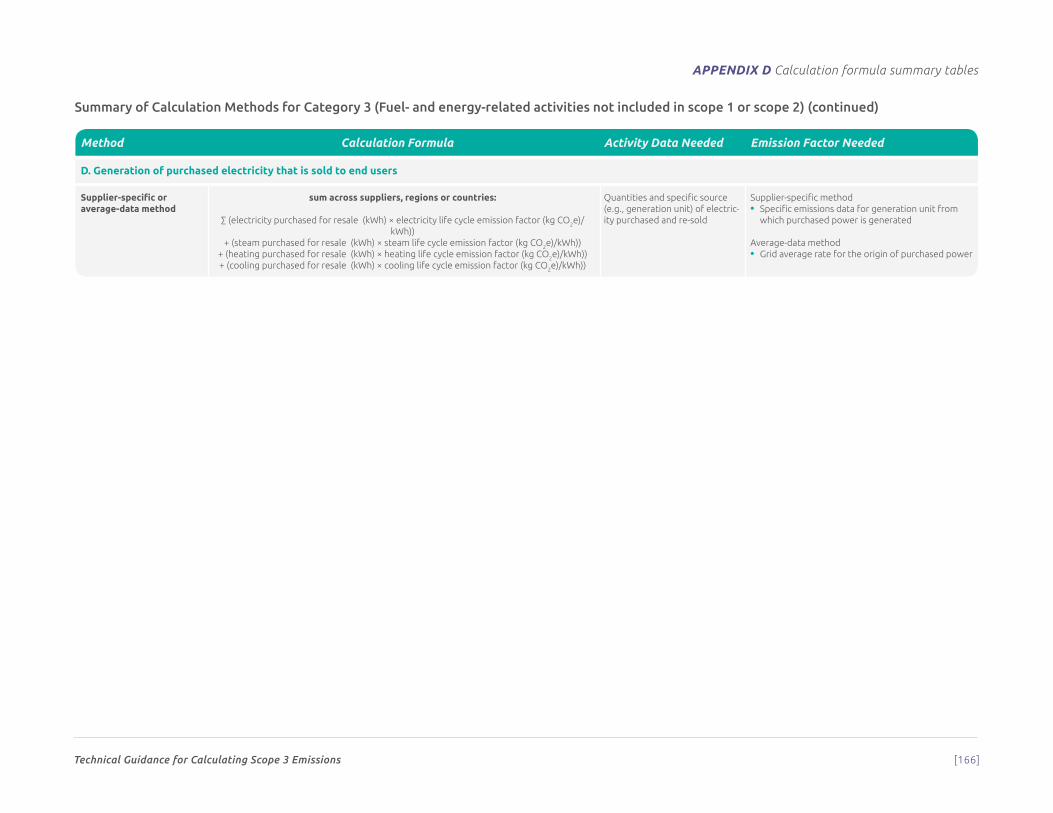
Appendix d Calculation formula summary tables
Technical Guidance for Calculating Scope 3 Emissions [166]
Summary of Calculation Methods for Category 3 (Fuel- and energy-related activities not included in scope 1 or scope 2) (continued)
Method Calculation Formula Activity Data Needed Emission Factor Needed
D. Generation of purchased electricity that is sold to end users
Supplier-specific or average-data method
sum across suppliers, regions or countries:
∑ (electricity purchased for resale (kWh) × electricity life cycle emission factor (kg CO2e)/kWh))
+ (steam purchased for resale (kWh) × steam life cycle emission factor (kg CO2e)/kWh))+ (heating purchased for resale (kWh) × heating life cycle emission factor (kg CO2e)/kWh))+ (cooling purchased for resale (kWh) × cooling life cycle emission factor (kg CO2e)/kWh))
Quantities and specific source (e.g., generation unit) of electric-ity purchased and re-sold
Supplier-specific method • Specific emissions data for generation unit from
which purchased power is generated
Average-data method• Grid average rate for the origin of purchased power
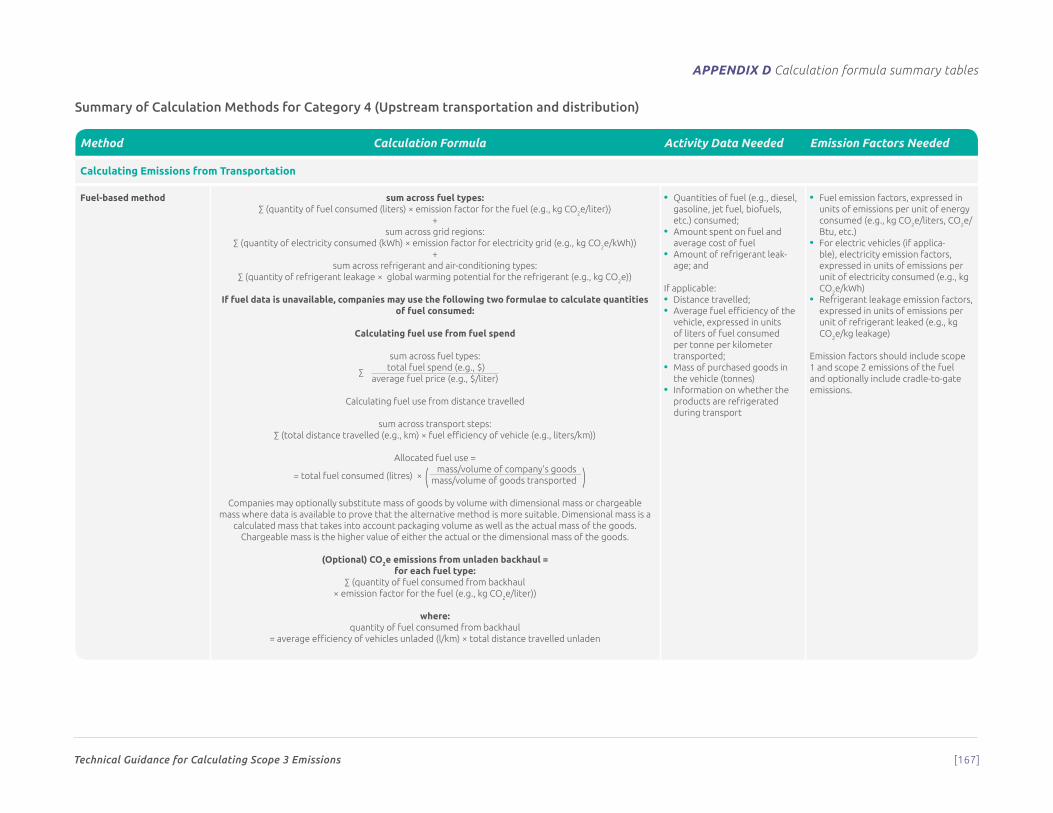
Appendix d Calculation formula summary tables
Technical Guidance for Calculating Scope 3 Emissions [167]
Summary of Calculation Methods for Category 4 (Upstream transportation and distribution)
Method Calculation Formula Activity Data Needed Emission Factors Needed
Calculating Emissions from Transportation
Fuel-based method sum across fuel types:∑ (quantity of fuel consumed (liters) × emission factor for the fuel (e.g., kg CO2e/liter))
+sum across grid regions:
∑ (quantity of electricity consumed (kWh) × emission factor for electricity grid (e.g., kg CO2e/kWh))+
sum across refrigerant and air-conditioning types:∑ (quantity of refrigerant leakage × global warming potential for the refrigerant (e.g., kg CO2e))
If fuel data is unavailable, companies may use the following two formulae to calculate quantities of fuel consumed:
Calculating fuel use from fuel spend
sum across fuel types: total fuel spend (e.g., $)
average fuel price (e.g., $/liter)
Calculating fuel use from distance travelled
sum across transport steps:∑ (total distance travelled (e.g., km) × fuel efficiency of vehicle (e.g., liters/km))
Allocated fuel use =
= total fuel consumed (litres) × mass/volume of company’s goods
mass/volume of goods transported
Companies may optionally substitute mass of goods by volume with dimensional mass or chargeable mass where data is available to prove that the alternative method is more suitable. Dimensional mass is a
calculated mass that takes into account packaging volume as well as the actual mass of the goods.Chargeable mass is the higher value of either the actual or the dimensional mass of the goods.
(Optional) CO2e emissions from unladen backhaul =for each fuel type:
∑ (quantity of fuel consumed from backhaul × emission factor for the fuel (e.g., kg CO2e/liter))
where: quantity of fuel consumed from backhaul
= average efficiency of vehicles unladed (l/km) × total distance travelled unladen
• Quantities of fuel (e.g., diesel, gasoline, jet fuel, biofuels, etc.) consumed;
• Amount spent on fuel and average cost of fuel
• Amount of refrigerant leak-age; and
If applicable:• Distance travelled;• Average fuel efficiency of the
vehicle, expressed in units of liters of fuel consumed per tonne per kilometer transported;
• Mass of purchased goods in the vehicle (tonnes)
• Information on whether the products are refrigerated during transport
• Fuel emission factors, expressed in units of emissions per unit of energy consumed (e.g., kg CO2e/liters, CO2e/Btu, etc.)
• For electric vehicles (if applica-ble), electricity emission factors, expressed in units of emissions per unit of electricity consumed (e.g., kg CO2e/kWh)
• Refrigerant leakage emission factors, expressed in units of emissions per unit of refrigerant leaked (e.g., kg CO2e/kg leakage)
Emission factors should include scope 1 and scope 2 emissions of the fuel and optionally include cradle-to-gate emissions.
∑
( )
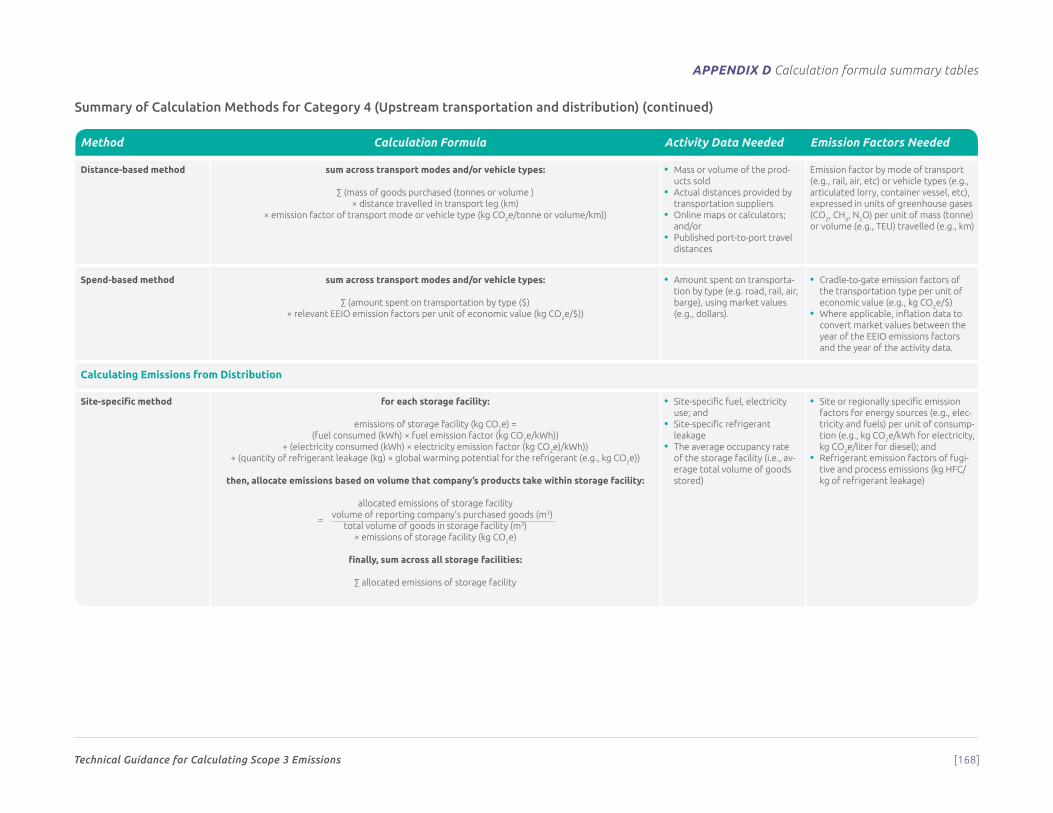
Appendix d Calculation formula summary tables
Technical Guidance for Calculating Scope 3 Emissions [168]
Summary of Calculation Methods for Category 4 (Upstream transportation and distribution) (continued)
Method Calculation Formula Activity Data Needed Emission Factors Needed
Distance-based method sum across transport modes and/or vehicle types:
∑ (mass of goods purchased (tonnes or volume ) × distance travelled in transport leg (km)
× emission factor of transport mode or vehicle type (kg CO2e/tonne or volume/km))
• Mass or volume of the prod-ucts sold
• Actual distances provided by transportation suppliers
• Online maps or calculators; and/or
• Published port-to-port travel distances
Emission factor by mode of transport (e.g., rail, air, etc) or vehicle types (e.g., articulated lorry, container vessel, etc), expressed in units of greenhouse gases (CO2, CH4, N2O) per unit of mass (tonne) or volume (e.g., TEU) travelled (e.g., km)
Spend-based method sum across transport modes and/or vehicle types:
∑ (amount spent on transportation by type ($)× relevant EEIO emission factors per unit of economic value (kg CO2e/$))
• Amount spent on transporta-tion by type (e.g. road, rail, air, barge), using market values (e.g., dollars).
• Cradle-to-gate emission factors of the transportation type per unit of economic value (e.g., kg CO2e/$)
• Where applicable, inflation data to convert market values between the year of the EEIO emissions factors and the year of the activity data.
Calculating Emissions from Distribution
Site-specific method for each storage facility:
emissions of storage facility (kg CO2e) =(fuel consumed (kWh) × fuel emission factor (kg CO2e/kWh))
+ (electricity consumed (kWh) × electricity emission factor (kg CO2e)/kWh))+ (quantity of refrigerant leakage (kg) × global warming potential for the refrigerant (e.g., kg CO2e))
then, allocate emissions based on volume that company’s products take within storage facility:
allocated emissions of storage facility
= volume of reporting company’s purchased goods (m3)total volume of goods in storage facility (m3)
× emissions of storage facility (kg CO2e)
finally, sum across all storage facilities:
∑ allocated emissions of storage facility
• Site-specific fuel, electricity use; and
• Site-specific refrigerant leakage
• The average occupancy rate of the storage facility (i.e., av-erage total volume of goods stored)
• Site or regionally specific emission factors for energy sources (e.g., elec-tricity and fuels) per unit of consump-tion (e.g., kg CO2e/kWh for electricity, kg CO2e/liter for diesel); and
• Refrigerant emission factors of fugi-tive and process emissions (kg HFC/kg of refrigerant leakage)
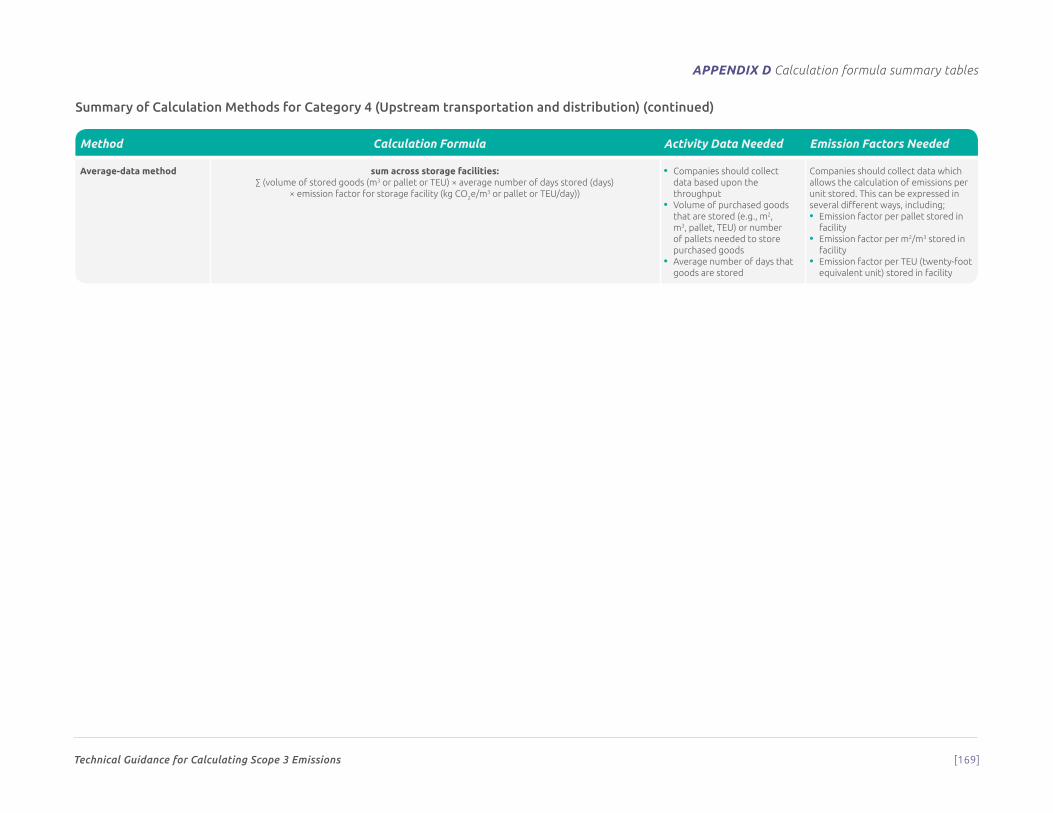
Appendix d Calculation formula summary tables
Technical Guidance for Calculating Scope 3 Emissions [169]
Summary of Calculation Methods for Category 4 (Upstream transportation and distribution) (continued)
Method Calculation Formula Activity Data Needed Emission Factors Needed
Average-data method sum across storage facilities:∑ (volume of stored goods (m3 or pallet or TEU) × average number of days stored (days)
× emission factor for storage facility (kg CO2e/m3 or pallet or TEU/day))
• Companies should collect data based upon the throughput
• Volume of purchased goods that are stored (e.g., m2, m3, pallet, TEU) or number of pallets needed to store purchased goods
• Average number of days that goods are stored
Companies should collect data which allows the calculation of emissions per unit stored. This can be expressed in several different ways, including;• Emission factor per pallet stored in
facility• Emission factor per m2/m3 stored in
facility• Emission factor per TEU (twenty-foot
equivalent unit) stored in facility
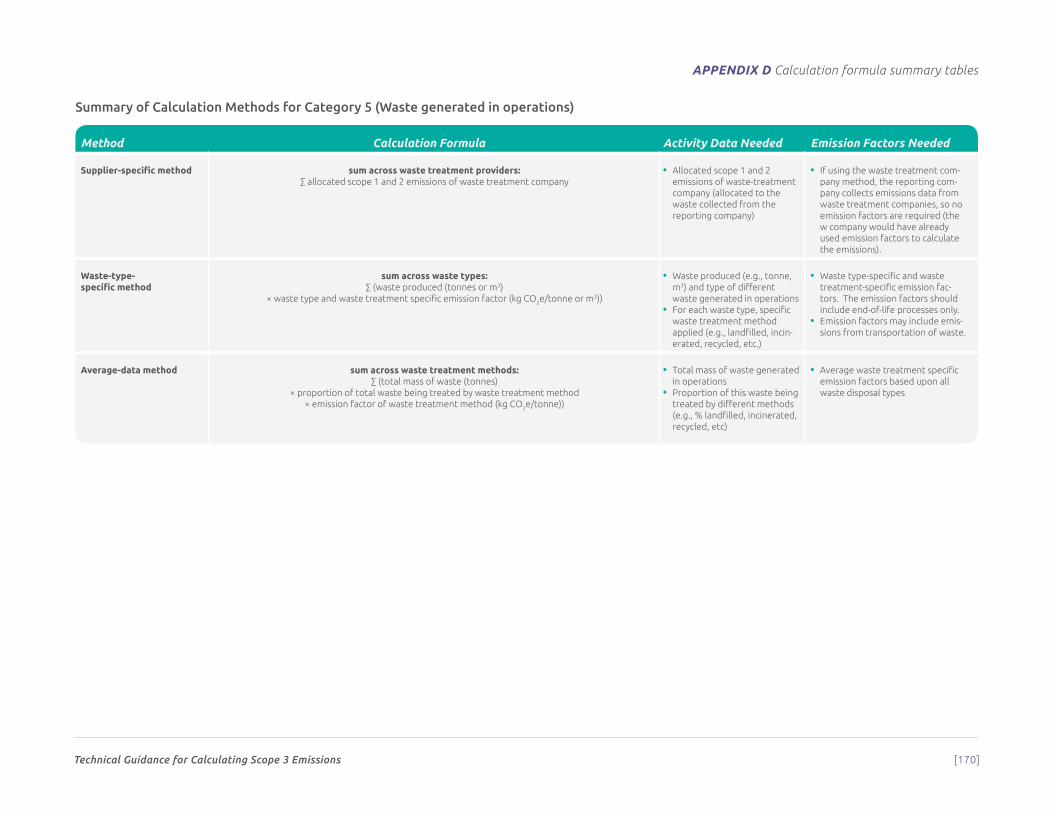
Appendix d Calculation formula summary tables
Technical Guidance for Calculating Scope 3 Emissions [170]
Summary of Calculation Methods for Category 5 (Waste generated in operations)
Method Calculation Formula Activity Data Needed Emission Factors Needed
Supplier-specific method sum across waste treatment providers:∑ allocated scope 1 and 2 emissions of waste treatment company
• Allocated scope 1 and 2 emissions of waste-treatment company (allocated to the waste collected from the reporting company)
• If using the waste treatment com-pany method, the reporting com-pany collects emissions data from waste treatment companies, so no emission factors are required (the w company would have already used emission factors to calculate the emissions).
Waste-type- specific method
sum across waste types:∑ (waste produced (tonnes or m3)
× waste type and waste treatment specific emission factor (kg CO2e/tonne or m3))
• Waste produced (e.g., tonne, m3) and type of different waste generated in operations
• For each waste type, specific waste treatment method applied (e.g., landfilled, incin-erated, recycled, etc.)
• Waste type-specific and waste treatment-specific emission fac-tors. The emission factors should include end-of-life processes only.
• Emission factors may include emis-sions from transportation of waste.
Average-data method sum across waste treatment methods:∑ (total mass of waste (tonnes)
× proportion of total waste being treated by waste treatment method× emission factor of waste treatment method (kg CO2e/tonne))
• Total mass of waste generated in operations
• Proportion of this waste being treated by different methods (e.g., % landfilled, incinerated, recycled, etc)
• Average waste treatment specific emission factors based upon all waste disposal types
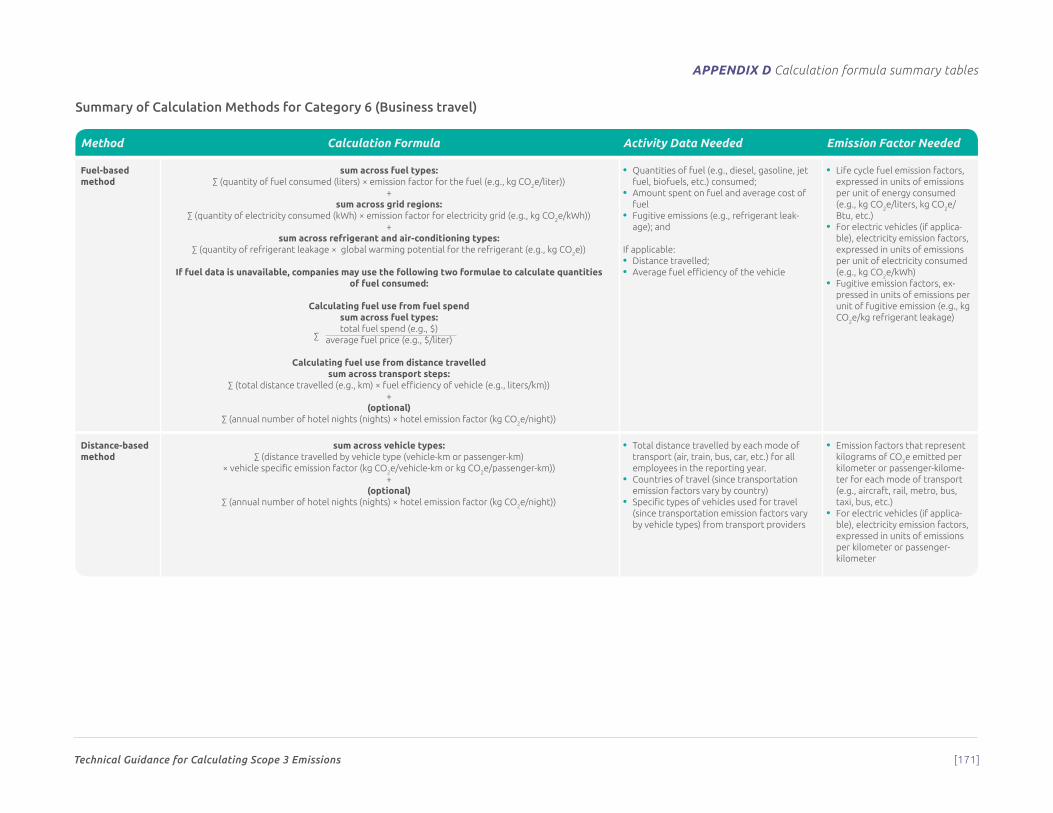
Appendix d Calculation formula summary tables
Technical Guidance for Calculating Scope 3 Emissions [171]
Summary of Calculation Methods for Category 6 (Business travel)
Method Calculation Formula Activity Data Needed Emission Factor Needed
Fuel-based method
sum across fuel types:∑ (quantity of fuel consumed (liters) × emission factor for the fuel (e.g., kg CO2e/liter))
+sum across grid regions:
∑ (quantity of electricity consumed (kWh) × emission factor for electricity grid (e.g., kg CO2e/kWh))+
sum across refrigerant and air-conditioning types:∑ (quantity of refrigerant leakage × global warming potential for the refrigerant (e.g., kg CO2e))
If fuel data is unavailable, companies may use the following two formulae to calculate quantities of fuel consumed:
Calculating fuel use from fuel spendsum across fuel types:total fuel spend (e.g., $)
average fuel price (e.g., $/liter)
Calculating fuel use from distance travelled sum across transport steps:
∑ (total distance travelled (e.g., km) × fuel efficiency of vehicle (e.g., liters/km))+
(optional)∑ (annual number of hotel nights (nights) × hotel emission factor (kg CO2e/night))
• Quantities of fuel (e.g., diesel, gasoline, jet fuel, biofuels, etc.) consumed;
• Amount spent on fuel and average cost of fuel
• Fugitive emissions (e.g., refrigerant leak-age); and
If applicable:• Distance travelled;• Average fuel efficiency of the vehicle
• Life cycle fuel emission factors, expressed in units of emissions per unit of energy consumed (e.g., kg CO2e/liters, kg CO2e/Btu, etc.)
• For electric vehicles (if applica-ble), electricity emission factors, expressed in units of emissions per unit of electricity consumed (e.g., kg CO2e/kWh)
• Fugitive emission factors, ex-pressed in units of emissions per unit of fugitive emission (e.g., kg CO2e/kg refrigerant leakage)
Distance-based method
sum across vehicle types:∑ (distance travelled by vehicle type (vehicle-km or passenger-km)
× vehicle specific emission factor (kg CO2e/vehicle-km or kg CO2e/passenger-km))+
(optional)∑ (annual number of hotel nights (nights) × hotel emission factor (kg CO2e/night))
• Total distance travelled by each mode of transport (air, train, bus, car, etc.) for all employees in the reporting year.
• Countries of travel (since transportation emission factors vary by country)
• Specific types of vehicles used for travel (since transportation emission factors vary by vehicle types) from transport providers
• Emission factors that represent kilograms of CO2e emitted per kilometer or passenger-kilome-ter for each mode of transport (e.g., aircraft, rail, metro, bus, taxi, bus, etc.)
• For electric vehicles (if applica-ble), electricity emission factors, expressed in units of emissions per kilometer or passenger- kilometer
∑
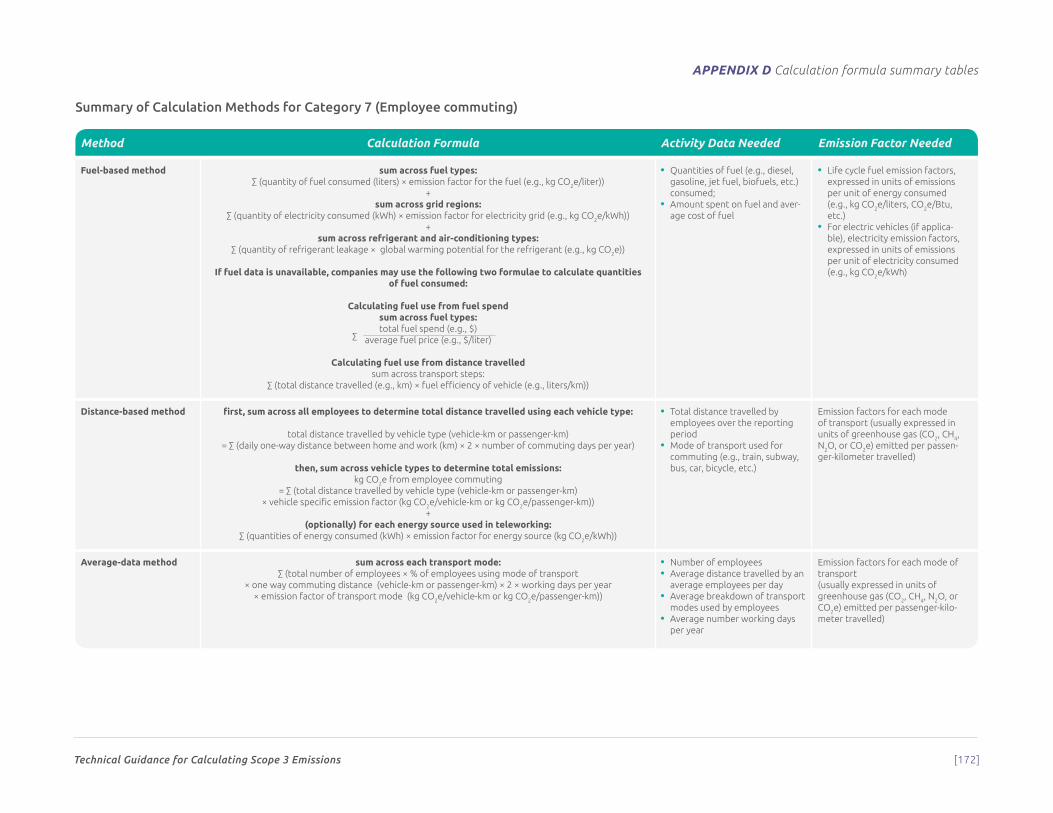
Appendix d Calculation formula summary tables
Technical Guidance for Calculating Scope 3 Emissions [172]
Summary of Calculation Methods for Category 7 (Employee commuting)
Method Calculation Formula Activity Data Needed Emission Factor Needed
Fuel-based method sum across fuel types:∑ (quantity of fuel consumed (liters) × emission factor for the fuel (e.g., kg CO2e/liter))
+sum across grid regions:
∑ (quantity of electricity consumed (kWh) × emission factor for electricity grid (e.g., kg CO2e/kWh))+
sum across refrigerant and air-conditioning types:∑ (quantity of refrigerant leakage × global warming potential for the refrigerant (e.g., kg CO2e))
If fuel data is unavailable, companies may use the following two formulae to calculate quantities of fuel consumed:
Calculating fuel use from fuel spendsum across fuel types:total fuel spend (e.g., $)
average fuel price (e.g., $/liter)
Calculating fuel use from distance travelled sum across transport steps:
∑ (total distance travelled (e.g., km) × fuel efficiency of vehicle (e.g., liters/km))
• Quantities of fuel (e.g., diesel, gasoline, jet fuel, biofuels, etc.) consumed;
• Amount spent on fuel and aver-age cost of fuel
• Life cycle fuel emission factors, expressed in units of emissions per unit of energy consumed (e.g., kg CO2e/liters, CO2e/Btu, etc.)
• For electric vehicles (if applica-ble), electricity emission factors, expressed in units of emissions per unit of electricity consumed (e.g., kg CO2e/kWh)
Distance-based method first, sum across all employees to determine total distance travelled using each vehicle type:
total distance travelled by vehicle type (vehicle-km or passenger-km)= ∑ (daily one-way distance between home and work (km) × 2 × number of commuting days per year)
then, sum across vehicle types to determine total emissions:kg CO2e from employee commuting
= ∑ (total distance travelled by vehicle type (vehicle-km or passenger-km) × vehicle specific emission factor (kg CO2e/vehicle-km or kg CO2e/passenger-km))
+(optionally) for each energy source used in teleworking:
∑ (quantities of energy consumed (kWh) × emission factor for energy source (kg CO2e/kWh))
• Total distance travelled by employees over the reporting period
• Mode of transport used for commuting (e.g., train, subway, bus, car, bicycle, etc.)
Emission factors for each mode of transport (usually expressed in units of greenhouse gas (CO2, CH4, N2O, or CO2e) emitted per passen-ger-kilometer travelled)
Average-data method sum across each transport mode:∑ (total number of employees × % of employees using mode of transport
× one way commuting distance (vehicle-km or passenger-km) × 2 × working days per year × emission factor of transport mode (kg CO2e/vehicle-km or kg CO2e/passenger-km))
• Number of employees• Average distance travelled by an
average employees per day• Average breakdown of transport
modes used by employees• Average number working days
per year
Emission factors for each mode of transport (usually expressed in units of greenhouse gas (CO2, CH4, N2O, or CO2e) emitted per passenger-kilo-meter travelled)
∑
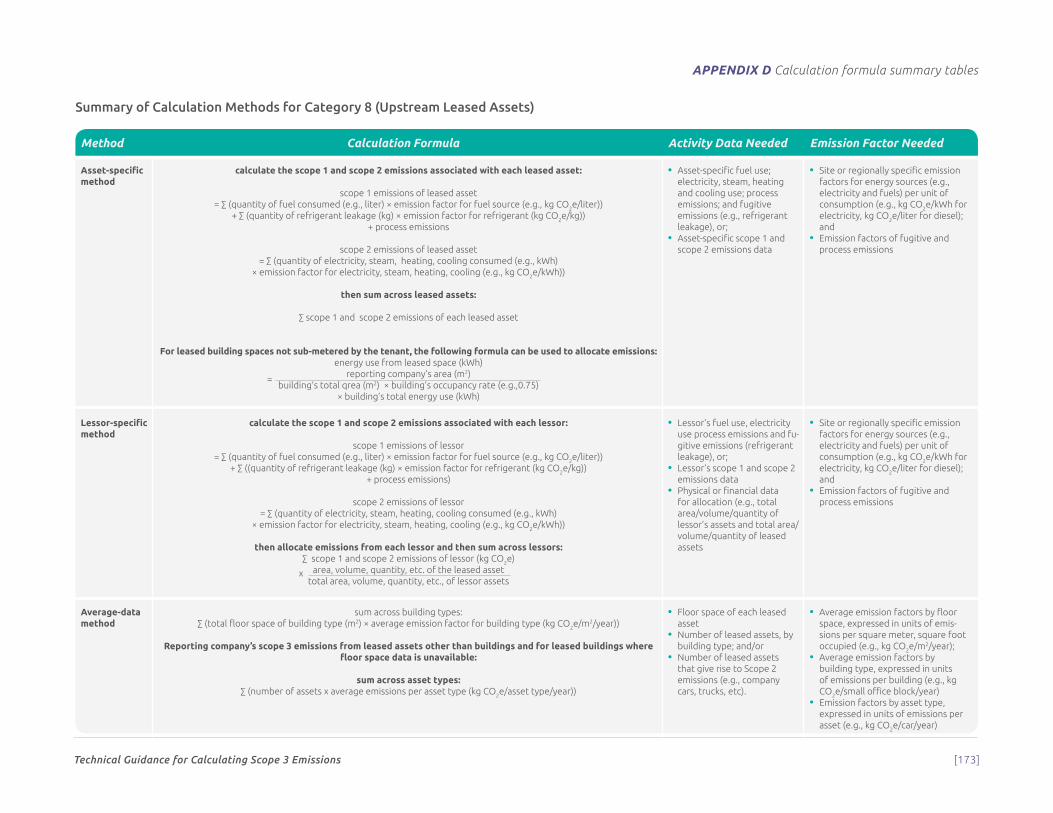
Appendix d Calculation formula summary tables
Technical Guidance for Calculating Scope 3 Emissions [173]
Summary of Calculation Methods for Category 8 (Upstream Leased Assets)
Method Calculation Formula Activity Data Needed Emission Factor Needed
Asset-specific method
calculate the scope 1 and scope 2 emissions associated with each leased asset:
scope 1 emissions of leased asset = ∑ (quantity of fuel consumed (e.g., liter) × emission factor for fuel source (e.g., kg CO2e/liter))
+ ∑ (quantity of refrigerant leakage (kg) × emission factor for refrigerant (kg CO2e/kg))+ process emissions
scope 2 emissions of leased asset= ∑ (quantity of electricity, steam, heating, cooling consumed (e.g., kWh)
× emission factor for electricity, steam, heating, cooling (e.g., kg CO2e/kWh))
then sum across leased assets:
∑ scope 1 and scope 2 emissions of each leased asset
For leased building spaces not sub-metered by the tenant, the following formula can be used to allocate emissions:energy use from leased space (kWh)
reporting company’s area (m2)building’s total qrea (m2) × building’s occupancy rate (e.g.,0.75)
× building’s total energy use (kWh)
• Asset-specific fuel use; electricity, steam, heating and cooling use; process emissions; and fugitive emissions (e.g., refrigerant leakage), or;
• Asset-specific scope 1 and scope 2 emissions data
• Site or regionally specific emission factors for energy sources (e.g., electricity and fuels) per unit of consumption (e.g., kg CO2e/kWh for electricity, kg CO2e/liter for diesel); and
• Emission factors of fugitive and process emissions
Lessor-specific method
calculate the scope 1 and scope 2 emissions associated with each lessor:
scope 1 emissions of lessor = ∑ (quantity of fuel consumed (e.g., liter) × emission factor for fuel source (e.g., kg CO2e/liter))
+ ∑ ((quantity of refrigerant leakage (kg) × emission factor for refrigerant (kg CO2e/kg))+ process emissions)
scope 2 emissions of lessor = ∑ (quantity of electricity, steam, heating, cooling consumed (e.g., kWh)
× emission factor for electricity, steam, heating, cooling (e.g., kg CO2e/kWh))
then allocate emissions from each lessor and then sum across lessors: ∑ scope 1 and scope 2 emissions of lessor (kg CO2e)
area, volume, quantity, etc. of the leased assettotal area, volume, quantity, etc., of lessor assets
• Lessor’s fuel use, electricity use process emissions and fu-gitive emissions (refrigerant leakage), or;
• Lessor’s scope 1 and scope 2 emissions data
• Physical or financial data for allocation (e.g., total area/volume/quantity of lessor’s assets and total area/volume/quantity of leased assets
• Site or regionally specific emission factors for energy sources (e.g., electricity and fuels) per unit of consumption (e.g., kg CO2e/kWh for electricity, kg CO2e/liter for diesel); and
• Emission factors of fugitive and process emissions
Average-data method
sum across building types:∑ (total floor space of building type (m2) × average emission factor for building type (kg CO2e/m2/year))
Reporting company’s scope 3 emissions from leased assets other than buildings and for leased buildings where floor space data is unavailable:
sum across asset types:∑ (number of assets x average emissions per asset type (kg CO2e/asset type/year))
• Floor space of each leased asset
• Number of leased assets, by building type; and/or
• Number of leased assets that give rise to Scope 2 emissions (e.g., company cars, trucks, etc).
• Average emission factors by floor space, expressed in units of emis-sions per square meter, square foot occupied (e.g., kg CO2e/m2/year);
• Average emission factors by building type, expressed in units of emissions per building (e.g., kg CO2e/small office block/year)
• Emission factors by asset type, expressed in units of emissions per asset (e.g., kg CO2e/car/year)
=
x
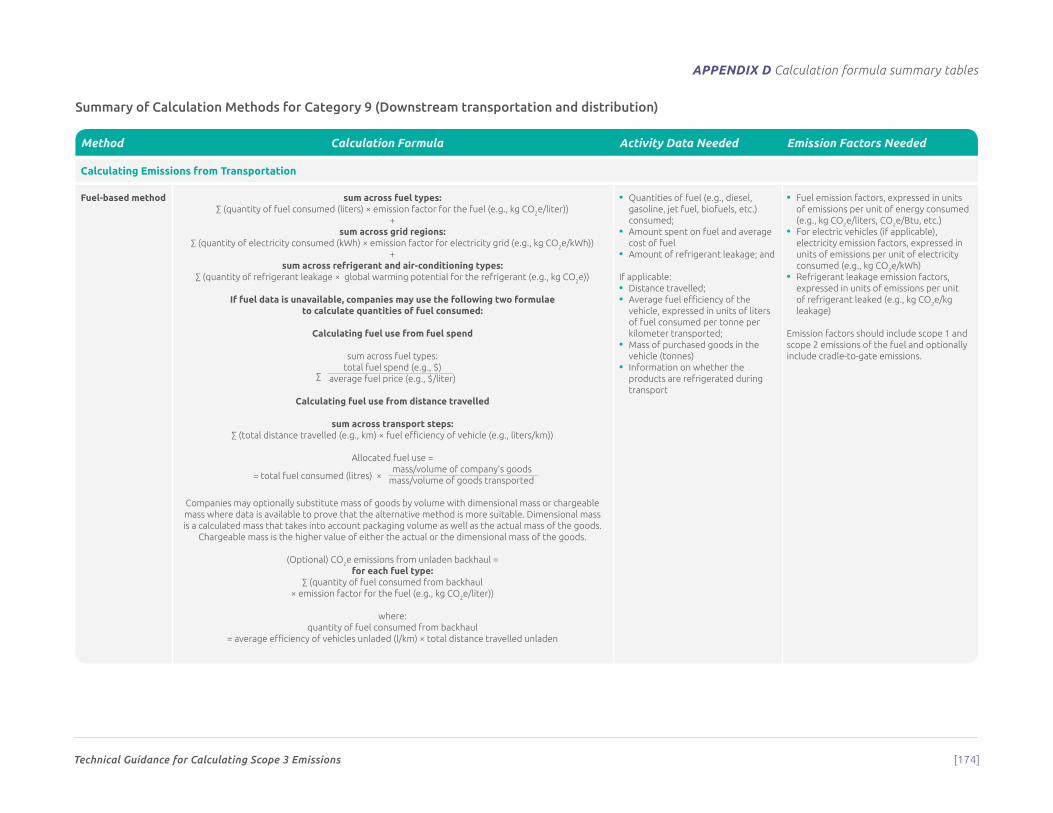
Appendix d Calculation formula summary tables
Technical Guidance for Calculating Scope 3 Emissions [174]
Summary of Calculation Methods for Category 9 (Downstream transportation and distribution)
Method Calculation Formula Activity Data Needed Emission Factors Needed
Calculating Emissions from Transportation
Fuel-based method sum across fuel types:∑ (quantity of fuel consumed (liters) × emission factor for the fuel (e.g., kg CO2e/liter))
+sum across grid regions:
∑ (quantity of electricity consumed (kWh) × emission factor for electricity grid (e.g., kg CO2e/kWh))+
sum across refrigerant and air-conditioning types:∑ (quantity of refrigerant leakage × global warming potential for the refrigerant (e.g., kg CO2e))
If fuel data is unavailable, companies may use the following two formulae to calculate quantities of fuel consumed:
Calculating fuel use from fuel spend
sum across fuel types:total fuel spend (e.g., $)
average fuel price (e.g., $/liter)
Calculating fuel use from distance travelled
sum across transport steps:∑ (total distance travelled (e.g., km) × fuel efficiency of vehicle (e.g., liters/km))
Allocated fuel use =
= total fuel consumed (litres) × mass/volume of company’s goods
mass/volume of goods transported
Companies may optionally substitute mass of goods by volume with dimensional mass or chargeable mass where data is available to prove that the alternative method is more suitable. Dimensional mass is a calculated mass that takes into account packaging volume as well as the actual mass of the goods.
Chargeable mass is the higher value of either the actual or the dimensional mass of the goods.
(Optional) CO2e emissions from unladen backhaul =for each fuel type:
∑ (quantity of fuel consumed from backhaul × emission factor for the fuel (e.g., kg CO2e/liter))
where: quantity of fuel consumed from backhaul
= average efficiency of vehicles unladed (l/km) × total distance travelled unladen
• Quantities of fuel (e.g., diesel, gasoline, jet fuel, biofuels, etc.) consumed;
• Amount spent on fuel and average cost of fuel
• Amount of refrigerant leakage; and
If applicable:• Distance travelled;• Average fuel efficiency of the
vehicle, expressed in units of liters of fuel consumed per tonne per kilometer transported;
• Mass of purchased goods in the vehicle (tonnes)
• Information on whether the products are refrigerated during transport
• Fuel emission factors, expressed in units of emissions per unit of energy consumed (e.g., kg CO2e/liters, CO2e/Btu, etc.)
• For electric vehicles (if applicable), electricity emission factors, expressed in units of emissions per unit of electricity consumed (e.g., kg CO2e/kWh)
• Refrigerant leakage emission factors, expressed in units of emissions per unit of refrigerant leaked (e.g., kg CO2e/kg leakage)
Emission factors should include scope 1 and scope 2 emissions of the fuel and optionally include cradle-to-gate emissions.
∑
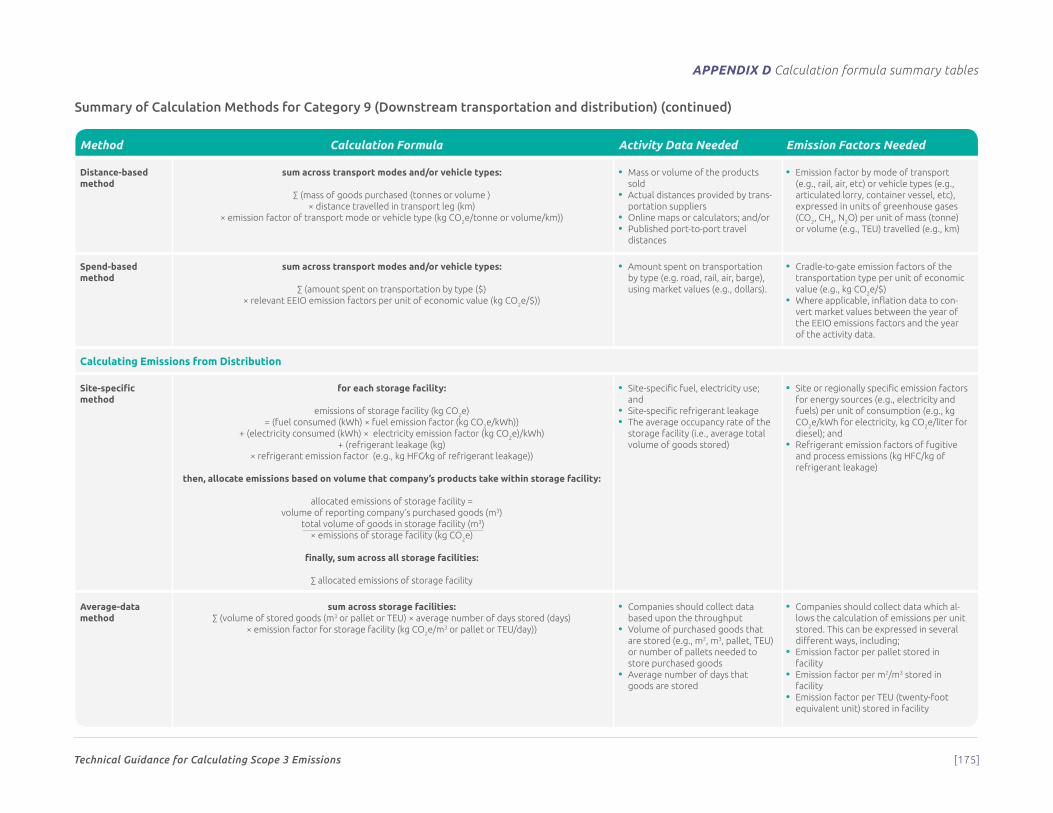
Appendix d Calculation formula summary tables
Technical Guidance for Calculating Scope 3 Emissions [175]
Summary of Calculation Methods for Category 9 (Downstream transportation and distribution) (continued)
Method Calculation Formula Activity Data Needed Emission Factors Needed
Distance-based method
sum across transport modes and/or vehicle types:
∑ (mass of goods purchased (tonnes or volume ) × distance travelled in transport leg (km)
× emission factor of transport mode or vehicle type (kg CO2e/tonne or volume/km))
• Mass or volume of the products sold
• Actual distances provided by trans-portation suppliers
• Online maps or calculators; and/or• Published port-to-port travel
distances
• Emission factor by mode of transport (e.g., rail, air, etc) or vehicle types (e.g., articulated lorry, container vessel, etc), expressed in units of greenhouse gases (CO2, CH4, N2O) per unit of mass (tonne) or volume (e.g., TEU) travelled (e.g., km)
Spend-based method
sum across transport modes and/or vehicle types:
∑ (amount spent on transportation by type ($)× relevant EEIO emission factors per unit of economic value (kg CO2e/$))
• Amount spent on transportation by type (e.g. road, rail, air, barge), using market values (e.g., dollars).
• Cradle-to-gate emission factors of the transportation type per unit of economic value (e.g., kg CO2e/$)
• Where applicable, inflation data to con-vert market values between the year of the EEIO emissions factors and the year of the activity data.
Calculating Emissions from Distribution
Site-specific method
for each storage facility:
emissions of storage facility (kg CO2e) = (fuel consumed (kWh) × fuel emission factor (kg CO2e/kWh))
+ (electricity consumed (kWh) × electricity emission factor (kg CO2e)/kWh) + (refrigerant leakage (kg)
× refrigerant emission factor (e.g., kg HFC⁄kg of refrigerant leakage))
then, allocate emissions based on volume that company’s products take within storage facility:
allocated emissions of storage facility =volume of reporting company’s purchased goods (m3)
total volume of goods in storage facility (m3) × emissions of storage facility (kg CO2e)
finally, sum across all storage facilities:
∑ allocated emissions of storage facility
• Site-specific fuel, electricity use; and
• Site-specific refrigerant leakage• The average occupancy rate of the
storage facility (i.e., average total volume of goods stored)
• Site or regionally specific emission factors for energy sources (e.g., electricity and fuels) per unit of consumption (e.g., kg CO2e/kWh for electricity, kg CO2e/liter for diesel); and
• Refrigerant emission factors of fugitive and process emissions (kg HFC/kg of refrigerant leakage)
Average-data method
sum across storage facilities:∑ (volume of stored goods (m3 or pallet or TEU) × average number of days stored (days)
× emission factor for storage facility (kg CO2e/m3 or pallet or TEU/day))
• Companies should collect data based upon the throughput
• Volume of purchased goods that are stored (e.g., m2, m3, pallet, TEU) or number of pallets needed to store purchased goods
• Average number of days that goods are stored
• Companies should collect data which al-lows the calculation of emissions per unit stored. This can be expressed in several different ways, including;
• Emission factor per pallet stored in facility
• Emission factor per m2/m3 stored in facility
• Emission factor per TEU (twenty-foot equivalent unit) stored in facility
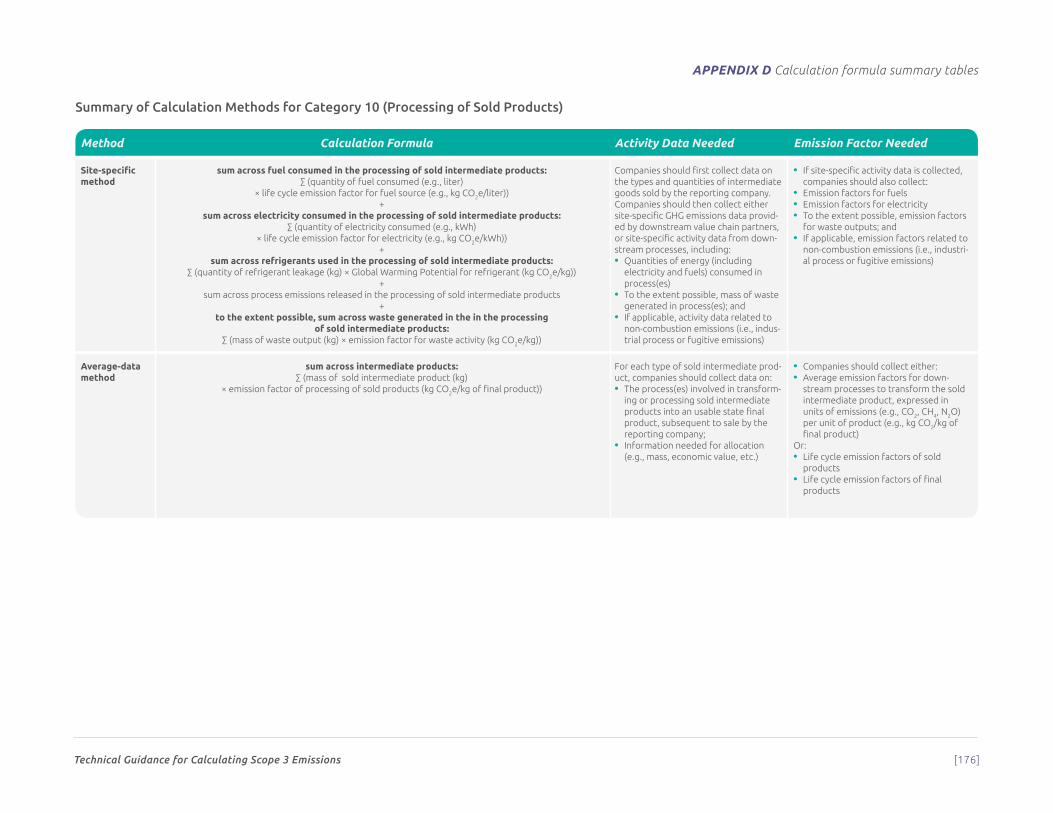
Appendix d Calculation formula summary tables
Technical Guidance for Calculating Scope 3 Emissions [176]
Summary of Calculation Methods for Category 10 (Processing of Sold Products)
Method Calculation Formula Activity Data Needed Emission Factor Needed
Site-specific method
sum across fuel consumed in the processing of sold intermediate products:∑ (quantity of fuel consumed (e.g., liter)
× life cycle emission factor for fuel source (e.g., kg CO2e/liter))+
sum across electricity consumed in the processing of sold intermediate products:∑ (quantity of electricity consumed (e.g., kWh)
× life cycle emission factor for electricity (e.g., kg CO2e/kWh))+
sum across refrigerants used in the processing of sold intermediate products:∑ (quantity of refrigerant leakage (kg) × Global Warming Potential for refrigerant (kg CO2e/kg))
+sum across process emissions released in the processing of sold intermediate products
+to the extent possible, sum across waste generated in the in the processing
of sold intermediate products:∑ (mass of waste output (kg) × emission factor for waste activity (kg CO2e/kg))
Companies should first collect data on the types and quantities of intermediate goods sold by the reporting company. Companies should then collect either site-specific GHG emissions data provid-ed by downstream value chain partners, or site-specific activity data from down-stream processes, including:• Quantities of energy (including
electricity and fuels) consumed in process(es)
• To the extent possible, mass of waste generated in process(es); and
• If applicable, activity data related to non-combustion emissions (i.e., indus-trial process or fugitive emissions)
• If site-specific activity data is collected, companies should also collect:
• Emission factors for fuels• Emission factors for electricity• To the extent possible, emission factors
for waste outputs; and• If applicable, emission factors related to
non-combustion emissions (i.e., industri-al process or fugitive emissions)
Average-data method
sum across intermediate products:∑ (mass of sold intermediate product (kg)
× emission factor of processing of sold products (kg CO2e/kg of final product))
For each type of sold intermediate prod-uct, companies should collect data on:• The process(es) involved in transform-
ing or processing sold intermediate products into an usable state final product, subsequent to sale by the reporting company;
• Information needed for allocation (e.g., mass, economic value, etc.)
• Companies should collect either:• Average emission factors for down-
stream processes to transform the sold intermediate product, expressed in units of emissions (e.g., CO2, CH4, N2O) per unit of product (e.g., kg CO2/kg of final product)
Or:• Life cycle emission factors of sold
products• Life cycle emission factors of final
products
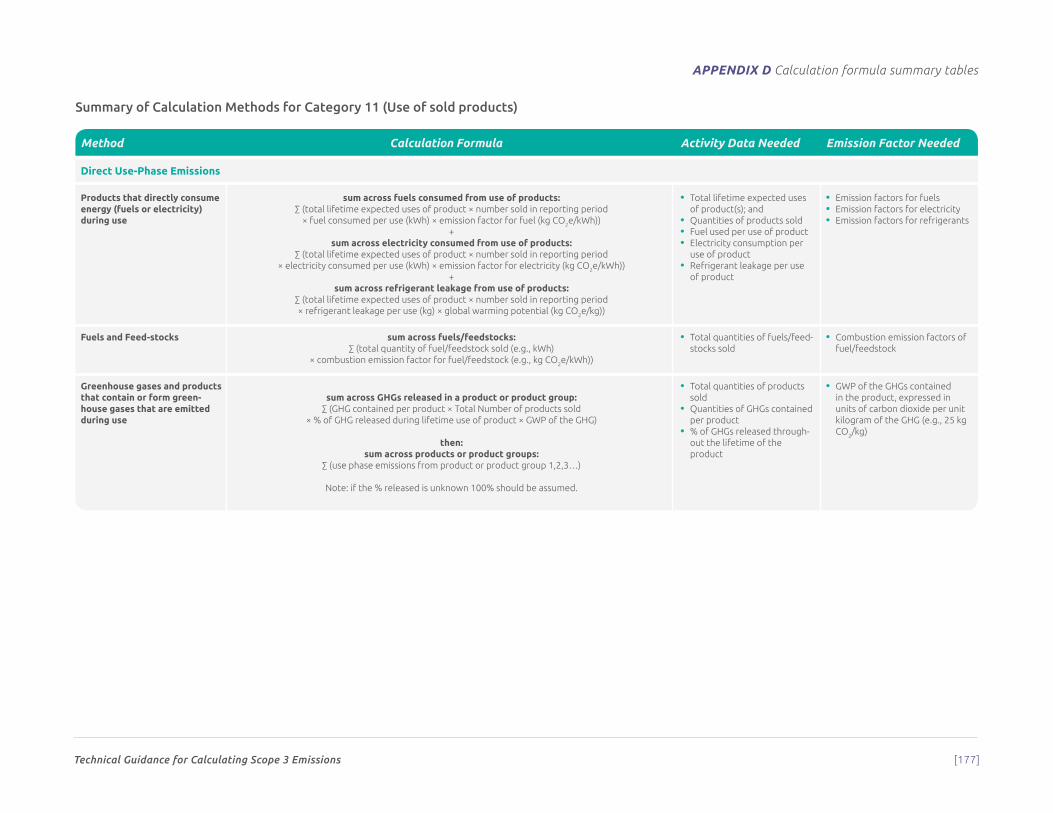
Appendix d Calculation formula summary tables
Technical Guidance for Calculating Scope 3 Emissions [177]
Summary of Calculation Methods for Category 11 (Use of sold products)
Method Calculation Formula Activity Data Needed Emission Factor Needed
Direct Use-Phase Emissions
Products that directly consume energy (fuels or electricity) during use
sum across fuels consumed from use of products:∑ (total lifetime expected uses of product × number sold in reporting period
× fuel consumed per use (kWh) × emission factor for fuel (kg CO2e/kWh))+
sum across electricity consumed from use of products:∑ (total lifetime expected uses of product × number sold in reporting period
× electricity consumed per use (kWh) × emission factor for electricity (kg CO2e/kWh))+
sum across refrigerant leakage from use of products:∑ (total lifetime expected uses of product × number sold in reporting period × refrigerant leakage per use (kg) × global warming potential (kg CO2e/kg))
• Total lifetime expected uses of product(s); and
• Quantities of products sold• Fuel used per use of product • Electricity consumption per
use of product• Refrigerant leakage per use
of product
• Emission factors for fuels• Emission factors for electricity• Emission factors for refrigerants
Fuels and Feed-stocks sum across fuels/feedstocks:∑ (total quantity of fuel/feedstock sold (e.g., kWh)
× combustion emission factor for fuel/feedstock (e.g., kg CO2e/kWh))
• Total quantities of fuels/feed-stocks sold
• Combustion emission factors of fuel/feedstock
Greenhouse gases and products that contain or form green-house gases that are emitted during use
sum across GHGs released in a product or product group:∑ (GHG contained per product × Total Number of products sold
× % of GHG released during lifetime use of product × GWP of the GHG)
then:sum across products or product groups:
∑ (use phase emissions from product or product group 1,2,3…)
Note: if the % released is unknown 100% should be assumed.
• Total quantities of products sold
• Quantities of GHGs contained per product
• % of GHGs released through-out the lifetime of the product
• GWP of the GHGs contained in the product, expressed in units of carbon dioxide per unit kilogram of the GHG (e.g., 25 kg CO2/kg)
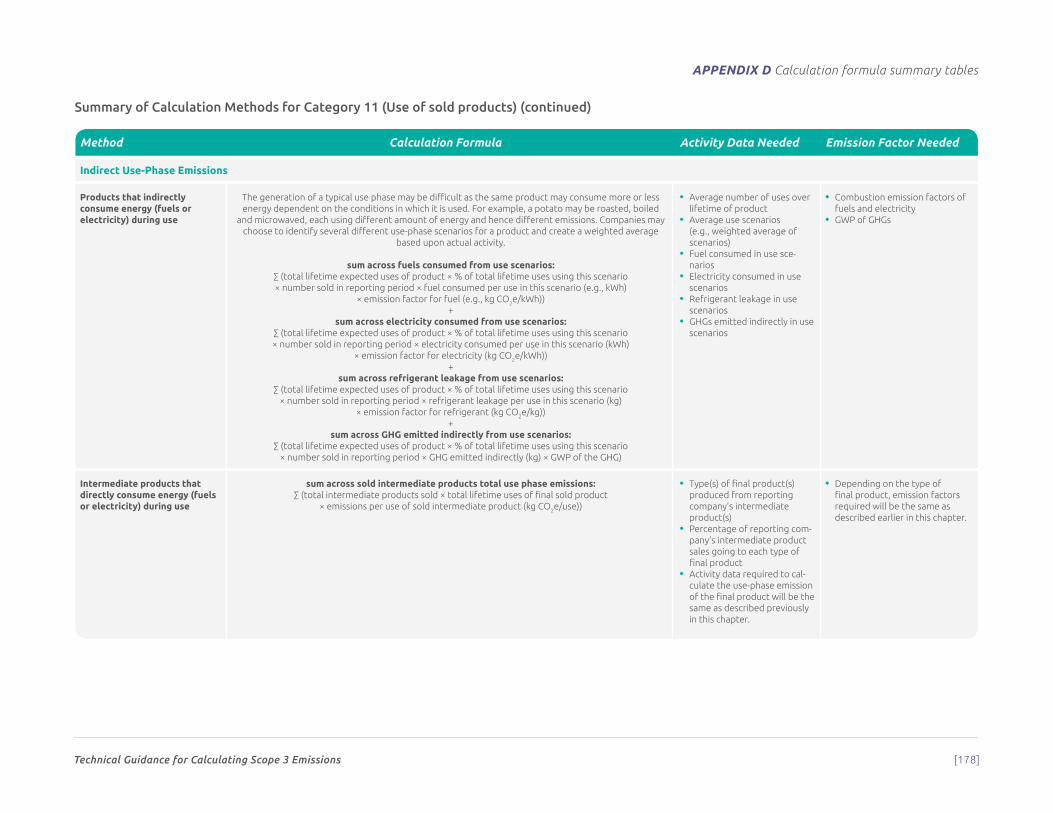
Appendix d Calculation formula summary tables
Technical Guidance for Calculating Scope 3 Emissions [178]
Summary of Calculation Methods for Category 11 (Use of sold products) (continued)
Method Calculation Formula Activity Data Needed Emission Factor Needed
Indirect Use-Phase Emissions
Products that indirectly consume energy (fuels or electricity) during use
The generation of a typical use phase may be difficult as the same product may consume more or less energy dependent on the conditions in which it is used. For example, a potato may be roasted, boiled
and microwaved, each using different amount of energy and hence different emissions. Companies may choose to identify several different use-phase scenarios for a product and create a weighted average
based upon actual activity.
sum across fuels consumed from use scenarios:∑ (total lifetime expected uses of product × % of total lifetime uses using this scenario× number sold in reporting period × fuel consumed per use in this scenario (e.g., kWh)
× emission factor for fuel (e.g., kg CO2e/kWh))+
sum across electricity consumed from use scenarios:∑ (total lifetime expected uses of product × % of total lifetime uses using this scenario× number sold in reporting period × electricity consumed per use in this scenario (kWh)
× emission factor for electricity (kg CO2e/kWh))+
sum across refrigerant leakage from use scenarios:∑ (total lifetime expected uses of product × % of total lifetime uses using this scenario
× number sold in reporting period × refrigerant leakage per use in this scenario (kg)× emission factor for refrigerant (kg CO2e/kg))
+sum across GHG emitted indirectly from use scenarios:
∑ (total lifetime expected uses of product × % of total lifetime uses using this scenario× number sold in reporting period × GHG emitted indirectly (kg) × GWP of the GHG)
• Average number of uses over lifetime of product
• Average use scenarios (e.g., weighted average of scenarios)
• Fuel consumed in use sce-narios
• Electricity consumed in use scenarios
• Refrigerant leakage in use scenarios
• GHGs emitted indirectly in use scenarios
• Combustion emission factors of fuels and electricity
• GWP of GHGs
Intermediate products that directly consume energy (fuels or electricity) during use
sum across sold intermediate products total use phase emissions:∑ (total intermediate products sold × total lifetime uses of final sold product
× emissions per use of sold intermediate product (kg CO2e/use))
• Type(s) of final product(s) produced from reporting company’s intermediate product(s)
• Percentage of reporting com-pany’s intermediate product sales going to each type of final product
• Activity data required to cal-culate the use-phase emission of the final product will be the same as described previously in this chapter.
• Depending on the type of final product, emission factors required will be the same as described earlier in this chapter.
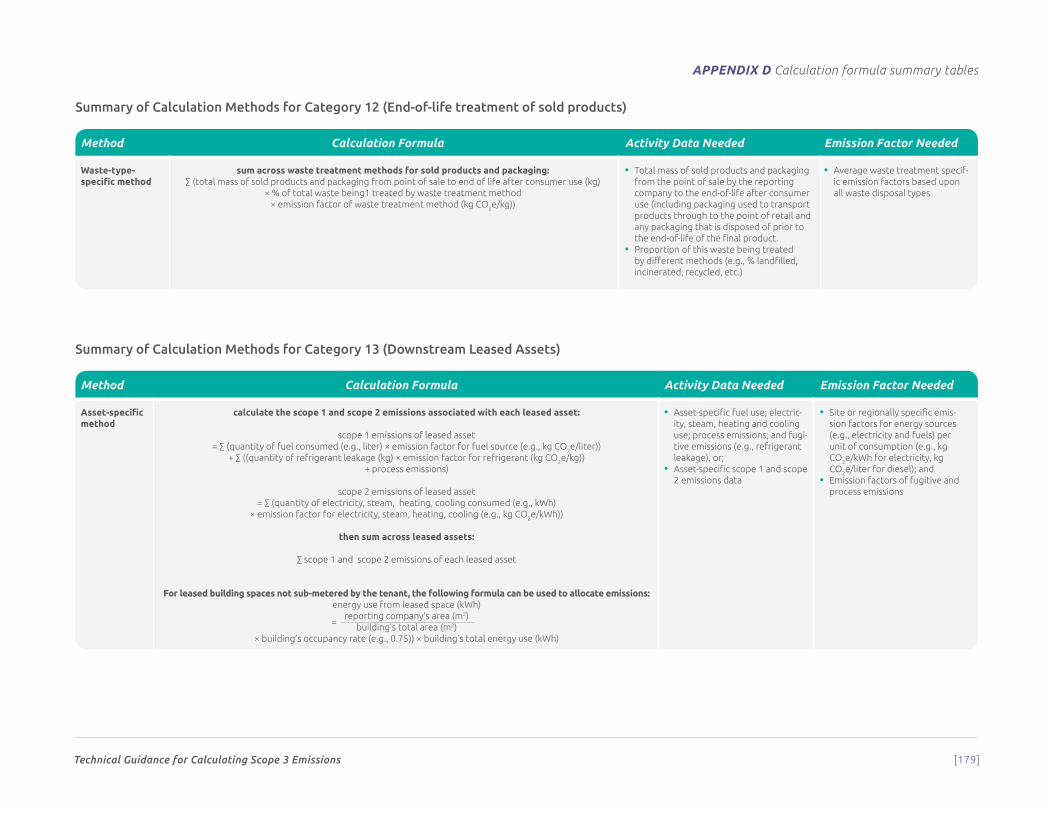
Appendix d Calculation formula summary tables
Technical Guidance for Calculating Scope 3 Emissions [179]
Summary of Calculation Methods for Category 12 (End-of-life treatment of sold products)
Method Calculation Formula Activity Data Needed Emission Factor Needed
Waste-type- specific method
sum across waste treatment methods for sold products and packaging:∑ (total mass of sold products and packaging from point of sale to end of life after consumer use (kg)
× % of total waste being1 treated by waste treatment method× emission factor of waste treatment method (kg CO2e/kg))
• Total mass of sold products and packaging from the point of sale by the reporting company to the end-of-life after consumer use (including packaging used to transport products through to the point of retail and any packaging that is disposed of prior to the end-of-life of the final product.
• Proportion of this waste being treated by different methods (e.g., % landfilled, incinerated, recycled, etc.)
• Average waste treatment specif-ic emission factors based upon all waste disposal types
Summary of Calculation Methods for Category 13 (Downstream Leased Assets)
Method Calculation Formula Activity Data Needed Emission Factor Needed
Asset-specific method
calculate the scope 1 and scope 2 emissions associated with each leased asset:
scope 1 emissions of leased asset = ∑ (quantity of fuel consumed (e.g., liter) × emission factor for fuel source (e.g., kg CO2e/liter))
+ ∑ ((quantity of refrigerant leakage (kg) × emission factor for refrigerant (kg CO2e/kg))+ process emissions)
scope 2 emissions of leased asset= ∑ (quantity of electricity, steam, heating, cooling consumed (e.g., kWh)
× emission factor for electricity, steam, heating, cooling (e.g., kg CO2e/kWh))
then sum across leased assets:
∑ scope 1 and scope 2 emissions of each leased asset
For leased building spaces not sub-metered by the tenant, the following formula can be used to allocate emissions:energy use from leased space (kWh)
reporting company’s area (m2)building’s total area (m2)
× building’s occupancy rate (e.g., 0.75)) × building’s total energy use (kWh)
• Asset-specific fuel use; electric-ity, steam, heating and cooling use; process emissions; and fugi-tive emissions (e.g., refrigerant leakage), or;
• Asset-specific scope 1 and scope 2 emissions data
• Site or regionally specific emis-sion factors for energy sources (e.g., electricity and fuels) per unit of consumption (e.g., kg CO2e/kWh for electricity, kg CO2e/liter for diesel); and
• Emission factors of fugitive and process emissions
=
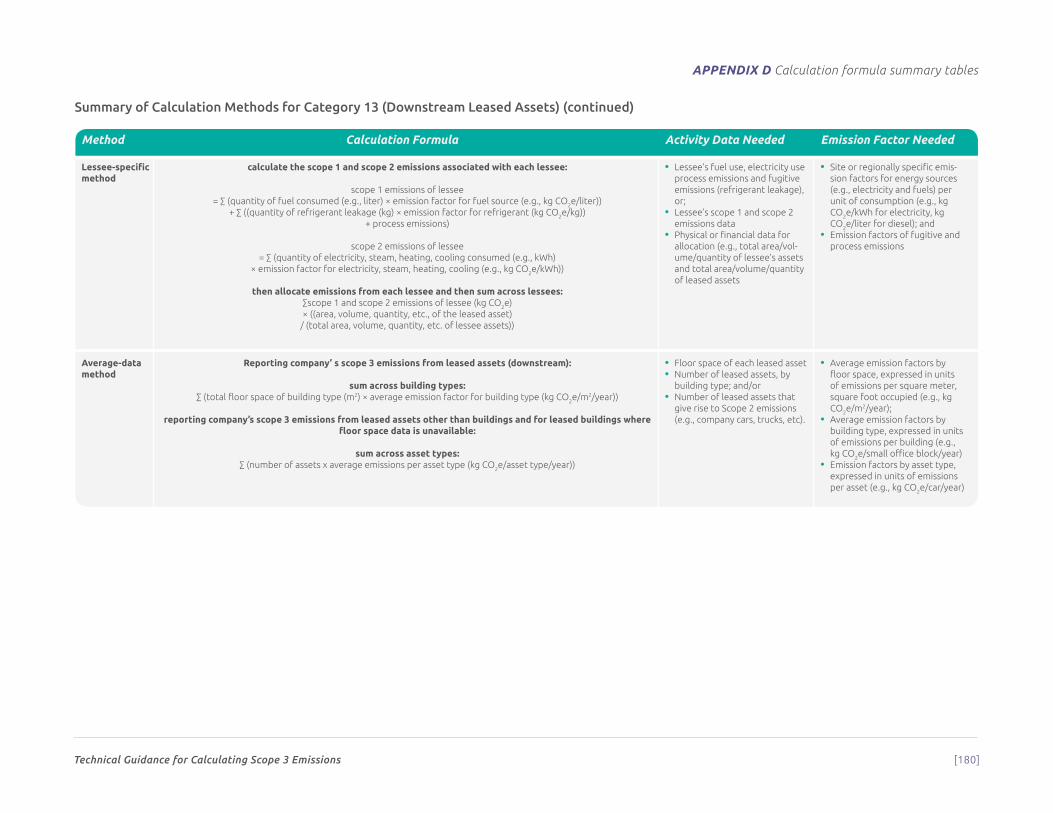
Appendix d Calculation formula summary tables
Technical Guidance for Calculating Scope 3 Emissions [180]
Summary of Calculation Methods for Category 13 (Downstream Leased Assets) (continued)
Method Calculation Formula Activity Data Needed Emission Factor Needed
Lessee-specific method
calculate the scope 1 and scope 2 emissions associated with each lessee:
scope 1 emissions of lessee = ∑ (quantity of fuel consumed (e.g., liter) × emission factor for fuel source (e.g., kg CO2e/liter))
+ ∑ ((quantity of refrigerant leakage (kg) × emission factor for refrigerant (kg CO2e/kg))+ process emissions)
scope 2 emissions of lessee = ∑ (quantity of electricity, steam, heating, cooling consumed (e.g., kWh)
× emission factor for electricity, steam, heating, cooling (e.g., kg CO2e/kWh))
then allocate emissions from each lessee and then sum across lessees:∑scope 1 and scope 2 emissions of lessee (kg CO2e)× ((area, volume, quantity, etc., of the leased asset)
/ (total area, volume, quantity, etc. of lessee assets))
• Lessee’s fuel use, electricity use process emissions and fugitive emissions (refrigerant leakage), or;
• Lessee’s scope 1 and scope 2 emissions data
• Physical or financial data for allocation (e.g., total area/vol-ume/quantity of lessee’s assets and total area/volume/quantity of leased assets
• Site or regionally specific emis-sion factors for energy sources (e.g., electricity and fuels) per unit of consumption (e.g., kg CO2e/kWh for electricity, kg CO2e/liter for diesel); and
• Emission factors of fugitive and process emissions
Average-data method
Reporting company’ s scope 3 emissions from leased assets (downstream):
sum across building types:∑ (total floor space of building type (m2) × average emission factor for building type (kg CO2e/m2/year))
reporting company’s scope 3 emissions from leased assets other than buildings and for leased buildings where floor space data is unavailable:
sum across asset types:∑ (number of assets x average emissions per asset type (kg CO2e/asset type/year))
• Floor space of each leased asset• Number of leased assets, by
building type; and/or• Number of leased assets that
give rise to Scope 2 emissions (e.g., company cars, trucks, etc).
• Average emission factors by floor space, expressed in units of emissions per square meter, square foot occupied (e.g., kg CO2e/m2/year);
• Average emission factors by building type, expressed in units of emissions per building (e.g., kg CO2e/small office block/year)
• Emission factors by asset type, expressed in units of emissions per asset (e.g., kg CO2e/car/year)
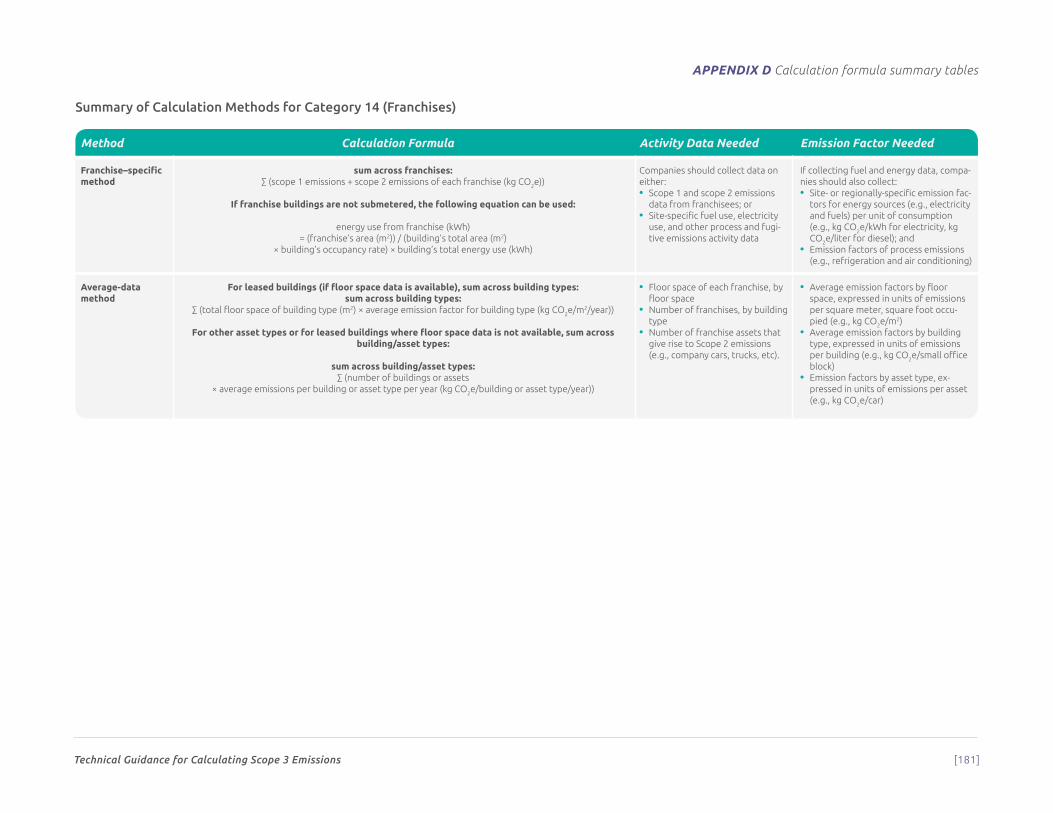
Appendix d Calculation formula summary tables
Technical Guidance for Calculating Scope 3 Emissions [181]
Summary of Calculation Methods for Category 14 (Franchises)
Method Calculation Formula Activity Data Needed Emission Factor Needed
Franchise–specific method
sum across franchises:∑ (scope 1 emissions + scope 2 emissions of each franchise (kg CO2e))
If franchise buildings are not submetered, the following equation can be used:
energy use from franchise (kWh) = (franchise’s area (m2)) / (building’s total area (m2)
× building’s occupancy rate) × building’s total energy use (kWh)
Companies should collect data on either:• Scope 1 and scope 2 emissions
data from franchisees; or • Site-specific fuel use, electricity
use, and other process and fugi-tive emissions activity data
If collecting fuel and energy data, compa-nies should also collect:• Site- or regionally-specific emission fac-
tors for energy sources (e.g., electricity and fuels) per unit of consumption (e.g., kg CO2e/kWh for electricity, kg CO2e/liter for diesel); and
• Emission factors of process emissions (e.g., refrigeration and air conditioning)
Average-data method
For leased buildings (if floor space data is available), sum across building types:sum across building types:
∑ (total floor space of building type (m2) × average emission factor for building type (kg CO2e/m2/year))
For other asset types or for leased buildings where floor space data is not available, sum across building/asset types:
sum across building/asset types:∑ (number of buildings or assets
× average emissions per building or asset type per year (kg CO2e/building or asset type/year))
• Floor space of each franchise, by floor space
• Number of franchises, by building type
• Number of franchise assets that give rise to Scope 2 emissions (e.g., company cars, trucks, etc).
• Average emission factors by floor space, expressed in units of emissions per square meter, square foot occu-pied (e.g., kg CO2e/m2)
• Average emission factors by building type, expressed in units of emissions per building (e.g., kg CO2e/small office block)
• Emission factors by asset type, ex-pressed in units of emissions per asset (e.g., kg CO2e/car)
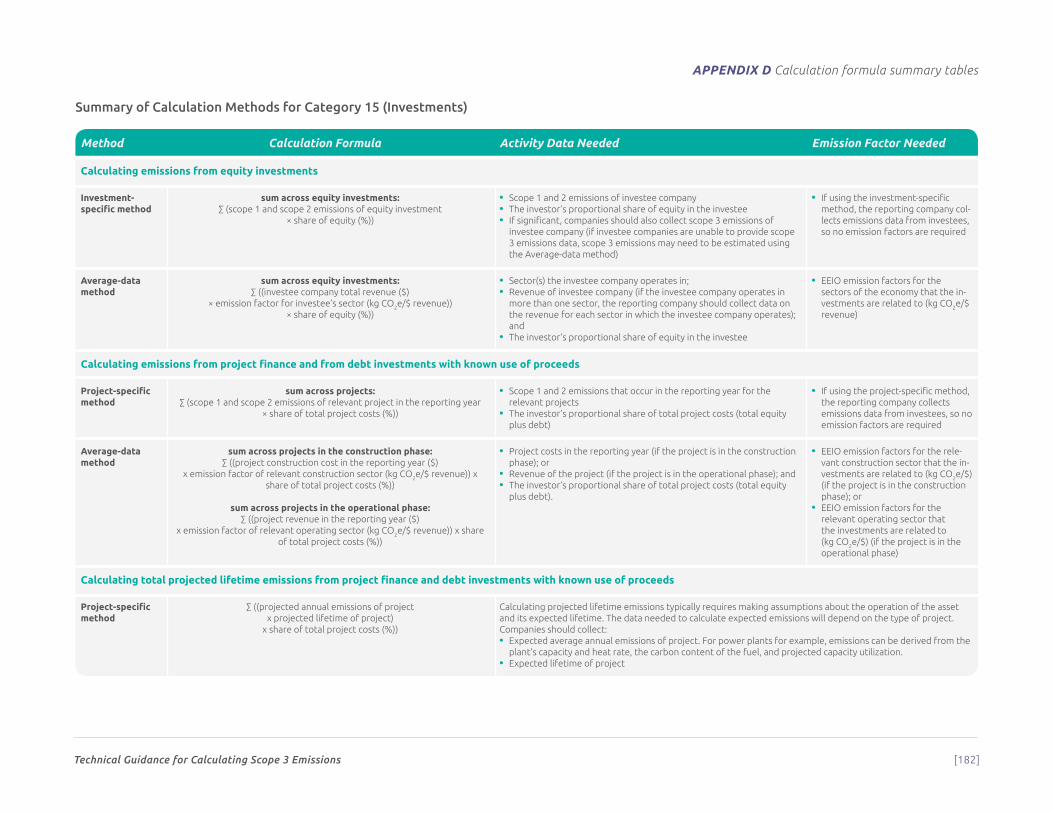
Appendix d Calculation formula summary tables
Technical Guidance for Calculating Scope 3 Emissions [182]
Summary of Calculation Methods for Category 15 (Investments)
Method Calculation Formula Activity Data Needed Emission Factor Needed
Calculating emissions from equity investments
Investment- specific method
sum across equity investments:∑ (scope 1 and scope 2 emissions of equity investment
× share of equity (%))
• Scope 1 and 2 emissions of investee company• The investor’s proportional share of equity in the investee• If significant, companies should also collect scope 3 emissions of
investee company (if investee companies are unable to provide scope 3 emissions data, scope 3 emissions may need to be estimated using the Average-data method)
• If using the investment-specific method, the reporting company col-lects emissions data from investees, so no emission factors are required
Average-data method
sum across equity investments:∑ ((investee company total revenue ($)
× emission factor for investee’s sector (kg CO2e/$ revenue)) × share of equity (%))
• Sector(s) the investee company operates in; • Revenue of investee company (if the investee company operates in
more than one sector, the reporting company should collect data on the revenue for each sector in which the investee company operates); and
• The investor’s proportional share of equity in the investee
• EEIO emission factors for the sectors of the economy that the in-vestments are related to (kg CO2e/$ revenue)
Calculating emissions from project finance and from debt investments with known use of proceeds
Project-specific method
sum across projects:∑ (scope 1 and scope 2 emissions of relevant project in the reporting year
× share of total project costs (%))
• Scope 1 and 2 emissions that occur in the reporting year for the relevant projects
• The investor’s proportional share of total project costs (total equity plus debt)
• If using the project-specific method, the reporting company collects emissions data from investees, so no emission factors are required
Average-data method
sum across projects in the construction phase:∑ ((project construction cost in the reporting year ($)
x emission factor of relevant construction sector (kg CO2e/$ revenue)) x share of total project costs (%))
sum across projects in the operational phase:∑ ((project revenue in the reporting year ($)
x emission factor of relevant operating sector (kg CO2e/$ revenue)) x share of total project costs (%))
• Project costs in the reporting year (if the project is in the construction phase); or
• Revenue of the project (if the project is in the operational phase); and• The investor’s proportional share of total project costs (total equity
plus debt).
• EEIO emission factors for the rele-vant construction sector that the in-vestments are related to (kg CO2e/$) (if the project is in the construction phase); or
• EEIO emission factors for the relevant operating sector that the investments are related to (kg CO2e/$) (if the project is in the operational phase)
Calculating total projected lifetime emissions from project finance and debt investments with known use of proceeds
Project-specific method
∑ ((projected annual emissions of project x projected lifetime of project)
x share of total project costs (%))
Calculating projected lifetime emissions typically requires making assumptions about the operation of the asset and its expected lifetime. The data needed to calculate expected emissions will depend on the type of project.Companies should collect:• Expected average annual emissions of project. For power plants for example, emissions can be derived from the
plant’s capacity and heat rate, the carbon content of the fuel, and projected capacity utilization.• Expected lifetime of project


![Technical Guidance Overview - New Jersey · Technical Guidance Overview George Nicholas Chairperson - DEP Technical Guidance Development ... [UST/LF] Presumptive Remedies Monitored](https://static.fdocuments.in/doc/165x107/5ebd185357241878db3b5ea8/technical-guidance-overview-new-jersey-technical-guidance-overview-george-nicholas.jpg)