TECHNICAL FEASIBILITY STUDY FOR PDAM KOTA …courses.writing.ufl.edu/3254/Examples and...
59
TECHNICAL FEASIBILITY STUDY FOR PDAM KOTA BANDUNG CIMENTENG WATER SUPPLY SYSTEM DECEMBER 2006 This publication was produced by Development Alternatives, Inc. for the United States Agency for International Development under Contract No. 497-M-00-05-00005-00
-
Upload
phungthien -
Category
Documents
-
view
218 -
download
1
Transcript of TECHNICAL FEASIBILITY STUDY FOR PDAM KOTA …courses.writing.ufl.edu/3254/Examples and...

TECHNICAL FEASIBILITY STUDY FOR PDAM KOTA BANDUNG CIMENTENG WATER SUPPLY SYSTEM
DECEMBER 2006
This publication was produced by Development Alternatives, Inc. for the United States Agency for International Development under Contract No. 497-M-00-05-00005-00

.
TECHNICAL FEASIBILITY STUDY FOR PDAM KOTA BANDUNG CIMENTENG WATER SUPPLY SYSTEM

TABLE OF CONTENTS
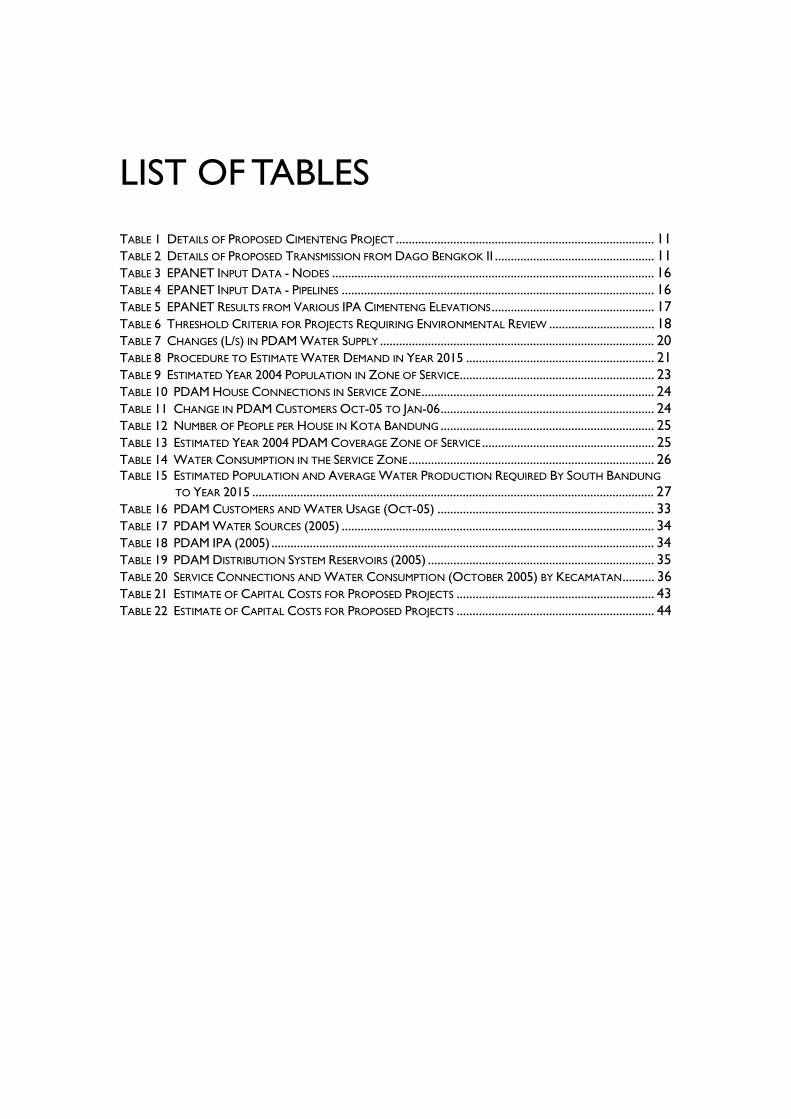
LIST OF FIGURES ........................................................................................................ III
LIST OF TABLES.......................................................................................................... IV
LIST OF ACRONYMS.................................................................................................... V
EXECUTIVE SUMMARY ..............................................................................................VI
1. INTRODUCTION ...................................................................................................7
1.1. OBJECTIVES OF THIS STUDY.............................................................................................................7 1.2. METHODOLOGY .............................................................................................................................8
2. PROPOSAL FOR EVALUATION ............................................................................9
3. ENGINEERING ANALYSIS OF PROPOSED PROJECT ........................................13
3.1. SOURCE WATER QUALITY AND TREATMENT............................................................................... 13 3.2. HYDRAULIC ANALYSIS.................................................................................................................. 14 3.3. ENVIRONMENTAL ANALYSIS ......................................................................................................... 18 3.4. CONSTRUCTION SEQUENCE ........................................................................................................ 19 3.5. INCREASE IN WATER SUPPLY........................................................................................................ 20
4. POPULATION AND WATER DEMAND IN YEAR 2015.......................................21
5. CONCLUSIONS....................................................................................................29
6. RECOMMENDATIONS.........................................................................................30
7. APPENDICES........................................................................................................31
APPENDIX A INTERVIEWS AND REPORTS USED IN THIS TECHNICAL STUDY........................ 32 APPENDIX B DETAILS ABOUT PDAM KOTA BANDUNG............................................................. 33 APPENDIX C NOTES ON WATER SERVICE TO GEDEBAGE......................................................... 37 APPENDIX D OUTLINE IMPLEMENTATION PLAN......................................................................... 38 APPENDIX E NOTES FOR MEETING (10 MARCH 2006) PDAM KOTA BANDUNG, USAID, AND
ESP-JAKARTA ............................................................................................................................................. 39 APPENDIX F ESTIMATED PROJECT COSTS...................................................................................... 43


LIST OF FIGURES FIGURE 1 PROPOSED CIMENTENG WATER SUPPLY ...........................................................................................7 FIGURE 2 STUDY METHODOLOGY....................................................................................................................8 FIGURE 3 SKETCH OF EXISTING CISANGKUY WATER SUPPLY SYSTEM ........................................................... 10 FIGURE 4 SKETCH OF PROPOSED CIMENTENG AND DAGO BENGKOK II PROJECTS....................................... 12 FIGURE 5 SKETCH OF IPA BADAKSINGA WATER TREATMENT PROCESS........................................................ 13 FIGURE 6 EPANET NETWORK DIAGRAM FOR EXISTING SYSTEM.................................................................. 15 FIGURE 7 EPANET NETWORK DIAGRAM FOR IPA CIMENTENG ANALYSIS................................................... 15 FIGURE 8 HYDRAULIC GRADE LINE WITH IPA CIMENTENG AT 800 M ASL................................................... 17 FIGURE 9 EPANET NETWORK DIAGRAM FOR IPA BADAKSINGA ................................................................. 18 FIGURE 10 SEQUENCE OF CONSTRUCTION ACTIVITIES ................................................................................. 19 FIGURE 11 SUMMARY OF CHANGES IN WATER SUPPLY ................................................................................. 20 FIGURE 12 AREA IN KOTA BANDUNG SERVED BY IPA CIMENTENG .............................................................. 22 FIGURE 13 GRAPH OF AVERAGE WATER PRODUCTION REQUIRED FOR SOUTH BANDUNG THROUGH YEAR
2015............................................................................................................................................ 28

LIST OF TABLES TABLE 1 DETAILS OF PROPOSED CIMENTENG PROJECT ................................................................................. 11 TABLE 2 DETAILS OF PROPOSED TRANSMISSION FROM DAGO BENGKOK II .................................................. 11 TABLE 3 EPANET INPUT DATA - NODES ..................................................................................................... 16 TABLE 4 EPANET INPUT DATA - PIPELINES .................................................................................................. 16 TABLE 5 EPANET RESULTS FROM VARIOUS IPA CIMENTENG ELEVATIONS................................................... 17 TABLE 6 THRESHOLD CRITERIA FOR PROJECTS REQUIRING ENVIRONMENTAL REVIEW ................................. 18 TABLE 7 CHANGES (L/S) IN PDAM WATER SUPPLY ...................................................................................... 20 TABLE 8 PROCEDURE TO ESTIMATE WATER DEMAND IN YEAR 2015 ........................................................... 21 TABLE 9 ESTIMATED YEAR 2004 POPULATION IN ZONE OF SERVICE............................................................. 23 TABLE 10 PDAM HOUSE CONNECTIONS IN SERVICE ZONE......................................................................... 24 TABLE 11 CHANGE IN PDAM CUSTOMERS OCT-05 TO JAN-06................................................................... 24 TABLE 12 NUMBER OF PEOPLE PER HOUSE IN KOTA BANDUNG ................................................................... 25 TABLE 13 ESTIMATED YEAR 2004 PDAM COVERAGE ZONE OF SERVICE ...................................................... 25 TABLE 14 WATER CONSUMPTION IN THE SERVICE ZONE............................................................................. 26 TABLE 15 ESTIMATED POPULATION AND AVERAGE WATER PRODUCTION REQUIRED BY SOUTH BANDUNG
TO YEAR 2015 .............................................................................................................................. 27 TABLE 16 PDAM CUSTOMERS AND WATER USAGE (OCT-05) .................................................................... 33 TABLE 17 PDAM WATER SOURCES (2005) .................................................................................................. 34 TABLE 18 PDAM IPA (2005) ........................................................................................................................ 34 TABLE 19 PDAM DISTRIBUTION SYSTEM RESERVOIRS (2005) ....................................................................... 35 TABLE 20 SERVICE CONNECTIONS AND WATER CONSUMPTION (OCTOBER 2005) BY KECAMATAN.......... 36 TABLE 21 ESTIMATE OF CAPITAL COSTS FOR PROPOSED PROJECTS .............................................................. 43 TABLE 22 ESTIMATE OF CAPITAL COSTS FOR PROPOSED PROJECTS .............................................................. 44


LIST OF ACRONYMS AMDAL Analisa Mengenai Dampak Lingkungan (Environmental Impact Review) ASL Above Sea Level BAPPEDA Badan Perencanaan Pembangunan Daerah (Regional Planning Board) BPS Badan Pusat Statistik Statistics Bureau DED Detailed Engineering Design EPANET Computer software program for hydraulic analysis FS Feasibility Studies HC House Connection IPA Instalasi Pergolahan Air (Water Treatment Plant) Kabupaten District; administrative subdivision of a Province Kecamatan Administrative subdivision of a Kotamadya Kelurahan Administrative subdivision of a Kecamatan km Kilometer = 1000 meters = 0.6 mile Kota City; administrative subdivision of a Province Kran Umum Public Tap L/sec Liters per second m meter = 1000 millimeters (mm) m3 cubic meters = 1000 Liters (L) Niaga Commercial customer O&M Operations and Maintenance PDAM Perusahan Daerah Air Minum PED Preliminary Engineering Design PSDA Pengembangan Sumber Daya Air (Water Resources Development) PLTA Pembangkit Listrik Tenaga Air (Hydro-electric Power Plant) PU Pekerjaan Umum (Department of Public Works) Rp Rupiah (currency of Indonesia) Wilayah Region


EXECUTIVE SUMMARY PDAM Kota Bandung proposes to reorganize the water supply system from Sungai Cisangkuy by changing the existing Pipa Lama 900 mm transmission pipeline to deliver water to the southern area of Kota Bandung (950 L/s) and to Kabupaten Bandung (150 L/s). The existing Pipa Baru 850 mm would remain unchanged and continue to deliver water to IPA Badaksinga. Currently the Pipa Lama delivers water (estimated to be 660 L/s) to IPA Badaksinga where it is treated before distribution to the service area. Thus implementing this proposal would require a water treatment facility for the Cisangkuy water and a replacement water supply for IPA Badaksinga. Therefore the proposed project also includes:
1. Constructing IPA Cimenteng (1100 L/s) at a location about 4 kilometers from the water source (Sungai Cisangkuy) to treat the water
2. Constructing transmission pipelines from PLTA Dago Bengkok II to deliver 600 L/s from the Sungai Cikapundung to IPA Badaksinga.
Cikapundung III
Kota & Kab
North
Cikapundung III Dago Bengkok II
IPA BADAKSINGA
P i
p a
B a r u
CISANGKUY [BAK PRASED II]
IPA Cimenteng
PROPOSED EXISTING
IPA BADAKSINGA
CISANGKUY [BAK PRASED II]
P i p a
B a
r u
P i p a
L
a m
a
To evaluate this proposal Consultant used EPANET computer software program for hydraulic analysis and results show the proposal to be technically feasible. Flow can be by gravity if the outlet of the clearwell of the new treatment plant is at or above elevation 790 meters. During Detailed Engineering Design data about flows and elevations should be verified and minor hydraulic losses estimated. Risks include inability to deliver full volume of water to IPA Badaksinga from Pipa Baru due to water losses and reduced hydraulic capacity; and from Dago Bengkok because of water shortages during the dry season. This scheme adds 1,000 L/s to the PDAM water supply, sufficient to serve 130,000 houses. However taking into consideration water lost (about 40%) and water to serve non-domestic customers, the number of houses that can be served is about 62,000.


1. INTRODUCTION
1.1. OBJECTIVES OF THIS STUDY PDAM Kota Bandung requested assistance from the USAID Environmental Services Program (ESP) to do a technical study of a proposal to take water from the Cisangkuy River, treat it at a location in Cimenteng area; and send the water to the southern area of Kota Bandung between Jalan Tol Padalarang Cileunyi and Jalan Soekarno Hatta. This Technical Study starts with a description of the proposed project including other facilities needed for implementation; next it analyzes the proposal in terms of hydraulics and water demand through year 2015; and then recommends a course of action for the PDAM.
Figure 1 Proposed Cimenteng Water Supply

TECHNICAL FEASIBILITY STUDY FOR PDAM KOTA BANDUNG CIMENTENG WATER SUPPLY SYSTEM
1.2. METHODOLOGY ESP-Jakarta provided a two-person-technical study team (International Water Supply Engineer and Local PDAM Water Supply Engineer) that mobilized 20 February 2006 to Kota Bandung. Based on discussion with PDAM staff the methodology shown below was used.
STEPS ACTIVITIES1 PROBLEM DEFINITION Scope and Area of Study
2 DATA COLLECTION Reports--Interviews--Site Visits
Water Supply Sources and CapacityEPANET (computer software program for hydraulic analysis)Population Projections to Year 2015
Water Demand in the Study Area
Volume of water
Costs to Construct and Operate
Stop--Further Study--Proceed
Actions to Optimize
7 NEXT STEPS Outline Plan for Implementation
RECOMMENDATIONS6
3
4
5
Proposed Project (IPA, pipelines)[size, materials, costs]
EVALUATION
DATA ANALYSIS
PROJECT DEFINITION
Figure 2 Study Methodology
ENVIRONMENTAL SERVICES PROGRAM WWW.ESP.OR.ID 8
TECHNICAL FEASIBILITY STUDY FOR PDAM KOTA BANDUNG CIMENTENG WATER SUPPLY SYSTEM
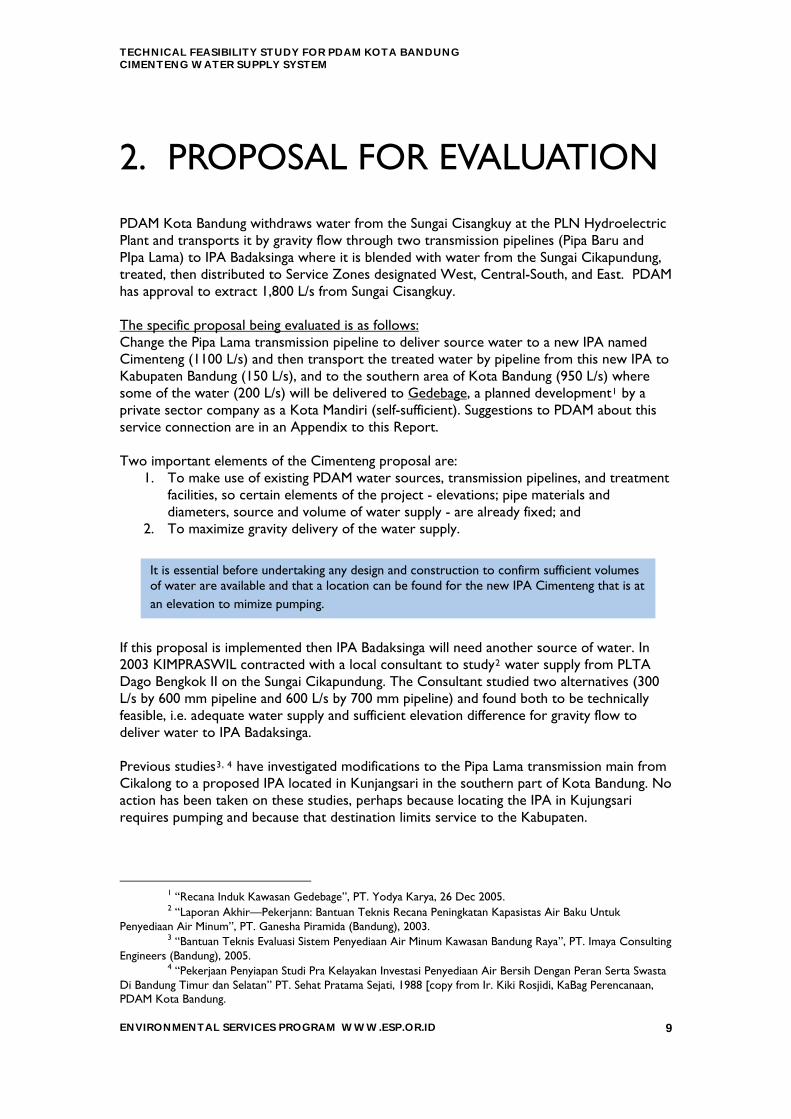
2. PROPOSAL FOR EVALUATION PDAM Kota Bandung withdraws water from the Sungai Cisangkuy at the PLN Hydroelectric Plant and transports it by gravity flow through two transmission pipelines (Pipa Baru and PIpa Lama) to IPA Badaksinga where it is blended with water from the Sungai Cikapundung, treated, then distributed to Service Zones designated West, Central-South, and East. PDAM has approval to extract 1,800 L/s from Sungai Cisangkuy. The specific proposal being evaluated is as follows: Change the Pipa Lama transmission pipeline to deliver source water to a new IPA named Cimenteng (1100 L/s) and then transport the treated water by pipeline from this new IPA to Kabupaten Bandung (150 L/s), and to the southern area of Kota Bandung (950 L/s) where some of the water (200 L/s) will be delivered to Gedebage, a planned development1 by a private sector company as a Kota Mandiri (self-sufficient). Suggestions to PDAM about this service connection are in an Appendix to this Report. Two important elements of the Cimenteng proposal are:
1. To make use of existing PDAM water sources, transmission pipelines, and treatment facilities, so certain elements of the project - elevations; pipe materials and diameters, source and volume of water supply - are already fixed; and
2. To maximize gravity delivery of the water supply.
It is essential before undertaking any design and construction to confirm sufficient volumes of water are available and that a location can be found for the new IPA Cimenteng that is at an elevation to mimize pumping.
If this proposal is implemented then IPA Badaksinga will need another source of water. In 2003 KIMPRASWIL contracted with a local consultant to study2 water supply from PLTA Dago Bengkok II on the Sungai Cikapundung. The Consultant studied two alternatives (300 L/s by 600 mm pipeline and 600 L/s by 700 mm pipeline) and found both to be technically feasible, i.e. adequate water supply and sufficient elevation difference for gravity flow to deliver water to IPA Badaksinga. Previous studies3, 4 have investigated modifications to the Pipa Lama transmission main from Cikalong to a proposed IPA located in Kunjangsari in the southern part of Kota Bandung. No action has been taken on these studies, perhaps because locating the IPA in Kujungsari requires pumping and because that destination limits service to the Kabupaten.
1 “Recana Induk Kawasan Gedebage”, PT. Yodya Karya, 26 Dec 2005. 2 “Laporan Akhir—Pekerjann: Bantuan Teknis Recana Peningkatan Kapasistas Air Baku Untuk
Penyediaan Air Minum”, PT. Ganesha Piramida (Bandung), 2003. 3 “Bantuan Teknis Evaluasi Sistem Penyediaan Air Minum Kawasan Bandung Raya”, PT. Imaya Consulting
Engineers (Bandung), 2005. 4 “Pekerjaan Penyiapan Studi Pra Kelayakan Investasi Penyediaan Air Bersih Dengan Peran Serta Swasta
Di Bandung Timur dan Selatan” PT. Sehat Pratama Sejati, 1988 [copy from Ir. Kiki Rosjidi, KaBag Perencanaan, PDAM Kota Bandung.
ENVIRONMENTAL SERVICES PROGRAM WWW.ESP.OR.ID 9
TECHNICAL FEASIBILITY STUDY FOR PDAM KOTA BANDUNG CIMENTENG WATER SUPPLY SYSTEM
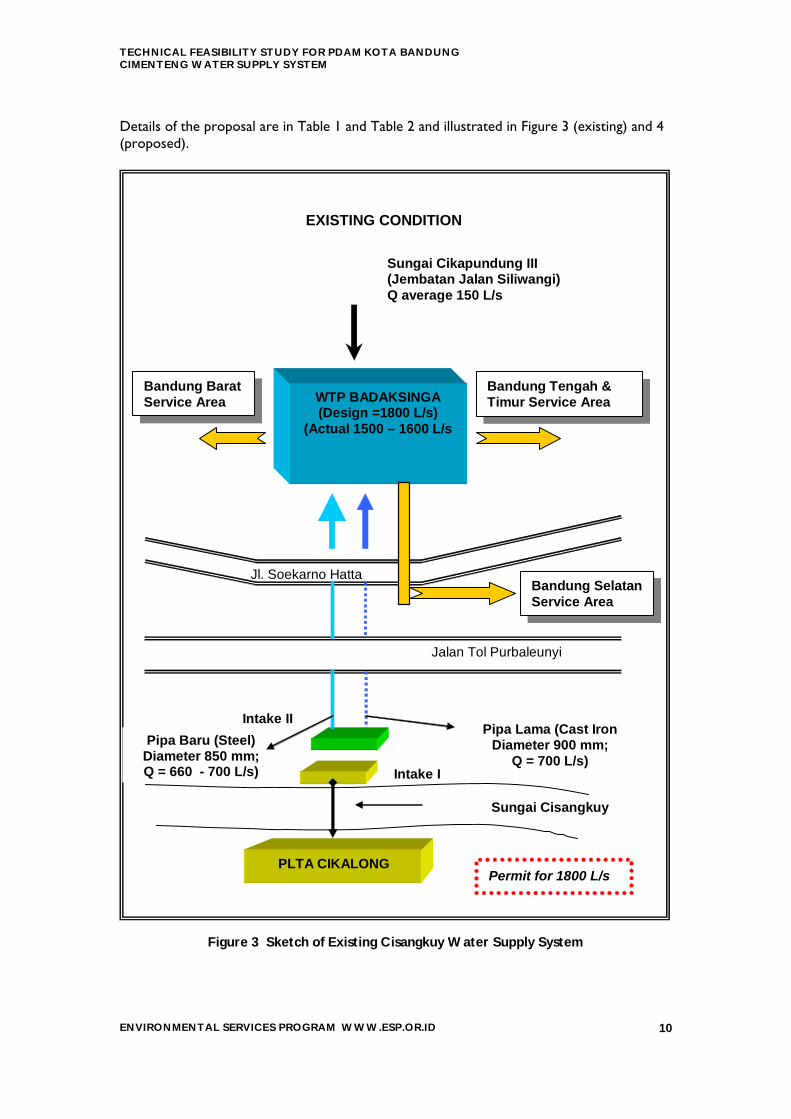
Details of the proposal are in Table 1 and Table 2 and illustrated in Figure 3 (existing) and 4 (proposed).
Intake II
Intake I
Pipa Lama (Cast Iron Diameter 900 mm;
Q = 700 L/s)
WTP BADAKSINGA(Design =1800 L/s)
(Actual 1500 – 1600 L/s
Jl. Soekarno Hatta
Sungai Cisangkuy
PLTA CIKALONG
Jalan Tol Purbaleunyi
Pipa Baru (Steel) Diameter 850 mm; Q = 660 - 700 L/s)
EXISTING CONDITION
Sungai Cikapundung III(Jembatan Jalan Siliwangi) Q average 150 L/s
Permit for 1800 L/s
Bandung Tengah & Timur Service Area
Bandung Selatan Service Area
Bandung Barat Service Area
Figure 3 Sketch of Existing Cisangkuy Water Supply System
ENVIRONMENTAL SERVICES PROGRAM WWW.ESP.OR.ID 10

TECHNICAL FEASIBILITY STUDY FOR PDAM KOTA BANDUNG CIMENTENG WATER SUPPLY SYSTEM
Table 1 Details of Proposed Cimenteng Project STRUCTURE PARAMETER EXISTING PROPOSED
Location S. Cisangkuy SOURCE Volume 1800 L/s
No Change
Year Constructed 1988--1989
Material Steel with Cement Lining
Diameter 850 mm Design Capacity 800 L/s Current Capacity* 660 L/s
Length 31.25 km Serves IPA Badaksinga
No Change PIPA BARU
Bulk Meter None Pitot Tube Meter Year Constructed 1956--1959 Material Grey Cast Iron
Diameter 800 mm (to km 14.2) 900 mm (17.0 km)
Design Capacity 1000 L/s
No Change
Current Capacity* 660 to 700 L/s 1100 L/s
Part I = ~4 km Length 31.25 km Part II = ~17 km
Serves IPA Badaksinga South Kota (750 L/s) Gedebage (200 L/s)
Kab. Bandung (150 L/s)
PIPA LAMA
Bulk Meter None Pitot Tube Meter TREATMENT (design flow) IPA IPA Badaksinga
(1800 L/s) IPA Badaksinga and IPA Cimenteng (1100 L/s)
Data Sources : (1) PDAM Kota Bandung; (2) ”Ringkasan Eksekutif, Bantuan Teknis Evaluasi Sistem Penyediaan Air Minum Kawasan Bandung Raya” by CV. Imaja, Bandung, 2005; and (3) “Bandung Water Supply Augmentation and Improvement—Phase 2, DED; Final Design Report, Vol. 3A: Cisangkuy Water Works Design Report” by DHV, IWACO, PT. Descerco, and PT. Waseco Tirta, Jan. 1988. Table 2 Details of Proposed Transmission from Dago Bengkok II STRUCTURE PARAMETER PROPOSED
Location S. Cikapundung Volume 600 L/s Material Steel with Cement Lining Diameter 700 mm Design Capacity 600 L/s Length 4.1 km Serves IPA Badaksinga
SOURCE
Bulk Meter Pitot Tube Meter Data Sources---(1) Bab. III, Bantuan Teknis Evaluasi Sistem Penyediaan Air Minum Kawasan Bandung Raya” by CV. Imaja, Bandung, 2005; and (2) “Laporan Akhir—Pekerjann: Bantuan Teknis Recana Peningkatan Kapasistas Air Baku Untuk Penyediaan Air Minum”, PT. Ganesha Piramida (Bandung), 2003.
ENVIRONMENTAL SERVICES PROGRAM WWW.ESP.OR.ID 11

TECHNICAL FEASIBILITY STUDY FOR PDAM KOTA BANDUNG CIMENTENG WATER SUPPLY SYSTEM
South Bandung Service Area
Intake II
Intake I
Pipa Lama (Cast Iron) Diameter 900 mm;
Q = 1100 L/s
WTP BADAKSINGA
(Design 1800 L/S) (Actual 1300 L/s)
Jl. Soekarno Hatta
Sungai Cisangkuy
PLTA CIKALONG
Jalan Tol Purbaleunyi
Pipa Baru (Steel) Diameter 850 mm;
Q = 700 L/s
PROPOSED SYSTEM
Proposed IPA Cimenteng Q = 1100 l/s
ENVIRONMENTAL SERVICES PROGRAM WWW.ESP.OR.ID 12
M
Proposed Valve
Proposed Water Meter
900 mm pipe 850 mm pipe
PLTA DAGO (Bengkok II)
Proposed 700 mm Pipe with flow 600 L/s
Permit for 1800 L/s
Figure 4 Sketch of Proposed Cimenteng and Dago Bengkok II Projects
[from Bantuan Teknis Evaluasi Sistem Penyediaan Air Minum Kawasan Bandung Raya” by CV. Imaja, Bandung, 2005]

TECHNICAL FEASIBILITY STUDY FOR PDAM KOTA BANDUNG CIMENTENG WATER SUPPLY SYSTEM
3. ENGINEERING ANALYSIS OF PROPOSED PROJECT
The engineering analysis of this study focused on answering these questions:
1. What treatment is needed at the proposed IPA Cimenteng? 2. Can sufficient volume of water be transmitted by gravity from IPA Cimenteng to the
Service Zone (southern part of Kota Bandung)? 3. Will the volume delivered to the Service Zone be adequate to serve the expected
population in the year 2015? This section describes approach, analysis, and results for the first two questions. Question #3--water Demand--is discussed in Section 4.
3.1. SOURCE WATER QUALITY AND TREATMENT
Sungai Cisangkuy is a major tributary of Sungai Citarum. The PDAM intake is about 150 meters downstream of the three PLN Cikalong Hydro-electric Power Plants (PLTA). There is sufficient quantity year-round and water quality is generally good. Cisangkuy water turbidity5 is on the order of 20 NTU although in November 2005 it was reported to be over 6000 NTU. Water from Cisangkuy goes to the IPA Badaksinga where it is blended with water from the Sungai Cikapundung. The combined waters are treated by coagulation with poly-aluminum chloride, flocculation, sedimentation, filtration, and disinfection (chlorine gas).
COAGULATION
FLOCCULATION
SEDIMENTATION
Alum & Alkali (Lime)
PROCESS TREATMENT IN THE EXISTING BADAKSINGA WTP
Disinfectant
Cikapundung
Cisangkuy
FILTRATIONWITH AIR & WATER BACKWASH
CLEAR WELL
Figure 5 Sketch of IPA Badaksinga Water Treatment Process
5 Interview with Agus Wahyu, Supervisor, IPA Badaksinga, 16 March 2006
ENVIRONMENTAL SERVICES PROGRAM WWW.ESP.OR.ID 13

TECHNICAL FEASIBILITY STUDY FOR PDAM KOTA BANDUNG CIMENTENG WATER SUPPLY SYSTEM
Filters are backwashed by air and water every 24 hours. Sedimentation basin residuals and filter backwash water are discharged to the Sungai Cikapundung. The plant operates 24 hours a day with two shifts, each with 12 operators and one supervisor. There is a water quality laboratory. IPA Badaksinga design was based on maximum influent turbidity of 200 NTU. With the majority of water from Cisangkuy, the high turbidity of Cikapundung is diluted. However Dago Bengkok connection increases Cikapundung water and disconnecting Pipa Lama decreases Cisangkuy water so the IPA Badaksinga needs modification of the chemical dosing system to treat the increased turbidity; and increased supply from the Sungai Cikapundung requires inlet pipe modifications and a Venturi meter to measure flow. As soon as possible, PDAM should conduct pilot studies to determine the most cost effective treatment process for Cisangkuy water. The process now used at IPA Badaksinga will work; chemical dosages should be less since the water quality of Cisangkuy is better than that of water from Cikapundung. However there may be differences in chemical composition (alkalinity, hardness); different physical settling characteristics of solids (turbidity); and there may be other suitable treatment methods. All these can be measured by pilot testing. The DED engineer will use results from the pilot studies to specify the treatment process and estimate operating costs, so these studies should start soon. The exact area of land needed for a water treatment plant depends on the design capacity and the treatment processes. For purposes of locating a suitable site now, it would be reasonable to assume four hectares of land.
3.2. HYDRAULIC ANALYSIS The purpose of this analysis is to determine elevations needed for gravity flow and to confirm delivery of required volumes of water to IPA Badaksinga. Flows in the transmission pipeline were simulated using EPANET, a computer software program for analyzing the hydraulic and water quality behavior of pressurized pipe networks. EPANET was developed by the United States Environmental Protection Agency (USEPA) National Risk Management Research Laboratory. It is public domain software that may be freely copied and distributed. EPANET Version 2 is designed to run under the Windows 95/98/NT operating system of an IBM/Intel-compatible personal computer. The software program and Users Manual can be downloaded at no cost from: http://www.epa.gov/nrmrl/wswrd/epanet.html Figure 6 is the EPANET network diagram for the existing system. The diagram starts on the left side with the Cisangkuy source and moves to the right to the IPA Badaksinga. The top line is the Pipa Baru which will continue to transmit water from Cisangkuy to IPA Badaksinga. The bottom line is the Pipa Lama. Valves with short sections of pipe are a fiction created to simulate limitations in water availability, i.e. maximum water from Cisangkuy is 1,800 L/s and maximum water into IPA Badaksinga is 1,400 L/s.
ENVIRONMENTAL SERVICES PROGRAM WWW.ESP.OR.ID 14

TECHNICAL FEASIBILITY STUDY FOR PDAM KOTA BANDUNG CIMENTENG WATER SUPPLY SYSTEM
Figure 6 EPANET Network Diagram for Existing System Figure 7 is the diagram used for a computer simulation to determine flows from and elevation of IPA Cimenteng. In this figure the bottom line is the Pipa Lama that is proposed to serve IPA Cimenteng and then transmit water to Kabupaten Bandung and Kota Bandung
Figure 7 EPANET Network Diagram for IPA Cimenteng Analysis
ENVIRONMENTAL SERVICES PROGRAM WWW.ESP.OR.ID 15
TECHNICAL FEASIBILITY STUDY FOR PDAM KOTA BANDUNG CIMENTENG WATER SUPPLY SYSTEM
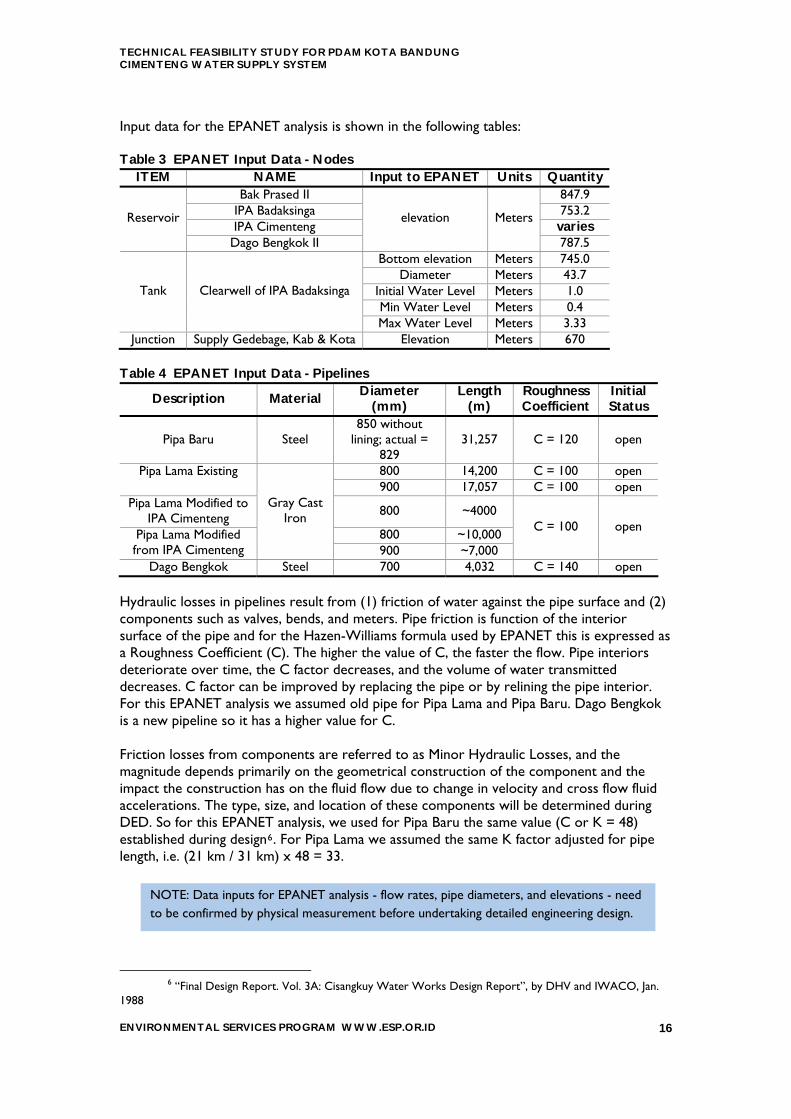
Input data for the EPANET analysis is shown in the following tables: Table 3 EPANET Input Data - Nodes
ITEM NAME Input to EPANET Units Quantity Bak Prased II 847.9
IPA Badaksinga 753.2 IPA Cimenteng varies
Reservoir
Dago Bengkok II
elevation Meters
787.5 Bottom elevation Meters 745.0
Diameter Meters 43.7 Initial Water Level Meters 1.0 Min Water Level Meters 0.4
Tank Clearwell of IPA Badaksinga
Max Water Level Meters 3.33 Junction Supply Gedebage, Kab & Kota Elevation Meters 670
Table 4 EPANET Input Data - Pipelines
Description Material Diameter (mm)
Length (m)
Roughness Coefficient
Initial Status
Pipa Baru Steel 850 without
lining; actual = 829
31,257 C = 120 open
800 14,200 C = 100 open Pipa Lama Existing 900 17,057 C = 100 open
Pipa Lama Modified to IPA Cimenteng 800 ~4000
800 ~10,000 Pipa Lama Modified from IPA Cimenteng
Gray Cast Iron
900 ~7,000
C = 100 open
Dago Bengkok Steel 700 4,032 C = 140 open Hydraulic losses in pipelines result from (1) friction of water against the pipe surface and (2) components such as valves, bends, and meters. Pipe friction is function of the interior surface of the pipe and for the Hazen-Williams formula used by EPANET this is expressed as a Roughness Coefficient (C). The higher the value of C, the faster the flow. Pipe interiors deteriorate over time, the C factor decreases, and the volume of water transmitted decreases. C factor can be improved by replacing the pipe or by relining the pipe interior. For this EPANET analysis we assumed old pipe for Pipa Lama and Pipa Baru. Dago Bengkok is a new pipeline so it has a higher value for C. Friction losses from components are referred to as Minor Hydraulic Losses, and the magnitude depends primarily on the geometrical construction of the component and the impact the construction has on the fluid flow due to change in velocity and cross flow fluid accelerations. The type, size, and location of these components will be determined during DED. So for this EPANET analysis, we used for Pipa Baru the same value (C or K = 48) established during design6. For Pipa Lama we assumed the same K factor adjusted for pipe length, i.e. (21 km / 31 km) x 48 = 33. NOTE: Data inputs for EPANET analysis - flow rates, pipe diameters, and elevations - need
to be confirmed by physical measurement before undertaking detailed engineering design.
6 “Final Design Report. Vol. 3A: Cisangkuy Water Works Design Report”, by DHV and IWACO, Jan.
1988
ENVIRONMENTAL SERVICES PROGRAM WWW.ESP.OR.ID 16
TECHNICAL FEASIBILITY STUDY FOR PDAM KOTA BANDUNG CIMENTENG WATER SUPPLY SYSTEM
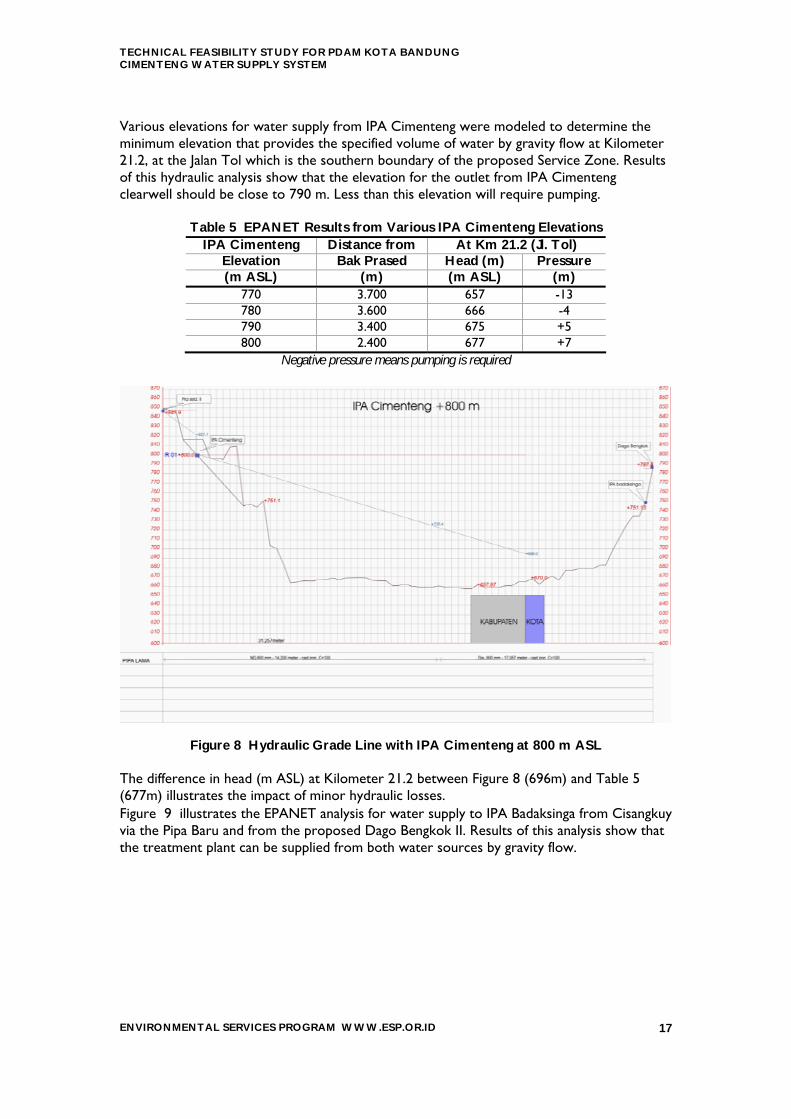
Various elevations for water supply from IPA Cimenteng were modeled to determine the minimum elevation that provides the specified volume of water by gravity flow at Kilometer 21.2, at the Jalan Tol which is the southern boundary of the proposed Service Zone. Results of this hydraulic analysis show that the elevation for the outlet from IPA Cimenteng clearwell should be close to 790 m. Less than this elevation will require pumping.
Table 5 EPANET Results from Various IPA Cimenteng Elevations IPA Cimenteng Distance from At Km 21.2 (Jl. Tol)
Elevation Bak Prased Head (m) Pressure (m ASL) (m) (m ASL) (m)
770 3.700 657 -13 780 3.600 666 -4 790 3.400 675 +5 800 2.400 677 +7
Negative pressure means pumping is required
Figure 8 Hydraulic Grade Line with IPA Cimenteng at 800 m ASL The difference in head (m ASL) at Kilometer 21.2 between Figure 8 (696m) and Table 5 677m) illustrates the impact of minor hydraulic losses. (
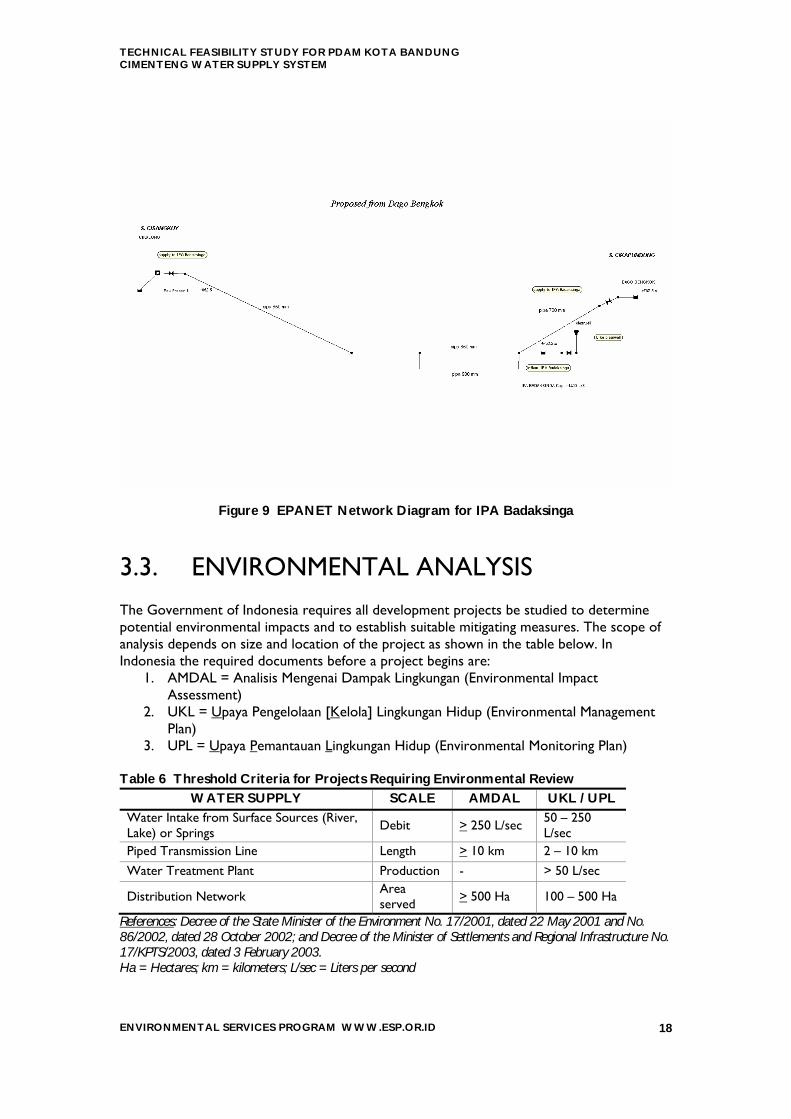
Figure 9 illustrates the EPANET analysis for water supply to IPA Badaksinga from Cisangkuy via the Pipa Baru and from the proposed Dago Bengkok II. Results of this analysis show that the treatment plant can be supplied from both water sources by gravity flow.
ENVIRONMENTAL SERVICES PROGRAM WWW.ESP.OR.ID 17
TECHNICAL FEASIBILITY STUDY FOR PDAM KOTA BANDUNG CIMENTENG WATER SUPPLY SYSTEM
Figure 9 EPANET Network Diagram for IPA Badaksinga
3.3. ENVIRONMENTAL ANALYSIS The Government of Indonesia requires all development projects be studied to determine potential environmental impacts and to establish suitable mitigating measures. The scope of analysis depends on size and location of the project as shown in the table below. In Indonesia the required documents before a project begins are:
1. AMDAL = Analisis Mengenai Dampak Lingkungan (Environmental Impact Assessment)
2. UKL = Upaya Pengelolaan [Kelola] Lingkungan Hidup (Environmental Management Plan)
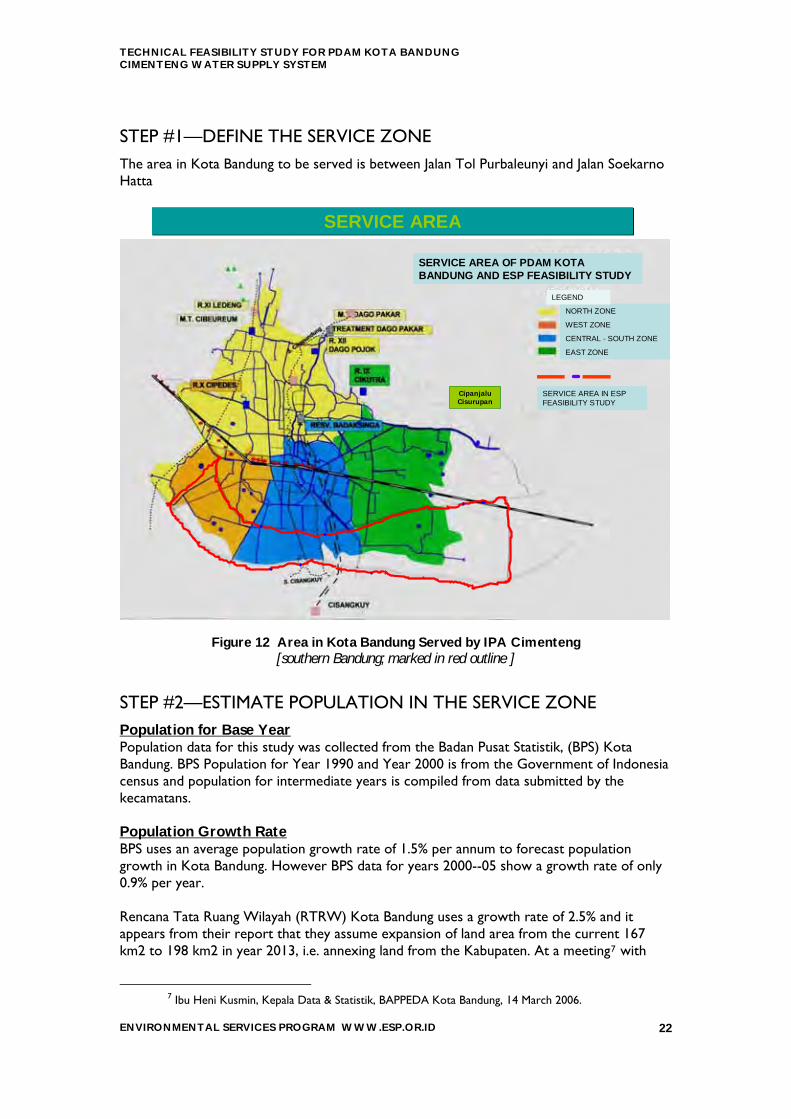
3. UPL = Upaya Pemantauan Lingkungan Hidup (Environmental Monitoring Plan) Table 6 Threshold Criteria for Projects Requiring Environmental Review
WATER SUPPLY SCALE AMDAL UKL / UPL Water Intake from Surface Sources (River, Lake) or Springs Debit > 250 L/sec 50 – 250
L/sec Piped Transmission Line Length > 10 km 2 – 10 km Water Treatment Plant Production - > 50 L/sec
Distribution Network Area served > 500 Ha 100 – 500 Ha
References: Decree of the State Minister of the Environment No. 17/2001, dated 22 May 2001 and No. 86/2002, dated 28 October 2002; and Decree of the Minister of Settlements and Regional Infrastructure No. 17/KPTS/2003, dated 3 February 2003. Ha = Hectares; km = kilometers; L/sec = Liters per second
ENVIRONMENTAL SERVICES PROGRAM WWW.ESP.OR.ID 18

TECHNICAL FEASIBILITY STUDY FOR PDAM KOTA BANDUNG CIMENTENG WATER SUPPLY SYSTEM
The proposed Cimenteng project involves modifying existing structures and constructing a new IPA. From the table above it appears UKL / UPL for IPA and pipelines will be sufficient. In 2004 PDAM completed UKL / UPL for Dago Bengkok transmission pipeline of capacity 300 L/s.
3.4. CONSTRUCTION SEQUENCE To do this work the Contractor will cut the existing Pipa Lama transmission pipeline in three different locations and reconnect to the new IPA Cimenteng at two of those locations. This will disrupt flow to IPA Badaksinga that can be replaced by supply from Dago Bengkok II via new transmission pipelines that must be connected to the IPA Badaksinga. To assure success and minimize disruptions, it is important that PDAM review in detail the sequence of activities; to schedule these disconnections and connections at a time of low water use; and to inform the public when to expect water outages and for what duration. Terms of Reference for the Contractor should include requirements to present in advance a schedule for this particular activity to be reviewed and approved before commencement. The schedule should show in detail day, time, work crews, equipment, and contingency plans.
Quantify The Current Water
in the Transmission
Pipe from Cisangkuy & Cikapundung
Construction Dago Bengkok II
DED & Construction Cimenteng WTP
Rehabilitation as Required for Cisangkuy System
Modification on
Badaksinga
Repair the Leakage & Expand Distribution Network in Southern Bandung
THE SEQUENCES OF CIKAPUNDUNG & CISANGKUY/CIMENTENG PROJECTS
Connect Pipa
Lama to Cimenteng
Unconnect the Pipa Lama from Badaksinga
Connect Dago Bengkok II to Badaksinga
Reline Pipa Baru
Pilot Study Water Treatment
Set Up the Method of Water Sale to Gedebage & Kab. Bandung
Figure 10 Sequence of Construction Activities
ENVIRONMENTAL SERVICES PROGRAM WWW.ESP.OR.ID 19

TECHNICAL FEASIBILITY STUDY FOR PDAM KOTA BANDUNG CIMENTENG WATER SUPPLY SYSTEM
3.5. INCREASE IN WATER SUPPLY The following table shows the total gain in PDAM water supply by implementing this project. See Figure 11 for details.
Table 7 Changes (L/s) in PDAM Water Supply Liters Per Second
(L/s) WATER SOURCE TRANSMISSION PIPELINE
Now Future Pipa Baru 700
ENVIRONMENTAL SERVICES PROGRAM WWW.ESP.OR.ID 20
700 Cisangkuy Pipa Lama 700 1100 Cikapundung III 200 200 Cikapundung Dago Bengkok 0 600
2 4 1600 2600 GAIN OF 1000
W ATER DELIVERY TO IPA BADAKSINGA & CIM EN TEN G
SOU RCE
INTAKE/ TRANSM ISSION
C isangkuy
1800 L/s
P ipa Lam a 700 L/s
P ipa Baru 700 L/s
C ikapundung
200 L/s
200 L/s
Dago Bengkok II
C ikapundun g III S iliw angi
N O W
1600 L/s
PLAN
700 L/s
600L/s
1500 L/s
D ELIVERY TO EXISTING IPA BAD AKSING A
600L/s
D ELIVERY TO PLANNED CIM ENTENG
1100 L/s
PLAN
SU PPORTACTIVI
Pipe Cutti
**Pipe Relin ing
**Q uantifthe CurreW ater
BadaksingM odificat
1100 L/s
D istributiRehabilita
**Q uantifthe CurreW ater
** recom m end
200 L/s
Figure 11 Summary of Changes in Water Supply

TECHNICAL FEASIBILITY STUDY FOR PDAM KOTA BANDUNG CIMENTENG WATER SUPPLY SYSTEM
4. POPULATION AND WATER DEMAND IN YEAR 2015
This section explains the methodology and results for estimating population and water demand in year 2015 for the area in southern Bandung that will be supplied by the proposed IPA Cimenteng system. The procedure used involved a multi-step process. Table 8 lists the steps. Table 8 Procedure to Estimate Water Demand in Year 2015
Step Activity Source or Formula 1 Define Zone of Service Ask PSAM ti mark map 2 Estimate Population in the Zone of Service Pop in Zone = (Total Pop. In Kec.) × (% of
Kec. In Zone) 2.1 Review map to estimate % land area in the
zone
2.2 Get population for each Kelurahan in the zone
BPS year 2004
2.3 Calculate population in each Kecamatan BPS (year 2004) for Kelurahan × % land area in Service Zone
3 Estimate Number of House Connections (HC)
3.1 Number of connections by customer category for each Wilayah
Data from PDAM
3.2 Calculate HC connections (Total PDAM connections) × (HC as % of Total)
4 Estimate Current Level by of Coverage by PDAM
4.1 Number of people per House Connections (HC)
Per PDAM, use 5
4.2 Calculate % Coverage % Coverage = [(PDAM HC) × (# people/HC)]/ [(Kec. Pop.)]
4.3 Evaluation % Coverage to determine if PDAM goal possible
5 Estimate Demand per HC for each Wilayah Data from PDAM m3/ month/ connection converted to L/S Demand
5.1 Evaluate data to establish single value to use
6 Forecast Future Population and Water Demand
6.1 Estimate future population Pop. In year #2 = (Pop. In year #1) × (1+ Growth Rate)
6.2 Estimate # HC per year by based on different scenarios
(Population / 5) × % HC Coverage
Water Demand = (#HC × m3 / connection / month)
6.3 Estimate domestic (HC) water demand
6.4 Estimate total water demand (L/s) (HC Water Demand)/ (% Water Used by HC)
6.5 Estimate amount of loss water 6.6 Calculate Required Water Production (L/s) (Total Water Demand) × (1+% Water
Loss)
ENVIRONMENTAL SERVICES PROGRAM WWW.ESP.OR.ID 21
TECHNICAL FEASIBILITY STUDY FOR PDAM KOTA BANDUNG CIMENTENG WATER SUPPLY SYSTEM
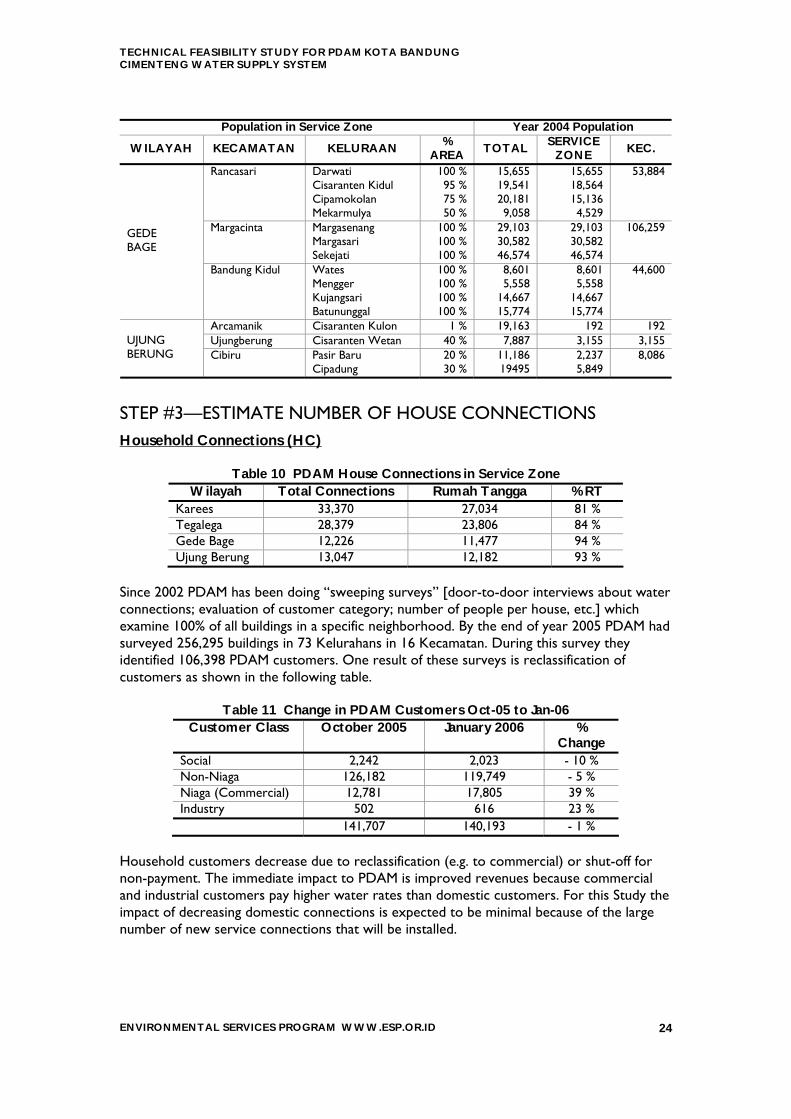
STEP #1—DEFINE THE SERVICE ZONE The area in Kota Bandung to be served is between Jalan Tol Purbaleunyi and Jalan Soekarno Hatta
SERVICE AREASERVICE AREA
CipanjaluCisurupan
NORTH ZONE
WEST ZONE
CENTRAL - SOUTH ZONE
EAST ZONE
LEGEND
SERVICE AREA IN ESP FEASIBILITY STUDY
SERVICE AREA OF PDAM KOTA BANDUNG AND ESP FEASIBILITY STUDY
Figure 12 Area in Kota Bandung Served by IPA Cimenteng [southern Bandung; marked in red outline ]
STEP #2—ESTIMATE POPULATION IN THE SERVICE ZONE Population for Base Year Population data for this study was collected from the Badan Pusat Statistik, (BPS) Kota Bandung. BPS Population for Year 1990 and Year 2000 is from the Government of Indonesia census and population for intermediate years is compiled from data submitted by the kecamatans. Population Growth Rate BPS uses an average population growth rate of 1.5% per annum to forecast population growth in Kota Bandung. However BPS data for years 2000--05 show a growth rate of only 0.9% per year. Rencana Tata Ruang Wilayah (RTRW) Kota Bandung uses a growth rate of 2.5% and it appears from their report that they assume expansion of land area from the current 167 km2 to 198 km2 in year 2013, i.e. annexing land from the Kabupaten. At a meeting7 with
7 Ibu Heni Kusmin, Kepala Data & Statistik, BAPPEDA Kota Bandung, 14 March 2006.
ENVIRONMENTAL SERVICES PROGRAM WWW.ESP.OR.ID 22

TECHNICAL FEASIBILITY STUDY FOR PDAM KOTA BANDUNG CIMENTENG WATER SUPPLY SYSTEM
BAPPEDA, they explained their population growth rate considers economic factors and the 2.5% growth rate is based on expected development of Gedebage. PLN no longer uses population to forecast electricity demand. The PLN is based on the following three factors8
1. economy (if good, then electricity consumption higher) 2. statistical analysis for past 5 years of natural growth of electricity usage based on
customers having more electric appliances 3. regional development in Propinsi Jawa Barat and Propinsi Banten)
PLN does not distinguish between Kota Bandung and Kabupaten Bandung; its service area is “Bandung Raya” (i.e. Greater Bandung). Based on discussions with PDAM, we used 1.5% for this study. Population in Future Years Population for each Kecamatan was calculated according to this formula:
Population Year (N) = Population Year (N-1) x (1 + Growth Rate)
Population Year (2015) = Population Year (2004) x (1 + 1.5%)11
Table 9 lists the administrative areas (Kecamatan and Kelurahan) in the Zone of Service and the estimated Year 2004 population. Percent Land Area is based on a visual estimate of a paper map.
Table 9 Estimated Year 2004 Population in Zone of Service Population in Service Zone Year 2004 Population
WILAYAH KECAMATAN KELURAAN % AREA TOTAL SERVICE
ZONE KEC.
KAREES Regol Ciseureuh Pasirluyu
100 % 100 %
14,745 13,802
14,745 13,802
28547
Bojongloa Kaler Kopo 10 % 26,756 2,676 2,676 Bojongloa Kidul Cibaduyut Kidul
Cibaduyut Wetan Mekarwangi Cibaduyut Kebon Lega Situ Saeur
100 % 100 % 100 % 100 % 100 % 100 %
7,781 4,426 9,157 9,722 23,433 21,489
7,781 4,426 9,157 9,722 23,433 21,489
76,008
Babakan Ciparay Margasuka Cirangsang Margahayu Utara Babakan Ciparay Babakan Sukahaji
100 % 100 % 100 % 80 % 50 % 0 %
11,344 9,864 20,219 29,987 28,380 26,582
11,344 9,864 20,219 23,990 14,190
0
79,607
TEGALEGA
Bandung Kulon Gempolsari Cigondewah Kaler Cigondewah Kidul Cigondewah Rahayu Caringin Warung Muncang Cibuntu Cijerah
0 % 100 % 100 % 100 % 100 % 0 % 0 % 1%
18,010 19,347 6,954 8,507 9,867 20,973 18,450 24,971
0 19,347 6,954 8,507 9,867
0 0
250
44,925
8 Ir. Kriswanto, Manager Perencanaan Sistem Kelistrikan, PLN Distribusi Jawa Barat dan Banten, 14
March 2006.
ENVIRONMENTAL SERVICES PROGRAM WWW.ESP.OR.ID 23
TECHNICAL FEASIBILITY STUDY FOR PDAM KOTA BANDUNG CIMENTENG WATER SUPPLY SYSTEM
Population in Service Zone Year 2004 Population
WILAYAH KECAMATAN KELURAAN % AREA TOTAL SERVICE
ZONE KEC.
Rancasari Darwati Cisaranten Kidul Cipamokolan Mekarmulya
100 % 95 % 75 % 50 %
15,655 19,541 20,181 9,058
15,655 18,564 15,136 4,529
53,884
Margacinta Margasenang Margasari Sekejati
100 % 100 % 100 %
29,103 30,582 46,574
29,103 30,582 46,574
106,259 GEDE BAGE
Bandung Kidul Wates Mengger Kujangsari Batununggal
100 % 100 % 100 % 100 %
8,601 5,558
14,667 15,774
8,601 5,558
14,667 15,774
44,600
Arcamanik Cisaranten Kulon 1 % 19,163 192 192 Ujungberung Cisaranten Wetan 40 % 7,887 3,155
ENVIRONMENTAL SERVICES PROGRAM WWW.ESP.OR.ID 24
3,155 UJUNG BERUNG Cibiru Pasir Baru
Cipadung 20 % 30 %
11,186 19495
2,237 5,849
8,086
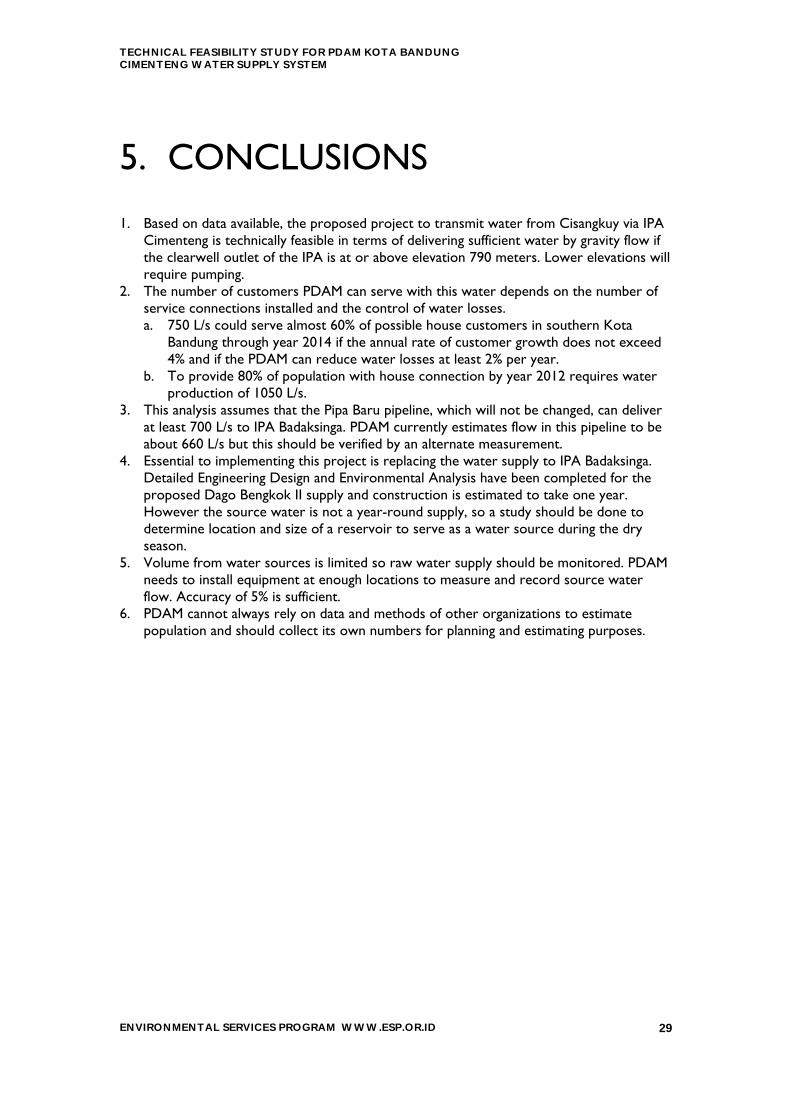
STEP #3—ESTIMATE NUMBER OF HOUSE CONNECTIONS Household Connections (HC)
Table 10 PDAM House Connections in Service Zone Wilayah Total Connections Rumah Tangga % RT
Karees 33,370 27,034 81 % Tegalega 28,379 23,806 84 % Gede Bage 12,226 11,477 94 % Ujung Berung 13,047 12,182 93 %
Since 2002 PDAM has been doing “sweeping surveys” [door-to-door interviews about water connections; evaluation of customer category; number of people per house, etc.] which examine 100% of all buildings in a specific neighborhood. By the end of year 2005 PDAM had surveyed 256,295 buildings in 73 Kelurahans in 16 Kecamatan. During this survey they identified 106,398 PDAM customers. One result of these surveys is reclassification of customers as shown in the following table.
Table 11 Change in PDAM Customers Oct-05 to Jan-06 Customer Class October 2005 January 2006 %
Change Social 2,242 2,023 - 10 % Non-Niaga 126,182 119,749 - 5 % Niaga (Commercial) 12,781 17,805 39 % Industry 502 616 23 % 141,707 140,193 - 1 %
Household customers decrease due to reclassification (e.g. to commercial) or shut-off for non-payment. The immediate impact to PDAM is improved revenues because commercial and industrial customers pay higher water rates than domestic customers. For this Study the impact of decreasing domestic connections is expected to be minimal because of the large number of new service connections that will be installed.

TECHNICAL FEASIBILITY STUDY FOR PDAM KOTA BANDUNG CIMENTENG WATER SUPPLY SYSTEM
STEP #4—ESTIMATE CURRENT LEVEL OF COVERAGE BY PDAM Number of People Per House Connection PDAM Sweeping Survey data indicate an average of 5 people per service connection, but according to BPS there are on average 3.6 people per house.
Table 12 Number of People per House in Kota Bandung Year Rumah Tangga # People per House 1980 274,401 5,3 1990 433,283 4,8 1995 559,360 3,2 2000 595,408 3,6 2005 Not available
Hasil pengelolahan Sensus 2000, BPS Propinsi Jawa Barat This difference between BPS and PDAM data results from different methods of counting the number of people per house. BPS counts number of "family cards" per address while PDAM counts number of people physically living in the dwelling. Consider for example one house with husband and wife who have a family card and the wife's mother who has her own family card. For BPS census, there are 1.5 people per house, but for PDAM water supply, there are three. Based on discussion with PDAM, we assume 5 people per house connection. Coverage in the Entire Kotamadya Analysis of PDAM Customer Data for January 2006 shows about 118,000 house connections in the Service Area. Assuming 5 people per connection, this means 590,000 people have direct piped water service, about 26% of the population in the Kotamadya. Data in the following table shows there are plenty of potential customers in south Bandung.
Table 13 Estimated Year 2004 PDAM Coverage Zone of Service
Wilayah
House Connections as %
of Total Connections
Kecamatan Total Kec. Pop. 2004
Total PDAM Customers
% Coverage
Karees 81 % Regol 77,298 8,035 42 % Bojongloa Kaler 115,830 6,046 22 % Bojongloa Kidul 76,008 4,350 24 % Babakan Ciparay 126,376 3,517
ENVIRONMENTAL SERVICES PROGRAM WWW.ESP.OR.ID 25
12 % Tegalega 84 %
Bandung Kulon 127,079 6,704 22 % Rancasari 64,435 2,070 15 % Margacinta 106,259 7,895 35 % Gede Bage 94 % Bandung Kidul 44,600 2,261 24 % Arcamanik 62,512 2,172 16 % Ujung Berung 76,825 1,401 9 % Ujung Berung 93 % Cibiru 79,350 83 0 %
4 11 956,572 44,534 % Coverage = [(Total PDAM Customers) × (HC as % of Total) × (5 people/ HC)] / (Kec. Pop.) PDAM believes the major factor limiting service connections is the availability of water and that they could install as many as 1,000 new service connections per month.

TECHNICAL FEASIBILITY STUDY FOR PDAM KOTA BANDUNG CIMENTENG WATER SUPPLY SYSTEM
STEP #5—ESTIMATE DEMAND PER HC FOR EACH WILAYAH Water Consumption per Domestic Service Connection PDAM data for October 2005 shows water consumption averages 20 m3 per month for all service connections and 19 m3/month/HC. This is supported by results from the Real Demand Survey (RDS) conducted in year 1999 that found a rate of 140 liters per person per day, which at 5 people per service connection is equivalent to 21 m3/connection/month. PDAM data allowed analysis of consumption data specific to the Service Zone and the results are shown in the following table.
Table 14 Water Consumption in the Service Zone Rumah Tangga (House) Customer Data
Wilayah Number of ustomers
Consumption (m3/month)
Rumah Tangga
m3/ month/RT Karees 27,034 422,425 16 Tegalega 23,806 356,424 15 Gede Bage 11,477 196,392 17 Ujung Berung 12,182 210,070 17
There is no reason to assume individual household water consumption will change significantly in the future because:
1. high costs of electricity are likely to preclude use of dishwashers 2. changes in bathing and toilet are more influenced by culture than product availability 3. density of housing limits size of outdoor landscaping.
Therefore assuming a demand of 20 m3/month/house allows for increased use over time.
STEP #6—ESTIMATE POPULATION AND WATER DEMAND TO YEAR 2015 To serve 80% of the population by House Connection by Year 2012 requires 8.1% annual average growth rate of HC. This is on the order of 700 new connections installed per month. Based on PDAM data we estimate 80% of the water supply is used for HC and the remainder for social, commercial, and industrial customers. So the total water demand is increased. Water Production depends on amount of water lost and we assumed Annual Reduction in Water Loss of 2% per year. Table 15 summarizes results.
ENVIRONMENTAL SERVICES PROGRAM WWW.ESP.OR.ID 26

TECHNICAL FEASIBILITY STUDY FOR PDAM KOTA BANDUNG CIMENTENG WATER SUPPLY SYSTEM
Table 15 Estimated Population and Average Water Production Required By South Bandung to Year 2015
FORECAST POPULATION AND WATER DEMAND TO YEAR 2015
2005 2007 2008 2010 2012 2014 2015 POPULATION 455,000 469,000 476,000 490,000 505,000 520,000 528,000 Annual Increase of HC 8,1 % % HC Coverage 23 % 39 % 47 % 64 % 80 % 96 % 100 % House Connections (HC) 20,900 36,800 45,000 62,200 80,500 99,700 105,600 #HC To Install Per Month - 700 700 700 800 800 700 HC Water Demand (L/s) 280 350 480 620 770 810 Total Water Demand (L/s) 350 440 600 780 960 1,010 Annual Reduction in Water Loss 2 %
Estimated Water Losses 40 % 36 % 34 % 30 % 26 % 22 % 20 % Required Water Production (L/s) 550 670 860 1,050 1,230 1,260
Annual Increase of HC 4,0 % % HC Coverage 23 % 31 % 35 % 43 % 51 % 59 % 63 % House Connections (HC) 20,900 29,100 33,300 42,100 51,500 61,400 66,500 #HC To Install Per Month - 300 300 400 400 400 400 HC Water Demand (L/s) 220 260 320 400 470 510 Total Water Demand (L/s) 280 330 400 500 590 640 Annual Reduction in Water Loss 2 %
Estimated Water Losses 40 % 36 % 34 % 30 % 26 % 22 % 20 % Required Water Production (L/s) 440 500 570 680 760 800
Formulas Used in Table Above
House Connections (HC) = (Population / 5) x % HC Coverage #HC to Install per Month = HC / (12 x number of years)
HC x (m3/month/house connection) HC Water Demand (L/s) = Total Water Demand (L/s) = Sosial + HC + Niaga + Industri Total Water Demand (L/s) = (HC Water Demand) / (% Water Used by HC)
Required Water Production (L/s) = (Total Water Demand) / (1 + %Water Loss)
Assumptions Used in the Table Above
Population growth rate 1.5% People per House Connection 5 m3/month/house connection 20 % of Total Water Supply Used by HC 80%
ENVIRONMENTAL SERVICES PROGRAM WWW.ESP.OR.ID 27

TECHNICAL FEASIBILITY STUDY FOR PDAM KOTA BANDUNG CIMENTENG WATER SUPPLY SYSTEM
Average Water Production Required for House Connection Growth
400
500
600
700
800
900
1,000
1,100
1,200
2007 2008 2009 2010 2011 2012 2013 2014 2015 2016
Years
Ave
rage
Wat
er P
rodu
ctio
n R
equi
red
(L/s
)
4%/yr HC & -2%/yr water loss
8.1%/yr HC & -2%/yr water loss
+8.1% annual increase of House Connections
+4% annual HC growth rate
Figure 13 Graph of Average Water Production Required for south Bandung through
Year 2015 The top line in this graph is based on an annual growth of House Connections of 8.1% to provide 80% service area coverage in Year 2012. With annual water loss reduction 2% a water production of 1050 L/s is needed in Year 2012. The bottom line in the graph shows that a slower increase in HC (4%) with same reduction of water losses that a production of 750 L/s is adequate through year 2014. Forecasting Water Demand depends on estimates of population growth, water consumption, service area coverage, and distribution system water losses. Overestimating results in excess construction and underutilized facilities; underestimating in unsatisfactory service due to water shortages. PDAM needs to accurately measure water production and consumption;; develop its own data for forecasting population growth; and continue to implement water loss reduction programs.
ENVIRONMENTAL SERVICES PROGRAM WWW.ESP.OR.ID 28
TECHNICAL FEASIBILITY STUDY FOR PDAM KOTA BANDUNG CIMENTENG WATER SUPPLY SYSTEM
5. CONCLUSIONS 1. Based on data available, the proposed project to transmit water from Cisangkuy via IPA
Cimenteng is technically feasible in terms of delivering sufficient water by gravity flow if the clearwell outlet of the IPA is at or above elevation 790 meters. Lower elevations will require pumping.
2. The number of customers PDAM can serve with this water depends on the number of service connections installed and the control of water losses. a. 750 L/s could serve almost 60% of possible house customers in southern Kota
Bandung through year 2014 if the annual rate of customer growth does not exceed 4% and if the PDAM can reduce water losses at least 2% per year.
b. To provide 80% of population with house connection by year 2012 requires water production of 1050 L/s.
3. This analysis assumes that the Pipa Baru pipeline, which will not be changed, can deliver at least 700 L/s to IPA Badaksinga. PDAM currently estimates flow in this pipeline to be about 660 L/s but this should be verified by an alternate measurement.
4. Essential to implementing this project is replacing the water supply to IPA Badaksinga. Detailed Engineering Design and Environmental Analysis have been completed for the proposed Dago Bengkok II supply and construction is estimated to take one year. However the source water is not a year-round supply, so a study should be done to determine location and size of a reservoir to serve as a water source during the dry season.
5. Volume from water sources is limited so raw water supply should be monitored. PDAM needs to install equipment at enough locations to measure and record source water flow. Accuracy of 5% is sufficient.
6. PDAM cannot always rely on data and methods of other organizations to estimate population and should collect its own numbers for planning and estimating purposes.
ENVIRONMENTAL SERVICES PROGRAM WWW.ESP.OR.ID 29


TECHNICAL FEASIBILITY STUDY FOR PDAM KOTA BANDUNG CIMENTENG WATER SUPPLY SYSTEM
6. RECOMMENDATIONS 1. MEASURE
a. Calibrate existing flow meters at IPA Badaksinga to confirm flows from Cisangkuy and Cikapundung
b. Install flow meters at other locations in the transmission system. To reduce costs, use portable, insertion flow meters with accuracy +5%. This data establishes a baseline for measuring water losses.
c. Conduct topographic surveys to accurately measure or confirm ground and pipe elevations.
2. STUDY a. Conduct pilot studies for treatment of Cisangkuy water. Results will be used in
designing IPA Cimenteng. Studies should cover both wet and dry season. b. Investigate conditions and costs for pipe relining. Relining Pipa Baru could restore
the original carrying capacity of 800 L/s. 3. OPTIMIZE
a. Continue efforts to reduce water losses in the distribution network. Reducing physical (“wet”) water losses makes more water available. Reducing commercial (“dry”) losses increases revenues.
b. Identify, inspect, and maintain valves. For transmission pipelines this should be done once a year. Water flow is restricted when valves are not in their proper position (open, closed). It commonly happens in large networks that valves get into the wrong position during repairs and installations.
4. DESIGN a. Begin Preliminary Engineering Design (PED) of the modified Pipa Lama transmission
pipeline to identify size and number of bends, valves, and fittings to include as minor losses in the hydraulic analysis
b. Schedule PED of IPA Cimenteng after pilot studies completed 5. PLAN
Sequence of activities as illustrated in Figure 10. 6. CONSIDER
a. Kabupaten Bandung has approval from Pengembangan Sumber Daya Air (PSDA) to withdraw 400 L/s from Cisangkuy. It would be reasonable for PDAM Kota Bandung to include this volume of water in the design of its treatment plant and transmission system, then deliver this volume to the Kabupaten via one or two metered connections. The Kabupaten would be bulk water customer.
b. The advantages of this proposal are economy of scale for infrastructure; Kabupaten gets its water supply; PDAM Kota Bandung gets a large customer; PDAM can use the water when the Kabupaten cannot.
ENVIRONMENTAL SERVICES PROGRAM WWW.ESP.OR.ID 30


TECHNICAL FEASIBILITY STUDY FOR PDAM KOTA BANDUNG CIMENTENG WATER SUPPLY SYSTEM
7. APPENDICES APPENDIX A INTERVIEWS AND REPORTS USED IN THIS TECHNICAL STUDY APPENDIX B DETAILS ABOUT PDAM KOTA BANDUNG APPENDIX C NOTES ON WATER SERVICE TO GEDEBAGE APPENDIX D OUTLINE IMPLEMENTATION PLAN APPENDIX E NOTES FOR MEETING (10 MARCH 2006) PDAM KOTA BANDUNG, USAID, and ESP-Jakarta APPENDIX F ESTIMATED PROJECT COSTS
ENVIRONMENTAL SERVICES PROGRAM WWW.ESP.OR.ID 31

TECHNICAL FEASIBILITY STUDY FOR PDAM KOTA BANDUNG CIMENTENG WATER SUPPLY SYSTEM
APPENDIX A INTERVIEWS AND REPORTS USED IN THIS TECHNICAL STUDY
INTERVIEWS
PDAM KOTA BANDUNG 1. Ir. Agung Sugianto, Bidang Penelitian Tehnik 2. Mohammad Moeslim, Ka. Sie. Perencanaan 3. Ir. H. Kiki Moch. Rosjidi, KaBag Perencanaan, 4. Hadi Pratama, Bidang Operasional 5. Dra. Titi Rachmawati, Kepala IPA Badaksinga 6. Agus Wahyu, Supervisor, IPA Badaksinga 7. Jhoni Wahdanu, Bagian Produksi Air Permukaan
OTHER AGENCIES 1. Staff Badan Pusat Statistik, Kota Bandung, 2. Ir. Kriswanto, Manager Perencanaan Sistem Kelistrikan, PLN Distribusi Jawa Barat dan
Banten, 14 March 2006. 3. Ibu Heni Kusmin, Kepala Data & Statistik, BAPPEDA Kota Bandung, 14 March 2006.
REPORTS 1. Selamatkan Air Kita--31 Tahun PDAM Kota Bandung, PDAM Kota Bandung, Jl.
Badaksinga No. 10, Bandung 40132, Indonesia 2. Bandung Dalam Angka 2004, Badan Pusat Statistik, Kota Bandung 3. "Laporan Kegiatan Tim S/d Akhir Tahun 2005 & Rencana Kerja Tahun 2006", TIM
Pemutakhiran Data Kepelangganan, PDAM Kota Bandung, Jan-06 4. “Bantuan Teknis Evaluasi Sistem Penyediaan Air Minum Kawasan Bandung Raya”, PT.
Imaya Consulting Engineers (Bandung), 2005. 5. “Laporan Akhir—Pekerjann: Bantuan Teknis Recana Peningkatan Kapasistas Air Baku
Untuk Penyediaan Air Minum”, PT. Ganesha Piramida (Bandung), 2003. 6. “Bandung Water Supply Augmentation and Improvement—Phase 2, DED; Final Design
Report, Vol. 3A: Cisangkuy Water Works Design Report” by DHV, IWACO, PT. Descerco, and PT. Waseco Tirta, Jan. 1988.
7. “Pekerjaan Penyiapan Studi Pra Kelayakan Investasi Penyediaan Air Bersih Dengan Peran Serta Swasta Di Bandung Timur dan Selatan” PT. Sehat Pratama Sejati, 1988 [copy from Ir. Kiki Rosjidi, KaBag Perencanaan, PDAM Kota Bandung].
8. “Recana Induk Kawasan Gedebage”, PT. Yodya Karya, 26 Dec 2005. 9. “Final Design Report. Vol. 3A: Cisangkuy Water Works Design Report”, by DHV and
IWACO, Jan. 1988 10. As-built Drawings for IPA Badaksinga prepared by DHV & IWACO, 1989.
ENVIRONMENTAL SERVICES PROGRAM WWW.ESP.OR.ID 32


TECHNICAL FEASIBILITY STUDY FOR PDAM KOTA BANDUNG CIMENTENG WATER SUPPLY SYSTEM
APPENDIX B DETAILS ABOUT PDAM KOTA BANDUNG The PDAM provides treated water and collects and treats wastewater for Kota Bandung; and produces bottled water.
SERVICE AREA – KOTA BANDUNG Kota Bandung, the capital of Propinsi Jawa Barat, is located in the Priangan highlands about 190 kilometers southeast of Jakarta. The Kota consists of 26 Kecamatans sub-divided into 139 Kelurahans. It has a land area of 167 square kilometers (km2) and a population of 2.23 million (year 2004). This is a population density of 134 people per hectare, however taking into consideration that only 60% of the land is occupied by housing, the density is actually about 220. Topographically the northern part of the Kota is mountainous and the southern part relatively flat. Elevations of the Kota range from 1050 meters above sea level (ASL) in the north to 675 meters ASL in the south. The city center is about 770 m ASL.
PRESSURE AT SERVICE CONNECTION PDAM goal is a pressure at the tap of 1 to 2 bars (10 to 20 meters) but due ot low volume of water available and high demand the actual pressure is 0.1 bar.
NUMBER OF CUSTOMERS AND LEVEL OF COVERAGE PDAM serves customers through piped water connections, public taps and hydrants, and trucked water services.
Table 16 PDAM Customers and Water Usage (Oct-05)
Customer Classification Number of Customers
(Oct-05)
% of Total
Water Usage
Oct-05 (m3)
% of Total
L/ connection/
day Sosial – Kran Umum 2,090 1,5 % 113,488 4,0 % 1750 Sosial 152 0,1 % 28,388 1,0 % 6020 Non – Niaga/ Rumah Tinggal 126,182 89,0 % 2,367,133 82,5 % 610 Niaga Kecil 4,847 3,4 % 102,662 3,6 % 680 Niaga Besar 7,934 5,6 % 244,092 8,5 % 990 Industri Kecil 267 0,2 % 4,938 0,2 % 600 Industri Bersar 235 0,2 % 9,495 0,3 % 1300 141,707 100 % 2,870,196 100 %
PDAM estimates 50 people per public tap (Kran Umum) and 5 people per domestic service connection. Thus PDAM is estimated to serve 735,000 people, about 32%9 of the estimated population of 2.28 million (year 2005).
9 PDAM reports that it serves 55% of the population.
ENVIRONMENTAL SERVICES PROGRAM WWW.ESP.OR.ID 33

TECHNICAL FEASIBILITY STUDY FOR PDAM KOTA BANDUNG CIMENTENG WATER SUPPLY SYSTEM
Major reasons why coverage is low are: 1. PDAM does not have sufficient water supply 2. Ground water is easily available 3. Large number of public taps and hydrants to serve small commercial establishments
such as kiosks and warungs.
FACILITIES FOR SOURCE, TREATMENT, AND TRANSMISSION Kota Bandung has numerous rivers and tributaries flowing through it but most are polluted because many industries and houses are not connected to the sewer system. PDAM prefers to use water from sources outside its boundary, i.e. Kabupten Bandung, which are at a higher elevation (thus can be delivered by gravity), and because the water quality is good. Sungai Cisangkuy (1600 L/s) and Sungai Cikapundung (600 L/s) provide about 85% of the water supply.
Table 17 PDAM Water Sources (2005)
Water Sources Number Maximum Production (L/s)
Year 2005 Production (L/s)
% of Total Production
Air Permukaan (River Water) 5 2770 2230 87 % Air Tanah (Ground Water) 32 180 164 6 % Mata Air (Water Springs) 16 170 177 7 % 53 3120 2571 100 %
The PDAM operates 6 treatment plants The only treatment needed is removing turbidity according to the process pre-sedimentation coagulation (using poly aluminum chloride) flocculation sedimentation filtration disinfection (by chlorine gas).
Table 18 PDAM IPA (2005)
Sumber Air Instalasi Pengolahan Air Kapasitas Desain (l/dt)
Kapasitas Produksi
(l/dt)
Prosentase (%)
Pemakaian Air Instalasi
(%)
Mata Air Bandung Utara – Lembang 170 93 55 %
Air Tanah Air Tanah (Sumur Artesis) 530 209 39 % -
Pengolahan Badaksinga dari S. Cisangkuy dan S. Cikapundung
1800 1503 84 % 5
Pengolahan Pakar dari S. Cikapundung 600 596 99 % 3,34
IPA Mini Dago Pakar 60 42 70 %
ENVIRONMENTAL SERVICES PROGRAM WWW.ESP.OR.ID 34
2,89 IPA Mini Cibeureum 40 40 100 % 2,50 IPA Mini Cipanjalu 20 14 70 % 3,62
Air Permukaan
IPA Mini Cirateun 5 3 60 % 2,50 3 Jumlah 3225 2500 78 % 5 Sumber: Bagian Produksi Air Permukaan PDAM Kota Bandung, 2005
The water distribution system has four zones (Bandung Utara, Bandung Timur, Bandung Barat, and Bandung Tengah Selatan) served by six major reservoirs. See Table 19. Ujung Berung in northeast Bandung is operated as a separate zone. Water comes from three sources: springs, the Sungai Cipanjalu (20 L/s), and local wells. There are no PDAM water storage facilities for this zone.

TECC
ENVI
HNICAL FEASIBILITY STUDY FOR PDAM KOTA BANDUNG IMENTENG WATER SUPPLY SYSTEM
RONMENTAL SERVICES PROGRAM WWW.ESP.OR.ID 35
Table 19 PDAM Distribution System Reservoirs (2005)
Reservoir Volume (m3)
Elevation (m) Water Source Serves
R. IX Cikutra 11,000 747,4 Air Tanah Timur R. X Cipedes 11,000 748,7 Air Tanah Barat R. XI Ledeng 3,000 924,15 Mata Air Ledeng Utara IPA Ledeng 100 Mata Air Ledeng Utara R. XII 7,500 845 S. Cikapundung Utara R. Badak Singa 10,000 744,5 S. Cikapundung
S. Cisangkuy Tengah Selatan
6 42,600

TECHNICAL FEASIBILITY STUDY FOR PDAM KOTA BANDUNG CIMENTENG WATER SUPPLY SYSTEM
ENVIRONMENTAL SERVICES PROGRAM WWW.ESP.OR.ID
36
(1) (2) (3) (4) (5) (6) (7) (8) (9) (10) Population Water (3)/(4) (5)/(4) (6)/(4) (6)/(5)
No Kecamatan (People) Connection Consumption Sold Pop/Connect m3/connect. Rp/connect. Rp/Consump.(unit) (m3) (Rp) (Pop/Unit) (m3/unit) (Rp/unit) Rp/m3
1 Bandung Kulon 130,256 6,825 102,982 232,269,260 19.09 15 34,032 2,255
2 Babakan C iparay 129,535 3,582 49,765 118,926,090 36.16 14 33,201 2,390
3 Bojongloa Kaler 118,726 6,109 91,199 205,636,575 19.43 15 33,661 2,255
4 Bojongloa Kidul 77,908 4,387 86,794 207,754,695 17.76 20 47,357 2,394
5 Astanaanyar 73,777 7,771 148,238 361,880,035 9.49 19 46,568 2,441
6 Regol 79,230 8,049 147,754 390,855,810 9.84 18 48,560 2,645
7 Lengkong 75,122 10,550 228,842 655,721,360 7.12 22 62,154 2,865
8 Bandung Kidul 45,715 2,241 50,585 116,191,685 20.40 23 51,848 2,297
9 Margacinta 108,915 8,017 127,245 308,474,250 13.59 16 38,478 2,424
10 Rancasari 66,046 2,070 28,466 68,088,490 31.91 14 32,893 2,392
11 Cibiru 81,334 82 1,498 3,847,960 991.88 18 46,926 2,569
12 Ujungberung 78,746 1,394 22,928 49,947,440 56.49 16 35,830 2,178
13 Arcam anik 64,075 2,181 38,247 87,185,710 29.38 18 39,975 2,280
14 Cicadas 101,076 9,396 151,103 341,074,555 10.76 16 36,300 2,257
15 Kiaracondong 128,111 8,511 124,374 286,003,925 15.05 15 33,604 2,300
16 Batununggal 122,437 6,554 107,945 266,967,935 18.68 16 40,734 2,473
17 Sum ur Bandung 39,269 4,446 147,258 442,381,375 8.83 33 99,501 3,004
18 Andir 102,716 5,036 77,316 202,304,315 20.40 15 40,172 2,617
19 Cicendo 92,867 5,676 128,722 342,508,925 16.36 23 60,343 2,661
20 Bandung W etan 37,670 4,089 117,258 351,181,160 9.21 29 85,884 2,995
21 Cibeunying Kidul 111,582 6,743 92,581 214,618,360 16.55 14 31,828 2,318
22 Cibeunying Kaler 71,712 4,918 125,189 329,861,390 14.58 25 67,072 2,635
23 Coblong 120,773 8,860 307,334 863,706,040 13.63 35 97,484 2,810
24 Sukajadi 102,522 5,851 154,951 391,177,140 17.52 26 66,856 2,525
25 Sukasari 78,402 5,641 126,451 337,614,185 13.90 22 59,850 2,670
26 Cidadap 49,918 2,295 66,061 191,698,385 21.75 29 83,529 2,902
Wilayah Kota Bandung 2,288,440 141,274 2,851,086 7,367,877,050 16.20 20 52,153 2,584
Table 20 Service Connections and Water Consumption (October 2005) by Kecamatan

TECHNICAL FEASIBILITY STUDY FOR PDAM KOTA BANDUNG CIMENTENG WATER SUPPLY SYSTEM
APPENDIX C NOTES ON WATER SERVICE TO GEDEBAGE Gedebage is a planned development10 of 526 hectares (ha) that includes residential housing (100 ha) and apartments (4 ha); commercial facilities (20 ha); hospital; train station; stadium; hotel; and retention pond (160 ha) for storm water. It is proposed by a private sector company as a Kota Mandiri (self-sufficient) and will be located in the southeast of the Kota. PDAM is planning on providing water supply of 200 Liters per Second (equivalent to 12,000 L/minute or 720 m3/hour). Following are some ideas for PDAM to consider about providing this volume of water.
1. Pipeline---this volume can be provided by a steel pipeline with lining of coal tar or cement, 400 mm internal diameter, Hazen-Williams C factor of 140. Expected flow velocity would be about 1.2 meter per second
2. Single Customer---it will be easier for PDAM to enter into a contract with the Property Manager so there is only one customer and one invoice.
3. Customer Service Meter to measure flow a. should be smaller than the pipe diameter. For example a Magnetic Flow meter
manufactured by Badger Meter (USA) size 150 mm (6 inch) has a flow range up to 12700 L/minute while a 200 mm (8 inch) has a range to 22600 L/minute. Accuracy is +0.5%, probably more than the PDAM needs. The advantage of smaller size is lower cost to purchase and install.
b. Needs a certain minimum distance of straight length unobstructed pipe upstream and downstream of the meter to ensure uniform, non-turbulent flow. Turbulent flow is created by bends, valves, and other fittings and causes incorrect meter readings. The minimum distance varies and is meter specific but in general is on the order of 5 to 10 times the meter diameter.
c. Could be two meters installed in series, one owned by PDAM and the other owned by the Customer. When the difference between the two meters is x%, the meters should be recalibrated. The value of x can be agreed during negotiations for contract for water supply and would be based on the sale price of the water. For example over a 24 hour period, a 6% difference could amount to slightly over 1000 cubic meters.
4. Water Storage---periodically PDAM will have to shut off flow for maintenance and repair; also there will be peak periods of higher water usage. Thus the Kota Mandiri should have its own water storage reservoir. A reasonable size would be 20% of average daily demand which at 200 L/s is about 3500 cubic meters, about 4.5 hours supply.
10 “Recana Induk Kawasan Gedebage”, PT. Yodya Karya, 26 Dec 2005.
ENVIRONMENTAL SERVICES PROGRAM WWW.ESP.OR.ID 37

TECHNICAL FEASIBILITY STUDY FOR PDAM KOTA BANDUNG CIMENTENG WATER SUPPLY SYSTEM
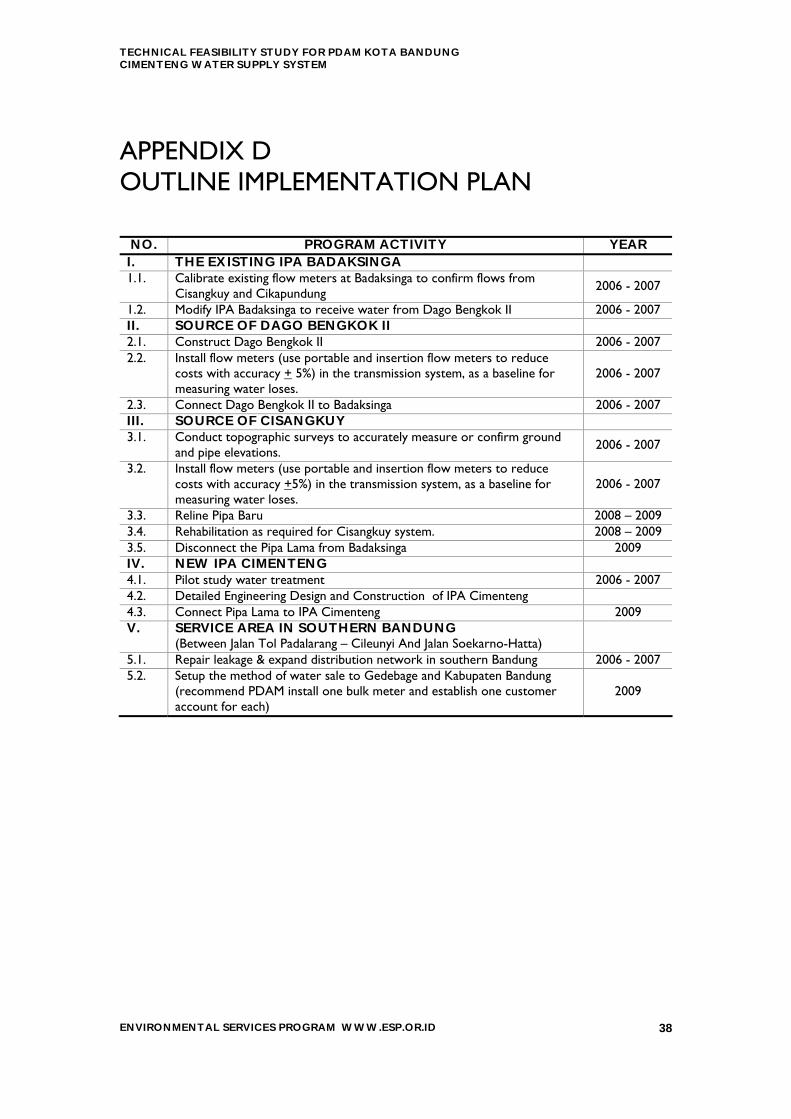
APPENDIX D OUTLINE IMPLEMENTATION PLAN
NO. PROGRAM ACTIVITY YEAR I. THE EXISTING IPA BADAKSINGA 1.1. Calibrate existing flow meters at Badaksinga to confirm flows from
Cisangkuy and Cikapundung 2006 - 2007
1.2. Modify IPA Badaksinga to receive water from Dago Bengkok II 2006 - 2007 II. SOURCE OF DAGO BENGKOK II 2.1. Construct Dago Bengkok II 2006 - 2007 2.2. Install flow meters (use portable and insertion flow meters to reduce
costs with accuracy + 5%) in the transmission system, as a baseline for measuring water loses.
2006 - 2007
2.3. Connect Dago Bengkok II to Badaksinga 2006 - 2007 III. SOURCE OF CISANGKUY 3.1. Conduct topographic surveys to accurately measure or confirm ground
and pipe elevations. 2006 - 2007
3.2. Install flow meters (use portable and insertion flow meters to reduce costs with accuracy +5%) in the transmission system, as a baseline for measuring water loses.
2006 - 2007
3.3. Reline Pipa Baru 2008 – 2009 2008 – 2009 3.4. Rehabilitation as required for Cisangkuy system.
3.5. Disconnect the Pipa Lama from Badaksinga 2009 IV. NEW IPA CIMENTENG 4.1. Pilot study water treatment 2006 - 2007
4.2. Detailed Engineering Design and Construction of IPA Cimenteng 4.3. Connect Pipa Lama to IPA Cimenteng 2009 V. SERVICE AREA IN SOUTHERN BANDUNG
(Between Jalan Tol Padalarang – Cileunyi And Jalan Soekarno-Hatta)
5.1. Repair leakage & expand distribution network in southern Bandung 2006 - 2007 5.2. Setup the method of water sale to Gedebage and Kabupaten Bandung
(recommend PDAM install one bulk meter and establish one customer account for each)
2009
ENVIRONMENTAL SERVICES PROGRAM WWW.ESP.OR.ID 38

TECHNICAL FEASIBILITY STUDY FOR PDAM KOTA BANDUNG CIMENTENG WATER SUPPLY SYSTEM
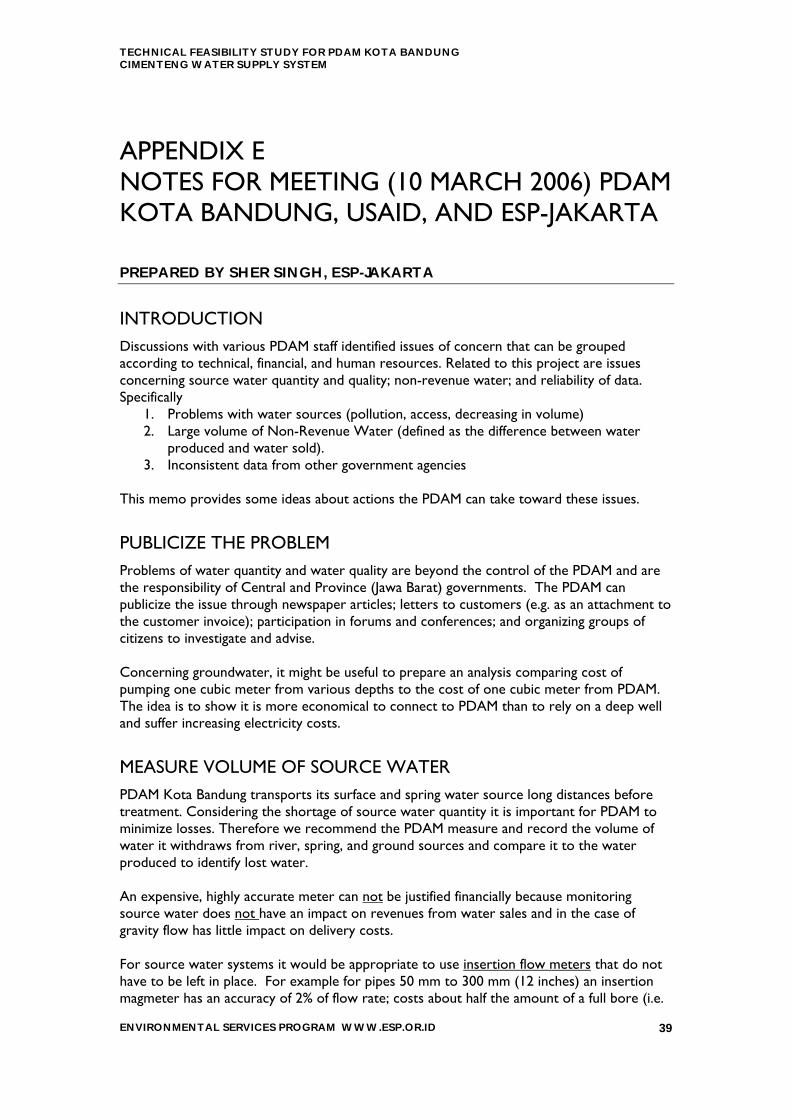
APPENDIX E NOTES FOR MEETING (10 MARCH 2006) PDAM KOTA BANDUNG, USAID, AND ESP-JAKARTA PREPARED BY SHER SINGH, ESP-JAKARTA
INTRODUCTION Discussions with various PDAM staff identified issues of concern that can be grouped according to technical, financial, and human resources. Related to this project are issues concerning source water quantity and quality; non-revenue water; and reliability of data. Specifically
1. Problems with water sources (pollution, access, decreasing in volume) 2. Large volume of Non-Revenue Water (defined as the difference between water
produced and water sold). 3. Inconsistent data from other government agencies
This memo provides some ideas about actions the PDAM can take toward these issues.
PUBLICIZE THE PROBLEM Problems of water quantity and water quality are beyond the control of the PDAM and are the responsibility of Central and Province (Jawa Barat) governments. The PDAM can publicize the issue through newspaper articles; letters to customers (e.g. as an attachment to the customer invoice); participation in forums and conferences; and organizing groups of citizens to investigate and advise. Concerning groundwater, it might be useful to prepare an analysis comparing cost of pumping one cubic meter from various depths to the cost of one cubic meter from PDAM. The idea is to show it is more economical to connect to PDAM than to rely on a deep well and suffer increasing electricity costs.
MEASURE VOLUME OF SOURCE WATER PDAM Kota Bandung transports its surface and spring water source long distances before treatment. Considering the shortage of source water quantity it is important for PDAM to minimize losses. Therefore we recommend the PDAM measure and record the volume of water it withdraws from river, spring, and ground sources and compare it to the water produced to identify lost water. An expensive, highly accurate meter can not be justified financially because monitoring source water does not have an impact on revenues from water sales and in the case of gravity flow has little impact on delivery costs. For source water systems it would be appropriate to use insertion flow meters that do not have to be left in place. For example for pipes 50 mm to 300 mm (12 inches) an insertion magmeter has an accuracy of 2% of flow rate; costs about half the amount of a full bore (i.e.
ENVIRONMENTAL SERVICES PROGRAM WWW.ESP.OR.ID 39

TECHNICAL FEASIBILITY STUDY FOR PDAM KOTA BANDUNG CIMENTENG WATER SUPPLY SYSTEM
in-place) magmeter, and can be installed on existing pipe without having to remove a section of pipe or shutting it down. Installation is done via a ball valve or a mounting system to make a pressure tap while the pipeline is still under pressure (“hot-tap”). A pitot tube is a device which converts the velocity head in a flow stream to a pressure head. Two connections, 90 degrees apart, either flanged or threaded, are needed per pipe. Installation is similar to insertion magmeter described above. Accuracy can be 1% of flow. It is possible to install permanent fittings so that the insertion meter can be moved from one location to another to make measurements. This minimizes procurement costs. The length and weight of the insertion meter depend on pipe size and for large diameter pipe may be so long and heavy that two people are needed to place and insert. Portable ultrasonic flowmeters can be used but require direct contact with the pipe surface (i.e. remove paint and other protective coatings) and results may be influenced by pipe interior lining.
RELINE PIPELINES TO IMPROVE CARRYING CAPACITY Actual carrying capacity of a pipeline decreases over time due to deterioration of the inner lining. There are techniques to reline a pipe in-place with minimal excavation and practically no replacement. [Contact Aart Merkelijin, ESP-Aceh WATSAN Advisor] . This can be an economical way to increase water volume.
WALK THE TRANSMISSION LINE TO IDENTIFY LEAKS Walking along the transmission line is a fast, inexpensive method to identify major leaks, malfunctioning air valves, encroachments and endangerments. Such a walk does not have to be completed in one day. Best time would be during the dry season where leaks and lush green vegetation (an indicator of a possible leak) can be more easily identified.
MAINTAIN PIPELINE VALVES A transmission pipeline typically has air valves at high points; wash-outs at low points, shut off valves to isolate sections for repair, sometimes flow control valves (e.g. butterfly valve). All these items need inspection and maintenance that includes “valve exercise” (closing and opening to assure movement). This requires a trained work crew with specific equipment and a documented maintenance plan to schedule and record work.
USE REPRESENTATIVE SAMPLE OF CUSTOMER WATER METERS Reducing Non-Revenue Water (NRW) increases revenues, reduces operating costs, and makes more water available. You cannot control what you cannot measure. Thus to control NRW requires accurately measuring the volume of water entering the distribution system, e.g. the effluent from water treatment plants and reservoirs, and the amount of water withdrawn as measured by customer water meters. PDAM Kota Bandung has about 140,000 connections of which 126,000 (90%) are classified as household (domestic). PDAM schedules monthly meter reading but with that many meters in place it is likely some meters cannot be accessed or are out-of-order or are incorrectly read or inaccurately reported. ENVIRONMENTAL SERVICES PROGRAM WWW.ESP.OR.ID 40

TECHNICAL FEASIBILITY STUDY FOR PDAM KOTA BANDUNG CIMENTENG WATER SUPPLY SYSTEM
It is possible to measure a smaller, representative sample of meters and calculate average water consumption that will be close to actual consumption as measured by 100% of the meters. Applying principles of statistics, a sample size of 384 can provide data with 95% confidence the results will be within 5% of the average. For PDAM the estimated average is 20 cubic meters per connection per month, so +5% would be 19 to 21 m3/con/mo. As shown in the following table, increasing sample size provides increased confidence and closer interval to average.
Sample Size Error in Interval Estimate
Confidence Level
96 10 % 95 % 384 5 % 95 % 666 5 % 99 % 9604 1 % 95 % 16641 1 % 99 %
Thus the PDAM could install 400 new, accurate meters at representative households, measure monthly, and have adequate confidence the results are within 5% of the actual average. With this number the PDAM can have a better idea about actual water loss and can identify household customers whose consumption is significantly lower (indicating a meter may not be working) or higher (indicating a problem; perhaps misuse of water). PDAM should have no difficulty finding locations for these meters. With about 1000 employees the PDAM could do this program without having to go outside their own organization.
CONSIDER PERFORMANCE BASED CONTRACT FOR NRW REDUCTION After installing bulk meters to measure water entering the distribution system and installing a small sample of meters at households, the PDAM can make a better estimate of water loss. After establishing this baseline, the PDAM could tender a performance-based contract for NRW reduction where compensation for work accomplished is based on level of reduction achieved. For example, if the contractor succeeds in reducing NRW from 40% to 32%, then payment would be based on that 8% reduction. To do this successfully requires that the PDAM establish a baseline and be able to measure contractor’s accomplishments. Based on experience elsewhere this type of contract works best when
1. Compensation is a combination of a subsistence rate (e.g. travel expenses, salary, housing allowance) and a rate based on performance; and
2. The agency commits money for capital improvements such as installation of zone meters in the distribution system; replacement of leaking valves and pipes.
DEVELOP PDAM NUMBERS TO ESTIMATE WATER DEMAND During data collection we found
1. Three different rates for future population growth: a. % from Kota BAPEDA b. 1.5% from Kota Badan Pusat Statistik (BPS) c. 0.9% from analysis of Kota BPS data for 2000—2004.
ENVIRONMENTAL SERVICES PROGRAM WWW.ESP.OR.ID 41

TECHNICAL FEASIBILITY STUDY FOR PDAM KOTA BANDUNG CIMENTENG WATER SUPPLY SYSTEM
2. Two different numbers for number of people per household a. from Kota BPS b. 5 from PDAM data
This difference between BPS and PDAM data results from different methods of counting the number of people per house. BPS counts number of "family cards" per address while PDAM counts number of people physically living in the dwelling. Consider for example one house with husband and wife who have a family card and the wife's mother who has her own family card. For BPS census, there are 1.5 people per house, but for PDAM water supply, there are three.
We conclude that PDAM cannot always rely on data from outside agencies and recommend the PDAM establish a Planning Committee that would meet once or twice a year to agree relevant numbers to be used for planning and estimating purposes. We suggest PDAM meet with other agencies providing public services such as PLN (electricity) and Dinas Kebersihan (trash collection and disposal) to learn how they forecast population and service demand. It may be useful for these agencies to meet once or twice a year to discuss this matter and mutually agree numbers for the year.
During the meeting the subject of energy efficiency was discussed. Electricity is not a significant cost item for the PDAM, nevertheless PDAM should
1. Perform an Energy Efficiency Assessment to identify major power uses and demand profile11 with emphasis on pumps and motors
2. Ask PLN about possible cost savings by controlling Power Factor12. Conduct pump efficiency tests that compare the relationship between energy consumed (kWh) and water flow (L/s) at a given pumping head (m) to determine overall system efficiency, electrical motor performance, and pump hydraulics. If performance is below standards then repair, replace, or upgrade. This activity could be contracted out to the private sector.
11 Power Demand Profile identifies quantities and when power is used according to time-of-day, day of
week, season, or other factors12 Motors for intake and discharge pumps have high electrical load consumption, especially at start-up.
This electrical load is described by the Power Factor (PF). Electricity Providers often invoice commercial and industrial customers for this type of electricity demand.
ENVIRONMENTAL SERVICES PROGRAM WWW.ESP.OR.ID 42

TECHNICAL FEASIBILITY STUDY FOR PDAM KOTA BANDUNG CIMENTENG WATER SUPPLY SYSTEM
APPENDIX F ESTIMATED PROJECT COSTS
CAPITAL COSTS The following table summarizes infrastructure projects and estimated costs that do NOT include
1. Land Acquisition 2. Detailed Engineering Design, Environmental Impact Assessments, Construction
Management (typically 12.5% of construction cost) 3. Commercial Contingencies (inflation, currency exchange) 4. Physical Contingencies (changes to quantities or unit costs) 5. Value Added Tax (Pajak Pertambahan Nilai, 10%)
Costs are based on estimates prepared for similar for other PDAM
Table 21 Estimate of Capital Costs for Proposed Projects
Infrastructure Components & Tasks Quantities Estimated Cost (Billion Rp)
Dago Bengkok Transmission Pipeline
Construct Intake Procure and Install Pipe Install Valves & Fittings Connect to IPA Badaksinga
Intake = 600 L/s Spiral Steel Pipeline, D=700mm, L=4200m Shut off Valves, Air Valves, Washout Bulk Water Meter
50
Pipa Baru Pipeline
Repair Valves Shutdown, Dewater & Inspect Install Measuring Devices
Inter-connecting Water Control Valves (6); Over Speed Valves (OSV), Air Valves, etc. Steel Pipeline D= 850mm, L=32,00m cement lining
60
110 IPA Cimenteng Design and Construct 1100 L/s Coagulation (alum); filtration; disinfection (Cl2 gas); bulk meter
Pipa Lama Pipeline (Existing)
Repair Valves Shutdown, Dewater & Inspect Repair, rehabilitate
Gray Cast Iron Pipe 800mm (14000m) and 900mm (17000); valve similar to Pipa Baru
40
Pipa Lama (Modified)
Cut and connect to IPA influent Cut and Connect to IPA Effluent Make connection to serve Kabupaten Cut and make connection to serve Kota
Pipe to be cut is 800 to 900 mm Section to be removed (or left buried in place) is on the order of 200 meters
40
300 PDAM proposes to use HDPE instead of spiral steel pipe for Dago Bengkok transmission pipeline which will reduce the cost by about 50%.
ENVIRONMENTAL SERVICES PROGRAM WWW.ESP.OR.ID 43

TECHNICAL FEASIBILITY STUDY FOR PDAM KOTA BANDUNG CIMENTENG WATER SUPPLY SYSTEM
It is recommended PDAM investigate relining the interior portions of the Pipa Baru and Pipa Lama in order to improve flow capacity. The cost for this depends very much on specific site conditions so it is not possible to estimate costs for this without getting an expert to inspect and estimate.
OPERATION AND MAINTENANCE EXPENSES Since the water flow in the transmission pipelines is by gravity, the principal operation and maintenance expenses are staff wages and annual costs for replacement and repair of pipeline and equipment. Using data from a recent study13, staff wages are based on a full time operation and maintenance staff of two work crews, each consisting of 1 foreman and three skilled laborers. Assume monthly salary for one work crew = 6 Million Rp. Thus annual cost for two work crews is 144 M Rp. So for this analysis use 150 M Rp. Maintenance and repair expenses for the pipeline, valves, and other appurtenances are assumed at the annual rate of 1% of the cost for valves and appurtenances which are about 20% of the pipeline costs in Table 1 above. Thus 1% x (20% x 160 B Rp) = 320 M Rp. So for this analysis use 300 M Rp. Table 22 summarizes the estimated operation and maintenance expenses for the Cisangkuy and Dago Bengkok Transmission Pipelines assuming inflation rate of 7% per year.
Table 22 Estimate of Capital Costs for Proposed Projects Million Rupiah
YEAR Labor Maintenance & Repairs Total
2006 150 300 0
2007 161 321 0
2008 172 343 515
2009 184 368 551
2010 197 393 590
2011 210 421 631
2012 225 450 675
2013 241 482 723
2014 258 515 773
2015 276 552 827
Years 2006 and 2007 are shown at zero because the pipelines are not completed until year 2008
13 Phase II Feasibility Analysis For the Proposed Subang Water Source and Water Transmission Main
Project, T. Stephen Jones, ESP-Jakarta, 2006
ENVIRONMENTAL SERVICES PROGRAM WWW.ESP.OR.ID 44

ENVIRONMENTAL SERVICES PROGRAM Ratu Plaza Building, 17th. Fl.
Jl. Jend. Sudirman No. 9 Jakarta 10270
Indonesia
Tel. +62-21-720-9594 Fax. +62-21-720-4546
www.esp.or.id