Technical Assistance Consultant’s Report Prakash Timilsina Dipayal-Silgadhi [email protected] 22...
86
Technical Assistance Consultant’s Report Project Number: 44069 July 2012 Nepal: Capacity Building for Waste Management Prepared by IPE Global Private Limited in association with Environment Resource Management Consultants (ERMC) (P.) Ltd. and Full Bright Consultancy (Pvt.) Ltd. This consultant’s report does not necessarily reflect the views of ADB or the Government concerned, and ADB and the Government cannot be held liable for its contents.
-
Upload
truongngoc -
Category
Documents
-
view
220 -
download
0
Transcript of Technical Assistance Consultant’s Report Prakash Timilsina Dipayal-Silgadhi [email protected] 22...

Technical Assistance Consultant’s Report
Project Number: 44069 July 2012
Nepal: Capacity Building for Waste Management
Prepared by
IPE Global Private Limited in association with Environment Resource Management Consultants (ERMC) (P.) Ltd. and Full Bright Consultancy (Pvt.) Ltd.
This consultant’s report does not necessarily reflect the views of ADB or the Government concerned, and ADB and the Government cannot be held liable for its contents.

Status of Solid Waste Management
in 58 Municipalities of Nepal
Solid Waste Management Baseline Study Report
July 2012

II
Preface
The SWM baseline study team conducted the survey in 58 municipalities of Nepal in April
to May 2012 during the dry season under the direct supervision of a project coordinator
from Solid Waste Management Technical Support Center (SWMTSC) with financial
assistance of Asian Development Bank (ADB). A group of environmental officers with
sufficient knowledge in subject matters and research experience were employed for the
fieldwork under the supervision of supervisors, team leader of SWM baseline study and
candidate municipality.
The objectives of the study are to conduct the systematic and comprehensive study of
quantification of municipal waste and its composition and to compile factual information
on the state of solid waste management in the 58 municipalities of Nepal. The
information collected from the 58 municipalities was analyzed and documented in the
form of this report. In addition, the field reports of 58 municipalities have been prepared
to provide detail information of each municipality.
The outputs of this study can be helpful to the SWMTSC and municipalities for
formulating appropriate and sustainable waste management plans to implement the
SWM Act 2011. The SWM baseline data collected by this survey have to be updated and
refined regularly in future through further research and analysis.
D. R. Pathak Geo‐environmental Expert & Team Leader SWM Baseline Study

III
Acknowledgements
I would like to express my sincere gratitude and appreciation to Dr. Sumitra Amatya, the
Program Coordinator of this study and Executive Director (ED) of SWMTSC for her
supervision, continuous encouragement and support throughout the project period.
The financial support for this study was provided by Asian Development Bank (ADB). I am
also grateful to Asian Development Bank Technical Assistance (ADB TA) Team for their
valuable input and necessary support. Special thanks to Surya Man Shakya, Deputy Team
Leader (DTL), ADB TA, for his effort in preparing SWM baseline proposal and his valuable
technical input over the period of study.
Appreciation is extended to National Program Director of ADB TA and Head of
Environmental Section of Ministry of Federal Affairs and Local Development.
The suggestions and feedbacks of Dipendra Oli and other individuals from SWMTSC are
highly appreciated. My sincere appreciation goes to executing officer (EO) and all the
concerned officials from 58 municipalities for their support and valuable information
during the project period.
I am very thankful to Keshav Parajuly and Yogesh Shakya, the supervisors of the SWM
baseline study team for their sincere and continuous supervision and review of field
reports of 58 municipalities. Thanks are due to Keshav Parajuly for a critical reading of this
report, which helped to improve the quality of the report. I am thankful to Bal Krishna
Khadka, consultant statistician in his efforts for supporting to design standard
questionnaire, SWM baseline training and sampling for survey. He analyzed and
presented the information in a standard format as well as contributed to prepare this
report. My sincere thanks also go out to data entry staffs for their sincere efforts and
passion. Thanks are due to following environmental officers who devoted their time and
effort into conducting the field study, collecting the necessary information and preparing
the field report of the assigned municipality.
At last, but not least, special thanks also go to ERMC (P) Ltd., Kathmandu and its partner
organizations for their timely logistic arrangements throughout the project period.

IV
Environmental Officers who collected Information from the 58 Municipalities
S . N . N a m e A s s ig n e d M u n ic i p a lity
E m ail
1 T ara P d A c h a rya A m a rg ad h i b ik a lp a ta ra2 0 0 2@ g m a i l .c o m2 S us h i l Ku m a r K a rk i B a g lu n g su sh i l5 76 @ ho t m a il .c om3 P rak a s h Na g arko ti B a n e pa prak as h na ga rk o t i2 01 2@ g m a i l .c o m4 P rak a s h S ig d e l B h a d ra pu r p rak as h .sig d e l2 00 0@ g m a i l .c o m5 U p am a K C B h a k ta pu r sr id h i99 @ g m a i l .c om6 S a jan a R i ja l K a th m a n du sa ja n a .r i ja l@ gm a i l .c om7 M er in a S ha ky a B h a ra t pu r m er i_ co o lg a l@ y a ho o .c o m8 A n i l M a na n d ha r B h im Du tt a an i l_m t09 @ y a h o o .c o m9 B ish o w R aj T iw a r i P o k ha ra b ish o w tiwa ri@ g m a i l. co m10 R a sh m i K o ju B id u r ra sh m i .k o ju@ y ah oo . co m11 S us h i la G w a c h ha B i ra tna g a r su sh i la gw ac hh a @ y a ho o .c o m12 A n ju G ya w a li G u la r i y a gy a w a l ia n ju _0 7 @ h otm a i l. co m13 S up re m e P ra ja p a ti B i rg u n j p ra ja pa ti .a r y a n@ ya h oo .c o m14 O m B am M a l la B u tw a l om a l la _ 19 @ y a ho o .c o m15 N o w a l K is ho re B h a tta ra i D a m a k no w a l0 3 @ y ah o o .c om16 Je e v an C hh e tr i L a li tp u r k c_ jv n @ y a h o o .c o m17 K es ha v Pa ud e l D h an ga d h i ap g l_ 1 4 4@ h ot m a il .c o m18 S aro j K o i ra la D h an k u ta y a sh_ ro se 2 0 @ yah o o .c om19 G un jan S i lw a l D h ara n gu n ju 4 a l l2 00 0@ y ah oo .c om20 A m i ta D uw a l D h u l ik he l am i tad u wa l@ y a ho o .c o m21 P rak a s h T im il sina D ip a ya l-S il g a dh i pa rk u_ d h a@ ya h oo . co m22 S ub e nd ra S h re s th a G a u r sh tsub e nd ra @ g m a i l .c om23 B in a G a u ta m G h o ra h i b in u_ 4 7 9@ y ah oo .co m24 A nu p am a Jo s h i G o rk h a a rpa n _ an u 5@ h otm a i l .c om25 R a b in S h ak y a B i re n d ran a ga r ra v e e yn 2 01 0@ h o tm a i l. co m26 B ig y a n N eu pa n e H e ta ud a nb igy an @ h o tm a i l. co m27 N iran ja n P hu y a l I la m np h u y a l@ s tu de n t.k u .e du .n p28 V ic ky K o i ra la I n a ruw a v c k rl1 11 @ g m a il .c om29 K aru n Dew an I tah a ri k a ru n_ d e w @ h o tm a i l. co m30 B ish a l KC D a shra t h C h a n d k se eb ee s h a l l@ g m a i l .c o m31 R a c h hy a K ay ast ha J a na kp u r ra c h hy a k a y a st h a@ h o tm a i l .c o m32 D iv ya Dh ak a l K a la i ya d iv a_ is h e re@ h ot m a il .c o m33 N a v in D ah a l K a m a la m a i na v in ch a n ge d ton a v e en @ g m a i l .c om34 D a w a Te n j i Y o lm u K a p iw a s tu v e z z a lo ne @ g m a i l .c om35 S ha rm i la K arm a ch a rya B h a k ta pu r su it _sh a rm i@ ya h oo .c o m36 B i ja y M a h ar ja n K a th m a n du bk sh5 5@ g m a i l.c o m37 A run a Th ap a K a th m a n du arun a _ m a g ar@ ho tm a i l .c om38 S ha rm i la M ah ar ja n K a th m a n du ak r it i_ 7 9@ h otm a i l .c o m39 R u pa k K o i ra la K h a n db ar i k o i ra la .ru pa k @ g m a i l.c om40 M un n y P rad h an K i rt ip u r m un ny p rad ha n@ h ot m a il .c o m41 T an u ja S h res tha L ah an em a i l_ tan u @ y a h oo .c o m42 M in u M a ha rja n L a li tp u r m an m i_n u@ h ot m a il .c o m43 P r iya nk a T im ila J a les hw ar p r i ya nka tim i la@ g m a i l. co m44 S ud ip P a nd ey L a li tp u r E nv i ro n .s u d ip @ gm a i l. com45 R a je sh K h a dk a L ekh n a th ra az _y e s@ y a ho o .c o m46 A n ju R a n a M ad hy ap u r T h im i an z oo 2 00 9@ h o tm a i l.c om47 S ar ik a G h a ra na M a lan g a w a sa ri k a _g h a ran a@ h o tm a il .c om48 E l i za Ka rk i M ec h in ag a r e l i zak a rk i1 3@ h o tm a i l .c om49 H a r i S h a ran G h im i re N a ra ya n y o u rsf o re v e r@ h o t m a il .c o m50 S r i ja n a K hy a ju N e pa lg un j sr i j an ak hy a ju @ ya h oo . com51 S us hm a A c ha ry a P a n a u ti ac h a ry a su shm a 3 @ g m a i l .c o m52 B in i ta K h a d k a B h im esh w o r k h a dk ab n t@ ya ho o .c om53 N ik k y Sh re sth a P u ta li ba z a r n ik ky sh re sth a @ y ah o o .c om54 Jy o ts an a Dh u n ga na R a jb ira j j yo tsa n a dh u ng a n a@ g m a il .c om55 B im a l Sh a rm a R a m g ra m b im a lb h us ha l@ g m a il .c om56 S ud e ep G him i re R a tn an ag ar sg h im i re9 @ y a h oo .co m57 U d ay a Th a pa S id dh a rt h an a ga r ne p u da y @ h otm a i l .c o m58 G an es h Th a g un n a S i ra h a ga n e c e g@ g m a i l. com59 S ury a M a n S h res tha T a n se n su ry a m an sh re s th a@ y ah oo .c om60 S an ta K u m a r M a ha r jan T ik a pu r sa n ta _ kum a r5 7 @ y ah o o .c o m61 U m e sh K ha n a l T r i y ug a the u m esh 8 @ g m a il .c o m62 S hr i j a na K a f le T u ls ip u r bu n u _sr i j a 25 @ y a ho o .c o m63 R a v i B h a nd a r i V y a s ra v i_ l l t@ h o tm a i l .c o m64 R a je n d ra B h a n da r i W a l in g ah ins ha @ g m a i l. co m

V
Executive Summary
Increasing unplanned urbanization, poor management along with user’s mind‐set of ‘out
of sight out of mind’ of wastes have intensified environmental pressures including
unorganized waste disposal in many municipalities of Nepal. Thus, solid waste
management (SWM) has become a major concern for the municipalities and towns of
Nepal. However, executing authorities such as Solid Waste Management Technical
Support Center (SWMTSC) and Local Governments (LGs) including municipalities are
having trouble in developing management plans and in decision making while addressing
the emerging issues due to the lack of the SWM baseline information and data related to
the functional elements of SWM.
The goal of the SWM baseline study was to conduct the systematic and comprehensive
study of quantification of municipal waste and its composition and to compile factual
information on the state of solid waste management in the existing 58 municipalities of
Nepal. The study also identified the status and background information on the municipal
solid waste, management practices, problems and future prospects in the municipalities.
The SWM baseline study team conducted the survey in 58 municipalities of Nepal in April
to May 2012 during the dry season. A total of 64 field surveyors with sufficient knowledge
in subject matters and research experience were employed for the fieldwork under direct
supervision of supervisors, team leader of SWM baseline study and candidate
municipality. The waste quantity and quality survey with sample size of 3,233 households,
627 institutions (schools/colleges/offices) and 627 commercial establishments
(shops/hotels/restaurants) were undertaken by employing random (probability) sampling
technique. In addition to waste quantity and quality survey, separate sets of
questionnaires were developed for household and municipality to collect and to update
SWM related information of different aspects.
The total sample size of 3233 households from 58 municipalities, varying from the
minimum 50 households to 220 households gave an average per‐capita household waste
generation figure of 170 gram/capita/day. This study also uncovered that the household
waste generation rates were varied depending upon the economic status and climatic
condition. In case of institutional establishments, the average daily waste generation was
1.4 kg per school and 2.5 kg per office. Similarly, the average daily waste generation from
shops and hotel/restaurant was found to be 1.4 kg per shop and 5.7 kg per
hotel/restaurant respectively.
Based on our analysis and findings, it can be estimated that, as the household waste in
general contributes to about 50 to 75% of the total municipal waste generation
depending upon the municipality. Thus, the per‐capita municipal waste generation, as per
survey results, was found to be 318 gram/capita/day. Based on these per‐capita waste
generation figures and population for the year 2011, the total municipal waste generation
of 58 municipalities was found to be more than 525, 000 tons/year.

VI
The analysis of household waste composition indicated that the highest waste fractions
were organic matter (65%) followed by plastics (11%). Paper and paper products and
others comprised 9% and 7% of the waste respectively. Glass, metal, rubber and leather,
textile components all were at or below 3%. The composition analysis of institutional
waste revealed 19% organic wastes, 18% plastics, 45% paper and paper products, 12%
others with glass, textiles, metals and rubber/leather all below or at 2%. Similarly, the
composition of commercial waste was made up of 40% organic wastes, 21% paper and
paper products, 22% plastics, 7% other wastes, 5% glass, 2% textiles, 2% metals and 1%
rubber and leather.
The study uncovered that about 30% of surveyed households in the municipalities were
practicing segregation of waste at the source and composting in traditional ways. Such
practices were found mainly in rural area of municipalities. Beside the household level
composting, community or municipal level composting plant could be found to some
extent and some are in planning phases in some municipalities. Analyzing the information
provided by municipalities, the present collection efficiency ranges between 70 to 90% in
major cities, whereas in several smaller cities it is below 50%. Only 6 municipalities use
sanitary landfill site for final disposal but dumping in riverbanks, depressed land/dumps,
open pit or temporary open piles are the ways of final disposal to the remaining
municipalities.
Of total 58 municipalities, 17 municipalities do not have designated section to look after
SWM. In these municipalities, either the municipality is not providing any waste
management services at all or the municipality has a few sweepers who work under the
ward offices or one of the other units. Of the total budget, the municipalities spend an
average of 10% for SWM, in which nearly 60‐70% towards street sweeping and collection,
20‐30% on transportation.
The findings of this study showed that the household waste of all municipalities, in
general, is good viable for producing compost. It also revealed that, in case if all
compostable and reusable/recyclable wastes could be utilized to their potentials, less
than 10% waste in more than 40 municipalities would have to be finally disposed to
landfill site. Moreover, the outputs of this study can be used for implementing proper
waste disposal and management plans and practices for recovery of resources before
deciding on the appropriate method of its disposal.

VII
Table of Contents
PREFACE ......................................................................................................................... II
ACKNOWLEDGEMENTS .................................................................................................. III
EXECUTIVE SUMMARY .................................................................................................... V
TABLE OF CONTENTS .................................................................................................... VII
LIST OF FIGURES ............................................................................................................ IX
LIST OF TABLES ............................................................................................................... X
1 INTRODUCTION ....................................................................................................... 1
1.1 BACKGROUND ............................................................................................................ 1
1.2 GEOGRAPHICAL DISTRIBUTION OF MUNICIPALITIES ............................................................. 2
1.3 LAND USE PATTERN ..................................................................................................... 3
1.4 URBAN‐RURAL SETTING ................................................................................................ 4
1.5 DEMOGRAPHIC INFORMATION ....................................................................................... 4
1.6 OBJECTIVES OF STUDY .................................................................................................. 5
1.7 STUDY LIMITATIONS ..................................................................................................... 5
2 STUDY METHODS .................................................................................................... 6
2.1 STUDY AREA, TYPE OF WASTE AND COMPOSITION .............................................................. 6
2.2 SAMPLING AND SURVEY DESIGN ..................................................................................... 7
2.2.1 Household sampling .......................................................................................... 7
2.2.2 Sampling of Institution and commercial establishment .................................... 8
2.3 RECRUITMENT, TRAINING AND EQUIPMENT ...................................................................... 9
2.4 FIELD SURVEY AND DATA COLLECTION ............................................................................ 10
2.4.1 Field study ........................................................................................................ 10
2.4.2 Standard questionnaires .................................................................................. 10
2.5 DATA ANALYSIS TECHNIQUES ....................................................................................... 11
2.6 QUALITY ASSURANCE AND QUALITY CONTROL ................................................................. 11
3 MUNICIPAL SOLID WASTE GENERATION AND COMPOSITION ................................ 12
3.1 HOUSEHOLD WASTE GENERATION ................................................................................ 12
3.2 INSTITUTIONAL AND COMMERCIAL WASTE GENERATION .................................................... 14
3.3 MUNICIPAL WASTE GENERATION .................................................................................. 14
3.4 MUNICIPAL WASTE COMPOSITION ................................................................................ 15
3.4.1 Household waste composition ......................................................................... 15
3.4.2 Institutional waste characteristics ................................................................... 18
3.4.3 Commercial waste characteristics ................................................................... 19
4 EXISTING SOLID WASTE MANAGEMENT SYSTEM ................................................... 20

VIII
4.1 COLLECTION AND SEGREGATION ................................................................................... 20
4.2 TRANSPORTATION, TRANSFER STATION AND FINAL DISPOSAL .............................................. 20
4.3 RESOURCE RECOVERY METHODS ................................................................................... 22
4.3.1 Recycling .......................................................................................................... 22
4.3.2 Composting ...................................................................................................... 23
4.4 PUBLIC AWARENESS AND COMMUNITY MOBILIZATION ...................................................... 23
4.5 SPECIAL WASTE MANAGEMENT .................................................................................... 23
5 MANAGERIAL ASPECTS OF SOLID WASTE MANAGEMENT ..................................... 25
5.1 ORGANIZATIONAL STRUCTURE ..................................................................................... 25
5.2 RESOURCES ALLOCATION FOR WASTE MANAGEMENT ........................................................ 25
5.3 SWM PLANNING, MONITORING AND EVALUATION .......................................................... 26
5.4 ACTORS INVOLVED IN SWM ....................................................................................... 27
5.5 SWM POLICIES AND LEGISLATION ................................................................................ 27
5.5.1 Solid Waste Management and Resource Mobilization Act 1987 .................... 27
5.5.2 National Policy on Solid Waste Management 1996 ........................................ 27
5.5.3 Environment Protection Act 2053 BS (1997 AD) and the related Regulations 28
5.5.4 Local Self Governance Act 2055 BS (1998 AD) and related Regulations ......... 28
5.5.5 Environment Policy and Strategy on Periodic Plans of the Government ......... 28
5.5.6 Solid Waste Management Act 2068 BS (2011 AD) .......................................... 28
6 POSSIBILITIES AND CHALLENGES ........................................................................... 31
6.1 CHALLENGES IN MANAGEMENT AND IMPLEMENTATION LEVEL ............................................ 31
6.2 POSSIBILITIES OF SUSTAINABLE SWM ........................................................................... 32
6.3 POSSIBILITIES OF PRIVATE SECTOR PARTICIPATION ............................................................ 33
6.4 EXPECTATION OF SUPPORT .......................................................................................... 34
7 CONCLUSIONS AND RECOMMENDATIONS ............................................................ 35
7.1 CONCLUSIONS .......................................................................................................... 35
7.2 RECOMMENDATIONS ................................................................................................. 36
REFERENCES ................................................................................................................. 38
ANNEXES ......................................................................................................................... I
ANNEX A: DETAILS OF COLLECTED DATA FROM MUNICIPALITIES ......................................................... I
ANNEX B: PROCEEDINGS OF 2‐DAY SWM BASELINE TRAINING .......................................................... I
ANNEX C: FIELD REPORT OF 58 MUNICIPALITIES ............................................................................. I

IX
List of Figures
FIGURE 2‐1 LOCATION OF 58 MUNICIPALITIES………............................................................... ..................... 6
FIGURE 2‐2 SAMPLE DESIGN FOR HOUSEHOLD WASTE QUALITY AND QUANTITY SURVEY ...................................... 7
FIGURE 2‐3 SAMPLE DESIGN FOR INSTITUTIONAL AND COMMERCIAL WASTE CHARACTERIZATION SURVEY .............. 9
FIGURE 3‐1 STATUS OF AVERAGE HOUSEHOLD WASTE GENERATION WITH VARIATION OF EXPENDITURES ............. 13
FIGURE 3‐2 AVERAGE HOUSEHOLD GENERATION PATTERN IN DIFFERENT ECOLOGICAL REGION ........................... 13
FIGURE 3‐3 AVERAGE COMPOSITION OF HOUSEHOLD WASTE OF 58 MUNICIPALITIES ........................................ 16
FIGURE 3‐4 COMPOSITION OF HOUSEHOLD WASTE IN DIFFERENT ECOLOGICAL REGION ..................................... 17
FIGURE 3‐5 AVERAGE COMPOSITION OF INSTITUTIONAL WASTE OF 58 MUNICIPALITIES .................................... 18
FIGURE 3‐6 AVERAGE COMPOSITION OF COMMERCIAL WASTE IN MUNICIPALITIES OF NEPAL ............................. 19
FIGURE 4‐1 TYPE OF SOLID WASTE DISPOSAL METHODS IN MUNICIPALITIES OF NEPAL ...................................... 21

X
List of Tables
TABLE 1‐1 GEOGRAPHICAL DISTRIBUTIONS OF THE MUNICIPALITIES ................................................................. 3
TABLE 1‐2 CLASSIFICATION OF MUNICIPALITIES BASED ON POPULATION (SOURCE: CBS, 2011) ........................... 4
ANNEX A/TABLE 1: AREA AND POPULATION IN 58 MUNICIPALITIES OF NEPAL .................................................... II
ANNEX A/TABLE 2: THE PER‐CAPITA HOUSEHOLD WASTE, PER‐CAPITA MSW, TOTAL GENERATED MSW, ESTIMATED
COLLECTED MSW AND COLLECTION EFFICIENCY IN 58 MUNICIPALITIES ...................................................... I
ANNEX A/TABLE 3: AVERAGE COMPOSITION OF HOUSEHOLD WASTE IN 58 MUNICIPALITIES .................................. I
ANNEX A/TABLE 4: AVERAGE COMPOSITION OF INSTITUTIONAL WASTE IN 58 MUNICIPALITIES ............................ III
ANNEX A/TABLE 5: AVERAGE COMPOSITION OF COMMERCIAL WASTE IN 58 MUNICIPALITIES ............................... V
ANNEX A/TABLE 6: TYPE OF EXISTING COLLECTION SERVICES AND TRANSPORTATION EQUIPMENTS IN 58
MUNICIPALITIES ............................................................................................................................... I
ANNEX A/TABLE 7: TYPE OF FINAL WASTE DISPOSAL METHODS AND DETAILS INFORMATION OF PLANNED LANDFILL
SITE IN 58 MUNICIPALITIES. ............................................................................................................ XIV
ANNEX A/TABLE 8: EXISTING AND PLANNED COMMUNITY OR MUNICIPAL COMPOSTING PLANT IN 58 MUNICIPALITIES
..................................................................................................................................................... I
ANNEX A/ TABLE 9: TOTAL MUNICIPAL BUDGET AND SWM BUDGET IN 58 MUNICIPALITIES .................................. I

1
CHAPTER I
1 Introduction
1.1 Background
Solid Waste Management (SWM) is one of the major environmental issues particularly in
municipalities of many developing countries like Nepal that suffer from serious pollution
problems. Urban population growth and economic development are considered vital for
Municipal Solid Waste (MSW) generation, as these factors not only accelerate
consumption rates but also increase waste generation (Alamgir et al., 2005). The
migration is creating unplanned urbanization and these areas produce a lot of
unmanageable quantities of solid waste in all major municipalities and cities of Nepal.
Increasing unplanned urbanization along with user’s mind‐set of ‘out of sight out of mind’
of wastes have intensified environmental pressures including unorganized waste disposal
in many municipalities of Nepal. In addition to these, the use of the products that
produces hazardous waste is another concern. Unmanaged disposal of medical wastes
generated from the hospitals and clinics are also contributing to the pollution and health
hazards in the localities. Thus, SWM has become a major concern for the municipalities
and towns of Nepal.
Although, SWM is one among the basic services provided by municipalities to keep urban
centers clean, and there is a need to develop appropriate SWM system in order to
prevent future environmental health problems (LGSA, 1999; SWMA, 2011), managing
solid waste is a low priority mainly because the demand is higher for other public services
in many municipalities of Nepal. As provisioned in solid waste management act 2011,
Solid Waste Management Technical Support Centre (SWMTSC) shall provide technical
support to all local governments (LGs) for effective and sustainable SWM with the
advancement of research and development (R & D) in this sector. However, executing
authorities such as SWMTSC and LGs including municipalities are experiencing difficulties
in developing management plans and in decision making while addressing the emerging
issues due to the lack of SWM baseline information and data related to the functional
elements of SWM. It is essential to know the composition and characterization of solid
waste for implementing proper waste disposal and management plans and practices for
recovery of resources before deciding the appropriate method of its processing and
disposal.
Previous studies have been conducted to collect SWM baseline information, but most of
those were limited to Kathmandu Valley’s municipalities (Dangi et al., 2011, 2009;
Manandhar, 2005; Nippon Koei Co. Ltd. and Yachiyo Engineering Co. Ltd., 2004). A
nationwide SWM baseline study in all 58 municipalities of Nepal was carried out by Solid
Waste Management & Resource Mobilization Center (SWMRMC) in 2003 (SWMRMC,
2004). It was the first attempt to conduct SWM baseline study in national level. SWMRMC

2
has made effort to update these data in different time windows over the period of 2004
to 2009; however, these reports on waste quantities are incomplete due to the lack of
scientific and systematic methodology. Despite these efforts, few studies were carried out
in solid waste quantity and quality in few municipalities (SEAM‐N, 2009). However, the
findings of the previous studies are not consistent in waste quantity and quality in
municipalities due to the lack of consistent scientific methods, the assumptions made to
quantify the waste generated from different sources.
This study was intended to conduct the systematic and comprehensive study of
quantification of municipal waste and its composition and to compile factual information
on the state of solid waste management in the 58 municipalities of Nepal. The study also
identified the current status and background information on the MSW, management
practices, problems and future prospects in the municipalities.
1.2 Geographical distribution of municipalities
The geographical distribution of these cities and towns as per development region and
ecological zones is as shown Table 1‐1. Table 1‐1 indicates that the municipalities are
concentrated in on eastern and central development regions in Terai rather than the hilly‐
mountain areas. Of total municipalities, 31 municipalities are located in Terai whereas 25
municipalities lie in hilly region and only 2 municipalities in Mountain Region. The Terai in
the EDR has ten municipalities whereas FWDR has only three municipalities in the Terai
area. However, the hilly‐mountain area in the CDR has ten municipalities whereas the
same region in the MWDR has only two municipalities despite of its greater geographical
coverage.
The physical factors such as altitude, temperature, rainfall, humidity as well as socio‐
economic factors such as population, economic status and consumption patterns etc. are
varied from one region to others. These factors influence the waste generation,
characteristics as well as treatment and final disposal technologies of waste. This analysis
provides a basis for the comparison of the various indicators describing the state of solid
waste management in the municipalities of different regions and finally helps to
recommend appropriate waste treatment and management approach.

3
Table 1‐1 Geographical distributions of the municipalities
Development
region
Ecological
region Municipality
No. of municipalities
Eastern
Development
Region
Mountain Khandbari 1
Hill Ilam, Dhankuta, Triyoga 3
Terai Damak, Inaruwa, Bhadrapur, Itahari,
Siraha, Biratnagar, Rajbiraj, Lahan,
Dharan, Mechinagar
10
Central
Development
Region
Mountain Bhimeshowr 1
Hill Panauti, Kirtipur, Thimi, Bidur,
Banepa, Dhulikhel, Kathmandu,
Bhaktapur, Lalitpur
9
Terai Malangawa, Bharatpur, Hetauda,
Janakpur, Gaur, Ratnanagar, Birgunj,
Kalyaiya, Jaleshowr, Kamlamai
10
Western
Development
Region
Hill Putalibazar, Lekhnath, Gorkha, Vyas,
Waling, Pokhara, Tansen, Baglung
8
Terai Butwal, Kapilbastu, Ramgram,
Siddharthanagar
4
Mid‐western
Development
Region
Hill Birendranagar, Narayan 2
Terai Gularia, Nepalgunj, Tulsipur, Ghorahi 4
Far‐western
Development
Region
Hill Amargadhi, Dasharathchand, Dipayal‐
Silgadhi
3
Terai Bhimdatta, Dhanghadi, Tikapur 3
Total Mountain = 2; Total Hill = 25; Total Terai = 31
1.3 Land use pattern
The municipalities cover about 2.25% of the total area of country. The smallest
municipality in terms of area coverage seems to be Banepa with an area of 6.07 square
kilometer (sq km) and the largest one is Triyuga of Udayapur district with an area of 322
sq km (Annex A/Table1). The figures indicated that the highest built‐up area was found to
be 36 sq km in Kathmandu Metropolitan City (KMC). Land use pattern is an important
factor in solid waste management as the solid wastes generated in rural areas are
normally managed locally.

4
1.4 Urban‐rural setting
For purpose of this SWM baseline study, area of each municipality was categorized into
urban and rural wards. Ward is the smallest administrative unit of each municipality. The
urban ward is referring to those areas having higher population density with intense
commercial and industrial activities. The rural wards in the municipalities are those areas
of lesser population density with no commercial activities. Of total 58 municipalities, only
few municipalities like Kathmandu valley’s municipalities, Biratnagar have no rural wards,
whereas Bhimdutta has 17 rural wards in total 19 wards. Similarly other many
municipalities like, Kamalamai, Kapilbastu, Triyuga, Dashrathchand, Gulariya, Khadbari
etc., are dominated by rural wards.
In this study, wards were chosen both from urban and rural setting of the municipalities
for the waste generation and composition study, which resulted more comprehensive
and representative average per‐capita waste generation rate in each municipality.
1.5 Demographic information
Nepal has 58 municipalities having a population of 4.5 million that accounts for 17% of
the total population in the country. Among the municipalities, the Kathmandu
Metropolitan City constitutes the largest population of 1,006,656 followed by Pokhara,
Lalitpur and Biratnagar Sub‐Metropolitan City. Dhulikhel has the lowest population,
16,406, among the municipalities followed by Dasharath Chand, Bhadrapur and Ilam
municipalities (CBS, 2011). These municipalities can be classified in 4 groups as under:
Table 1‐2 Classification of municipalities based on population (Source: CBS, 2011)
Population range No. of municipalities Total population
> 100000 10 2419273
50000 ‐ 100000 17 1193935
25000 ‐ 50000 22 721400
< 25000 9 186842
Total 58 4521450
Biratnagar, Birgunj, Bharatpur, Bhim Dutta, Butwal, Dhangadhi, Dharan, Kathmandu,
Lalitpur and Pokhara having a population above 100,000 which account more than 50% of
the total municipalities’ population. Similarly, the municipalities having population less
than 25,000 are 9 which include Amarghadi, Bhadrapur, Bhimeshwor, Dasharath Chand,

5
Dhulikhel, Ilam, Jaleshwor, Narayan and Waling. The population of the rest of the
municipalities lies between 25,000 and 100, 000 as given in Annex A/Table 1.
1.6 Objectives of study
The main objectives of this study are to determine the municipal waste generation and its
composition in the municipalities of Nepal and to present status, practices and issues of
SWM in 58 municipalities of Nepal.
The specific objectives of the study are:
to determine the per capita household waste generation, amount and the
different waste composition;
to estimate the quantity of institutional and commercial waste generation and
their composition;
to estimate the average per capita municipal waste generation and its total
quantity;
to exhibit the current practices of municipal waste in 58 municipalities in terms of
segregation, collection, treatment and final disposal;
to assess the level of services and allocation of financial and human resources in
SWM;
to study current policies, regulations related to SWM; and
to analyze the information, identify the focal areas for improvement and to
provide recommendations in relation to the status‐quo and issues of municipal
solid waste management.
1.7 Study limitations
Although the study covers municipal solid waste quantity and quality survey, vegetable
waste, street waste etc., waste generated from parks/gardens and treated hospital waste
were not accounted in the study even they are considered as MSW. Moreover, industrial
and hospital waste were not considered though they are not MSW but go to the MSW
stream with partial or no treatment in many municipalities of Nepal.
Small sample size and one time sampling of waste generation may vary average value,
difficulty for estimation of total institutional and commercial waste quantity was still
remained because the data obtained were fluctuated and the statistics of commercial and
institutional sources were not also updated.
The rapidly changing political situation in Nepal in the April/May of 2012 has disrupted
the SWM survey in few municipalities. However, survey was resumed when situation
became favorable.

6
CHAPTER II
2 Study methods
2.1 Study area, type of waste and composition
The SWM baseline study was conducted to 58 municipalities of Nepal. Location of the 58
municipalities is given in Figure 2‐1.
FIGURE 2‐1 LOCATION OF 58 MUNICIPALITIES
The households, commercial establishments, institutions, industries, health institutions,
etc are the potential waste generators in the municipality. However, this SWM baseline
study covers the households, commercial and institutional establishments as waste
generators in existing 58 municipalities of the country. Solid waste survey for composition
of 58 municipalities was sorted out as:
Organic waste
Plastics
Paper and paper products
Textile
Rubber and Leather

7
Metals
Glass
Others (inert materials etc.)
2.2 Sampling and survey design
The study covers 58 municipalities with sample size of 3,233 households, 627
institutions/offices and 627 commercial establishments (shop/hotel/restaurant) which
were undertaken by employing random (probability) sampling technique. This size of
sample produces results with +/‐1.7 percent of the error margin at a 95 percent
confidence level at the national level1.
2.2.1 Household sampling
Sampling for the selection of respondents was done in four stages. The sampling
framework is outlined in brief below in Figure 2‐2.
Sampling frame: 58 Municipalities
First stage: Each Municipality was considered as Strata based on
Stratified sampling principle
Second stage: Wards were selected municipality based from the on the
urban‐rural settings, income level, population density etc. in
consultation with concerned municipal officials
Third stage: From the selected wards, households were identified by
Right‐Hand‐Rule technique for waste quantity survey
Fourth stage: Respondent was selected for interview
FIGURE 2‐2 SAMPLE DESIGN FOR HOUSEHOLD WASTE QUALITY AND QUANTITY SURVEY
In the first stage, 58 municipalities of Nepal were considered as strata using stratified
sampling technique. The sample size for each stratum was determined by probability
1Statistically, error margin is the range within which the result may vary and still be acceptable; confidence level indicates the probability that the result will fall within that range. The confidence level of 95% means that there are 95 chances in 100 that the sample result represents the true condition of the population within a specified error margin. For instance, if the estimate sample value is Rs. 4000, confidence level is 95% and error margin is +/‐ 4%, then the true value will be no less than Rs. 3840 and no more than Rs.4160, in that result the researcher have 95% confidence.

8
proportional to size (PPS) sampling technique (i.e. greater the stratum size; greater the
sample size). However, the minimum sample size for each stratum was determined to 50
households.
In the second stage, proportional numbers of wards were selected from every
municipality mainly based on the urban‐rural settings, income level, population density
etc. in consultation with concerned municipal officials. The numbers of sample wards vary
according to the size of the municipality. One ward was selected for every 10 households:
for example, if 100 households are to be selected from a municipality, ten wards, each
with the minimum 10 households, could be selected. In this study, 220, 150 and 100
households were selected in KMC, LSMC and Bhaktapur municipality while the minimum
50 households were selected from rest of the municipalities.
In the third stage, households in each sample ward were selected randomly by employing
the Right‐Hand‐Rule technique2. Finally, in the fourth stage, household head, if possible,
was selected as respondents for interview who can provide information about solid waste
management practices.
2.2.2 Sampling of Institution and commercial establishment
Waste quantity and quality survey of Institutional and commercial establishment were
also conducted simultaneously. A total of 627 schools or Non/government offices were
selected. These institutional establishments spread across the 58 municipality of country.
The minimum five schools and five Non/government offices were selected from every
municipality. Generally, the similar wards that were identified for household survey were
also chosen for sampling of institution (office) and commercial establishment. One school
and one office (government/non‐government or private) from each ward were selected,
except for wards where school or office was not available. In such case, two or more than
two schools or offices were sampled from a single ward.
Similarly, 627 shops or hotel/restaurants were selected for waste quantity and quality
survey. These 627 shops and hotel/restaurants were spread across the 58 municipality of
country. The minimum five shops and hotel/restaurants were selected from every
municipality. One shop and one hotel/restaurant were randomly selected from each
ward.
2 The starting points for the "Right‐Hand‐Rule” are recognizable locations such as schools, crossroads, Chautaras, bazaars etc. At first, interviewers start to walk towards any direction randomly from a starting point counting number of households at the same time. If it is less than 20, an interviewer will select the first 10 households on the right hand side of his/her route. If it is between 20 to 29, an interviewer will select the first household and then select each 3rd household on the right hand side of the interviewer route until he/she covered 10 households. If it is 30 or more than 30, an interviewer will select the first household and then select each 4th household on the right hand side of the interviewer route until s/he covers 10 households.
9
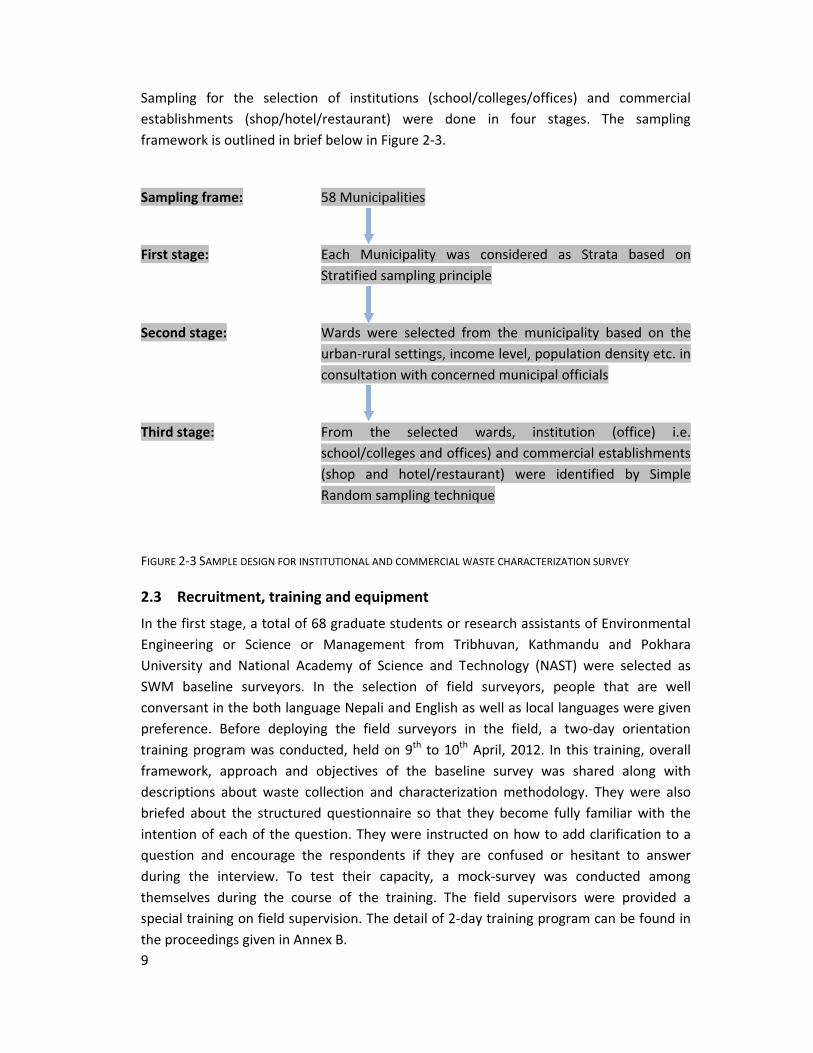
Sampling for the selection of institutions (school/colleges/offices) and commercial
establishments (shop/hotel/restaurant) were done in four stages. The sampling
framework is outlined in brief below in Figure 2‐3.
Sampling frame: 58 Municipalities
First stage: Each Municipality was considered as Strata based on
Stratified sampling principle
Second stage: Wards were selected from the municipality based on the
urban‐rural settings, income level, population density etc. in
consultation with concerned municipal officials
Third stage: From the selected wards, institution (office) i.e.
school/colleges and offices) and commercial establishments
(shop and hotel/restaurant) were identified by Simple
Random sampling technique
FIGURE 2‐3 SAMPLE DESIGN FOR INSTITUTIONAL AND COMMERCIAL WASTE CHARACTERIZATION SURVEY
2.3 Recruitment, training and equipment
In the first stage, a total of 68 graduate students or research assistants of Environmental
Engineering or Science or Management from Tribhuvan, Kathmandu and Pokhara
University and National Academy of Science and Technology (NAST) were selected as
SWM baseline surveyors. In the selection of field surveyors, people that are well
conversant in the both language Nepali and English as well as local languages were given
preference. Before deploying the field surveyors in the field, a two‐day orientation
training program was conducted, held on 9th to 10th April, 2012. In this training, overall
framework, approach and objectives of the baseline survey was shared along with
descriptions about waste collection and characterization methodology. They were also
briefed about the structured questionnaire so that they become fully familiar with the
intention of each of the question. They were instructed on how to add clarification to a
question and encourage the respondents if they are confused or hesitant to answer
during the interview. To test their capacity, a mock‐survey was conducted among
themselves during the course of the training. The field supervisors were provided a
special training on field supervision. The detail of 2‐day training program can be found in
the proceedings given in Annex B.

10
Out of 68 participants, a total of 64 participants successfully completed training programs.
Upon completion of the training, surveyors were assigned to conduct SWM baseline study
in each municipality based on lottery system. A surveyor was assigned in each
municipality except Kathmandu Metropolitan City (KMC), Lalitpur Sub Metropolitan City
(LSMC) and Bhaktapur municipality. The four surveyors engaged in KMC whereas three
and two surveyors were involved in LSMC and Bhaktapur municipality respectively. All the
surveyors engaged in SWM baseline study were provided with hand gloves, dust masks,
digital weighing machine, 7 sets of pre‐designed questionnaires and record sheets.
2.4 Field survey and data collection
2.4.1 Field study
The SWM baseline study team conducted the survey in 58 municipalities of Nepal in April
to May 2012 during the dry season. Field surveyors with sufficient knowledge in subject
matters and research experience were employed for the fieldwork under direct
supervision of supervisors, team leader of SWM baseline study and candidate
municipality. Surveyors had spent the minimum 10 nights to complete their field study in
their assigned municipality.
Due to the difficulty of handing waste from more than 3200 households and 1200
institutions or commercial establishments of 58 municipalities with limited resources and
time as well as based upon the findings of Nippon Koei Co. Ltd. and Yachiyo Engineering
Co. Ltd. (2005) and Dangi et al. (2008) in municipalities of Kathmandu valley, this study
utilized a one‐day sampling of waste. The findings of Nippon Koei Co. Ltd. and Yachiyo
Engineering Co. Ltd. (2005) are presented in next chapter.
The sampling of household waste was performed the day after the survey. For this study,
a household was defined as a number of people using one kitchen and not by the number
of rooms or house types. During the survey, the surveyors informed each households,
commercial sectors, government and non‐government institutions and educational
institutions that their wastes generated in a 24 hour period would be analyzed and
provided waste collection bags. The surveyors collected the waste the next day to
measure quantity (in wet weight basis) of the eight different wastes mentioned in
subsection 2.1.
2.4.2 Standard questionnaires
A pre‐coded structured questionnaire was formulated with the help of experts within the
team. The separate set of questionnaires was developed for household and municipality
to collect and to update SWM related information of different aspects. Length of the
questionnaire was also considered in such a way that its administration in the field would
not take more time. The questionnaire was formulated in English and the English version
was used for administering. The enumerator actually translates the questionnaire in
Nepali during the interview process.

11
A pre‐test was carried out and the questionnaire fine‐tuned before actually administering
it in the field.
2.5 Data analysis techniques
Upon completion of the field survey in 58 municipalities, data was analyzed using CS‐Pro,
SPSS and MS Excel. In order to maintain the data clean, legal codes, authorized range
check, consistency check and extreme case check systems was developed in the data
entry program. After the completion of the data entry, the data was imported to SPSS
where analysis and presentation in a tabular form was performed. After the analysis, the
data was imported in the MS Excel to produce necessary charts and graphs.
2.6 Quality assurance and quality control
To make the SWM baseline study results more accurate and realistic, different quality
assurance and quality control procedures were carried out during period of whole study.
The qualified and competitive surveyors, who have sufficient knowledge in subject
matters and research experiences, were selected to conduct this study. The
questionnaires were designed in simple and understandable format to get the detail
information of various aspects of SWM. Before deploying in the field, the surveyors were
fully trained during the 2‐day training with sufficient field exercises. To make accurate and
realistic measurement of waste, digital weighing machine were provided to each surveyor.
All the municipalities were informed about the SWM baseline study along with the details
of terms of references (ToR) of surveyor. Each surveyor had carried out his/her field
survey in direct consultation and direct supervision under concerned municipal officials of
assigned municipality. Moreover, municipalities were requested to provide
recommendation letter to ensure whether surveyors were fully engaged in their field
study to assigned municipality. The supervisors from SWM baseline study team had
supervised and provided necessary inputs to each surveyor continuously during the field
survey. During the waste quantity survey, waste samplings were repeated in households
and other waste generators in case of unrealistic waste quantity observed.

12
CHAPTER III
3 Municipal solid waste generation and composition
3.1 Household waste generation
The wards in this study were chosen mainly based on the urban‐rural settings, income
level, population density etc to quantify the realistic representative average per capita
waste generation in each municipality. The per capita waste generation of each
household was calculated by dividing the total waste produced with the number of
people living in that household that day. The clusters were chosen based on urban‐rural
settings, population density and economic status in each municipality where the
representative households were selected randomly by employing the Right‐Hand‐Rule
technique. The total sample size of 3233 households from 58 municipalities, varying from
the minimum 50 households to 220 households gave an average per‐capita household
waste generation figure of 170 gm/capita/day. This study also showed that the household
waste generation rates were varied depending upon the economic status. Figure 3‐1
showed that households those have higher average expenditures also have generated
higher amount of waste per day. It is clear that household that spend a lot mean that they
might have high consumption rates, which resulted more generation of waste.
Tchobanoglous et al. (1993) and Vesilind et al. (2002) showed that waste generation rates
could vary depending on the season, month and day of the week. However, Nippon Koei
Co. Ltd. and Yachiyo Engineering Co. Ltd. (2005) did not find conventional season‐specific
impacts on household waste generation in KMC. Instead, they found 223 gram/capita/day
with 248 gram/L of bulk density among 40 households examined in April 2004 (the dry
season) and 248 gram/capita/day with a bulk density of 174 gram/L for 400 households
studied in September 2004 (the wet season). Nippon Koei Co. Ltd. and Yachiyo
Engineering Co. Ltd. (2005) also found the similar waste generation from households
sampled during weekdays and weekends. Similarly, Dangi et al. (2008) also found that the
daily average household waste generation in 200 KMC households did not vary much
during a 14‐day study conducted in December 2005. But, it is noted that geographical
location with climatic variation varied the average household generation rate as shown as
Figure 3‐2. The Figure 3‐2 compared the average household waste generation of
municipalities located in different ecological regions: Mountain, Hill and Terai.

13
0.570.71
0.82
1.07
1.25
0.0
0.2
0.4
0.6
0.8
1.0
1.2
1.4
< 5,000
5001 ‐
10,000
10,001 ‐
20,000
20,001 ‐
40,000
> 40,000
Average monthly expenditure (NRs./family)
Avera
ge d
aily w
aste
genera
tion (kg/fam
ily)
FIGURE 3‐1 STATUS OF AVERAGE HOUSEHOLD WASTE GENERATION WITH VARIATION OF EXPENDITURES
0.49
0.72
0.88
0.00.10.20.30.40.50.60.70.80.91.0
Mountain municipality Hill municipality Terai municipality
Ecological region
Ave
rag
e d
aily
was
te
gen
erat
ion
(kg
/fam
ily)
FIGURE 3‐2 AVERAGE HOUSEHOLD GENERATION PATTERN IN DIFFERENT ECOLOGICAL REGION
As per survey results, the per‐capita household waste generation is found to vary from a
minimum value of 75 gm/capita/day (Triyuga Municipality) to a maximum value of 278
gm/capita/day (Inaruwa Municipality). It is noted that the households surveyed in some
of the municipalities, especially from the rural wards were found to use most of the
organic waste for feeding their cattle. Even when they were requested to keep all the
waste generated in 24 hours from their households during the survey – thus resulting in
very low rate of waste generation compared to the municipality average. Higher per
capita waste generation was observed in Kathmandu, Pokhara, Banepa, Bharatpur etc.,
because fast urban growth and economic development of these cities have accelerated
not only the consumption rates but also the waste generation. However, in case of few
municipalities those have lesser urban growth and economic development especially
located in Terai area like Inaruwa, Lahan, Kalaiya, Malangwa and Rajbiraj, most of the
14
households surveyed were found to generate wastes much more than average. Highly
populated area with lack of basic knowledge in SWM and poor sanitation level might be
the reasons of higher amount of waste generation in the households surveyed in these
municipalities. The per capita household waste generation in each municipality is given to
Annex A/ Table 2.
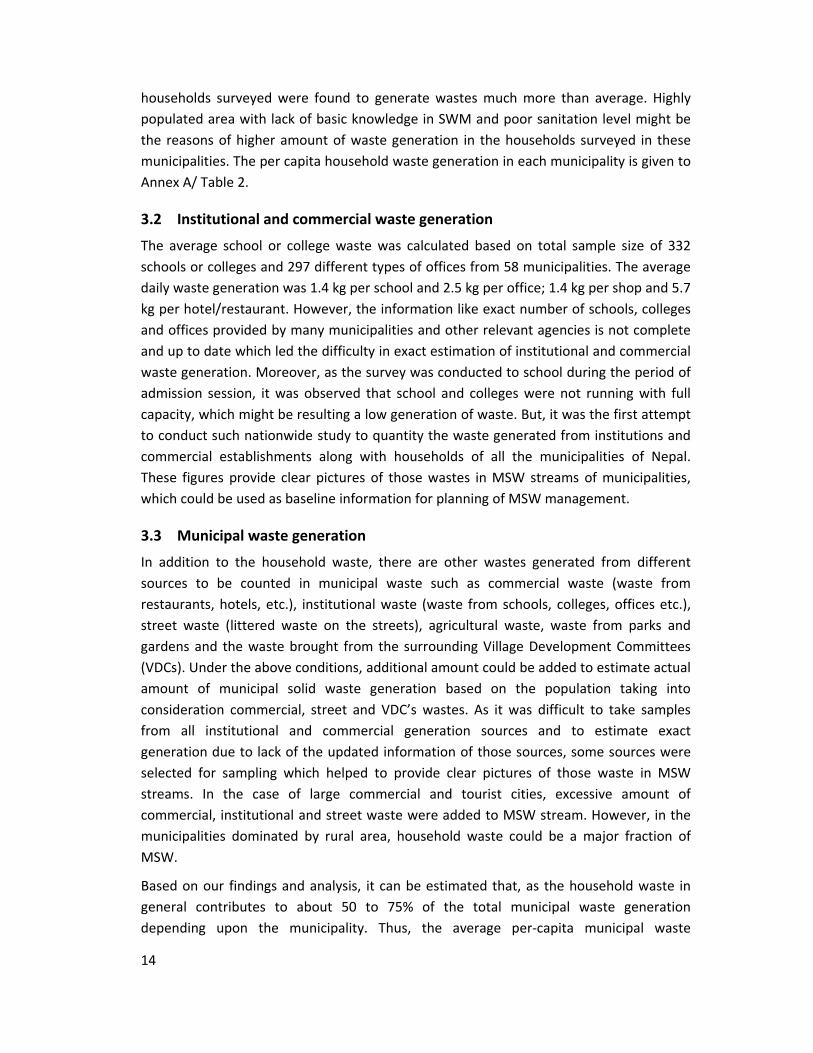
3.2 Institutional and commercial waste generation
The average school or college waste was calculated based on total sample size of 332
schools or colleges and 297 different types of offices from 58 municipalities. The average
daily waste generation was 1.4 kg per school and 2.5 kg per office; 1.4 kg per shop and 5.7
kg per hotel/restaurant. However, the information like exact number of schools, colleges
and offices provided by many municipalities and other relevant agencies is not complete
and up to date which led the difficulty in exact estimation of institutional and commercial
waste generation. Moreover, as the survey was conducted to school during the period of
admission session, it was observed that school and colleges were not running with full
capacity, which might be resulting a low generation of waste. But, it was the first attempt
to conduct such nationwide study to quantity the waste generated from institutions and
commercial establishments along with households of all the municipalities of Nepal.
These figures provide clear pictures of those wastes in MSW streams of municipalities,
which could be used as baseline information for planning of MSW management.
3.3 Municipal waste generation
In addition to the household waste, there are other wastes generated from different
sources to be counted in municipal waste such as commercial waste (waste from
restaurants, hotels, etc.), institutional waste (waste from schools, colleges, offices etc.),
street waste (littered waste on the streets), agricultural waste, waste from parks and
gardens and the waste brought from the surrounding Village Development Committees
(VDCs). Under the above conditions, additional amount could be added to estimate actual
amount of municipal solid waste generation based on the population taking into
consideration commercial, street and VDC’s wastes. As it was difficult to take samples
from all institutional and commercial generation sources and to estimate exact
generation due to lack of the updated information of those sources, some sources were
selected for sampling which helped to provide clear pictures of those waste in MSW
streams. In the case of large commercial and tourist cities, excessive amount of
commercial, institutional and street waste were added to MSW stream. However, in the
municipalities dominated by rural area, household waste could be a major fraction of
MSW.
Based on our findings and analysis, it can be estimated that, as the household waste in
general contributes to about 50 to 75% of the total municipal waste generation
depending upon the municipality. Thus, the average per‐capita municipal waste
15
generation, as per survey results, can be estimated 318 gram/capita/day. The per‐capita
household and municipal waste generation in each municipality has been given to Annex
A /Table 2. Based on these per‐capita waste generation figures and population for the
year 2011, the total municipal waste generation has been calculated and presented in the
same table. The total municipal waste generation of 58 municipalities was found to be
more than 525,000 tons/year. It is however lower than that reported in other studies, like
SWMRMC (2004, 2008), the 170 gram/capita/day and 318 gram/capita/day of Nepalese
municipalities’ household and municipal waste generation rate calculated in this study
appears to be reasonable. For example, this study revealed the household waste
generation rate of KMC 232 gram/capita/day, which is levelheaded to the data presented
by Nippon Koei Co. Ltd. and Yachiyo Engineering Co. Ltd. (2005). Data from the 440 KMC
households that took part in their study yielded an average generation rate of 250
gram/capita/day. The majority of households sampled by the study yielded generation
rate of 100 to 150 gram/capita/day in their frequency plot, and is in general agreement
with the results of this study.
Generally, the lower generation rate was resulted in this study, which may have been due
to the way household sources were selected, the sampling and handling method used.
The low counts of valuable recyclables such as glass, paper, plastics and metals, which are
often sold to informal collectors at the source, may have contributed to the rates
obtained here. Furthermore, few previous project specific studies held in municipalities
relied solely upon the questionnaires instead of physical site sampling, which have led to
elevated per capita household solid waste generation rates. Most of the previous studies
were limited to only core urban area of the municipality instead of covering urban, semi‐
urban and rural wards of municipalities proportionately. Considering the household from
only core urban area, in fact, will give higher per capita household waste generation rates.
In this study, the wards were chosen based on urban‐rural settings, population density
and economic status in each municipality where the representative households were
selected randomly, which resulted the lower average household waste generation rates
as compared to previous study.
3.4 Municipal waste composition
The characteristics of MSW collected from any area depend on various factors such as
consumer patterns, food habits, cultural traditions of inhabitants, lifestyles, climate,
economic status, etc. Composition of urban waste is changing with increasing use of
packaging material and plastics.
3.4.1 Household waste composition
Average composition of household waste of 58 municipalities in eight major waste
components, i.e. organic, plastics, paper and paper products, glass, metal, rubber and
leather, textiles and others like inert and dust (with average values by % wet weight), is
represented graphically in Figure 3‐3.

16
Organic waste
65%
Plastics
11%
Paper/paper
products
9%
Others
7%
Glass
3%
Metals
2%
Textiles
2%
Rubber and Leather
1%
FIGURE 3‐3 AVERAGE COMPOSITION OF HOUSEHOLD WASTE OF 58 MUNICIPALITIES
The analysis of waste composition indicated that the highest waste fractions were organic
matter (65%) followed by plastics (11%). Paper and paper products and others comprised
9% and 7% of the waste respectively. Glass, metal, rubber and leather, textile
components all were at or below 3%. The average composition of the household waste of
58 municipalities showed that there was a mixture of different types of components, with
a significant portion (65%) of them being compostable. The high organic content
indicated the necessity for frequent collection and removal, as well as having a good
prospect of organic waste recycling through composting. Similarly, the content of major
reusable/recyclable materials (i.e. plastic, paper and paper products, metal, glass, rubber
and textiles) comprised with an average of 28%. Moreover, paper and paper products,
textiles, plastics and rubber etc., can be used as Refused Derived Fuels (RDFs), which
comprised about 23%.
It is also remarkable that geographical location with climatic variation also varies the
composition of household waste. The Figure 3‐4 compared the average household waste
composition of municipalities located in different ecological regions: Mountain, Hill and
Terai. Compared to Mountain and Hill region, the organic fraction was higher in the
household waste of municipalities from Terai region.

17
52
10 112 2 3 1
17
63
12 104 2 2 1
6
68
10 82 1 2 1
7
01020304050607080
Organic
waste
Plastics Paper/paper
products
Glass Metals Textiles Rubber and
Leather
Others
% by weight
Mountain Municipality Hill Municipality Terai Municipality
FIGURE 3‐4 COMPOSITION OF HOUSEHOLD WASTE IN DIFFERENT ECOLOGICAL REGION
Moreover, the values for different waste fractions in terms of percentage composition
obtained from the analysis of household waste samples of each municipality are
elaborated in Annex A/ Table 3. As regards the comparative values for different waste
fractions that play a vital role in treatment and recycling/ resource recovery aspects of
waste management, following important information can be derived from the data
tabulated in that Table. Content on organic materials varies up to 85.87% (Tulsipur
Municipality), with an average value of 65.24%. The findings revealed that the household
waste of all municipalities, in general is qualitatively good viable for producing compost.
The content on major reusable/recyclable materials (i.e. metal, paper, glass and plastic)
varies from 6% (Gaur Municipality) to 57% (Baglung Municipality), with an average value
of 28%. So far the plastic waste is concerned, which is generally creating a major waste
disposal problem in almost all municipalities, the value varies from 2.5% (Gaur
Municipality) to 24% (Baglung Municipality). In the municipalities, those have significant
fraction of reusable/recyclable materials including plastic in the MSW stream, promotion
of waste reduction and recycling activity could be an important measure for minimization
of waste problem created by these waste fractions both quantitatively and qualitatively.
The content of inert materials (i.e. neither compostable nor recyclable) varies from 0% to
30%, with an average value of 7%. It indicates that, in case if all compostable and
reusable/recyclable wastes could be utilized to their potentials, in more than 40
municipalities, less than 10% waste would have to be finally disposed to landfill site. Even
those inert/residue fractions could be used for different purposes rather than disposed of,
such as low strength brick/blocks for paving.
Overall, the average composition of household waste was in line with other studies
conducted in 58 municipalities and municipalities within Kathmandu valley. SWMRMC
(2004) reported the average composition of household waste comprised of organic (66%),

18
plastics (10%) and paper and paper products (9%), which were very similar to present
findings.
The percent by weight of the waste identified by the field study is also within the range of
urban waste characteristics for low‐income countries specified by the World Bank
(Cointreau, 2006).
3.4.2 Institutional waste characteristics
Waste generated from offices, schools and colleges were categorized as institutional
wastes. The composition analysis revealed 19% organic wastes, 18% plastics, 45% paper
and paper products 12% others with glass, textiles, metals and rubber/leather all below
or at 2% (Figure 3‐5).
Paper products
45%
Others
12% Organic waste
19%
Plastics
18%
Glass
2%
Metals
2%
Textiles
1%
Rubber and Leather
1%
FIGURE 3‐5 AVERAGE COMPOSITION OF INSTITUTIONAL WASTE OF 58 MUNICIPALITIES
The higher fraction of paper and paper products and plastics came from students’ snack
boxes and discarded white paper Generally, a low level of organic wastes was found in
school waste because there was little handling of fresh food. The others contained dust,
mud and broken bricks.
The composition of institutional waste obtained from the analysis of institution waste
samples of each municipality are given in Annex A/ Table 4. The table indicated that the
dominant fraction of institutional waste was observed to be paper and paper products in
all the municipalities. It varies from 16 (Ilam Municipality) to 83% (Kapilbastu
Municipality) with an average value of 45%. Organic fraction was found to be in the range
19
of 0% (Kapilbastu Municipality) to 60% (Ilam Municipality) whereas plastics vary from 4%
(Inaruwa Municipality) to 36% (Jaleshwor Municipality).
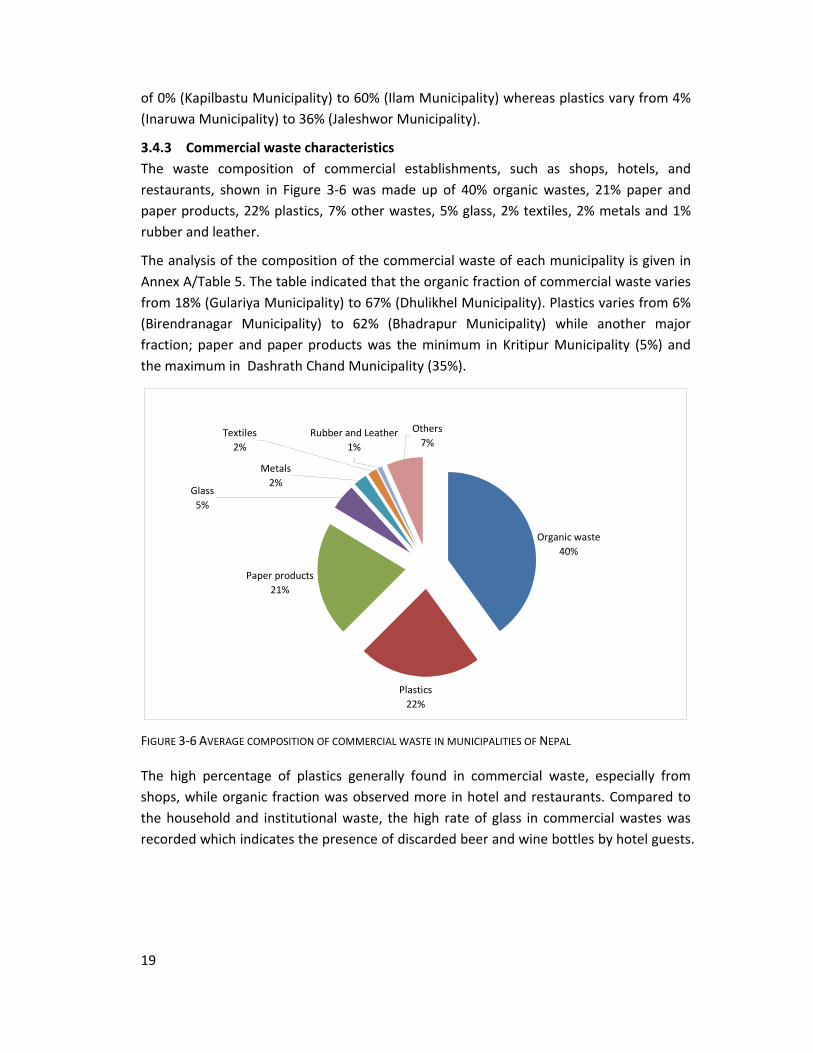
3.4.3 Commercial waste characteristics
The waste composition of commercial establishments, such as shops, hotels, and
restaurants, shown in Figure 3‐6 was made up of 40% organic wastes, 21% paper and
paper products, 22% plastics, 7% other wastes, 5% glass, 2% textiles, 2% metals and 1%
rubber and leather.
The analysis of the composition of the commercial waste of each municipality is given in
Annex A/Table 5. The table indicated that the organic fraction of commercial waste varies
from 18% (Gulariya Municipality) to 67% (Dhulikhel Municipality). Plastics varies from 6%
(Birendranagar Municipality) to 62% (Bhadrapur Municipality) while another major
fraction; paper and paper products was the minimum in Kritipur Municipality (5%) and
the maximum in Dashrath Chand Municipality (35%).
Plastics
22%
Paper products
21%
Organic waste
40%
Others
7%
Glass
5%
Metals
2%
Textiles
2%
Rubber and Leather
1%
FIGURE 3‐6 AVERAGE COMPOSITION OF COMMERCIAL WASTE IN MUNICIPALITIES OF NEPAL
The high percentage of plastics generally found in commercial waste, especially from
shops, while organic fraction was observed more in hotel and restaurants. Compared to
the household and institutional waste, the high rate of glass in commercial wastes was
recorded which indicates the presence of discarded beer and wine bottles by hotel guests.

20
CHAPTER IV
4 Existing solid waste management system
4.1 Collection and segregation
The study uncovered that about 30% of surveyed households in the municipalities are
practicing segregation of waste at sources, which means that waste generated from more
than 70% of households in municipalities goes to MSW disposal site in the form of mixed
waste. It is noted that the households surveyed in some of the municipalities, especially
from the rural wards were found to segregate kitchen waste for their own purpose, e.g.
feeding cattle etc. Even though 21 municipalities have conducted minimal activities for
the promotion of waste segregation at sources in recent years, effective and mass scale
segregation programs are yet to be implemented by almost all municipalities. It was also
reported that the segregated waste at sources sometime, were mixed again during
transportation due to the lack of separate treatment methods.
The solid waste collection system in many municipalities is not satisfactory. Analyzing the
information provided by municipalities, the present collection efficiency ranges between
70 to 90% in major cities, whereas in several smaller municipalities it is below 50% (Annex
A/Table 2). Still, the estimation of collected waste by the municipalities seems to be
overestimated due to the lack of scientific recording system. The collection rate in each
municipality is given in Annex A/Table2. Citizens dispose of waste within their compound
either by unscientific composting or open burning or by throwing the waste in the open
space around. The collection, city cleaning and sweeping is not made on a day‐to‐day
basis. Only main market, main roads and some important residential area are served
daily. Rests of the areas are served intermittently ranging from twice a week to twice a
month. Many areas are neglected due to inefficiency and inadequacy of service.
Container service, door to door collection and road side pickup from open piles or
containers are the type of existing collection services generally practiced in Nepalese
municipalities. The type of existing collection services, collection coverage and frequency
in each municipality are listed in Annex A/Table 6. Public Private Partnerships in collection
and transportation of waste is being attempted on a small scale which needs to be
expanded substantially to improve the primary collection service and making the cities
clean and livable.
4.2 Transportation, transfer station and final disposal
The vehicle and equipment available for waste collection/transportation in each
municipality are listed in Annex A/Table 6.
The functional element of transfer and transport means facilities and appurtenances used
to affect the transfer of wastes from relatively small collection vehicles to larger vehicles

21
and to transport them over extended distances to either processing centers or disposal
sites. Transfer and transport operations become a necessity when haul distances to
available disposal sites or processing centers increase to the point that directly hauling is
no longer economically feasible. The transfer sites are not available in major
municipalities except in Kathmandu and Lalitpur. This may be due to fewer distances of
the disposal sites from city center.
Sites for construction of treatment facilities and sanitary landfills sites are yet to be
identified by many municipalities and waste is currently being disposed off untreated at
crude dumping sites causing problems of health and environment. There is an urgent
need to identify and allot suitable parcels of land for setting up treatment and disposal
facilities. The disposal sites in most of the municipalities are mainly riverbanks, depressed
land/dumps, open pit or temporary open piles as given in Figure 4‐13.
64
13
25
6
2 2
0
5
10
15
20
25
30
San
itary
Lan
dfill
Site
Con
trolle
ddu
mpi
ng
Riv
ersi
de d
umpi
ng
Ope
n du
mpi
ng
Ope
n/riv
erdu
mpi
ng
Roa
dsid
e/riv
ersi
depi
lling
No
mun
icip
aldi
spos
al s
yste
m
Type of disposal methods
Nu
mb
er o
f m
un
icip
alit
y
FIGURE 4‐1 TYPE OF SOLID WASTE DISPOSAL METHODS IN MUNICIPALITIES OF NEPAL
Annex A/Table 7 presents the type of final waste disposal methods practiced in 58
municipalities. Only six municipalities; Kathmandu, Lalitpur, Pokhara, Ghorai, Dhankuta
and Tansen have constructed sanitary landfill site. Even in these municipalities, especially
3Figure 4‐1 refers existing final waste disposal methods practiced in 58 municipalities. Of total 58 municipalities, only six municipalities; Kathmandu, Lalitpur, Pokhara, Ghorai, Dhankuta and Tansen have constructed sanitary landfill site. Tansen municipality has just started to operate sanitary landfill site since October 11, 2012 after construction of access road. For the final disposal of waste generated In Kathmandu and Lalitpur, sanitary landfill site at Sisdol , Okharpauwa was constructed and operated as sanitary landfill site in early stage of operation but currently it is not operated as sanitary landfill site.

22
in Kathmandu and Lalitpur are facing the problems like; frequent local protest, lack of
proper management, operation plan and unavailability of enough equipment etc. In many
municipalities, there is public oppositions and political pressure for disposal of wastes.
This shows that awareness of proper way of waste management is still lacking. The public
and community, where disposal is to be done, need to be taken into confidence and they
need to be made aware of the proper handling of wastes and compensation and other
social programs need to be developed and implemented along with local CBOs and clubs.
In 21 municipalities there is no landfill site planned to date. But other municipalities have
so far identified and planned for a kind of landfill. The details information of planned
landfill site in each municipality is presented in Annex A/Table 7. The problems faced by
the municipalities at present include waiting for approval and government decision for
land purchasing, more land to be acquired, lack of technical support, financial problems,
and problem in area selections, strong opposition of nearby people etc. The political
interferences also have been observed in many municipalities and in some technical
problems such as flooding, shallow water table, highly permeable soil, slope instability
exist. In some municipalities, Initial Environmental Examination (IEE) and Environmental
Impact Assessment (EIA) have been already completed and in some municipalities, these
are in under process.
It is remarkable that sustainable, cost effective and environment friendly technologies
need to be introduced rather than land filling approach in the municipalities of Nepal. As
MSW comprised of more than 65% organic fraction and nearly 20% to 25%
reusable/recyclable fraction in the Nepalese municipalities, resources recovery approach
such as composting, and promotion of 3R activities have to be implemented.
4.3 Resource recovery methods
With municipal budget constraints being tight and resources being scarce, municipalities
are challenged to create a sound budget without increasing cost efficiency option. At the
same time, MSW has become environmental, financial and social burden to each
municipality. However, resource recovery methods instead of disposal methods in
managing MSW not only minimize the above mentioned burdens of municipalities but
also generate the resources. This study unveiled that minimal resource recovery activities
were conducted in the municipalities of Nepal.
4.3.1 Recycling
The household waste composition survey revealed that more than 25% fraction of
household waste and much higher % from institutional and commercial waste could be
either reused or recycled. However, it was observed that there were not any formal
system introduced for reuse and recycle of these components in the municipalities of
Nepal. While it is encouraging to notice that people recover recyclable materials at
sources and sell for a price to formal and informal sector, a large amount of recyclable

23
material continues to be disposed off on the streets and it lands up at the dumping
grounds. According to the survey, 32 municipalities do have waste minimization program
such as reuse and recycle activities via small entrepreneurs in the formal and informal
sector. Of them, 27 municipalities do have information about the scrap dealers/workers,
who collect or buy the recyclable and reusable products from MSW stream.
4.3.2 Composting
Content on organic materials varies up to 85.87% (Tulsipur Municipality), with an average
value of 65.24% that could be used for producing compost. It was found that about 30%
of surveyed households in the municipalities are practicing it. The most of them from
rural areas of the municipality, who were managing their household waste through
composting in traditional way but urban households are not generally doing composting.
Community or municipal composting plant could be found to some extent and also in
planning phases in many municipalities (Annex A/Table 8). Composting provides not only
the fertilizer to farmers wherein they are facing the scarcity of getting chemical fertilizer,
even in very high price, but also reduces large stream of solid waste to be handled and
much less burden in terms of quantity for final disposal into a landfill. The windrow or box
composting can be used either in community level or in municipality level depending
upon the size of municipalities to handle large fraction of organic waste in the
municipalities of Nepal.
4.4 Public awareness and community mobilization
Lack of public awareness is one of the major problems of SWM in most of the
municipalities. In many municipalities, not only citizens but also the municipal staffs are
not aware of managing solid waste even though they have knowledge in waste
management. Therefore, it is first necessary to aware municipalities staffs prior to launch
mass scale public awareness campaigns. Based on the survey data, there are public
awareness program for SWM staffs in only 37 municipalities. Of them, only 10%
municipalities do it regularly while more than 65% do it sometime. Regarding to the
campaigns to public, few municipalities are doing it in collaboration with other actors like
SWMTSC, NGOs and CBOs. Moreover, 33% of municipalities have conducted SWM
awareness and promotion of 3R (reduce, reuse and recycle) activities sometime in
collaboration with educational institutions. In contrast, household survey revealed that
more than 65% households do not have any idea of SWM program by municipalities in
last three years and more than 82% households have not participated in municipal SWM
awareness program.
4.5 Special waste management
Special waste includes waste from special categories like dead animals, construction and
industrial wastes, hazardous/infectious wastes from health institutions that need to be
managed differently than general waste. It is observed that for medical waste,

24
incineration is done in majority of municipalities by hospitals themselves. The incineration
means just burning in the hospital compound within chamber or open burning. In some
municipalities, it is mixed with municipal waste. In some cases, it is burned or just crudely
dumped. However, proper system of management of medical waste is missing and people
are not much aware of the health impact including medical personnel in most hospitals.
In Kathmandu, Bir hospital along with other few hospital have started in managing all
type of hospital waste in safely manner. There is no proper slaughterhouse specifically
designated in all the municipalities; however, it is being operated in Kathmandu, Lalitpur
and other few municipalities. It is observed that dead animals are buried in many
municipalities and dumped in remaining other municipalities. The burying is done near
riverbanks, jungle area and dumping sites. Existing practices for special waste
management in each municipality have been briefly presented in the individual
municipality reports.

25
CHAPTER V
5 Managerial aspects of Solid Waste Management
5.1 Organizational structure
As SWM is one among the basic essential services that have to be provided by
municipalities to keep urban centers clean by developing appropriate SWM system (LGSA,
1999; SWMA, 2011), many have separate sections or units, within their organization
structures, to deal with this issue. Most waste management units are either part of the
Social Development Section or Planning and Urban Development Section or Community
Welfare Section of the municipalities. Some of the smaller municipalities, however, do
not have waste management units. Of total 58 municipalities, 17 municipalities do not
have designated section to look after SWM. In these municipalities, either the
municipality is not providing any waste management services at all or the municipality
has a few sweepers who work under the ward offices or one of the other units. It was
observed that two or more units seem to have similar or overlapping responsibilities in
some municipalities.
Because of the core function and importance of waste management services in order to
prevent the municipalities’ environment and public health and the unique nature of
operating waste management systems, it is essential for all municipalities to have a
separate unit to deal with SWM related issues. In smaller municipalities, this can be a part
of the Social Development Section or Community Welfare Section or Urban Development
Section, whatever is there. In large municipalities however, this should be a separate
Section in itself.
5.2 Resources allocation for waste management
Waste management is a very important function of all municipalities and it requires
substantial human and financial resources. However, often due to financial constraints
municipalities are unable to provide adequate resources for waste management.
Furthermore, due to technical and managerial inefficiencies, the available resources are
often not utilized effectively. Almost all municipalities allocate the budget in SWM sector
however, the breakdown of SWM expenditures are rare except in few municipalities.
Based on the analysis of data provided by municipalities, about 10% of the total municipal
budget is spent in SWM. Of the total SWM budget, the municipalities spend nearly 60‐
70% towards collection and street sweeping, 20‐30% on transportation, which shows that
more attention is required for efficient collection system, treatment and safe disposal of
solid waste. The total municipal budget and budget for SWM in each municipality over
the period of fiscal year (FY) 2009/10 to 2011/12 are presented in the Annex A/Table 9.
Although most of the municipalities do not have any formal system of SWM service
charges, few municipalities have introduced such system and generated revenue.
However, in the municipalities where private sectors are involved in SWM, have collected

26
SWM charges from beneficiaries to sustain their business. The details of SWM fee
structure and revenue generated from SWM service charges in the municipalities
wherever be available are presented in individual municipality report.
The amount of financial and human resources dedicated to waste management varies
significantly according to municipalities. For example, many small municipalities such as
Khadbari have no solid waste management staff but a large city like Kathmandu has more
than 1000 people working on waste management. In addition, Kathmandu also uses the
services of several private companies and NGOs in waste management. The number of
staff working on waste management through these organizations is not accounted for in
this number. Moreover, regular training program for SWM staffs is very important to
enhance their capacity in effective and sustainable SWM. However, there are training
programs for SWM staffs in less than 50% municipalities. Of them, only 7% municipalities
provide regular capacity building training to their SWM staffs however, 75% do it
sometime. The details of human resources and their responsibilities in each municipality
have been presented in the individual municipality report. The number of staff allocated
for waste management generally depends on the characteristics of the municipality and
their experience with dealing with waste management. Older municipalities, which tend
to have large urban population and have dealt with the problems of waste management
for a longer time tend to have a lot of staff to deal with the problem, while newer
municipalities which generally have large rural population have very few staff dedicated
to waste management.
5.3 SWM planning, monitoring and evaluation
Solid waste management is more a managerial issue than the technical. In the
municipalities of Nepal, lacks of appropriate and sustainable management have created
many environmental and social problems within the municipalities and neighboring VDCs,
where waste disposal site is located. Therefore, it requires proper planning, budgeting,
implementation strategy, regular monitoring and evaluation to ensure that the services
are provided in a continuous manner. Based on the information provided by
municipalities, 45% of municipalities reported that they do not have annual plan for SWM,
while 67% and 62% municipalities have not formulated short‐term and mid‐term/periodic
plan for SWM. It means that SWM is not still in priority of many municipalities even
though it is one of the basic essential services to be provided to keep municipality clean
and healthy. It was reported that SWM department/section/unit or senior officials
responsible for SWM in the municipalities monitor and evaluate the SWM activities in
regular basis to make more accountable to municipal staffs as well as other stakeholders.
Municipalities those have such monitoring and evaluation mechanism claim that it has
also helped to improve SWM service delivery in their municipalities. Majority of
municipalities (39) have established such mechanism on SWM but is yet to be introduced
by many municipalities.

27
5.4 Actors involved in SWM
There are various stakeholders in the MSWM like Institutional actors (national
government, Local government etc.), the private sector stakeholders (formal and informal
private sector), the civil society movement (CBOs, TLOs and NGOs) and finally the citizens.
Furthermore there are other actors like "external support agencies" (multilateral,
bilateral, development banks, etc.) into account as important stakeholders with power
and influence. Analyzing the information provided by municipalities, 31 municipalities
have formal working relation with other governments’ institutions, NGOs, CBOs and
private sectors in managing waste. Of them, 23 municipalities have collaborated with
these organizations with financial commitments while 8 municipalities are working with
them without financial commitments. Moreover, it was found that 22 municipalities have
contract out any SWM activities to other actors, mainly NGOs, CBOs, TLOs. A partnership
of municipality with NGOs, CBOs and TLOs are working well in various sector in many
municipalities and could be used even more in relation to SWM.
5.5 SWM policies and legislation
With a view improve SWM, the then Government of Nepal established the Solid Waste
Management Board under the then Ministry of Construction, Supply and Transportation.
Various initiatives were taken between 1981 AD and 1986 AD.
5.5.1 Solid Waste Management and Resource Mobilization Act 1987
Realizing the need of having legislation on SWM, Solid Waste Management and Resource
Mobilization Act, 2044 (1987 AD) was passed and brought into force in 1987 AD. This Act
provided for establishment of the Solid Waste Management and Resource Mobilization
Center as an autonomous body replacing the Solid Waste Management Board. For the
effective implementation of the Act, the Solid Waste Management and Resource
Mobilization Regulations and necessary by‐laws were framed and some new previsions
on solid waste management were incorporated through amendments in the Solid Waste
Management and Resource Mobilization Act.
5.5.2 National Policy on Solid Waste Management 1996
The first Solid Waste Management National Policy was formulated in 2053 BS (1996AD) to
tackle the emerging solid waste management problems due to urbanization. The policy
emphasized on waste management in municipal and urban areas. This policy is still in
force. The main objectives of this policy are to make solid waste management simple and
effective, to minimize the impact of solid waste on environment and public health, to
treat solid waste as resource, to include private sector participation in solid waste
management, and to improve public participation by increasing public awareness on
sanitation.

28
5.5.3 Environment Protection Act 2053 BS (1997 AD) and the related Regulations
In the process of internalizing the Environmental Assessment System in development
proposals, the Government of Nepal enacted the Environment Protection Act (EPA) 1997
and the Environment Protection Rules (EPR), 1997, which make the integration of IEE and
EIA legally binding to the prescribed projects. The Act (Section 7) prohibits the creation of
pollution that may cause significant adverse impacts on the environment, or any such act
that is likely to be hazardous to public life and people's health, or any act that disposes or
causes to be disposed sound, heat, radioactive rays and wastes from any mechanical
devices, industrial enterprises, or other places contrary to the prescribed standards. The
Act made provision for appointing Environment Inspector in order to effectively carry out
or cause to be carried out the acts of mitigation, avoidance or control of pollution or
activities required to be carried out in accordance with the IEE or EIA.
5.5.4 Local Self Governance Act 2055 BS (1998 AD) and related Regulations
The Local Self Governance Act has made ward committees responsible for managing the
waste within their respective areas. The functions, duties and powers of each Ward
Committee under the Village Development Committee include cleaning the roads, ways,
bridges, drainage, ponds, lakes, wells, deep water, taps, etc. within the Ward. The Ward
Committees have to arrange for disposal of wastes, dirt and rotten materials and to make
arrangements to encourage the inhabitants of the Ward for maintaining sanitation.
5.5.5 Environment Policy and Strategy on Periodic Plans of the Government
There is no specific provision in the Environment Policy and Strategy regarding solid waste
management. The Present periodic Plan "Three Years Plan 2010‐11, 2011‐12, 2010‐2013
AD” emphasized promoting and extending sanitation facilities through public awareness
at the rural and urban areas with the participation and contribution of the local
government and users’ communities. It has further emphasized IEE and Environment
Impact Assessment for implementing any infrastructure development project. The plan
has, under infrastructure development, targeted to construct 10 landfill sites and conduct
feasibility study for another 10 sites. The plan has associated solid waste management
with sanitation and infrastructure development activities.
5.5.6 Solid Waste Management Act 2068 BS (2011 AD)
Finally with an objective to amend and consolidate the laws relating to solid waste
management and to arrange for the systematic and effective management of solid waste
by minimizing solid waste generation at source, re‐using & processing the waste and
providing for proper disposal of the solid waste. The Govt. of Nepal enacted Municipal
solid Waste management Act 2068 BS (2011 AD) effective from 15th June 2011 AD. The
objectives of the Act also include maintaining clean and healthy environment by
minimizing the adverse effects of solid waste on public health and the environment.

29
The Local Bodies have been made responsible for construction, operation and
management of infrastructures for collection, treatment and final disposal of solid waste,
including construction of transfer stations, treatment plants, etc. However, healthcare
institutions and industries are made responsible to manage their biomedical and
hazardous wastes. A Local Body is authorized to specify the time, place and method for
disposal of solid waste and prescribe collection centre for each settlement at such places
which is convenient to all. The Local Body is required to manage transportation of waste
& provide means of transport of solid waste. The Local Body is expected to encourage
reduction, reuse and recycling of solid waste and coordinate with industries for reuse of
packing materials for reducing the waste. The Local Body is allowed to construct transfer
stations for managing the initially collected solid waste in such a way that it would not
cause adverse effect to public health.
The Act makes the Local Body responsible for constructing sanitary landfill sites subject to
Environment Protection Laws for management and final disposal of the waste. The Act
prohibits management of waste without license and provides for issuance of license and
prescribes the procedure for issuance of license to manage the waste. It provides for the
involvement of the private sector firms, CBOs and NGOs in solid waste management
through competitive bidding. It also provides procedures for bidding, selection of
successful bidder, authority of the bidder for collecting tipping fees against solid waste
management services. Section 16 authorizes the Local Body to give permission for
construction and operation of sanitary landfill site, treatment plant or any other
infrastructure subject to Environment Protection and other related laws. A Local Body is
authorized to monitor the compliance of the specified standards and cancel any permit if
needed.
The Act authorizes for imposition and collection of service fees against solid waste
management services and prescribes the basis for fixing such fees (tariff) and procedures
for collection of such fees and the usage of the fees. It authorizes the Local Bodies or
authorized private operator to suspend or stop the services if any user fails to pay the fee.
The Act allows for pecuniary punishment and/or imprisonment for violating the laws. The
Act mandates the Local Body to carry out environment protection activities by preparing
master plans for the affected area surrounding a landfill site. It authorizes the local bodies
for formulation of rules, bye‐laws and guidelines, and issue directives. As new SWM Act,
2011 AD authorizes the local bodies for formulation of rules, bye‐laws and guidelines, and
issue directives; it will be useful for every municipality to have waste management by‐
laws or guidelines that are approved by the Municipal Board.
The survey findings showed that only 46 municipalities were aware with SWM policy,
1996 while 49 municipalities were known about SWM Act, 2011. Moreover, there are also
other laws, standards or guidelines to govern municipal waste management which
provides some provisions on the related aspects. According to the Local Self‐Governance

30
Act and its regulations, municipalities can however develop by‐laws to suit their needs. Of
58 municipalities, 23 municipalities informed they have some by‐laws/issue directives etc.,
related to SWM within the municipality but were not effectively implemented to carry
out management of wastes. For example, Ilam issued the directive to ban polythene bag
in the municipality and surrounding VDCs. To implement this directive successfully,
municipality charges Rs. 500 if shops are found to selling polythene bags and Rs. 200 is
charged for people if they are found carrying polythene bags. Similarly, other few
municipalities have also initiated to enforce punishments/penalties to the violators of
SWM. Moreover, 9 municipalities have operational guidelines for landfill site or controlled
dumping site operation.

31
CHAPTER VI
6 Possibilities and Challenges
6.1 Challenges in management and implementation level
As discussed in previous chapters, the municipalities of Nepal are facing many
complications and difficulties to achieve their goal of solid waste management. In the
recent years, the management problems are becoming complicated and their magnitudes
have been increased by many folds. The haphazard disposal of solid waste in densely
populated areas, environmentally sensitive areas, riverbanks and heritage sites has made
the adverse impacts on the public health and the environment of surroundings which
puts a negative externality in anticipated improvement on the quality of life of people.
The problems are existed at both management and implementation levels. Most common
and frequently cited problems of the solid waste management in the municipalities are
listed below:
No separate section to look after Solid Waste Management;
Lack of equipment and technical manpower, capacity building of manpower;
Lack of data, statistical records, research, awareness and information, proper
planning;
Insufficient budget;
No public private participation; and
Political issues.
Analysis of present solid waste management practices by Nepalese municipalities shows
that there are many problems that need to be addressed.
Littering by residents after collection‐ user’s mind‐set of ‘use and throw’ of wastes
have intensified environmental pressures including unorganized waste disposal in
many municipalities of Nepal;
Poor conditions of containers and areas around them – in many municipalities,
primary collection and storage of waste is done using open storage enclosures,
and these result in unhygienic conditions, foul smell and odor, and proliferation of
flies and other vectors.
No practice of source separation;
Collection and transportation cost‐ Of the total SWM budget, the municipalities
spend nearly 60‐70% towards collection and street sweeping, 20‐30% on
transportation;

32
Poor working condition – Manual collection and transfer without safety measures
is unhygienic to the collectors;
Collection and transfer systems – current collection and transfer of solid waste in
the municipalities is conducted in an ad hoc manner, without any systematic
approach. Multiple handling of organic waste without identifying proper transfer
systems also created problems. GIS‐based route analysis and optimization
techniques can be used to determine optimal ways of utilizing scarce manpower
and resources for waste collection and transfer;
Treatment strategy and unscientific disposal techniques ‐ solid waste is not being
treated and all waste is openly dumped in more than 50 municipalities of Nepal.
Moreover, compostable household and market wastes can be composted
efficiently and economically, recyclable fraction can be recycled and reused and
the quantity of waste going to the landfill can be reduced by 70–80% in all the
municipalities.
6.2 Possibilities of sustainable SWM
Resource recovery is fundamental to sustainable SWM to all the municipalities. A
recovery‐centric approach to municipal solid waste management is not functional though
many municipalities and households from those municipalities claim to have become
aware of that need. This cannot be fully functional, however, without active citizen
participation, willingness of the municipality and proper implementation of regulations.
Since more than 65% of the solid waste generated in Nepal is of organic origin,
composting is one of the best ways to manage solid waste. Moreover, paper and paper
products, textiles, plastics and rubber etc., can be used as Refused Derived Fuels (RDFs),
which comprised about 23% in Nepalese municipalities. Resource recovery methods like,
composting, recycling and RDFs help reduce the waste transported to and disposed of in
landfills in one hand and generate resources in other hand.
In addition to the resource recovery approach, introducing a cost recovery approach
could be benefited in many municipalities of Nepal for the sustainable SWM. As many
people are willingness to pay for SWM, cost recovery from beneficiaries could be a
sustainable option for SWM. Under the same concept, few municipalities including
Tansen and Dhankuta have been selected for a proposed solid waste Output‐Based Aid
(OBA) pilot project. The World Bank has initiated this project with the main government
counterparts; the Solid Waste Management Technical Support Centre (SWMTSC), Town
Development Fund (TDF) and the two participating municipalities (Tansen and Dhankuta)
which were selected based on essential eligibility criteria which included: (i) expressing
willingness to participate in the project; (ii) committing to improving levels of cost
recovery for SWM services; (iii) having existing sanitary landfill sites etc. If this cost

33
recovery approach implemented successfully in the candidate municipalities, it would be
replicated to other many possible municipalities for sustainable SWM.
6.3 Possibilities of private sector participation
In many countries, private companies are interested in providing solid waste
management services and such partnerships are successively implemented by the
responsible authorities (Zerbock, 2003). This is generally done to improve efficiency in
waste management, reduce municipal investment, and share risks associated with
introduction of a new technology or process. Based on the past experiences, private
sector has already successfully played a major role in waste management in many
developed countries and even in different cities of developing countries. In Chennai, a
major port city in Southern India, the French multinational Onyx won a contract with the
municipal corporation to collect the waste and sweep streets in one area of the city
(Jayaraman, 2002). Remuneration per ton of waste collected is significantly lower than
the previous expenses of the municipality and Onyx has won many praises from many
residents for good service.
In Nepal, however, private sector participation in waste management is a relatively new
phenomenon and very few municipalities have tried this approach. Even when
municipalities have tried to involve the private sector, they have faced several difficulties.
These include:
Opposition from their own staff, who fear that they will loose their jobs;
Lack of understanding of PSP process and no clear road‐map for working with the
private sector;
Lack of capable private parties;
Unclear policies;
Poor coordination between private parties and municipalities;
Insufficient monitoring and evaluation by municipalities.
As a result, in general municipalities have not been able to take advantage of PSP in waste
management. Although many municipalities claim to be working with private sector in
waste management, most of these are NGOs or community based organizations, which
occasionally do solid waste management. Public Private Partnerships in collection and
transportation of waste is being attempted on a small scale which needs to be expanded
substantially to improve the primary collection service and making the cities clean and
livable.
In fact, private sector participation is especially important when waste management
becomes more complex and specialized. However, it should be critically reviewed to
decide if private sector involvement in solid waste management is a sustainable and

34
preferable alternative to the conventional dependence on local government. For the
Nepalese municipalities, where private sector participation is not common and relatively
new phenomenon, the contractual document therefore must be well clear to describe in
quantitative terms what services are required and what facilities and privileges are
provided to private sectors. The ability and willingness of the government/local
authorities to monitor the performance of the private partner and enforce sanctions if
necessary are crucial for an effective partnership and for the long‐term improvement of
the cities situation.
6.4 Expectation of support
The municipalities have been made responsible for construction, operation and
management of infrastructures for collection, treatment and final disposal of solid waste,
including construction of transfer stations, treatment plants, etc in their territory.
However, Nepalese municipalities, till date, do not have sufficient technical capacities,
financial resources and willingness to handle the SWM properly. Hence, municipalities
need technical support from SWMTSC as well as some assistance from donor agencies.
These helps include both in the forms of hardware and software. Hardware supports
include technical supports, physical equipment, financial support etc. Similarly, software
which includes capacity building and empowerment of human resources, creating
awareness and institutional assistance are also expected to achieve the objective of solid
waste management. This survey also identified that almost all the municipalities are
seeking support from SWMTSC and other external agencies in the various aspects of SWM.

35
CHAPTER VII
7 Conclusions and Recommendations
7.1 Conclusions
The goal of the SWM baseline study was to conduct the systematic and comprehensive
study of quantification of municipal waste and its composition and to compile factual
information on the state of solid waste management in the 58 municipalities of Nepal.
The SWM baseline study team conducted the survey in 58 municipalities of Nepal in April
to May 2012 during the dry season. The total sample size of 3233 households from 58
municipalities, varying from the minimum 50 households to 220 households gave an
average per‐capita household waste generation figure of 170 gram/capita/day. The
household waste generation rates varied depending upon the economic status and
climatic condition. Moreover, the average daily waste generation was 1.4 kg per school
and 2.5 kg per office. Similarly, the average daily waste generation was found to be 1.4 kg
per shop and 5.7 kg per hotel/restaurant respectively. Considering the household waste
in general contributes to about 50 to 75% of the total municipal waste generation
depending upon the municipality, the per‐capita municipal waste generation was
estimated to 318 gram/capita/day. Based on these per‐capita waste generation figures
and population for the year 2011, the total municipal waste generation of 58
municipalities was found to be more than 525, 000 tons/year.
The analysis of waste composition showed that the highest fraction was organic matter;
65% and 40% in household and commercial waste respectively, whereas, dominant
fraction was paper and paper products (45%) in institutional waste. The findings of this
study showed that the municipal waste of all municipalities, in general is good viable for
producing compost. The households mainly in rural area of municipalities are doing
household composting in traditional way, but urban households, where less land is
available, are not generally doing household composting. Community or municipal level
composting plant could be observed to some extent in some municipalities. It was also
found that only 6 municipalities use sanitary landfill site for final disposal till date but
dumping in riverbanks, depressed land/dumps, open pit or temporary open piles are the
way of final disposal in the other municipalities.
Municipalities are unable to achieve its goal of solid waste management because of lack
of technical and human resources, data, statistical records, proper planning, insufficient
budget, less private participation and unnecessary political issues. Moreover, most of the
municipalities have been facing the SWM problems due to mismanagement of available
resources. Of total 58 municipalities, 17 municipalities do not have designated section to
look after SWM. In these municipalities, either the municipality is not providing any waste
management services at all or the municipality has a few sweepers who work under the
ward offices or one of the other units. Of the total budget, the municipalities spend an

36
average of 10% for SWM, in which nearly 60‐70% towards street sweeping and collection,
20‐30% on transportation.
At present, SWMTSC is supporting to municipalities technically and financially as well. In
addition to SWMTSC, various programs in SWM sector are being supported by many
donor agencies. However, these are not sufficient and municipalities are seeking some
external supports for the cost effective and sustainable waste management.
The outputs of this study can be used for implementing proper waste disposal and
management plans and practices for recovery of resources before deciding on the
appropriate method of its disposal.
7.2 Recommendations
Following are the recommendations to achieve the good waste management practices in
the Nepalese municipalities:
Based on the output of this SWM baseline study, establish data and information
management systems for municipal waste management at the national/local level
with consideration to a bottom‐up approach in reporting e.g. information and
data from LGs like municipalities to SWMTSC;
Develop SWM strategy, management plans, treatment strategies, guidelines
and/or policies at the national/local level addressing municipal waste
management through 3R principles than landfilling approach, therefore looking
into the effects on public health and impacts on the environment.
Promotion of waste segregation at sources; separation of waste at the source in at
least two fractions, i.e. compostable and reusable/recyclables, deserves due
consideration for over minimization of waste problem in all the municipalities;
Awareness campaigns in mass scale to separate waste at source and to change
users’ mindset of use and throw should be effectively enforced;
GIS‐based route analysis and optimization techniques can be used to determine
optimal ways of utilizing scarce manpower and resources for waste collection and
transfer;
Initiative should be taken for resource recovery and cost recovery approach in the
municipalities for sustainable SWM. For e.g. composting could be the best way of
managing solid wastes in many Nepalese municipalities because of the higher
value of organic materials that is about 65%. Paper and paper products, textiles,
plastics, rubber etc., could be used as Refused Derived Fuels (RDFs), which
comprised about 23% in Nepalese municipalities. Resource recovery methods like,
composting, recycling and RDFs help reduce the waste transported to and
disposed of in landfills in hand and generate resources in other hand;

37
Strengthen capacity building and technical support activities to municipalities to
enhance the technical and human capacity of municipality for SWM; allocation
financial and human resources for SWM in municipalities should be increased and
managed properly;
SWMTSC should provide technical assistance to municipalities to develop an
efficient and sustainable waste management system. It should be ensured that the
assistance provided is based on local needs and suitable for local condition.
Besides this, it should be effective and sustainable in the long run.
Partnerships and cooperation of various stakeholders in SWM should be enhanced
in the provision of resources for the effective implementation of the 3Rs and of
waste management in the municipalities;
Promote regular dialogue, consultation and consensus building among solid waste
management stakeholders.
Document and disseminate information on the importance of and good practices
in SWM, which can be replicated to other municipalities.

38
References
Alamgir, M., McDonald, C., Roehi, K.E., Ahsan, A. (2005). Integrated management and safe
disposal of MSW in least developed Asian countries—a feasibility study, Waste Safe.
Khulna University of Engineering and Technology, Asia Pro Eco Programme of the
European Commission; 2005.
Dangi, M.B., Pretz, C. R., Urynowicz, M.A., Gerow K.G., Reddy, J.M. (2011). Municipal solid
waste generation in Kathmandu, Nepal. Journal of Environmental Management, 92, 240‐
249.
Dangi, M.B., Cohen, R.R.H., Urynowicz, M.A., Poudyal, K.N. (2009). Searching for a way to
sustainability: technical and policy analyses of solid waste issues in Kathmandu. Waste
Management and Research 27, 295‐301.
Dangi, M.B., Urynowicz, M.A., Gerow, K.G., Thapa, R.B. (2008). Use of stratified cluster
sampling for efficient estimation of solid waste generation at household level. Waste
Management and Research. 26, 493‐499.
Central Bureau of Statistics (CBS) (2011). Preliminary population of urban areas of Nepal.
Government of Nepal, Kathmandu, Nepal.
Cointreau, S. (2006). Occupational and Environmental Health Issues of Solid Waste
Management: Special Emphasis on Middle‐ and Lower‐Income Countries. World Bank,
Washington, DC. Retrieved 26.06.09. from.
http://siteresources.worldbank.org/INTUSWM/Resources/up‐2.pdf.
Environment Protection Act 2053 BS (1997 AD) and the related Regulations. Ministry of
Environment, Kathmandu, Nepal.
Jayaraman, N. (2002).Trashing water is good business for water companies, CorpWatch
India, http://www.corpwatchindia.org/issues/PID.jsp?articleid=823.
Local Self‐Governance Act 2055 BS (1998 AD) and Regulations (1999 AD), Ministry of Local
Development, Kathmandu, Nepal.
Manandhar, D.R. (2009). Situation Assessment of SWM at Municipalities in Eastern
Regions. Project Report, SEAM‐N, Nepal.
Manandhar, R. (2005). Basic Fact Sheet of Solid Waste Management of Kathmandu
Municipal Corporation Unpublished record received from KMC.
Manandhar, R. 2006. Solid waste management of KMC. In: 3R South Asia Expert
Workshop. Institute for Global Environmental Strategies, August 30 ‐September 1, 2006,
Kanagawa, Japan.
National Policy on Solid Waste Management 2053 BS (1996 AD), Ministry of Local
Development, Kathmandu, Nepal.

39
Nippon Koei Co. Ltd., Yachiyo Engineering Co. Ltd. (2005). The Study on the Solid Waste
Management for the Kathmandu Valley, Final Report: Main Report (1). JICA, Kathmandu,
Nepal.
Solid Waste Management and Resource Mobilization Center (SWMRMC) (2004). A
diagnostic report on state of solid waste management in municipalities of Nepal,
SWMRMC, Pulcowk, Nepal.
SWMRMC (2008). Baseline study on solid waste management in the municipalities of
Nepal. Final Report, Unpublished, Solid Waste Management & Resource Mobilization
Center, Pulchowk, Nepal.
Solid Waste Management Act 2068 BS (2011 AD), Ministry of Local Development,
Kathmandu, Nepal.
Solid Waste Management and Resource Mobilization Act, 2044 BS (1987 AD),
Government of Nepal, Kathmandu, Nepal.
Tchobanoglous, G., Theisen, H., Vigil, S. (1993). Integrated Solid Waste Management.
McGraw‐Hill, New York, USA.
Vesilind, P.A., Worrell, W., Reinhart, D. (2002). Solid Waste Engineering. Books/Cole
Thomson Learning, Pacific Grove, CA, USA.
Zerbock, O. (2003). Urban Solid Waste Management: Waste Reduction in Developing
Countries. Michigan Technological University, USA, pp 23.

i
Annexes
Annex A: Details of collected data from municipalities
Annex B: Proceedings of 2‐day SWM baseline training
The proceedings of 2‐day SWM baseline survey training is published in separate volume.
Annex C: Field report of 58 municipalities
The individual reports of all 58 municipalities are published in separate volume.

ii
Annex A/Table 1: Area and population in 58 municipalities of Nepal
S.N. Name of district Name of municipality Total area (sq. km.)4
Total length of municipal boundary (km)5
Built up area (sq. km)6
Total population (CBS, 2011)
1 Dadeldhura Amargadhi 138.96 81.26 0.358 21633
2 Baglung Baglung 8.61 12.39 2.33 31046
3 Kavrepalanchok Banepa 6.07 12.16 0.697 28237
4 Jhapa Bhadrapur 10.69 20.78 5 18608
5 Bhaktapur Bhaktapur 6.58 14.45 1.23 83893
6 Chitawan Bharatpur 162.61 81.81 3.9 139790
7 Kanchanpur Bhimdatta 171.24 93.30 4.28 102762
8 Dolakha Bhimeswor 65.43 50.84 NA 24217
9 Nuwakot Bidur 33.61 39.86 2.1 25934
10 Morang Biratnagar SMPC 59.04 43.69 10.84 202061
11 Surkhet Birendranagar 34.95 26.24 13 59273
12 Parsa Birgunj SMPC 21.24 29.78 9.02 137976
13 Rupandehi Butwal 69.37 47.69 2.76 119710
14 Tanahu Byas 60.17 52.41 3.53 45122
15 Jhapa Damak 71.40 45.33 26.9 74843
16 Baitadi Dasharathchanda 55.00 43.16 1.6 17363
17 Kailali Dhangadhi 103.75 62.44 13.44 104801
18 Dhankuta Dhankuta 48.68 38.06 4.83 28916
19 Sunsari Dharan 104.38 58.74 NA 118755
20 Kavrepalanchok Dhulikhel 12.14 15.98 0.62 16406
21 Doti Dipayal‐Silgadhi 74.74 56.81 NA 25887
22 Rautahat Gaur 21.74 20.53 3 35349
23 Dang Ghorai 74.46 45.70 NA 65713
24 Gorkha Gorkha 61.92 42.71 NA 33890
25 Bardiya Gulariya 95.14 59.98 5.47 57326
26 Makwanpur Hetauda 47.95 38.68 12.46 90593
27 Ilam Ilam 26.93 33.33 2.71 19054
28 Sunsari Inaruwa 22.57 24.67 4.25 29999
29 Sunsari Itahari 42.78 42.10 25.18 74360
30 Mahottari Jaleshwor 15.57 19.79 NA 23231
31 Dhanusa Janakpur 24.75 27.75 NA 99560
32 Bara Kalaiya 19.05 26.41 11.7 43888
33 Sindhuli Kamalamai 209.11 112.13 13.23 41054
34 Kapilbastu Kapilbastu 37.24 31.39 0.16 30887
35 Kathmandu Kathmandu MPC 49.66 43.86 36.52 1006656
36 Sankhuwasabha Khandbari 91.89 61.23 NA 27103
37 Kathmandu Kirtipur 14.82 23.18 3.238 66070
38 Siraha Lahan 20.37 20.45 0.67 34350
39 Lalitpur Lalitpur SMPC 15.21 21.44 14 223285
40 Kaski Lekhnath 77.64 56.17 5.46 59244
4Area of each municipality was calculated from VDC boundary map obtained from Department of Survey, Government of Nepal using GIS analysis 5Ibid 6Built up area of each municipality was obtained from respective municipality, except Pokhara SMPC. Built up area of Pokhara SMPC has been obtained from Rimal (2011) Urban growth and land use/land cover change of Pokhara SMPC, Nepal, Journal of Theoretical and Applied Information Technology, 26 (2), 118‐129.

iii
41 Sarlahi Malangawa 9.44 16.00 1.74 25199
42 Jhapa Mechinagar 56.41 47.75 3 57622
43 Dailekh Narayan 67.01 43.30 0.44 22142
44 Banke Nepalgunj 12.51 19.46 4.81 76053
45 Kavrepalanchok Panauti 31.70 35.44 2.88 28570
46 Kaski Pokhara SMPC 55.27 63.15 28.44 263477
47 Syangja Putalibazar 70.51 44.13 NA 31280
48 Saptari Rajbiraj 12.06 20.89 2.176 39181
49 Nawalparasi Ramgram 34.76 37.50 4.12 27988
50 Chitawan Ratnanagar 35.56 35.11 0.9 45698
51 Rupandehi Siddharthnagar 36.08 40.69 3.6 64579
52 Siraha Siraha 23.93 29.33 1.284 29785
53 Palpa Tansen 21.75 24.80 NA 32037
54 Bhaktapur Thimi 11.15 18.40 1.38 84259
55 Kailali Tikapur 67.12 49.45 7.06 50782
56 Udayapur Triyuga 322.24 96.60 1 70435
57 Dang Tulsipur 92.18 51.62 1.5 59330
58 Syangja Waling 35.12 41.63 4.49 24188
Total 3282.23 2393.94 313.30 4521450

i
Annex A/Table 2: The per‐capita household waste, per‐capita MSW, total generated MSW, estimated collected MSW and collection efficiency in 58 municipalities
S.N. Name of Municipality
Average waste per HH per day in kg
Average HH size
Average per capita HH waste (gm/capita/day)
Total population (CBS, 2011)
Total HH waste (ton/day)
Total commercial waste (ton/day)
Total institutional waste (ton/day)
Average per capita MSW (gm/capita/day)
Total MSW generation (ton/day)
Estimated collected waste (ton/day)
Collection efficiency (%)
1 Amargadhi 0.50 5.92 84.43 21633 1.83 NA NA 112.57 2.4 1.00 41
2 Baglung 0.66 4.66 142.49 31046 4.42 4.10 0.37 284.98 8.8 4.00 45
3 Banepa 1.36 5.64 240.80 28237 6.80 1.05 0.54 344.00 9.7 4.50 46
4 Bhadrapur 0.39 4.81 80.20 18608 1.49 0.13 0.06 106.93 2.0 1.00 50
5 Bhaktapur 0.85 5.47 155.43 83893 13.04 7.20 0.62 345.40 29.0 25.00 86
6 Bharatpur 1.25 5.66 220.04 139790 30.76 6.82 0.80 440.07 61.5 15.00 24
7 Bhimdatta 0.60 5.58 107.53 102762 11.05 1.30 1.14 215.05 22.1 NA ‐
8 Bhimeswor 0.41 4.52 91.24 24217 2.21 0.22 0.12 121.66 2.9 NA ‐
9 Bidur 0.47 4.81 97.21 25934 2.52 2.87 0.17 194.42 5.0 NA ‐
10 Biratnagar SMPC 0.68 4.80 142.39 202061 28.77 NA NA 284.78 57.5 50.00 87
11 Birendranagar 0.62 5.88 104.90 59273 6.22 3.18 0.46 174.83 10.4 1.00 10
12 Birgunj SMPC 0.84 6.14 137.23 137976 18.93 2.67 0.27 274.46 37.9 15.00 40
13 Butwal 0.56 5.00 112.10 119710 13.42 8.40 0.39 224.21 26.8 17.00 63
14 Byas 0.41 4.23 97.50 45122 4.40 2.46 0.64 162.50 7.3 NA ‐
15 Damak 0.62 5.34 115.84 74843 8.67 1.85 0.32 231.69 17.3 7.00 40
16 Dasarath Chand 0.85 5.96 142.28 17363 2.47 0.25 0.31 189.71 3.3 0.50 15
17 Dhangadi 0.71 5.16 138.45 104801 14.51 11.00 0.40 276.90 29.0 12.00 41
18 Dhankuta 0.69 4.78 143.40 28916 4.15 NA NA 260.73 7.5 6.00 80
19 Dharan 1.17 5.53 212.31 118755 25.21 7.53 0.44 424.62 50.4 35.00 69
20 Dhulikhel 0.64 5.59 115.16 16406 1.89 NA NA 153.54 2.5 NA ‐
21 Dipayal‐Silgadhi 0.56 6.42 86.92 25887 2.25 0.72 0.11 124.17 3.2 NA ‐
22 Gaur 0.73 7.38 99.02 35349 3.50 NA 0.59 141.46 5.0 NA ‐
23 Ghorai 0.46 3.92 117.91 65713 7.75 1.52 0.15 196.51 12.9 10.00 77
24 Gorkha 0.56 4.12 136.46 33890 4.62 0.22 0.06 194.94 6.6 2.00 30
25 Gularia 0.76 6.46 116.97 57326 6.71 NA NA 194.94 11.2 1.00 9
26 Hetauda 0.81 5.29 153.98 90593 13.95 NA 0.88 256.63 23.2 9.00 39
27 Ilam 1.14 5.66 201.34 19054 3.84 1.63 1.26 366.08 7.0 3.90 56
28 Inaruwa 1.36 4.88 277.89 29999 8.34 1.16 0.27 396.98 11.9 3.00 25
29 Itahari 1.00 5.12 196.10 74360 14.58 2.86 NA 326.83 24.3 6.00 25

ii
30 Jaleswor 0.52 6.10 85.70 23231 1.99 0.43 NA 114.27 2.7 NA ‐
31 Janakpur 0.61 6.08 101.00 99560 10.06 1.23 0.77 168.33 16.8 4.00 24
32 Kalaiya 1.43 6.28 227.10 43888 9.97 0.86 NA 324.43 14.2 1.50 11
33 Kamalamai 1.00 5.74 174.41 41054 7.16 1.37 2.65 249.15 10.2 4.00 39
34 Kapilbastu 0.71 6.16 114.97 30887 3.55 2.27 0.05 164.24 5.1 1.50 30
35 Kathmandu MPC 1.10 4.74 232.31 1006656 233.85 NA NA 464.61 467.7 405.00 87
36 Khadbari 0.56 5.04 111.36 27103 3.02 0.53 0.17 159.09 4.3 NA ‐
37 Kritipur 0.89 5.84 151.75 66070 10.03 NA 0.25 252.91 16.7 6.00 36
38 Lahan 1.42 6.06 235.08 34350 8.08 1.02 0.68 335.83 11.5 NA ‐
39 Lalitpur SMPC 0.90 4.84 185.91 223285 41.51 NA NA 371.82 83.0 60.00 72
40 Lekhanath 0.50 4.47 112.52 59244 6.67 0.77 0.28 187.54 11.1 NA ‐
41 Malangawa 1.90 7.18 264.20 25199 6.66 0.66 0.12 377.43 9.5 1.50 16
42 Mechinagar 0.33 4.38 76.44 57622 4.40 0.73 0.45 127.40 7.3 7.00 95
43 Narayan 0.48 5.40 89.37 22142 1.98 NA NA 119.16 2.6 0.50 19
44 Nepalgung 1.13 6.06 186.34 76053 14.17 22.38 0.48 372.67 28.3 NA ‐
45 Panauti 0.60 4.94 121.86 28570 3.48 0.90 0.11 174.09 5.0 2.00 40
46 Pokhara 0.97 4.40 220.97 263477 58.22 27.29 4.00 441.94 116.4 50.00 43
47 Putalibazar 0.55 4.55 121.81 31280 3.81 0.18 0.13 174.01 5.4 4.50 83
48 Rajbiraj 1.39 5.24 265.59 39181 10.41 1.68 0.38 379.41 14.9 6.00 40
49 Ramgram 0.70 5.64 123.62 27988 3.46 0.07 0.28 176.60 4.9 1.50 30
50 Ratnagar 0.74 4.74 155.83 45698 7.12 7.64 0.38 311.65 14.2 11.00 77
51 Sidharthanagar 0.78 5.52 141.38 64579 9.13 0.77 0.29 235.63 15.2 4.00 26
52 Siraha 0.57 6.12 93.63 29785 2.79 0.59 0.05 133.75 4.0 1.00 25
53 Tansen 1.19 5.22 228.12 32037 7.31 2.86 0.32 304.15 9.7 2.50 26
54 Thimi 0.70 5.12 136.72 84259 11.52 NA NA 273.44 23.0 12.00 52
55 Tikapur 0.58 5.76 100.90 50782 5.12 NA NA 168.17 8.5 0.60 7
56 Triyuga 0.45 6.08 74.60 70435 5.25 2.60 0.36 124.33 8.8 NA ‐
57 Tulsipur 0.54 4.64 115.91 59330 6.88 1.46 0.20 193.18 11.5 6.00 52
58 Waling 0.68 4.62 147.92 24188 3.58 3.07 0.15 295.84 7.2 1.00 14
Total/average value 0.8 5.4 170 4521450 769 150 23 318.26 1439 822 57
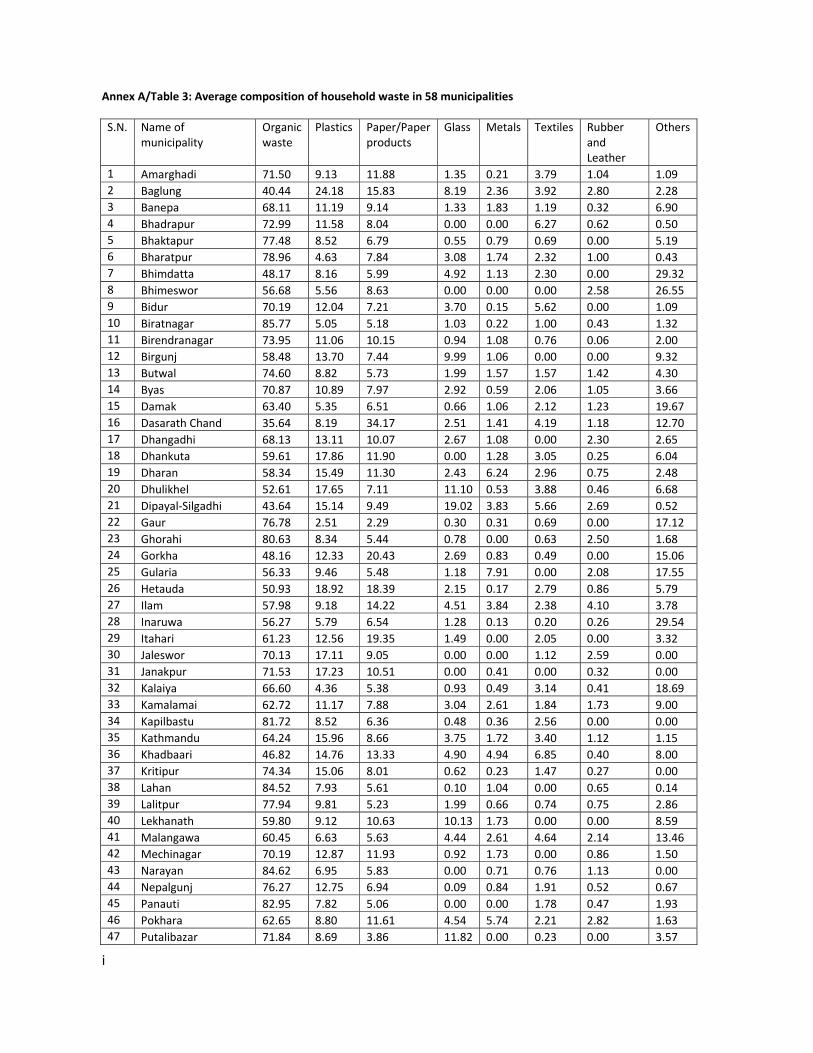
i
Annex A/Table 3: Average composition of household waste in 58 municipalities
S.N. Name of municipality
Organic waste
Plastics Paper/Paper products
Glass Metals Textiles Rubber and Leather
Others
1 Amarghadi 71.50 9.13 11.88 1.35 0.21 3.79 1.04 1.09
2 Baglung 40.44 24.18 15.83 8.19 2.36 3.92 2.80 2.28
3 Banepa 68.11 11.19 9.14 1.33 1.83 1.19 0.32 6.90
4 Bhadrapur 72.99 11.58 8.04 0.00 0.00 6.27 0.62 0.50
5 Bhaktapur 77.48 8.52 6.79 0.55 0.79 0.69 0.00 5.19
6 Bharatpur 78.96 4.63 7.84 3.08 1.74 2.32 1.00 0.43
7 Bhimdatta 48.17 8.16 5.99 4.92 1.13 2.30 0.00 29.32
8 Bhimeswor 56.68 5.56 8.63 0.00 0.00 0.00 2.58 26.55
9 Bidur 70.19 12.04 7.21 3.70 0.15 5.62 0.00 1.09
10 Biratnagar 85.77 5.05 5.18 1.03 0.22 1.00 0.43 1.32
11 Birendranagar 73.95 11.06 10.15 0.94 1.08 0.76 0.06 2.00
12 Birgunj 58.48 13.70 7.44 9.99 1.06 0.00 0.00 9.32
13 Butwal 74.60 8.82 5.73 1.99 1.57 1.57 1.42 4.30
14 Byas 70.87 10.89 7.97 2.92 0.59 2.06 1.05 3.66
15 Damak 63.40 5.35 6.51 0.66 1.06 2.12 1.23 19.67
16 Dasarath Chand 35.64 8.19 34.17 2.51 1.41 4.19 1.18 12.70
17 Dhangadhi 68.13 13.11 10.07 2.67 1.08 0.00 2.30 2.65
18 Dhankuta 59.61 17.86 11.90 0.00 1.28 3.05 0.25 6.04
19 Dharan 58.34 15.49 11.30 2.43 6.24 2.96 0.75 2.48
20 Dhulikhel 52.61 17.65 7.11 11.10 0.53 3.88 0.46 6.68
21 Dipayal‐Silgadhi 43.64 15.14 9.49 19.02 3.83 5.66 2.69 0.52
22 Gaur 76.78 2.51 2.29 0.30 0.31 0.69 0.00 17.12
23 Ghorahi 80.63 8.34 5.44 0.78 0.00 0.63 2.50 1.68
24 Gorkha 48.16 12.33 20.43 2.69 0.83 0.49 0.00 15.06
25 Gularia 56.33 9.46 5.48 1.18 7.91 0.00 2.08 17.55
26 Hetauda 50.93 18.92 18.39 2.15 0.17 2.79 0.86 5.79
27 Ilam 57.98 9.18 14.22 4.51 3.84 2.38 4.10 3.78
28 Inaruwa 56.27 5.79 6.54 1.28 0.13 0.20 0.26 29.54
29 Itahari 61.23 12.56 19.35 1.49 0.00 2.05 0.00 3.32
30 Jaleswor 70.13 17.11 9.05 0.00 0.00 1.12 2.59 0.00
31 Janakpur 71.53 17.23 10.51 0.00 0.41 0.00 0.32 0.00
32 Kalaiya 66.60 4.36 5.38 0.93 0.49 3.14 0.41 18.69
33 Kamalamai 62.72 11.17 7.88 3.04 2.61 1.84 1.73 9.00
34 Kapilbastu 81.72 8.52 6.36 0.48 0.36 2.56 0.00 0.00
35 Kathmandu 64.24 15.96 8.66 3.75 1.72 3.40 1.12 1.15
36 Khadbaari 46.82 14.76 13.33 4.90 4.94 6.85 0.40 8.00
37 Kritipur 74.34 15.06 8.01 0.62 0.23 1.47 0.27 0.00
38 Lahan 84.52 7.93 5.61 0.10 1.04 0.00 0.65 0.14
39 Lalitpur 77.94 9.81 5.23 1.99 0.66 0.74 0.75 2.86
40 Lekhanath 59.80 9.12 10.63 10.13 1.73 0.00 0.00 8.59
41 Malangawa 60.45 6.63 5.63 4.44 2.61 4.64 2.14 13.46
42 Mechinagar 70.19 12.87 11.93 0.92 1.73 0.00 0.86 1.50
43 Narayan 84.62 6.95 5.83 0.00 0.71 0.76 1.13 0.00
44 Nepalgunj 76.27 12.75 6.94 0.09 0.84 1.91 0.52 0.67
45 Panauti 82.95 7.82 5.06 0.00 0.00 1.78 0.47 1.93
46 Pokhara 62.65 8.80 11.61 4.54 5.74 2.21 2.82 1.63
47 Putalibazar 71.84 8.69 3.86 11.82 0.00 0.23 0.00 3.57
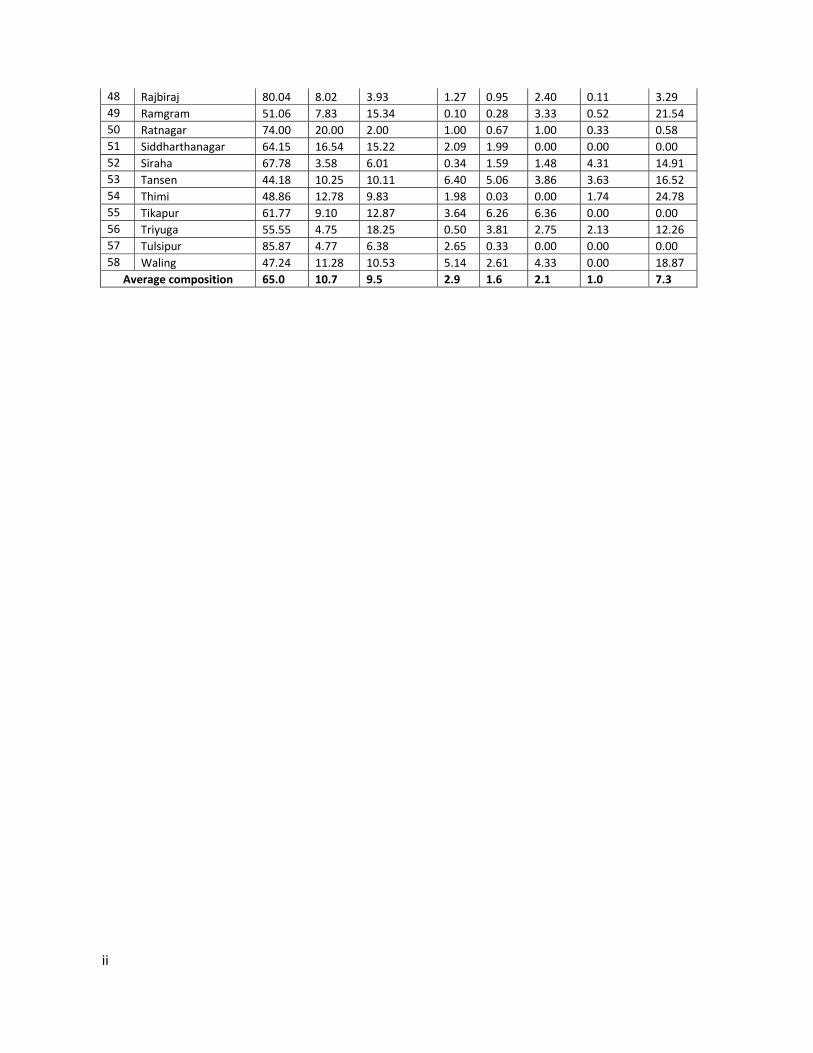
ii
48 Rajbiraj 80.04 8.02 3.93 1.27 0.95 2.40 0.11 3.29
49 Ramgram 51.06 7.83 15.34 0.10 0.28 3.33 0.52 21.54
50 Ratnagar 74.00 20.00 2.00 1.00 0.67 1.00 0.33 0.58
51 Siddharthanagar 64.15 16.54 15.22 2.09 1.99 0.00 0.00 0.00
52 Siraha 67.78 3.58 6.01 0.34 1.59 1.48 4.31 14.91
53 Tansen 44.18 10.25 10.11 6.40 5.06 3.86 3.63 16.52
54 Thimi 48.86 12.78 9.83 1.98 0.03 0.00 1.74 24.78
55 Tikapur 61.77 9.10 12.87 3.64 6.26 6.36 0.00 0.00
56 Triyuga 55.55 4.75 18.25 0.50 3.81 2.75 2.13 12.26
57 Tulsipur 85.87 4.77 6.38 2.65 0.33 0.00 0.00 0.00
58 Waling 47.24 11.28 10.53 5.14 2.61 4.33 0.00 18.87
Average composition 65.0 10.7 9.5 2.9 1.6 2.1 1.0 7.3

iii
Annex A/Table 4: Average composition of institutional waste in 58 municipalities
S.N. Name of municipality
Organic waste
Plastics Paper/Paper products
Glass Metals Textiles Rubber and Leather
Others
1 Amargadhi 13.36 13.14 63.74 1.12 5.68 0.98 1.06 0.92
2 Baglung 25.70 22.67 46.96 0.41 0.99 0.34 0.04 2.90
3 Banepa 15.13 31.17 42.75 2.47 3.90 0.24 4.33 0.00
4 Bhadrapur 16.52 5.72 77.76 0.00 0.00 0.00 0.00 0.00
5 Bhaktapur 30.35 18.77 29.35 2.95 3.15 3.46 1.68 10.29
6 Bharatpur 30.84 18.89 49.37 0.00 0.38 0.00 0.30 0.22
7 Bhimdatta 24.30 12.05 32.63 0.42 0.41 0.92 1.19 28.08
8 Bhimeswor 11.74 4.97 46.21 0.00 0.12 0.12 0.00 36.83
9 Bidur 15.17 24.54 55.53 0.00 1.49 1.49 1.79 0.00
10 Biratnagar 41.56 19.48 35.49 0.00 1.54 0.39 0.00 1.54
11 Birendranagar 24.62 21.84 51.41 1.78 0.03 0.20 0.00 0.12
12 Birgunj 16.99 21.54 50.18 0.00 0.00 0.00 0.00 11.29
13 Butwal 24.48 17.32 29.55 0.00 0.35 2.36 2.58 23.37
14 Byas 42.11 21.02 29.90 1.63 0.69 0.72 0.61 3.33
15 Damak 38.04 12.16 20.95 0.02 8.00 1.66 0.61 18.56
16 Dasarath Chand 10.20 11.16 36.31 7.97 12.71 5.44 5.01 11.21
17 Dhangadi 16.36 17.59 50.89 0.73 1.99 0.27 0.00 12.17
18 Dhankuta 16.90 20.80 40.25 0.00 0.46 0.00 0.46 21.12
19 Dharan 22.39 21.29 37.81 3.70 3.89 2.26 1.18 7.47
20 Dhulikhel 36.25 15.22 48.53 0.00 0.00 0.00 0.00 0.00
21 Dipayal‐Silgadhi 18.30 27.93 34.71 3.88 1.21 0.92 1.61 11.43
22 Gaur 22.42 6.59 21.87 4.44 0.00 0.00 0.00 44.68
23 Ghorai 21.38 17.32 39.33 2.50 0.43 3.67 0.39 14.98
24 Gorkha 18.03 26.47 45.55 1.82 2.50 0.00 0.00 5.64
25 Gularia 8.95 11.28 56.74 0.08 0.00 0.00 0.62 22.33
26 Hetuda 8.01 29.61 49.09 0.98 1.33 1.30 0.08 9.61
27 Ilam 60.10 6.83 16.34 1.96 0.97 0.88 0.82 12.10
28 Inaruwa 1.50 4.00 40.80 0.00 0.59 0.88 0.00 52.23
29 Itahari 25.64 24.90 40.13 2.95 0.00 0.00 0.00 6.38
30 Jaleswor 17.09 35.70 46.44 0.77 0.00 0.00 0.00 0.00
31 Janakpur 11.23 25.58 43.38 0.00 0.00 0.00 0.00 19.81
32 Kalaiya 9.98 11.24 36.08 0.00 7.51 1.39 0.47 33.33
33 Kamalamai 12.28 17.48 50.12 4.54 1.93 0.00 1.74 11.91
34 Kapilbastu 0.00 16.63 83.37 0.00 0.00 0.00 0.00 0.00
35 Kathmandu 20.29 24.55 44.28 1.37 1.13 3.89 1.14 3.35
36 Khadbaari 4.94 22.70 58.79 0.91 1.18 3.18 0.99 7.31
37 Kritipur 22.13 14.31 59.55 3.25 0.00 0.77 0.00 0.00
38 Lahan 27.95 14.30 50.87 0.01 1.17 0.00 0.52 5.19
39 Lalitpur 14.53 23.05 41.05 0.11 1.43 0.00 0.19 19.64
40 Lekhanath 11.19 11.51 48.58 6.17 1.92 0.00 2.39 18.24
41 Malangawa 5.85 21.57 28.23 5.70 0.73 4.78 0.00 33.14
42 Mechinagar 24.74 15.32 44.62 5.65 0.00 0.00 3.89 5.78
43 Narayan 16.56 29.03 54.41 0.00 0.00 0.00 0.00 0.00
44 Nepalgung 39.30 13.02 44.24 0.00 1.92 0.00 0.00 1.53
45 Panauti 33.67 16.54 44.43 0.07 0.00 3.01 0.65 1.63
46 Pokhara 26.19 8.14 65.35 0.00 0.00 0.00 0.00 0.32
47 Putalibazar 1.63 33.64 53.04 0.00 0.00 0.00 0.00 11.69

iv
48 Rajbiraj 12.32 10.51 40.09 1.13 0.51 1.03 0.12 34.30
49 Ramgram 19.84 7.28 31.47 10.62 1.44 0.06 0.38 28.92
50 Ratnagar 10.26 18.94 60.31 0.20 0.62 0.21 0.93 8.53
51 Sidharthanagar 1.08 23.21 75.71 0.00 0.00 0.00 0.00 0.00
52 Siraha 29.10 4.17 43.19 0.27 2.57 1.56 2.66 16.49
53 Tansen 22.92 11.25 24.05 5.16 1.91 4.02 3.75 26.94
54 Thimi 0.77 19.18 60.20 0.10 0.00 0.00 0.83 18.92
55 Tikapur 27.92 19.16 47.00 0.00 4.60 0.00 0.00 1.32
56 Triyuga 10.89 14.34 67.24 0.00 3.21 1.46 0.45 2.41
57 Tulsipur 2.94 20.53 56.97 0.00 2.31 0.00 0.00 17.26
58 Waling 41.57 10.99 17.08 2.12 1.91 0.92 0.36 25.06
Average composition 19.6 17.6 45.5 1.6 1.6 0.9 0.8 12.4

v
Annex A/Table 5: Average composition of commercial waste in 58 municipalities
S.N. Name of municipality Organic waste
Plastics Paper/Paper products
Glass Metals Textiles Rubber and Leather
Others
1 Amargadhi 35.13 19.28 27.43 15.11 2.92 0.03 0.12 0.00
2 Baglung 41.14 14.96 26.91 13.67 1.37 0.38 0.53 1.04
3 Banepa 41.28 17.47 23.89 8.08 2.62 0.00 0.81 5.86
4 Bhadrapur 24.35 61.71 11.99 0.00 0.00 0.00 0.00 1.95
5 Bhaktapur 38.73 21.29 18.03 2.14 6.20 0.73 0.37 12.51
6 Bharatpur 56.76 8.73 23.70 6.46 0.95 3.09 0.00 0.32
7 Bhimdatta 34.41 21.71 19.46 2.26 1.51 7.31 0.89 12.45
8 Bhimeswor 25.04 35.20 16.66 5.79 0.00 0.21 0.00 17.12
9 Bidur 53.03 22.43 17.02 5.73 0.77 0.98 0.05 0.00
10 Biratnagar 58.53 18.86 19.11 0.00 0.00 0.00 2.18 1.32
11 Birendranagar 25.07 6.01 9.98 39.59 0.58 9.30 7.71 1.77
12 Birgunj 34.65 19.15 31.77 8.81 2.58 0.00 0.00 3.04
13 Butwal 41.08 20.77 19.67 6.67 1.60 0.00 0.00 10.21
14 Byas 47.24 15.85 21.56 5.98 3.19 3.43 1.19 1.55
15 Damak 52.04 11.34 17.48 0.64 6.44 0.35 3.02 8.70
16 Dasarath Chand 24.04 16.56 35.37 1.23 6.84 3.51 2.71 9.75
17 Dhangadi 22.78 27.50 12.15 14.71 4.70 3.10 5.56 9.50
18 Dhankuta 37.93 17.42 21.07 0.00 4.16 8.15 0.00 11.28
19 Dharan 25.57 18.27 17.09 7.99 6.76 4.23 0.00 20.09
20 Dhulikhel 67.18 14.36 7.18 8.24 0.00 0.00 0.00 3.04
21 Dipayal‐Silgadhi 27.95 32.41 17.25 17.47 2.05 0.00 2.87 0.00
22 Gaur 46.32 9.68 15.44 0.00 0.00 0.00 0.00 28.57
23 Ghorai 40.49 22.51 21.44 6.64 2.56 0.00 1.44 4.92
24 Gorkha 51.46 26.69 13.50 0.00 3.95 0.00 0.00 4.40
25 Gularia 18.08 37.19 29.70 2.52 0.47 0.00 0.56 11.50
26 Hetuda 31.64 28.30 18.44 6.15 6.05 0.83 0.00 8.59
27 Ilam 56.13 14.04 11.73 2.41 5.05 3.04 4.11 3.50
28 Inaruwa 45.37 9.02 13.26 0.00 1.09 0.00 0.00 31.27
29 Itahari 23.13 36.17 30.41 0.53 2.52 2.63 0.00 4.61
30 Jaleswor 38.23 51.00 7.85 0.00 0.00 0.00 2.92 0.00
31 Janakpur 38.62 22.82 28.38 0.00 0.00 0.61 1.52 8.06
32 Kalaiya 44.07 23.69 20.41 0.00 2.26 0.00 0.00 9.57
33 Kamalamai 37.54 17.04 29.36 7.07 1.02 0.00 0.00 7.96
34 Kapilbastu 46.04 24.28 21.34 0.00 0.00 0.00 8.34 0.00
35 Kathmandu 45.44 24.29 23.29 2.86 2.65 1.03 0.00 0.45
36 Khadbaari 29.20 20.89 32.31 5.36 4.07 3.29 0.19 4.69
37 Kritipur 65.77 25.99 5.45 2.79 0.00 0.00 0.00 0.00
38 Lahan 42.46 33.41 14.96 0.72 4.98 0.00 0.00 3.48
39 Lalitpur 39.36 21.05 30.14 1.01 0.25 0.06 0.16 7.97
40 Lekhanath 33.59 19.50 32.45 6.05 0.98 0.00 0.00 7.43
41 Malangawa 23.91 17.72 28.16 7.67 1.56 9.57 6.94 4.47
42 Mechinagar 32.91 24.65 31.85 1.33 4.08 0.00 1.26 3.93
43 Narayan 44.93 16.84 33.06 1.82 3.36 0.00 0.00 0.00
44 Nepalgung 54.96 13.67 16.34 11.23 3.49 0.31 0.00 0.00
45 Panauti 36.09 47.55 14.16 0.91 0.00 1.30 0.00 0.00
46 Pokhara 47.23 12.60 24.68 6.14 1.44 6.95 0.13 0.84
47 Putalibazar 23.87 28.42 24.10 0.00 0.00 0.00 0.00 23.62

vi
48 Rajbiraj 46.42 12.94 23.50 0.85 3.08 1.03 0.61 11.58
49 Ramgram 43.12 21.83 22.31 0.00 1.18 5.33 0.00 6.23
50 Ratnagar 38.12 22.96 26.24 4.30 2.70 2.43 1.29 1.96
51 Sidharthanagar 37.44 47.14 15.13 0.00 0.30 0.00 0.00 0.00
52 Siraha 48.36 7.64 27.99 7.35 1.97 0.44 2.14 4.11
53 Tansen 46.49 10.80 24.53 3.36 1.57 0.20 0.29 12.76
54 Thimi 22.05 28.04 25.37 1.12 0.00 0.00 0.17 23.26
55 Tikapur 28.40 18.44 33.05 5.58 9.27 5.27 0.00 0.00
56 Triyuga 51.93 13.90 17.49 1.49 0.00 6.13 0.00 9.08
57 Tulsipur 38.47 17.01 13.64 14.32 9.47 0.08 1.46 5.55
58 Waling 51.04 12.00 15.59 9.64 1.39 1.95 0.00 8.40
Average composition 39.70 22.12 21.24 5.03 2.38 1.68 1.06 6.80

i
Annex A/Table 6: Type of existing collection services and transportation equipments in 58 municipalities
S. n.
Name of Municipality
Type of existing collection services Collection Coverage
and frequency
Existing collection and transportation equipments
Rickshaw/Cart Tractor/Power tiller
Tipper/Dump trucks
Others
No. Capacity (m3)
No Capacity (m3)
No Capacity (m3)
No Capacity (m3)
1 Amargadi Road Side Container (Few no. in city area)
Road side pick‐up from open piles and containers
‐ Daily, Ward‐4, 5 and part of ward‐1
. 0.5 . 3.5 . 8 .
2 Baglung ‐ ‐ Door to door collection
Thrice a week from 60 % of urban area
. . 1 1 1 2 .
3 Banepa Road side collection depots (50 point in city area)
‐ ‐ Twice a day in city area only
. . 2 1 . .
4 Bhadrapur Concrete ring as container service
Road side pick‐up from open piles and containers
‐ Daily in main city area, not at in other area
12 0.25 1 2 1 1.5 .
5 Bhaktapur ‐ Road side pick‐up
Door to door collection
twice a day in city area
88 0.18 2 1.62 6 3.9 Kharpan,Plastic bucket, Pickup van
33, 100, 6
0.06, 0.01, 1.34

ii
6 Bharatpur Road side collection depots
‐ Door to door collection
Daily collected in ward 2, 3 and 10, waste collected sometime in ward 8 and 12 but not in other area
. . . . .
7 Bhimdutta ‐ Road side pick‐up
‐ Waste collected daily only in urban area especially ward 4
9 0.12 2 10 . .
8 Bhimeshwor Road side collection depots
Road side pick‐up
Door to door collection
Daily collected in ward 1, 3, 6 and 10, while collected sometimes from other area
4 1 . 1 3 Compacter 1 5 tons
9 Bidur 30 road side container in few wards
Road side pick‐up from open piles and containers
‐ Daily collected from urban area like Trisuli bazar and Devighat but thrice a month in rural area
‐ ‐ 1 (not in used)
3.06 2 10.83, 8 .

iii
10 Biratnagar Road side dust bins at some localities
Road side pick‐up from bins and open piles
Door to door collection
Collection covers 60% of urban population
25 Rickshaw, 3 Carts
300‐500 kg and 50 kg
6 2 ton 10 3 ton Three wheelers, Excavator
8, 1
11 Birendranagar Few road side containers in city area especially in ward 6
Road side pick‐up from open piles and containers
‐ Waste collected from city area (ward ‐6 and 8)
2 . 2 1 Tanker 1
12 Birgunj ‐ Road side pick up from open piles
Door to door collection
Covers almost all area of municipality
40 1 12 3 2 4.5 .
13 Butwal Road Side Container (Few no. in city area)
Road side pick up from open piles and containers
‐ Covers almost all area of municipality
18 0.85 6 3 3 5 .
18 Dhankuta Road side container
Road side pick up from containers and open piles
Door to door collection
Daily in main urban market, twice to thrice a week in other urban main roads, twice a week in urban branch roads and no service
. . 2 2.5 tons .

iv
in rural areas
19 Dharan ‐ Road side pick up from open piles
Door to door collection
Daily collection from market area which is about 5.28 sq. km. while once or twice a week from other parts of municipality
8 . 5 2 ‐ 3 tons
. .
20 Dhulikhel Road side containers in city area
Road side pick up from open piles and containers
‐ Daily collection mainly from city area covering 95% population
. . 2 .
21 Dipayal‐Silgadi Road side containers in ward 1 and 7
Road side pick up from containers and open piles
‐ Collection coverage area is about 45%
. . 1 1.2 . .
22 Gaur ‐ Road side pick up from open piles
‐ Covers about 25% of urban areas in
1 0.45 2 2.82 . .

v
daily basis and only 7% of total population
23 Ghorai ‐ Road side pick up from piles
Door to door collection
Covers only urban area (ward‐10 and half of ward‐11) and served population is 34%.
1 . 1 1 .
24 Gorkha Road side dust bins at some area of city
Door to door collection
Daily collection from city area
. . 1 2 ton . .
25 Gulariya ‐ Road side pick from open piles
‐ Wastecollected from only selected area of urban area but in daily basis
. . 1 4 ton . .
26 Hetauda ‐ Road side pick up from open piles
Door to door collection
Daily collection from main urban area (ward ‐ 1, 2, 3, 4, 5 and 10) and once or twice a month in the remaining
15 . 2 2 Water tanker, Bulldozer
.

vi
areas
27 Ilam ‐ Road side pick up from open piles
Door to door collection in core urban area
Daily collection in main city area
. . 1 1 ton 1 2 ton .
28 Inaruwa Road side container made from concrete rings in urban area
Road side pick up from open piles and containers
‐ 60 % of waste from urban area (ward ‐ 1, 2, 3 and 5) twice a week but not collected from rural ward at all.
3 . 1 . .
29 Itahari 30 road side containers in different place of municipality
Road side pick up from containers and open piles
‐ Daily collection in main city area from ward‐ 1, 4 and 8, twice a week in local street markets of ward ‐1 and 8 and thrice a week in some places of ward‐5
4 1 2 9 1 18 .

vii
(street markets)
30 Jaleshwar ‐ Road side pick up from open piles
‐ 50% of urban area and 20% of rural area but daily basis only in core urban area
. . 1 2.5 1 3 .
31 Janakpur ‐ Road side pick up from open piles
‐ Waste collection twice a day in core urban area but no service in rural wards
4 . 4 2 .
32 Kalaiya Carts used as road side containers
Road side pick up from open piles
‐ Waste collection generally from road side of urban wards, occasionally from rural area
4 NA 2 6 2 ‐ .

viii
33 Kamalamai ‐ Road side pick up from open piles
‐ Waste is collected daily in main urban area while once a week from other part
. . 1 3 . Mini truck 1 6
34 Kapilbastu Road side container bins
Road side pick up from open piles and containers
‐ Regular collection from ward ‐ 1, 2, 3 and 5
5 1 1 3 . .
35 Kathmandu Road side containers
Road side pick up from open piles and containers
Door to door collection by private sector
Collection coverage area is more than 90%. Daily collection from many places, twice to thrice a week in remaining area of Kathmandu
. . 2. 1.57 16 (Eicher), 10 (Mazda), 1
3.75, 4.5, 20
Compacter, Skip, Roller
11, 4, 1, 2, 17.
14, 4, 4.5, 6, 15
36 Khadbari No municipal collection system, individual manage themselves
. . . . .
37 Kirtipur Road side containers
Road side pick up from open piles and containers
Door to door collection
. . . 2 Loader 1

ix
38 Lahan Road side containers
Road side pick up from open piles and containers
‐ Regular collection from market area
2 . 2 . .
39 Lalitpur Road side containers
Road side pick up from open piles and containers
Door to door collection
In some areas the wastes are collected in daily basis whereas in other areas once a week or twice a week.
. . 2 2.3 12 3.5 Secondary Vehicle container
4 15
40 Lekhnath No municipal collection system, individual manage themselves
. . . . .
41 Madhyapur Thimi
Road side containers
Road side pick up from open piles and containers
‐ Daily collected in some areas whereas in other area of municipality once a week or twice a week from the public chowk and also from the roadside
17 . . 1 .
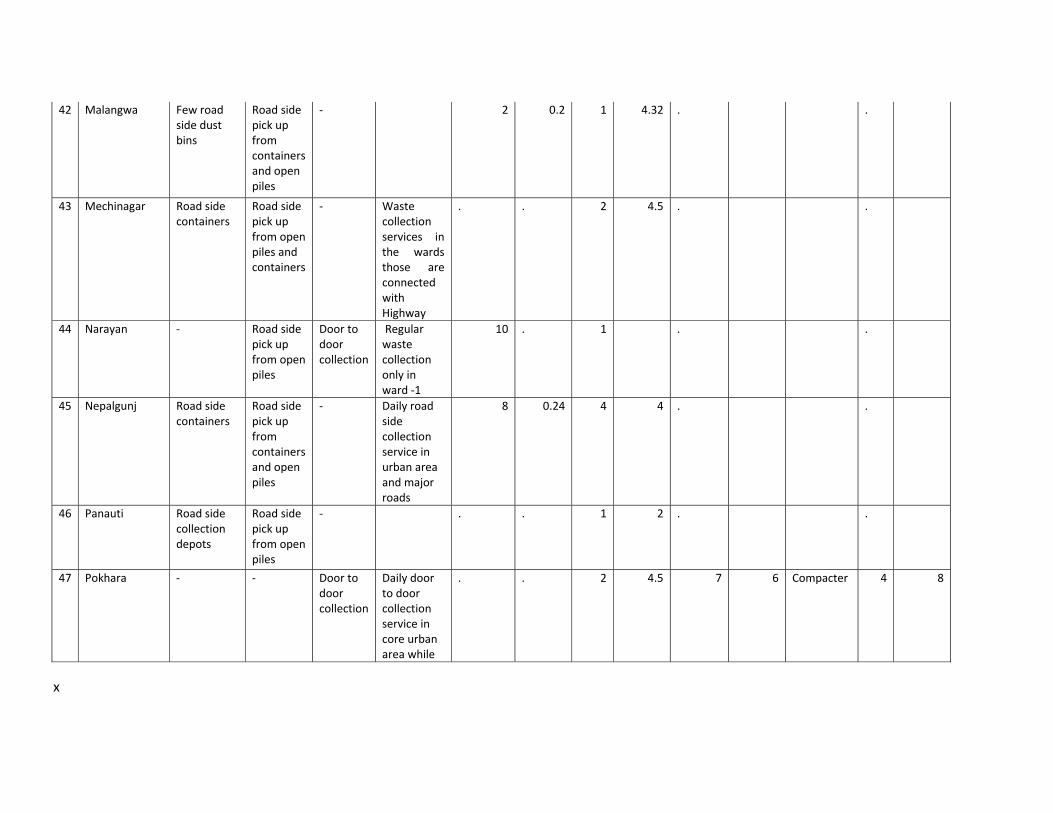
x
42 Malangwa Few road side dust bins
Road side pick up from containers and open piles
‐ 2 0.2 1 4.32 . .
43 Mechinagar Road side containers
Road side pick up from open piles and containers
‐ Waste collection services in the wards those are connected with Highway
. . 2 4.5 . .
44 Narayan ‐ Road side pick up from open piles
Door to door collection
Regular waste collection only in ward ‐1
10 . 1 . .
45 Nepalgunj Road side containers
Road side pick up from containers and open piles
‐ Daily road side collection service in urban area and major roads
8 0.24 4 4 . .
46 Panauti Road side collection depots
Road side pick up from open piles
‐ . . 1 2 . .
47 Pokhara ‐ ‐ Door to door collection
Daily door to door collection service in core urban area while
. . 2 4.5 7 6 Compacter 4 8

xi
once a week in outer core area
48 Putalibazar ‐ Rod side pick up from collection point
Door to door collection
Regular waste collection in only ward‐ 1 and 4 while waste in other area managed by individuals themselves
. . 1 2.5 1 6 .
49 Rajbiraj Road side concrete made bin
Road side pick up from open piles and containers
‐ Only 40% of the waste is collected mainly from core city area
11, 2 0.25, 0.135
2 2 ‐ ‐ ‐ ‐ ‐
50 Ramgram Road side container service
Road side pick up from containers and open piles
‐ Waste is collected from urban wards only
2 0.5 1 3 ‐ ‐ ‐ ‐ ‐
51 Ratnanagar ‐ Road side pick up from open piles
‐ Daily collection in urban area (ward ‐ 1, 2 and 8) but twice a week in rural area
10 0.1 1 3 1 5 .

xii
52 Siddarthanagar Few road side containers in ward 1
Road side pick up from containers and open piles
Door to door collection
Collected daily in urban area, once a week in suburban areas and not at all from rural area
. . 5 3.46 . Wheel barrow
12 0.4
53 Siraha ‐ Road side pick up from open piles
‐ . . . 1 3 .
54 Tansen ‐ Road side pick up
Door to door collection
Daily collection in urban wards while thrice a week in rural areas
. . 1 6.48 1 10.97 .
55 Tikapur ‐ Road side pick up from open piles
‐ Daily waste collection from block 1 and its adjoining blocks and once a week from remaining block of ward‐9 whereas no collection from other areas
6 5 1 40 . .

xiii
56 Triyuga Road side containers in core urban areas
Road side pick up from open piles and containers
‐ Daily collection limited to core urban area (ward ‐ 2 only), rest of areas have no waste collection services
. . 2 3.75 . Small Trolly 12 3.36
57 Tulsipur Road side collection containers
‐ Door to door collection
Waste collection in only ward ‐5
. . 1 . Compacter 1
58 Waling ‐ ‐ Door to door collection
Regular collection in urban area
1 8.1 . .

xiv
Annex A/Table 7: Type of final waste disposal methods and details information of planned landfill site in 58 municipalities.
S.N. Name of Municipality Final disposal methods Planning for landfill site in near future
Detail of existing and planned landfill site
Location Area (Ropani)
Amount of waste disposed (tons/day)
Distance from main city (Km)
Planned year of construction
Estimated lifespan (in Year)
1 Amargadi Open dumping No
2 Baglung Open dumping Yes Khudurke, Ward ‐1
11 ‐ 4 EIA under preparation
3 Banepa Open dumping Yes Balthali, khopasi NA NA 20 NA 50
4 Bhadrapur Riverside dumping No
5 Bhaktapur Controlled tipping No
6 Bharatpur Open dumping Yes Ward ‐11, Taldevi Community Forest
190 5 IEE of the proposed site and design of landfill site completed.
30
7 Bhimdatta Open dumping Yes At the border of ward ‐8 & 9
8 Bhimeshwor Open dumping Yes Ward ‐ 1
9 Bidur Open dumping No
10 Biratnagar Open dumping Yes Dangra landfill site
360 200 18 Within 2017 30

xv
11 Birendranagar Open dumping/riverside dumping
Yes Gutheri, ward‐1 13.31 5 7 IEE and design completed and Initially scheduled for 2010/11 but not still started due to lack of budget
10
12 Birgunj Open dumping/riverside dumping
Yes Ward ‐ 19 Bhutandevi
210 63 4 2015 20
13 Butwal River side dumping with wall fenced around waste disposed area
Yes Proposed in different alternative site like, Tamnagar‐14 and Shivanagar community forest area
‐ 42 ‐ ‐ 50
14 Byas Riverside dumping Yes Byas‐8 15 7 5 2013 15
15 Damak Riverside dumping Yes Not fixed Not fixed Not fixed Not fixed Not fixed Not fixed
16 Dasharathchanda Open dumping Yes Ward ‐ 1 & 8 150 10 4 2015 5
17 Dhangadi . No
18 Dhankuta Sanitary landfill site ‐ Sallariban, ward ‐3
1 8 13 Under Operation
30
19 Dharan Riverside dumping Yes Have a plan to be a part of Regional landfill site however; future of the project is still questionable.
20 Dhulikhel Open dumping Yes Thakuri gaun 30 6 3 Not fixed

xvi
21 Dipayal‐Silgadi Open dumping in sloppy hills and jungle
Yes Ward ‐ 1 4.5 1 2 2011 15
22 Gaur Open dumping/riverside dumping
Yes
23 Ghorai Sanitary landfill site
24 Gorkha Controlled tipping Yes Lamitar, ward‐ 8 30 2 3 2013/14 10
25 Gulariya Open dumping No
26 Hetauda Open dumping No
27 Ilam Open dumping/dumping at sloppy land
Yes Khalte, ward‐3 30 6 25
28 Inaruwa Open dumping/riverside dumping
No
29 Itahari Controlled tipping Yes Morag 373 24 2016 30
30 Jaleshwar Open dumping Yes Ward ‐1 8.31 4 2 km Under discussion
31 Janakpur Open dumping Yes Dhanusa Sinurjora
200 17 8 2013 20
32 Kalaiya Riverside dumping No
33 Kamalamai Open dumping Yes Kwandree kholsee land fill site
29 4 3 ‐ 50
34 Kapilbastu Open dumping No ‐ ‐ ‐ ‐ ‐ ‐

xvii
35 Kathmandu Sanitary landfill site7
Yes Bancharedada, Nuwakot
1700 600 28 km EIA completed, Under discussion
29
36 Khadbari Municipality is not currently involved in waste disposal and treatment
Yes Ward ‐12, Satthimore
62 6 7 2014 50
37 Kirtipur Riverside dumping Yes Ward ‐3 6 km 2012/13
38 Lahan Open dumping No
39 Lalitpur Sanitary landfill site8 Yes Bancharedada, Nuwakot
1700 600 28 km EIA completed, Under discussion
29
40 Lekhnath Currently, municipality is not involved in SWM disposal and treatment
Yes Ward ‐13, Majhuwa
100 20 8 km Alternative 3 sites were selected to proceed IEE for landfill site, IEE will be conducted in FY 2012/13.
25
7For the final disposal of waste generated In Kathmandu and Lalitpur, sanitary landfill site at Sisdol , Okharpauwa was constructed and operated as sanitary landfill site in early stage of operation but currently it is not operated as sanitary landfill site. 8Ibid

xviii
41 Madhyapur Thimi Open dumping/controlled dumping
No
42 Malangwa Open dumping No
43 Mechinagar Open dumping Yes Lalpani, Ward ‐2 92 7 7 Under discussion due to public obstruction
20
44 Narayan Open dumping No
45 Nepalgunj Open dumping Yes Hirminiya VDC 133 25 8 2012‐2017 30
46 Panauti Riverside dumping Yes Makaitar‐13 9 8 5 2013 30
47 Pokhara Sanitary landfill site ‐
48 Putalibazar Open dumping/riverside dumping
Yes Ward ‐7 25 4 7 2013 50
49 Rajbiraj Road side piling Yes Jamuni madhepura VDC
NA 15 3 2017 20
50 Ramgram Riverside dumping Yes Ward ‐ 1, Sanda 133 5 3 2012/13 20
51 Ratnanagar Controlled tipping Yes Panchakanya Community Forest
53 15 5.5 2011 5
52 Siddarthanagar Riverside dumping Yes
53 Siraha Open dumping/riverside dumping
No

xix
54 Tansen Sanitary landfill site, operation started from October 11, 2012
‐ Ward ‐2 29 6 5 15
55 Tikapur Open dumping Yes Initially identified in flooding zone of Karnali, but area was rejected during IEE process in June 2011, After then municipality committed to identify the land for waste disposal, which is still under way.
56 Triyuga Riverside dumping Yes Ward ‐11 133 16 12 2013 35
57 Tulsipur Open dumping Yes Phulbari VDC‐1 38 14 100
58 Waling Riverside dumping Yes Panche khola 10 Not fixed 2 2013/14 50
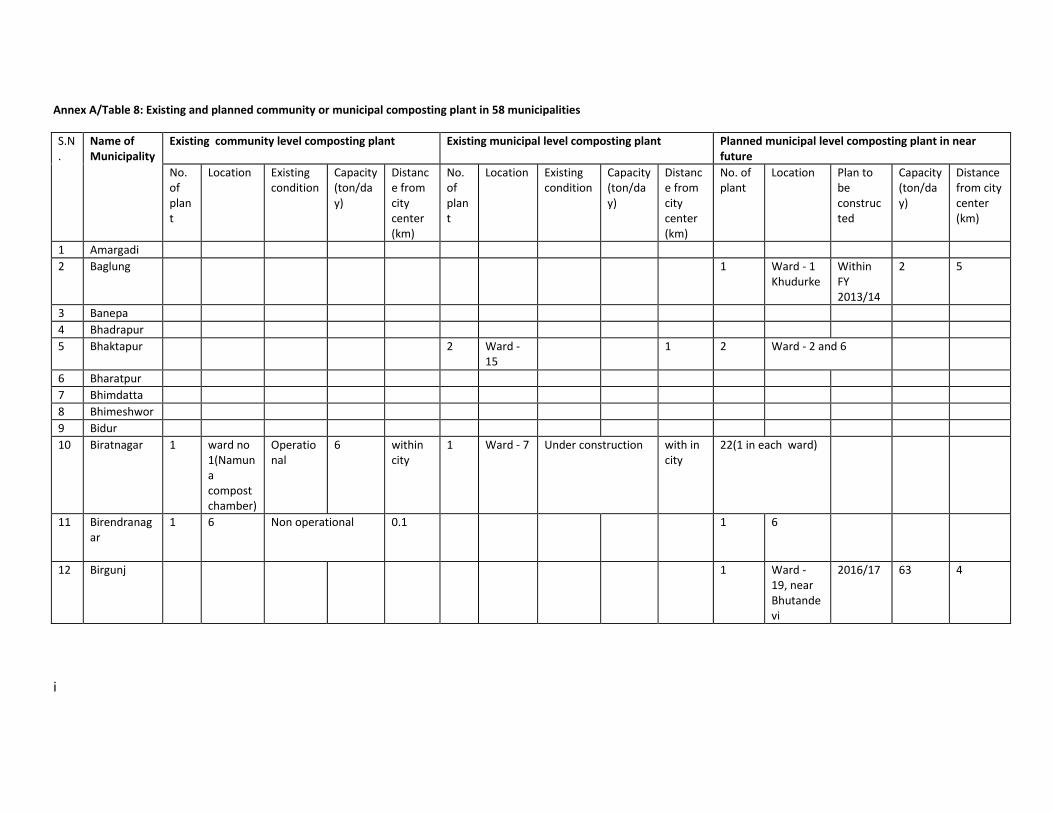
i
Annex A/Table 8: Existing and planned community or municipal composting plant in 58 municipalities
S.N.
Name of Municipality
Existing community level composting plant Existing municipal level composting plant Planned municipal level composting plant in near future
No. of plant
Location Existing condition
Capacity (ton/day)
Distance from city center (km)
No. of plant
Location Existing condition
Capacity (ton/day)
Distance from city center (km)
No. of plant
Location Plan to be constructed
Capacity (ton/day)
Distance from city center (km)
1 Amargadi
2 Baglung 1 Ward ‐ 1 Khudurke
Within FY 2013/14
2 5
3 Banepa
4 Bhadrapur
5 Bhaktapur 2 Ward ‐15
1 2 Ward ‐ 2 and 6
6 Bharatpur
7 Bhimdatta
8 Bhimeshwor
9 Bidur
10 Biratnagar 1 ward no 1(Namuna compost chamber)
Operational
6 within city
1 Ward ‐ 7 Under construction with in city
22(1 in each ward)
11 Birendranagar
1 6 Non operational 0.1 1 6
12 Birgunj 1 Ward ‐19, near Bhutandevi
2016/17 63 4

ii
13 Butwal 1 Ramnagar, ward‐2
operational
10 2 1 Hatbazar,ward ‐7
Operational(Demonstration site)
1 0.5 2 Ward ‐ 14 and 15
FY 2012/13 ‐ 2013/14
15 3
14 Byas
15 Damak Few Not fixed Under planning
Not fixed
Not fixed
16 Dasharathchanda
17 Dhangadi
18 Dhankuta 1 Ward ‐3, waste management centre
Not in operation
3 3.5
19 Dharan 1 Dharan‐13,Amarhat 3
20 Dhulikhel 1 Thakuri gaun‐1
Under planning
6 3
21 Dipayal‐Silgadi
1 1 NA NA 1
22 Gaur 1 Ward ‐ 9, Gaur
Within FY 2012/13 1 km from Gaur
23 Ghorai 1 9 2014/15 5 4.5
24 Gorkha
25 Gulariya 3 Ward ‐11,8,6 1 4
26 Hetauda 1 Ward ‐10
3 1.5
27 Ilam 2 Ward ‐2 and 5
FY 2012/13
5
28 Inaruwa 1 Ward ‐ 2, Gudri ghat
Under planning
‐ 0.5

iii
29 Itahari
30 Jaleshwar
31 Janakpur
32 Kalaiya
33 Kamalamai 3 Operational
0.3 4 2 Ward ‐4 FY 2013/14
1
34 Kapilbastu
35 Kathmandu Ward‐5 ‐ ‐ 1 ward ‐12,teku
closed 5
36 Khadbari
37 Kirtipur 1 Kirtipur ward 6
Operational
0.01 0.5 1 Ward ‐3, kirtipur
‐
7 1
38 Lahan
39 Lalitpur 1 Tikathali,ward ‐ 4 3 3 km
40 Lekhnath 1 Ward 8,Shisuwa
Normal ‐ 0.2 1 Ward‐13, Majhuwa
Within 2016/17
1 8
41 Madhyapur Thimi
42 Malangwa
43 Mechinagar 1 Ward 2 Construction phase complete
3 7
44 Narayan
45 Nepalgunj 1 Hirminiya VDC
2012 19 ton 8
46 Panauti
47 Pokhara Recycling yard 1 Ward ‐18 .165 tons/day
12
48 Putalibazar 1 Badkhola ‐4, Bajra area
2013 4 1
49 Rajbiraj

iv
50 Ramgram
51 Ratnanagar
52 Siddarthanagar
53 Siraha
54 Tansen 2 Ward ‐ 11 and 12
2013/14 1 4.5
55 Tikapur
56 Triyuga 3 ward ‐1,2 and 11
2013/14 0.5 0.8
57 Tulsipur
58 Waling Each HH
Ward ‐1,2,3,45,8
2012/13

i
Annex A/ Table 9: Total municipal budget and SWM budget in 58 municipalities
S.N. Name of Municipality
Total municipal budget (NRs.) in lakhs Total SWM budget (NRs.) in lakhs SWM budget (% of total municipal budget)
Average SWM budget in % of total municipal budget (FY 2009/10 ‐ 2011/12)
FY 2009/2010
FY 2010/2011
FY 2011/2012*
FY 2009/2010
FY 2010/2011
FY 2011/2012*
FY 2009/2010
FY 2010/2011
FY 2011/2012*
1 Amargadi 501.50 610.38 604.66 7.14 7.06 7.75 1.42 1.16 1.28 1.29
2 Baglung 712.12 650.04 702.34 107.43 25.58 52.69 15.09 3.94 7.50 8.84
3 Banepa NA NA 860.00 NA 46.14 51.00 ‐ ‐ 5.93 5.93
4 Bhadrapur 558.51 899.32 1253.24 14.71 14.11 18.50 2.63 1.57 1.48 1.89
5 Bhaktapur 2558.31 2721.05 3850.00 480.00 554.29 537.00 18.76 20.37 13.95 17.69
6 Bharatpur NA NA NA NA NA NA ‐ ‐ ‐ ‐
7 Bhimdatta NA NA NA 55.00 55.00 55.00 ‐ ‐ ‐ ‐
8 Bhimeshwor 486.61 581.45 510.64 9.00 11.18 9.00 1.85 1.92 1.76 1.84
9 Bidur 620.98 527.98 680.53 24.50 27.00 42.00 3.95 5.11 6.17 5.08
10 Biratnagar 2396.37 3451.90 3680.61 251.30 435.21 171.50 10.49 12.61 4.66 9.25
11 Birendranagar 824.73 909.66 990.69 28.00 28.95 34.90 3.40 3.18 3.52 3.37
12 Birgunj NA 2589.25 3171.39 NA 587.49 590.20 ‐ 22.69 18.61 20.65
13 Butwal 1454.58 2036.54 3220.99 157.80 178.73 192.00 10.85 8.78 5.96 8.53
14 Byas 853.62 980.09 879.68 43.23 27.36 38.40 5.06 2.79 4.37 4.07
15 Damak 941.53 1257.33 1664.63 11.56 18.84 21.50 1.23 1.50 1.29 1.34
16 Dasharathchanda 655.70 499.06 644.96 2.00 2.50 7.00 0.31 0.50 1.09 0.63
17 Dhangadi 976.87 1256.68 15349.52 23.98 NA NA 2.46 ‐ ‐ 2.46
18 Dhankuta NA NA NA 44.42 59.80 50.00 ‐ ‐ ‐ ‐
19 Dharan 1775.93 2173.77 2400.68 84.43 87.31 126.71 4.75 4.02 5.28 4.68
20 Dhulikhel 713.92 768.42 1127.23 12.00 22.80 32.25 1.68 2.97 2.86 2.50
21 Dipayal‐Silgadi 349.13 567.12 530.80 45.82 5.75 6.33 13.12 1.01 1.19 5.11
22 Gaur 762.25 576.65 745.34 14.17 36.62 41.00 1.86 6.35 5.50 4.57
23 Ghorai 712.16 798.21 997.28 60.00 80.00 85.00 8.43 10.02 8.52 8.99
24 Gorkha NA NA 768.44 NA 2.40 NA ‐ ‐ ‐ ‐
25 Gulariya 54.27 80.52 750.33 4.32 6.48 NA 7.96 8.05 ‐ 8.00
26 Hetauda 0.00 0.00 2258.64 98.58 90.45 100.00 ‐ ‐ 4.43 4.43
27 Ilam 686.04 865.92 753.00 29.20 25.44 34.42 4.26 2.94 4.57 3.92
28 Inaruwa 520.01 536.86 660.52 9.00 14.00 20.63 1.73 2.61 3.12 2.49

ii
29 Itahari 742.49 1010.08 1285.16 57.40 98.06 84.00 7.73 9.71 6.54 7.99
30 Jaleshwar 543.45 706.91 846.78 4.20 1.39 6.24 0.77 0.20 0.74 0.57
31 Janakpur 1438.79 1660.86 1630.08 91.85 92.49 103.45 6.38 5.57 6.35 6.10
32 Kalaiya 658.68 628.58 491.77 51.71 46.08 40.96 7.85 7.33 8.33 7.84
33 Kamalamai 1008.19 1048.86 897.34 3.82 4.57 10.50 0.38 0.44 1.17 0.66
34 Kapilbastu 574.25 693.48 0.00 12.00 15.07 NA 2.09 2.17 ‐ 2.13
35 Kathmandu 12128.54 9474.08 19000.00 2786.12 2531.33 4431.00 22.97 26.72 23.32 24.34
36 Khadbari 634.71 556.48 NA NA 0.40 NA ‐ 0.07 ‐ 0.07
37 Kirtipur NA NA 1224.10 24.13 25.14 25.00 ‐ ‐ 2.04 2.04
38 Lahan 501.58 450.26 5914.35 36.26 36.02 NA 7.23 8.00 ‐ 7.61
39 Lalitpur 2349.51 4338.22 5586.89 131.10 221.73 312.20 5.58 5.11 5.59 5.43
40 Lekhnath 896.75 1084.14 1287.08 NA NA NA ‐ ‐ ‐ ‐
41 Malangwa 329.68 222.46 930.70 16.15 21.41 30.50 4.90 9.63 3.28 5.93
42 Mechinagar 1035.12 1235.52 1390.62 15.00 19.87 29.50 1.45 1.61 2.12 1.73
43 Narayan NA NA 631.77 NA NA NA ‐ ‐ ‐ ‐
44 Nepalgunj 964.87 1162.03 1511.10 50.95 16.32 206.17 5.28 1.40 13.64 6.78
45 Panauti 1550.45 1308.93 985.48 10.17 36.48 16.78 0.66 2.79 1.70 1.72
46 Pokhara 2730.36 3222.45 3685.84 245.00 286.00 303.30 8.97 8.88 8.23 8.69
47 Putalibazar 391.90 491.25 802.62 12.00 17.95 17.48 3.06 3.65 2.18 2.96
48 Rajbiraj 415.91 548.60 1053.00 36.29 26.12 38.00 8.73 4.76 3.61 5.70
49 Ramgram 552.16 625.55 629.34 4.98 6.13 8.00 0.90 0.98 1.27 1.05
50 Ratnanagar 706.83 883.38 923.31 15.43 28.80 29.45 2.18 3.26 3.19 2.88
51 Siddarthanagar 1089.22 1256.76 1505.93 45.82 53.48 65.30 4.21 4.26 4.34 4.27
52 Siraha 703.97 675.33 540.50 3.50 4.00 5.00 0.50 0.59 0.93 0.67
53 Tansen 215.49 325.37 746.14 24.47 27.65 42.00 11.36 8.50 5.63 8.49
54 Thimi NA NA 1625.41 29.70 NA 32.55 ‐ ‐ 2.00 2.00
55 Tikapur 674.60 NA NA 0.96 NA NA 0.14 ‐ ‐ 0.14
56 Triyuga 795.45 1199.00 1074.00 11.23 14.30 15.00 1.41 1.19 1.40 1.33
57 Tulsipur 485.12 541.34 965.60 20.00 30.00 12.50 4.12 5.54 1.29 3.65
58 Waling 422.22 464.71 515.68 4.26 3.09 5.51 1.01 0.66 1.07 0.91
Total/average value 53655.42 61152.82 106736.72 5362.09 6114.34 8195.17 9.99 10.00 7.68 9.22