Techne Annual Reportresources.bio-techne.com/docs-assets/pdf/TECHNE_AnnualReport_FY... · Master...
72
TECH 2014 ANNUAL REPORT
Transcript of Techne Annual Reportresources.bio-techne.com/docs-assets/pdf/TECHNE_AnnualReport_FY... · Master...

TECH
2 0 1 4 A N N U A L R E P O R T
CA_ARFY2014cover_09.14_final.indd 1 9/10/2014 12:33:08 PM

Master Brand System Development. Our new name, Bio-Techne, was born by combining two Greek words. “Bios” is the Greek word for life and “techne” is the Greek word for applying knowledge to solve problems. This name represents the mission of our company, To provide the Life Sciences community with innovative, high-quality scientific tools to better understand biological processes and drive discovery.
We have a vision of organizing our operating divisions to align expertise and share best practices in a manner that creates value, but we will organize our branding, communications, and selling strategies along major market segments of life science research and diagnostic development.
The various brands in our portfolio will be aligned in this framework to give clarity to our communications and offerings, allowing us to create a comprehensive portfolio of products to meet the expanding needs of scientific discovery.
Techne Corporation (Bio-Techne)
Biotechnology Instruments Clinical Controls
Corporation
Master Brand System Development
Master Brand
Divisions
Sub Brands Sub Brands
Selling Channels
North America
EuropeMiddle East
Africa
China
ROW
Selling Channels
Market Brands
MASTER BRAND SYSTEM DEVELOPMENT
CA_ARFY2014cover_09.14_final.indd 2 9/10/2014 12:33:08 PM

1
Charles Kummeth, CEO
Welcome to Bio-Techne, It’s a new year, and a new company name. Under our new corporate name, we are now able to do business as a unified company with a global corporate brand that stands for quality, innovation and scientific excellence.
The fiscal year ending June 30, 2014 was an important year for the company. I want to highlight just a few of the many accomplishments our employees achieved. We added a new regional sales network in the United States. We expanded our employee count in China from 12 to 31, not including new employees from acquisitions. In the fiscal year and the month of July, we completed four acquisitions and one strategic investment that we hope to soon convert to an acquisition. We added numerous new systems to the operations of the company, including Salesforce.com as a new Customer Relationship Management tool. We attracted four new key executives to the leadership team, reorganized the company around development and operations to be more efficient and innovative, created a new branding and tradeshow plan, created the first company strategic plan, began participating at regular investor meetings, conducted quarterly earnings calls, and established many more important new processes that will enable accelerated growth.
We increased our employee count from about 800 to over 1300 with the following acquisitions in fiscal year 2014: PrimeGene, a China-based proteins company, and Bionostics, a clinical controls company…and in July of 2014: ProteinSimple, a protein identification and quantification instrument company and Novus Biologicals, an antibody company. All of these acquisitions, along with a strategic investment in CyVek, a next generation ELISA instrument company, support our key strategic directions, which include:
Expand regionally with tuck-in acquisitions;
Expand our antibody products portfolio, giving researchers more choice;
Acquire small innovative instrument technologies that can leverage our reagents, offering researchers more complete solutions;
Acquire new talent to help the company with its next phase of accelerated growth; and
Acquire scientific talent and intellectual property to expand our product portfolio and inspire new discoveries in the company.
TO OUR SHAREHOLDERS
FINANCIAL HIGHLIGHTS
2
Financial Performance in Fiscal Year 2014
The company reversed its negative growth from the previous year to positive growth this year, despite continued headwinds in academic spending. As we look forward, we expect these headwinds to subside, with renewed NIH spending, continued strong growth in China and a modest improvement in Europe’s economic climate.
Highlights of our FY2014 performance include the following:
Adjusted earnings were $125.3 million and adjusted diluted earnings per share were $3.39, both increasing 6% from FY2013. Adjusted earnings exclude intangible asset amortization, costs recognized upon the sale of inventory that was written-up to fair value as part of the acquisitions and professional fees related to acquisition activity in fiscal 2014. The impact of certain tax events were also excluded.
Net sales increased 15% to $357.8 million in FY2014. Excluding acquisitions and the impact of foreign exchange rate fluctuations, organic revenue increased 3%.
Operating margins were 50.2% and return on sales was 35% after adjusting for the acquisition related costs and certain tax impacts noted above.
Net cash provided by operations was $136.8M in FY2014, an 11% increase over the prior year. We closed the year with $367 million in cash and available-for-sale investments, including our investment in ChemoCentryx that had a market value of $37.1 million at June 30, 2014. We returned $45.4 million to our shareholders in the form of dividends.
We introduced over 1,600 new biotechnology products that generated $3.4 million of sales in FY2014. We now offer over 25,000 total products.
TO OUR SHAREHOLDERS
(1) Excludes intangible asset amortization, costs recognized upon the sale of inventory that was written-up to fair value as part of acquisitions, professional fees related to acquisition activity and the impact of certain tax events. See Item 7. of the Company’s Annual Report on Form 10-K, following, for further details.
(In thousands, except per share data)
Year Ended June 30,
2014 2013 2012
Net Sales $ 357,763 $ 310,575 $ 314,560
Adjusted net earnings(1) $ 125,325 $ 118,032 $ 121,161
Adjusted diluted earnings per share(1) $ 3.39 $ 3.20 $ 3.27
Cash flow from operations $ 136,762 $ 123,562 $ 126,746
(In thousands)
June 30,
2014 2013 2012
Cash, cash equivalents and available-for-sale investments $ 366,929 $ 465,313 $ 412,952
Working capital $ 443,022 $ 377,432 $ 310,757
Total assets $ 862,491 $ 778,098 $ 719,324
Stockholders’ equity $ 795,265 $ 737,541 $ 674,442
Common shares outstanding 37,002 36,835 36,826
$121m$118m
$125m
FY2012 FY2013 FY2014Adjusted net earnings
$127m$124m
$137m
FY2012 FY2013 FY2014Cash flow from operations
$315m $311m
$358m
FY2012 FY2013 FY2014Net Sales

3
Global Representation
Our Biotechnology segment sales, which represented 84% of Bio-Techne sales in FY2014, increased 4% for the fiscal year. Sales in this segment improved 3% after acquisitions and foreign currency changes are excluded. Bio-Techne Europe and Bio-Techne China’s results are also included in the Biotechnology segment’s sales and represent 29% and 6% of Biotechnology sales respectively in FY2014. China’s sales were up 27% over last year, a significant achievement and a result of the sales force investments we made this year. We expect continued strong growth of our sales in China.
Sales in the United States to industrial, pharmaceutical and biotechnology customers, Biotechnology’s largest domestic-customer segment, increased 4% in FY2014. United States sales to academic customers decreased 9% in FY2014 primarily to continued funding headwinds, but also to the increased competition for this price-conscience customer class.
As for our other segment, Clinical Controls, which develops blood controls and calibrators for use in hospitals and clinics, organic growth, which excludes the Bionostics acquisition in July 2013, was 7% for the full year, rounding out a year of solid and consistent demand and operational execution.
Clinical Controls, Minneapolis, MN Site
Biotechnology, Minneapolis, MN Site
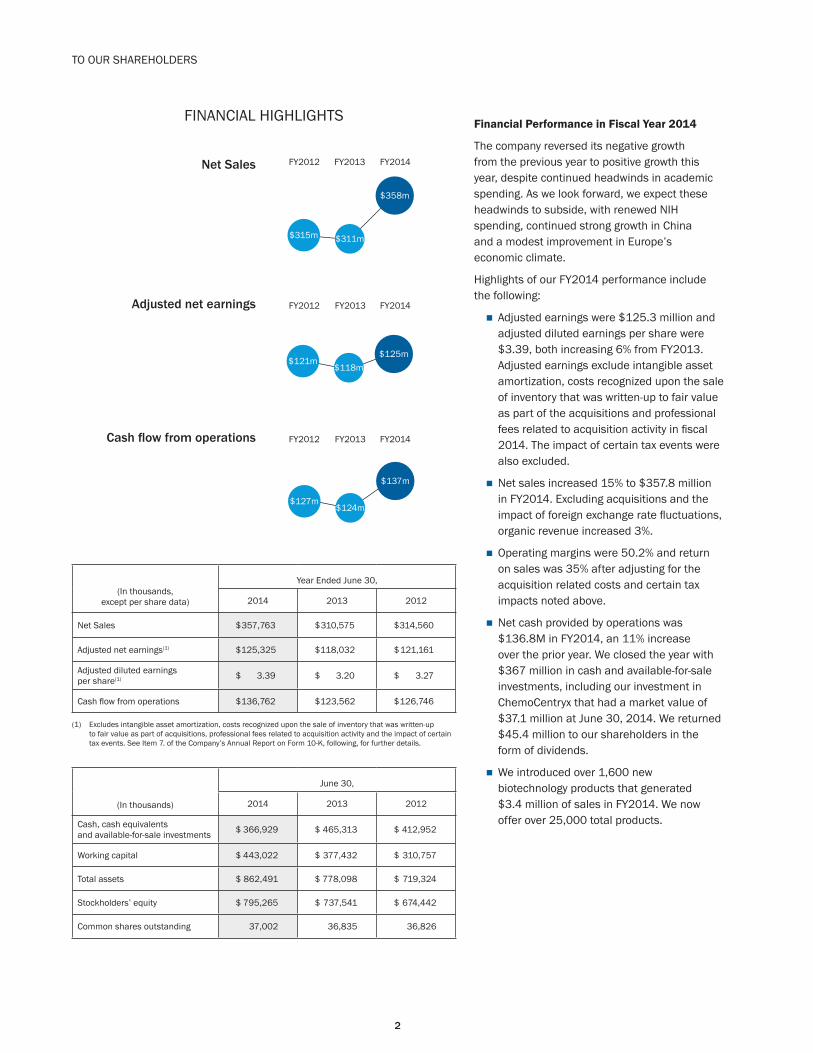
Cytokines andgrowth factors usedin a varietyof life scienceresearch applications
Low-cost proteinmanufacturingin China
~225,000 additional antibodies and digital platform
Partnership toautomate ELISAtesting
Monoclonal andpolyclonal antibodiesvalidated for variousapplications includingWestern Blot
Single and multi-analyteELISA assays
Library of over 3,000biologically activecompounds (agonistsand antagonists)
Business Expansion Through Acquisition
R&D Systems
+ PrimeGene
+ Novus Biologicals
+ CyVek
+ Bionostics
Proteins
Antibodies
Assays
SmallMolecule
ClinicalControls
Tocris
Blood cells-basedclinical controlsand calibrators
Blood chemistrycontrols (glucose,blood gas, andcoagulation)
R&D Systems
BUSINESS EXPANSION THROUGH ACQUISITION
4
Global Markets
We had a great year with our Pacifi c Rim business, with revenue increasing 10% year-over-year as compared to 3.5% last year. This was accomplished by adding employees in the region and a new Singapore resident director to work with and manage our local distributors. We also streamlined our distributor family and created a system to better reward distributors that were investing in our product lines. Japan was a particularly good story, with organic growth in FY2014 of 13%.
Bio-Techne Europe organic sales increased 1% in FY2014. This compares to a decrease of 3.5% last year. Both European academic institutions and biotechnology and pharmaceutical companies were still impacted by the European sovereign debt crisis, austerity measures and reductions in research funding. By the fourth quarter, however, it appeared these pressures have started to subside. Competitive pressures in the academic segment are increasing, though, similar to what is being seen in the U.S.
Our Tocris business unit continues to be integrated into the global Bio-Techne operations. In this past year, Tocris has focused on innovative new products, leveraging Bio-Techne’s full marketing strength and accelerating growth in China, where Tocris product sales increased 26% from FY2013.
With the addition of Novus, PrimeGene and Protein Simple, we believe we can attain more critical mass in all of our businesses operating globally. Novus gives us accessibility to over 225,000 antibodies, which, combined with our portfolio of antibodies and proteins, provides our customers with an unprecedented level of product breadth to choose from. In addition, the R&D Systems, PrimeGene and Novus brands offer price sensitive researchers the choice between price and quality that has become a common decision in these funding-constrained times. We will add to all of this a world class website in the coming year to offer the end user an unparalleled customer experience. ProteinSimple’s innovative instrumentation will leverage the content of our broad antibody and protein portfolio. Researchers will be able to bundle reagents to purchase with this revolutionary new Western Blotting instrument platform.
TO OUR SHAREHOLDERS

5
Channel Strategies
We had a solid year in creating new commercial processes within Bio-Techne, starting with hiring a new Sales and Marketing Vice President. We also dramatically reorganized our overall sales and marketing groups, adding a local field sales group in the U.S., more than doubling our sales representatives in China and opening a sales office in Beijing. We also added marketing strength through our recent acquisitions. Both Novus and ProteinSimple have marketing as a core strength led by senior level executives with solid marketing experience.
We inked a deal with Fisher to partner with us, giving them the right to sell our Biotechnology division products in the U.S. and Canada. This is an important sales growth initiative, providing us with more than 30 Fisher technical service representatives who will assist both our sales force and Fisher’s extensive sales force to sell our products. Sales results in the first two quarters under this arrangement have been very encouraging. Again, the addition of products from the newly acquired companies only makes all of this even better.
New Product Development
My 25 years at 3M trained me for innovation. In my career, I have always strived to promote “the 3M way” in innovation. This means you can’t schedule it. You can’t demand it. You can’t expect it from laboratories of over-constrained employees. Innovation must come from an environment that is healthy, meaning that resources are matched to the work load, that there is ample spare time to dream, that there is no fear in failing and that there is celebration of success. Of course, in the end, it is highly desirable to also have intellectual property ownership of these discoveries.
It will take a few years to see this innovative culture at Bio-Techne flourish, but with over 130 PhDs and a technical community of hundreds, I am confident we will succeed in this endeavor. This past year, we did a solid job of prioritizing our product development projects. We launched 1600 new products versus 2100 last year but with 40% more first year revenue. Now, with our recent acquisitions, we can leverage synergies to create new-to-the-world technologies. As we grow, we will increase the vitality index of new products even more.

Strategy for Accelerated Growth. Our goal of accelerated growth is built on a solid foundation. We have high quality products and can leverage this into innovation in our core areas of expertise. We have a strong brand name that can open the doors to geographic expansion. The breadth of our product offering is extensive and, with strong commercial execution, we can increase our market share. We have a solid balance sheet, but a focus on operational excellence will create more value for shareholders. Our long tenured and dedicated staff have made this company strong and, with adding new talent in key areas, we can bring in new ideas to continue our legacy into the future to meet the expanding needs of scientific discovery.
Accelerated Growth
HighQuality
Products
Inno
vatio
n in
Cor
e Ar
eas
StrongBrandName
Geo
grap
hic
Expa
nsio
n
Breadthof Product
Line
Com
mer
cial
Exe
cutio
n
SolidBalanceSheet
Oper
atio
nal E
xcel
lenc
eLong Tenured
andTalented Staff
Tale
nt R
ecru
itmen
t
6
STRATEGY FOR ACCELERATED GROWTH
TO OUR SHAREHOLDERS
Ultimate Goal
Five Pillars Strategy
Strong Foundation
7
Another key principle of the Bio-Techne innovation engine is the Key Opinion Leader (KOL) network. This past year we have created a science advisory board that works in tandem with our board of directors. We have also identified over 30 new KOLs, leaders in their fields of science, with areas of strategic focus like stem cells, aptamers, cytokines and synthetic proteins, novel antibodies, and diagnostic tools.
Strategic Direction
We have five pillar strategies that will define success:
Enable and sponsor innovation in the core product lines
Geographic expansion
Commercial execution
Operational excellence
Talent recruitment and retention
These will be the charters from which we are building our tactical plans. Clearly, the earliest results will come from expanding our geographical and commercial infrastructure. This is already working well. Longer term, the KOL strategy, focus groups to helps us in product design and prioritization and continuing to build a world class team will continue to fuel innovation and accelerated growth. M&A and other operational and strategic initiatives will supplement the above to aid in executing a growth plan that can endure market challenges.
We have just completed a solid year of growth and execution in the business. We look forward to FY2015 and are excited about the possibilities that may take us into new and exciting markets. We remain committed to getting closer to our global customers to better understand their needs and continue to deliver more products, more solutions and novel instruments to meet their ever expanding laboratory needs. The team is energized and so am I. Welcome to the new Bio-Techne.
Charles Kummeth CEO
Building Innovation Opportunities
Forward Looking Statements
Certain statements in this letter may constitute forward-looking statements as defined in the U.S. Private Securities Litigation Reform Act of 1995. Forward-looking statements reflect the Company’s current views with respect to future events and financial performance and include any statement that does not directly relate to a current or historical fact. Forward-looking statements can generally be identified by the words “believe,” “expect,” “anticipate” or “intend” or similar words. There are a number of risks and uncertainties that could affect actual results. For additional information concerning such risks and uncertainties, see the section titled “Risk Factors” in the Company’s annual report on Form 10-K and quarterly reports on Form 10-Q as filed with the Securities and Exchange Commission. We undertake no obligation to update or revise any forward-looking statements due to new information or future events. Investors are cautioned not to place undue emphasis on these statements.
8
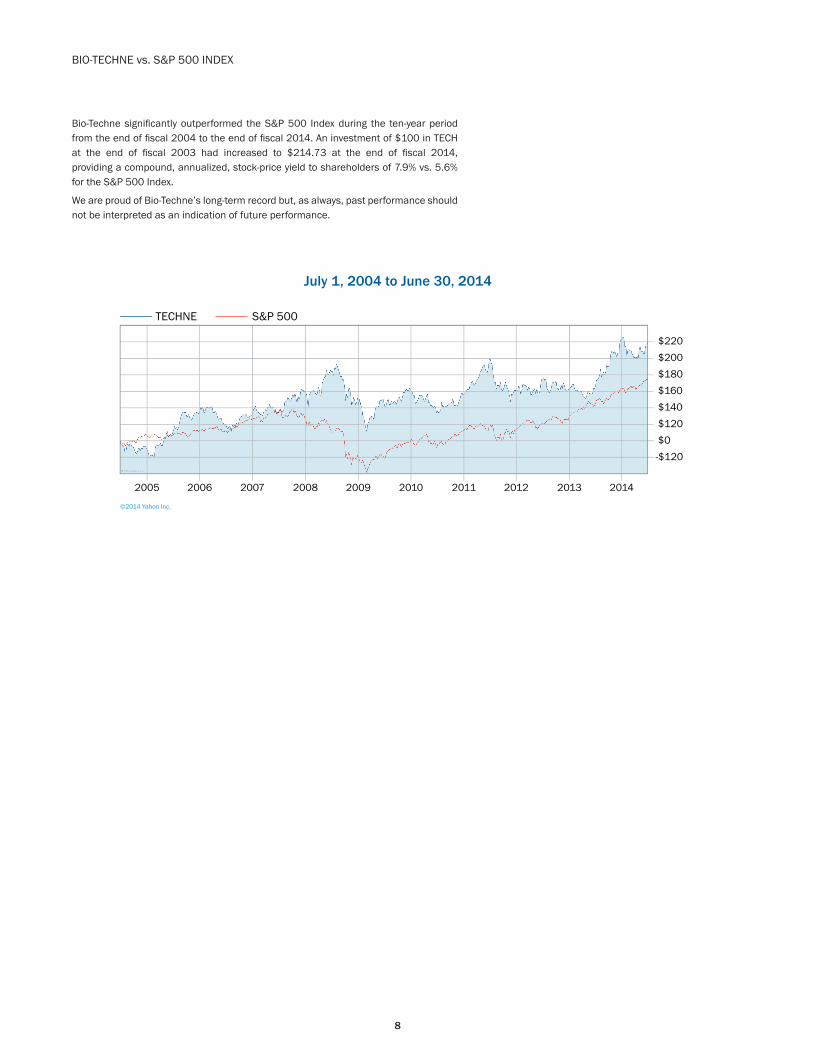
Bio-Techne signifi cantly outperformed the S&P 500 Index during the ten-year period from the end of fi scal 2004 to the end of fi scal 2014. An investment of $100 in TECH at the end of fi scal 2003 had increased to $214.73 at the end of fi scal 2014, providing a compound, annualized, stock-price yield to shareholders of 7.9% vs. 5.6% for the S&P 500 Index.
We are proud of Bio-Techne’s long-term record but, as always, past performance should not be interpreted as an indication of future performance.
BIO-TECHNE vs. S&P 500 INDEX
$220$200$180$160$140$120$0-$120
2014201320122011201020092008200720062005
TECHNE
©2014 Yahoo Inc.
S&P 500
July 1, 2004 to June 30, 2014

UNITED STATES
SECURITIES AND EXCHANGE COMMISSION
Washington, DC 20549
FORM 10-K
X ANNUAL REPORT PURSUANT TO SECTION 13 OR 15(d) OF THE
SECURITIES EXCHANGE ACT OF 1934
For the fiscal year ended June 30, 2014
TRANSITION REPORT PURSUANT TO SECTION 13 OR 15(d)
OF THE SECURITIES EXCHANGE ACT OF 1934
For the transition period from ________to __________
Commission File Number: 000-17272
TECHNE CORPORATION (Exact name of Registrant as specified in its charter)
Minnesota 41-1427402
(State of Incorporation) (IRS Employer Identification No.)
614 McKinley Place N.E., Minneapolis, MN 55413-2610
(Address of principal executive offices) (Zip Code)
Registrant’s telephone number: (612) 379-8854
Securities registered pursuant to Section 12(b) of the Act: Common Stock, $0.01 par value
Name of each exchange on which registered: The Nasdaq Stock Market LLC
(Nasdaq Global Select Market)
Securities registered pursuant to Section 12(g) of the Act: None Indicate by check mark if the registrant is a well-known seasoned issuer, as defined in Rule 405 of the Securities Act. Yes (X) No ( )
Indicate by check mark if the registrant is not required to file reports pursuant to Section 13 or 15(d) of the Act. Yes ( ) No (X)
Indicate by check mark whether the registrant (1) has filed all reports required to be filed by section 13 or 15(d) of the Securities Exchange Act of
1934 during the preceding 12 months (or for such shorter period that the registrant was required to file such reports), and (2) has been subject to such filing requirements for the past 90 days: Yes (X) No ( )
Indicate by check mark whether the registrants has submitted electronically and posted on its corporate Web site, if any, every Interactive Data File required to be submitted and posted pursuant to Rule 405 of Regulation S-T (§232.405 of this chapter) during the preceding 12 months (or
for such shorter period that the registrant was required to submit and post such files). Yes (X) No ( )
Indicate by check mark if disclosure of delinquent filers pursuant to Item 405 of Regulation S-K is not contained herein, and will not be
contained, to the best of registrant’s knowledge, in definitive proxy or information statements incorporated by reference in Part III of this Form 10-K or any amendment to this Form 10-K. ( )
Indicate by check mark whether the registrant is a large accelerated filer, an accelerated filer, a non-accelerated filer, or a smaller reporting company. See the definitions of “large accelerated filer,” “accelerated filer” and “smaller reporting company” in Rule 12b-2 of the Exchange Act.
Large accelerated filer (X) Accelerated filer ( ) Non-accelerated filer ( ) Small reporting company ( )
Indicate by check mark whether the Registrant is a shell company (as defined in Exchange Act Rule 12b-2). Yes ( ) No (X)
The aggregate market value of the Common Stock held by non-affiliates of the Registrant, based upon the closing sale price on December 31, 2013 as reported on The Nasdaq Stock Market ($94.67 per share) was approximately $2.7 billion. Shares of Common Stock held by each officer
and director and by each person who owns 5% or more of the outstanding Common Stock have been excluded.
Shares of $0.01 par value Common Stock outstanding at August 22, 2014: 37,007,203
DOCUMENTS INCORPORATED BY REFERENCE
Portions of the Company’s Proxy Statement for its 2014 Annual Meeting of Shareholders are incorporated by reference into Part III.

TABLE OF CONTENTS
Page
PART I
Item 1. Business 1
Item 1A. Risk Factors 10
Item 1B. Unresolved Staff Comments 15
Item 2. Properties 15
Item 3. Legal Proceedings 16
Item 4. Mine Safety Disclosures 16
PART II
Item 5. Market for the Registrant’s Common Equity, Related Shareholder
Matters and Issuer Purchases of Equity Securities 16
Item 6. Selected Financial Data 18
Item 7. Management’s Discussion and Analysis of
Financial Condition and Results of Operations 19
Item 7A. Quantitative and Qualitative Disclosures about Market Risk 28
Item 8. Financial Statements and Supplementary Data 30
Item 9. Changes in and Disagreements with Accountants
on Accounting and Financial Disclosure 48
Item 9A. Controls and Procedures 48
Item 9B. Other Information 49
PART III
Item 10. Directors, Executive Officers and Corporate Governance 50
Item 11. Executive Compensation 50
Item 12. Security Ownership of Certain Beneficial Owners and Management
and Related Shareholder Matters 50
Item 13. Certain Relationships and Related Transactions, and Director Independence 50
Item 14. Principal Accounting Fees and Services 51
PART IV
Item 15. Exhibits, Financial Statement Schedules 51
SIGNATURES 52
i

1
PART I
ITEM 1. BUSINESS
OVERVIEW
Techne and its subsidiaries, collectively doing business as Bio-Techne (Bio-Techne, we, our, us or the Company)
develop, manufacture and sell biotechnology products and clinical diagnostic controls worldwide. With our deep
product portfolio and application expertise, Bio-Techne is a leader in providing specialized proteins, including
cytokines and growth factors, and related immunoassays, small molecules and other reagents to the research,
diagnostics and clinical controls markets.
A Minneapolis, Minnesota-based company, Bio-Techne originally was founded as Research and Diagnostic
Systems, Inc. (R&D Systems) in 1976, initially producing hematology controls and calibrators for primary use in
clinical settings. Techne Corporation, a public entity at the time and currently the parent company, acquired R&D
Systems in 1984 and through this action made R&D Systems a public company. The initial products focused on the
hematology blood controls and calibrators market but soon expanded through the creation of the Biotechnology
Division, to include reagents used in life science research. A series of acquisitions further expanded the product
portfolio. These included the Amgen research business in 1991, the Genzyme research business in 1997, Fortron Bio
Science, Inc. and BiosPacific, Inc. (BiosPacific) in 2005, and Boston Biochem, Inc. and Tocris Holdings Limited
(Tocris) in 2011. In fiscal 2014, we further strengthened our clinical controls solutions by acquiring Bionostics
Holdings Limited (Bionostics), and our biotechnology segment offerings were increased by the recent acquisition of
Shanghai PrimeGene Bio-Tech Co. (PrimeGene), and an agreement to invest in and possibly acquire CyVek, Inc.
(CyVek). With these recent investments, we will be able to scale our business and expand into new product and
geographic markets.
Recognizing the importance of a unified and global approach to meeting our mission and accomplishing our
strategies, in fiscal 2014 we implemented a new global brand, Bio-Techne. The Bio-Techne brand is derived from
the Greek words “Bio,” or “life,” and “Techne,” or “the application of knowledge to practical matters.” The
combination of these words and their meanings capture the essence of Bio-Techne, its products and mission. The
acquisition of various brands over the years drove the need for an umbrella branding strategy that could hold all of
the acquired assets. The Bio-Techne name solidifies the new strategic direction for the Company along with
unifying and positioning all of our brands under one complete portfolio.
With these strategic efforts, as well as the establishment of dedicated subsidiaries in Europe and Asia, we now
operate globally along with offices in several locations in the United States, Europe and China. Today, our product
line extends to over 24,000 products, 95% of which are manufactured in-house. While maintaining our core
strengths in cytokines and immunoassays, we also develop antibodies, cell selection and multicolor flow cytometry
kits, multiplex assays, biologically active compounds, and stem cell products and kits.
We are committed to providing the life sciences community with innovative, high-quality scientific tools to better
understand biological processes and drive discovery. We intend to build on Bio-Techne’s past accomplishments,
strong reputation and financial position by executing strategies that position us to become the standard for biological
content in the research market, and to leverage that leadership position to enter the diagnostics and other adjacent
markets. Our strategies include:
Continued innovation in core products. Through collaborations with key opinion leaders and participation
in scientific discussions and associations, we expect to leverage our continued significant investment in our
research and development activities to be first-to-market with quality products that are at the leading edge
of life science researchers’ needs.
Investments in targeted acquisitions. We intend to leverage our strong balance sheet to gain access to new
technologies and products that improve our competitiveness in the current market and allow us to enter
adjacent markets.
Expansion of geographic footprint. We will continue to expand our sales staff and distribution channels
globally in order to increase our global presence and make it easier for customers to transact with us.

2
Realignment of resources. In recognition of the increased size and scale of the organization, we intend to
redesign our development and operational resources to create greater efficiencies throughout the
organization.
Talent recruitment and retention. We will recruit, train and retain the most talented staff to implement all of
our strategies effectively.
OUR PRODUCTS AND MARKETS
Currently Bio-Techne operates worldwide and has two reportable business segments, Biotechnology and Clinical
Controls, both of which serve the life science and diagnostic markets. The Biotechnology reporting segment
develops, manufactures and sells biotechnology research and diagnostic products world-wide. The Clinical Controls
reporting segment develops and manufactures controls and calibrators for the global clinical market. In fiscal 2014,
net sales from Bio-Techne’s Biotechnology segment were 84% of consolidated net sales. Bio-Techne’s Clinical
Controls segment net sales were 16% of consolidated net sales for fiscal 2014. Financial information relating to Bio-
Techne’s segments is incorporated herein by reference to Note L to the Consolidated Financial Statements included
in Item 8 of this Annual Report on Form 10-K.
Biotechnology Segment
Through our Biotechnology segment, we are one of the world’s leading suppliers of specialized proteins, such as
cytokines, growth factors, immunoassays, antibodies and related reagents, to the biotechnology research community.
The proteins are produced naturally in minute amounts by different cell types and can be isolated in a pure form
either from the same cells or produced through recombinant DNA technology. With the acquisition of Tocris in
April 2011, we added chemically-based products to our Biotechnology segment. These small compounds, sold in
highly purified forms typically with agonistic or antagonistic properties in a variety of biological processes, allow
customers access to a broad range of compounds and biological reagents to meet their life science research needs.
Our combined chemical and biological reagents portfolio provides new tools which customers can use in solving the
complexity of important biological pathways and glean knowledge which may lead to a fuller understanding of
biological processes and ultimately to the development of novel strategies to address different pathologies.
Currently, the majority of the protein products are produced by laboratory processes that use recombinant DNA
technology, while our chemically-based products are produced using available chemicals. Consequently, raw
materials are readily available for most of our products in the Biotechnology segment.
Biotechnology Segment Products
Proteins. Cytokines, growth factors and enzymes, extracted from natural sources or produced using
recombinant DNA technology, are developed and manufactured in house. All protein products are produced to
the highest possible purity and characterized to ensure the highest level of biological activity. The growing
interest by academic and commercial researchers in cytokines is largely due to the profound effect that tiny
amounts of a cytokine can have on cells and tissues. Cytokines are intercellular messengers and, as a result, act
as signaling agents by interacting with specific receptors on the affected cells and trigger events that can lead to
significant changes in a cell behavior. For example, cytokines can induce cells to acquire more specialized
functions and features (differentiation) or can play a key role in attracting cells at the site of injury, inducing
them to grow and initiate the healing process. Unregulated cytokine production and action can have non-
beneficial effects and lead to various pathologies. Enzymes are proteins which act as biological catalysts that
accelerate chemical reactions. Most enzymes, including proteases, kinases and phosphatases, are proteins that
modify the structure and function of other proteins and in turn affect cell behavior and function. Additionally,
both enzymes and cytokines have the potential to serve as predictive biomarkers and therapeutic targets for a
variety of diseases and conditions including cancer, Alzheimer’s, arthritis, autoimmunity, diabetes,
hypertension, obesity, inflammation, AIDS and influenza.

3
Antibodies. Antibodies are specialized proteins produced by the immune system of an animal that recognize
and bind to target molecules. Bio-Techne’s polyclonal antibodies are produced in animals (primarily goats,
sheep and rabbits) and purified from the animals’ blood. Monoclonal antibodies are derived from immortalized
rodent cell lines using hybridoma technology and are isolated from cell culture medium. The flow cytometry
product line includes fluorochrome labeled antibodies and kits that are used to determine the immuno-
phenotypic properties of cells from different tissues.
Immunoassays. We market a variety of immunoassays on different testing platforms, including a microtiter-
plate based kit sold under the trade name Quantikine®, multiplex immunoassays based on encoded bead
technology and immunoassays based on planar spotted surfaces. All of these immunoassay products are used
by researchers to quantify the level of a specific protein in biological fluids, such as serum, plasma, or urine.
Protein quantification is an integral component of basic research, as potential diagnostic tools for various
diseases and as a valuable indicator of the effects of new therapeutic compounds in the drug discovery process.
Immunoassays can also be useful in clinical diagnostics. We have received Food and Drug Administration
(FDA) marketing clearance for erythropoietin (EPO), transferrin receptor (TfR) and Beta2-microglobulin (2M)
immunoassays for use as in vitro diagnostic devices.
Small Molecule Chemically-based Products. These products include small natural or synthetic chemical
compounds used by investigators as agonists, antagonists and/or inhibitors of various biological functions. Used
in concert with other Company products, they provide additional tools to elucidate key pathways of cellular
functions and can provide insight into the drug discovery process.
Recent acquisitions and investments made in fiscal 2014 and 2015 will further expand and complement Bio-
Techne’s current product offerings in the Biotechnology segment. For additional information regarding our
investments and acquisitions, see “Acquisitions and Investments” under this Item 1.
Biotechnology Segment Customers and Distribution Methods
We sell our biotechnology products directly to customers who are primarily located in North America, Western
Europe and China. In January 2014, we entered into a sales and marketing partnership agreement with Fisher
Scientific in order to bolster our market presence in North America and leverage the transactional efficiencies
offered by the large Fisher organization. We also sell through third party distributors in China, southern Europe and
in the rest of the world. Our sales are widely distributed, and no single end-user customer accounted for more than
10% of Biotechnology’s net sales during fiscal 2014, 2013 or 2012.
Biotechnology Segment Competitors
The worldwide market for protein related and chemically-based research reagents is being supplied by a number of
companies, including GE Healthcare Life Sciences, BD Biosciences, Merck KGaA/EMD Chemicals, Inc.,
PeproTech, Inc., Santa Cruz Biotechnology, Inc., Abcam plc., Sigma-Aldrich Corporation, Thermo Fisher
Scientific, Inc., Cayman Chemical Company and Enzo Biochem, Inc. Market success is primarily dependent upon
product quality, selection and reputation, and we believe we are one of the leading world-wide suppliers of cytokine
related products in the research market. We further believe that the expanding line of our products, their recognized
quality, and the growing demand for protein related and chemically-based research reagents will allow us to remain
competitive in the growing biotechnology research and diagnostic market.
Biotechnology Segment Manufacturing
Our Biotechnology segment develops and manufactures the majority of its cytokines using recombinant DNA
technology, thus significantly reducing our reliance on outside resources. Tocris chemical-based products are
synthesized from widely available products. We typically have several outside sources for all critical raw materials
necessary for the manufacture of our products.
The majority of Bio-Techne’s biotechnology products are shipped within one day of receipt of the customers’
orders. Consequently, we had no significant backlog of orders for our Biotechnology segment products as of the
date of this Annual Report on Form 10-K or as of a comparable date for fiscal 2013.
4
Clinical Controls Segment
Proper diagnosis of many illnesses requires a thorough and accurate analysis of a patient’s blood cells, which is
usually done with automated or semi-automated hematology instruments. Our Clinical Controls segment develops
and manufactures controls and calibrators for instruments in the global clinical market.
Clinical Controls Segment Products
Hematology controls and calibrators are products derived from various cellular components of blood which have
been stabilized. Control and calibrator products can be utilized to ensure that hematology instruments are
performing accurately and reliably. Ordinarily, a hematology control is used once to several times a day to make
sure the instrument is reading accurately. In addition, most instruments need to be calibrated periodically.
Hematology calibrators are similar to controls, but undergo additional testing to ensure that the calibration values
assigned are within tight specifications and can be used to calibrate the instrument.
Cell-based whole blood controls. Our Clinical Controls segment offers a wide range of hematology controls and
calibrators for both impedance and laser type cell counters. Hematology control products are also supplied for
use as proficiency testing tools by laboratory certifying authorities in a number of states and countries. We
believe our products have improved stability and versatility and a longer shelf life than most of those of our
competitors.
Chemistry-based blood controls. The acquisition of Bionostics early in fiscal 2014 expanded our product
offerings in the Clinical Controls segment through their chemistry-based blood controls. Controls for blood
glucose and blood gas devices are the largest portion of Bionostics’ business. Bionostics recently launched
coagulation device control products which extend its product portfolio and allow it to enter an adjacent market
segment in the controls business.
Clinical Controls Segment Customers and Distribution Methods
Original Equipment Manufacturer (OEM) agreements represent the largest market for our clinical controls products.
In fiscal 2014, 2013 and 2012, OEM agreements accounted for $41.2 million, $10.8 million and $9.7 million,
respectively, or 12%, 3% and 3% of total consolidated net sales in each fiscal year, respectively. The increase in
fiscal 2014 was a result of the acquisition of Bionostics. We sell our clinical control products directly to customers
in the United States and through distributors in the rest of the world. One OEM customer accounted for
approximately 14% of Clinical Controls’ net sales during fiscal 2014. No single customer accounted for more than
10% of Clinical Controls’ net sales in fiscal 2013 or 2012.
Clinical Controls Segment Competitors
Competition is intense in the clinical controls business. The first control products were developed in response to the
rapid advances in electronic instrumentation used in hospital and clinical laboratories for blood cell counting.
Historically, most of the instrument manufacturing companies made controls for use on their own instruments. With
rapid expansion of the instrument market, however, a need for more versatile controls enabled non-instrument
manufacturers to gain a foothold. Today the market is composed of manufacturers of laboratory reagents, chemicals
and coagulation products and independent blood control manufacturers in addition to instrument manufacturers.
The principal clinical diagnostic control competitors for our products in this segment are Abbott Diagnostics,
Beckman Coulter, Inc., Bio-Rad Laboratories, Inc., Streck, Inc., Siemens Healthcare Diagnostics Inc. and Sysmex
Corporation. We believe we are the third largest supplier of hematology controls in the marketplace behind
Beckman Coulter, Inc. and Streck, Inc.
Clinical Controls Segment Manufacturing
The primary raw material for our clinical controls products is whole blood. Human blood is purchased from
commercial blood banks, while porcine and bovine blood is purchased from nearby meat processing plants. After
raw blood is received, it is separated into its components, processed and stabilized. Although the cost of human
blood has increased due to the requirement that it be tested for certain diseases and pathogens prior to use, the higher
cost of these materials has not had a material adverse effect on our business. Bio-Techne does not perform its own
pathogen testing, as most suppliers test all human blood collected.
5
There was no significant backlog of orders for our Clinical Control products as of the date of this Annual Report on
Form 10-K or as of a comparable date for fiscal 2013. The majority of the Clinical Control products are shipped
based on a preset, recurring schedule.
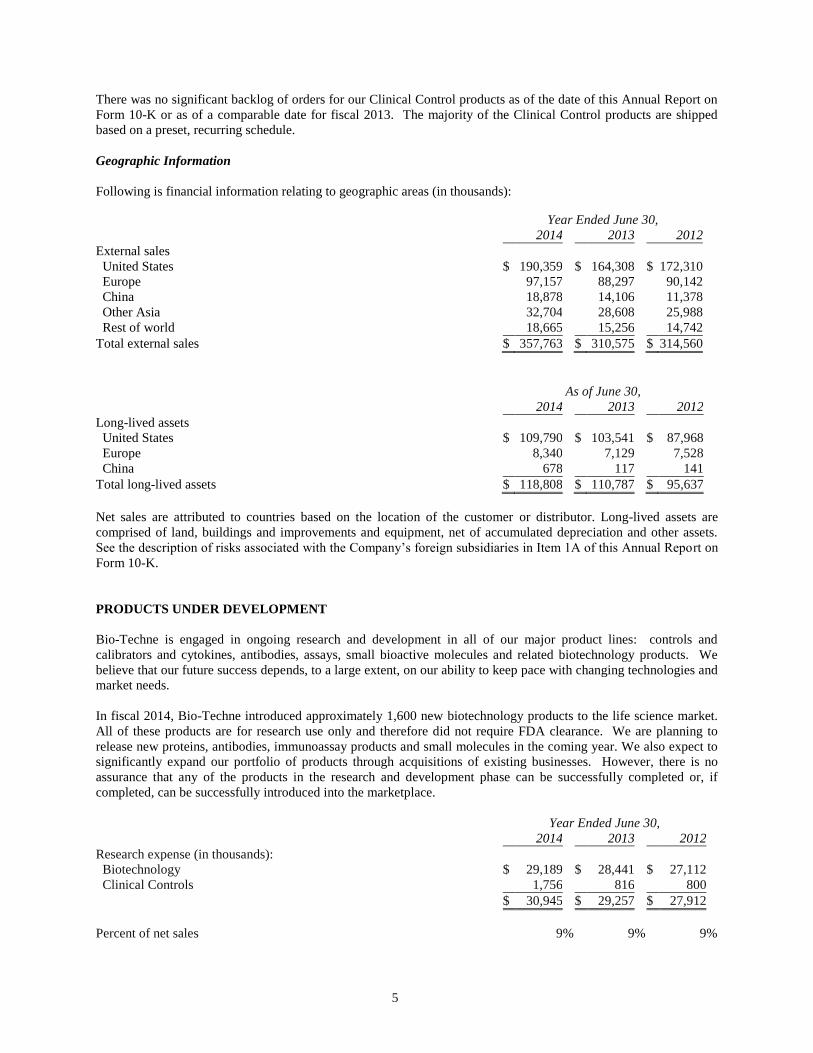
Geographic Information
Following is financial information relating to geographic areas (in thousands):
Year Ended June 30,
2014 2013 2012
External sales
United States $ 190,359 $ 164,308 $ 172,310
Europe 97,157 88,297 90,142
China 18,878 14,106 11,378
Other Asia 32,704 28,608 25,988
Rest of world 18,665 15,256 14,742
Total external sales $ 357,763 $ 310,575 $ 314,560
As of June 30,
2014 2013 2012
Long-lived assets
United States $ 109,790 $ 103,541 $ 87,968
Europe 8,340 7,129 7,528
China 678 117 141
Total long-lived assets $ 118,808 $ 110,787 $ 95,637
Net sales are attributed to countries based on the location of the customer or distributor. Long-lived assets are
comprised of land, buildings and improvements and equipment, net of accumulated depreciation and other assets.
See the description of risks associated with the Company’s foreign subsidiaries in Item 1A of this Annual Report on
Form 10-K.
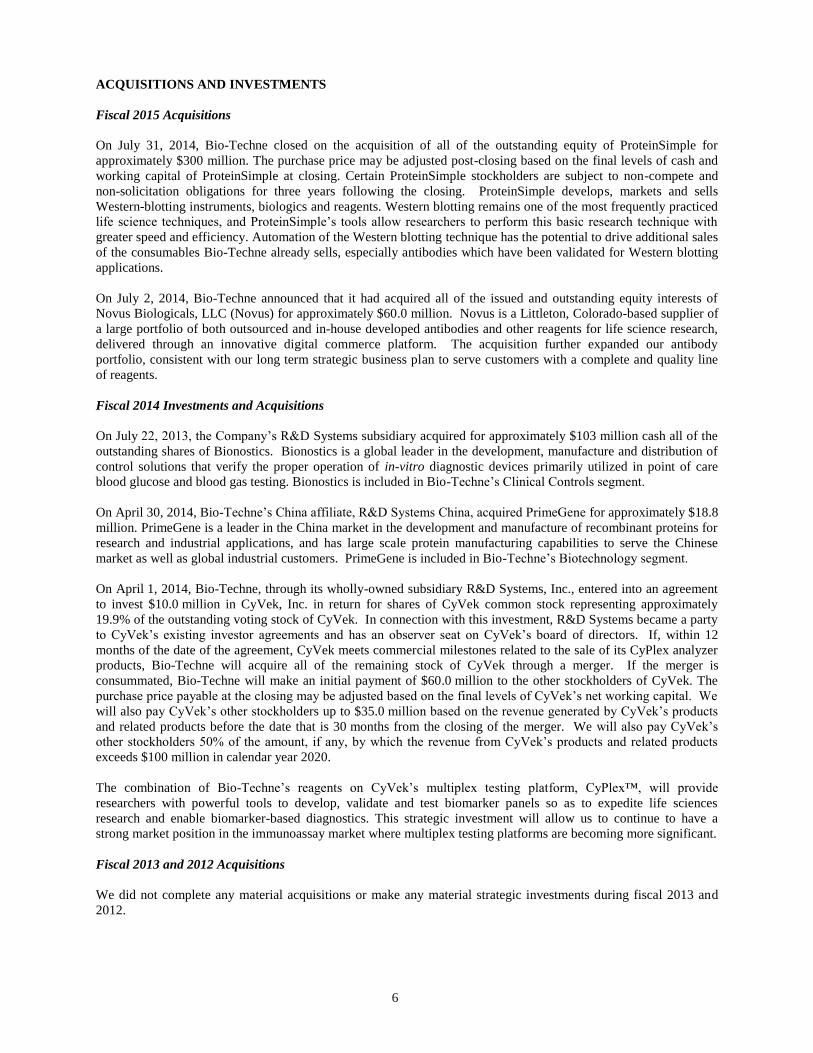
PRODUCTS UNDER DEVELOPMENT
Bio-Techne is engaged in ongoing research and development in all of our major product lines: controls and
calibrators and cytokines, antibodies, assays, small bioactive molecules and related biotechnology products. We
believe that our future success depends, to a large extent, on our ability to keep pace with changing technologies and
market needs.
In fiscal 2014, Bio-Techne introduced approximately 1,600 new biotechnology products to the life science market.
All of these products are for research use only and therefore did not require FDA clearance. We are planning to
release new proteins, antibodies, immunoassay products and small molecules in the coming year. We also expect to
significantly expand our portfolio of products through acquisitions of existing businesses. However, there is no
assurance that any of the products in the research and development phase can be successfully completed or, if
completed, can be successfully introduced into the marketplace.
Year Ended June 30,
2014 2013 2012
Research expense (in thousands):
Biotechnology $ 29,189 $ 28,441 $ 27,112
Clinical Controls 1,756 816 800
$ 30,945 $ 29,257 $ 27,912
Percent of net sales 9 % 9 % 9 %
6
ACQUISITIONS AND INVESTMENTS
Fiscal 2015 Acquisitions
On July 31, 2014, Bio-Techne closed on the acquisition of all of the outstanding equity of ProteinSimple for
approximately $300 million. The purchase price may be adjusted post-closing based on the final levels of cash and
working capital of ProteinSimple at closing. Certain ProteinSimple stockholders are subject to non-compete and
non-solicitation obligations for three years following the closing. ProteinSimple develops, markets and sells
Western-blotting instruments, biologics and reagents. Western blotting remains one of the most frequently practiced
life science techniques, and ProteinSimple’s tools allow researchers to perform this basic research technique with
greater speed and efficiency. Automation of the Western blotting technique has the potential to drive additional sales
of the consumables Bio-Techne already sells, especially antibodies which have been validated for Western blotting
applications.
On July 2, 2014, Bio-Techne announced that it had acquired all of the issued and outstanding equity interests of
Novus Biologicals, LLC (Novus) for approximately $60.0 million. Novus is a Littleton, Colorado-based supplier of
a large portfolio of both outsourced and in-house developed antibodies and other reagents for life science research,
delivered through an innovative digital commerce platform. The acquisition further expanded our antibody
portfolio, consistent with our long term strategic business plan to serve customers with a complete and quality line
of reagents.
Fiscal 2014 Investments and Acquisitions
On July 22, 2013, the Company’s R&D Systems subsidiary acquired for approximately $103 million cash all of the
outstanding shares of Bionostics. Bionostics is a global leader in the development, manufacture and distribution of
control solutions that verify the proper operation of in-vitro diagnostic devices primarily utilized in point of care
blood glucose and blood gas testing. Bionostics is included in Bio-Techne’s Clinical Controls segment.
On April 30, 2014, Bio-Techne’s China affiliate, R&D Systems China, acquired PrimeGene for approximately $18.8
million. PrimeGene is a leader in the China market in the development and manufacture of recombinant proteins for
research and industrial applications, and has large scale protein manufacturing capabilities to serve the Chinese
market as well as global industrial customers. PrimeGene is included in Bio-Techne’s Biotechnology segment.
On April 1, 2014, Bio-Techne, through its wholly-owned subsidiary R&D Systems, Inc., entered into an agreement
to invest $10.0 million in CyVek, Inc. in return for shares of CyVek common stock representing approximately
19.9% of the outstanding voting stock of CyVek. In connection with this investment, R&D Systems became a party
to CyVek’s existing investor agreements and has an observer seat on CyVek’s board of directors. If, within 12
months of the date of the agreement, CyVek meets commercial milestones related to the sale of its CyPlex analyzer
products, Bio-Techne will acquire all of the remaining stock of CyVek through a merger. If the merger is
consummated, Bio-Techne will make an initial payment of $60.0 million to the other stockholders of CyVek. The
purchase price payable at the closing may be adjusted based on the final levels of CyVek’s net working capital. We
will also pay CyVek’s other stockholders up to $35.0 million based on the revenue generated by CyVek’s products
and related products before the date that is 30 months from the closing of the merger. We will also pay CyVek’s
other stockholders 50% of the amount, if any, by which the revenue from CyVek’s products and related products
exceeds $100 million in calendar year 2020.
The combination of Bio-Techne’s reagents on CyVek’s multiplex testing platform, CyPlex™, will provide
researchers with powerful tools to develop, validate and test biomarker panels so as to expedite life sciences
research and enable biomarker-based diagnostics. This strategic investment will allow us to continue to have a
strong market position in the immunoassay market where multiplex testing platforms are becoming more significant.
Fiscal 2013 and 2012 Acquisitions
We did not complete any material acquisitions or make any material strategic investments during fiscal 2013 and
2012.
7
Prior Investments
Bio-Techne has an approximate 14% equity investment in ChemoCentryx, Inc. (CCXI). CCXI is a technology and
drug development company working in the area of chemokines. Chemokines are cytokines which regulate the
trafficking patterns of leukocytes, the effector cells of the human immune system. Bio-Techne’s investment in
CCXI is included in “Short-term available-for-sale investments” at June 30, 2014 and 2013 at fair values of $37.1
million and $89.6 million, respectively.
GOVERNMENT REGULATION
All manufacturers of clinical diagnostic controls are regulated under the Federal Food, Drug and Cosmetic Act, as
amended. All of Bio-Techne’s clinical control products are classified as "in vitro diagnostic products" by the U.S.
Food and Drug Administration (FDA). The entire control manufacturing process, from receipt of raw materials to
the monitoring of control products through their expiration date, is strictly regulated and documented. FDA
inspectors make periodic site inspections of Bio-Techne’s clinical control operations and facilities. Clinical control
manufacturing must comply with Quality System Regulations (QSR) as set forth in the FDA’s regulations governing
medical devices.
Three of Bio-Techne’s immunoassay kits, EPO, TfR and 2M, have FDA clearance to be sold for clinical diagnostic
use. Bio-Techne must comply with QSR for the manufacture of these kits. Biotechnology products manufactured in
the U.S. and sold for use in the research market do not require FDA clearance. Tocris products are used as research
tools and require no regulatory approval for commercialization. Some of Tocris’ products are considered controlled
substances and require government permits to stock such products and to ship them to end-users. Bio-Techne has no
reason to believe that these annual permits will not be re-issued.
Some of Bio-Techne’s research groups use small amounts of radioactive materials in the form of radioisotopes in
their product development activities. Thus, Bio-Techne is subject to regulation and inspection by the Minnesota
Department of Health and has been granted a license through August 2016. Bio-Techne has had no difficulties in
renewing this license in prior years and has no reason to believe it will not be renewed in the future. If, however, the
license was not renewed, it would have minimal effect on Bio-Techne’s business since there are other technologies
the research groups could use to replace the use of radioisotopes.
Beginning on January 1, 2013, Bio-Techne is subject to the medical device excise tax which was included as part of
the Affordable Care Act. The tax applies to the sale of medical devices by a manufacturer, producer or importer of
the device and is 2.3% of the sale price. The tax applies to Bio-Techne’s in vitro diagnostic products, including its
clinical control products and biotechnology clinical diagnostic immunoassay kits. Bio-Techne’s medical device
excise tax for fiscal 2014 and 2013 was $0.5 million and $0.1 million, respectively.
PATENTS AND TRADEMARKS
Bio-Techne owns patent protection for certain clinical controls products which generally have a life of 20 years from
the date of the patent application or patent grant. Bio-Techne is not substantially dependent on products for which it
has obtained patent protection.
Bio-Techne may seek patent protection for new or existing products it manufactures. No assurance can be given
that any such patent protection will be obtained. No assurance can be given that Bio-Techne’s products do not
infringe upon patents or proprietary rights owned or claimed by others, particularly for genetically engineered
products. Bio-Techne has not conducted a patent infringement study for each of its products.
Bio-Techne has a number of licensing agreements with patent holders under which it has the exclusive and/or non-
exclusive right to use patented technology as well as the right to manufacture and sell certain patented proteins and
related products to the research market. For fiscal 2014, 2013 and 2012, total royalties expensed under these
licenses were approximately $3.5 million, $3.3 million and $3.2 million, respectively.

8
Bio-Techne has obtained federal trademark registration for certain of its brand names and clinical controls and
biotechnology product groups which generally have a life of 10 years from the date of the trademark grant. Bio-
Techne believes it has common law trademark rights to certain marks in addition to those which it has registered.
SEASONALITY OF BUSINESS
Biotechnology segment products marketed by Bio-Techne historically experience a slowing of sales or of the rate of
sales growth during the summer months. Bio-Techne also usually experiences a slowing of sales in both of its
reportable segments during the Thanksgiving to New Year holiday period. Bio-Techne believes this seasonality is a
result of vacation and academic schedules of its world-wide customer base.
EMPLOYEES
Through its subsidiaries, Bio-Techne employed 967 full-time and 54 part-time employees as of June 30, 2014, as
follows:
Full-
time
Part-
time
U.S. 782 25
Europe 107 29
Asia 78 0
967 54
ENVIRONMENT
Compliance with federal, state and local environmental protection laws in the United States, United Kingdom,
Germany, China and Hong Kong had no material effect on Bio-Techne in fiscal 2014.
INVESTOR INFORMATION
We are subject to the information requirements of the Securities Exchange Act of 1934 (the Exchange Act).
Therefore, we file periodic reports, proxy statements, and other information with the Securities and Exchange
Commission (SEC). Such reports, proxy statements, and other information may be obtained by visiting the Public
Reference Room of the SEC at 100 F Street, N.E., Room 1580, Washington, DC 20549 or by calling the SEC at 1-
800-SEC-0330. In addition, the SEC maintains an internet site (http://www.sec.gov) that contains reports, proxy and
information statements, and other information regarding issuers that file electronically.
Financial and other information about us is available on our web site (http://www.bio-techne.com). We make
available on our web site copies of our Annual Report on Form 10-K, Quarterly Reports on Form 10-Q, Current
Reports on Form 8-K, and amendments to those reports filed or furnished pursuant to Section 13 or 15(d) of the
Exchange Act as soon as reasonably practicable after filing such material electronically or otherwise furnishing it to
the SEC.
EXECUTIVE OFFICERS OF THE REGISTRANT
Currently, the names, ages, positions and periods of service of each executive officer of the Company are as follows:
Name Age Position Officer Since
Charles Kummeth
54
President, Chief Executive Officer and Director
2013
James T. Hippel 43 Chief Financial Officer 2014
Brenda Furlow 56 Senior Vice President, General Counsel 2014
J. Fernando Bazan 54 Chief Technical Officer 2013
Marcel Veronneau 60 Senior Vice President, Clinical Controls 1995
Kevin Reagan 62 Senior Vice President, Biotech 2013
David Eansor 53 Senior Vice President, Novus Biologicals 2014

9
Set forth below is information regarding the business experience of each executive officer. There are no family
relationships among any of the officers named, nor is there any arrangement or understanding pursuant to which any
person was selected as an officer.
Charles Kummeth has been President and Chief Executive Officer of the Company since April 1, 2013. Prior to
joining the Company, he served as President of Mass Spectrometry and Chromatography at Thermo Fisher
Scientific Inc. from September 2011. He was President of that company’s Laboratory Consumables Division from
2009 to September 2011. Prior to joining Thermo Fisher, Mr. Kummeth served in various roles at 3M Corporation,
most recently as the Vice President of the company’s Medical Division from 2006 to 2008.
James T. Hippel has been Chief Financial Officer of the Company since April 1, 2014. Prior to joining the
Company, Mr. Hippel served as Senior Vice President and Chief Financial Officer for Mirion Technologies, Inc., a
$300 million global company that provides radiation detection and identification products. Prior to Mirion, Mr.
Hippel served as Vice President, Finance at Thermo Fisher Scientific, Inc., leading finance operations for its Mass
Spectrometry & Chromatography division and its Laboratory Consumables division. In addition, Mr. Hippel’s
experience includes nine years of progressive financial leadership at Honeywell International, within its Aerospace
Segment. Mr. Hippel started his career with KPMG LLP and is a CPA (inactive).
Brenda Furlow joined the Company as Senior Vice President and General Counsel on August 4, 2014. Most
recently, Ms. Furlow was an associate with Alphatech Counsel, SC and served as general counsel to emerging
growth technology companies. Ms. Furlow was General Counsel for TomoTherapy, Inc., a global, publicly traded
company that manufactured and sold radiation therapy equipment from 2007 to 2011. From 1998 to 2007, Ms.
Furlow served as General Counsel for Promega Corporation, a global life sciences company. In addition, Ms.
Furlow’s experience includes five years in various positions with a credit union trade association. Ms. Furlow began
her legal career as an associate with a Chicago-based law firm.
Dr. J. Fernando Bazan was appointed Chief Technical Officer when he joined the Company on August 1, 2013. Dr.
Bazan is an adjunct profession at the University of Minnesota School of Medicine and served as Chief Scientific
Officer at Neuroscience, Inc., a neuroimmunology startup from 2010 to 2012. From 2003 through 2010, Dr. Bazan
served as Senior Scientist at Genentech, Inc. (Roche).
Marcel Veronneau was appointed as Vice President, Clinical Controls in March 1995. Prior thereto, he served as
Director of Operations for R&D Systems’ Clinical Controls Division since joining the Company in 1993.
Dr. Kevin Reagan was appointed Senior Vice President, Biotech on August 1, 2013. Dr. Reagan joined the
Company in January 2012 as R&D Systems’ Vice President of Immunology. Prior to joining the Company, Dr.
Reagan served as Managing Director of Calbiotech Veterinary Diagnostics from 2010 through 2011 and Senior Vice
President of Calbiotech, Inc from 2009 through 2011. From 2005 through 2009, he served as Vice President, R&D,
Immunological Systems at Invitrogen, Corp, a division of Life Technologies Corporation.
David Eansor has served as Senior Vice President, Novus Biologicals, since the Company completed its acquisition
of Novus on July 2, 2014. From January 2013 until the date of the acquisition, Mr. Eansor was the Senior Vice
President of Corporate Development of Novus Biologicals. Prior to joining Novus, Mr. Eansor was the President of
the Bioscience Division of Thermo Fisher Scientific. Mr. Eansor was promoted to Division President in early 2010
after 5 years as President of Thermo Fisher’s Life Science Research business.
10
ITEM 1A. RISK FACTORS
Statements in this Annual Report on Form 10-K, and elsewhere, that are forward-looking involve risks and
uncertainties which may affect the Company’s actual results of operations. Certain of these risks and uncertainties
which have affected and, in the future, could affect the Company’s actual results are discussed below. The
Company undertakes no obligation to update or revise any forward-looking statements made due to new information
or future events. Investors are cautioned not to place undue emphasis on these statements.
The following risk factors should be read carefully in connection with evaluation of the Company’s business and
any forward-looking statements made in this Annual Report on Form 10-K and elsewhere. Any of the following
risks or others discussed in this Annual Report on Form 10-K or the Company’s other SEC filings could materially
adversely affect the Company’s business, operating results and financial condition.
Changes in economic conditions could negatively impact the Company’s revenues and earnings.
The Company’s biotechnology products are sold primarily to research scientists at pharmaceutical and
biotechnology companies and at university and government research institutions. Research and development
spending by the Company’s customers and the availability of government research funding can fluctuate due to
changes in available resources, mergers of pharmaceutical and biotechnology companies, spending priorities,
general economic conditions and institutional and governmental budgetary policies. The U.S. and global
economies have experienced a period of economic downturn. Such downturns, and other reductions or delays in
governmental funding, could cause customers to delay or forego purchases of the Company’s products. The
Company carries essentially no backlog of orders and changes in the level of orders received and filled daily
can cause fluctuations in quarterly revenues and earnings.
The biotechnology and clinical control industries are very competitive, more so recently due to consolidation
trends.
The Company faces significant competition across all of its product lines and in each market in which it
operates. Competitors include companies ranging from start-up companies, which may be able to more quickly
respond to customers’ needs, to large multinational companies, which may have greater financial, marketing,
operational, and research and development resources than the Company. In addition, consolidation trends in the
pharmaceutical and biotechnology industries have served to create fewer customer accounts and to concentrate
purchasing decisions for some customers, resulting in increased pricing pressure on the Company. Moreover,
customers may believe that consolidated businesses are better able to compete as sole source vendors, and
therefore prefer to purchase from such businesses. The entry into the market by manufacturers in China and
other low-cost manufacturing locations is also creating increased pricing and competitive pressures, particularly
in developing markets. Failure to anticipate and respond to competitors’ actions may impact the Company’s
future sales and earnings.
The Company’s future growth is dependent on the development of new products in a rapidly changing
technological environment.
One element of the Company’s growth strategy is to increase revenues through new product releases. As a
result, the Company must anticipate industry trends and develop products in advance of customer needs. New
product development requires planning, designing and testing at both technological and manufacturing-process
levels and may require significant research and development expenditures. There can be no assurance that any
products now in development, or that the Company may seek to develop in the future, will achieve feasibility or
gain market acceptance. There can also be no assurance that the Company’s competitors will not succeed in
developing technologies and products in a more timely and cost effective manner than the Company. If the
Company does not appropriately innovate and invest in new technologies, the Company’s technologies will
become outdated, rendering the Company’s technologies and products obsolete or noncompetitive. To the
extent the company fails to introduce new and innovative products, the Company may lose market share to its
competitors, which may be difficult or impossible to regain.

11
Acquisitions and divestures pose financial, management and other risks and challenges.
The Company routinely explores acquiring other businesses and assets. From time to time, the Company may
also consider disposing of certain assets, subsidiaries, or lines of business. In early fiscal 2014, the Company
finalized the acquisition of Bionostics. In the last quarter of fiscal 2014, the Company acquired PrimeGene and
announced its investment in CyVek and its intention to acquire the remaining shares of CyVek in the event
certain milestones were met. Subsequent to the close of fiscal 2014, the Company also acquired Novus and
ProteinSimple. Acquisitions or divestitures present financial, managerial and operational challenges, including
diversion of management attention, difficulty with integrating acquired businesses, integration of different
corporate cultures or separating personnel and financial and other systems, increased expenses, assumption of
unknown liabilities, indemnities, and potential disputes with the buyers or sellers, and the need to evaluate the
financial systems of and establish internal controls for acquired entities. There can be no assurance that the
Company will engage in any acquisitions or divestitures or that the Company will be able to do so on terms that
will result in any expected benefits. In addition, acquisitions financed with borrowings could make the
Company more vulnerable to business downturns and could negatively affect the Company’s earnings due to
higher leverage and interest expense.
The Company is subject to risk associated with global operations.
The Company engages in business globally, with approximately 47% of the Company’s sales revenue in fiscal
2014 coming from outside the U.S. This subjects the Company to a number of risks, including international
economic, political, and labor conditions; tax laws (including U.S. taxes on foreign subsidiaries); increased
financial accounting and reporting burdens and complexities; unexpected changes in, or impositions of,
legislative or regulatory requirements; failure of laws to protect intellectual property rights adequately;
inadequate local infrastructure and difficulties in managing and staffing international operations; delays
resulting from difficulty in obtaining export licenses for certain technology; tariffs, quotas and other trade
barriers and restrictions; transportation delays; operating in locations with a higher incidence of corruption and
fraudulent business practices; and other factors beyond the Company’s control, including terrorism, war, natural
disasters, climate change and diseases.
The application of laws and regulations implicating global transactions is often unclear and may at times
conflict. Compliance with these laws and regulations may involve significant costs or require changes in the
Company’s business practices that result in reduced revenue and profitability. Non-compliance could also result
in fines, damages, criminal sanctions, prohibitions business conduct, and damage to the Company’s reputation.
The Company incurs additional legal compliance costs associated with its global operations and could become
subject to legal penalties in foreign countries if it does not comply with local laws and regulations, which may
be substantially different from those in the U.S.
The Company conducts and plans to grow its business in developing markets.
The Company’s efforts to grow its businesses depends, to a degree, on its success in developing market share in
additional geographic markets including, but not limited to, China. In some cases, these countries have greater
political and economic volatility and greater vulnerability to infrastructure and labor disruptions than the
Company’s other markets. Operating and seeking to expand business in a number of different regions and
countries exposes the Company to multiple and potentially conflicting cultural practices, business practices and
legal and regulatory requirements.
In many foreign countries, particularly in those with developing economies, it may be common to engage in
business practices that are prohibited by U.S. regulations applicable to the Company, such as the Foreign
Corrupt Practices Act. Although the Company implements policies and procedures designed to ensure
compliance with these laws, there can be no assurance that all of the Company’s employees, contractors, and
agents, as well as those companies to which the Company outsources certain aspects of its business operations,
including those based in foreign countries where practices which violate such U.S. laws may be customary, will
comply with the Company’s internal policies. Any such non-compliance, even if prohibited by the Company’s
internal policies, could have an adverse effect on the Company’s business and result in significant fines or
penalties.

12
The Company is significantly dependent on sales made through foreign subsidiaries which are subject to
changes in exchange rates and changes to the strength of foreign governments and economic conditions.
Approximately 30% of the Company’s net sales in fiscal 2014 were made through its foreign subsidiaries,
which transact their sales in foreign currencies. Any adverse movement in foreign currency exchange rates
could, therefore, negatively affect the Company’s revenues and earnings. Moreover, the financial crisis faced by
several Eurozone countries, and the ongoing economic instability in that region, may lead to reduced spending
on health care and research by Eurozone governments, which could adversely affect the Company’s European
sales, as well as its revenues, financial condition and results of operations.
The Company may incur losses as a result of its investments in ChemoCentryx, Inc., CyVek, Inc. and other
companies in which is does not have a majority interest, the success of which is largely out of the Company’s
control.
The Company’s expansion strategies include collaborations and investments in joint ventures and companies
developing new products related to the Company’s business. These strategies carry risks that objectives will
not be achieved and future earnings will be adversely affected.
The Company has an approximate 14% equity investment in ChemoCentryx, Inc. (CCXI) that is valued at $37.1
million on the Company’s June 30, 2014 Consolidated Balance Sheet. CCXI is a biopharmaceutical company
focused on discovering, developing and commercializing orally-administered therapeutics to treat autoimmune
diseases, inflammatory diseases and cancers. The development of new drugs is a highly risky undertaking.
CCXI is dependent on a limited number of products, must achieve favorable clinical trial results, obtain
regulatory and marketing approval for these products and is reliant on a strategic alliance with
GlaxoSmithKline. CCXI has also incurred significant losses and has yet to achieve profitability.
The ownership of CCXI shares is very concentrated, the share price is highly volatile and there is limited
trading of the shares. These factors make it possible that the Company could experience future dilution or a
decline in the $7.6 million unrealized gain it has on its CCXI investment and/or its original $29.5 million
investment in CCXI. At August 22, 2014, the market value of the Company’s investment in CCXI was $30.9
million.
On April 1, 2014, the Company invested $10 million in CyVek, Inc. in exchange for shares of CyVek’s
common stock representing approximately 19.9% of the outstanding voting stock of CyVek. In connection with
this investment, the Company also became a party to CyVek’s existing investor agreements and has an observer
seat on CyVek’s board of directors. CyVek is an instrument company that has developed a microfluidics
instrument platform and related reagents for performing immunoassays and other assays for the research
market. Cyvek has incurred significant losses and has not yet achieved profitability. There is no assurance that
the Company’s investment in CyVek will bring sufficient returns, and may in fact result in losses.
The Company’s success will be dependent on recruiting and retaining highly qualified personnel.
Recruiting and retaining qualified scientific, production and management personnel are critical to the
Company’s success. The Company’s anticipated growth and its expected expansion into areas and activities
requiring additional expertise will require the addition of new personnel and the development of additional
expertise by existing personnel. The failure to attract and retain such personnel could adversely affect the
Company’s business.
The Company is dependent on maintaining its intellectual property rights.
The Company’s success depends in part on its ability to protect and maintain its intellectual property, including
trade secrets. The Company attempts to protect trade secrets in part through confidentiality agreements, but
those agreements can be breached, and if they are, there may not be an adequate remedy. If trade secrets
become publicly known, the Company could lose its competitive position.
13
In addition, the Company’s success depends in part on its ability to operate without infringing the proprietary
rights of others, and to obtain licenses where necessary or appropriate. The Company has obtained and
continues to negotiate licenses to produce a number of products claimed to be owned by others. Since the
Company has not conducted a patent infringement study for each of its products, it is possible that products of
the Company may unintentionally infringe patents of third parties.
The Company has been and may in the future be sued by third parties alleging that the Company is infringing
their intellectual property rights. These lawsuits are expensive, take significant time, and divert management’s
focus from other business concerns. If the Company is found to be infringing the intellectual property of others,
it could be required to cease certain activities, alter its products or processes or pay licensing fees. This would
cause unexpected costs and delays which may have a material adverse effect on the Company. If the Company
is unable to obtain a required license on acceptable terms, or unable to design around any third party patent, it
may be unable to sell some of its products and services, which could result in reduced revenue. In addition, if
the Company does not prevail, a court may find damages or award other remedies in favor of the opposing party
in any of these suits, which may adversely affect the Company’s earnings.
The Company has entered into and drawn on a revolving credit facility. The burden of this additional debt
could adversely affect the Company, make it more vulnerable to adverse economic or industry conditions,
and prevent it from funding its expansion strategy.
In connection with the acquisition of ProteinSimple in July 2014, the Company entered into a revolving credit
facility, governed by a Credit Agreement dated July 28, 2014. The Credit Agreement provides for a revolving
credit facility of $150 million, which can be increased by an additional $150 million subject to certain
conditions. Borrowings under the Credit Agreement bear interest at a variable rate. As of July 31, 2014, the
Company had drawn $125 million under the Credit Agreement.
The terms of the Credit Agreement and the burden of the indebtedness incurred thereunder could have negative
consequences for us, such as:
limiting our ability to obtain additional financing to fund our working capital, capital expenditures,
debt service requirements, expansion strategy, or other needs;
increasing the Company’s vulnerability to, and reducing its flexibility in planning for, adverse changes
in economic, industry and competitive conditions; and
increasing the Company’s vulnerability to increases in interest rates.
The Credit Agreement also contains negative covenants that limit our ability to engage in specified types of
transactions. These covenants limit our ability to, among other things, sell, lease or transfer any properties or
assets, with certain exceptions; and enter into certain merger, consolidation or other reorganization transactions,
with certain exceptions.
A breach of any of these covenants could result in an event of default under our credit facility. Upon the
occurrence of an event of default, the lender could elect to declare all amounts outstanding under such facility to
be immediately due and payable and terminate all commitments to extend further credit. In addition, the
Company would be subject to additional restrictions if an event of default exists under the Credit Agreement,
such as a prohibition on the payment of cash dividends.

14
The Company’s business is subject to governmental laws and regulations.
The Company’s operations are subject to regulation by various US federal, state and international agencies.
Laws and regulations enacted and enforced by these agencies impact all aspects of the Company’s operations
including design, development, manufacturing, labeling, selling and the importing and exporting of products
across international borders. Any changes to laws and regulations governing such activities could have an
effect on the Company’s operations and ability to obtain regulatory clearance or approval of the Company’s
products. If the Company fails to comply with any of these regulations, it may become subject to fines,
penalties or actions that could impact development, manufacturing and distribution and/or increase costs or
reduce sales. The approval process applicable to clinical control products of the type that may be developed by
the Company may take a year or more. Delays in obtaining approvals could adversely affect the marketing of
new products developed by the Company, and negatively affect the Company’s revenues.
As a multinational corporation, the Company is subject to the tax laws and regulations of U.S. federal, state and
local governments and of several international jurisdictions. From time to time, new tax legislation may be
implemented which could adversely affect current or future tax filings or negatively impact the Company’s
effective tax rate and thus increase future tax payments.
The Company relies heavily on internal manufacturing and related operations to produce, package and
distribute its products.
The Company manufactures the majority of the products it sells at its Minneapolis, Minnesota facility. Quality
control, packaging and distribution operations support all of the Company’s sales. Since the Company creates
value for its customers through the development of high-quality products, any significant decline in quality or
disruption of operations for any reason, particularly at the Minneapolis facility, could adversely affect sales and
customer relationships, and therefore adversely affect the business. While the Company has taken certain steps
to manage these operational risks, and while insurance coverage may reimburse, in whole or in part, for losses
related to such disruptions, the Company’s future sales growth and earnings may be adversely affected by
perceived disruption risks or actual disruptions.
The design and manufacture of products involves certain inherent risks. Manufacturing or design defects could
lead to recalls, litigation or alerts relating to the Company’s products. A recall could result in significant costs
and damage to the Company’s reputation which could reduce demand, particularly for certain of its regulated
products.
Disruptions in the supply and cost of raw materials could reduce the Company’s earnings, cash flow, and
ability to meet customers’ needs.
The Company’s products are made from a wide variety of raw materials that are generally available from
alternate sources of supply. However, some of the Company’s products are available only from a single
supplier. If such suppliers were to limit or terminate production or otherwise fail to supply these materials for
any reason, such failures could have a material adverse impact on the Company’s product sales and business. In
addition, price increases for raw materials could adversely affect the Company’s earnings and cash flow.
Increased exposure to product liability claims could adversely affect the Company’s earnings.
Product liability is a major risk in testing and marketing biotechnology and pharmaceutical products offered by
the Company’s customers. Currently these risks are primarily borne by the Company’s customers. As the
Company’s products and services are further integrated into customers’ production processes, the Company
may become increasingly exposed to product liability and other claims in the event that the use of its products
or services is alleged to have resulted in adverse effects. There can be no assurance that a future product liability
claim or series of claims brought against the Company would not have an adverse effect on the Company’s
business or the results of operations. The Company’s business may be materially and adversely affected by a
successful product liability claim or claims in excess of any insurance coverage that it may have. In addition,
product liability claims, regardless of their merits, could be costly, divert management’s attention, and adversely
affect the Company’s reputation and demand for its products.

15
Any such product liability claims brought against the Company could be significant and any adverse
determination may result in liabilities in excess of the Company’s insurance coverage. Although the Company
carries product liability insurance, it cannot be certain that current insurance will be sufficient to cover these
claims or that it can be maintained on acceptable terms, if at all.
Cyber security risks and the failure to maintain the confidentiality, integrity, and availability of the
Company’s computer hardware, software, and Internet applications and related tools and functions could
result in damage to the Company’s reputation and/or subject the Company to costs, fines, or lawsuits.
The integrity and protection of the Company’s own data, and that of its customers and employees, is critical to
the Company’s business. The regulatory environment governing information, security and privacy laws is
increasingly demanding and continues to evolve. Maintaining compliance with applicable security and privacy
regulations may increase the Company’s operating costs and/or adversely impact the Company’s ability to
market its products and services to customers. Although the Company’s computer and communications
hardware is protected through physical and software safeguards, it is still vulnerable to fire, storm, flood, power
loss, earthquakes, telecommunications failures, physical or software break-ins, software viruses, and similar
events. These events could lead to the unauthorized access, disclosure and use of non-public information. The
techniques used by criminal elements to attack computer systems are sophisticated, change frequently and may
originate from less regulated and remote areas of the world. As a result, the Company may not be able to
address these techniques proactively or implement adequate preventative measures. If the Company’s computer
systems are compromised, it could be subject to fines, damages, litigation, and enforcement actions, customers
could curtail or cease using its applications, and the Company could lose trade secrets, the occurrence of which
could harm its business.
ITEM 1B. UNRESOLVED STAFF COMMENTS
There are no unresolved staff comments as of the date of this report.
ITEM 2. PROPERTIES
The Company owns the facilities that its headquarters and R&D Systems subsidiary occupy in Minneapolis,
Minnesota. The Minneapolis facilities are utilized by both the Company’s Clinical Controls and Biotechnology
segments.
The Minneapolis complex includes approximately 800,000 square feet of space in several adjoining buildings. Bio-
Techne uses approximately 625,000 square feet of the complex for administrative, research, manufacturing, shipping
and warehousing activities. The Company is currently leasing or plans to lease the remaining space in the complex
as retail and office space.
The Company owns approximately 649 acres of farmland, including buildings, in southeast Minnesota. A portion of
the land and buildings are leased to third parties as cropland and for a dairy operation. The remaining property is
used by the Company to house animals for polyclonal antibody production for its Biotechnology segment.
Rental income from the above properties was $1.0 million, $0.8 million and $0.7 million in fiscal 2014, 2013 and
2012, respectively.
The Company owns the 17,000 square foot facility that its R&D Europe subsidiary occupies in Abingdon, England.
This facility is utilized by the Company’s Biotechnology segment.
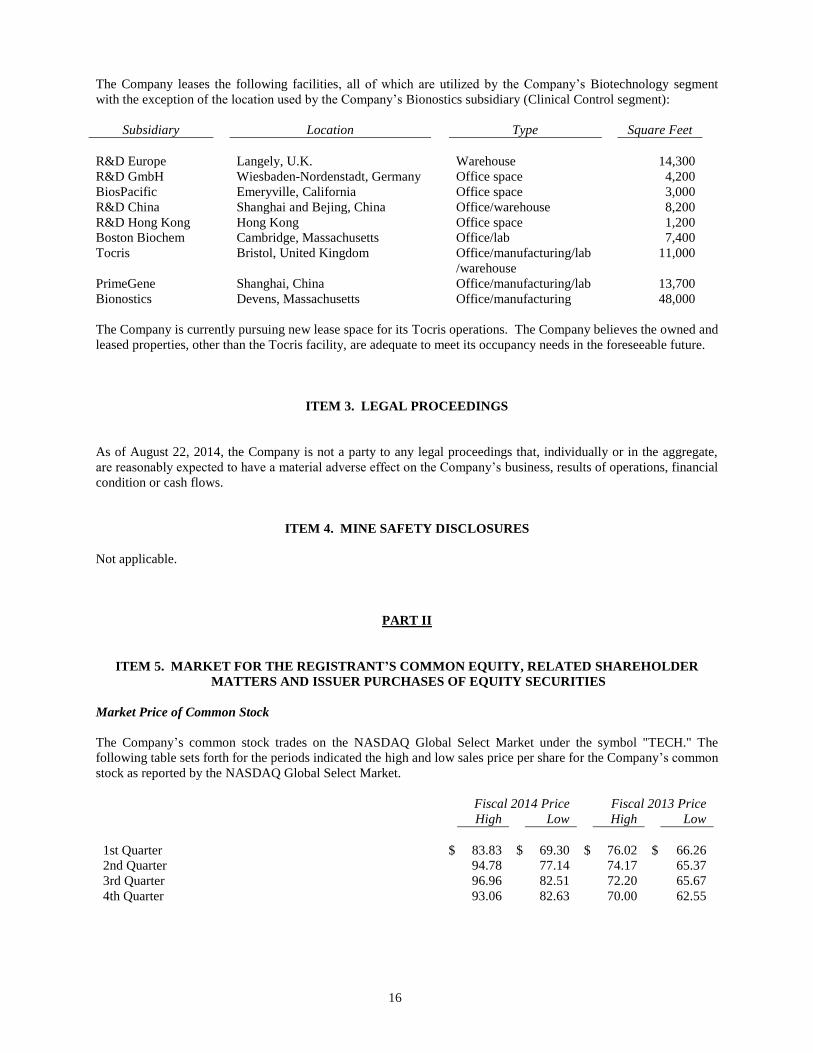
16
The Company leases the following facilities, all of which are utilized by the Company’s Biotechnology segment
with the exception of the location used by the Company’s Bionostics subsidiary (Clinical Control segment):
Subsidiary Location Type Square Feet
R&D Europe Langely, U.K. Warehouse 14,300
R&D GmbH Wiesbaden-Nordenstadt, Germany Office space 4,200
BiosPacific Emeryville, California Office space 3,000
R&D China Shanghai and Bejing, China Office/warehouse 8,200
R&D Hong Kong Hong Kong Office space 1,200
Boston Biochem Cambridge, Massachusetts Office/lab 7,400
Tocris Bristol, United Kingdom Office/manufacturing/lab
/warehouse
11,000
PrimeGene Shanghai, China Office/manufacturing/lab 13,700
Bionostics Devens, Massachusetts Office/manufacturing 48,000
The Company is currently pursuing new lease space for its Tocris operations. The Company believes the owned and
leased properties, other than the Tocris facility, are adequate to meet its occupancy needs in the foreseeable future.
ITEM 3. LEGAL PROCEEDINGS
As of August 22, 2014, the Company is not a party to any legal proceedings that, individually or in the aggregate,
are reasonably expected to have a material adverse effect on the Company’s business, results of operations, financial
condition or cash flows.
ITEM 4. MINE SAFETY DISCLOSURES
Not applicable.
PART II
ITEM 5. MARKET FOR THE REGISTRANT’S COMMON EQUITY, RELATED SHAREHOLDER
MATTERS AND ISSUER PURCHASES OF EQUITY SECURITIES
Market Price of Common Stock
The Company’s common stock trades on the NASDAQ Global Select Market under the symbol "TECH." The
following table sets forth for the periods indicated the high and low sales price per share for the Company’s common
stock as reported by the NASDAQ Global Select Market.
Fiscal 2014 Price Fiscal 2013 Price
High Low High Low
1st Quarter $ 83.83 $ 69.30 $ 76.02 $ 66.26
2nd Quarter 94.78 77.14 74.17 65.37
3rd Quarter 96.96 82.51 72.20 65.67
4th Quarter 93.06 82.63 70.00 62.55
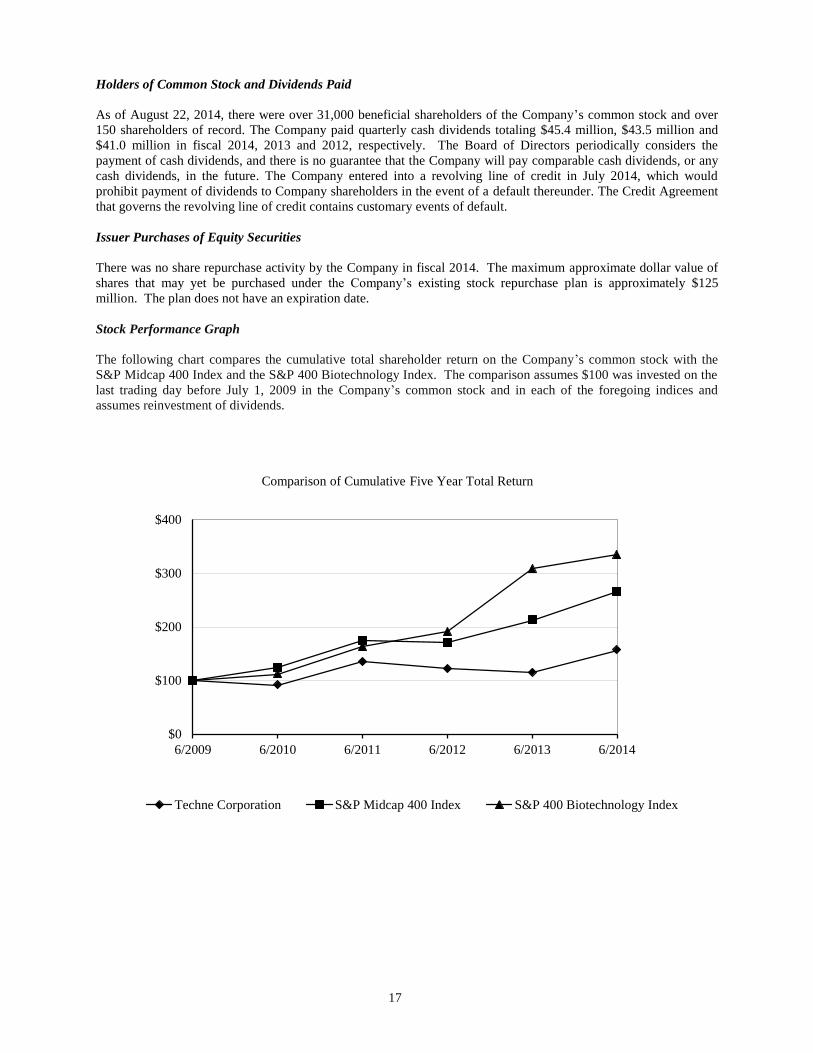
17
Holders of Common Stock and Dividends Paid
As of August 22, 2014, there were over 31,000 beneficial shareholders of the Company’s common stock and over
150 shareholders of record. The Company paid quarterly cash dividends totaling $45.4 million, $43.5 million and
$41.0 million in fiscal 2014, 2013 and 2012, respectively. The Board of Directors periodically considers the
payment of cash dividends, and there is no guarantee that the Company will pay comparable cash dividends, or any
cash dividends, in the future. The Company entered into a revolving line of credit in July 2014, which would
prohibit payment of dividends to Company shareholders in the event of a default thereunder. The Credit Agreement
that governs the revolving line of credit contains customary events of default.
Issuer Purchases of Equity Securities
There was no share repurchase activity by the Company in fiscal 2014. The maximum approximate dollar value of
shares that may yet be purchased under the Company’s existing stock repurchase plan is approximately $125
million. The plan does not have an expiration date.
Stock Performance Graph
The following chart compares the cumulative total shareholder return on the Company’s common stock with the
S&P Midcap 400 Index and the S&P 400 Biotechnology Index. The comparison assumes $100 was invested on the
last trading day before July 1, 2009 in the Company’s common stock and in each of the foregoing indices and
assumes reinvestment of dividends.
$0
$100
$200
$300
$400
6/2009 6/2010 6/2011 6/2012 6/2013 6/2014
Comparison of Cumulative Five Year Total Return
Techne Corporation S&P Midcap 400 Index S&P 400 Biotechnology Index
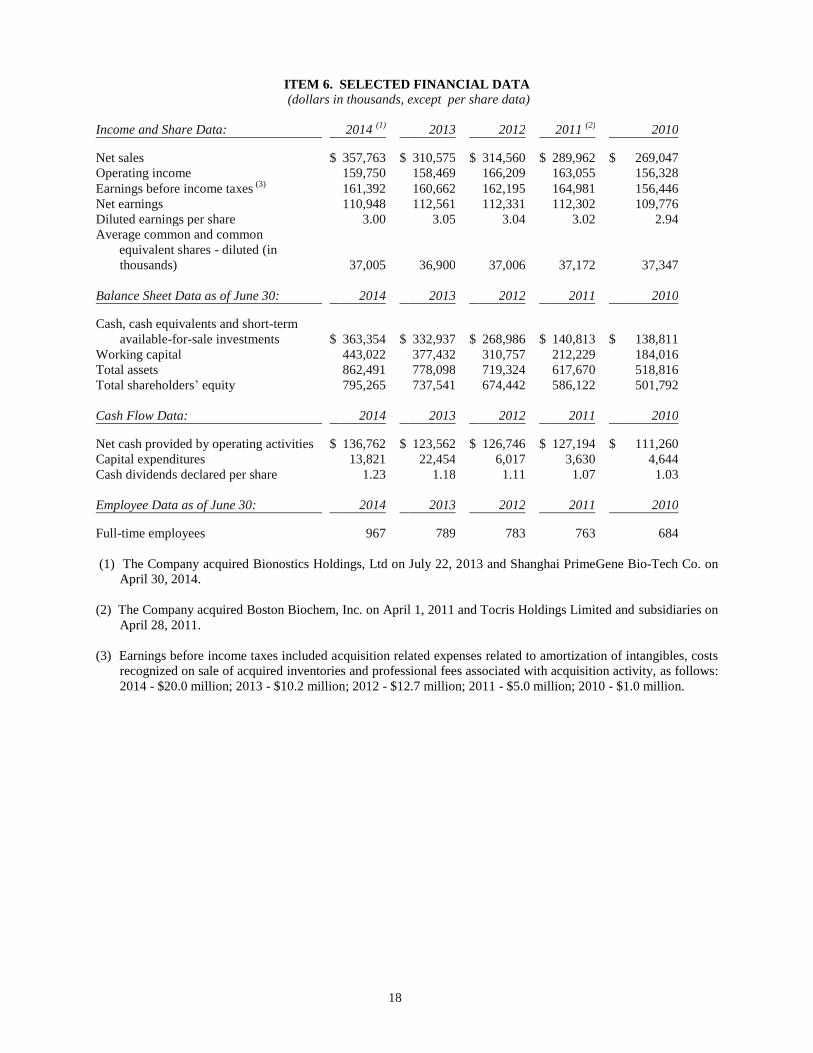
18
ITEM 6. SELECTED FINANCIAL DATA
(dollars in thousands, except per share data)
Income and Share Data: 2014 (1)
2013 2012 2011 (2)
2010
Net sales $ 357,763 $ 310,575 $ 314,560 $ 289,962 $ 269,047
Operating income 159,750 158,469 166,209 163,055 156,328
Earnings before income taxes (3)
161,392 160,662 162,195 164,981 156,446
Net earnings 110,948 112,561 112,331 112,302 109,776
Diluted earnings per share 3.00 3.05 3.04 3.02 2.94
Average common and common
equivalent shares - diluted (in
thousands) 37,005 36,900 37,006 37,172 37,347
Balance Sheet Data as of June 30: 2014 2013 2012 2011 2010
Cash, cash equivalents and short-term
available-for-sale investments $ 363,354 $ 332,937 $ 268,986 $ 140,813 $ 138,811
Working capital 443,022 377,432 310,757 212,229 184,016
Total assets 862,491 778,098 719,324 617,670 518,816
Total shareholders’ equity 795,265 737,541 674,442 586,122 501,792
Cash Flow Data: 2014 2013 2012 2011 2010
Net cash provided by operating activities $ 136,762 $ 123,562 $ 126,746 $ 127,194 $ 111,260
Capital expenditures 13,821 22,454 6,017 3,630 4,644
Cash dividends declared per share 1.23 1.18 1.11 1.07 1.03
Employee Data as of June 30: 2014 2013 2012 2011 2010
Full-time employees 967 789 783 763 684
(1) The Company acquired Bionostics Holdings, Ltd on July 22, 2013 and Shanghai PrimeGene Bio-Tech Co. on
April 30, 2014.
(2) The Company acquired Boston Biochem, Inc. on April 1, 2011 and Tocris Holdings Limited and subsidiaries on
April 28, 2011.
(3) Earnings before income taxes included acquisition related expenses related to amortization of intangibles, costs
recognized on sale of acquired inventories and professional fees associated with acquisition activity, as follows:
2014 - $20.0 million; 2013 - $10.2 million; 2012 - $12.7 million; 2011 - $5.0 million; 2010 - $1.0 million.
19
ITEM 7. MANAGEMENT’S DISCUSSION AND ANALYSIS OF FINANCIAL
CONDITION AND RESULTS OF OPERATIONS
FORWARD-LOOKING INFORMATION
This report contains forward-looking statements, which are based on the Company’s current assumptions and
expectations. The principal forward-looking statements in this report include: the Company’s expectations regarding
product releases and strategy, acquisition activity, governmental license renewals, capital expenditures, the
performance of the Company’s investments, future dividend declarations, the construction and lease of certain
facilities, the adequacy of owned and leased property for future operations, anticipated financial results and
sufficiency of capital resources to meet the Company’s foreseeable future cash and working capital requirements.
All such forward-looking statements are intended to enjoy the protection of the safe harbor for forward-looking
statements contained in the Private Securities Litigation Reform Act of 1995, as amended. Although the Company
believes there is a reasonable basis for the forward-looking statements, the Company’s actual results could be
materially different. The most important factors which could cause the Company’s actual results to differ from
forward-looking statements are set forth in the Company’s description of risk factors in Item 1A to this Annual
Report on Form 10-K.
Forward-looking statements speak only as of the date they are made, and the Company does not undertake any
obligation to update any forward-looking statements.
USE OF ADJUSTED FINANCIAL MEASURES
The adjusted financial measures used in this Annual Report on Form 10-K quantify the impact the following events
had on reported net sales, gross margin percentages and net earnings for fiscal 2014 as compared to fiscal 2013 and
2012:
fluctuations in exchange rates used to convert transactions in foreign currencies (primarily the Euro, British
pound sterling and Chinese yuan) to U.S. dollars;
the acquisition of Bionostics Holdings, Ltd. (Bionostics) on July 22, 2013 and Shanghai PrimeGene Bio-
Tech Co. (PrimeGene) on April 30, 2014, including the impact of amortizing intangible assets and the
recognition of costs upon the sale of inventory written-up to fair value;
professional fees and other costs incurred as part of the acquisition of Bionostics and PrimeGene in fiscal
2014, the acquisitions of Novus Biologicals LLC (Novus) and ProteinSimple, which closed in July 2014,
and on-going acquisition activity;
income tax adjustments related to the reinstatement of the U.S. credit for research and development
expenditures in fiscal 2013, the expiration of the credit on December 31, 2013, and the reversal of valuation
allowances on deferred tax assets in fiscal 2012; and
impairment losses related to the Company’s investments in unconsolidated entities.
These adjusted financial measures are not prepared in accordance with generally accepted accounting principles
(GAAP) and may be different from adjusted financial measures used by other companies. Adjusted financial
measures should not be considered as a substitute for, or superior to, measures of financial performance prepared in
accordance with GAAP. The Company views these adjusted financial measures to be helpful in assessing the
Company's ongoing operating results. In addition, these adjusted financial measures facilitate our internal
comparisons to historical operating results and comparisons to competitors' operating results. These adjusted
financial measures are included in this Annual Report on Form 10-K because the Company believes they are useful
to investors in allowing for greater transparency related to supplemental information used in the Company’s
financial and operational analysis. Investors are encouraged to review the reconciliations of adjusted financial
measures used in this Annual Report on Form 10-K to their most directly comparable GAAP financial measures.
20
OVERVIEW
Bio-Techne develops, manufactures and sells biotechnology products and clinical diagnostic controls worldwide.
With our deep product portfolio and application expertise, Bio-Techne is a leader in providing specialized proteins,
including cytokines and growth factors, and related immunoassays, small molecules and other reagents to the
research, diagnostics and clinical controls markets.
Bio-Techne operates worldwide and has two reportable business segments, Biotechnology and Clinical Controls,
both of which service the life science and diagnostic markets. The Biotechnology reporting segment develops,
manufactures and sells biotechnology research and diagnostic products world-wide. The Clinical Controls reporting
segment develops and manufactures controls and calibrators for the global clinical market.
OVERALL RESULTS
For fiscal 2014, consolidated net sales increased 15% as compared to fiscal 2013. After adjusting for the impact of
the Bionostics and PrimeGene acquisitions in fiscal 2014, as well as foreign currency fluctuations, organic sales for
the year increased 3%. The growth was broad-based, with the Company achieving organic growth in both reporting
segments and in most regions of the world. Commercial investments made globally in fiscal 2014, especially in
China, were the biggest contributing factor impacting organic revenue growth.
Consolidated GAAP net earnings decreased 1% for fiscal 2014 as compared to fiscal 2013. After adjusting for
acquisition related costs and certain income tax items in both years, adjusted net earnings increased 6% in fiscal
2014 as compared to fiscal 2013. Adjusted earnings growth was driven by increased sales partially offset by a lower
margin mix from the acquired Bionostics business, as well as investments made in commercial operations and
administrative infrastructure during fiscal 2014.
For fiscal 2013, consolidated net sales decreased 1% as compared to fiscal 2012. There were no acquisitions made
in fiscal 2013 or fiscal 2012 and the impact from foreign currency fluctuation was minimal. The U.S. market in the
Biotechnology segment was particularly soft in 2013, with lower National Institute of Health (NIH) funding for our
academic customers coupled with industry consolidation in the pharma and biotech markets.
Consolidated GAAP net earnings were flat for fiscal 2013 as compared to fiscal 2012. After adjusting for acquisition
related costs and certain income tax and impairment items in both years, adjusted net earnings decreased 3% in
fiscal 2013 as compared to fiscal 2012. The lower earnings in fiscal 2013 resulted from lower revenue coupled with
a 5% increase in research and development investment and a 4% increase in selling, general and administrative costs
primarily related to investments made in global commercial resources, administrative infrastructure, and annual
wage, salary and benefits increases.
RESULTS OF OPERATIONS
Net Sales Consolidated organic net sales, excluding the impact of net sales contributed by companies acquired during the
fiscal year and the effect of the change from the prior year in exchange rates used to convert sales in foreign
currencies (primarily British pound sterling, euros and Chinese yuan) into U.S. dollars, were as follows (in
thousands):
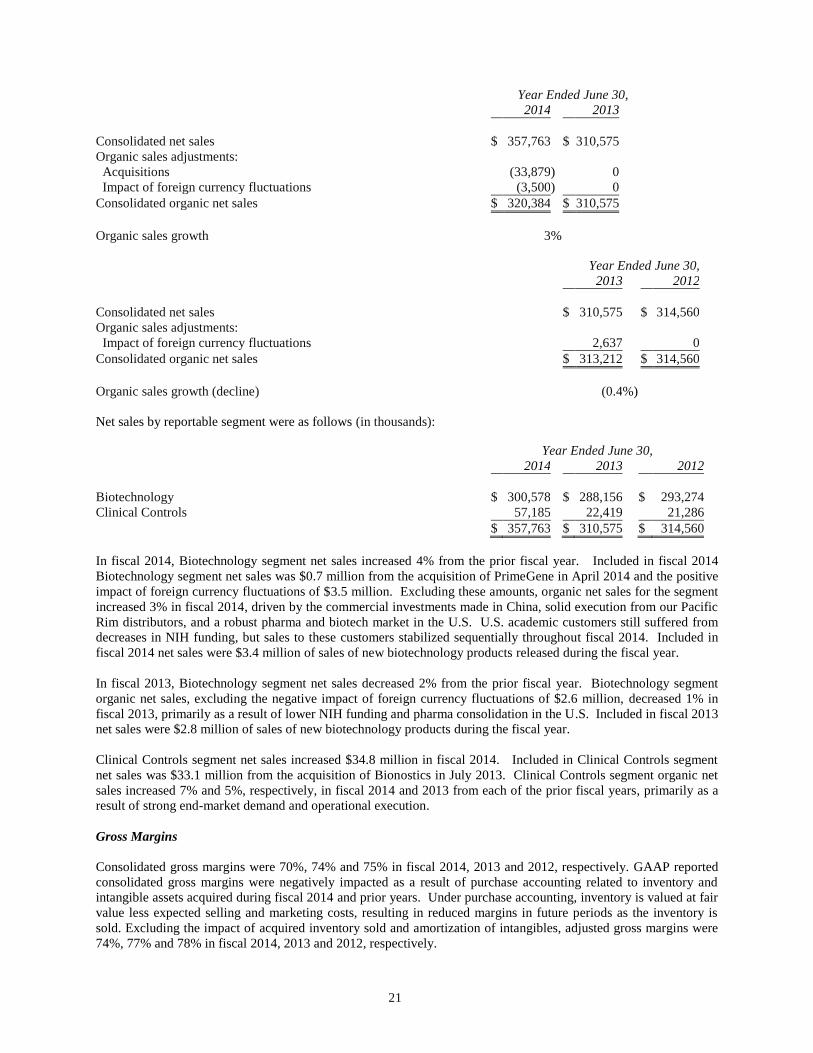
21
Year Ended June 30,
2014 2013
Consolidated net sales $ 357,763 $ 310,575
Organic sales adjustments:
Acquisitions (33,879 ) 0
Impact of foreign currency fluctuations (3,500 ) 0
Consolidated organic net sales $ 320,384 $ 310,575
Organic sales growth 3 %
Year Ended June 30,
2013 2012
Consolidated net sales $ 310,575 $ 314,560
Organic sales adjustments:
Impact of foreign currency fluctuations 2,637 0
Consolidated organic net sales $ 313,212 $ 314,560
Organic sales growth (decline) (0.4 %) Net sales by reportable segment were as follows (in thousands): Year Ended June 30,
2014 2013 2012
Biotechnology $ 300,578 $ 288,156 $ 293,274
Clinical Controls 57,185 22,419 21,286
$ 357,763 $ 310,575 $ 314,560
In fiscal 2014, Biotechnology segment net sales increased 4% from the prior fiscal year. Included in fiscal 2014
Biotechnology segment net sales was $0.7 million from the acquisition of PrimeGene in April 2014 and the positive
impact of foreign currency fluctuations of $3.5 million. Excluding these amounts, organic net sales for the segment
increased 3% in fiscal 2014, driven by the commercial investments made in China, solid execution from our Pacific
Rim distributors, and a robust pharma and biotech market in the U.S. U.S. academic customers still suffered from
decreases in NIH funding, but sales to these customers stabilized sequentially throughout fiscal 2014. Included in
fiscal 2014 net sales were $3.4 million of sales of new biotechnology products released during the fiscal year.
In fiscal 2013, Biotechnology segment net sales decreased 2% from the prior fiscal year. Biotechnology segment
organic net sales, excluding the negative impact of foreign currency fluctuations of $2.6 million, decreased 1% in
fiscal 2013, primarily as a result of lower NIH funding and pharma consolidation in the U.S. Included in fiscal 2013
net sales were $2.8 million of sales of new biotechnology products during the fiscal year.
Clinical Controls segment net sales increased $34.8 million in fiscal 2014. Included in Clinical Controls segment
net sales was $33.1 million from the acquisition of Bionostics in July 2013. Clinical Controls segment organic net
sales increased 7% and 5%, respectively, in fiscal 2014 and 2013 from each of the prior fiscal years, primarily as a
result of strong end-market demand and operational execution.
Gross Margins
Consolidated gross margins were 70%, 74% and 75% in fiscal 2014, 2013 and 2012, respectively. GAAP reported
consolidated gross margins were negatively impacted as a result of purchase accounting related to inventory and
intangible assets acquired during fiscal 2014 and prior years. Under purchase accounting, inventory is valued at fair
value less expected selling and marketing costs, resulting in reduced margins in future periods as the inventory is
sold. Excluding the impact of acquired inventory sold and amortization of intangibles, adjusted gross margins were
74%, 77% and 78% in fiscal 2014, 2013 and 2012, respectively.
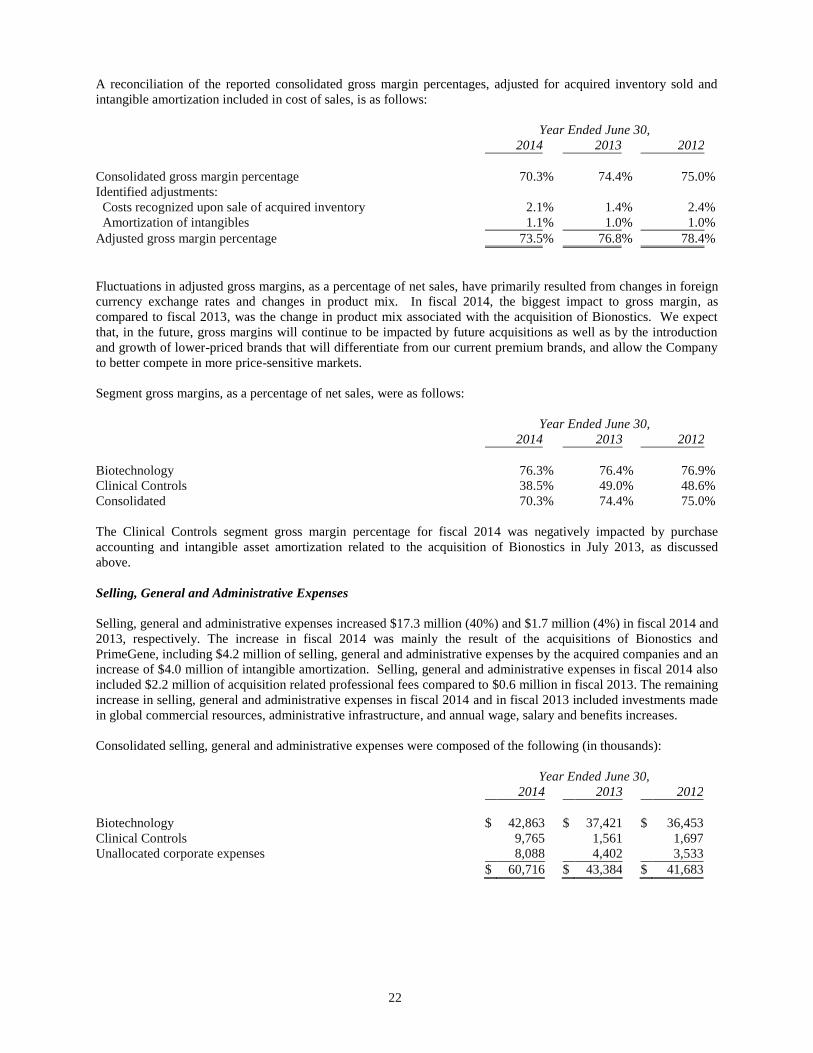
22
A reconciliation of the reported consolidated gross margin percentages, adjusted for acquired inventory sold and
intangible amortization included in cost of sales, is as follows:
Year Ended June 30,
2014 2013 2012
Consolidated gross margin percentage 70.3 % 74.4 % 75.0 %
Identified adjustments:
Costs recognized upon sale of acquired inventory 2.1 % 1.4 % 2.4 %
Amortization of intangibles 1.1 % 1.0 % 1.0 %
Adjusted gross margin percentage 73.5 % 76.8 % 78.4 %
Fluctuations in adjusted gross margins, as a percentage of net sales, have primarily resulted from changes in foreign
currency exchange rates and changes in product mix. In fiscal 2014, the biggest impact to gross margin, as
compared to fiscal 2013, was the change in product mix associated with the acquisition of Bionostics. We expect
that, in the future, gross margins will continue to be impacted by future acquisitions as well as by the introduction
and growth of lower-priced brands that will differentiate from our current premium brands, and allow the Company
to better compete in more price-sensitive markets.
Segment gross margins, as a percentage of net sales, were as follows:
Year Ended June 30,
2014 2013 2012
Biotechnology 76.3 % 76.4 % 76.9 %
Clinical Controls 38.5 % 49.0 % 48.6 %
Consolidated 70.3 % 74.4 % 75.0 %
The Clinical Controls segment gross margin percentage for fiscal 2014 was negatively impacted by purchase
accounting and intangible asset amortization related to the acquisition of Bionostics in July 2013, as discussed
above.
Selling, General and Administrative Expenses
Selling, general and administrative expenses increased $17.3 million (40%) and $1.7 million (4%) in fiscal 2014 and
2013, respectively. The increase in fiscal 2014 was mainly the result of the acquisitions of Bionostics and
PrimeGene, including $4.2 million of selling, general and administrative expenses by the acquired companies and an
increase of $4.0 million of intangible amortization. Selling, general and administrative expenses in fiscal 2014 also
included $2.2 million of acquisition related professional fees compared to $0.6 million in fiscal 2013. The remaining
increase in selling, general and administrative expenses in fiscal 2014 and in fiscal 2013 included investments made
in global commercial resources, administrative infrastructure, and annual wage, salary and benefits increases.
Consolidated selling, general and administrative expenses were composed of the following (in thousands):
Year Ended June 30,
2014 2013 2012
Biotechnology $ 42,863 $ 37,421 $ 36,453
Clinical Controls 9,765 1,561 1,697
Unallocated corporate expenses 8,088 4,402 3,533
$ 60,716 $ 43,384 $ 41,683
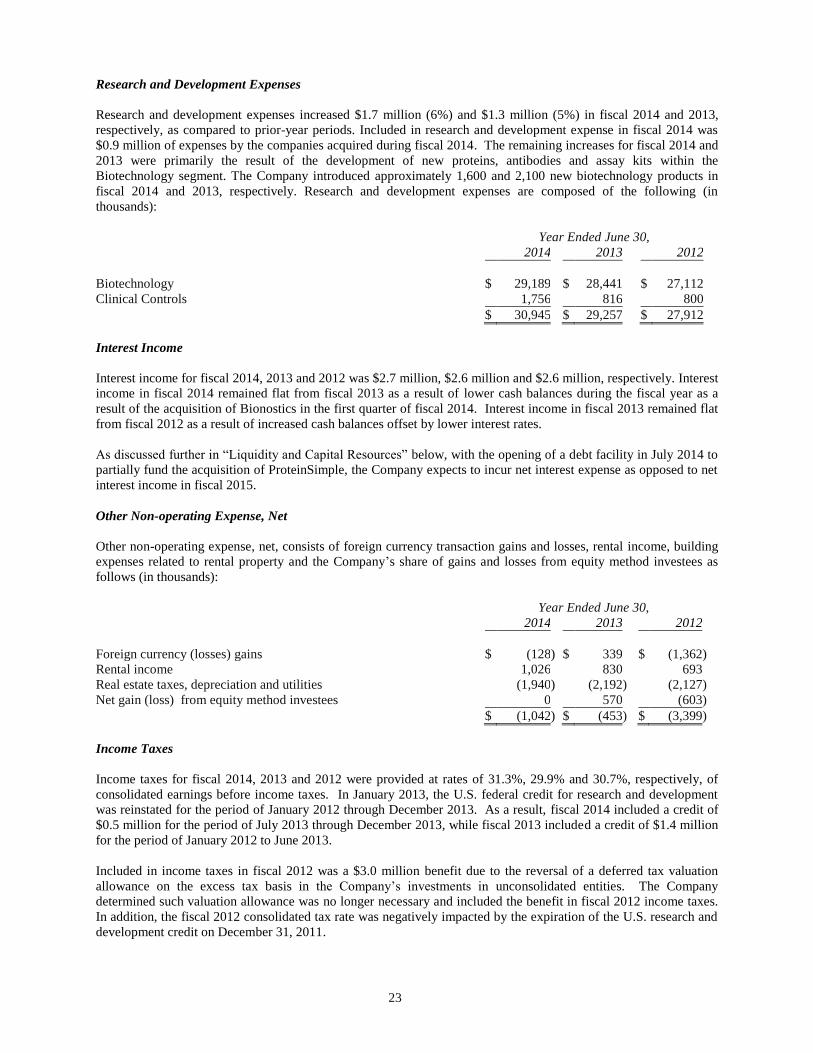
23
Research and Development Expenses
Research and development expenses increased $1.7 million (6%) and $1.3 million (5%) in fiscal 2014 and 2013,
respectively, as compared to prior-year periods. Included in research and development expense in fiscal 2014 was
$0.9 million of expenses by the companies acquired during fiscal 2014. The remaining increases for fiscal 2014 and
2013 were primarily the result of the development of new proteins, antibodies and assay kits within the
Biotechnology segment. The Company introduced approximately 1,600 and 2,100 new biotechnology products in
fiscal 2014 and 2013, respectively. Research and development expenses are composed of the following (in
thousands):
Year Ended June 30,
2014 2013 2012
Biotechnology $ 29,189 $ 28,441 $ 27,112
Clinical Controls 1,756 816 800
$ 30,945 $ 29,257 $ 27,912
Interest Income
Interest income for fiscal 2014, 2013 and 2012 was $2.7 million, $2.6 million and $2.6 million, respectively. Interest
income in fiscal 2014 remained flat from fiscal 2013 as a result of lower cash balances during the fiscal year as a
result of the acquisition of Bionostics in the first quarter of fiscal 2014. Interest income in fiscal 2013 remained flat
from fiscal 2012 as a result of increased cash balances offset by lower interest rates.
As discussed further in “Liquidity and Capital Resources” below, with the opening of a debt facility in July 2014 to
partially fund the acquisition of ProteinSimple, the Company expects to incur net interest expense as opposed to net
interest income in fiscal 2015.
Other Non-operating Expense, Net
Other non-operating expense, net, consists of foreign currency transaction gains and losses, rental income, building
expenses related to rental property and the Company’s share of gains and losses from equity method investees as
follows (in thousands):
Year Ended June 30,
2014 2013 2012
Foreign currency (losses) gains $ (128 ) $ 339 $ (1,362 )
Rental income 1,026 830 693
Real estate taxes, depreciation and utilities (1,940 ) (2,192 ) (2,127 )
Net gain (loss) from equity method investees 0 570 (603 )
$ (1,042 ) $ (453 ) $ (3,399 )
Income Taxes
Income taxes for fiscal 2014, 2013 and 2012 were provided at rates of 31.3%, 29.9% and 30.7%, respectively, of
consolidated earnings before income taxes. In January 2013, the U.S. federal credit for research and development
was reinstated for the period of January 2012 through December 2013. As a result, fiscal 2014 included a credit of
$0.5 million for the period of July 2013 through December 2013, while fiscal 2013 included a credit of $1.4 million
for the period of January 2012 to June 2013.
Included in income taxes in fiscal 2012 was a $3.0 million benefit due to the reversal of a deferred tax valuation
allowance on the excess tax basis in the Company’s investments in unconsolidated entities. The Company
determined such valuation allowance was no longer necessary and included the benefit in fiscal 2012 income taxes.
In addition, the fiscal 2012 consolidated tax rate was negatively impacted by the expiration of the U.S. research and
development credit on December 31, 2011.

24
U.S. federal taxes have been reduced by the manufacturer’s deduction provided for under the American Jobs
Creation Act of 2004 and the U.S. federal credit for research and development. Foreign income taxes have been
provided at rates which approximate the tax rates in the countries in which the Company has operations.
Net Earnings
Adjusted consolidated net earnings are as follows (in thousands):
Year Ended June 30,
2014 2013 2012
Net earnings $ 110,948 $ 112,561 $ 112,331
Identified adjustments:
Costs recognized upon sale of acquired inventory 7,479 4,501 7,573
Amortization of intangibles 10,267 5,061 5,094
Professional and other acquisition related costs 2,247 607 0
Impairment loss on investments 0 0 3,254
Tax impact of above adjustments (5,305 ) (2,596 ) (4,668 )
Tax impact of research and development credit (476 ) (1,392 ) (465 )
Tax impact of foreign source income 165 (710 ) 1,058
Tax benefit from reversal of valuation allowance 0 0 (3,016 )
Adjusted net earnings $ 125,325 $ 118,032 $ 121,161
Adjusted net earnings growth (decline) 6 % (3 %) 4 %
LIQUIDITY AND CAPITAL RESOURCES
Cash, cash equivalents and available-for-sale investments at June 30, 2014 were $367 million compared to $465
million at June 30, 2013. Included in available-for-sale investments at June 30, 2014 and 2013 was the fair value of
the Company’s investment in CCXI of $37.1 million and $89.6 million, respectively.
At June 30, 2014, approximately 76%, 21%, and 3% of the Company’s cash and equivalent account balances of
$319 million were located in the U.S., U.K. and China, respectively. At June 30, 2014, approximately 84% of the
Company’s available-for-sale investment accounts are located in the U.S., with the remaining 16% in China.
The Company has either paid U.S. taxes on its undistributed foreign earnings or intends to indefinitely reinvest the
undistributed earnings in the foreign operations. Management of the Company expects to be able to meet its cash
and working capital requirements for operations, facility expansion, capital additions, and cash dividends for the
foreseeable future, and at least the next 12 months, through currently available funds and cash generated from
operations.
Subsequent to June 30, 2014, the Company acquired Novus for approximately $60.0 million and ProteinSimple for
approximately $300 million. The Novus acquisition was financed through cash on hand. The purchase of
ProteinSimple was financed through cash on hand and a $150 million revolving line of credit facility that was
opened in July 2014, of which $125 million was initially drawn to fund the acquisition. This senior unsecured
revolving credit facility has a term of five years with an adjustable interest rate equal to the greater of (i) the prime
commercial rate, (ii) the per annum federal funds rate plus 0.5%, or (iii) LIBOR + 1.00% - 1.75% depending on the
existing total leverage ratio of Debt to EBITDA (as defined in the Credit Agreement governing the revolving credit
facility). The financial covenants of the revolving credit facility require the Company to maintain a minimum
Interest Coverage Ratio, defined as the ratio of EBIT to cash interest expense, of 4.0x and a maximum total leverage
ratio of 3.5x. The annualized fee for any unused portion of the credit facility is 15 basis points.
Future acquisition strategies may or may not require additional borrowings under the line of credit facility or other
outside sources of funding.
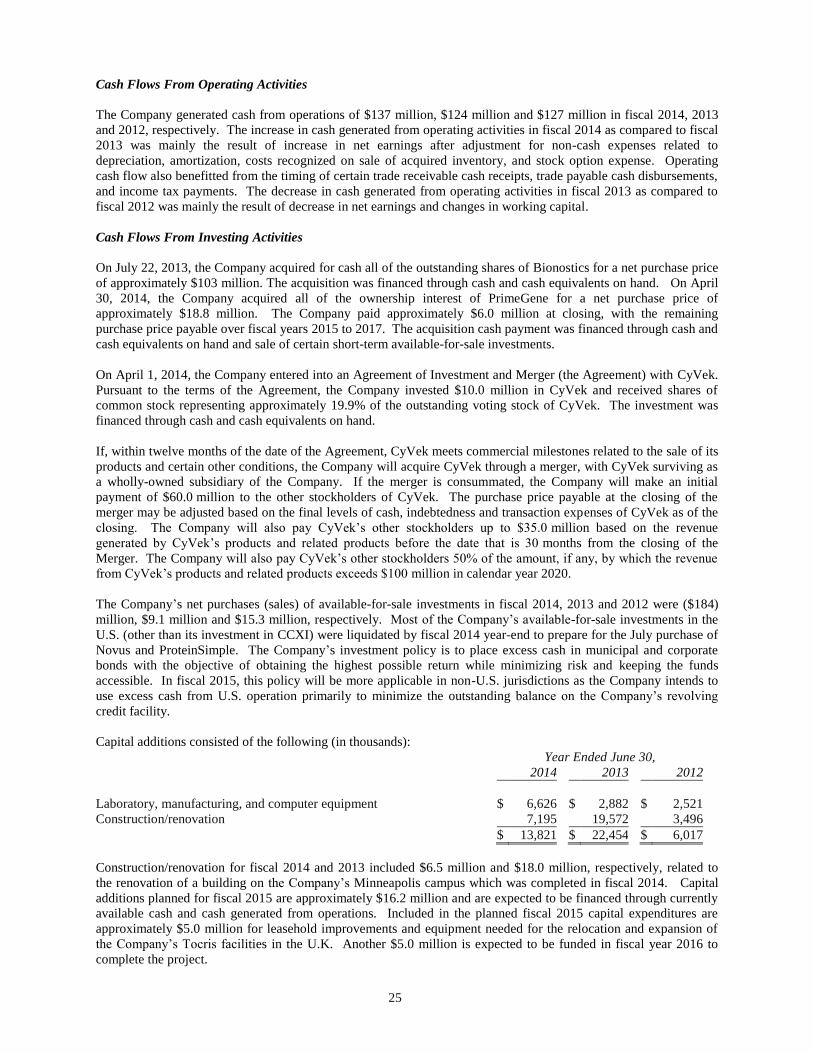
25
Cash Flows From Operating Activities
The Company generated cash from operations of $137 million, $124 million and $127 million in fiscal 2014, 2013
and 2012, respectively. The increase in cash generated from operating activities in fiscal 2014 as compared to fiscal
2013 was mainly the result of increase in net earnings after adjustment for non-cash expenses related to
depreciation, amortization, costs recognized on sale of acquired inventory, and stock option expense. Operating
cash flow also benefitted from the timing of certain trade receivable cash receipts, trade payable cash disbursements,
and income tax payments. The decrease in cash generated from operating activities in fiscal 2013 as compared to
fiscal 2012 was mainly the result of decrease in net earnings and changes in working capital.
Cash Flows From Investing Activities
On July 22, 2013, the Company acquired for cash all of the outstanding shares of Bionostics for a net purchase price
of approximately $103 million. The acquisition was financed through cash and cash equivalents on hand. On April
30, 2014, the Company acquired all of the ownership interest of PrimeGene for a net purchase price of
approximately $18.8 million. The Company paid approximately $6.0 million at closing, with the remaining
purchase price payable over fiscal years 2015 to 2017. The acquisition cash payment was financed through cash and
cash equivalents on hand and sale of certain short-term available-for-sale investments.
On April 1, 2014, the Company entered into an Agreement of Investment and Merger (the Agreement) with CyVek.
Pursuant to the terms of the Agreement, the Company invested $10.0 million in CyVek and received shares of
common stock representing approximately 19.9% of the outstanding voting stock of CyVek. The investment was
financed through cash and cash equivalents on hand.
If, within twelve months of the date of the Agreement, CyVek meets commercial milestones related to the sale of its
products and certain other conditions, the Company will acquire CyVek through a merger, with CyVek surviving as
a wholly-owned subsidiary of the Company. If the merger is consummated, the Company will make an initial
payment of $60.0 million to the other stockholders of CyVek. The purchase price payable at the closing of the
merger may be adjusted based on the final levels of cash, indebtedness and transaction expenses of CyVek as of the
closing. The Company will also pay CyVek’s other stockholders up to $35.0 million based on the revenue
generated by CyVek’s products and related products before the date that is 30 months from the closing of the
Merger. The Company will also pay CyVek’s other stockholders 50% of the amount, if any, by which the revenue
from CyVek’s products and related products exceeds $100 million in calendar year 2020.
The Company’s net purchases (sales) of available-for-sale investments in fiscal 2014, 2013 and 2012 were ($184)
million, $9.1 million and $15.3 million, respectively. Most of the Company’s available-for-sale investments in the
U.S. (other than its investment in CCXI) were liquidated by fiscal 2014 year-end to prepare for the July purchase of
Novus and ProteinSimple. The Company’s investment policy is to place excess cash in municipal and corporate
bonds with the objective of obtaining the highest possible return while minimizing risk and keeping the funds
accessible. In fiscal 2015, this policy will be more applicable in non-U.S. jurisdictions as the Company intends to
use excess cash from U.S. operation primarily to minimize the outstanding balance on the Company’s revolving
credit facility.
Capital additions consisted of the following (in thousands):
Year Ended June 30,
2014 2013 2012
Laboratory, manufacturing, and computer equipment $ 6,626 $ 2,882 $ 2,521
Construction/renovation 7,195 19,572 3,496
$ 13,821 $ 22,454 $ 6,017
Construction/renovation for fiscal 2014 and 2013 included $6.5 million and $18.0 million, respectively, related to
the renovation of a building on the Company’s Minneapolis campus which was completed in fiscal 2014. Capital
additions planned for fiscal 2015 are approximately $16.2 million and are expected to be financed through currently
available cash and cash generated from operations. Included in the planned fiscal 2015 capital expenditures are
approximately $5.0 million for leasehold improvements and equipment needed for the relocation and expansion of
the Company’s Tocris facilities in the U.K. Another $5.0 million is expected to be funded in fiscal year 2016 to
complete the project.

26
Cash Flows From Financing Activities
In fiscal 2014, 2013 and 2012, the Company paid cash dividends of $45.4 million, $43.5 million and $41.0 million,
respectively. The Board of Directors periodically considers the payment of cash dividends.
The Company received $8.3 million, $1.1 million and $0.8 million for the exercise of options for 141,000, 22,000
and 17,000 shares of common stock in fiscal 2014, 2013 and 2012, respectively. The Company recognized excess
tax benefits from stock option exercises of $0.3 million, $0.1 million and $0.1 million in fiscal 2014, 2013 and 2012,
respectively.
In fiscal 2013 and 2012, the Company purchased 8,324 and 13,140 shares of common stock, respectively, for its
employee stock bonus plans at a cost of $0.6 million and $0.9 million, respectively.
In April 2009, the Board of Directors authorized a plan for the repurchase and retirement of $60 million of its
common stock. In October 2012, the Board of Directors increased the amount authorized under the plan by $100
million. The plan does not have an expiration date. In fiscal 2013 and 2012, the Company purchased and retired
28,000 and 344,000 shares of common stock, respectively, at market values of $1.8 million and $23.6 million.
There were no stock repurchases in fiscal 2014. At June 30, 2014, approximately $125 million remained available
for purchase under the above authorizations.
CONTRACTUAL OBLIGATIONS
The following table summarizes the Company’s contractual obligations and commercial commitments as of June 30,
2014 (in thousands):
Payments Due by Period
Total
Less than
1 Year
1-3
Years
3-5
Years
After
5 Years
Operating leases $ 14,696 $ 1,785 $ 3,133 $ 2,052 $ 7,726
Minimum royalty payments 153 153 0 0 0
CyVek acquisition (1)
95,000 60,000 0 35,000 0
$ 109,489 $ 61,938 $ 3,133 $ 37,052 $ 7,726
(1) Amounts represent the maximum potential contingent liability under the CyVek Merger Agreement. In
addition, the Company will pay CyVek’s other stockholders up to 50% of the amount, if any, by which
revenues of CyVek’s products and related products exceeds $100 million in calendar year 2020.
OFF-BALANCE SHEET ARRANGEMENTS
The Company is not a party to any off-balance sheet transactions, arrangements or obligations that have, or are
reasonably likely to have, a current or future material effect on the Company’s financial condition, changes in the
financial condition, revenues or expenses, results of operations, liquidity, capital expenditures or capital resources.
CRITICAL ACCOUNTING POLICIES
Management’s discussion and analysis of the Company’s financial condition and results of operations are based
upon the Company’s Consolidated Financial Statements, which have been prepared in accordance with accounting
principles generally accepted in the United States of America (U.S. GAAP). The preparation of these financial
statements requires management to make estimates and judgments that affect the reported amounts of assets,
liabilities, revenues and expenses, and related disclosure of contingent assets and liabilities. On an ongoing basis,
management evaluates its estimates. Management bases its estimates on historical experience and on various other
assumptions that are believed to be reasonable under the circumstances, the results of which form the basis for
making judgments about the carrying values of assets and liabilities that are not readily apparent from other sources.
Actual results may differ from these estimates under different assumptions or conditions.

27
The Company has identified the policies outlined below as critical to its business operations and an understanding of
results of operations. The listing is not intended to be a comprehensive list of all accounting policies; investors
should also refer to Note A to the Consolidated Financial Statements included in Item 8 of this Annual Report on
Form 10-K .
Valuation of Available-For-Sale Investments
The Company considers all of its marketable securities available-for-sale and reports them at fair market value. Fair
market values are based on assumptions that market participants would use in pricing an asset or liability in the
principal or most advantageous market. Unrealized gains and losses on available-for-sale investments are excluded
from income, but are included, net of taxes, in other comprehensive income. If an “other-than-temporary”
impairment is determined to exist, the difference between the value of the investment recorded in the financial
statements and the Company’s current estimate of fair value is recognized as a charge to earnings in the period in
which the impairment is determined. Net unrealized gains on available-for-sale investments at June 30, 2014 were
$7.6 million.
Valuation of Inventory
Inventories are stated at the lower of cost (first-in, first-out method) or market. The Company regularly reviews
inventory on hand for slow-moving and obsolete inventory, inventory not meeting quality control standards and
inventory subject to expiration.
To meet strict customer quality standards, the Company has established a highly controlled manufacturing process
for proteins, antibodies and its chemically-based products. These products require the initial manufacture of multiple
batches to determine if quality standards can be consistently met. In addition, the Company will produce larger
batches of established products than current sales requirements due to economies of scale. The manufacturing
process for these products, therefore, has and will continue to produce quantities in excess of forecasted usage. The
Company values its manufactured protein and antibody inventory based on a two-year forecast and its chemically-
based products on a five-year forecast. The establishment of a two-year or five-year forecast requires considerable
judgment. Inventory quantities in excess of the forecast are not valued due to uncertainty over salability. The value
of protein, antibody and chemically-based product inventory not valued at June 30, 2014 was $30.3 million.
The fair value of inventory purchased through acquisitions were determined based on quantities acquired, selling
prices at the date of acquisition and management’s assumptions regarding inventory having future value and the
costs to sell such inventories. Inventory purchased in fiscal 2014 through the acquisition of Bionostics was increased
$1.7 million to $5.7 million. Substantially all of Bionostics acquired inventory was sold as of June 30, 2014.
Inventory purchased in fiscal 2014 through the acquisition of PrimeGene was increased $0.8 million to $1.0 million.
The increase in value of the PrimeGene inventory remaining at June 30, 2104 was $0.6 million.
The value of inventory purchased in fiscal 2011 through acquisitions was increased $25.7 million for a total
acquired inventory value of $33.0 million. In addition, the Company acquired inventory that was not valued as part
of the purchase price allocation as it was in excess of forecasted usage. The increase in value of the fiscal 2011
acquired inventory remaining at June 30, 2014 was $7.6 million.
Valuation of Intangible Assets and Goodwill
When a business is acquired, the purchase price is allocated, as applicable, between tangible assets, identifiable
intangible assets and goodwill. Determining the portion of the purchase price allocated to intangible assets requires
significant estimates. The fair value of intangible assets acquired, including developed technologies, trade names,
customer relationships and non-compete agreements, were based on management’s forecasted cash inflows and
outflows using a relief-from-royalty and multi-period excess earnings method with consideration to other factors
including an independent valuation of management’s assumptions. Intangible assets are being amortized over their
estimated useful lives, ranging from 3 to 15 years. The Company reviews the carrying amount of intangible assets
for impairment whenever events or changes in circumstances indicate the carrying amount of an asset may not be
recoverable. Intangible assets, net of accumulated amortization, were $109 million at June 30, 2014.
28
Goodwill recognized in connection with a business acquisition represents the excess of the aggregate purchase price
over the fair value of net assets acquired. Goodwill is tested for impairment annually or more frequently if changes
in circumstance or the occurrence of events suggest impairment exists. Assessing the impairment of goodwill
requires the Company to make judgments regarding the fair value of the net assets of its reporting units and the
allocation of the carrying amount of shared assets to the reporting units. The Company’s annual assessment included
a qualitative assessment of whether it is more-likely-than-not that a reporting unit’s fair value is less than its
carrying value. A significant change in the Company’s market capitalization or in the carrying amount of net assets
of a reporting unit could result in an impairment charge in future periods. The Company completed its annual
impairment testing of goodwill and concluded that no impairment existed as of June 30, 2014, as the fair values of
the Company’s reporting units exceeded their carrying values. Goodwill at June 30, 2014 was $151 million.
Valuation of Investments
The Company has made equity investments in several start-up and early development stage companies, including
CyVek in fiscal 2014. The accounting treatment of each investment (cost method or equity method) is dependent
upon a number of factors, including, but not limited to, the Company’s share in the equity of the investee and the
Company’s ability to exercise significant influence over the operating and financial policies of the investee. In
determining which accounting treatment to apply, the Company must make judgments based upon the quantitative
and qualitative aspects of the investment.
The Company periodically assesses its equity investments for impairment. Development stage companies of the type
the Company has invested in are dependent on their ability to raise additional funds to continue research and
development efforts and on receiving patent protection and/or FDA clearance to market their products. If such
funding were unavailable or inadequate to fund operations or if patent protection or FDA clearance were not
received, the Company would potentially recognize an impairment loss to the extent of its remaining net investment.
ITEM 7A. QUANTITATIVE AND QUALITATIVE DISCLOSURES
ABOUT MARKET RISK
At the end of fiscal 2014, the Company had a portfolio of fixed income debt securities, excluding those classified as
cash and cash equivalents, of $11.3 million (see Note C to the Consolidated Financial Statements included in Item 8
of this Annual Report on Form 10-K). These securities, like all fixed income instruments, are subject to interest rate
risk and will decline in value if market interest rates increase. The Company’s investment policy requires all
investment in short-term and long-term securities to have at least debt ratings of A1 or A3 (or the equivalent),
respectively. As the Company’s fixed income securities are classified as available-for-sale, unrealized gains or
losses are recognized by the Company in “Other comprehensive income (loss)” on the Consolidated Statement of
Earnings and Comprehensive Income. The Company generally holds its fixed income securities until maturity and,
historically, has not recorded any material gains or losses on any sale prior to maturity. In late fiscal 2014, the
Company liquidated the majority of its fixed income debt securities in anticipation of acquisitions made in July
2014. Gains and losses recorded on the liquidation were not material.
The Company operates internationally, and thus is subject to potentially adverse movements in foreign currency
exchange rates. Approximately 30% of consolidated net sales are made in foreign currencies, including 14% in euro,
6% in British pound sterling, 5% in Chinese yuan and the remaining 5% in other European currencies. As a result,
the Company is exposed to market risk mainly from foreign exchange rate fluctuations of the euro, British pound
sterling, and the Chinese yuan as compared to the U.S. dollar as the financial position and operating results of the
Company’s foreign operations are translated into U.S. dollars for consolidation.

29
Month-end exchange rates between the British pound sterling, euro and Chinese yuan and the U.S. dollar, which
have not been weighted for actual sales volume in the applicable months in the periods, were as follows:
Year Ended June 30,
2014 2013 2012
British pound:
High $ 1.71 $ 1.62 $ 1.64
Low 1.52 1.52 1.54
Average 1.64 1.57 1.59
Euro:
High $ 1.39 $ 1.36 $ 1.44
Low 1.32 1.23 1.24
Average 1.36 1.30 1.34
Chinese yuan:
High $ .165 $ .163 $ .159
Low .160 .157 .155
Average .163 .160 .158
The Company’s exposure to foreign exchange rate fluctuations also arises from trade receivables and intercompany
payables denominated in one currency in the financial statements, but receivable or payable in another currency. At
June 30, 2014, the Company had the following trade receivable and intercompany payables denominated in one
currency but receivable or payable in another currency (in thousands):
Denominated
Currency
U. S.
Dollar
Equivalent
Accounts receivable in:
Euros £ 1,296 $ 2,217
Other European currencies £ 1,135 $ 1,942
Intercompany payable in:
Euros £ 451 $ 771
U.S. dollars £ 2,956 $ 5,057
U.S. dollars yuan 20,332 $ 3,305
All of the above balances are revolving in nature and are not deemed to be long-term balances.
The Company does not enter into foreign currency forward contracts to reduce its exposure to foreign currency rate
changes on forecasted intercompany sales transactions or on intercompany foreign currency denominated balance
sheet positions. Foreign currency transaction gains and losses are included in “Other non-operating expense, net” in
the Consolidated Statement of Earnings and Comprehensive Income. The effect of translating net assets of foreign
subsidiaries into U.S. dollars are recorded on the Consolidated Balance Sheet as part of “Accumulated other
comprehensive income (loss).”
The effects of a hypothetical simultaneous 10% appreciation in the U.S. dollar from June 30, 2014 levels against the
euro, British pound sterling and Chinese yuan are as follows (in thousands):
Decrease in translation of 2014 earnings into U.S. dollars $ 2,577
Decrease in translation of net assets of foreign subsidiaries 17,849
Additional transaction losses 836

30
ITEM 8. FINANCIAL STATEMENTS AND SUPPLEMENTARY DATA
CONSOLIDATED STATEMENTS OF EARNINGS AND COMPREHENSIVE INCOME
Techne Corporation and Subsidiaries (in thousands, except per share data)
Year Ended June 30,
2014 2013 2012
Net sales $ 357,763 $ 310,575 $ 314,560
Cost of sales 106,352 79,465 78,756
Gross margin 251,411 231,110 235,804
Operating expenses:
Selling, general and administrative 60,716 43,384 41,683
Research and development 30,945 29,257 27,912
Total operating expenses 91,661 72,641 69,595
Operating income 159,750 158,469 166,209
Other income (expense):
Interest income 2,684 2,646 2,639
Impairment losses on investments 0 0 (3,254 )
Other non-operating expense, net (1,042 ) (453 ) (3,399 )
Total other income (expense) 1,642 2,193 (4,014 )
Earnings before income taxes 161,392 160,662 162,195
Income taxes 50,444 48,101 49,864
Net earnings 110,948 112,561 112,331
Other comprehensive income (loss):
Foreign currency translation adjustments 15,819 (3,538 ) (3,804 )
Unrealized (losses) gains on available-for-sale investments,
net of tax of ($17,110), ($2,129) and $23,422, respectively (35,760 ) (3,684 ) 41,870
Other comprehensive (loss) income (19,941 ) (7,222 ) 38,066
Comprehensive income $ 91,007 $ 105,339 $ 150,397
Earnings per share:
Basic $ 3.01 $ 3.06 $ 3.04
Diluted $ 3.00 $ 3.05 $ 3.04
Cash dividends per common share: $ 1.23 $ 1.18 $ 1.11
Weighted average common shares outstanding:
Basic 36,890 36,836 36,939
Diluted 37,005 36,900 37,006
See Notes to Consolidated Financial Statements.

31
CONSOLIDATED BALANCE SHEETS
Techne Corporation and Subsidiaries (in thousands, except share and per share data)
June 30,
2014 2013
ASSETS
Current assets:
Cash and cash equivalents $ 318,568 $ 163,786
Short-term available-for-sale investments 44,786 169,151
Trade accounts receivable, less allowance for doubtful accounts of
$487 and $428, respectively 47,874 38,183
Other receivables 7,127 1,992
Deferred income taxes 9,623 0
Inventories 38,847 34,877
Prepaid expenses 2,588 1,527
Total current assets 469,413 409,516
Available-for-sale investments 3,575 132,376
Property and equipment, net 117,120 108,756
Goodwill 151,473 84,336
Intangible assets, net 108,776 40,552
Investments in unconsolidated entities 10,446 531
Other assets 1,688 2,031
$ 862,491 $ 778,098
LIABILITIES AND SHAREHOLDERS’ EQUITY
Current liabilities:
Trade accounts payable $ 9,652 $ 6,236
Salaries, wages and related accruals 6,158 4,025
Accrued expenses 4,136 9,603
Income taxes payable 496 2,276
Related party note payable, current 5,949 0
Deferred income taxes 0 9,944
Total current liabilities 26,391 32,084
Deferred income taxes 33,838 8,473
Related party note payable, long-term 6,997 0
Commitments and contingencies (Note I)
Shareholders’ equity:
Undesignated capital stock, no par; authorized 5,000,000 shares; none
issued or outstanding 0 0
Common stock, par value $.01 a share; authorized 100,000,000 shares;
issued and outstanding 37,002,203 and 36,834,678 shares, respectively 370 368
Additional paid-in capital 147,004 134,895
Retained earnings 653,279 587,725
Accumulated other comprehensive (loss) income (5,388 ) 14,553
Total shareholders’ equity 795,265 737,541
$ 862,491 $ 778,098
See Notes to Consolidated Financial Statements.

32
CONSOLIDATED STATEMENTS OF SHAREHOLDERS’ EQUITY
Techne Corporation and Subsidiaries
(in thousands)
Common Stock
Additional
Paid-in Retained
Accumulated
Other
Compre-
hensive
Shares Amount Capital Earnings Income(Loss) Total
Balances at June 30, 2011 37,153 $ 371 $ 129,312 $ 472,730 $ (16,291 ) $ 586,122
Net earnings 112,331 112,331
Other comprehensive income 38,066 38,066
Common stock issued for exercise of options 17 0 847 847
Repurchase of common stock (344 ) (3 ) (23,595 ) (23,598 )
Cash dividends (41,018 ) (41,018 )
Stock-based compensation expense 1,641 1,641
Tax benefit from exercise of stock options 51 51
Balances at June 30, 2012 36,826 368 131,851 520,448 21,775 674,442
Net earnings 112,561 112,561
Other comprehensive loss (7,222 ) (7,222 )
Common stock issued for exercise of options 22 0 1,105 1,105
Common stock issued for restricted stock
award 15 0 0
Repurchase of common stock (28 ) (0 ) (1,821 ) (1,821 )
Cash dividends (43,463 ) (43,463 )
Stock-based compensation expense 1,864 1,864
Tax benefit from exercise of stock options 75 75
Balances at June 30, 2013 36,835 368 134,895 587,725 14,553 737,541
Net earnings 110,948 110,948
Other comprehensive loss (19,941 ) (19,941 )
Surrender and retirement of stock to exercise
options (1 ) (0 ) (56 ) (56 )
Common stock issued for exercise of options 142 2 8,380 8,382
Common stock issued for restricted stock
awards 26 0 0
Cash dividends (45,394 ) (45,394 )
Stock-based compensation expense 3,523 3,523
Tax benefit from exercise of stock options 262 262
Balances at June 30, 2014 37,002 $ 370 $ 147,004 $ 653,279 $ (5,388 ) $ 795,265
See Notes to Consolidated Financial Statements.

33
CONSOLIDATED STATEMENTS OF CASH FLOWS
Techne Corporation and Subsidiaries (in thousands)
Year Ended June 30,
2014 2013 2012
Cash flows from operating activities:
Net earnings $ 110,948 $ 112,561 $ 112,331
Adjustments to reconcile net earnings to net cash provided by
operating activities:
Depreciation and amortization 19,175 12,321 12,467
Costs recognized on sale of acquired inventory 7,480 4,501 7,573
Deferred income taxes (2,853 ) (2,534 ) (7,363 )
Stock-based compensation expense 3,523 1,864 1,641
Excess tax benefit from stock option exercises (262 ) (75 ) (51 )
Impairment losses on investments 0 0 3,254
Net (gain) loss from equity method investees 0 (570 ) 603
Other 592 763 230
Change in operating assets and liabilities, net of acquisitions:
Trade accounts and other receivables 1,145 (2,334 ) (2,096 )
Inventories (2,895 ) (2,216 ) (1,577 )
Prepaid expenses (554 ) (33 ) (476 )
Trade accounts payable and accrued expenses 1,368 243 1,581
Salaries, wages and related accruals 1,034 (92 ) 686
Income taxes payable (1,939 ) (837 ) (2,057 )
Net cash provided by operating activities 136,762 123,562 126,746
Cash flows from investing activities:
Purchase of available-for-sale investments (106,746 ) (112,712 ) (147,011 )
Proceeds from sale of available-for-sale investments 229,975 41,507 64,291
Proceeds from maturities of available-for-sale investments 59,435 62,103 67,435
Additions to property and equipment (13,821 ) (22,454 ) (6,017 )
Acquisitions, net of cash acquired (109,180 ) 0 0
Investment in unconsolidated entity (10,000 ) 0 0
Other 25 352 (366 )
Net cash provided by (used in) investing activities 49,688 (31,204 ) (21,668 )
Cash flows from financing activities:
Cash dividends (45,394 ) (43,463 ) (41,018 )
Proceeds from stock option exercises 8,326 1,105 847
Excess tax benefit from stock option exercises 262 75 51
Purchase of common stock for stock bonus plans 0 (573 ) (907 )
Repurchase of common stock 0 (1,821 ) (23,598 )
Net cash used in financing activities (36,806 ) (44,677 ) (64,625 )
Effect of exchange rate changes on cash and cash equivalents 5,138 (570 ) (1,391 )
Net change in cash and cash equivalents 154,782 47,111 39,062
Cash and cash equivalents at beginning of year 163,786 116,675 77,613
Cash and cash equivalents at end of year $ 318,568 $ 163,786 $ 116,675
See Notes to Consolidated Financial Statements.
34
NOTES TO CONSOLIDATED FINANCIAL STATEMENTS
Techne Corporation and Subsidiaries
Years ended June 30, 2014, 2013 and 2012
A. Description of Business and Summary of Significant Accounting Policies:
Description of business: Techne Corporation and subsidiaries, collectively doing business as Bio-Techne, (the
Company) develop, manufacture and sell biotechnology products and clinical diagnostic controls worldwide. With
its deep product portfolio and application expertise, Bio-Techne is a leader in providing specialized proteins,
including cytokines and growth factors, and related immunoassays, small molecules and other reagents to the
research, diagnostics and clinical controls markets.
Estimates: The preparation of consolidated financial statements in conformity with accounting principles generally
accepted in the United States of America requires management to make estimates and assumptions that affect the
reported amounts of assets and liabilities, disclosures of contingent assets and liabilities at the date of the
consolidated financial statements, and the reported amounts of revenues and expenses during the reporting period.
These estimates include the valuation of accounts receivable, available-for-sale investments, inventory, intangible
assets, stock based compensation and income taxes. Actual results could differ from these estimates.
Principles of consolidation: The consolidated financial statements include the accounts of the Company and its
wholly-owned subsidiaries. All intercompany accounts and transactions have been eliminated.
Translation of foreign financial statements: Assets and liabilities of the Company’s foreign operations are translated
at year-end rates of exchange and the resulting gains and losses arising from the translation of net assets located
outside the U.S. are recorded as other comprehensive income (loss) on the consolidated statement of earnings and
comprehensive income. The cumulative translation adjustment is a component of accumulated other comprehensive
income (loss) on the consolidated balance sheets. Foreign statements of earnings are translated at the average rate of
exchange for the year. Foreign currency transaction gains and losses are included in other non-operating expense in
the consolidated statements of earnings.
Revenue recognition: The Company recognizes revenue when persuasive evidence of an arrangement exists,
delivery has occurred or services have been rendered, the price is fixed or determinable and collectability is
reasonably assured. Payment terms for shipments to end-users are generally net 30 days. Payment terms for
distributor shipments may range from 30 to 90 days. Freight charges billed to end-users are included in net sales and
freight costs are included in cost of sales. Freight charges on shipments to distributors are paid directly by the
distributor. Any claims for credit or return of goods must be made within 10 days of receipt. Revenues are reduced
to reflect estimated credits and returns. Sales, use, value-added and other excise taxes are not included in revenue.
Research and development: Research and development expenditures are expensed as incurred. Development
activities generally relate to creating new products, improving or creating variations of existing products, or
modifying existing products to meet new applications.
Advertising costs: Advertising expenses (including production and communication costs) were $3.4 million, $3.2
million and $3.4 million for fiscal 2014, 2013 and 2012, respectively. The Company expenses advertising expenses
as incurred.
Share-based compensation: The cost of employee services received in exchange for the award of equity instruments
is based on the fair value of the award at the date of grant. Separate groups of employees that have similar historical
exercise behavior with regard to option exercise timing and forfeiture rates are considered separately in determining
option fair value. Compensation cost is recognized using a straight-line method over the vesting period and is net of
estimated forfeitures. Stock option exercises and stock awards are satisfied through the issuance of new shares.

35
Income taxes: The Company uses the asset and liability method of accounting for income taxes. Deferred tax assets
and liabilities are recognized to record the income tax effect of temporary differences between the tax basis and
financial reporting basis of assets and liabilities. Deferred tax assets and liabilities are measured using enacted tax
rates expected to apply to taxable income in the years in which those temporary differences are expected to be
recovered or settled. The effect on deferred tax assets and liabilities of a change in tax rates is recognized in income
in the period that includes the enactment date. Tax positions taken or expected to be taken in a tax return are
recognized in the financial statements when it is more likely than not that the position would be sustained upon
examination by tax authorities. A recognized tax position is then measured at the largest amount of benefit that is
greater than fifty percent likely of being realized upon ultimate settlement. The Company recognizes interest and
penalties related to unrecognized tax benefits in income tax expense.
Financial instruments not measured at fair value: Certain of the Company’s financial instruments are not measured
at fair value but nevertheless are recorded at carrying amounts approximating fair value, based on their short-term
nature. These financial instruments include cash and cash equivalents, accounts receivable, accounts payable and
other current liabilities.
Cash and equivalents: Cash and cash equivalents include cash on hand and highly-liquid investments with original
maturities of three months or less.
Available-for-sale investments: Available-for-sale investments consist of debt instruments with original maturities
of generally three months to three years and equity securities. Available-for-sale investments are recorded based on
trade-date. The Company considers all of its marketable securities available-for-sale and reports them at fair value.
The Company utilizes valuation techniques for determining fair market value which maximize the use of observable
inputs and minimize the use of unobservable inputs to the extent possible. The Company determines fair value based
on assumptions that market participants would use in pricing an asset or liability in the principal or most
advantageous market. When considering market participant assumptions in fair value measurements, the following
fair value hierarchy distinguishes between observable and unobservable inputs, which are categorized in one of the
following levels:
Level 1 Inputs: Unadjusted quoted prices in active markets for identical assets or liabilities accessible to the
reporting entity at the measurement date.
Level 2 Inputs: Other than quoted prices included in Level 1 inputs that are observable for the asset or liability,
either directly or indirectly, for substantially the full term of the asset or liability.
Level 3 Inputs: Unobservable inputs for the asset or liability used to measure fair value to the extent that
observable inputs are not available, thereby allowing for situations in which there is little, if any, market
activity for the asset or liability at measurement date.
Unrealized gains and losses on available-for-sale securities are excluded from income, but are included, net of taxes,
in other comprehensive income. If an “other-than-temporary” impairment is determined to exist, the difference
between the value of the investment security recorded in the financial statements and the Company’s current
estimate of the fair value is recognized as a charge to earnings in the period in which the impairment is determined.
Inventories: Inventories are stated at the lower of cost (first-in, first-out method) or market. The Company regularly
reviews inventory on hand for slow-moving and obsolete inventory, inventory not meeting quality control standards
and inventory subject to expiration. To meet strict customer quality standards, the Company has established a
highly controlled manufacturing process for proteins, antibodies and its chemically-based products. These products
require the initial manufacture of multiple batches to determine if quality standards can be consistently met. In
addition, the Company will produce larger batches of established products than current sales requirements due to
economies of scale. The manufacturing process for these products, therefore, has and will continue to produce
quantities in excess of forecasted usage. The Company values its manufactured protein and antibody inventory
based on a two-year forecast and its chemically-based products on a five-year forecast. Inventory quantities in
excess of the forecast are not valued due to uncertainty over salability. Sales of previously unvalued protein,
antibody and chemically-based inventory for fiscal years 2014, 2013 and 2012 were not material.

36
Property and equipment: Property and equipment are recorded at cost. Equipment is depreciated using the straight-
line method over an estimated useful life of five years. Buildings, building improvements and leasehold
improvements are amortized over estimated useful lives of 5 to 40 years. Property and equipment are reviewed for
impairment whenever events or changes in circumstances indicate that the carrying amount may not be recoverable.
In the current year, the Company has identified no such events.
Goodwill: At June 30, 2014 and 2013, the Company had recorded goodwill of $151.5 million and $84.3 million,
respectively. The Company tests goodwill at least annually for impairment. The Company completed its annual
impairment testing of goodwill and concluded that no impairment existed as of June 30, 2014.
Intangible assets: Intangible assets are being amortized over their estimated useful lives. Intangible assets are
reviewed for impairment whenever events or changes in circumstances indicate that the carrying amount may not be
recoverable. In the current year, the Company has identified no such events.
Investments in unconsolidated entities: The Company has equity investments in several start-up and early
development stage companies. The accounting treatment of each investment (cost method or equity method) is
dependent upon a number of factors, including, but not limited to, the Company’s share in the equity of the investee
and the Company’s ability to exercise significant influence over the operating and financial policies of the investee.
B. Acquisitions:
Bionostics Holdings, Ltd.: On July 22, 2013, the Company acquired for cash all of the outstanding shares of
Bionostics Holdings, Ltd. (Bionostics) and its U.S. operating subsidiary, Bionostics, Inc. Bionostics is a global
leader in the development, manufacture and distribution of control solutions that verify the proper operation of in-
vitro diagnostic devices primarily utilized in point of care blood glucose and blood gas testing. Bionostics is
included in the Company’s Clinical Controls segment.
In connection with the Bionostics acquisition, the Company recorded $14.4 million of developed technology
intangible assets that have an estimated useful life of 9 years, $2.7 million of trade name intangible assets that have
an estimated useful life of 5 years, $2.4 million related to non-compete agreements that have an estimated useful life
of 3 years, and $41.0 million related to customer relationships that have an estimated useful life of 14 years. The
intangible asset amortization is not deductible for income tax purposes.
The goodwill recorded as a result of the Bionostics acquisition represents the strategic benefits of growing the
Company’s product portfolio and the expected revenue growth from increased market penetration from future
products and customers. The goodwill is not deductible for income tax purposes. Transaction costs of $0.5 million and $0.6 million were included in the Company’s selling, general and
administrative costs during fiscal 2014 and 2013, respectively, related to the Bionostics acquisition.
Shanghai PrimeGene Bio-Tech Co.: On April 30, 2014, the Company acquired all of the ownership interest of
Shanghai PrimeGene Bio-Tech Co. (PrimeGene). PrimeGene manufactures recombinant proteins and is included in
the Company’s Biotechnology segment. The Company paid approximately $6.0 million at closing, with the
remaining purchase price payable over fiscal years 2015 to 2017. The note payable is due to individuals who are
currently employed by PrimeGene.
In connection with the PrimeGene acquisition, the Company recorded $2.2 million of developed technology
intangible assets that have an estimated useful life of 9 years, $3.0 million of trade name intangible assets that have
an estimated useful life of 11 years, $0.3 million related to non-compete agreements that have an estimated useful
life of 3 years, and $9.1 million related to customer relationships that have an estimated useful life of 9 years. The
intangible asset amortization is not deductible for income tax purposes.
The goodwill recorded as a result of the PrimeGene acquisition represents the strategic benefits of growing the
Company’s product portfolio and the expected revenue growth from increased market penetration from future
products and customers. The goodwill is not deductible for income tax purposes.
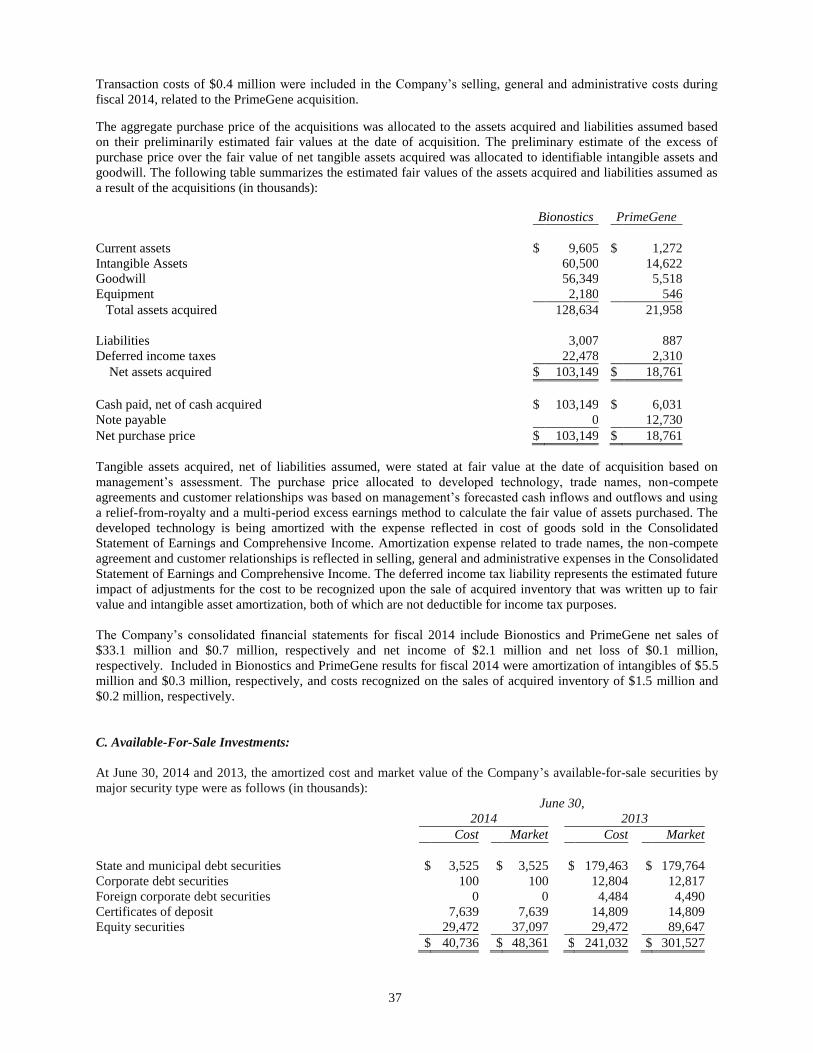
37
Transaction costs of $0.4 million were included in the Company’s selling, general and administrative costs during
fiscal 2014, related to the PrimeGene acquisition.
The aggregate purchase price of the acquisitions was allocated to the assets acquired and liabilities assumed based
on their preliminarily estimated fair values at the date of acquisition. The preliminary estimate of the excess of
purchase price over the fair value of net tangible assets acquired was allocated to identifiable intangible assets and
goodwill. The following table summarizes the estimated fair values of the assets acquired and liabilities assumed as
a result of the acquisitions (in thousands):
Bionostics PrimeGene
Current assets $ 9,605 $ 1,272
Intangible Assets 60,500 14,622
Goodwill 56,349 5,518
Equipment 2,180 546
Total assets acquired 128,634 21,958
Liabilities 3,007 887
Deferred income taxes 22,478 2,310
Net assets acquired $ 103,149 $ 18,761
Cash paid, net of cash acquired $ 103,149 $ 6,031
Note payable 0 12,730
Net purchase price $ 103,149 $ 18,761
Tangible assets acquired, net of liabilities assumed, were stated at fair value at the date of acquisition based on
management’s assessment. The purchase price allocated to developed technology, trade names, non-compete
agreements and customer relationships was based on management’s forecasted cash inflows and outflows and using
a relief-from-royalty and a multi-period excess earnings method to calculate the fair value of assets purchased. The
developed technology is being amortized with the expense reflected in cost of goods sold in the Consolidated
Statement of Earnings and Comprehensive Income. Amortization expense related to trade names, the non-compete
agreement and customer relationships is reflected in selling, general and administrative expenses in the Consolidated
Statement of Earnings and Comprehensive Income. The deferred income tax liability represents the estimated future
impact of adjustments for the cost to be recognized upon the sale of acquired inventory that was written up to fair
value and intangible asset amortization, both of which are not deductible for income tax purposes.
The Company’s consolidated financial statements for fiscal 2014 include Bionostics and PrimeGene net sales of
$33.1 million and $0.7 million, respectively and net income of $2.1 million and net loss of $0.1 million,
respectively. Included in Bionostics and PrimeGene results for fiscal 2014 were amortization of intangibles of $5.5
million and $0.3 million, respectively, and costs recognized on the sales of acquired inventory of $1.5 million and
$0.2 million, respectively.
C. Available-For-Sale Investments:
At June 30, 2014 and 2013, the amortized cost and market value of the Company’s available-for-sale securities by
major security type were as follows (in thousands):
June 30,
2014 2013
Cost Market Cost Market
State and municipal debt securities $ 3,525 $ 3,525 $ 179,463 $ 179,764
Corporate debt securities 100 100 12,804 12,817
Foreign corporate debt securities 0 0 4,484 4,490
Certificates of deposit 7,639 7,639 14,809 14,809
Equity securities 29,472 37,097 29,472 89,647
$ 40,736 $ 48,361 $ 241,032 $ 301,527
38
At June 30, 2014 and 2013, all of the Company’s available-for-sale debt securities were valued using Level 2 inputs,
while its equity securities were valued using Level 1 inputs. Certificates of deposit are carried at cost and are not
subject to the fair value hierarchy. There were no transfers between Level 1 and Level 2 securities during fiscal
2014. Gross unrealized gains on available-for-sale investments were $7.6 million at June 30, 2014. Gross unrealized
gains and unrealized losses on available-for-sale investments were $60.7 million and $0.2 million, respectively, at
June 30, 2013.
The Company’s investment in equity securities consists of investments in the common stock and warrants of
ChemoCentryx, Inc. (CCXI). The warrants are to purchase 150,000 shares of CCXI common stock at $20 per share
and expire in February, 2022. The fair value of the warrants as of June 30, 2014 and 2013 were $0.6 million and
$1.5 million, respectively, and were valued using Level 2 inputs. At June 30, 2014, the Company holds an
approximate 14% interest in CCXI.
Contractual maturities of available-for-sale debt securities are shown below (in thousands). Expected maturities may
differ from contractual maturities because borrowers may have the right to recall or prepay obligations with or
without call or prepayment penalties.
Year Ending June 30, 2014:
Due within one year $ 7,689
Due one to five years 3,575
$ 11,264
Proceeds from maturities or sales of available-for-sale securities were $290 million, $104 million and $132 million
during fiscal 2014, 2013 and 2012, respectively. There were no material realized gains or losses on these sales.
Realized gains and losses are determined on the specific identification method.
D. Inventories:
Inventories consist of (in thousands):
June 30,
2014 2013
Raw materials $ 9,852 $ 5,885
Finished goods 28,995 28,992
$ 38,847 $ 34,877
At June 30, 2014 and 2013, the Company had $30.3 million and $26.0 million, respectively, of excess protein,
antibody and chemically-based inventory on hand which was not valued.
E. Property and Equipment:
Property and equipment consist of (in thousands): June 30,
2014 2013
Cost:
Land $ 7,468 $ 7,438
Buildings and improvements 149,442 142,656
Machinery and equipment 53,067 39,706
209,977 189,800
Accumulated depreciation and amortization (92,857 ) (81,044 )
$ 117,120 $ 108,756
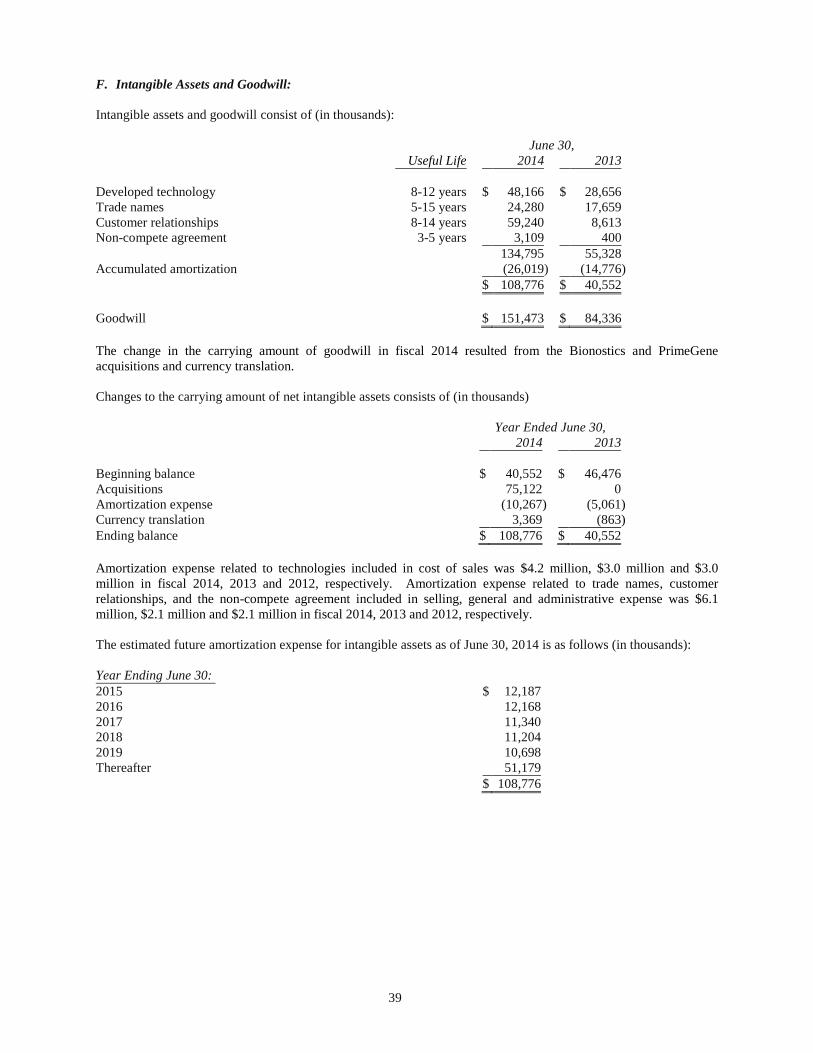
39
F. Intangible Assets and Goodwill:
Intangible assets and goodwill consist of (in thousands):
June 30,
Useful Life 2014 2013
Developed technology 8-12 years $ 48,166 $ 28,656
Trade names 5-15 years 24,280 17,659
Customer relationships 8-14 years 59,240 8,613
Non-compete agreement 3-5 years 3,109 400
134,795 55,328
Accumulated amortization (26,019 ) (14,776 )
$ 108,776 $ 40,552
Goodwill $ 151,473 $ 84,336
The change in the carrying amount of goodwill in fiscal 2014 resulted from the Bionostics and PrimeGene
acquisitions and currency translation.
Changes to the carrying amount of net intangible assets consists of (in thousands)
Year Ended June 30,
2014 2013
Beginning balance $ 40,552 $ 46,476
Acquisitions 75,122 0
Amortization expense (10,267 ) (5,061 )
Currency translation 3,369 (863 )
Ending balance $ 108,776 $ 40,552
Amortization expense related to technologies included in cost of sales was $4.2 million, $3.0 million and $3.0
million in fiscal 2014, 2013 and 2012, respectively. Amortization expense related to trade names, customer
relationships, and the non-compete agreement included in selling, general and administrative expense was $6.1
million, $2.1 million and $2.1 million in fiscal 2014, 2013 and 2012, respectively.
The estimated future amortization expense for intangible assets as of June 30, 2014 is as follows (in thousands):
Year Ending June 30:
2015 $ 12,187
2016 12,168
2017 11,340
2018 11,204
2019 10,698
Thereafter 51,179
$ 108,776
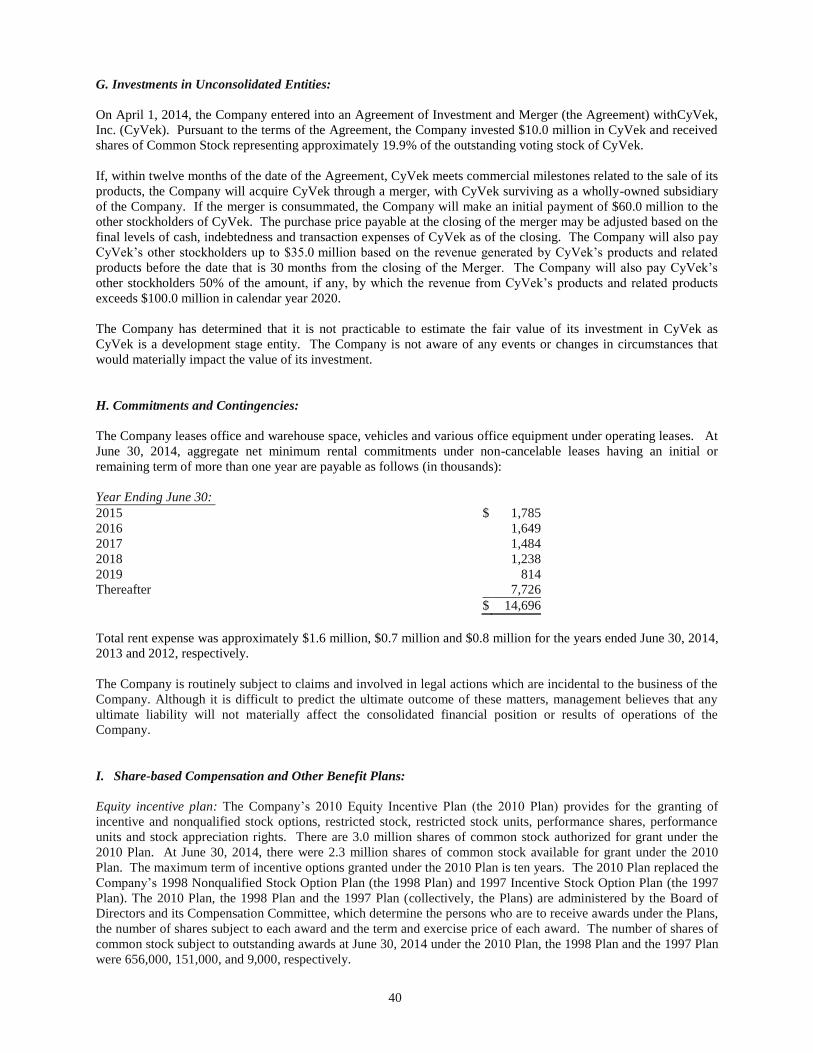
40
G. Investments in Unconsolidated Entities:
On April 1, 2014, the Company entered into an Agreement of Investment and Merger (the Agreement) withCyVek,
Inc. (CyVek). Pursuant to the terms of the Agreement, the Company invested $10.0 million in CyVek and received
shares of Common Stock representing approximately 19.9% of the outstanding voting stock of CyVek.
If, within twelve months of the date of the Agreement, CyVek meets commercial milestones related to the sale of its
products, the Company will acquire CyVek through a merger, with CyVek surviving as a wholly-owned subsidiary
of the Company. If the merger is consummated, the Company will make an initial payment of $60.0 million to the
other stockholders of CyVek. The purchase price payable at the closing of the merger may be adjusted based on the
final levels of cash, indebtedness and transaction expenses of CyVek as of the closing. The Company will also pay
CyVek’s other stockholders up to $35.0 million based on the revenue generated by CyVek’s products and related
products before the date that is 30 months from the closing of the Merger. The Company will also pay CyVek’s
other stockholders 50% of the amount, if any, by which the revenue from CyVek’s products and related products
exceeds $100.0 million in calendar year 2020.
The Company has determined that it is not practicable to estimate the fair value of its investment in CyVek as
CyVek is a development stage entity. The Company is not aware of any events or changes in circumstances that
would materially impact the value of its investment.
H. Commitments and Contingencies:
The Company leases office and warehouse space, vehicles and various office equipment under operating leases. At
June 30, 2014, aggregate net minimum rental commitments under non-cancelable leases having an initial or
remaining term of more than one year are payable as follows (in thousands):
Year Ending June 30:
2015 $ 1,785
2016 1,649
2017 1,484
2018 1,238
2019 814
Thereafter 7,726
$ 14,696
Total rent expense was approximately $1.6 million, $0.7 million and $0.8 million for the years ended June 30, 2014,
2013 and 2012, respectively.
The Company is routinely subject to claims and involved in legal actions which are incidental to the business of the
Company. Although it is difficult to predict the ultimate outcome of these matters, management believes that any
ultimate liability will not materially affect the consolidated financial position or results of operations of the
Company.
I. Share-based Compensation and Other Benefit Plans:
Equity incentive plan: The Company’s 2010 Equity Incentive Plan (the 2010 Plan) provides for the granting of
incentive and nonqualified stock options, restricted stock, restricted stock units, performance shares, performance
units and stock appreciation rights. There are 3.0 million shares of common stock authorized for grant under the
2010 Plan. At June 30, 2014, there were 2.3 million shares of common stock available for grant under the 2010
Plan. The maximum term of incentive options granted under the 2010 Plan is ten years. The 2010 Plan replaced the
Company’s 1998 Nonqualified Stock Option Plan (the 1998 Plan) and 1997 Incentive Stock Option Plan (the 1997
Plan). The 2010 Plan, the 1998 Plan and the 1997 Plan (collectively, the Plans) are administered by the Board of
Directors and its Compensation Committee, which determine the persons who are to receive awards under the Plans,
the number of shares subject to each award and the term and exercise price of each award. The number of shares of
common stock subject to outstanding awards at June 30, 2014 under the 2010 Plan, the 1998 Plan and the 1997 Plan
were 656,000, 151,000, and 9,000, respectively.

41
Stock option activity under the Plans for the three years ended June 30, 2014, consists of the following (shares in
thousands):
Shares
Weighted
Average
Exercise
Price
Weighted
Avg.
Contractual
Life (Yrs.)
Aggregate
Intrinsic
Value
Outstanding at June 30, 2011 499 $ 64.15
Granted 95 71.94
Forfeited (2 ) 76.15
Exercised (17 ) 50.98
Outstanding at June 30, 2012 575 65.78
Granted 175 67.80
Exercised (22 ) 51.17
Outstanding at June 30, 2013 728 66.70
Granted 251 80.88
Forfeited (26 ) 76.23
Exercised (142 ) 59.07
Outstanding at June 30, 2014 811 $ 72.11 5.4 $ 16.6 million
Exercisable at June 30:
2012 403 $ 62.67
2013 497 65.04
2014 534 69.49 5.1 $ 12.3 million
The fair values of options granted under the Plans were estimated on the date of grant using the Black-Scholes
option-pricing model with the following assumptions used:
Year Ended June 30,
2014 2013 2012
Dividend yield 1.5% 1.8% 1.5%
Expected volatility 18%-22% 18%-23% 22%-23%
Risk-free interest rates 1.4%-2.1% 0.4%-1.4% 0.9%-2.0%
Expected lives 6 years 5 years 6 years
The dividend yield is based on the Company’s historical annual cash dividend divided by the market value of the
Company’s common stock. The expected annualized volatility is based on the Company’s historical stock price
over a period equivalent to the expected life of the option granted. The risk-free interest rate is based on U.S.
Treasury constant maturity interest rates with a term consistent with the expected life of the options granted.
The weighted average fair value of options granted during fiscal 2014, 2013 and 2012 was $14.77, $9.72 and
$14.14, respectively. The total intrinsic value of options exercised during fiscal 2014, 2013 and 2012 were $3.7
million, $0.4 million and $0.3 million, respectively. The total fair value of options vested during fiscal 2014, 2013
and 2012 were $2.2 million, $1.5 million and $1.6 million, respectively.
In fiscal 2014 and fiscal 2013, 26,355 and 15,000 restricted common stock shares were granted at weighted average
grant date fair values of $86.60 and $67.46 per share, respectively. Non-vested restricted common stock shares at
June 30, 2014 and 2013 were 36,355 and 15,000, respectively.
In fiscal 2014, 5,000 restricted stock units were granted at a weighted average grant date fair value of $86.25. The
restricted stock units vest over a three year period.
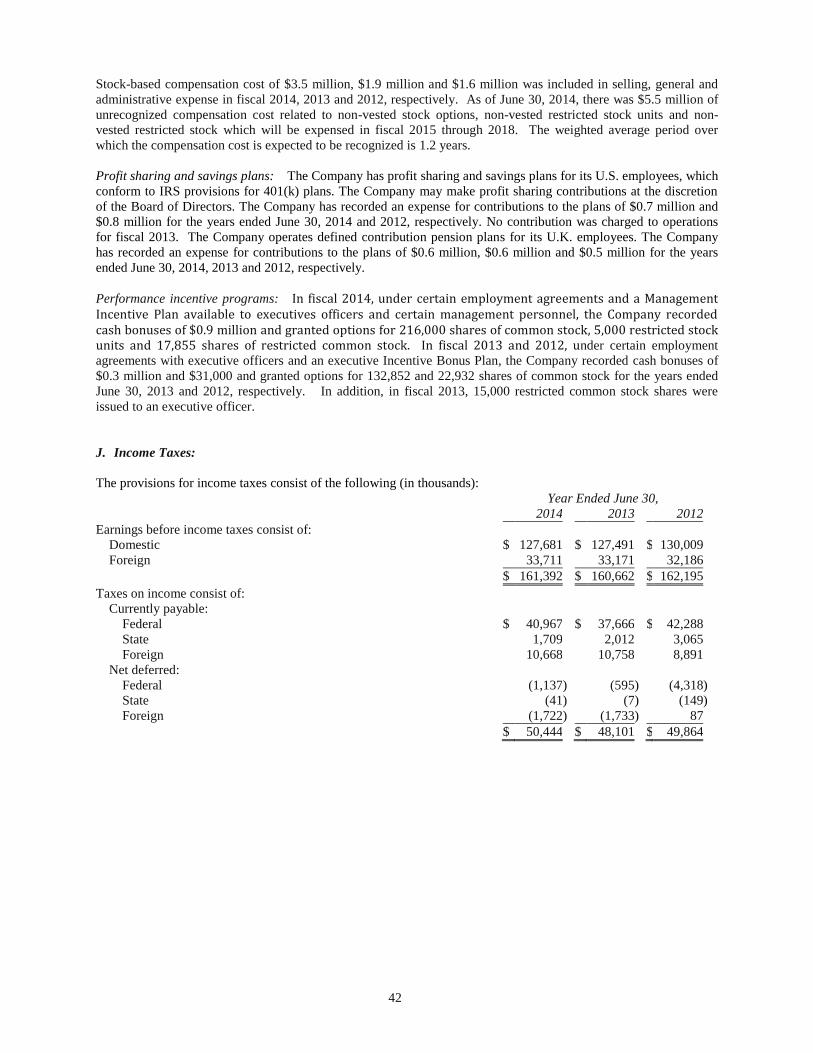
42
Stock-based compensation cost of $3.5 million, $1.9 million and $1.6 million was included in selling, general and
administrative expense in fiscal 2014, 2013 and 2012, respectively. As of June 30, 2014, there was $5.5 million of
unrecognized compensation cost related to non-vested stock options, non-vested restricted stock units and non-
vested restricted stock which will be expensed in fiscal 2015 through 2018. The weighted average period over
which the compensation cost is expected to be recognized is 1.2 years.
Profit sharing and savings plans: The Company has profit sharing and savings plans for its U.S. employees, which
conform to IRS provisions for 401(k) plans. The Company may make profit sharing contributions at the discretion
of the Board of Directors. The Company has recorded an expense for contributions to the plans of $0.7 million and
$0.8 million for the years ended June 30, 2014 and 2012, respectively. No contribution was charged to operations
for fiscal 2013. The Company operates defined contribution pension plans for its U.K. employees. The Company
has recorded an expense for contributions to the plans of $0.6 million, $0.6 million and $0.5 million for the years
ended June 30, 2014, 2013 and 2012, respectively.
Performance incentive programs: In fiscal 2014, under certain employment agreements and a Management Incentive Plan available to executives officers and certain management personnel, the Company recorded cash bonuses of $0.9 million and granted options for 216,000 shares of common stock, 5,000 restricted stock units and 17,855 shares of restricted common stock. In fiscal 2013 and 2012, under certain employment
agreements with executive officers and an executive Incentive Bonus Plan, the Company recorded cash bonuses of
$0.3 million and $31,000 and granted options for 132,852 and 22,932 shares of common stock for the years ended
June 30, 2013 and 2012, respectively. In addition, in fiscal 2013, 15,000 restricted common stock shares were
issued to an executive officer.
J. Income Taxes:
The provisions for income taxes consist of the following (in thousands):
Year Ended June 30,
2014 2013 2012
Earnings before income taxes consist of:
Domestic $ 127,681 $ 127,491 $ 130,009
Foreign 33,711 33,171 32,186
$ 161,392 $ 160,662 $ 162,195
Taxes on income consist of:
Currently payable:
Federal $ 40,967 $ 37,666 $ 42,288
State 1,709 2,012 3,065
Foreign 10,668 10,758 8,891
Net deferred:
Federal (1,137 ) (595 ) (4,318 )
State (41 ) (7 ) (149 )
Foreign (1,722 ) (1,733 ) 87
$ 50,444 $ 48,101 $ 49,864
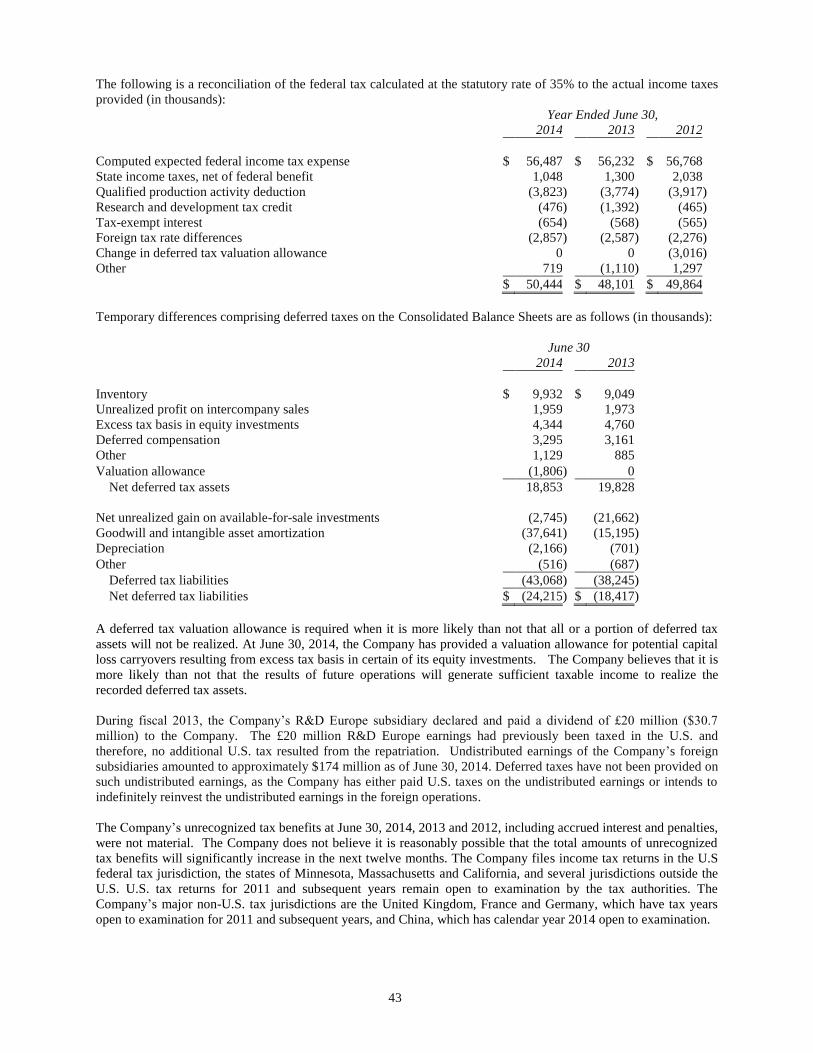
43
The following is a reconciliation of the federal tax calculated at the statutory rate of 35% to the actual income taxes
provided (in thousands):
Year Ended June 30,
2014 2013 2012
Computed expected federal income tax expense $ 56,487 $ 56,232 $ 56,768
State income taxes, net of federal benefit 1,048 1,300 2,038
Qualified production activity deduction (3,823 ) (3,774 ) (3,917 )
Research and development tax credit (476 ) (1,392 ) (465 )
Tax-exempt interest (654 ) (568 ) (565 )
Foreign tax rate differences (2,857 ) (2,587 ) (2,276 )
Change in deferred tax valuation allowance 0 0 (3,016 )
Other 719 (1,110 ) 1,297
$ 50,444 $ 48,101 $ 49,864
Temporary differences comprising deferred taxes on the Consolidated Balance Sheets are as follows (in thousands):
June 30
2014 2013
Inventory $ 9,932 $ 9,049
Unrealized profit on intercompany sales 1,959 1,973
Excess tax basis in equity investments 4,344 4,760
Deferred compensation 3,295 3,161
Other 1,129 885
Valuation allowance (1,806 ) 0
Net deferred tax assets 18,853 19,828
Net unrealized gain on available-for-sale investments (2,745 ) (21,662 )
Goodwill and intangible asset amortization (37,641 ) (15,195 )
Depreciation (2,166 ) (701 )
Other (516 ) (687 )
Deferred tax liabilities (43,068 ) (38,245 )
Net deferred tax liabilities $ (24,215 ) $ (18,417 )
A deferred tax valuation allowance is required when it is more likely than not that all or a portion of deferred tax
assets will not be realized. At June 30, 2014, the Company has provided a valuation allowance for potential capital
loss carryovers resulting from excess tax basis in certain of its equity investments. The Company believes that it is
more likely than not that the results of future operations will generate sufficient taxable income to realize the
recorded deferred tax assets.
During fiscal 2013, the Company’s R&D Europe subsidiary declared and paid a dividend of £20 million ($30.7
million) to the Company. The £20 million R&D Europe earnings had previously been taxed in the U.S. and
therefore, no additional U.S. tax resulted from the repatriation. Undistributed earnings of the Company’s foreign
subsidiaries amounted to approximately $174 million as of June 30, 2014. Deferred taxes have not been provided on
such undistributed earnings, as the Company has either paid U.S. taxes on the undistributed earnings or intends to
indefinitely reinvest the undistributed earnings in the foreign operations.
The Company’s unrecognized tax benefits at June 30, 2014, 2013 and 2012, including accrued interest and penalties,
were not material. The Company does not believe it is reasonably possible that the total amounts of unrecognized
tax benefits will significantly increase in the next twelve months. The Company files income tax returns in the U.S
federal tax jurisdiction, the states of Minnesota, Massachusetts and California, and several jurisdictions outside the
U.S. U.S. tax returns for 2011 and subsequent years remain open to examination by the tax authorities. The
Company’s major non-U.S. tax jurisdictions are the United Kingdom, France and Germany, which have tax years
open to examination for 2011 and subsequent years, and China, which has calendar year 2014 open to examination.

44
K. Earnings Per Share:
The number of shares used to calculate earnings per share are as follows (in thousands, except per share data):
Year Ended June 30,
2014 2013 2012
Net earnings used for basic and diluted earnings per share $ 110,948 $ 112,561 $ 112,331
Weighted average shares used in basic computation 36,890 36,836 36,939
Dilutive stock options 115 64 67
Weighted average shares used in diluted computation 37,005 36,900 37,006
Basic EPS $ 3.01 $ 3.06 $ 3.04
Diluted EPS $ 3.00 $ 3.05 $ 3.04
The dilutive effect of stock options in the above table excludes all options for which the aggregate exercise proceeds
exceeded the average market price for the period. The number of potentially dilutive option shares excluded from
the calculation was 196,000, 329,000 and 94,000 at June 30, 2014, 2013 and 2012, respectively.
L. Segment Information:
The Company has two reportable segments based on the nature of its products. The Company’s Biotechnology
reporting segment develops, manufactures and sells biotechnology research and diagnostic products world-wide.
The Company’s Clinical Controls reporting segment develops and manufactures controls and calibrators for sale
world-wide. No customer in the Biotechnology segment accounted for more than 10% of the segments net sales for
the years ended June 30, 2014, 2013 and 2012. One customer accounted for approximately 14% of Clinical
Controls’ net sales during fiscal 2014. No single customer accounted for more than 10% of Clinical Controls’ net
sales in fiscal 2013 or 2012. There are no concentrations of business transacted with a particular customer or
supplier or concentrations of revenue from a particular product or geographic area that would severely impact the
Company in the near term.
The accounting policies of the segments are the same as those described in Note A. In evaluating segment
performance, management focuses on sales and earnings before taxes.
Following is financial information relating to the operating segments (in thousands):
Year Ended June 30,
2014 2013 2012
External sales
Biotechnology $ 300,578 $ 288,156 $ 293,274
Clinical Controls 57,185 22,419 21,286
Consolidated net sales $ 357,763 $ 310,575 $ 314,560
Earnings before taxes
Biotechnology $ 159,220 $ 156,910 $ 162,763
Clinical Controls 10,643 8,746 8,002
Segment earnings before taxes 169,863 165,656 170,765
Corporate (8,471 ) (4,994 ) (8,570 )
Consolidated earnings before taxes $ 161,392 $ 160,662 $ 162,195
Goodwill
Biotechnology $ 95,124 $ 84,336 $ 85,682
Clinical Controls 56,349 0 0
Consolidated goodwill $ 151,473 $ 84,336 $ 85,682
Intangible assets, net
Biotechnology $ 53,778 $ 40,552 $ 46,476
Clinical Controls 54,998 0 0
Consolidated intangible assets, net $ 108,776 $ 40,552 $ 46,476

45
Year Ended June 30,
2014 2013 2012
Assets
Biotechnology $ 685,302 $ 580,085 $ 529,392
Clinical Controls 55,615 24,887 22,135
Segment assets 740,917 604,972 551,527
Corporate cash and available- for- sale investments 60,142 108,504 112,443
Corporate property and equipment 60,350 61,296 51,587
Corporate, other 1,082 3,326 3,767
Consolidated assets $ 862,491 $ 778,098 $ 719,324
Depreciation and amortization
Biotechnology $ 10,879 $ 10,781 $ 10,920
Clinical Controls 7,205 389 411
Segment depreciation and amortization 18,084 11,170 11,331
Corporate 1,091 1,151 1,136
Consolidated depreciation and amortization $ 19,175 $ 12,321 $ 12,467
Capital purchases
Biotechnology $ 4,157 $ 3,248 $ 4,021
Clinical Controls 5,687 6,914 597
Segment capital purchases 9,844 10,162 4,618
Corporate 3,977 12,292 1,399
Consolidated capital purchases $ 13,821 $ 22,454 $ 6,017
The other reconciling items include the results of unallocated corporate expenses and the Company’s share of gain
(losses) from its equity method investees.
Following is financial information relating to geographic areas (in thousands):
Year Ended June 30,
2014 2013 2012
External sales
United States $ 190,359 $ 164,308 $ 172,310
Europe 97,157 88,297 90,142
China 18,878 14,106 11,378
Other Asia 32,704 28,608 25,988
Rest of world 18,665 15,256 14,742
Total external sales $ 357,763 $ 310,575 $ 314,560
Long-lived assets
United States $ 109,790 $ 103,541 $ 87,968
Europe 8,340 7,129 7,528
China 678 117 141
Total long-lived assets $ 118,808 $ 110,787 $ 95,637
External sales are attributed to countries based on the location of the customer or distributor. Long-lived assets are
comprised of land, buildings and improvements and equipment, net of accumulated depreciation and other assets.
M. Supplemental Disclosures of Cash Flow Information and Noncash Investing and Financing Activities:
In fiscal 2014, the Company acquired PrimeGene for approximately $18.7 million. Approximately $6.0 million was
paid at closing with approximately $12.7 million payable over fiscal years 2015 through 2017.
In fiscal 2014, 2013 and 2012, the Company paid cash for income taxes of $55.2 million, $51.6 million and $58.7
million, respectively.
In fiscal 2014, stock options for 1,077 shares of common stock were exercised by the surrender of 733 shares of
common stock at fair market value of $56,000.
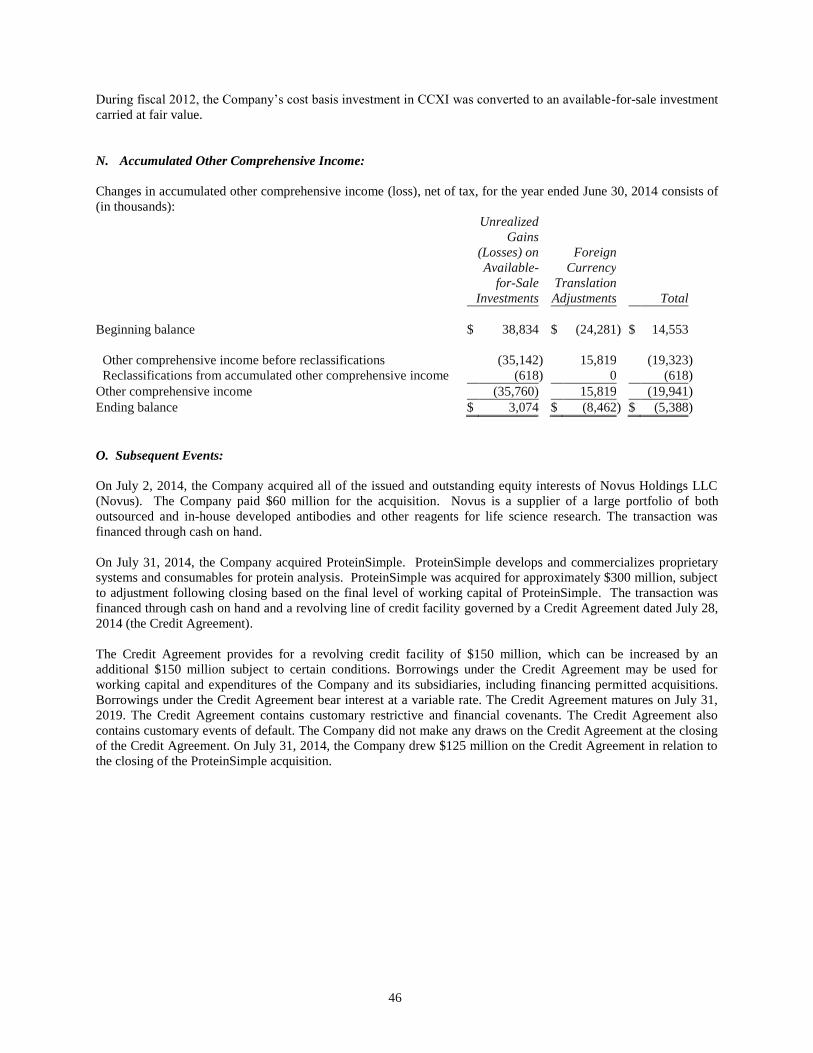
46
During fiscal 2012, the Company’s cost basis investment in CCXI was converted to an available-for-sale investment
carried at fair value.
N. Accumulated Other Comprehensive Income:
Changes in accumulated other comprehensive income (loss), net of tax, for the year ended June 30, 2014 consists of
(in thousands):
Unrealized
Gains
(Losses) on
Available-
for-Sale
Investments
Foreign
Currency
Translation
Adjustments Total
Beginning balance $ 38,834 $ (24,281 ) $ 14,553
Other comprehensive income before reclassifications (35,142 ) 15,819 (19,323 )
Reclassifications from accumulated other comprehensive income (618 ) 0 (618 )
Other comprehensive income (35,760) 15,819 (19,941 )
Ending balance $ 3,074 $ (8,462 ) $ (5,388 )
O. Subsequent Events:
On July 2, 2014, the Company acquired all of the issued and outstanding equity interests of Novus Holdings LLC
(Novus). The Company paid $60 million for the acquisition. Novus is a supplier of a large portfolio of both
outsourced and in-house developed antibodies and other reagents for life science research. The transaction was
financed through cash on hand.
On July 31, 2014, the Company acquired ProteinSimple. ProteinSimple develops and commercializes proprietary
systems and consumables for protein analysis. ProteinSimple was acquired for approximately $300 million, subject
to adjustment following closing based on the final level of working capital of ProteinSimple. The transaction was
financed through cash on hand and a revolving line of credit facility governed by a Credit Agreement dated July 28,
2014 (the Credit Agreement).
The Credit Agreement provides for a revolving credit facility of $150 million, which can be increased by an
additional $150 million subject to certain conditions. Borrowings under the Credit Agreement may be used for
working capital and expenditures of the Company and its subsidiaries, including financing permitted acquisitions.
Borrowings under the Credit Agreement bear interest at a variable rate. The Credit Agreement matures on July 31,
2019. The Credit Agreement contains customary restrictive and financial covenants. The Credit Agreement also
contains customary events of default. The Company did not make any draws on the Credit Agreement at the closing
of the Credit Agreement. On July 31, 2014, the Company drew $125 million on the Credit Agreement in relation to
the closing of the ProteinSimple acquisition.
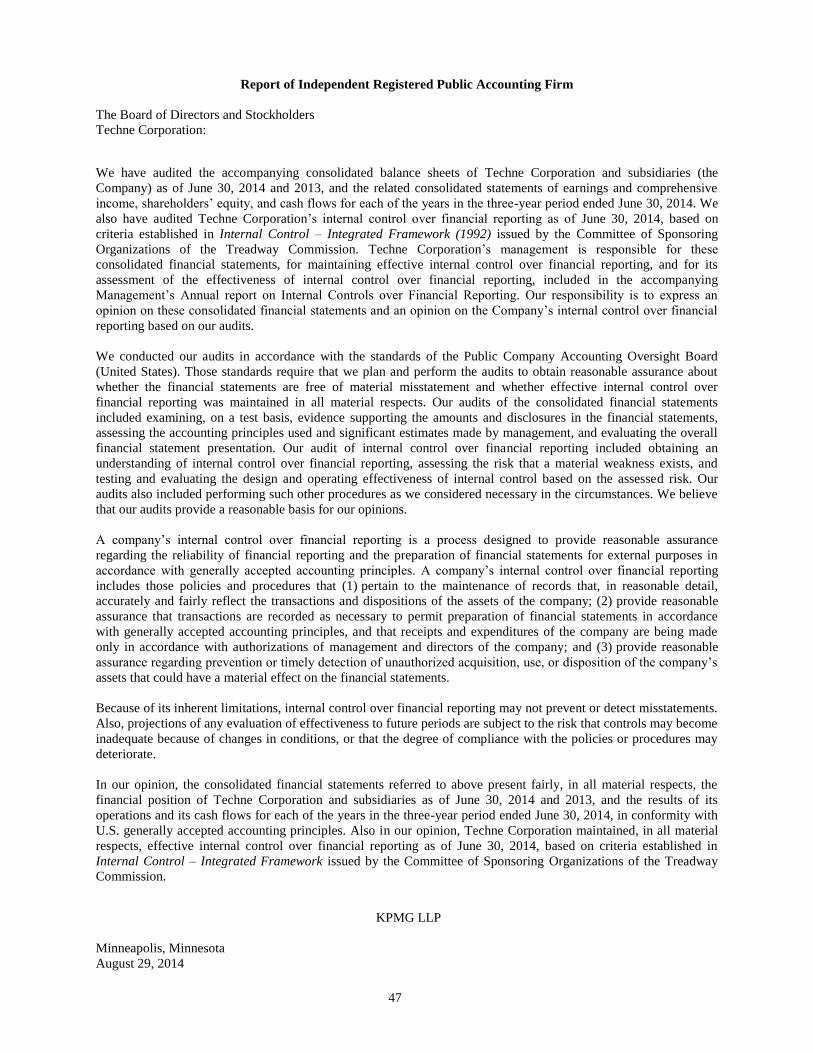
47
Report of Independent Registered Public Accounting Firm
The Board of Directors and Stockholders
Techne Corporation:
We have audited the accompanying consolidated balance sheets of Techne Corporation and subsidiaries (the
Company) as of June 30, 2014 and 2013, and the related consolidated statements of earnings and comprehensive
income, shareholders’ equity, and cash flows for each of the years in the three-year period ended June 30, 2014. We
also have audited Techne Corporation’s internal control over financial reporting as of June 30, 2014, based on
criteria established in Internal Control – Integrated Framework (1992) issued by the Committee of Sponsoring
Organizations of the Treadway Commission. Techne Corporation’s management is responsible for these
consolidated financial statements, for maintaining effective internal control over financial reporting, and for its
assessment of the effectiveness of internal control over financial reporting, included in the accompanying
Management’s Annual report on Internal Controls over Financial Reporting. Our responsibility is to express an
opinion on these consolidated financial statements and an opinion on the Company’s internal control over financial
reporting based on our audits.
We conducted our audits in accordance with the standards of the Public Company Accounting Oversight Board
(United States). Those standards require that we plan and perform the audits to obtain reasonable assurance about
whether the financial statements are free of material misstatement and whether effective internal control over
financial reporting was maintained in all material respects. Our audits of the consolidated financial statements
included examining, on a test basis, evidence supporting the amounts and disclosures in the financial statements,
assessing the accounting principles used and significant estimates made by management, and evaluating the overall
financial statement presentation. Our audit of internal control over financial reporting included obtaining an
understanding of internal control over financial reporting, assessing the risk that a material weakness exists, and
testing and evaluating the design and operating effectiveness of internal control based on the assessed risk. Our
audits also included performing such other procedures as we considered necessary in the circumstances. We believe
that our audits provide a reasonable basis for our opinions.
A company’s internal control over financial reporting is a process designed to provide reasonable assurance
regarding the reliability of financial reporting and the preparation of financial statements for external purposes in
accordance with generally accepted accounting principles. A company’s internal control over financial reporting
includes those policies and procedures that (1) pertain to the maintenance of records that, in reasonable detail,
accurately and fairly reflect the transactions and dispositions of the assets of the company; (2) provide reasonable
assurance that transactions are recorded as necessary to permit preparation of financial statements in accordance
with generally accepted accounting principles, and that receipts and expenditures of the company are being made
only in accordance with authorizations of management and directors of the company; and (3) provide reasonable
assurance regarding prevention or timely detection of unauthorized acquisition, use, or disposition of the company’s
assets that could have a material effect on the financial statements.
Because of its inherent limitations, internal control over financial reporting may not prevent or detect misstatements.
Also, projections of any evaluation of effectiveness to future periods are subject to the risk that controls may become
inadequate because of changes in conditions, or that the degree of compliance with the policies or procedures may
deteriorate.
In our opinion, the consolidated financial statements referred to above present fairly, in all material respects, the
financial position of Techne Corporation and subsidiaries as of June 30, 2014 and 2013, and the results of its
operations and its cash flows for each of the years in the three-year period ended June 30, 2014, in conformity with
U.S. generally accepted accounting principles. Also in our opinion, Techne Corporation maintained, in all material
respects, effective internal control over financial reporting as of June 30, 2014, based on criteria established in
Internal Control – Integrated Framework issued by the Committee of Sponsoring Organizations of the Treadway
Commission.
KPMG LLP
Minneapolis, Minnesota
August 29, 2014
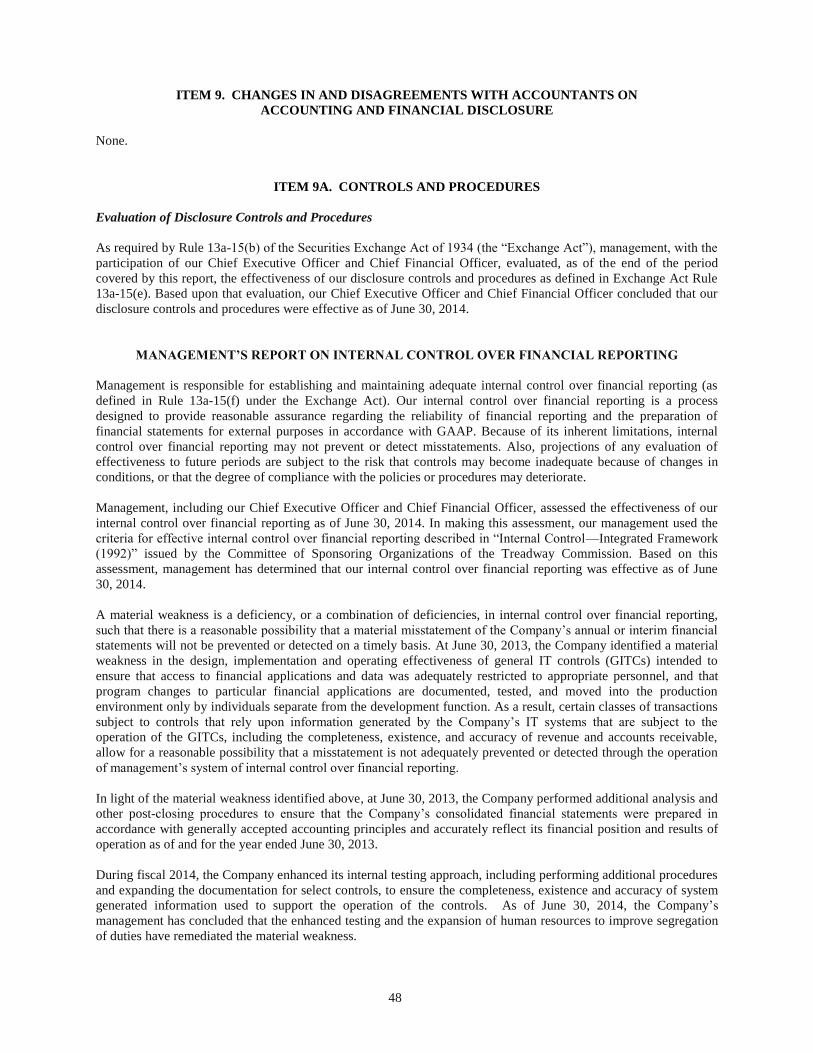
48
ITEM 9. CHANGES IN AND DISAGREEMENTS WITH ACCOUNTANTS ON
ACCOUNTING AND FINANCIAL DISCLOSURE
None.
ITEM 9A. CONTROLS AND PROCEDURES
Evaluation of Disclosure Controls and Procedures
As required by Rule 13a-15(b) of the Securities Exchange Act of 1934 (the “Exchange Act”), management, with the
participation of our Chief Executive Officer and Chief Financial Officer, evaluated, as of the end of the period
covered by this report, the effectiveness of our disclosure controls and procedures as defined in Exchange Act Rule
13a-15(e). Based upon that evaluation, our Chief Executive Officer and Chief Financial Officer concluded that our
disclosure controls and procedures were effective as of June 30, 2014.
MANAGEMENT’S REPORT ON INTERNAL CONTROL OVER FINANCIAL REPORTING
Management is responsible for establishing and maintaining adequate internal control over financial reporting (as
defined in Rule 13a-15(f) under the Exchange Act). Our internal control over financial reporting is a process
designed to provide reasonable assurance regarding the reliability of financial reporting and the preparation of
financial statements for external purposes in accordance with GAAP. Because of its inherent limitations, internal
control over financial reporting may not prevent or detect misstatements. Also, projections of any evaluation of
effectiveness to future periods are subject to the risk that controls may become inadequate because of changes in
conditions, or that the degree of compliance with the policies or procedures may deteriorate.
Management, including our Chief Executive Officer and Chief Financial Officer, assessed the effectiveness of our
internal control over financial reporting as of June 30, 2014. In making this assessment, our management used the
criteria for effective internal control over financial reporting described in “Internal Control—Integrated Framework
(1992)” issued by the Committee of Sponsoring Organizations of the Treadway Commission. Based on this
assessment, management has determined that our internal control over financial reporting was effective as of June
30, 2014.
A material weakness is a deficiency, or a combination of deficiencies, in internal control over financial reporting,
such that there is a reasonable possibility that a material misstatement of the Company’s annual or interim financial
statements will not be prevented or detected on a timely basis. At June 30, 2013, the Company identified a material
weakness in the design, implementation and operating effectiveness of general IT controls (GITCs) intended to
ensure that access to financial applications and data was adequately restricted to appropriate personnel, and that
program changes to particular financial applications are documented, tested, and moved into the production
environment only by individuals separate from the development function. As a result, certain classes of transactions
subject to controls that rely upon information generated by the Company’s IT systems that are subject to the
operation of the GITCs, including the completeness, existence, and accuracy of revenue and accounts receivable,
allow for a reasonable possibility that a misstatement is not adequately prevented or detected through the operation
of management’s system of internal control over financial reporting.
In light of the material weakness identified above, at June 30, 2013, the Company performed additional analysis and
other post-closing procedures to ensure that the Company’s consolidated financial statements were prepared in
accordance with generally accepted accounting principles and accurately reflect its financial position and results of
operation as of and for the year ended June 30, 2013.
During fiscal 2014, the Company enhanced its internal testing approach, including performing additional procedures
and expanding the documentation for select controls, to ensure the completeness, existence and accuracy of system
generated information used to support the operation of the controls. As of June 30, 2014, the Company’s
management has concluded that the enhanced testing and the expansion of human resources to improve segregation
of duties have remediated the material weakness.

49
The Company’s internal control over financial reporting as of June 30, 2014 has been audited by KPMG LLP, as
stated in their report which is included elsewhere herein.
Changes in Internal Control over Financial Reporting
Other than the remediation actions described above, there were no other material changes in our internal control
over financial reporting that occurred during the quarter ended June 30, 2014 that have materially affected, or are
reasonably likely to materially affect, our internal control over financial reporting.
ITEM 9B. OTHER INFORMATION
On April 24, 2014, the Board of Directors of Techne Corporation (the “Company”), approved a form of
indemnification agreement (the “Indemnification Agreement”) and authorized the Company to enter into an
Indemnification Agreement with each of the Company’s directors and executive officers and certain other
employees as determined by the Company’s chief executive officer (each an “Indemnitee”).
The Indemnification Agreement clarifies the process and conditions under which the Company will advance
expenses and indemnify each Indemnitee against costs incurred in connection with a proceeding to which an
Indemnitee is made party to, or threatened to be made party to, by reason of anything done or not done by the
Indemnitee in his or her official capacity, or in which he or she serves as a witness by reason of such official
capacity. The indemnification rights provided for in the Indemnification Agreement supersede other agreements on
the topics of indemnification and advancement, including the Company’s Bylaws, and supplement indemnification
and advancement rights provided for under applicable law.
This foregoing description of the material terms of the Indemnification Agreement does not purport to be complete
and is qualified in its entirety by reference to the full text of the Indemnification Agreement, which is attached as
Exhibit 10.27 hereto and is incorporated by reference herein.
On August 27, 2014, the Company, Research and Diagnostic Systems, Inc. (“R&D”), a Minnesota corporation and
wholly-owned subsidiary of the Company, and Cayenne Merger Sub, Inc. (“Merger Sub”), a Delaware corporation
and wholly-owned subsidiary of R&D, entered into a letter agreement (the “Agreement”) with CyVek, Inc., a
Delaware corporation (“CyVek”), relating to the Agreement of Investment and Merger, dated as of April 1, 2014,
among such parties and Citron Capital Limited, as Stockholders’ Agent (the “Merger Agreement”).
Under the Agreement, the parties agreed that they have no obligations under Section 5.5 of the Merger Agreement to
enter into any agreement relating to certain pre-merger services. In addition, the Agreement clarifies that certain
leases or licenses of the CyPlex analyzer solely for binding commitments to purchase cartridges will constitute valid
leases or licenses for purposes of the Commercial Milestone Achievement set forth in Section 7.8 of the Merger
Agreement, and that certain related customers will be considered separate, independent, unaffiliated third-party
customers for purposes of meeting the Commercial Milestone Achievement set forth in Section 7.8 of the Merger
Agreement.
This description of the material terms of the Agreement does not purport to be complete and is qualified in its
entirety by reference to the full text of the Agreement, which will be filed as an exhibit to the Company’s Quarterly
Report on Form 10-Q for the quarter ending September 30, 2014.

50
PART III
ITEM 10. DIRECTORS, EXECUTIVE OFFICERS AND CORPORATE GOVERNANCE
Other than “Executive Officers of the Registrant” which is set forth at the end of Item 1 in Part I of this report, the
information required by Item 10 is incorporated herein by reference to the sections entitled "Election of Directors,"
"Corporate Governance" and "Compliance With Section 16(a) of the Exchange Act" in the Company’s Proxy
Statement for its 2014 Annual Meeting of Shareholders which will be filed with the Securities and Exchange
Commission pursuant to Regulation 14A within 120 days after the close of the fiscal year for which this report is
filed.
ITEM 11. EXECUTIVE COMPENSATION
The information required by Item 11 is incorporated herein by reference to the section entitled “Corporate
Governance” and "Executive Compensation Discussion and Analysis" in the Company’s Proxy Statement for its
2014 Annual Meeting of Shareholders which will be filed with the Securities and Exchange Commission pursuant to
Regulation 14A within 120 days after the close of the fiscal year for which this report is filed.
ITEM 12. SECURITY OWNERSHIP OF CERTAIN BENEFICIAL
OWNERS AND MANAGEMENT AND RELATED SHAREHOLDER MATTERS
Information about the Company’s equity compensation plans at June 30, 2014 is as follows:
Plan Category
Number of
Securities to be
Issued Upon
Exercise of
Outstanding
Options, Warrants
and Rights
Weighted-Average
Exercise Price of
Outstanding
Options, Warrants
and Rights
Number of Securities
Remaining Available
for Future Issuance
Under Equity
Compensation Plans
Equity compensation plans
approved by Shareholders (1)
816,000
$72.11
2.3 million
Equity compensation plans not
approved by Shareholders
0
0
0
(1) Includes the Company’s 2010 Equity Incentive Plan, 1997 Incentive Stock Option Plan and 1998 Nonqualified
Stock Option Plan.
The remaining information required by Item 12 is incorporated by reference to the sections entitled "Principal
Shareholders" and "Management Shareholdings" in the Company’s Proxy Statement for its 2014 Annual Meeting of
Shareholders which will be filed with the Securities and Exchange Commission pursuant to Regulation 14A within
120 days after the close of the fiscal year for which this report is filed.
ITEM 13. CERTAIN RELATIONSHIPS AND RELATED TRANSACTIONS, AND DIRECTOR
INDEPENDENCE
The information required by Item 13 is incorporated by reference to the sections entitled "Corporate Governance" in
the Company’s Proxy Statement for its 2014 Annual Meeting of Shareholders which will be filed with the Securities
and Exchange Commission pursuant to Regulation 14A within 120 days after the close of the fiscal year for which
this report is filed.

51
ITEM 14. PRINCIPAL ACCOUNTING FEES AND SERVICES
The information required by Item 14 is incorporated herein by reference to the section entitled "Audit Matters" in
the Company’s Proxy Statement for its 2014 Annual Meeting of Shareholders which will be filed with the Securities
and Exchange Commission pursuant to Regulation 14A within 120 days after the close of the fiscal year for which
this report is filed.
PART IV
ITEM 15. EXHIBITS, FINANCIAL STATEMENT SCHEDULES
A. (1) List of Financial Statements.
The following Consolidated Financial Statements are filed as part of this Annual Report on Form 10-K:
Consolidated Statements of Earnings and Comprehensive Income for the Years Ended June 30, 2014, 2013
and 2012
Consolidated Balance Sheets as of June 30, 2014 and 2013
Consolidated Statements of Shareholders’ Equity for the Years Ended June 30, 2014, 2013 and 2012
Consolidated Statements of Cash Flows for the Years Ended June 30, 2014, 2013 and 2012
Notes to Consolidated Financial Statements for the Years Ended June 30, 2014, 2013 and 2012
Report of Independent Registered Public Accounting Firm
A. (2) Financial Statement Schedules.
All financial statement schedules are omitted because they are not applicable, not material or the required
information is shown in the Consolidated Financial Statements or Notes thereto.
A. (3) Exhibits.
See “Exhibit Index” immediately following signature page.

52
SIGNATURES
Pursuant to the requirements of Section 13 or 15(d) of the Securities Exchange Act of 1934, the Registrant has duly
caused this Report to be signed on its behalf by the undersigned, thereunto duly authorized.
TECHNE CORPORATION
Date: August 29, 2014 /s/ Charles Kummeth
By: Charles Kummeth
Its: President
Pursuant to the requirements of the Securities Exchange Act of 1934, this Report has been signed by the following
persons on behalf of the Registrant and in the capacities and on the dates indicated.
Date Signature and Title
August 29, 2014 /s/ Robert V. Baumgartner
Robert V. Baumgartner
Chairman of the Board and Director
August 29, 2014 /s/ Roger C. Lucas, Ph.D.
Dr. Roger C. Lucas
Vice Chairman and Director
August 29, 2014 /s/ Howard V. O’Connell
Howard V. O’Connell, Director
August 29, 2014 /s/ Randolph C. Steer, Ph.D., M.D.
Dr. Randolph C. Steer, Director
August 29, 2014 /s/ Charles A. Dinarello, M.D.
Dr. Charles A. Dinarello, Director
August 29, 2014 /s/ Karen A. Holbrook, Ph.D.
Dr. Karen A. Holbrook, Director
August 29, 2014 /s/ John L. Higgins
John L. Higgins, Director
August 29, 2014 /s/ Roeland Nusse, Ph.D.
Dr. Roeland Nusse, Director
August 29, 2014 /s/ Harold J. Wiens
Harold J. Wiens, Director
August 29, 2014 /s/ Charles Kummeth
Charles Kummeth, Chief Executive Officer
(principal executive officer)
August 29, 2014 /s/ James Hippel
James Hippel, Chief Financial Officer
(principal financial officer and principal accounting
officer)

53
EXHIBIT INDEX
for Form 10-K for the 2014 Fiscal Year
Exhibit
Number
Description
3.1
Restated Bylaws of Company, as amended to date--incorporated by reference to Exhibit 3.1 of the
Company’s Form 8-K dated October 25, 2012.*
3.2 Restated Articles of Incorporation of the Company, as amended to date--incorporated by reference to
Exhibit 3.2 of the Company’s Form 8-K, dated October 25, 2012.*
10.1** Company’s Profit Sharing Plan--incorporated by reference to Exhibit 10.6 of the Company’s Form 10,
dated October 27, 1988.*
10.2** Company’s Stock Bonus Plan--incorporated by reference to Exhibit 10.7 of the Company’s Form 10,
dated October 27, 1988.*
10.3** 1997 Incentive Stock Option Plan--incorporated by reference to Exhibit 10.24 of the Company’s Form
10-K for the year ended June 30, 1997.*
10.4** Form of Stock Option Agreement for 1997 Incentive Stock Option Plan--incorporated by reference to
Exhibit 10.25 of the Company’s Form 10-K for the year ended June 30, 1997.*
10.5** 1998 Nonqualified Stock Option Plan--incorporated by reference to Exhibit 10.1 of the Company’s
Form 10-Q for the quarter ended September 30, 1998.*
10.6** Form of Stock Option Agreement for 1998 Nonqualified Stock Option Plan--incorporated by reference
to Exhibit 10.2 of the Company’s Form 10-Q for the quarter ended September 30, 1998.*
10.7 Amended and Restated Investors Rights Agreement dated June 13, 2006 among ChemoCentryx, Inc
and the Company and certain investors--incorporated by reference to Exhibit 10.31 of the Company’s
10-K for the year ended June 30, 2006.*
10.8**
Description of Management Incentive Bonus Under the Techne Corporation 2010 Equity Incentive
Plan--incorporated by reference to Exhibit 10.13 of the Company’s 10-K for the year ended June
30, 2013.*
10.9** 2010 Equity Incentive Plan--incorporated by reference to Exhibit 10.1 of the Company’s 8-K dated
October 28, 2010.*
10.10** Form of Nonqualified Stock Option Agreement for the 2010 Equity Incentive Plan--incorporated by
reference to Exhibit 10.2 of the Company’s 8-K dated October 28, 2010.*
10.11** Form of Incentive Stock Option Agreement for the 2010 Equity Incentive Plan--incorporated by
reference to Exhibit 10.3 of the Company’s 8-K dated October 28, 2010.*
10.12** Amended and Restated Employment Agreement, dated July 1, 2011, with Marcel Veronneau--
incorporated by reference to Exhibit 10.19 of the Company’s 10-K for the year ended June 30, 2011.*
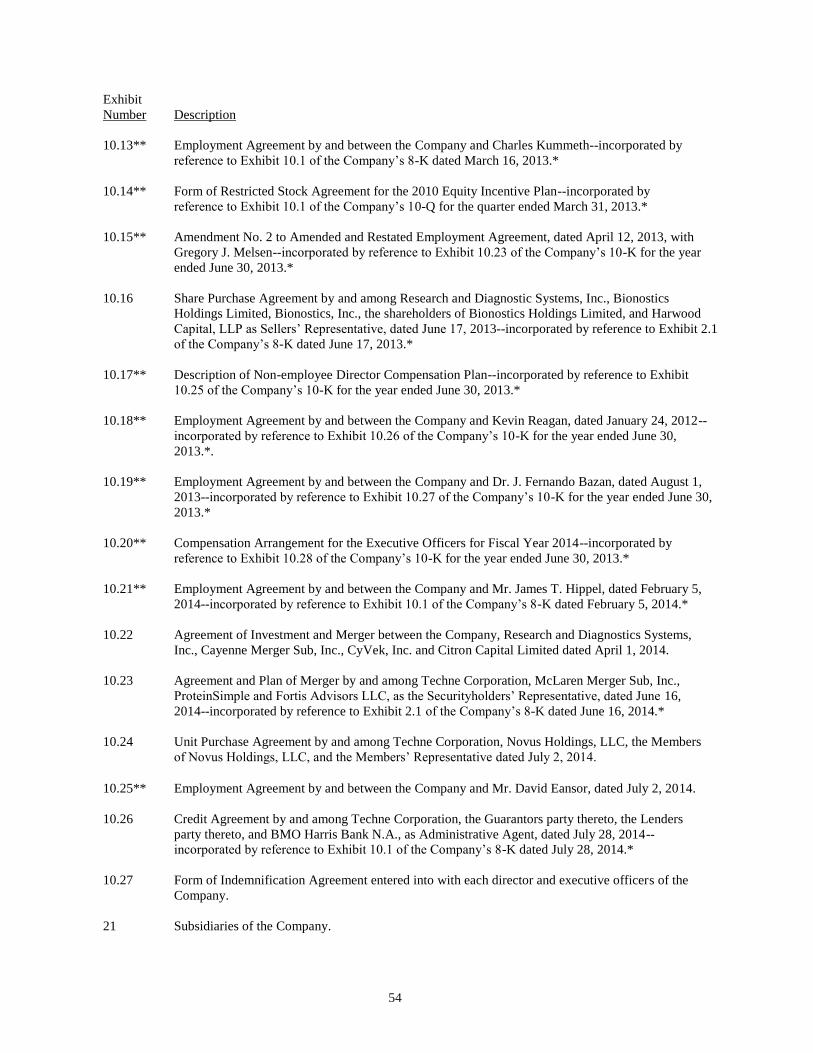
54
Exhibit
Number
Description
10.13** Employment Agreement by and between the Company and Charles Kummeth--incorporated by
reference to Exhibit 10.1 of the Company’s 8-K dated March 16, 2013.*
10.14** Form of Restricted Stock Agreement for the 2010 Equity Incentive Plan--incorporated by
reference to Exhibit 10.1 of the Company’s 10-Q for the quarter ended March 31, 2013.*
10.15** Amendment No. 2 to Amended and Restated Employment Agreement, dated April 12, 2013, with
Gregory J. Melsen--incorporated by reference to Exhibit 10.23 of the Company’s 10-K for the year
ended June 30, 2013.*
10.16 Share Purchase Agreement by and among Research and Diagnostic Systems, Inc., Bionostics
Holdings Limited, Bionostics, Inc., the shareholders of Bionostics Holdings Limited, and Harwood
Capital, LLP as Sellers’ Representative, dated June 17, 2013--incorporated by reference to Exhibit 2.1
of the Company’s 8-K dated June 17, 2013.*
10.17** Description of Non-employee Director Compensation Plan--incorporated by reference to Exhibit
10.25 of the Company’s 10-K for the year ended June 30, 2013.*
10.18** Employment Agreement by and between the Company and Kevin Reagan, dated January 24, 2012--
incorporated by reference to Exhibit 10.26 of the Company’s 10-K for the year ended June 30,
2013.*.
10.19** Employment Agreement by and between the Company and Dr. J. Fernando Bazan, dated August 1,
2013--incorporated by reference to Exhibit 10.27 of the Company’s 10-K for the year ended June 30,
2013.*
10.20** Compensation Arrangement for the Executive Officers for Fiscal Year 2014--incorporated by
reference to Exhibit 10.28 of the Company’s 10-K for the year ended June 30, 2013.*
10.21** Employment Agreement by and between the Company and Mr. James T. Hippel, dated February 5,
2014--incorporated by reference to Exhibit 10.1 of the Company’s 8-K dated February 5, 2014.*
10.22 Agreement of Investment and Merger between the Company, Research and Diagnostics Systems,
Inc., Cayenne Merger Sub, Inc., CyVek, Inc. and Citron Capital Limited dated April 1, 2014.
10.23 Agreement and Plan of Merger by and among Techne Corporation, McLaren Merger Sub, Inc.,
ProteinSimple and Fortis Advisors LLC, as the Securityholders’ Representative, dated June 16,
2014--incorporated by reference to Exhibit 2.1 of the Company’s 8-K dated June 16, 2014.*
10.24 Unit Purchase Agreement by and among Techne Corporation, Novus Holdings, LLC, the Members
of Novus Holdings, LLC, and the Members’ Representative dated July 2, 2014.
10.25** Employment Agreement by and between the Company and Mr. David Eansor, dated July 2, 2014.
10.26 Credit Agreement by and among Techne Corporation, the Guarantors party thereto, the Lenders
party thereto, and BMO Harris Bank N.A., as Administrative Agent, dated July 28, 2014--
incorporated by reference to Exhibit 10.1 of the Company’s 8-K dated July 28, 2014.*
10.27 Form of Indemnification Agreement entered into with each director and executive officers of the
Company.
21 Subsidiaries of the Company.

55
Exhibit
Number
Description
23
Consent of KPMG LLP, Independent Registered Public Accounting Firm.
31.1 Certification of Chief Executive Officer pursuant to Section 302 of the Sarbanes-Oxley Act of 2002.
31.2 Certification of Chief Financial Officer pursuant to Section 302 of the Sarbanes-Oxley Act of 2002.
32.1
Certification of Chief Executive Officer pursuant to Section 906 of the Sarbanes-Oxley Act of 2002.
32.2 Certification of Chief Financial Officer pursuant to Section 906 of the Sarbanes-Oxley Act of 2002.
101 The following financial statements from the Company’s Annual Report on Form 10-K for the fiscal
year ended June 30, 2014, formatted in Extensible Business Reporting Language (XBRL): (i) the
Consolidated Statements of Earnings and Comprehensive Income, (ii) the Consolidated Balance
Sheets, (iii) the Consolidated Statements of Shareholders’ Equity, (iv) the Consolidated Statements
of Cash Flows, and (v) Notes to the Consolidated Financial Statements.
\
-------------
* Incorporated by reference; SEC File No. 000-17272
** Management contract or compensatory plan or arrangement
Exhibits for Form 10-K have not been included in this report. Exhibits have been filed with the Securities and
Exchange Commission. Upon request to the Investor Relations Department, Techne Corporation will furnish,
without charge, any such exhibits as well as copies of periodic reports filed with the Securities and Exchange
Commission.

This page intentionally left blank

This page intentionally left blank

This page intentionally left blank
TECH is Bio-Techne Corporation’s Nasdaq stock symbol, which is listed on the Nasdaq Global Select Market.
Annual Meeting The annual meeting of shareholders of Bio-Techne Corporation will be held at the corporate office, 614 McKinley Place NE, Minneapolis, Minnesota, on Thursday, October 30, 2014, at 3:30 p.m. (CDT).
Corporate Offices Bio-Techne Corporate Office and R&D Systems, Inc. 614 McKinley Place NE Minneapolis, MN 55413-2610, USA (612) 379-8854
R&D Systems Europe 19 Barton Lane Abingdon Science Park Abingdon, Oxon OX14 3NB, UK 1235 529449
R&D Systems GmbH Borsigstrasse 7a 65205 Wiesbaden-Nordenstadt, Germany 6122 90980
Tocris Holdings Limited IO Centre Moorend Farm Avenue Bristol, BS11 0QL, UK (44) 117 916 3336
R&D Systems China 24 – A1 Hua Min Empire Plaza 726 West Yan An Road Shanghai, People’s Republic of China 21 52380373
R&D Systems Hong Kong Unit 208B 2nd Floor Photonics Centre Hong Kong Science Park New Territories, Hong Kong (852) 29926006
BiosPacific 5980 Horton Street, Suite 360 Emeryville, CA 94608, USA (510) 652-6155
Boston Biochem 840 Memorial Drive Cambridge, MA 02139, USA (617) 576-2210
Bionostics 7 Jackson Road Devens, MA 01434, USA (978) 772-7070
Novus Biologicals 8100 Southpark Way, A8 Littleton, CO 80120, USA (303) 730-1950
Protein Simple 3040 Oakmead Village Drive Santa Clara, CA 95051, USA (408) 510-5500
Board of Directors Robert V. Baumgartner Chairman of the Board and Director
Roger C. Lucas, Ph.D. Vice Chairman and Director
Charles Kummeth President, Chief Executive Officer and Director
Charles A. Dinarello, M.D. Director
John L. Higgins Director
Karen A. Holbrook, Ph.D. Director
Roeland Nusse, Ph.D. Director
Howard O’Connell Director
Randolph C. Steer, M.D., Ph.D. Director
Harold J. Wiens Director
Executive Officers Charles Kummeth President and Chief Executive Officer
James T. Hippel Chief Financial Officer
J. Fernando Bazan, Ph.D. Chief Technology Officer
David Eansor Senior VP, Novus Biologicals
Brenda Furlow Senior VP, General Counsel
Kevin J. Reagan, Ph.D. Senior VP, Biotechnology
Marcel Veronneau Senior VP, Clinical Controls
CORPORATE INFORMATION
CA_ARFY2014cover_09.14_final.indd 3 9/10/2014 12:33:09 PM

614 McKinley Place N.E., Minneapolis, Minnesota 55413 bio-techne.com 612 379 8854 Fax: 612 379 6580
CA_ARFY2014cover_09.14_final.indd 4 9/10/2014 12:33:09 PM