Tech, Trade Tensions, and Tightening: Key Market Topics ... · As of December 31, 2017 for...
26
Tech, Trade Tensions, and Tightening: Key Market Topics for Spring April 19, 2018 Rebecca Patterson Chief Investment Officer Alex Christie Portfolio Manager
Transcript of Tech, Trade Tensions, and Tightening: Key Market Topics ... · As of December 31, 2017 for...

Tech, Trade Tensions, and Tightening: Key Market Topics for Spring
April 19, 2018
Rebecca PattersonChief Investment Officer
Alex ChristiePortfolio Manager
This summary is for your general information. The discussion of any tax, charitable giving, or estate planning alternatives and other observations herein are not intended as legal or tax advice and do not take into account the particular estate planning objectives, financial situation or needs of individual clients. This summary is based upon information obtained from various sources that Bessemer believes to be reliable, but Bessemer makes no representation or warranty with respect to the accuracy or completeness of such information. Views expressed herein are current only as of the date indicated and are subject to change without notice. Forecasts may not be realized due to a variety of factors, including changes in law, regulation, interest rates, and inflation.
Past performance is no guarantee of future results. This material is provided for your general information. It does not take into account the particular investment objectives, financial situation, or needs of individual clients. This material has been prepared based on information that Bessemer Trust believes to be reliable, but Bessemer Trust makes no representation or warranty with respect to the accuracy or completeness of such information. This presentation does not include a complete description of any fund or portfolio mentioned herein and is not an offer to sell any securities. Investors should carefully consider the investment objectives, risks, charges, and expenses of each fund or portfolio before investing.
Views expressed herein are current only as of the date indicated, and are subject to change without notice. Forecasts may not be realized due to a variety of factors, including changes in economic growth, corporate profitability, geopolitical conditions, and inflation. The mention of a particular security is not intended to represent a stock-specific or other investment recommendation, and our view of these holdings may change at any time based on stock price movements, new research conclusions, or changes in risk preference. Index information is included herein to show the general trend in the securities markets during the periods indicated and is not intended to imply that any referenced portfolio is similar to the indices in either composition or volatility. Index returns are not an exact representation of any particular investment, as you cannot invest directly in an index.
2

Agenda
§ Technology: Sector in the Spotlight and How Bessemer Is Positioned
§ Trade Tensions: Putting in Context and Looking Ahead
§ Tightening: How the Federal Reserve Views the Economic Outlook and What It Means for Portfolios
§ Key Takeaways and Current Portfolio Positioning
3

Technology is … Massive
4
Left as of April 17, 2018. Right as of December 31, 2017. Source: FactSet, Bureau of Economic Analysis
S&P 500 Sector Weights Capital Spending as a Share of GDP
Information Technology 25.0%
Health Care13.7%
Financials 14.6%Industrials 10.1%
Consumer Discretionary
12.6%
Consumer Staples7.6%
Energy 6.1%Materials 2.9%
Utilities 2.8%
Telecom Services1.9% Real Estate 2.8%
IT Equipment, Software and R&D
42%
Other58%

Technology is … Accelerating
5
Cloud
Digital
Big Data
IoT AI
SaaS
Mobile
Social Media e-commerce
Automation
Cyber Security
Block Chain

0%
10%
20%
30%
40%
50%
Apr 17 Jul 17 Oct 17 Jan 18 Apr 18
The Technology Sector Has Performed Well
6
S&P Tech Sector
S&P 500
Average Return 33%
One-Year Total ReturnIndexed to 0 on April 13, 2017
One-Year Total Return, Tech Sector Constituents
As of April 17, 2018. Source: FactSet
-20% 20% 60% 100% 140%Advanced Micro Device
SymantecWestern Union Company
CorningQUALCOMM
CAKLA-Tencor
FacebookCadence Design Systems
Fidelity National Information ServicesFiserv
Alphabet (Class C)Hewlett Packard Enterprise
Motorola SolutionsCisco Systems
Activision BlizzardCognizant Technology Solutions
MicrosoftFLIR Systems
Applied MaterialsLam Research
NetAppRed HatNVIDIA

Bessemer Technology Exposure
We like many attributes of technology stocks, and portfolios have benefited from being overweight§ High gross margins and returns on investments
§ Solid growth prospects
§ Competitive advantages
§ Low use of debt
§ Reduced cyclicality
Tech themes in Bessemer equity portfolios§ Cloud
§ Digitalization/software/SaaS
§ Payment technologies
§ e-commerce platforms
§ Artificial intelligence
7

Bitcoin Interest and Prices Skyrocketed in 2017
8
As of March 21, 2018. Google search numbers represent search interest relative to the highest point on the chart for the given region and time. A value of 100 is the peak popularity for the term. A value of 50 means that the term is half as popular. A score of 0 means there was not enough data for this term.Source: Bloomberg, Google
0
10
20
30
40
50
60
70
80
90
100
0
2,000
4,000
6,000
8,000
10,000
12,000
14,000
16,000
18,000
20,000
2013 2014 2015 2016 2017 2018
Bitcoin per U.S. Dollar (L)Google Searches: Bitcoin (R)
Bitcoin Per Dollar and Worldwide Google Searches for Bitcoin

Crypto Not Ready to Replace Mainstream Currencies or Gold Anytime Soon
Attribute Fiat Money Gold Crypto Currencies
Store of value Yes Yes Sometimes
Easy to hold/exchange Yes Sometimes Usually
Universally accepted Yes Yes No
Stability of value Usually Usually No
Legal oversight Yes Yes No
Anonymity No No Yes
9

Central Banks Around the World Working on Sovereign Cryptocurrencies
10
As of January 2018. CBCC stands for Central Bank Crypto Currency. Source: Bank for International Settlements, Bessemer Trust

Agenda
§ Technology: Sector in the Spotlight and How Bessemer Is Positioned
§ Trade Tensions: Putting in Context and Looking Ahead
§ Tightening: How the Federal Reserve Views the Economic Outlook and What It Means for Portfolios
§ Key Takeaways and Current Portfolio Positioning
11

Key U.S. Trade Developments
12
As of April 6, 2018. Unfilled bars represent as-yet-unimplemented tariffs.
Source: J.P. Morgan
Tariffs on U.S. Tariffs on China
Announced Tariffs by China and U.S.
Billions
$2.2
-$0.8
$3
-$3
$50
-$50
$150
-$100 $0 $100 $200
U.S. Wash Mach/Solar Panels (Jan 22)
CH Retaliation on Sorguhm (Feb 4)
U.S. Steel & Ali (Mar 18)
CH Steel & Ali Retaliation (Apr 2)
U.S. Section 301 (Apr 3)
CH Retaliation to Section 301 (Apr 4)
U.S. Revised Section 301 (April 5)
As-Yet-Unimplemented
Tariffs
Potential Next Steps?
§ CFIUS legislation§ China technology and
“reciprocity”§ Comment window for Section
301 proposals§ Outlines of NAFTA deal§ TPP???

Key U.S. Fiscal Developments
December 2017: Tax Cuts and Jobs Act§ Includes provisions to lower corporate tax rate, as well as change international taxes, taxation of
domestic business activity, individual income taxes, estate and gift taxes
– Top individual tax rate lowered from 39.6% to 37%; maximum deduction for state/local real estate, personal property and either income or sales taxes capped at $10,000 (previously no limit)
– Top corporate tax rate lowered from 35% to 21%; one-time deemed repatriation tax on accumulated foreign earnings at 8% for active business and 15.5% for liquid assets (“cash”), to be paid over eight years
February 2018: Spending Package§ Two-year plan to increase both defense and non-defense spending by a total of roughly $300 billion
§ Federal debt ceiling raised through March 2019
CBO’s Take:§ Stimulus should boost GDP over next few years but longer-term potential growth is likely to remain
around 2%
§ Budget deficit rising toward 5% of GDP while federal debt on track to rise from 76.5% of GDP in 2017 to 96.2% by 2028
13

As of April 9, 2018. Source: Congressional Budget Office, Capital Economics
1968 1978 1988 1998 2008 2018 2028-10%-8%-6%-4%-2%0%2%4%
U.S. Fiscal Developments: Visual ImplicationsFederal Budget Balance
Percent of GDP
14
14%
17%
20%
23%
26%
1968 1978 1988 1998 2008 2018 2028
Revenue
Outlays
0%
1%
2%
3%
4%
1968 1978 1988 1998 2008 2018 20280.0%
0.5%
1.0%
1.5%
2.0%
2.5%
2010 2013 2016 2019 2022 2025 2028
April 2018
June 2017
Federal Interest CostsPercent of GDP
Federal Outlays & RevenuePercent of GDP
Real Potential GDPYoY
CBO Projections
CBO ProjectionsCBO
Projections
CBO Projections

Equity Tug of War with Fiscal and Trade Policies
15
As of April 16, 2018. Equity Market is measured using the S&P 500. Source: Bloomberg
Equity Market Lows Holding as Trade Policy Remains in Focus
2300
2400
2500
2600
2700
2800
2900
Mar 17 May 17 Jul 17 Sep 17 Nov 17 Jan 18 Mar 18
"Conciliatory" Xi Speech
Metal Tariffs
Inflation Fear+Vol Sell-Off
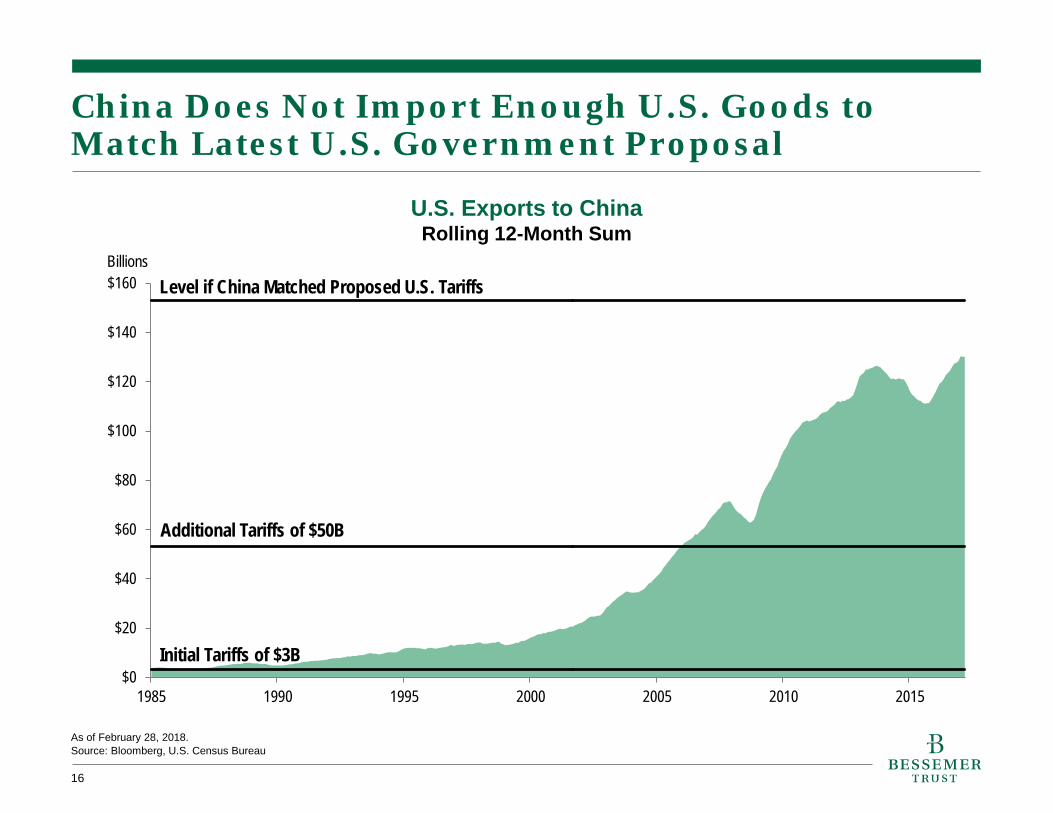
China Does Not Import Enough U.S. Goods to Match Latest U.S. Government Proposal
16
As of February 28, 2018. Source: Bloomberg, U.S. Census Bureau
$0
$20
$40
$60
$80
$100
$120
$140
$160
1985 1990 1995 2000 2005 2010 2015
U.S. Exports to ChinaRolling 12-Month Sum
Initial Tariffs of $3B
Additional Tariffs of $50B
Level if China Matched Proposed U.S. Tariffs Billions

6.0
6.1
6.2
6.3
6.4
6.5
6.6
6.7
6.8
6.9
7.0
Apr 13 Dec 13 Aug 14 Apr 15 Dec 15 Aug 16 Apr 17 Dec 17
China Has Other Options for Trade Retaliation
17
As of April 16, 2018. Source: Bloomberg
August 2015 Devaluation
Chinese Renminbi Has Room for Depreciation/Devaluation If NeededChinese Renminbi per U.S. Dollar

-40%
-30%
-20%
-10%
0%
10%
20%
30%
-30
-20
-10
0
10
20
30
40
2004 2006 2008 2010 2012 2014 2016 2018
Equipment Spending (Right)Composite Capex Plans Index (Left)
YoY, SAAR
What Will Matter Most to Corporate Decision-Makers: Fiscal Policy or Trade?
As of December 31, 2017 for equipment spending. As of March 31, 2018 for composite capex plans index. Composite capex plans index is the average of planned capex series from the Dallas Fed, Kansas City Fed, NY Fed, Philly Fed, and Richmond Fed Manufacturing Surveys. Source: Strategas, Federal Reserve, U.S. Bureau of Economic Analysis
Capex Plans vs. Actual Capex
18

Agenda
§ Technology: Sector in the Spotlight and How Bessemer Is Positioned
§ Trade Tensions: Putting in Context and Looking Ahead
§ Tightening: How the Federal Reserve Views the Economic Outlook and What It Means for Portfolios
§ Key Takeaways and Current Portfolio Positioning
19

U.S. Expansion Mature, but Recession Not Imminent
As of March 31, 2018. Recession colors indicate: green (positive economic growth momentum), yellow (neutral momentum) and red (weakening momentum). Source: Bloomberg, National Bureau of Economic Research
Yield Curve Not Yet InvertedDifference Between 10-Year and 2-Year Yields
Key Recession Indicators
20
-2.5%
-2.0%
-1.5%
-1.0%
-0.5%
0.0%
0.5%
1.0%
1.5%
2.0%
2.5%
3.0%
1977 1985 1993 2001 2009 2017
Recession Jobless claims
ISM services
ISM manufacturing
Consumer confidence
Personal consumption
Existing home sales
Single family housing permits
Yield curve
Vehicle sales
Investment grade bond spreads

Will Higher U.S. Bond Yields Attract Enough Buyers?
21
As of December 31, 2017.Source: Bloomberg, U.S. Treasury
Foreign Official Holdings of U.S. Securities Percent of Reserves
50%
52%
54%
56%
58%
60%
2001 2005 2009 2013 2017

-120
-100
-80
-60
-40
-20
0
20
40
60
80
100
-35
-30
-25
-20
-15
-10
-5
0
5
1985 1990 1995 2000 2005 2010 2015
Europe Attracting and Keeping More Capital as Economy Recovers, Bond Yields Rise
Left as of February 28, 2018. ZEW data is based on surveys of up to 300 financial market experts. Consumer confidence and ZEW Eurozone Assessment of Current Situation are diffusion indices, meaning a reading above (below) 0 indicates that more (fewer) surveyed individuals reported a positive view on a scale of -100 to 100. Source: Bloomberg, Eurostat, ZEW Zentrum fuer Europaeische Wirtschaftsforschung GmbH
Consumer Confidence and Assessment of the Current Economy Near All-Time Highs
ZEW Eurozone Assessment of Current Situation (R)
Consumer Confidence (L)
German Bond Yields Rise on Improved OutlookGerman 10-Year Government Bond Yield
-0.2%
0.0%
0.2%
0.4%
0.6%
0.8%
Jan 16 Jul 16 Jan 17 Jul 17 Jan 18
22

Higher Interest Rates Don’t Guarantee Strong USD
23
As of January 31, 2018. U.S. dollar is measured using the Federal Reserve Trade-Weighted Major Currencies Index.Source: Bloomberg, Federal Reserve
85
90
95
100
105
110
115
-6 0 6 12 18 24 30 36Months Relative to First Hike
Mar 83 Feb 88Feb 94 Jun 99Jun 04 Dec 15
Start of Rate Hikes
Trade-Weighted U.S. Dollar Performance During Fed Tightening Cycles
Indexed to 100 the Month of the First Rate Hike
± Higher interest rates± Corporate repatriation± Strong U.S. growth/earnings
attracting capital flows
± Widening current-account deficit± Stronger overseas growth and
relatively attractive equity valuations pulling capital out of U.S.
± Central banks potentially shifting reserves at margin
Starting Month of Rate Hikes

Agenda
§ Technology: Sector in the Spotlight and How Bessemer Is Positioned
§ Trade Tensions: Putting in Context and Looking Ahead
§ Tightening: How the Federal Reserve Views the Economic Outlook and What It Means for Portfolios
§ Key Takeaways and Current Portfolio Positioning
24

Key Takeaways and Current Portfolio Positioning
25
Core Views Portfolio Implications
Global economy moderating into spring but still robust; central banks moving gradually
Hold equity exposure and modest underweight to fixed income
Late-cycle dynamics increasingly apparent; volatility likely to persist in coming quarters
Maintain defensive exposures within equity mandates as well as broader commodity exposure
Balance of payments dynamics offset rising interest rates; dollar range-bound to modestly weaker
Supportive for emerging market equities at the margin; commodities offer partial hedge for dollar
Political and policy uncertainty a risk for business and consumer confidence
Portfolio changes more likely if uncertainty starts to weigh on confidence indicators