Tech TECHNICAL REPORT
16
Tech Water and Wastewater Impact Fee Study July 2021 TECHNICAL REPORT West Travis County PUA Nelisa Heddin Consulting [email protected] (512) 589-1028
Transcript of Tech TECHNICAL REPORT

Tech
Water and Wastewater Impact Fee Study July 2021
TECHNICAL REPORT West Travis County PUA
Nelisa Heddin Consulting [email protected] (512) 589-1028
Page 1 of 9
Land Use Assumption and Impact Fee Report West Travis County Public Utility Agency
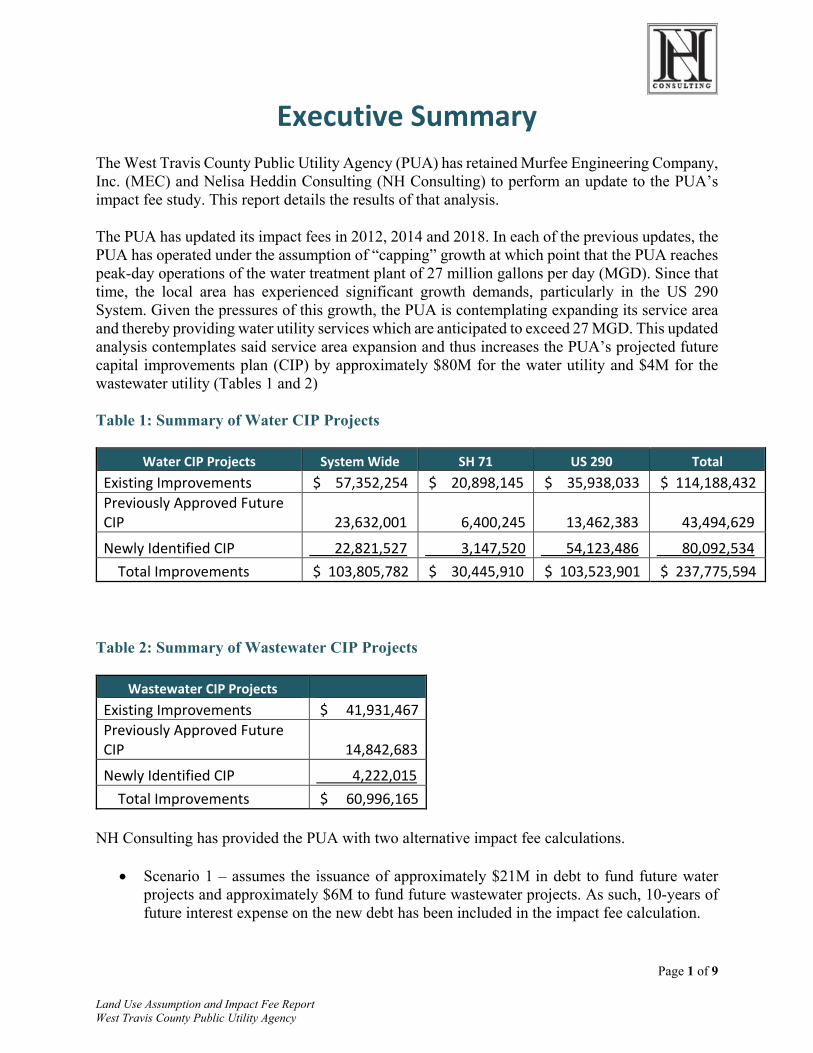
Executive Summary The West Travis County Public Utility Agency (PUA) has retained Murfee Engineering Company, Inc. (MEC) and Nelisa Heddin Consulting (NH Consulting) to perform an update to the PUA’s impact fee study. This report details the results of that analysis.
The PUA has updated its impact fees in 2012, 2014 and 2018. In each of the previous updates, the PUA has operated under the assumption of “capping” growth at which point that the PUA reaches peak-day operations of the water treatment plant of 27 million gallons per day (MGD). Since that time, the local area has experienced significant growth demands, particularly in the US 290 System. Given the pressures of this growth, the PUA is contemplating expanding its service area and thereby providing water utility services which are anticipated to exceed 27 MGD. This updated analysis contemplates said service area expansion and thus increases the PUA’s projected future capital improvements plan (CIP) by approximately $80M for the water utility and $4M for the wastewater utility (Tables 1 and 2)
Table 1: Summary of Water CIP Projects
Water CIP Projects System Wide SH 71 US 290 Total Existing Improvements $ 57,352,254 $ 20,898,145 $ 35,938,033 $ 114,188,432 Previously Approved Future CIP 23,632,001 6,400,245 13,462,383 43,494,629
Newly Identified CIP 22,821,527 3,147,520 54,123,486 80,092,534 Total Improvements $ 103,805,782 $ 30,445,910 $ 103,523,901 $ 237,775,594
Table 2: Summary of Wastewater CIP Projects
Wastewater CIP Projects Existing Improvements $ 41,931,467 Previously Approved Future CIP 14,842,683
Newly Identified CIP 4,222,015 Total Improvements $ 60,996,165
NH Consulting has provided the PUA with two alternative impact fee calculations.
• Scenario 1 – assumes the issuance of approximately $21M in debt to fund future water projects and approximately $6M to fund future wastewater projects. As such, 10-years of future interest expense on the new debt has been included in the impact fee calculation.
Page 2 of 9
Land Use Assumption and Impact Fee Report West Travis County Public Utility Agency
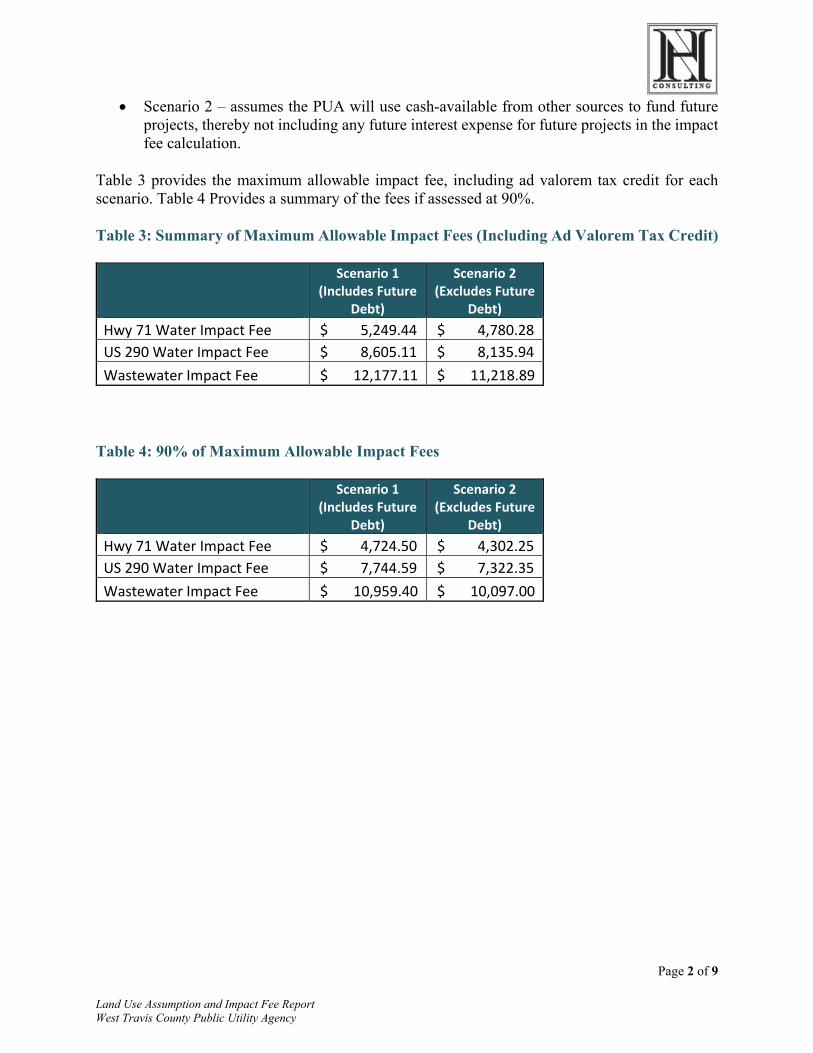
• Scenario 2 – assumes the PUA will use cash-available from other sources to fund future projects, thereby not including any future interest expense for future projects in the impact fee calculation.
Table 3 provides the maximum allowable impact fee, including ad valorem tax credit for each scenario. Table 4 Provides a summary of the fees if assessed at 90%.
Table 3: Summary of Maximum Allowable Impact Fees (Including Ad Valorem Tax Credit)
Scenario 1 (Includes Future
Debt)
Scenario 2 (Excludes Future
Debt) Hwy 71 Water Impact Fee $ 5,249.44 $ 4,780.28 US 290 Water Impact Fee $ 8,605.11 $ 8,135.94 Wastewater Impact Fee $ 12,177.11 $ 11,218.89
Table 4: 90% of Maximum Allowable Impact Fees
Scenario 1 (Includes Future
Debt)
Scenario 2 (Excludes Future
Debt) Hwy 71 Water Impact Fee $ 4,724.50 $ 4,302.25 US 290 Water Impact Fee $ 7,744.59 $ 7,322.35 Wastewater Impact Fee $ 10,959.40 $ 10,097.00
Page 3 of 9
Land Use Assumption and Impact Fee Report West Travis County Public Utility Agency
Background West Travis County Public Utility Agency
The PUA provides water and wastewater services to an estimated population of 60,000 people located in Travis and Hays counties. The PUA acquired the systems from the Lower Colorado River Authority (LCRA) in March 2012. Since that time, the PUA has continued to provide continuous and adequate service to the affected population.
The PUA was created in partnership through concurrent ordinances of the City of Bee Cave, Travis County Municipal Utility District #5 (now Lake Pointe Municipal Utility District), and Hays County as a vehicle to finance, own, and operate the West Travis County water and wastewater utility systems as a publicly owned utility. The PUA Board is currently comprised of five members, each appointed by each of the three sponsoring entities.
Installment Purchase Agreement
In order to purchase the systems by a public entity rather than a divestiture to a private for-profit utility, the PUA was required to retire the debt which LCRA had outstanding against the systems. In March 2012, the principal balance of that debt exceeded $140M, plus interest accrual. However, many of LCRA’s bonds were not “callable.” As such, immediately retiring the bonds would require the payment of defeasance costs, which would have added significant costs to ratepayers.
In order to avoid payment of additional defeasance costs, the PUA entered into an installment purchase agreement with the LCRA, which outlined specific timing for installment payments through 2019. These installment payments coincided with “call dates” associated with LCRA’s bonds. Installment payments consisted of the principal balance on the callable bonds, plus capitalized interest accrued. The PUA made its first installment payment to the LCRA in July 2012. Since that time, the PUA funded subsequent installment payments through the issuance of bonds. The PUA made its final $15M installment payment to the LCRA in the Spring of 2019. Installment payments to the LCRA included both the principal balance on the bonds as well as accrued interest.
System Debt
Since its inception in 2012, the PUA has issued several series of revenue bonds. These issuances not only funded payments to the LCRA but also funded construction of existing and future capital improvement projects necessary to support regional growth.
In order to be rated for bonds, the PUA presented a financial pro forma which illustrated the PUA’s ability to support its bonded indebtedness through rates and fees. In 2012, the PUA received an “A-“ bond rating by Standard & Poors. In December, 2017 the PUA had its rating upgraded by Standard & Poors to “A positive” and “A1” by Moody’s Investor Service. This improved rating is due to increased cash reserves and improved operational and financial management of the utility, including significant cost reductions and revenue enhancements.
Page 4 of 9
Land Use Assumption and Impact Fee Report West Travis County Public Utility Agency
System Revenues and Expenses
The PUA is a non-taxing entity. Accordingly, the PUA’s only available avenues for revenue recovery are through rates and fees charged to current and future customers of the system. To the extent the PUA does not recover the costs of providing future service to customers through impact fees, those costs must be recovered through rates. The PUA is allowed to set impact fees at an amount at or below the maximum allowable fee as determined by the impact fee calculation. So long as the PUA does not go above the maximum allowable fee, the PUA may use policy initiatives to determine the appropriate level of the impact fee. This balance must be considered when setting an appropriate impact fee, realizing that any portion of the costs not recovered by impact fees will need to be recovered through monthly rates charged to customers.
Impact Fee Fund
Impact fees are only collected from new growth in the system. Existing customers are not subject to pay impact fees1. The PUA maintains impact fees collected in a separate fund. The PUA spends impact fee monies only for authorized purposes in compliance with Chapter 395 of the Texas Local Government Code. The PUA has created a plan for spending those funds in accordance with Chapter 395.
1 Currently existing customers are not subject to impact fees with the exception of a currently existing customer who increases their level of service.
Page 5 of 9
Land Use Assumption and Impact Fee Report West Travis County Public Utility Agency
Purpose of Report One of the most effective growth management tools available to public utilities is the use of new customer impact fees, which facilitates growth paying for itself vs. existing customers paying for this cost burden in rates. The PUA has adopted a ten-year Land Use Assumptions and Capital Improvements Plan (CIP) to service growth in the system, and the cost of the 10-year CIP is the basis for calculating impact fees. Impact fees are calculated by taking the total cost of the CIP divided by the projected growth in living unit equivalents (LUEs) in the system for water and wastewater. The last step in the process to adopt an impact fee is the determination of the maximum allowable impact fees per the guidelines set forth in Chapter 395 of the Texas Local Government Code.
Chapter 395 of the Texas Local Government Code provides specific requirements that cities, water districts and other political subdivisions in Texas must abide by while determining, assessing, and collecting Impact Fees. The process outlined for implementing or amending fees includes:
1. Development of Land Use Assumptions (LUA); 2. Development of Capital Improvement Plan (CIP) based on LUA; 3. Development of maximum impact fees; 4. Public hearing on LUA, CIP and impact fees; 5. Adoption of or amendment to LUA, CIP and impact fees;
NH Consulting has been retained by the PUA to determine the maximum allowable impact fee per requirements set forth in Chapter 395 of the Texas Local Government Code, based upon the Land Use Assumptions and Capital Improvements Plan adopted by the PUA Board of Directors.
This report is intended to outline the methodology utilized by NH Consulting in determining the maximum allowable impact fee that can be charged by the PUA.
Page 6 of 9
Land Use Assumption and Impact Fee Report West Travis County Public Utility Agency
Methodology and Findings In developing amendments to impact fees charged to the PUA’s customers, it was first necessary to develop a future assumption of system growth. Next, capital improvements which are necessary to meet the needs of that growth are identified. Finally, a maximum allowable impact fee may be determined. Making this determination involves a systematic progression of steps, which are outlined below.
Step 1: Land Use Assumptions
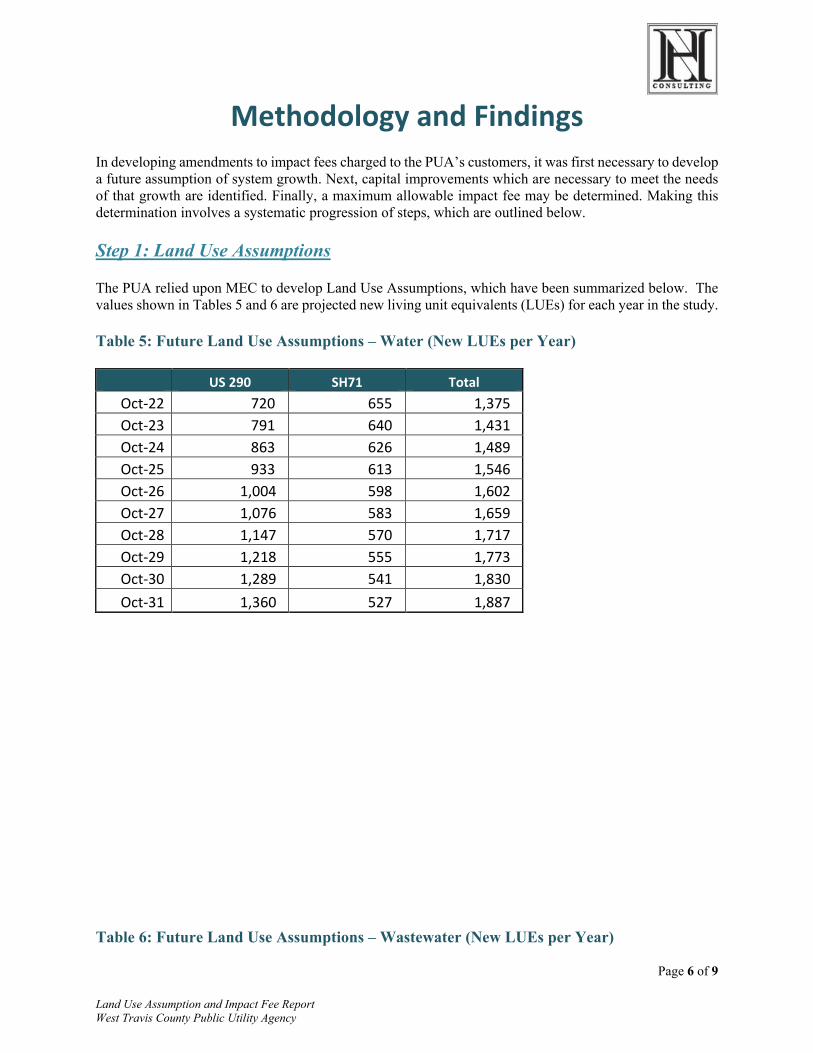
The PUA relied upon MEC to develop Land Use Assumptions, which have been summarized below. The values shown in Tables 5 and 6 are projected new living unit equivalents (LUEs) for each year in the study.
Table 5: Future Land Use Assumptions – Water (New LUEs per Year)
US 290 SH71 Total Oct-22 720 655 1,375 Oct-23 791 640 1,431 Oct-24 863 626 1,489 Oct-25 933 613 1,546 Oct-26 1,004 598 1,602 Oct-27 1,076 583 1,659 Oct-28 1,147 570 1,717 Oct-29 1,218 555 1,773 Oct-30 1,289 541 1,830 Oct-31 1,360 527 1,887
Table 6: Future Land Use Assumptions – Wastewater (New LUEs per Year)

Page 7 of 9
Land Use Assumption and Impact Fee Report West Travis County Public Utility Agency
Total Oct-22 255 Oct-23 283 Oct-24 219 Oct-25 225 Oct-26 224 Oct-27 229 Oct-28 206 Oct-29 194 Oct-30 183 Oct-31 177
Step 2: Existing Improvements
Chapter 395 of the Texas Local Government Code regulates impact fees that utilities may charge. Chapter 395 requires that impact fees collected by a utility should be utilized to pay for capital improvements necessitated by growth. Capital improvements utilized in the calculation may include existing improvements that have excess capacity as well as future improvements that will meet growth needs. Such projects were isolated by MEC and are included in the impact fee calculation.
Step 3: Planned Improvements
Planned improvements are improvements projected to be necessary in the future, which are driven by growth. Maintenance repair or replacement projects not driven by future growth may not be included in the impact fee calculation. MEC identified future projects that would be necessary to meet the needs of future growth based on projected timing of that growth.
Step 4: Capacity Analysis
Once projects eligible for inclusion in the impact fee have been determined, the next step is to perform a capacity analysis for each of those improvements. State law stipulates that only costs associated with available capacity projected to meet future growth needs in the ten-year planning period can be included in the fee determination.
Step 5: Determination of Costs to be Included in Fee
State law allows the following costs to be included in the impact fee calculation:
Construction contract price; Surveying and engineering fees; Land acquisition costs; Projected interest and finance costs; Fees paid to a qualified engineer or financial consultant, preparing or updating the capital
improvements plan.

Page 8 of 9
Land Use Assumption and Impact Fee Report West Travis County Public Utility Agency
As MEC estimated construction and engineering costs for each project in the CIP, NH Consulting used those cost estimates and grossed them up for legal and permitting costs as well as bond issuance costs (for bond funded projects) in order to arrive at an estimate of CIP costs in 2018 dollars. Given that many of the projects included in the CIP will be constructed in future years, NH Consulting then grossed up CIP cost estimates in order to account for future inflationary impacts to project costs, as described below.
Allowable project design and construction costs, as described above, which were then inflated at 3% annually until projected project construction;
Legal and permitting costs estimated at 1.5% of design and construction costs; Bond issuance costs estimated at 2% of design, construction, legal and permitting costs
2;
Interest Expense (assumed a 30 year bond at 4% interest)3.
The total costs that may be included in the water impact fees are identified on Schedules 1, 2 and 3; the costs that may be included in the wastewater impact fees are identified on Schedules 4, 5 and 6.
Step 6: Determination of Maximum Allowable Fee
NH Consulting determined a maximum allowable impact fee, which collects all revenues to pay for allowable projects and related fees within the ten-year study period.
Step 7: Determination of Rate Revenue Credit
In addition to describing the costs that can be included in the maximum impact fee calculation, Chapter 395 of the Texas Local Government Code also specifically states that the fee shall:
“Provide a plan for awarding:
(a) A credit for the portion of ad valorem tax and utility service revenues generated by new service units during the program period that is used for the payment of improvements, including the payment of debt that is included in the capital improvements plan; or
(b) In the alternative, a credit equal to 50 percent of the total projected cost of implementing the capital improvements plan.”
Accordingly, the utility may elect to adopt a fee that is equal to 50% of the calculated amount or develop a plan for awarding a credit for utility service revenues that are generated to pay for debt associated with assets in the capital improvements plan.
NH Consulting has performed the requisite credit calculation that determines the credit needed for both the water and the wastewater utility. In so doing, NH Consulting has identified the annual debt service for PUA issued bonds, which are associated with regional assets to be funded through rates. NH Consulting then determined the estimated LUEs in the system based on the current LUE count and projected growth in the system. Finally, NH Consulting divided the total debt service paid for regional projects through rates by the
2 Bond issuance costs were only included for existing projects.
3 Interest expense for existing projects included all accrued interest to-date, plus 10 years of future interest. Interest
expense for future projects, if included, was for only 10 years of future interest.
Page 9 of 9
Land Use Assumption and Impact Fee Report West Travis County Public Utility Agency
total LUEs that would pay those rates over the 10-year study period to determine the total credit which should be applied against the maximum allowable impact fee.
Summary of Maximum Allowable Fees
Maximum Allowable Fees
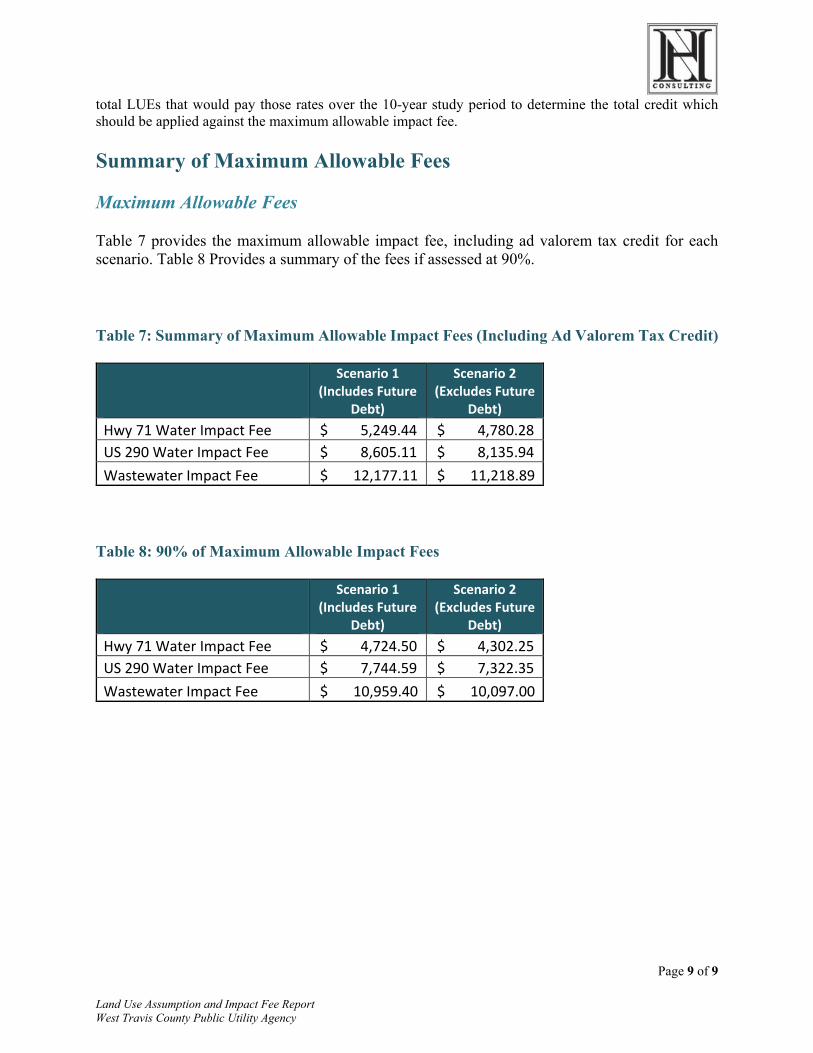
Table 7 provides the maximum allowable impact fee, including ad valorem tax credit for each scenario. Table 8 Provides a summary of the fees if assessed at 90%.
Table 7: Summary of Maximum Allowable Impact Fees (Including Ad Valorem Tax Credit)
Scenario 1 (Includes Future
Debt)
Scenario 2 (Excludes Future
Debt) Hwy 71 Water Impact Fee $ 5,249.44 $ 4,780.28 US 290 Water Impact Fee $ 8,605.11 $ 8,135.94 Wastewater Impact Fee $ 12,177.11 $ 11,218.89
Table 8: 90% of Maximum Allowable Impact Fees
Scenario 1 (Includes Future
Debt)
Scenario 2 (Excludes Future
Debt) Hwy 71 Water Impact Fee $ 4,724.50 $ 4,302.25 US 290 Water Impact Fee $ 7,744.59 $ 7,322.35 Wastewater Impact Fee $ 10,959.40 $ 10,097.00
7/21/21 Page 1
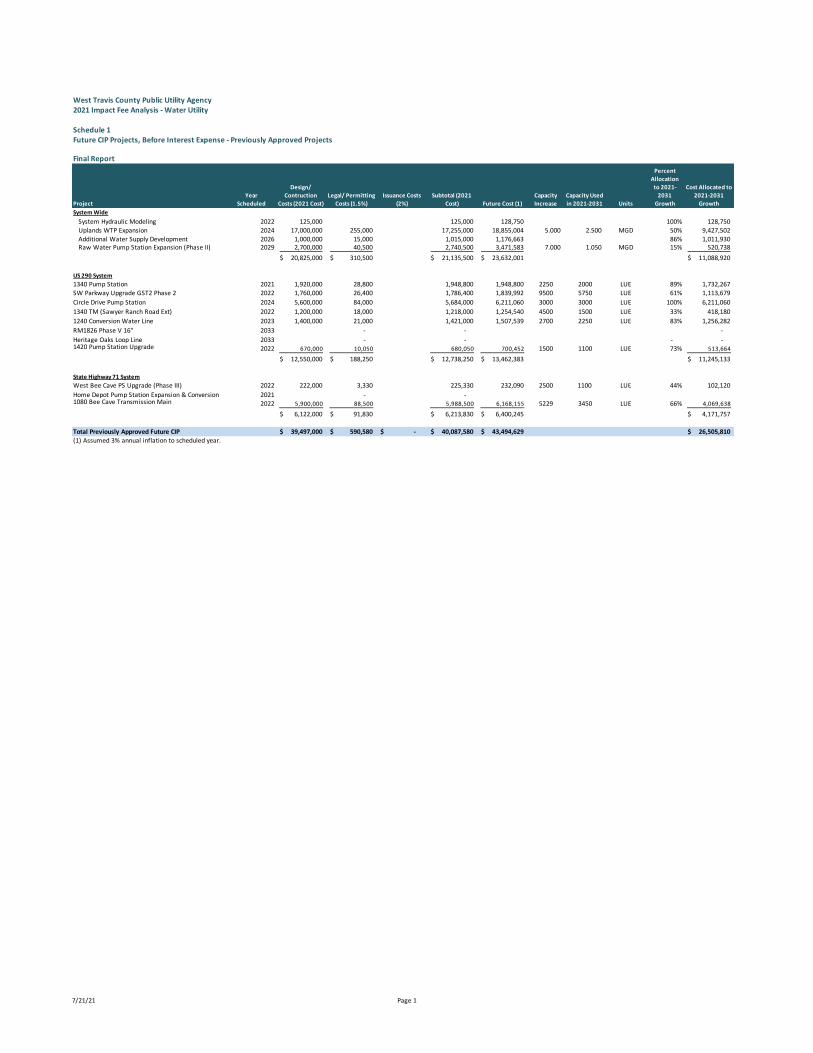
West Travis County Public Utility Agency2021 Impact Fee Analysis - Water Utility
Schedule 1Future CIP Projects, Before Interest Expense - Previously Approved Projects
Final Report
ProjectYear
Scheduled
Design/ Contruction
Costs (2021 Cost)Legal/ Permitting
Costs (1.5%)Issuance Costs
(2%)Subtotal (2021
Cost) Future Cost (1)Capacity Increase
Capacity Used in 2021-2031 Units
Percent Allocation
to 2021-2031
Growth
Cost Allocated to 2021-2031
GrowthSystem Wide
System Hydraulic Modeling 2022 125,000 125,000 128,750 100% 128,750 Uplands WTP Expansion 2024 17,000,000 255,000 17,255,000 18,855,004 5.000 2.500 MGD 50% 9,427,502 Additional Water Supply Development 2026 1,000,000 15,000 1,015,000 1,176,663 86% 1,011,930 Raw Water Pump Station Expansion (Phase II) 2029 2,700,000 40,500 2,740,500 3,471,583 7.000 1.050 MGD 15% 520,738
20,825,000$ 310,500$ 21,135,500$ 23,632,001$ 11,088,920$
US 290 System1340 Pump Station 2021 1,920,000 28,800 1,948,800 1,948,800 2250 2000 LUE 89% 1,732,267 SW Parkway Upgrade GST2 Phase 2 2022 1,760,000 26,400 1,786,400 1,839,992 9500 5750 LUE 61% 1,113,679 Circle Drive Pump Station 2024 5,600,000 84,000 5,684,000 6,211,060 3000 3000 LUE 100% 6,211,060 1340 TM (Sawyer Ranch Road Ext) 2022 1,200,000 18,000 1,218,000 1,254,540 4500 1500 LUE 33% 418,180 1240 Conversion Water Line 2023 1,400,000 21,000 1,421,000 1,507,539 2700 2250 LUE 83% 1,256,282 RM1826 Phase V 16" 2033 - - - Heritage Oaks Loop Line 2033 - - - - 1420 Pump Station Upgrade 2022 670,000 10,050 680,050 700,452 1500 1100 LUE 73% 513,664
12,550,000$ 188,250$ 12,738,250$ 13,462,383$ 11,245,133$
State Highway 71 SystemWest Bee Cave PS Upgrade (Phase III) 2022 222,000 3,330 225,330 232,090 2500 1100 LUE 44% 102,120 Home Depot Pump Station Expansion & Conversion 2021 - - 1080 Bee Cave Transmission Main 2022 5,900,000 88,500 5,988,500 6,168,155 5229 3450 LUE 66% 4,069,638
6,122,000$ 91,830$ 6,213,830$ 6,400,245$ 4,171,757$
Total Previously Approved Future CIP 39,497,000$ 590,580$ -$ 40,087,580$ 43,494,629$ 26,505,810$ (1) Assumed 3% annual inflation to scheduled year.

1
West Travis County Public Utility Agency2021 Impact Fee Analysis - Water Utility
Schedule 2Future CIP Projects, Before Interest Expense - Newly Identified Projects
DRAFT
ProjectYear
Scheduled
Design/ Contruction
Costs (2021 Cost)Legal/ Permitting
Costs (1.5%)Issuance Costs
(2%)Subtotal (2021
Cost) Future Cost (1)Capacity Increase
Capacity Used in 2022-2031 Units
Percent Allocation
to 2018-2027
Growth
Cost Allocated to 2018-2027
Growth
System Wide Impact Fee Update 2026 92,500 92,500 107,233 100% 107,233 TM No. 2 (Upsize) 2027 1,396,000 20,940 1,416,940 1,691,900 3100 2100 LUEs 68% 1,146,126 Ranch Road 12 16" TM (HPR to Fitzhugh) 2027 5,621,000 84,315 5,705,315 6,812,444 5200 2100 LUEs 40% 2,751,180 1340 PS (HPR) 2027 2,016,000 30,240 2,046,240 2,443,318 5200 2100 LUEs 40% 986,724 Uplands WTP Expansion to 33 MGD 2026 10,000,000 150,000 10,150,000 11,766,632 8 7.44 LUEs 93% 10,942,968
19,125,500$ 285,495$ 19,410,995$ 22,821,527$ 15,934,230$
US 290 SystemSWP PS Modifications 2025 1,500,000$ 22,500 1,522,500 1,713,587 12000 8810 LUEs 73% 1,258,059 1240 EST 2027 2,095,000 31,425 2,126,425 2,539,063 2250 2250 LUEs 100% 2,539,063 Hwy 71 Parallel 20" TM (uplands to SWPWPS) 2030 4,150,000 62,250 4,212,250 5,496,031 8150 5700 LUEs 70% 3,843,850 Fitzhugh Road 16" TM (Crumley to RR12) 2030 2,083,000 31,245 2,114,245 2,758,610 5200 2200 LUEs 42% 1,167,104 Darden Hill Rd 16" WL 2028 5,956,400 89,346 6,045,746 7,435,505 5200 1800 LUEs 35% 2,573,829 Nutty Brown 12" TM 2026 3,158,000 47,370 3,205,370 3,715,902 2900 1000 LUEs 34% 1,281,346 Fitzhugh Road 16" TM (CLPS to Crumley) 2029 6,498,000 97,470 6,595,470 8,354,944 5200 3800 LUEs 73% 6,105,536 30" Parallel TM 2 (SWPPS to County Line) 2025 19,354,000 290,310 19,644,310 22,109,844 12000 8810 LUEs 73% 16,232,310
44,794,400$ 671,916$ 45,466,316$ 54,123,486$ 35,001,096$
SH71 SystemWest Bee Cave PS Upgrade (Electrical & Pumping) 2025 336,000$ 5,040 341,040 383,844 4200 700 LUEs 17% 63,974 TM No. 2 (West Bee Cave to HPR) 2027 825,792$ 12,387 838,179 1,000,829 3100 700 LUEs 23% 225,994 HPR GST2 2022 1,686,209 25,293 1,711,502 1,762,847 5000 700 LUEs 14% 246,799
2,848,001$ 42,720$ 2,890,721$ 3,147,520$ 536,766$
Total New Proposed 66,767,901$ 1,000,131$ -$ 67,768,032$ 80,092,534$ 51,472,093$
(1) Future cost determined by applying 3% annual inflation to scheduled year.
Newly Proposed Projects
1
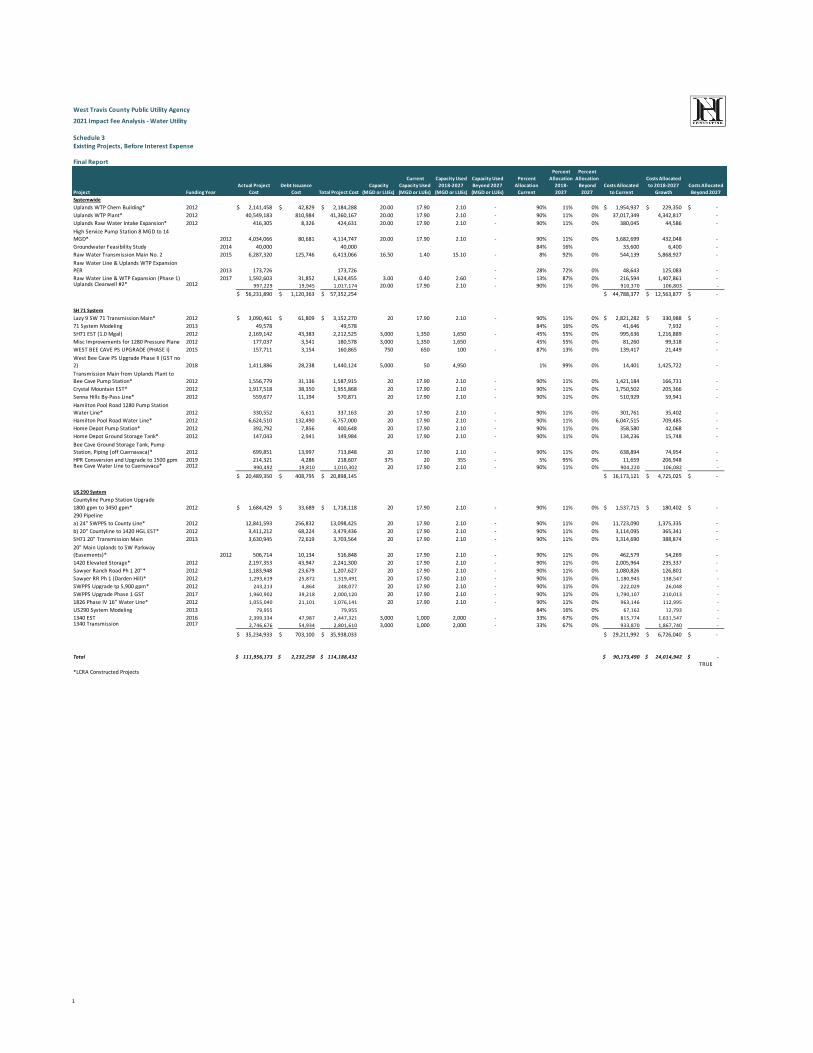
West Travis County Public Utility Agency
2021 Impact Fee Analysis - Water Utility
Schedule 3Existing Projects, Before Interest Expense
Final Report
Project Funding YearActual Project
CostDebt Issuance
Cost Total Project Cost Capacity
(MGD or LUEs)
Current Capacity Used (MGD or LUEs)
Capacity Used 2018-2027
(MGD or LUEs)
Capacity Used Beyond 2027 (MGD or LUEs)
Percent Allocation
Current
Percent Allocation
2018-2027
Percent Allocation
Beyond 2027
Costs Allocated to Current
Costs Allocated to 2018-2027
GrowthCosts Allocated
Beyond 2027SystemwideUplands WTP Chem Building* 2012 2,141,458$ 42,829$ 2,184,288$ 20.00 17.90 2.10 - 90% 11% 0% 1,954,937$ 229,350$ -$ Uplands WTP Plant* 2012 40,549,183 810,984 41,360,167 20.00 17.90 2.10 - 90% 11% 0% 37,017,349 4,342,817 - Uplands Raw Water Intake Expansion* 2012 416,305 8,326 424,631 20.00 17.90 2.10 - 90% 11% 0% 380,045 44,586 - High Service Pump Station 8 MGD to 14 MGD* 2012 4,034,066 80,681 4,114,747 20.00 17.90 2.10 - 90% 11% 0% 3,682,699 432,048 - Groundwater Feasibility Study 2014 40,000 40,000 84% 16% 33,600 6,400 - Raw Water Transmission Main No. 2 2015 6,287,320 125,746 6,413,066 16.50 1.40 15.10 - 8% 92% 0% 544,139 5,868,927 - Raw Water Line & Uplands WTP Expansion PER 2013 173,726 173,726 - 28% 72% 0% 48,643 125,083 - Raw Water Line & WTP Expansion (Phase 1) 2017 1,592,603 31,852 1,624,455 3.00 0.40 2.60 - 13% 87% 0% 216,594 1,407,861 - Uplands Clearwell #2* 2012 997,229 19,945 1,017,174 20.00 17.90 2.10 - 90% 11% 0% 910,370 106,803 -
56,231,890$ 1,120,363$ 57,352,254$ 44,788,377$ 12,563,877$ -$
SH 71 SystemLazy 9 SW 71 Transmission Main* 2012 3,090,461$ 61,809$ 3,152,270$ 20 17.90 2.10 - 90% 11% 0% 2,821,282$ 330,988$ -$ 71 System Modeling 2013 49,578 49,578 84% 16% 0% 41,646 7,932 - SH71 EST (1.0 Mgal) 2012 2,169,142 43,383 2,212,525 3,000 1,350 1,650 - 45% 55% 0% 995,636 1,216,889 - Misc Improvements for 1280 Pressure Plane 2012 177,037 3,541 180,578 3,000 1,350 1,650 45% 55% 0% 81,260 99,318 - WEST BEE CAVE PS UPGRADE (PHASE I) 2015 157,711 3,154 160,865 750 650 100 - 87% 13% 0% 139,417 21,449 - West Bee Cave PS Upgrade Phase II (GST no 2) 2018 1,411,886 28,238 1,440,124 5,000 50 4,950 1% 99% 0% 14,401 1,425,722 - Transmission Main from Uplands Plant to Bee Cave Pump Station* 2012 1,556,779 31,136 1,587,915 20 17.90 2.10 - 90% 11% 0% 1,421,184 166,731 - Crystal Mountain EST* 2012 1,917,518 38,350 1,955,868 20 17.90 2.10 - 90% 11% 0% 1,750,502 205,366 - Senna Hills By-Pass Line* 2012 559,677 11,194 570,871 20 17.90 2.10 - 90% 11% 0% 510,929 59,941 - Hamilton Pool Road 1280 Pump Station Water Line* 2012 330,552 6,611 337,163 20 17.90 2.10 - 90% 11% 0% 301,761 35,402 - Hamilton Pool Road Water Line* 2012 6,624,510 132,490 6,757,000 20 17.90 2.10 - 90% 11% 0% 6,047,515 709,485 - Home Depot Pump Station* 2012 392,792 7,856 400,648 20 17.90 2.10 - 90% 11% 0% 358,580 42,068 - Home Depot Ground Storage Tank* 2012 147,043 2,941 149,984 20 17.90 2.10 - 90% 11% 0% 134,236 15,748 - Bee Cave Ground Storage Tank, Pump Station, Piping (off Cuernavaca)* 2012 699,851 13,997 713,848 20 17.90 2.10 - 90% 11% 0% 638,894 74,954 - HPR Consversion and Upgrade to 1500 gpm 2019 214,321 4,286 218,607 375 20 355 - 5% 95% 0% 11,659 206,948 - Bee Cave Water Line to Cuernavaca* 2012 990,492 19,810 1,010,302 20 17.90 2.10 - 90% 11% 0% 904,220 106,082 -
20,489,350$ 408,795$ 20,898,145$ 16,173,121$ 4,725,025$ -$
US 290 SystemCountyline Pump Station Upgrade1800 gpm to 3450 gpm* 2012 1,684,429$ 33,689$ 1,718,118$ 20 17.90 2.10 - 90% 11% 0% 1,537,715$ 180,402$ -$ 290 Pipelinea) 24" SWPPS to County Line* 2012 12,841,593 256,832 13,098,425 20 17.90 2.10 - 90% 11% 0% 11,723,090 1,375,335 - b) 20" Countyline to 1420 HGL EST* 2012 3,411,212 68,224 3,479,436 20 17.90 2.10 - 90% 11% 0% 3,114,095 365,341 - SH71 20" Transmission Main 2013 3,630,945 72,619 3,703,564 20 17.90 2.10 - 90% 11% 0% 3,314,690 388,874 - 20" Main Uplands to SW Parkway (Easements)* 2012 506,714 10,134 516,848 20 17.90 2.10 - 90% 11% 0% 462,579 54,269 - 1420 Elevated Storage* 2012 2,197,353 43,947 2,241,300 20 17.90 2.10 - 90% 11% 0% 2,005,964 235,337 - Sawyer Ranch Road Ph 1 20"* 2012 1,183,948 23,679 1,207,627 20 17.90 2.10 - 90% 11% 0% 1,080,826 126,801 - Sawyer RR Ph 1 (Darden Hill)* 2012 1,293,619 25,872 1,319,491 20 17.90 2.10 - 90% 11% 0% 1,180,945 138,547 - SWPPS Upgrade tp 5,900 gpm* 2012 243,213 4,864 248,077 20 17.90 2.10 - 90% 11% 0% 222,029 26,048 - SWPPS Upgrade Phase 1 GST 2017 1,960,902 39,218 2,000,120 20 17.90 2.10 - 90% 11% 0% 1,790,107 210,013 - 1826 Phase IV 16" Water Line* 2012 1,055,040 21,101 1,076,141 20 17.90 2.10 - 90% 11% 0% 963,146 112,995 - US290 System Modeling 2013 79,955 79,955 84% 16% 0% 67,162 12,793 - 1340 EST 2016 2,399,334 47,987 2,447,321 3,000 1,000 2,000 - 33% 67% 0% 815,774 1,631,547 - 1340 Transmission 2017 2,746,676 54,934 2,801,610 3,000 1,000 2,000 - 33% 67% 0% 933,870 1,867,740 -
35,234,933$ 703,100$ 35,938,033$ 29,211,992$ 6,726,040$ -$
Total 111,956,173$ 2,232,258$ 114,188,432$ 90,173,490$ 24,014,942$ -$ TRUE
*LCRA Constructed Projects
1
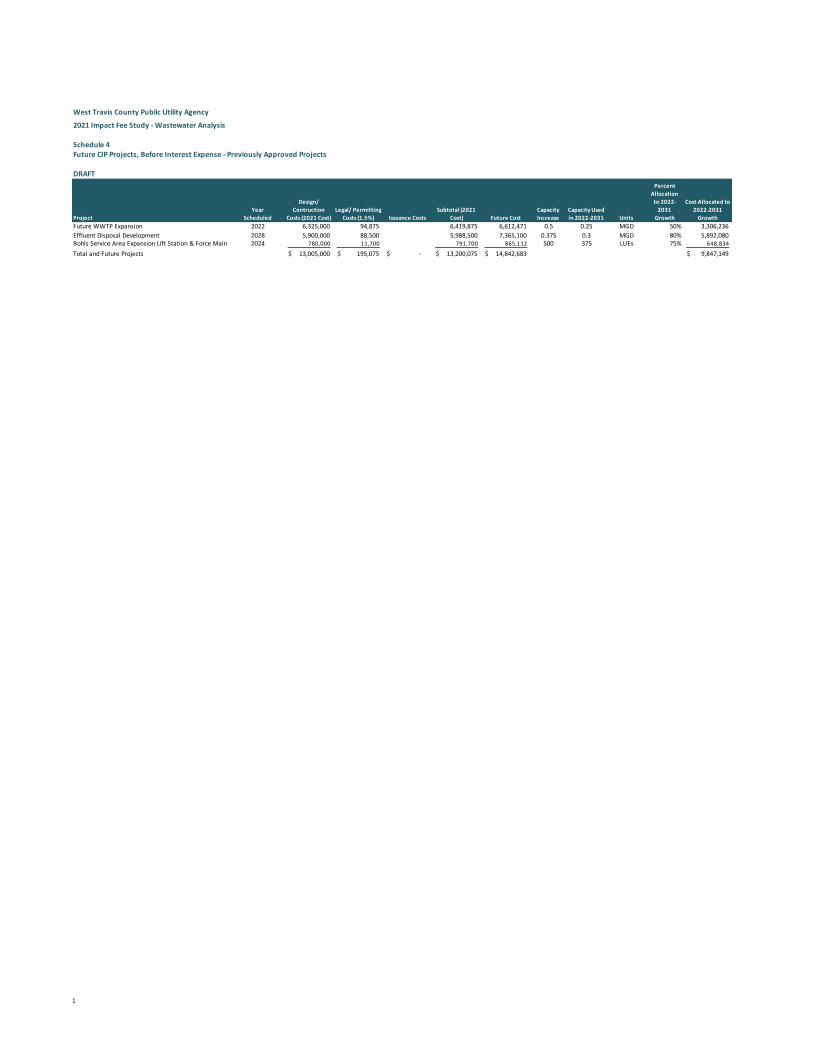
West Travis County Public Utility Agency
2021 Impact Fee Study - Wastewater Analysis
Schedule 4Future CIP Projects, Before Interest Expense - Previously Approved Projects
DRAFT
ProjectYear
Scheduled
Design/ Contruction
Costs (2021 Cost)Legal/ Permitting
Costs (1.5%) Issuance Costs Subtotal (2021
Cost) Future CostCapacity Increase
Capacity Used in 2022-2031 Units
Percent Allocation
to 2022-2031
Growth
Cost Allocated to 2022-2031
GrowthFuture WWTP Expansion 2022 6,325,000 94,875 6,419,875 6,612,471 0.5 0.25 MGD 50% 3,306,236 Effluent Disposal Development 2028 5,900,000 88,500 5,988,500 7,365,100 0.375 0.3 MGD 80% 5,892,080 Bohls Service Area Expansion Lift Station & Force Main 2024 780,000 11,700 791,700 865,112 500 375 LUEs 75% 648,834
Total and Future Projects 13,005,000$ 195,075$ -$ 13,200,075$ 14,842,683$ 9,847,149$

1
West Travis County Public Utility Agency
2021 Impact Fee Study - Wastewater Analysis
Schedule 5Future CIP Projects, Before Interest Expense - Newly Identified Projects
DRAFT
ProjectYear
Scheduled
Design/ Contruction
Costs (2021 Cost)Legal/ Permitting
Costs (1.5%) Issuance Costs Subtotal (2021
Cost) Future CostCapacity Increase
Capacity Used in 2015-2024 Units
Percent Allocation
to 2018-2027
Growth
Cost Allocated to 2018-2027
GrowthImpact Fee Study 2026 27,500 27,500 31,880 100% 31,880
BWR & Effluent Disposal Injection Well 2022 517,500 7,763 10,350 535,613 551,681 0.375 0.30 MGD 80% 441,345 BWR Phase 1 Supply/Reject FMs 2022 1,460,500 21,908 29,210 1,511,618 1,556,966 0.500 0.30 MGD 60% 934,180 Lime Kiln Interceptor 2026 1,730,000 25,950 39,560 1,795,510 2,081,488 1,800 900 LUEs 50% 1,040,744
Total Future Projects 3,735,500$ 55,620$ 79,120$ 3,870,240$ 4,222,015$ 2,448,148$
1
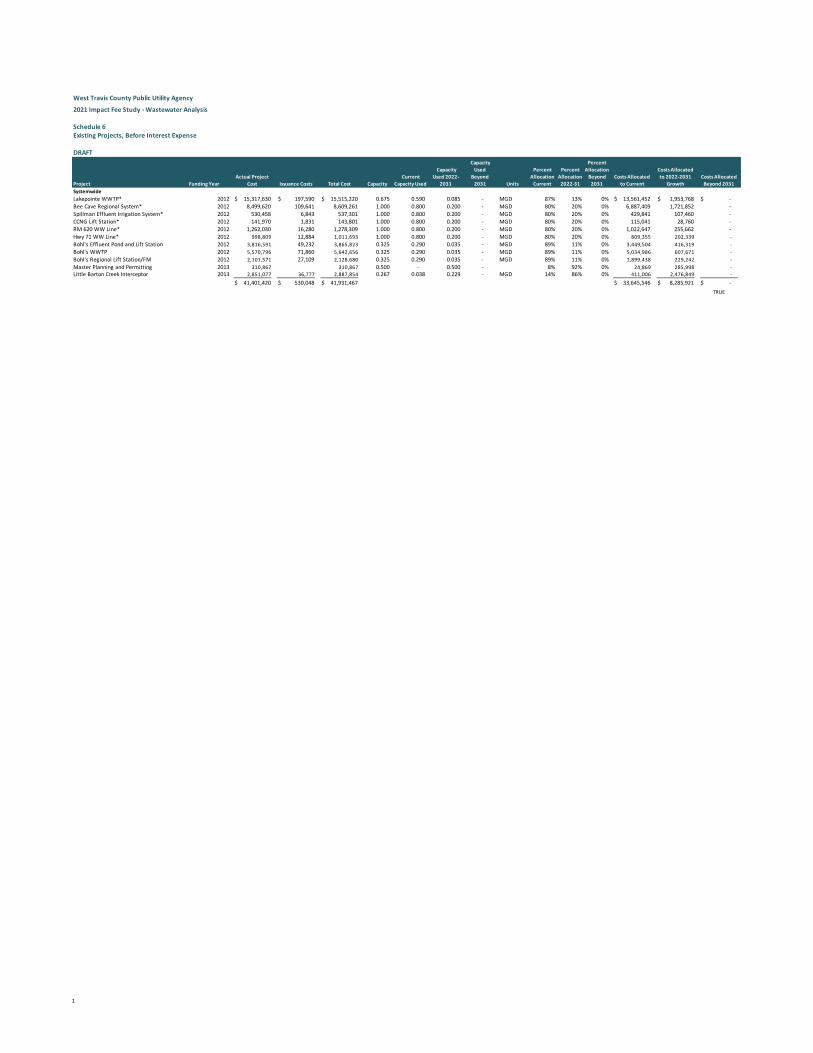
West Travis County Public Utility Agency
2021 Impact Fee Study - Wastewater Analysis
Schedule 6Existing Projects, Before Interest Expense
DRAFT
Project Funding YearActual Project
Cost Issuance Costs Total Cost Capacity Current
Capacity Used
Capacity Used 2022-
2031
Capacity Used
Beyond 2031 Units
Percent Allocation
Current
Percent Allocation
2022-31
Percent Allocation
Beyond 2031
Costs Allocated to Current
Costs Allocated to 2022-2031
GrowthCosts Allocated
Beyond 2031SystemwideLakepointe WWTP* 2012 15,317,630$ 197,590$ 15,515,220$ 0.675 0.590 0.085 - MGD 87% 13% 0% 13,561,452$ 1,953,768$ -$ Bee Cave Regional System* 2012 8,499,620 109,641 8,609,261 1.000 0.800 0.200 - MGD 80% 20% 0% 6,887,409 1,721,852 - Spillman Effluent Irrigation System* 2012 530,458 6,843 537,301 1.000 0.800 0.200 - MGD 80% 20% 0% 429,841 107,460 - CCNG Lift Station* 2012 141,970 1,831 143,801 1.000 0.800 0.200 - MGD 80% 20% 0% 115,041 28,760 - RM 620 WW Line* 2012 1,262,030 16,280 1,278,309 1.000 0.800 0.200 - MGD 80% 20% 0% 1,022,647 255,662 - Hwy 71 WW Line* 2012 998,809 12,884 1,011,693 1.000 0.800 0.200 - MGD 80% 20% 0% 809,355 202,339 - Bohl's Effluent Pond and Lift Station 2012 3,816,591 49,232 3,865,823 0.325 0.290 0.035 - MGD 89% 11% 0% 3,449,504 416,319 - Bohl's WWTP 2012 5,570,796 71,860 5,642,656 0.325 0.290 0.035 - MGD 89% 11% 0% 5,034,986 607,671 - Bohl's Regional Lift Station/FM 2012 2,101,571 27,109 2,128,680 0.325 0.290 0.035 - MGD 89% 11% 0% 1,899,438 229,242 - Master Planning and Permitting 2013 310,867 310,867 0.500 - 0.500 - 8% 92% 0% 24,869 285,998 - Little Barton Creek Interceptor 2013 2,851,077 36,777 2,887,854 0.267 0.038 0.229 - MGD 14% 86% 0% 411,006 2,476,849 -
41,401,420$ 530,048$ 41,931,467$ 33,645,546$ 8,285,921$ -$ TRUE