Tech-Clarity Perspective: The Facts About Managing Product ...€¦ · development targets....
20
© Tech-Clarity, Inc. 2015 Tech-Clarity Perspective: The Facts About Managing Product Data The Real Story on PDM Value and Accessibility
Transcript of Tech-Clarity Perspective: The Facts About Managing Product ...€¦ · development targets....

© Tech-Clarity, Inc. 2015
Tech-Clarity Perspective: The Facts About Managing
Product Data
The Real Story on PDM Value and Accessibility

2 © Tech-Clarity, Inc. 2015
Table of Contents Executive Overview ....................................................................... 3 Benefits of Effective Data Management ........................................ 4 Design Challenges and Impacts .................................................... 5 Identifying the Top Performers ...................................................... 7 Evaluating Data Management Approaches ................................... 8 So Why Doesn’t Everyone Use PDM? .......................................... 9 The “We Don’t Use 3D” Myth ...................................................... 10 The PDM Time and Cost Misconception ..................................... 12 The “We’re too Small for PDM” Myth .......................................... 13 Misconception that PDM is “All or Nothing” ................................. 14 The Fallacy that “PDM is Only for Managing CAD Files” ............ 16 PDM is “Just an Engineering Tool” .............................................. 17 Conclusion ................................................................................... 18 Recommendations ...................................................................... 19 About the Author ......................................................................... 19 About the Research ..................................................................... 20
3 © Tech-Clarity, Inc. 2015
Executive Overview Product Data Management (PDM) helps companies improve the way they control, access, and share critical, product-related files and information. But perhaps more important than what PDM does, are the benefits that PDM delivers. The Tech-Clarity report The Business Value of Product Data Management explains that companies gain strategic business benefits from PDM including improved time to market, better product quality, increased innovation, improved efficiency, reduced product cost, and more. Further, our Best Practices for Managing Design Data survey concludes that operational PDM improvements “lead to better product profitability and business performance.” The value of PDM is really not disputed. But not everyone is managing data. Why? There are many reasons cited, but it’s not what you might think. It’s not because companies don’t need it. In fact, the study results show that only 8% of companies not using PDM say it’s because they don’t have any problems related to data management (Figure 6).
Only 8% of companies not using PDM say it’s because they don’t have any problems related to data management.
So what stops people from implementing such an important tool? Too often, people don’t know the truth about PDM. For example, this research finds that about one quarter without PDM don’t understand PDM benefits (24%) and/or don’t know what PDM is (21%). There are other misconceptions as well. For example, some believe that companies that primarily use 2D CAD and office documents don’t benefit from PDM, which is simply not true. There is also a lot of misinformation about who should use PDM and how hard it is to implement. While PDM can take a lot of time and money to implement, it doesn’t have to. Others believe that only larger companies can benefit from PDM, or that it is only valuable inside of engineering. Clearly there are a lot of myths to address with facts.
It’s time for companies to stop believing the urban legends about PDM and get the facts so they can start improving their businesses.
To get the real story and prompt a practical discussion, Tech-Clarity surveyed over 2,500 companies about their experiences managing data. It’s time for companies to stop believing the urban legends about PDM and get the facts so they can start improving their businesses. After all, the alternative is unmanaged (or manually managed) data, which is inefficient at best and risky at worse. As The Basics of Managing CAD explains, “Some recognize the shortcomings and risks of a manual (data) management approach, while others are one mistake away from learning the hard way.”
4 © Tech-Clarity, Inc. 2015
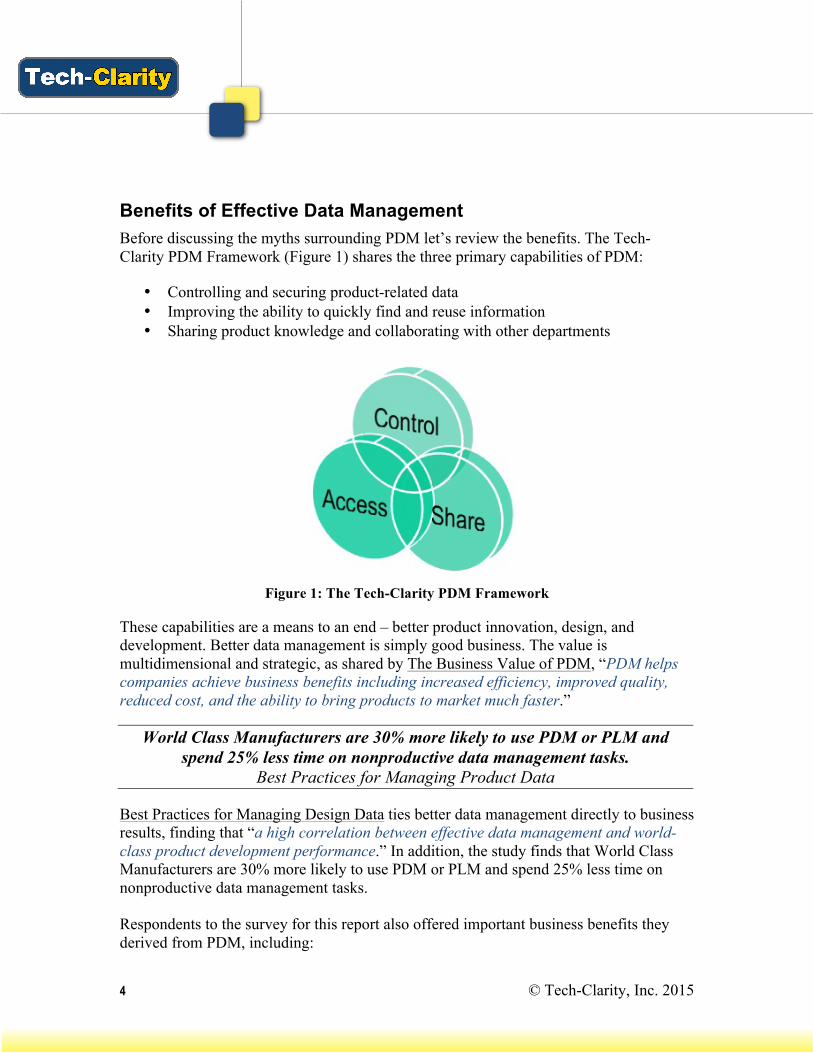
Benefits of Effective Data Management Before discussing the myths surrounding PDM let’s review the benefits. The Tech-Clarity PDM Framework (Figure 1) shares the three primary capabilities of PDM:
• Controlling and securing product-related data • Improving the ability to quickly find and reuse information • Sharing product knowledge and collaborating with other departments
Figure 1: The Tech-Clarity PDM Framework
These capabilities are a means to an end – better product innovation, design, and development. Better data management is simply good business. The value is multidimensional and strategic, as shared by The Business Value of PDM, “PDM helps companies achieve business benefits including increased efficiency, improved quality, reduced cost, and the ability to bring products to market much faster.”
World Class Manufacturers are 30% more likely to use PDM or PLM and spend 25% less time on nonproductive data management tasks.
Best Practices for Managing Product Data
Best Practices for Managing Design Data ties better data management directly to business results, finding that “a high correlation between effective data management and world-class product development performance.” In addition, the study finds that World Class Manufacturers are 30% more likely to use PDM or PLM and spend 25% less time on nonproductive data management tasks. Respondents to the survey for this report also offered important business benefits they derived from PDM, including:
5 © Tech-Clarity, Inc. 2015
• “PDM allowed us to gain control of our product design data and made it easy to share and reuse design data.”
• “Our engineering hours are reduced by15% for projects engineered with 3D CAD and PDM integration.”
• “We have probably reduced time to search for current and/or historical documents by 20-25%.”
They also described other benefits including “improved efficiency,” “less wasted time and effort,” and more.
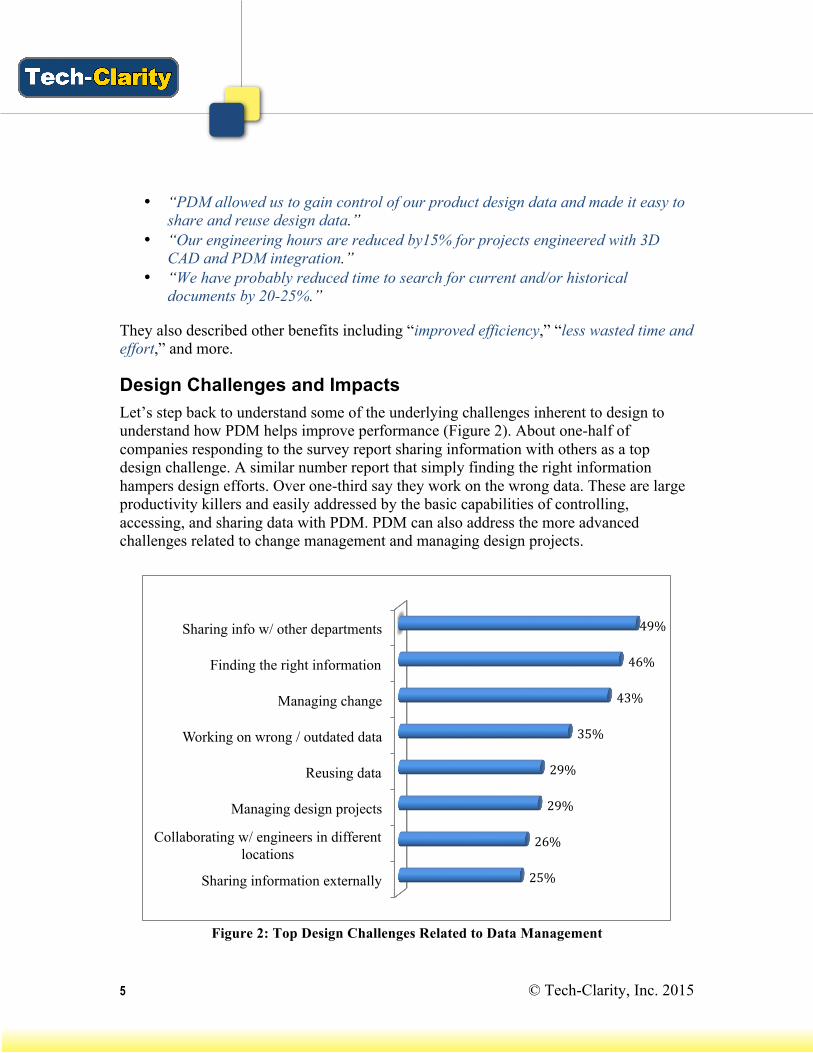
Design Challenges and Impacts Let’s step back to understand some of the underlying challenges inherent to design to understand how PDM helps improve performance (Figure 2). About one-half of companies responding to the survey report sharing information with others as a top design challenge. A similar number report that simply finding the right information hampers design efforts. Over one-third say they work on the wrong data. These are large productivity killers and easily addressed by the basic capabilities of controlling, accessing, and sharing data with PDM. PDM can also address the more advanced challenges related to change management and managing design projects.
Figure 2: Top Design Challenges Related to Data Management
Sharing info w/ other departments
Finding the right information
Managing change
Working on wrong / outdated data
Reusing data
Managing design projects
Collaborating w/ engineers in different locations
Sharing information externally
49%
46%
43%
35%
29%
29%
26%
25%

6 © Tech-Clarity, Inc. 2015
Perhaps more importantly than the challenges are the significant business impacts they lead to (Figure 3). Not surprisingly given the difficulty to find and share data, over one-half of companies say that suffer from design inefficiency due to data management challenges. Designers waste a significant amount of their time searching for data or finding ways to share data with others. The Tech-Clarity report Reducing Non-Value Added Work in Engineering indicates this is a significant issue, and that on average “Engineers spend a third of their time on non-value added work.”
Over one-half of companies say that suffer from design inefficiency due to data management challenges.
Companies also report inability to hit time, quality, and project budget targets. Like the challenges above, these impacts can be easily addressed by the control, access, and sharing capabilities found in PDM.
Figure 3: Top Design and Development Impacts from Data Management Challenges
Design inefficiency
Missed due dates
Errors resulting in
wasted investment /
rework
Missed product cost
targets
Poor quality Project budget
overruns
56%
38% 34% 34%
31% 27%
7 © Tech-Clarity, Inc. 2015
Identifying the Top Performers This report extends prior Tech-Clarity research that shows a strong correlation between data management performance and business performance. The report determines which companies are doing better at designing their products and then analyzes what they do differently so others can learn from them and improve their own performance.
To do this, we analyzed four metrics to identify those that performed at the highest level in product development. The survey requested that each participant evaluate their company’s performance compared to their competitors on their ability to:
• Develop products efficiently • Design high quality products • Develop products quickly • Meet design project / program cost targets
Based on their stated performance in these categories, the top respondents were placed into the Top Performer category and all other responses were classified as Others. The Top Performers represent the top 23% of performers based on a logical cutoff in the performance responses. In this way the two “performance bands” can be compared to see which processes, tools, or organizational approaches are more common in higher-performing companies.
The two “performance bands” can be compared to see which processes, tools, or organizational approaches are more common in higher-performing companies.
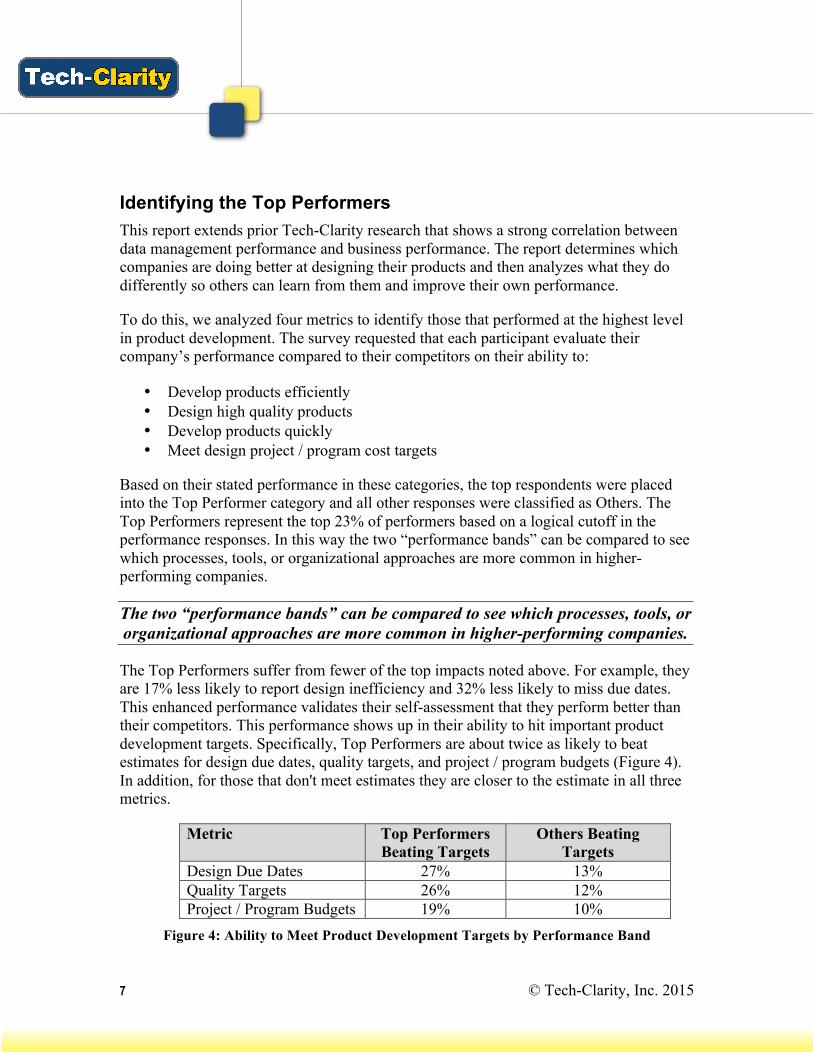
The Top Performers suffer from fewer of the top impacts noted above. For example, they are 17% less likely to report design inefficiency and 32% less likely to miss due dates. This enhanced performance validates their self-assessment that they perform better than their competitors. This performance shows up in their ability to hit important product development targets. Specifically, Top Performers are about twice as likely to beat estimates for design due dates, quality targets, and project / program budgets (Figure 4). In addition, for those that don't meet estimates they are closer to the estimate in all three metrics.
Metric Top Performers Beating Targets
Others Beating Targets
Design Due Dates 27% 13% Quality Targets 26% 12% Project / Program Budgets 19% 10%
Figure 4: Ability to Meet Product Development Targets by Performance Band
8 © Tech-Clarity, Inc. 2015
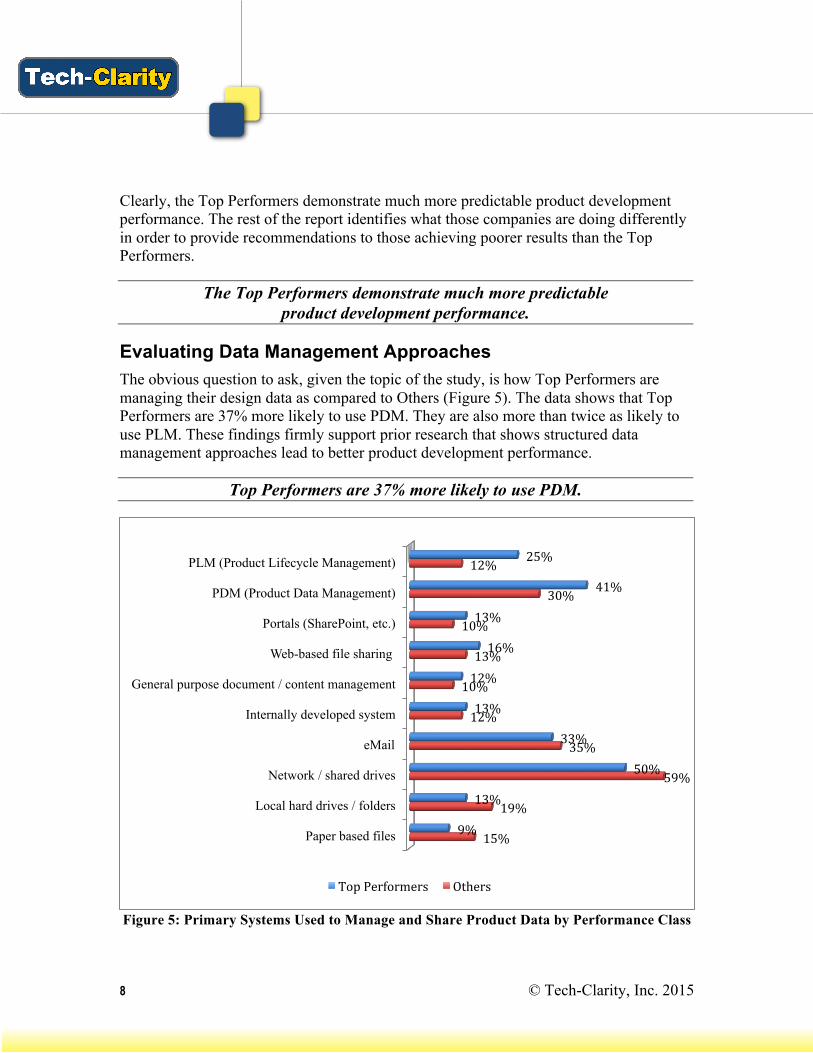
Clearly, the Top Performers demonstrate much more predictable product development performance. The rest of the report identifies what those companies are doing differently in order to provide recommendations to those achieving poorer results than the Top Performers.
The Top Performers demonstrate much more predictable product development performance.
Evaluating Data Management Approaches The obvious question to ask, given the topic of the study, is how Top Performers are managing their design data as compared to Others (Figure 5). The data shows that Top Performers are 37% more likely to use PDM. They are also more than twice as likely to use PLM. These findings firmly support prior research that shows structured data management approaches lead to better product development performance.
Top Performers are 37% more likely to use PDM.
Figure 5: Primary Systems Used to Manage and Share Product Data by Performance Class
PLM (Product Lifecycle Management)
PDM (Product Data Management)
Portals (SharePoint, etc.)
Web-based file sharing
General purpose document / content management
Internally developed system
Network / shared drives
Local hard drives / folders
Paper based files
25%
41%
13%
16%
12%
13%
33%
50%
13%
9%
12%
30%
10%
13%
10%
12%
35%
59%
19%
15%
Top Performers Others

9 © Tech-Clarity, Inc. 2015
Both Top Performers and Others are using some tools at about the same rate. These include portals, web-based file sharing (such as Box.net, Dropbox, or Google Drive), and general document management systems. These tools don’t appear to offer any real differentiation to those that leverage them.
Perhaps what’s even more interesting is that the next largest set of differentiators between companies across performance bands comes from what Top Performers don’t do! For example, Top Performers are 15% less likely to use network/shared drives as a primary data management system and 32% less likely to use local hard drives / folders. Although unmanaged approaches like email and network drives are used by those in all performance classes, they are less frequently used as the primary system in Top Performers.
PDM and structured data management solutions drive better performance, while unmanaged and manually managed approaches lead to poorer results.
These findings suggest that PDM and structured data management solutions drive better performance, while unmanaged and manually managed approaches lead to poorer results.
So Why Doesn’t Everyone Use PDM? Given the clear benefits of PDM and other structured data management approaches, the next obvious question is “why isn’t everyone using PDM?!” We asked that question of those that reported they don’t use PDM or the PDM capabilities of a PLM system (Figure 6). Perhaps the most surprising finding is that only 8% claim they don’t have problems related to data management. So it doesn’t appear that they don’t need PDM.
The next obvious question is “why isn’t everyone using PDM?!”
The main reason companies say they don’t have PDM is because they believe it costs too much. Others believe they have too few available IT resources or it’s too hard to deploy. There are numerous reasons cited, including a lack of understanding of PDM and its benefits. Given the heavy emphasis put on cost, we decided to test the assumption that PDM costs a lot to implement (and a few other beliefs) as a part of this research effort.
The main reason companies say they don’t have PDM is because they believe it costs too much.

10 © Tech-Clarity, Inc. 2015
Figure 6: Reasons Companies Don’t Use PDM
The “We Don’t Use 3D” Myth One of the common misconceptions about data management software is that it is only necessary if you use 3D CAD as your primary design tool. The correct statement is probably that 3D CAD creates a critical need for data management, but it’s very valuable for those that use 2D CAD, office documents, scanned documents, and any variety of deliverables.
3D CAD creates a critical need for data management, but it’s very valuable for those that use 2D CAD, office documents,
scanned documents, and any variety of deliverables.
The confusion comes in because many who design with 3D CAD feel they were “forced” to use PDM by complex file relationships, and perhaps they were. Managing the complex file relationships in 3D without PDM often leads to broken file relationships and issues such as inability to pull up an assembly. For those companies, PDM helped with the obvious pain, but they typically manage much more than 3D – including documents, drawings, templates, standards, and more – when they recognize the value of data management.
40%
29% 24% 24%
21% 20% 20%
8%
11 © Tech-Clarity, Inc. 2015
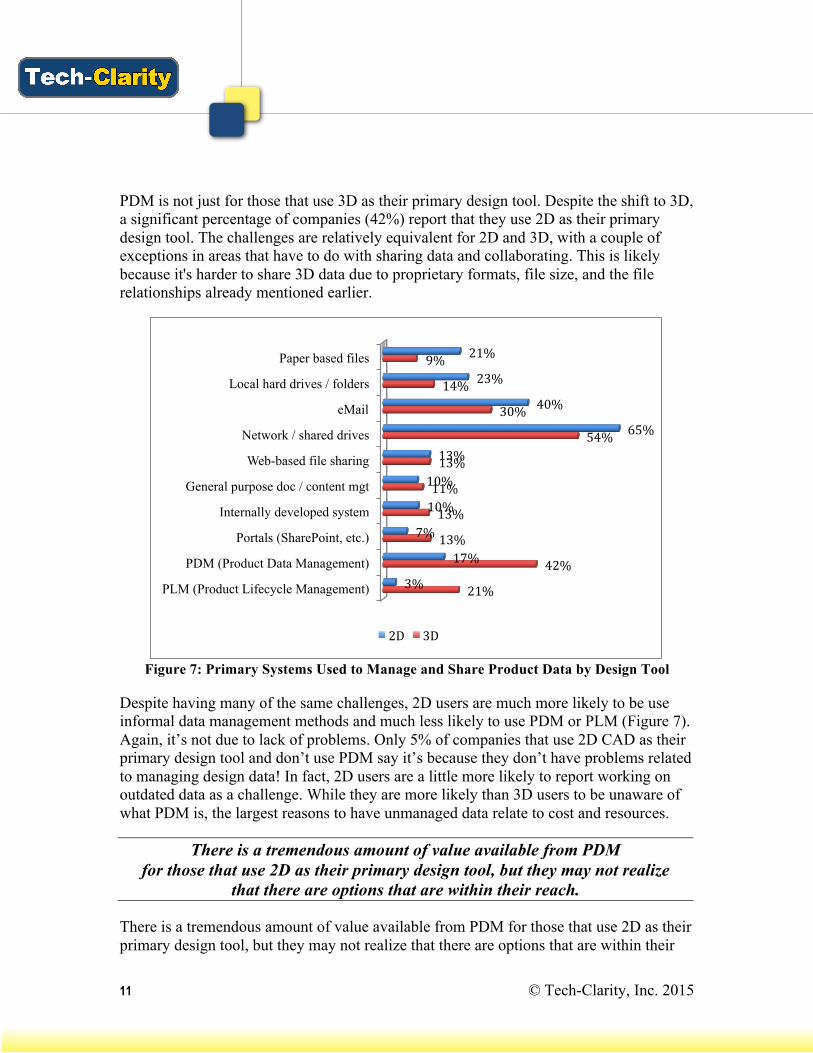
PDM is not just for those that use 3D as their primary design tool. Despite the shift to 3D, a significant percentage of companies (42%) report that they use 2D as their primary design tool. The challenges are relatively equivalent for 2D and 3D, with a couple of exceptions in areas that have to do with sharing data and collaborating. This is likely because it's harder to share 3D data due to proprietary formats, file size, and the file relationships already mentioned earlier.
Figure 7: Primary Systems Used to Manage and Share Product Data by Design Tool
Despite having many of the same challenges, 2D users are much more likely to be use informal data management methods and much less likely to use PDM or PLM (Figure 7). Again, it’s not due to lack of problems. Only 5% of companies that use 2D CAD as their primary design tool and don’t use PDM say it’s because they don’t have problems related to managing design data! In fact, 2D users are a little more likely to report working on outdated data as a challenge. While they are more likely than 3D users to be unaware of what PDM is, the largest reasons to have unmanaged data relate to cost and resources.
There is a tremendous amount of value available from PDM for those that use 2D as their primary design tool, but they may not realize
that there are options that are within their reach.
There is a tremendous amount of value available from PDM for those that use 2D as their primary design tool, but they may not realize that there are options that are within their
Paper based files
Local hard drives / folders
Network / shared drives
Web-based file sharing
General purpose doc / content mgt
Internally developed system
Portals (SharePoint, etc.)
PDM (Product Data Management)
PLM (Product Lifecycle Management)
21%
23%
40%
65%
13%
10%
10%
7%
17%
3%
9%
14%
30%
54%
13%
11%
13%
13%
42%
21%
2D 3D
12 © Tech-Clarity, Inc. 2015
reach. This makes it important to tackle the time and cost misconceptions surrounding PDM because many 2D users are missing a significant opportunity for improvement.
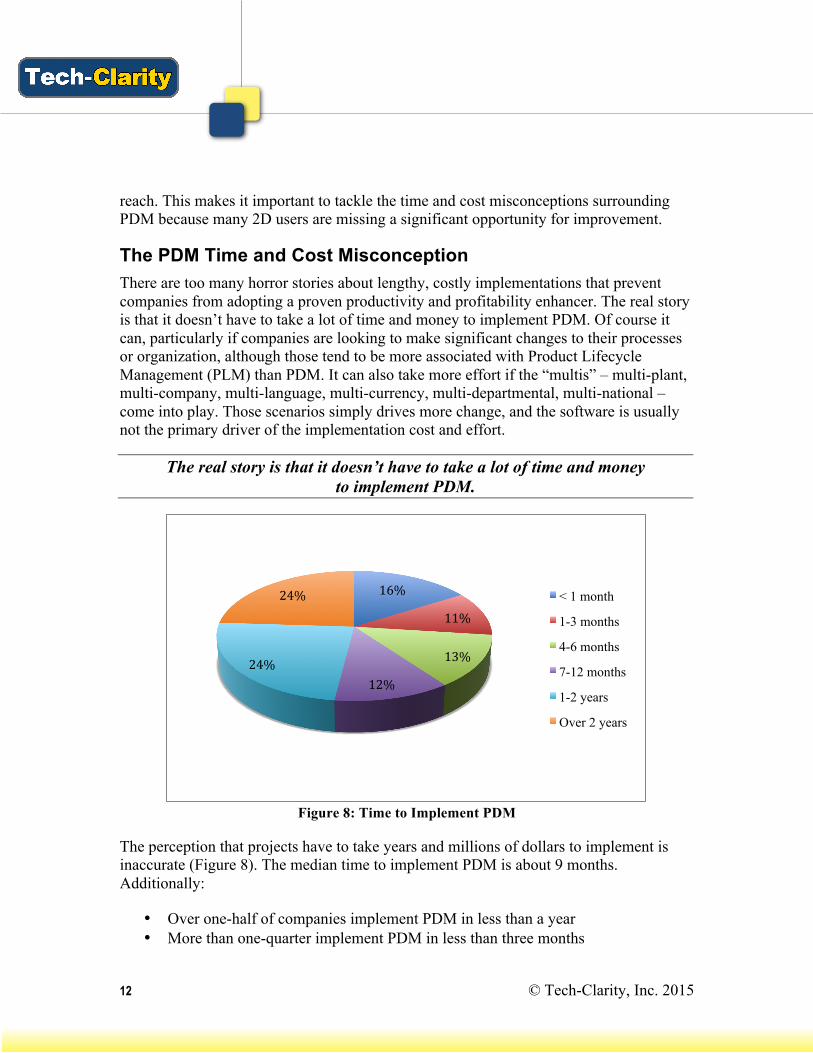
The PDM Time and Cost Misconception There are too many horror stories about lengthy, costly implementations that prevent companies from adopting a proven productivity and profitability enhancer. The real story is that it doesn’t have to take a lot of time and money to implement PDM. Of course it can, particularly if companies are looking to make significant changes to their processes or organization, although those tend to be more associated with Product Lifecycle Management (PLM) than PDM. It can also take more effort if the “multis” – multi-plant, multi-company, multi-language, multi-currency, multi-departmental, multi-national – come into play. Those scenarios simply drives more change, and the software is usually not the primary driver of the implementation cost and effort.
The real story is that it doesn’t have to take a lot of time and money to implement PDM.
Figure 8: Time to Implement PDM
The perception that projects have to take years and millions of dollars to implement is inaccurate (Figure 8). The median time to implement PDM is about 9 months. Additionally:
• Over one-half of companies implement PDM in less than a year • More than one-quarter implement PDM in less than three months
16%
11%
13%
12% 24%
24% < 1 month
1-3 months
4-6 months
7-12 months
1-2 years
Over 2 years
13 © Tech-Clarity, Inc. 2015
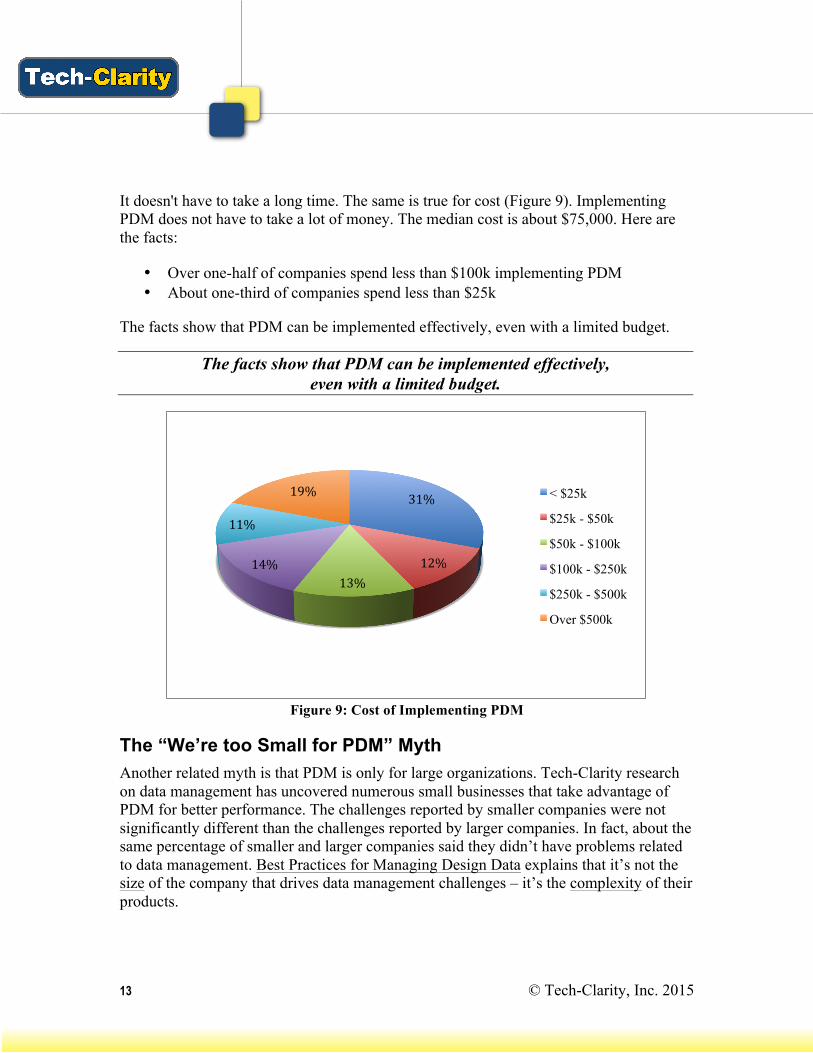
It doesn't have to take a long time. The same is true for cost (Figure 9). Implementing PDM does not have to take a lot of money. The median cost is about $75,000. Here are the facts:
• Over one-half of companies spend less than $100k implementing PDM • About one-third of companies spend less than $25k
The facts show that PDM can be implemented effectively, even with a limited budget.
The facts show that PDM can be implemented effectively, even with a limited budget.
Figure 9: Cost of Implementing PDM
The “We’re too Small for PDM” Myth Another related myth is that PDM is only for large organizations. Tech-Clarity research on data management has uncovered numerous small businesses that take advantage of PDM for better performance. The challenges reported by smaller companies were not significantly different than the challenges reported by larger companies. In fact, about the same percentage of smaller and larger companies said they didn’t have problems related to data management. Best Practices for Managing Design Data explains that it’s not the size of the company that drives data management challenges – it’s the complexity of their products.
31%
12% 13%
14%
11%
19% < $25k
$25k - $50k
$50k - $100k
$100k - $250k
$250k - $500k
Over $500k

14 © Tech-Clarity, Inc. 2015
The challenges reported by smaller companies were not significantly different than the challenges reported by larger companies.
So if smaller companies have the same data management challenges as larger companies, then why don't they have PDM? Not surprisingly the most common reasons had to do with cost and resources. The good news is that smaller companies can realize the same benefits of PDM as larger companies with significantly lower implementation costs. The study shows that PDM implementation cost is highly dependent on the number of engineers / designers in the organization. The median PDM cost for a company with 20 or less engineers is less than $20,000. The takeaway here is that smaller companies can gain significant advantages, but can implement PDM with a significantly lower investment than larger companies.
Smaller companies can realize the same benefits of PDM as larger companies with significantly lower implementation costs.
Misconception that PDM is “All or Nothing” Some believe that a PDM implementation has to start big in order to provide value. They think that if everything isn’t under control then the implementation effort is wasted. That couldn’t be further from the truth. Many companies start small and grow. About one-half of companies that implement PDM started with a limited scope (small amount of functionality, users, sites, projects, and/or departments). Starting small doesn’t seem to hamper performance, either, because an almost identical percentage of Top Performers start with limited scope as do Others (Figure 10). The bottom line is that it’s OK to start small.
About one-half of companies that implement PDM started with a limited scope.
Companies can achieve value from PDM and “grow the value over time by including more processes, integrating to ERP, incorporating more people, and leveraging additional functionality as needed,” according to the Business Value of PDM. PDM is a functionally scalable solution and can even serve as the backbone for a broader PLM implementation if desired (Figure 11). PDM is a foundation for growth, not an “all or nothing” proposition.
Starting small doesn’t seem to hamper performance, an almost identical percentage of Top Performers start with limited scope as do Others.

15 © Tech-Clarity, Inc. 2015
Figure 10: PDM Implementation Approach by Performance Band
Figure 11: The Tech-Clarity PDM Maturity Framework
Top Performer
Other
50%
51%
26%
29%
24%
19%
Started with a limited scope (small amount of functionality, users, sites, projects, and/or departments) Started with a moderate scope (more functionality, users, sites, projects, and/or departments)
Started with relatively full scope (significant amount of functionality, users, sites. projects, and departments)
16 © Tech-Clarity, Inc. 2015
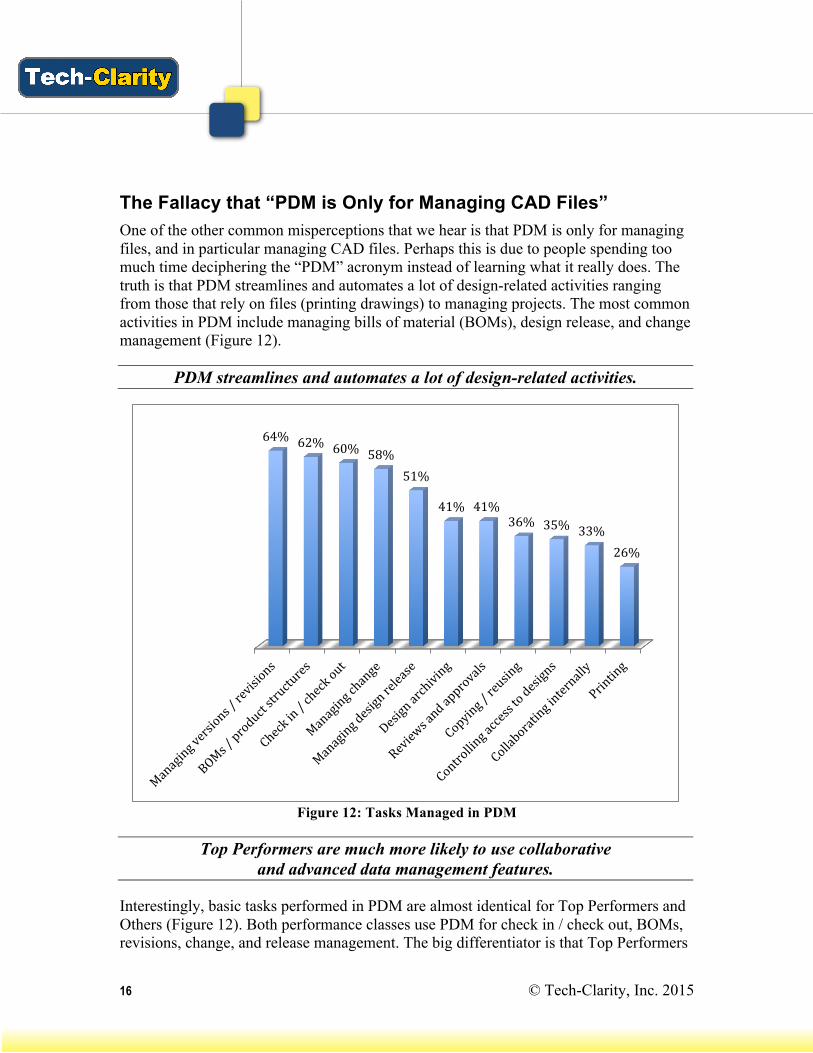
The Fallacy that “PDM is Only for Managing CAD Files” One of the other common misperceptions that we hear is that PDM is only for managing files, and in particular managing CAD files. Perhaps this is due to people spending too much time deciphering the “PDM” acronym instead of learning what it really does. The truth is that PDM streamlines and automates a lot of design-related activities ranging from those that rely on files (printing drawings) to managing projects. The most common activities in PDM include managing bills of material (BOMs), design release, and change management (Figure 12).
PDM streamlines and automates a lot of design-related activities.
Figure 12: Tasks Managed in PDM
Top Performers are much more likely to use collaborative and advanced data management features.
Interestingly, basic tasks performed in PDM are almost identical for Top Performers and Others (Figure 12). Both performance classes use PDM for check in / check out, BOMs, revisions, change, and release management. The big differentiator is that Top Performers
64% 62% 60% 58% 51%
41% 41% 36% 35% 33%
26%
17 © Tech-Clarity, Inc. 2015
are much more likely to use collaborative and advanced data management features like collaborating internally (44% compared to 30%) multi-CAD management (44% compared to 22%). PDM clearly has a lot to offer beyond managing files.
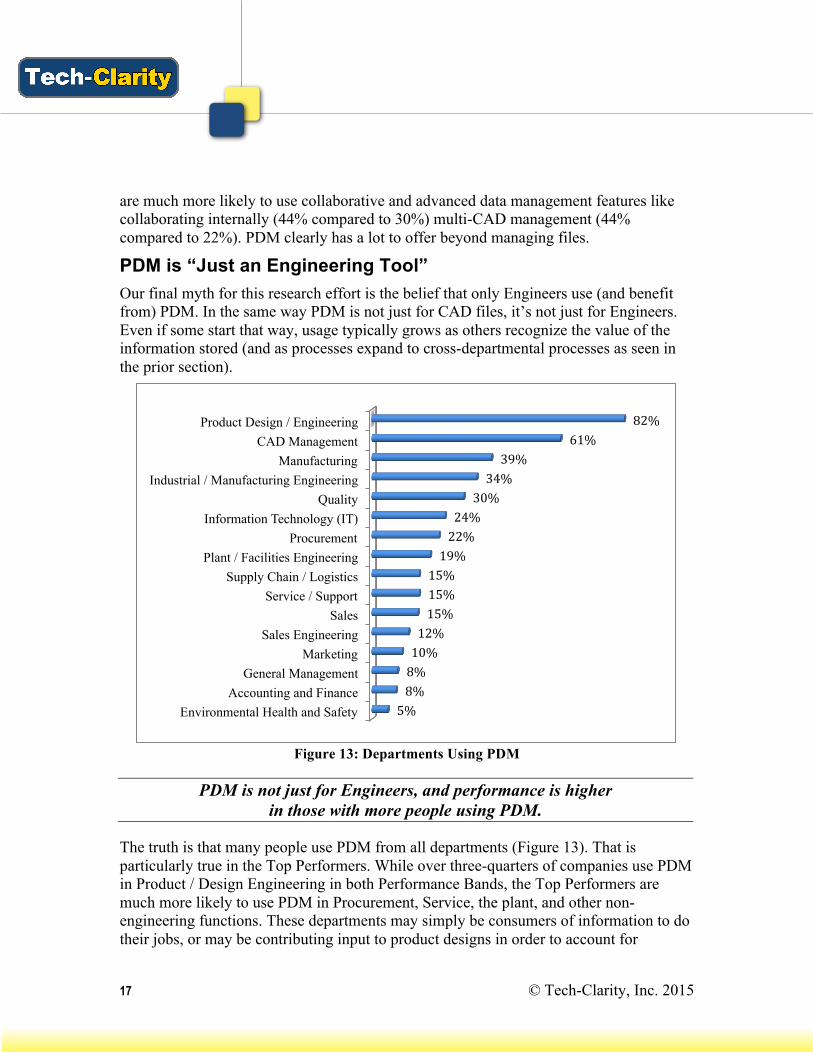
PDM is “Just an Engineering Tool” Our final myth for this research effort is the belief that only Engineers use (and benefit from) PDM. In the same way PDM is not just for CAD files, it’s not just for Engineers. Even if some start that way, usage typically grows as others recognize the value of the information stored (and as processes expand to cross-departmental processes as seen in the prior section).
Figure 13: Departments Using PDM
PDM is not just for Engineers, and performance is higher in those with more people using PDM.
The truth is that many people use PDM from all departments (Figure 13). That is particularly true in the Top Performers. While over three-quarters of companies use PDM in Product / Design Engineering in both Performance Bands, the Top Performers are much more likely to use PDM in Procurement, Service, the plant, and other non-engineering functions. These departments may simply be consumers of information to do their jobs, or may be contributing input to product designs in order to account for
Product Design / Engineering CAD Management
Manufacturing Industrial / Manufacturing Engineering
Quality Information Technology (IT)
Procurement Plant / Facilities Engineering
Supply Chain / Logistics Service / Support
Sales Sales Engineering
Marketing General Management
Accounting and Finance Environmental Health and Safety
82% 61%
39% 34%
30% 24% 22% 19%
15% 15% 15%
12% 10% 8% 8% 5%
18 © Tech-Clarity, Inc. 2015
downstream needs early in design. The bottom line is that PDM is not just for Engineers and performance is higher in those with more people using PDM.
Conclusion Product Data Management (PDM) helps companies improve business performance by improving time to market, product quality, innovation, efficiency, product cost, and more. PDM’s ability to help companies control, access, and share product data is a powerful tool that helps companies improve top- and bottom-line performance.
This report shares facts from prior research and a survey of over 2,500 companies to help educate companies about PDM. In particular, the report provides clarity around a series of urban legends that are commonplace in the industry, including:
Myth: PDM is only for those that use 3D CAD Fact: It isn’t, those that primarily use 2D CAD have a lot to gain from PDM
Myth: PDM is “all or nothing” Fact: Most companies start with a limited scope and grow over time
Myth: Small companies don’t need or benefit from PDM Fact: It’s really product complexity that drives the need for PDM, and small
companies have a lot to gain
Myth: PDM is only for managing CAD files Fact: PDM manages files of all kinds and automates and improves important,
product-centric processes
Myth: PDM is only an engineering tool Fact: Most companies – including the Top Performers – expand usage across
departments
Myth: PDM has to cost a lot Fact: Simply not true, although it can if it’s part of an “enterprise
transformation”
Myth: PDM has to take a lot of time to implement Fact: The facts show that just isn’t the case
Hopefully a clear understanding of PDM and its accessibility will help drive practical conversations in companies with unmanaged product data, and allow them to take advantage of the benefits available from PDM.
19 © Tech-Clarity, Inc. 2015
Recommendations Based on industry experience and research for this report, Tech-Clarity offers the following recommendations:
• Reevaluate preconceived notions about the cost and time required to implementPDM based on the facts provided in this report
• Companies that use 2D as their primary design tool should recognize the need andvalue of PDM
• Companies that use 3D as their primary design tool should recognize that there ismore value available from PDM than simply keeping complex file relationshipsunder control
• Smaller companies should recognize that complexity is the driver of datamanagement challenges as opposed to size, but also recognize that PDM cost isdriven by size. This provides them with a strong opportunity for improvementwith an attractive ROI.
• Recognize that PDM implementations can start small and expand value over time,reducing the barrier to entry and business benefits
• For those without PDM, get started and grow value over time• For those with PDM, recognize that PDM provides a foundation for growth.
Increase value by implementing additional capabilities and expanding usage tomore departments.
About the Author Jim Brown is the President of Tech-Clarity, an independent research and consulting firm that specializes in analyzing the business value of software technology and services. Jim has over 20 years of experience in software for the manufacturing industries. He has a broad background including roles in industry, management consulting, the software industry, and research. His experience spans enterprise applications including PLM, ERP, quality management, service lifecycle management, manufacturing, supply chain management, and more. Jim is passionate about improving product innovation, product development, and engineering performance through the use of software technology.
Jim is an experienced researcher, author, and public speaker and enjoys the opportunity to speak at conferences or anywhere he can engage with people with a passion to improve business performance through software technology.
Jim can be reached at [email protected]. You can read additional research, watch Tech-Clarity TV, or join the Clarity on PLM blog at www.tech-clarity.com. You can also follow Jim on Twitter at @jim_techclarity, or find Tech-Clarity on Facebook as TechClarity.inc.

20 © Tech-Clarity, Inc. 2015
About the Research Tech-Clarity gathered and analyzed 2,500 responses to a web-based survey on designing software-intensive products. The survey was conducted in English, French, German, Italian, Japanese, Korean, Polish, and Simplified Chinese. Survey responses were gathered by direct e-mail, social media, and online postings by Tech-Clarity, Autodesk, and Engineering.com.
The respondents were comprised of about one-half (54%) who were individual contributors and one-third (33%) who were managers. The remaining 12% represented director, VP, or executive levels of their organizations.
The respondents represented a mix of company sizes, including 39% from smaller companies (less than $50 million), 16% between $50 million and $100 million, 12% between $100 million and $250 million, 16% between $250 million and $1 billion, and 17% greater than $1 billion. All company sizes were reported in US dollar equivalent.
In addition, respondents represented a mix of company sizes based on the number of engineers or designers in their business ranging from less than 5 (28%), between 6 and 20 (26%), between 21 and 100 (21%), between 101 and 500 (12%), and over 500 (13%).
The responding companies were a good representation of the manufacturing and design industries, including Industrial Equipment / Machinery (34%), Automotive and Transportation (22%), Building Products / Fabrication (17%), High-tech and Electronics (15%), and others including Energy / Utilities, Chemicals, Consumer Packaged Goods, Life Sciences / Medical Devices, and more. Note that these numbers add up to greater than 100% because some companies indicated that they are active in more than one industry.
The respondents reported doing business globally, with most companies doing business in Asia / Pacific Rim (60%), about one-third in North America (35%), another one-third doing business in Western Europe (31%), Eastern Europe (12%), and Latin America (7%). Note that these numbers add up to greater than 100% because some companies indicated that they receive 10% more of their revenue from multiple geographies.
Respondents included manufacturers as well as service providers and software companies, but responses from those determined not to be directly involved in design or manufacturing were not included in the analysis.