TEAMSAI AND CAVOK JOIN FORCES - ARSAarsa.org/.../ARSA-CAVOK-2015MROAssessment-20150302.pdf ·...
86
-
Upload
trinhthien -
Category
Documents
-
view
214 -
download
0
Transcript of TEAMSAI AND CAVOK JOIN FORCES - ARSAarsa.org/.../ARSA-CAVOK-2015MROAssessment-20150302.pdf ·...


1 Copyright © 2015 CAVOK, a division of Oliver Wyman
TEAMSAI AND CAVOK JOIN FORCES
In 2013 the Aeronautical Repair Station Association (ARSA) announced a strategic partnership with TeamSAI,
an aviation consulting firm specializing in strategic, tactical and operational management solutions. The
relationship enabled the firms to combine ARSA’s industry knowledge and policy expertise with TeamSAI’s
betterinsight™ market intelligence service to create regular, high quality economic analyses of the global
aviation maintenance sector.
As of February 2, 2015, CAVOK, the aviation technical services and consulting division of international
consulting firm Oliver Wyman, has acquired and integrated TeamSAI into their business. The new CAVOK and
its betterinsight™ market intelligence service will continue to work with ARSA to provide critical information
to make its members more effective managers and leaders, and help lawmakers, regulators, journalists, and
voters better understand the economic consequences of policy decisions.
CONTENTS
EXECUTIVE SUMMARY ................................................................................................................................................... 3
STATE OF THE WORLD ................................................................................................................................................... 5
STATE OF THE AIRLINE INDUSTRY .................................................................................................................................. 7
GLOBAL AIR TRANSPORT FLEET FORECAST ................................................................................................................... 9
1. FLEET MIX ........................................................................................................................................................ 13
2. AIRCRAFT ORDERS IN 2014 ............................................................................................................................. 15
3. ORDER BACKLOG ............................................................................................................................................ 17
4. DELIVERIES AND RETIREMENTS ...................................................................................................................... 18
5. CARGO FLEET .................................................................................................................................................. 20
6. REGIONAL FLEET CHARACTERISTICS .............................................................................................................. 23
GLOBAL AIR TRANSPORT MRO MARKET FORECAST ..................................................................................................... 27
1. TOTAL MRO BY CLASS ..................................................................................................................................... 28
2. TOTAL MRO BY REGION .................................................................................................................................. 29
3. TOTAL MRO BY OEM ....................................................................................................................................... 31
4. TOTAL MRO BY AIRCRAFT FAMILY/MODEL ..................................................................................................... 33
5. IMPLICATIONS FOR MROS .............................................................................................................................. 35
AIRFRAME MAINTENANCE MARKET FORECAST AND STRUCTURE ............................................................................... 37
1. MARKET STRUCTURE ...................................................................................................................................... 39
2. COST STRUCTURE ........................................................................................................................................... 41
3. SUPPLY CHAIN ................................................................................................................................................ 42

Copyright © 2015 CAVOK, a division of Oliver Wyman 2
ENGINE MAINTENANCE MARKET FORECAST AND STRUCTURE ................................................................................... 43
1. MARKET STRUCTURE ...................................................................................................................................... 47
2. COST STRUCTURE ........................................................................................................................................... 49
3. SUPPLY CHAIN ................................................................................................................................................ 50
COMPONENT MAINTENANCE FORECAST AND STRUCTURE ........................................................................................ 51
1. MARKET STRUCTURE ...................................................................................................................................... 53
2. COST STRUCTURE ........................................................................................................................................... 55
3. SUPPLY CHAIN ................................................................................................................................................ 56
LINE MAINTENANCE MARKET FORECAST AND STRUCTURE ........................................................................................ 57
1. MARKET STRUCTURE ...................................................................................................................................... 59
2. COST STRUCTURE ........................................................................................................................................... 61
3. SUPPLY CHAIN ................................................................................................................................................ 62
GLOBAL MRO BALANCE OF TRADE .............................................................................................................................. 63
1. AIRFRAME MAINTENANCE (excluding modifications) ...................................................................................... 63
2. ENGINE MAINTENANCE .................................................................................................................................. 66
3. COMPONENT MAINTENANCE ........................................................................................................................ 68
GLOBAL BUSINESS AVIATION OUTLOOK FOR 2015 ..................................................................................................... 70
AVIATION MAINTENANCE INDUSTRY EMPLOYMENT & ECONOMIC IMPACT ............................................................... 74
1. AIRFRAME & LINE MAINTENANCE ................................................................................................................... 75
2. ENGINE MAINTENANCE .................................................................................................................................. 76
3. COMPONENT MAINTENANCE ........................................................................................................................ 77
4. U.S. EMPLOYMENT AND ECONOMIC IMPACT................................................................................................. 78
CONCLUSION .............................................................................................................................................................. 81

3 Copyright © 2015 CAVOK, a division of Oliver Wyman
EXECUTIVE SUMMARY
This report details CAVOK’s 2015 assessment and ten-year outlook of the air transport maintenance, repair, and overhaul
(MRO) market and a one year out look of the business aviation MRO market, starting with a review of global economic
conditions, a key driver for the health of the industry. The global economy is expected to improve in the coming years, but
concerns remain over the strength of the recovery. Generally, airlines operate with very thin margins with major cost
drivers such as labor, maintenance, and fuel, greatly influencing financial performance. Operators are increasingly
relentless in managing costs; with limited leverage over labor and fuel, airlines focus significant attention on managing
maintenance expenses.
The global commercial air transport fleet stands at nearly 24,000 aircraft. Approximately one-third is domiciled in North
America. Twenty percent is in Western Europe while Eastern Europe has five percent. Asia Pacific, China, and India
combined have slightly more than a quarter of the world’s fleet; however, the composition will be changing over the next
ten years. The North American share is expected to experience a decline of seven percent; any net growth is limited by the
large operators’ significant re-fleeting efforts. The Asian markets anticipate the highest growth rates, representing
opportunities for the MRO industry.
Globally, the 2015 air transport jet and turboprop MRO markets are expected to be $67.1B, piercing the $100B milestone
by 2025. This represents a healthy 4.1% compound annual growth rate (CAGR). The airframe, engine, component, and
line MRO market segments each have a different growth profile:
Airframe MRO 2015 forecast is $14.5B, increasing to $16.7B by 2025. This represents a 1.4% growth
rate, the slowest MRO segment during the forecast period. Airlines and their affiliated maintenance
providers maintain a solid hold on this market. The airframe MRO market is considered a low-margin,
labor intensive segment.
Engine MRO is expected to be $27.9B in 2015; growing at 5.3% annually it will reach $46.8B by 2025.
Unlike airframe MRO, the engine segment is largely contracted with the engine original equipment
manufacturers (OEMs) having a large share of the market. Engine MROs, recognizing the value of the
aftermarket, typically enjoy higher margin work.
Component MRO is forecast to be $12.4B in 2015, growing to $19.2B by 2025, representing a 4.4%
annual growth rate. Like the engine MRO business, much of the component segment is contracted,
though it varies greatly from one component type to the next. Similarly, the labor and material mix can
vary.
Line MRO is pegged at $12.3B in 2015 and forecast to grow at 3.7% annually to $17.8B by 2025. The
nature of line maintenance is less prone to contracting, and because the work is labor-intensive and
subject to limited ground times in a scheduled operation, the opportunities to take advantage of
economies of scale are limited.

Copyright © 2015 CAVOK, a division of Oliver Wyman 4
An examination of the flow of maintenance work among and between regions reveals that North America contracts more
airframe maintenance to the rest of the world than it provides to other regions. Engine maintenance, on the other hand, is
just the opposite. North America supports other regions with more capacity and throughput than its region demands.
Structural characteristics in the global economy such as labor rate differentials and complex supply chains have led to these
trends; however, as the differentiators between developed and developing regions narrow, North America will be ripe to
repatriate airframe maintenance currently contracted to other regions.
The business aviation fleet currently consists of nearly 31,400 aircraft requiring roughly $8.8B in MRO market activity in
2015. Nearly 67% (17,814) of the business aviation fleet is domiciled in North America.
In terms of economic activity, MRO plays a significant role. In the United States, approximately 4,023 firms with more than
218,000 employees operate in the civil MRO market (including airline employees). Small and medium-sized enterprises
(SME) account for 84% of these U.S. firms and 20% of all employees. There are 141,707 technicians in the U.S. and
approximately 37% are certificated.

5 Copyright © 2015 CAVOK, a division of Oliver Wyman
STATE OF THE WORLD
Seven years have passed since the last global financial crisis. Global recovery is weak and uneven, but economic
predictions for 2015 anticipate quickening economic growth. Emerging market and developing economies will continue
to be the largest portion of global growth, but output will remain below the levels seen in the 2010-2011 rebound. Led by
the United States and the United Kingdom, advanced economies are expected to pick up steam in 2015; however, the
spread between the growth rates of developed and developing economies is expected to widen slightly due to weakening
conditions that continue to linger in the advanced economies.
EXHIBIT 1: IMF World Economic Outlook Projections
Source: IMF World Economic Outlook – October 2014
World gross domestic product (GDP) is expected to grow by 3.8% in 2015 according to the October 2014 International
Monetary Fund (IMF) World Economic Outlook with the factors underlying global economic activity continuing to improve.
Significant risks, including spillover effects of central bank policies, and escalating geopolitical tensions in Eastern Europe
still remain.
Advanced economies are expected to see a 2.3% increase in GDP for 2015, a half a point increase over 2014 and nearly a
full point over the growth experienced in 2013. Drivers of the predicted growth acceleration are efforts to stabilize debt to
GDP ratios by reducing deficit spending, and enduring loose credit monetary policies that will keep interest rates at or near
record lows.
The U.S. is forecast to experience 3.1% GDP growth in 2015 driven by an accommodative monetary policy, strengthened
household balance sheets, and a healthy housing market. Across the Pacific, with the Japanese economic revival remaining
problematic, expected growth in 2015 is only 1.5%.
The euro zone, moving slowly out of recession, is expected to grow by 1.3% in 2015; however, considerable financial,
economic, and political challenges remain. Unexpected weakness in Germany and worsening conditions in France creates
1.2% 1.4%1.8%
2.3%
5.1%4.7%
4.4%5.0%
3.4% 3.3% 3.3%3.8%
0.0%
1.0%
2.0%
3.0%
4.0%
5.0%
6.0%
2012 2013 2014 2015
Advanced Economies Emerging & Developing Economies World Output

Copyright © 2015 CAVOK, a division of Oliver Wyman 6
concern. Policymakers face significant challenges in restoring confidence in the financial sector; high levels of private and
public debt and unemployment create political instability risks. The euro zone priority is to achieve strong growth and
increase inflation, which implies that the euro zone will continue to loosen monetary policy, and may go as far as
purchasing sovereign assets if economic conditions do not improve.
Emerging and developing economies, including China, are expected to grow at 5.0% in 2015. Exports – driven by stronger
growth in advanced economies and stronger domestic demand encouraged by low levels of unemployment – are expected
to support this growth. While the emerging and developing economies are expected to experience the strongest growth
since 2012, their output will remain below the growth rates achieved during the 2010-2011 rebound. This reflects the long
lasting structural factors affecting all economies. Even as residential investment continues to slow in China, GDP is
projected to sustain its high growth at 7.1% in 2015, down just 0.3% from 2014. China’s growth in both 2014 and 2015 is
primarily the result of new tax relief policies adopted in the first half of 2014, increased infrastructure spending, and cuts
in required reserve ratios.
Growth in India is expected to increase substantially to 6.4% as demand for exports and investments continue.
In contrast to the two aforementioned high growth countries, the Commonwealth of Independent States is projected to
grow a mere 1.6%, reflecting the region’s deteriorating economic and geopolitical conditions. The low growth is due in
part to the situation in Ukraine, resultant sanctions placed upon Russia, and currently low oil prices.
The weak and uneven growth in GDP along with rising geopolitical tensions also negatively impact trade. In 2015, the
World Trade Organization projects global trade growth at 4.0%. Exports are projected to increase by 3.8% in developed
economies and 4.5% in developing economies while imports are expected to rise by 3.7%% in developed economies and
4.5% in developing economies.
There are signs that growth is picking up in both developed and developing countries, but the world continues to face a
fragile recovery. Economic issues have significant impact on the airline and MRO industries. Business environments
become increasingly challenging when conditions worsen.
A bright spot that has developed in recent months is the price of crude oil. The price of oil went into free fall during the last
quarter of 2014 and it is not expected to recover in 2015. While the increased supply and reduced cost of oil has a positive
impact on the world’s regions, except the Middle East, in 2015, the World Bank is forecasting that oil prices will break $100
per barrel again within the decade. With this in mind, market participants should carefully consider hedging options once
the price of oil has stabilized and begins to trend higher.

7 Copyright © 2015 CAVOK, a division of Oliver Wyman
STATE OF THE AIRLINE INDUSTRY
The graph below depicts IATA’s estimate that 3.3 billion passengers and 51.3 million metric tons of cargo were carried in
2014. The growth in traffic together with airline capacity discipline created first-time passenger load factors of 80%,
allowing the industry to record an estimated $19.9 billion in post-tax profits.
EXHIBIT 2: IATA Global Passenger and Freight Traffic Growth Forecasts
Source: IATA Industry Financial Forecast – June 2014
IATA believes the key elements for the best financial performance since 2010 are the development of ancillary revenue
sources, industry restructuring, falling fuel prices and the strong cyclical economic upturn. IATA also understands that the
upturn in advanced economies is a result of loose monetary policies, reduced budgetary tightening, and improving
balance sheets for households and banking.
Despite the presence of adverse developments in Ukraine, the stuttering euro area recovery, and growing terrorist and
militant actions in the Middle East, with low fuel prices expected throughout the year, the industry is forecast to improve
upon last year’s performance.
In 2015, passenger traffic is expected to be up 7.0%, well above the 20 year average of 5%, and cargo volumes are expected
to grow by 4.5%. The anticipated 7.3% passenger capacity growth will slightly exceed traffic growth, pushing the expected
load factor down a few tenths.
0.0%
1.0%
2.0%
3.0%
4.0%
5.0%
6.0%
7.0%
8.0%
$-
$5
$10
$15
$20
$25
$30
2013 2014 2015F
TRA
FFIC
GR
OW
TH R
ATE
S
PO
ST T
AX
PR
OFI
TS
BIL
LIO
NS
Post-Tax Profits Passenger Traffic Freight Traffic

Copyright © 2015 CAVOK, a division of Oliver Wyman 8
In addition to the strong traffic growth, airlines are expected to return a net profit of $25.0B in 2015, creating back-to-back
years of record profits. This increase in financial performance will be driven by marginally higher economic growth
expected in 2015, continued increases in revenue from ancillary services, improvements to industry structure and
efficiency, and substantially lower fuel prices.
EXHIBIT 3: Spot Prices of Crude Oil and Jet Fuel per Gallon
Source: U.S. Energy Information Administration
IATA is forecasting the price of jet fuel to average $2.38 per gallon in 2015, down from $2.78 per gallon in 2014, and thus
fuel costs are expected to decrease in 2015 as a percentage of airline operating costs to 26%. For the past several years,
fuel costs as a percent of total airline expenses have been hovering around 30%. Notwithstanding current low fuel prices,
improving fuel efficiency will continue to be a priority for airlines in 2015, and for the foreseeable future.
IATA’s 2015 forecast represents the most upbeat outlook the industry has seen in several years as traffic and profitability
are forecast to continue to improve; however, the airline industry remains a comparatively low margin business, and the
balance between profit and loss remains delicate. Net margins are expected to remain weak at 3.2% in 2015, and as such,
the industry remains highly susceptible to negative shocks.
$-
$0.50
$1.00
$1.50
$2.00
$2.50
$3.00
$3.50
$4.00
Jan
-04
Ap
r-0
4Ju
l-0
4O
ct-0
4Ja
n-0
5A
pr-
05
Jul-
05
Oct
-05
Jan
-06
Ap
r-0
6Ju
l-0
6O
ct-0
6Ja
n-0
7A
pr-
07
Jul-
07
Oct
-07
Jan
-08
Ap
r-0
8Ju
l-0
8O
ct-0
8Ja
n-0
9A
pr-
09
Jul-
09
Oct
-09
Jan
-10
Ap
r-1
0Ju
l-1
0O
ct-1
0Ja
n-1
1A
pr-
11
Jul-
11
Oct
-11
Jan
-12
Ap
r-1
2Ju
l-1
2O
ct-1
2Ja
n-1
3A
pr-
13
Jul-
13
Oct
-13
Jan
-14
Ap
r-1
4Ju
l-1
4O
ct-1
4
WTI Crude Oil Brent Crude Oil Kerosene-Type Jet Fuel

9 Copyright © 2015 CAVOK, a division of Oliver Wyman
GLOBAL AIR TRANSPORT FLEET FORECAST
The global commercial air transport fleet currently stands at nearly 24,000 aircraft and is expected to grow 3.9% annually
from 2015-2020 to 29,003 aircraft. Growth is expected to slow to 3.5% per year during the second five year period, bring
the total number of in service aircraft up to 34,408 by 2025.
EXHIBIT 4: 2015-2025 Global Fleet Forecast by Aircraft Class
Source: betterinsight™ and PlaneStats
13,124
16,949
21,089
4,686
5,753
7,181
3,396
3,222
2,906
2,721
3,079
3,232
23,927
29,003
34,408
5.2%
4.5%4.2%
4.5%
-1.0%
-2.0%
2.5%
1.0%
0
5,000
10,000
15,000
20,000
25,000
30,000
35,000
40,000
2015 2015-2020CAGR
2020 2020-2025CAGR
2025
Narrowbody Widebody Regional Jet Turboprop

Copyright © 2015 CAVOK, a division of Oliver Wyman 10
EXHIBIT 5: 2015-2025 Global Fleet Forecast by Aircraft Usage
Source: betterinsight™ and PlaneStats
Over the entire ten-year forecast, CAVOK predicts the global fleet will grow on average by 3.7% annually. The passenger
fleet is expected to grow at 3.8% annually and the cargo fleet by 2.3% annually.
22,056
26,947
32,062
1,871
2,056
2,346
23,927
29,003
34,408
4.1%
3.5%
1.9%
2.7%
0
5,000
10,000
15,000
20,000
25,000
30,000
35,000
40,000
2015 2015-2020CAGR
2020 2020-2025CAGR
2025
Passenger Cargo

11 Copyright © 2015 CAVOK, a division of Oliver Wyman
EXHIBIT 6: 2015-2025 Global Aircraft Demand
Source: betterinsight™ and PlaneStats
Fueling the 3.7% annual growth rate, CAVOK forecasts the delivery of 18,068 new passenger aircraft and 423 new cargo
aircraft over the next ten years, and the retirement of 7,346 passenger aircraft and 664 cargo aircraft over the same period.
In other words, 43% of the new deliveries over the forecast period are replacement aircraft while 57% are for growth. In
addition to deliveries of new aircraft and the retirement of current in-service aircraft, the 716 passenger to freighter
conversions of current in-service aircraft will play an integral role in the size and growth of the global cargo fleet, which is
discussed further in section five of this fleet forecast.

Copyright © 2015 CAVOK, a division of Oliver Wyman 12
EXHIBIT 7: 2015-2025 In-service Fleet Growth by Region
Source: betterinsight™ and PlaneStats
Just as the economic growth outlook varies widely from region to region, so too does the in-service fleet growth outlook.
At one extreme of the regional fleet growth outlook, North American airlines have created the highest demand for new
aircraft. Over 4,100 new aircraft are forecast to be delivered to the region over the next ten years with 78% of the deliveries
slotted as replacements for older aircraft. China, on the other hand, is experiencing just the opposite phenomenon where
2,548 deliveries will mostly support net growth. The systematic elimination and replacement of older, less fuel efficient
aircraft is expected to improve the bottom line of airlines by reducing fuel and maintenance costs over the life of the aircraft.
22%922
69%2,219
48%1,452
89%2,264
63%920 73%
96850%565
96%800
45%371
0
500
1,000
1,500
2,000
2,500
3,000
3,500
4,000
4,500
NorthAmerica
Asia Pacific WesternEurope
China LatinAmerica &Caribbean
Middle East EasternEurope
India Africa
Deliveries Retirements Net Growth

13 Copyright © 2015 CAVOK, a division of Oliver Wyman
1. FLEET MIX
Today, the global commercial airline fleet of western built jets and turboprops is made up of 13,124 narrowbodies, 4,686
widebodies, 3,396 regional jets, and 2,721 turboprops. While the airline fleet expected to grow by nearly 10,500 aircraft
by 2025, the complexion of the global fleet is not expected to experience drastic change.
The narrowbody (NB) fleet currently comprises nearly 55% of the total fleet with some 13,124 in-service aircraft. Over the
next ten-year period, its share will rise to 61%, growing to 21,089. The narrowbody is the fastest growing aircraft class and
is expected to achieve a 4.9% CAGR over the next ten years.
EXHIBIT 8: 2015-2025 Narrowbody Fleet Characteristics
2015 2020 2025
Fleet Size 13,124 16,949 21,089
CAGR N/A 5.2% 4.9%
Market Share 55% 58% 61%
Source: betterinsight™ and PlaneStats
Widebodies (WB) presently account for 20% of the total fleet. The in-service fleet will grow from 4,686 to 5,753 over five
years, and to 7,181 in ten years. Widebody market share will remain fairly constant over the forecast period. The widebody
fleet is also expected to achieve a robust CAGR of 4.4% over the forecast period.
EXHIBIT 9: 2015-2025 Widebody Fleet Characteristics
2015 2020 2025
Fleet Size 4,686 5,753 7,181
CAGR N/A 4.2% 4.4%
Market Share 20% 20% 21%
Source: betterinsight™ and PlaneStats

Copyright © 2015 CAVOK, a division of Oliver Wyman 14
Regional jets (RJ) currently make up roughly 14% of the total fleet, but that share will decline to 8% by 2025 as the fleet of
RJs shrinks from 3,396 to 2,906 in-service aircraft. This shrinking of the regional jet fleet is evidence of the up-gaging trend
that has been prevalent in recent forecasts as part of an industry wide effort to improve cost structure and profitability amid
volatile fuel prices.
EXHIBIT 10: 2015-2025 Regional Jet Fleet Characteristics
2015 2020 2025
Fleet Size 3,396 3,222 2,906
CAGR N/A -1.0% -1.5%
Market Share 14% 11% 8%
Source: betterinsight™ and PlaneStats
Turboprops (TP) account for 11% of the total fleet or 2,721 aircraft. Over the next five years, the in-service commercial
turboprop fleet will grow by 358 aircraft to 3,079. The fleet in 2025 is predicted to be 3,232 and make up 9% of the global
fleet.
EXHIBIT 11: 2015-2025 Turboprop Fleet Characteristics
2015 2020 2025
Fleet Size 2,721 3,079 3,232
CAGR N/A 2.5% 1.7%
Market Share 11% 11% 9%
Source: betterinsight™ and PlaneStats

15 Copyright © 2015 CAVOK, a division of Oliver Wyman
2. AIRCRAFT ORDERS IN 2014
Orders of typical usage types (passenger, freighter, combi, and quick-change) to commercial customers (airlines; airline
holding companies; banks; special purpose corporations; and financial lessors; and operating lease companies) during
2014 were as follows:
Gross orders from commercial customers in 2014 totaled 3,282, and net orders totaled 2,847.
Boeing won the orders battle by recording 1,296 net orders over Airbus’ 1,099.
EXHIBIT 12: 2014 Aircraft Orders by Aircraft Family/Series and Aircraft Class
Aircraft Class Aircraft Family/Series
NB WB RJ TP
Airbus A320CEO/NEO Family 967 49%
Airbus A330 Family 150 34%
Airbus A350 Family -32 -7%
Airbus A380 14 3%
ATR 42/72 155 82%
Boeing 737NG/MAX Series 992 51%
Boeing 747 Series 0 0%
Boeing 767 Series 4 1%
Boeing 777/777X Series 276 63%
Boeing 787 Series 24 6%
Bombardier CRJ Series 45 17%
Bombardier CSeries 59 22%
Bombardier QSeries 34 18%
Embraer E-Jet/E2 115 44%
Mitsubishi MRJ 24 9%
Sukhoi Superjet 100 20 8%
Total Net Orders 2,018 71% 436 15% 204 7% 189 7%
Source: betterinsight™ and PlaneStats

Copyright © 2015 CAVOK, a division of Oliver Wyman 16
An important factor in the 2014 order total relative to previous years was the significant drop in orders for widebody and
regional jet aircraft (namely A350, 787, and E-175/E-175 E2 aircraft), while A320CEO/NEO family and 737NG/MAX series
aircraft continued to dominate narrowbody orders with 97% of net narrowbody orders and 69% of net total orders.
Overall, 2,018 net narrowbody orders were placed by commercial customers. The 737NG/MAX series led narrowbody
orders with 992 net orders, while the A320 family and C-Series followed with 967 and 59 net orders, respectively.
Widebodies represented roughly 15% of net orders. Orders for widebodies in 2014 decreased substantially over the
previous year’s orders. The 2014 net total of 436 widebody orders was down from 607 net orders in 2013. The top-selling
widebody was the 777 with 276 net orders. The 787 received 24 net orders. The A350 received -32 net orders. Airbus
received 150 net orders for the A330, and 14 net orders for the A380. The 747 series received 2 orders and 2 cancellations
in 2014 resulting in 0 net orders.
Regional jet orders constituted 9% of net orders with 204 net orders. The E-Jet family led regional orders with 115 net
orders in 2014. Bombardier’s CRJ program received 45 net orders, and Sukhoi took 20 net orders. Mitsubishi’s MRJ took
24 new orders.
Turboprops orders also represented roughly 7% of net orders with 189 net orders. ATR received 155 net orders for ATR-
72/42 aircraft, and Bombardier received 34 net orders for Q400 aircraft.

17 Copyright © 2015 CAVOK, a division of Oliver Wyman
3. ORDER BACKLOG
The strong orders intake during the last few years has pushed the firm backlog to a record total of over 13,600 aircraft;
9,643 are narrowbodies (71%), 2,614 are widebodies (20%), 960 are regional jets (7%), and 344 are turboprops (3%). This
backlog is equal to 57% of the current in-service fleet.
Airbus has the largest share of the order backlog with 6,032 on order, while Boeing follows with 5,639 on order. All other
manufacturers account for the remaining 15% of aircraft on order.
This high level of backlog is equivalent to 8.5 years of production based on the 2014 delivery total. Production rates are
expected to increase for the 737 and 787, and several new aircraft programs are expected to launch in coming years. New
market entrants (A320NEO, 737MAX, CSeries, 787-10, 777-X, A350, C919, ARJ21, Embraer E2, MRJ, and MC-21)
represent 62% of the backlog.
EXHIBIT 13: 2015 Order Backlog by Aircraft Manufacturer and Aircraft Class
Source: betterinsight™ and PlaneStats

Copyright © 2015 CAVOK, a division of Oliver Wyman 18
4. DELIVERIES AND RETIREMENTS
As the world continues to recover from the global financial crisis, commercial aircraft manufacturers have never seen a
better market. In the face of historically high - although recently softening - fuel costs in combination with low interest rates
and a drive to reduce costs and increase profits, the airlines have generated unprecedented demand on the manufacturers
for more efficient and more reliable aircraft.
EXHIBIT 14: 2015-2025 Deliveries by Aircraft Class
Source: betterinsight™ and PlaneStats
During 2014, delivery of 1,575 new aircraft to operators made for another historic year. Boeing led with 692 deliveries
(44%) followed by Airbus with 611 (39%). Embraer delivered 90 (5%), ATR 76, Bombardier 77 (5%), and Sukhoi delivered
29 (2%).
The level of deliveries in the next few years is expected to remain high due to a strong backlog as well as expected
production rate increases by Airbus and Boeing. 8,865 aircraft are forecast to be delivered in the next five years, of which
64% will be narrowbodies, 22% widebodies, 8% regional jets, and 6% turboprops. Offsetting these deliveries will be nearly
3,800 retirements of current in-service aircraft, resulting in a net growth of 5,076 aircraft.
5,693
6,142
11,835 1,911
2,192
4,103
728
611 1,339
533
681 1,214
18,491
0
2,000
4,000
6,000
8,000
10,000
12,000
14,000
16,000
18,000
20,000
2015-2020 2020-2025 2015-2025
Narrowbody Widebody Regional Jet Turboprop

19 Copyright © 2015 CAVOK, a division of Oliver Wyman
In the second five-year period, sustained traffic growth due to continued worldwide GDP growth, increasing need to
replace older generation aircraft with more fuel efficient and less maintenance intensive aircraft, and the build-up of
production rates for 737MAX, A320NEO, 787, A350, and other new market entrants will drive a forecast for a higher level
of deliveries—some 9,626. However, more than 4,200 retirements of current in-service aircraft are forecasted in the same
period, resulting in a net growth of 5,405 aircraft.
Over the ten years, overall deliveries will total 18,491. Roughly 44% of deliveries will be for replacement and 8,010 aircraft,
or roughly 33% of the current in-service fleet, will be retired.
EXHIBIT 15: 2015-2025 Retirements by Aircraft Class
Source: betterinsight™ and PlaneStats
Delivery financing is expected to be a key factor in upcoming years given the high levels of forecast deliveries and
anticipated increases in the cost of financing, due to expected interest rate increases in advanced economies. Lessors are
likely to take a larger role in the commercial aviation market with nearly 50% of the global commercial aircraft fleet
expected to be under an operating lease by the end of the forecast period.
(1,868)
(2,002)
(3,870)(844)
(764)
(1,608)
(902)
(927)
(1,829)
(175)
(528) (703)
(8,010)
(9,000)
(8,000)
(7,000)
(6,000)
(5,000)
(4,000)
(3,000)
(2,000)
(1,000)
02015-2020 2020-2025 2015-2025
Narrowbody Widebody Regional Jet Turboprop

Copyright © 2015 CAVOK, a division of Oliver Wyman 20
5. CARGO FLEET
The current cargo fleet of 1,871 in-service aircraft is forecast to grow an average of 2.3% a year to 2,346 by 2025. With short
haul and domestic traffic subject to strong competition by trucks in the U.S. and Europe, long haul traffic is the key to the
cargo market; however this market is being threatened by large bellied passenger aircraft such as the 777 which has 25%
more capacity under the floor than a 747-8. Over 35% of the existing active fleet will be retired over the next ten years,
reflecting the high average age of the freighter fleet which is 21.6 today and will be 21.4 in 2025.
EXHIBIT 16: 2015-2025 Cargo Fleet by Aircraft Class
Source: betterinsight™ and PlaneStats
All 423 of the new deliveries over the 10 year period are forecast to be widebodies, contributing to a slight reduction of the
cargo fleet age. New build freighter deliveries are destined to the larger carriers as longer range models, where their higher
utilization make them economically viable.
564 618 626
966
1,056
1,336
27
27
34
314
355
350
1,871
2,056
2,346
1.8% 0.3%
1.8%
4.8%0.0%
4.7%2.5%
-0.3%
0
500
1,000
1,500
2,000
2,500
2015 2015-2020CAGR
2020 2020-2025CAGR
2025
Narrowbody Widebody Regional Jet Turboprop

21 Copyright © 2015 CAVOK, a division of Oliver Wyman
EXHIBIT 17: 2015-2025 Cargo Aircraft Deliveries, Conversions, and Retirements
2015-2020 2020-2025
Deliveries 154 269
Conversions 324 392
Retirements 293 371
Source: betterinsight™ and PlaneStats
Some 716 conversions will account for 63% of the aircraft being added to the cargo fleet. The lower capital cost of
acquisition and conversion is critical to the economics for lower utilization markets. Reduced demand due to increased
competition from trucking and rail has led to fewer conversions being forecast.
EXHIBIT 18: 2015-2025 Conversions by Aircraft Class
Source: betterinsight™ and PlaneStats
187
148
335 50
113
163
9
22
31
78
109
187
716
0
100
200
300
400
500
600
700
800
2015-2020 2020-2025 2015-2025
Narrowbody Widebody Regional Jet Turboprop

Copyright © 2015 CAVOK, a division of Oliver Wyman 22
CAVOK forecasts that roughly 46% of the conversions during the forecast period will be narrowbody aircraft. Turboprop
aircraft will make up 26% of conversions over the next ten years, widebody aircraft will make up 23%, and regional jet
aircraft will make up the remaining 4% of conversions.
Interesting developments to watch in the future include conversion programs for the A320/321, A330, 737NG, 777,
CRJ100/200 aircraft and the success of the MD-80 program.
To date, the narrowbody passenger to freighter conversion market has been dominated by Boeing models, namely the
737-400. Airbus has not yet been able to develop an economical narrowbody freighter for several reasons, but chief among
them being technical issues related to the placement of the A320 family’s fly-by-wire system as it runs through the area
where the cargo door would typically be placed. Recently, however, PacAvi Group, in partnership with AeroTurbine, has
announced that it is launching a new program for conversion of A320/A321 aircraft and expects deliveries to begin in 2017
or earlier. It will be interesting to watch this program progress, especially since the A320 family passenger to freighter
conversion joint venture between Airbus and Irkut was shuttered due to technical challenges and costs.
The 737-800, much like its predecessor, the 737-400, will be a popular conversion candidate in the coming years. The
aircraft is capable of transporting one additional pallet over the 737-400 and is a proven, reliable airframe with much newer
technology.
The first MD-80 passenger to freighter supplemental type certificate was issued in 2013. This aircraft is considerably more
expensive to operate on an hourly basis than the slightly smaller Boeing 737-400 which burns about 12% less fuel;
however, the significantly lower ownership costs make this an attractive niche aircraft for low utilization cargo operators
whose aircraft spend a significant amount of time on the ground. Aeronautical Engineers estimates that a 737-400 can cost
between $3.3 million and $4.0 million where was an MD-80 will go for $750,000 to $800,000.
For some time now, Boeing has been promoting the 777 passenger to freighter conversion alongside the new build 777F
with little success. Technical design and cost issues related to replacing the composite floor beams are a major drawback
to the program and the widebody dedicated freighter market in general has been suffering in the past few years as the
airlines have been moving more cargo in the bellies of large passenger aircraft amidst high fuel prices and soft demand for
expedited cargo shipments. This shift away from dedicated freighters to the bellies of passenger aircraft has also affected
the success of the A330 passenger to freighter conversion program as well as the new build A330 new build freighter.
Lastly, the CRJ passenger to freighter conversion program was launched in 2013 by Miami based Aeronautical Engineers,
Inc., but it remains to be seen whether or not there is a market for these small freighters, especially since the CRJs will have
to compete against the lower cost turboprop freighters such as the ATR72. CAVOK forecasts more than 120 ATR
conversions over the next ten years and only 30 CRJ conversions over the same period.

23 Copyright © 2015 CAVOK, a division of Oliver Wyman
6. REGIONAL FLEET CHARACTERISTICS
The global commercial air transport fleet currently stands at nearly 24,000 aircraft. Approximately one-third of the fleet is
domiciled in North America. Twenty percent of the fleet is in Western Europe; Eastern Europe adds another 5%. Asia
Pacific, China, and India combined have slightly more than a quarter of the world’s fleet. However, the fleet composition is
changing. North America, which is experiencing significant re-fleeting, is expected to see its share decline by 7%, as its net
growth is very limited. Emerging markets in Asia are expected to see a greater share of the market, and therefore represent
the MRO growth engines for the industry.
EXHIBIT 19: 2015-2025 Fleet Share Change by Region
Source: betterinsight™ and PlaneStats
-7%
-3%
1%
1%
1%
1%
2%
2%
3%
-8% -6% -4% -2% 0% 2% 4%
North America
Western Europe
Africa
Latin America & Caribbean
Eastern Europe
Middle East
Asia Pacific
India
China

Copyright © 2015 CAVOK, a division of Oliver Wyman 24
EXHIBIT 20: 2015-2025 Fleet Growth by Region
Source: betterinsight™ and PlaneStats
The African fleet of 1,030 aircraft is forecast to grow 3.6% annually in the first five-year period to 1,228 aircraft by 2020
and 6.3% in the second-five year period to 1,670 aircraft by 2025.
Over the forecast period, 821 aircraft are forecast to be delivered while 450 currently in-service aircraft are forecast to be
retired. Africa is expected to receive over 270 net migrations over the forecast period, the majority of which are expected
to migrate from Western Europe.
The North American commercial fleet of 7,420 aircraft is, and will continue to be, the largest fleet throughout the ten-
year forecast period, although its share of the fleet declines from 31% to 24% of the in-service fleet.
CAVOK views North America as a mature market that will experience minimal fleet growth over the forecast period. The
North American commercial fleet is forecast to grow 1.2% annually to 7,874 aircraft by 2020 and by 0.7% to 8,142 aircraft
by 2025.
North America is forecast to receive 22% of the worldwide total deliveries over the next ten years (4,112 aircraft).
1,287
726
772
507
373
453
306
454
198
1,032
1,377
332
490
549
408
507
268
442
0 500 1,000 1,500 2,000 2,500
Asia Pacific
China
Western Europe
Latin America & Caribbean
Middle East
Eastern Europe
India
North America
Africa
2020 2025

25 Copyright © 2015 CAVOK, a division of Oliver Wyman
The current commercial fleet in India of 385 aircraft is forecast to grow 12.4% annually in the first five-year period to 691
aircraft by 2020 and by 11.6% per year in the second-five year period to 1,198 aircraft in 2025. Despite the high growth
rate, India will still have the smallest fleet in 2025 (3% share of global fleet) as limited infrastructure and significant
competition from rail continue to limit India’s aviation potential.
Over the forecast period, 832 aircraft are forecast to be delivered and very few aircraft currently in-service are forecast to
be retired in India due to the already young age of the country’s fleet.
The Eastern European fleet of 1,294 aircraft is forecast to grow 6.2% annually in the first five-year period to 1,747 aircraft
by 2020 and by 4.3% in the second-five year period to 2,155 aircraft in 2025.
Over the forecast period, 1,123 aircraft are forecast to be delivered, while 558 aircraft currently in-service are forecast to
be retired in the region. Eastern Europe is expected to receive over 280 net migrations over the forecast period, a large
portion of which are expected to come from Western Europe.
The fleet in the Middle East of 1,174 aircraft is forecast to grow 5.7% annually in the first five-year period to 1,547 aircraft
by 2020 and by 6.3% in the second-five year period to 2,096 aircraft in 2025.
Over the forecast period, 1,327 aircraft are forecast to be delivered and 359 aircraft currently in-service are expected to be
retired in the region.
The commercial fleet in Latin America and the Caribbean of 1,720 aircraft is forecast to grow 5.3% annually in the first
five-year period to 2,227 aircraft by 2020 and by 4.1% in the second-five year period to 2,717 aircraft in 2025.
Over the forecast period, 1,462 aircraft are forecast to be delivered while 542 currently in-service aircraft are expected to
be retired in the region. Latin America is forecast to receive over 70 net migrations over the forecast period, mostly from
Western Europe and North America.
Western Europe has the second largest commercial fleet (4,837 in-service aircraft). While Western Europe is a mature
market in most respects, it also has some characteristics of a growth market when considering the prominence of low-cost
carriers in the region. Currently, the Western European fleet comprises 20% of the global commercial fleet, and, in ten
years’ time, Western Europe’s share of the global fleet is expected to decrease to 17% by 2025.
The commercial fleet is forecast to grow 3.0% annually in the first five-year period to 5,609 aircraft by 2020 and by 1.2%
annually in the second five-year period to 5,941 aircraft in 2025.
Western Europe is forecast to receive 16% of the worldwide total deliveries in the next ten years (3,051 aircraft), while 1,599
of the current in-service fleet in Western Europe is expected to retire over the next ten years.
More than 300 net migrations out of the region are forecast over ten years.

Copyright © 2015 CAVOK, a division of Oliver Wyman 26
China is a key economic market and a major driver of global fleet growth. The current in-service fleet of 2,232 aircraft is
forecast to grow 5.8% annually in the first five-year period to 2,958 aircraft by 2020 and by 7.9% annually in the second
five-year period to 4,335 aircraft in 2025. Over the ten year period, the Chinese fleet is forecast to grow 6.9% annually,
nearly doubling in size. China’s share of the global fleet is expected to increase from 9% in 2015 to 13% in 2025.
China will account for 14% of the worldwide total deliveries over the next ten years (2,548 aircraft). An overwhelming
majority, 89%, are for fleet expansion verus fleet replacement.
Only 284 in-service aircraft are forecast to retire over the period. This low level of retirements can be attributed to the young
average age of the Chinese fleet. Approximately 150 net migrations out of the region are forecast over ten years (mostly
older A320 and 737 aircraft).
Asia Pacific is currently the third largest region in terms of fleet size with a 16% share of the baseline fleet (3,835 in-service
aircraft). Asia Pacific’s share of the global fleet is expected to increase to 18% by 2025. Like China, Asia Pacific is one of the
key growth markets in the fleet forecast.
The commercial fleet in Asia Pacific is forecast to grow 6.0% annually over the first five-year period to 5,122 aircraft by 2020
and by 3.7% annually in the second five-year period to 6,154 aircraft in 2025.
Asia Pacific is expected to receive 17% of the deliveries in the next ten years (3,215 aircraft). Over 69% forecast deliveries
are for expansion purposes (vs. fleet replacement). 996 currently in-service aircraft are forecast to retire over the next ten
years.

27 Copyright © 2015 CAVOK, a division of Oliver Wyman
GLOBAL AIR TRANSPORT MRO MARKET FORECAST
The fleet forecast as previously discussed drives demand for MRO work. The global air transport MRO spend in 2015 is
expected to be $67.1B. This will rise to $83.2B by 2020, representing a solid 4.4% CAGR over the 5 year period. The growth
rate will decline modestly to 3.8% annually in the second half of the forecast period (2020-2025). Over the full 10 year
forecast period, the global air transport MRO spend will average 4.1% CAGR, rising to $100.4B by 2025.
Airframe maintenance will continue to lose market share in deference to increased engine MRO spend over the next ten
years, while little is expected to change in the relative mix of component and line MRO spend over the forecast period.
EXHIBIT 21: 2015-2025 Global MRO Forecast by MRO Segment
Source: betterinsight™ and PlaneStats
$14.5 $15.9 $16.7
$27.9
$37.1
$46.8
$12.4
$15.2
$19.2
$12.3
$15.0
$17.8
$67.1
$83.2
$100.4
1.9% 1.0%
5.9%
4.8%4.1%
4.7%4.0%
3.5%
$-
$20
$40
$60
$80
$100
$120
2015 2015-2020CAGR
2020 2020-2025CAGR
2025
Bil
lio
ns
Airframe Engine Component Line

Copyright © 2015 CAVOK, a division of Oliver Wyman 28
1. TOTAL MRO BY CLASS
On the whole, very little change is expected in the total MRO market mix by aircraft class (NB, WB, RJ, or TP) over the period.
Narrowbodies will continue to hold a commanding overall share (upwards of 49-54%) in contrast to the widebodies’ 38-
40%, the regional jets’ declining 7%, and the turboprops’ 4-5%.
Globally, MRO related to narrowbody aircraft dominates the budget. The MRO share mirrors that of the fleet itself—that is,
the narrowbody fleet constitutes roughly 55% of the total fleet, and the narrowbody MRO constitutes approximately 49%
of the global MRO. Widebody MRO, on the other hand, makes up just 20% of the global fleet but represents roughly 40%
of the market over the forecast period, because each aircraft is much more maintenance intensive. As the global regional
jet fleet size declines, regional jet MRO and its share of the total MRO market are expected to also decline. The turboprop
fleet is expected to grow modestly (1.7% CAGR 2015-2025), which translates into a total MRO market size growing at 3.5%
CAGR in the first half of the forecast period, then just 0.4% for the second half as more maintenance-efficient turboprops
assume a larger share of the fleet.
EXHIBIT 22: 2015-2025 Global MRO Forecast by Aircraft Class
Source: betterinsight™ and PlaneStats
$32.7 B $41.7 B$54.1 B
$26.4 B $33.1 B$38.1 B
$4.8 B $4.6 B $4.4 B$3.2 B $3.8 B $3.9 B
5.0%5.3%
4.6% 2.9%-0.9% -0.9%3.5% 0.4%
0%
10%
20%
30%
40%
50%
60%
70%
80%
90%
100%
2015 2015-2020CAGR
2020 2020-2025CAGR
2025
Narrowbody Widebody Regional Jet Turboprop

29 Copyright © 2015 CAVOK, a division of Oliver Wyman
2. TOTAL MRO BY REGION
Regionally, as the fleet distribution changes, so too will MRO follow. For the first time, North America will not remain the
largest single region for total MRO value throughout the forecast period. CAVOK is expecting North America to shrink from
$20.0B in 2015 to $19.2B by 2020, then rebounding a bit to $21.3B by 2025; overall, relatively flat growth for the period
with 0.6% CAGR. Latin America and the Caribbean, which currently represents 5% of the total MRO market, is expected to
more than double over the period (growing from $3.2B to $6.5B) and increasing its market share by one point.
EXHIBIT 23: 2015-2025 Global MRO Forecast by Region
Source: betterinsight™ and PlaneStats
$20.0
$12.4
$14.7
$5.1
$5.5
$3.2
$3.2
$2.1
$0.8
$19.2
$17.3
$18.2
$7.5
$8.0
$4.8
$4.0
$2.3
$1.8
$21.3
$20.5
$19.9
$11.7
$9.8
$6.5
$5.1
$3.0
$2.6
$- $5 $10 $15 $20 $25
North America
Asia Pacific
Western Europe
China
Middle East
Latin America & Caribbean
Eastern Europe
Africa
India
Billions
2015 2020 2025

Copyright © 2015 CAVOK, a division of Oliver Wyman 30
Europe is expected to see solid growth, however, Western Europe will lose a couple points of market share, even as it grows
at 3.0% annually and adds $5.1B to its current $14.7B MRO demand. Eastern Europe, while relatively small at just 5% of
the market, is forecast to grow much faster, at 4.6% annually over the forecast period.
Asia, as has been the case for some years now, remains the growth engine for MRO. Asia Pacific countries should grow at
a healthy 5.2%, rising to the same levels as that of Western Europe and North America. China, which is expected to more
than double in market size, is forecast to grow at 8.6% CAGR. India is forecast to grow 12.1% annually during the forecast
period, but should remain a relatively small share of the total market (1-3%).
Together, the Americas, Europe, and Asia represent nearly 90% of the total MRO market. As CAVOK has pointed out in the
past, however, the Americas and Europe are expected to lose market share to Asia. By 2019, greater Asia (including Asia
Pacific, China, and India) is expected to be the largest of the combined regional areas.
The Middle East is anticipated to nearly double in market size, growing at a 6.0% annual rate and constitute 10% of the
global MRO market by 2025. Africa too is expected to enjoy healthy growth at 3.9% per year, but will only maintain its 3%
market share.

31 Copyright © 2015 CAVOK, a division of Oliver Wyman
3. TOTAL MRO BY OEM
Boeing and Airbus will remain the two dominant players in the air transport aircraft manufacturing market with a combined
three-quarters or more of the worldwide fleet. Boeing aircraft are expected to maintain the largest share of the global fleet
over the forecast period; however, it will lose share as Airbus’ share approaches that of Boeing. Combined, today these two
OEMs’ aircraft drive 88% of the MRO, and by 2025 they are expected to expand this share to 90%.
EXHIBIT 24: 2015-2025 Global MRO Forecast by Aircraft Manufacturer
Source: betterinsight™ and PlaneStats
$25.3 B
$36.8 B $44.6 B
$.9 B
$1.4 B $1.8 B
$33.8 B
$37.7 B $45.5 B
$3.2 B$3.3 B $3.7 B
$2.4 B $2.5 B $2.3 B
$1.4 B $1.5 B $2.4 B
7.8%
3.9%9.1%
4.9%
2.2% 3.8%
0.5% 2.3%0.8% -1.5%0.1% 10.9%
0%
10%
20%
30%
40%
50%
60%
70%
80%
90%
100%
2015 2015-2020 CAGR 2020 2020-2025 CAGR 2025
Airbus ATR Boeing Bombardier Embraer Other

Copyright © 2015 CAVOK, a division of Oliver Wyman 32
Bombardier and Embraer aircraft are both expected to lose MRO market share over the forecast period. Some of this loss
will be to new entrants to the regional jet market space, while the rest of the loss will come from operators favoring
narrowbodies over regional jets. This is true despite the fact that Bombardier’s narrowbody CSeries will be introduced
during the forecast period. The total MRO value driven by the CSeries is limited compared to the MRO value already
delivered Bombardier regional jets will shed as they are phased out of service (especially its CRJ fleet).
Within the regional jet space, Embraer aircraft are anticipated to maintain the top ranking for global MRO, even as its fleets’
MRO value declines by -0.3% annually through 2025. Bombardier’s regional jet MRO share will fall more than 40% as its
existing aircraft’s market potential declines over the forecast period. Despite the positive press for new regional jets, none
of the new entrants in this MRO market space (SuperJet, Mitsubishi, etc.) will come close to rivaling either Bombardier or
Embraer over the forecast period.
As for turboprop MRO, ATR aircraft are almost single handedly driving the growth for this aircraft class. ATR aircraft are
expected to take over the top ranking from Bombardier within the next five years, and the fleets’ MRO value will grow by
6.9% annually during the forecast period. Bombardier’s turboprop MRO value will grow just 0.7% annually throughout the
forecast period, while Embraer’s turboprop MRO value will shrink 6.3% annually over the next 10 years. Turboprop MRO
from all other OEMs is expected to decline 0.6% annually from 2015 to 2020 and then deteriorate rapidly at a rate of -4.6%
per year between 2020 and 2025.

33 Copyright © 2015 CAVOK, a division of Oliver Wyman
4. TOTAL MRO BY AIRCRAFT FAMILY/MODEL
Airbus A320 family (including the NEO in later years) and the Boeing 737 family (excluding Classics and including the MAX
version in later years) will dominate MRO demand throughout the forecast period. The A320 family has a larger share, but
Boeing’s 737 family should begin to close that gap by 2025. Both will approximately double in market size by 2025.
EXHIBIT 25: 2015-2025 Top Aircraft Fleets by Total MRO Spend
Aircraft Family/Model 2015 2020 2025
A320 $16.2B 1 $22.8B 1 $27.9B 1
737NG/MAX $9.5B 2 $15.0B 2 $22.7B 2
777 $9.0B 3 $10.7B 3 $10.8B 3
A330 $5.1B 4 $7.2B 4 $7.2B 4
787 $0.1B $2.5B 6 $5.9B 5
A350 $0.0B $1.2B $4.5B 6
A380 $0.8B $2.5B 7 $3.0B 7
747 $4.2B 5 $3.5B 5 $2.8B 8
E-Jet $1.4B $1.9B 10 $2.1B 9
ATR $0.9B $1.4B $1.8B 10
A340 $2.1B 10 $2.4B 8 $1.5B
767 $3.0B 7 $1.8B $1.4B
CRJ $2.1B 9 $1.9B 9 $1.3B
757 $3.1B 6 $1.6B $0.6B
737CLASSICS $2.4B 8 $1.0B $0.3B
Other $7.1B $5.6B $6.6B
Note: Top ten rankings for each year are displayed to the right of the MRO spend dollar value.
Source: betterinsight™ and PlaneStats
To put this growth in perspective, the 2015 MRO spend of the 737 fleet is currently comparable to that of the third largest
fleet (777), yet by 2025 the 737 MRO spend will be nearly double the 777 despite relative rankings remaining unchanged.

Copyright © 2015 CAVOK, a division of Oliver Wyman 34
In fact, by 2025, the A320 family and 737 series combined are forecast to constitute a greater share of the combined MRO
market all other fleet types.
The A330 and 747 are the two other fleets that will remain in the 2025 top ten. New entrants to the 2025 top ten include
the 787, A350, A380, Embraer’s E-Jets and ATR.
While the global fleet’s MRO demand will grow 4.1% over the next ten years, the change in the mix by type variants shows
some interesting developments. The entrance of the NEO and the MAX will push their respective families’ annual growth
rates to 5.6% and 9.1%, respectively. Six of the top ten fleets in 2015 are forecast to decline in total MRO value by 2025.
These declining fleets will give way to other aircraft types.
The fastest growing families/models in terms of MRO demand over the forecast period are the MRJ-70/90, Irkut MC-21,
A350, CSeries, COMAC C919, 787, and ARJ21. As the fleets of MD-90s, AvroRJ, BAE 146, DC-8/9/10, Fokker50/70/100,
and classic series of the Boeing 737 and 747 models retire, demand for related MRO will dissolve. These fleets currently
represent just a small share (less than 10%) of the global market though, so their retirement will have little impact on the
overall market. More significantly, however, the 757 and 767, with their combined 9% of the global MRO demand in 2015,
are expected to fall to roughly one third of that by 2025 while shedding 7% of their MRO market share.
The 787, small in terms of MRO demand today, is expected to grow 47% year over year through 2025. This will drive it from
26th to 5th in terms of MRO rank as its MRO consumption grows to nearly $6B. Its Airbus counterpart, the A350 which is
just entering service, is expected to grow to over $4.4B by 2025.
ATR is also expected to double its MRO market value over the ten-year period; however, in total by 2025, it should fall just
short of the $2B threshold mark.

35 Copyright © 2015 CAVOK, a division of Oliver Wyman
5. IMPLICATIONS FOR MROS
Globally, the total MRO market is expected to become increasingly top heavy. In 2015, the top ten airframes comprise 85%
of the total MRO market. By 2025 the top ten airframes will represent 88%, picking up three percentage points of market
share.
Given the transition to newer generational aircraft mentioned above, it is clear that MROs must be prepared to handle the
type of activities associated with this changing mix, or focus their strategy to capture end-of-life markets. From an airframe
MRO perspective, providers must be able to address the demands of new composite and metal matrix airframe materials
that are present in the newest generation of aircraft such as the 787 and A350. At the other end of the spectrum, the
757/767 fleet will still account for over 2% of the global MRO market in 2025, meaning those with proven 757/767
capabilities and competencies should be well positioned to capitalize on the extended life of these aircraft.
New aircraft can enjoy a significant honeymoon period, particularly during the four year warranty period after delivery.
Aircraft of the 2010 and late 2000’s vintage will experience increased MRO demands in the latter half of the forecast period.
The 2000’s and 2010’s vintage fleets will grow from 6% in 2015 to more than a third of the market by 2025. This makes the
combined 2000’s and 2010’s vintage second only to the 1990’s vintage dominated by the A320 Family and 737NG Series.
As the fleets continue to age beyond the forecast period, MROs with capabilities to service this growing segment will be
well positioned for success.
The obvious targets on the narrowbody side are 737NG/MAX and A320CEO/NEO. These two families are expected to drive
a combined 38% of the MRO market in 2015. More importantly, these same two families are forecast to drive slightly more
than 50% of the market by 2025.
While all widebodies combined are not expected to come close to the MRO these two top narrowbodies demand, over half
of the top ten families in 2025 in terms of MRO value are widebody aircraft. Moreover, CAVOK estimates that operators
currently are sending just over 20% of their widebody heavy maintenance to regions other than their own, namely Asia
Pacific and China.
MROs in North America and Western Europe can open a broad market for themselves by targeting repatriated widebody
maintenance work with the introduction of new capacity and the development of the necessary skills. Recognizing that the
regional labor rates are continuing to move towards parity, MROs that build widebody capabilities could be in a position
to capture this market from operators in their own region that have been sending that work abroad.
Capturing market share from Asia Pacific and China will not be a simple task, however. Even if labor rate parity is reached,
or nearly reached, Asian MROs have the demonstrated capacity and skills in place today. While MROs in the other regions
of the world do have widebody capability, investment will be needed for training, tooling and equipment. There will be a
high cost of capital for such expansion, but it will be a necessary investment to compete with the Asian MROs.

Copyright © 2015 CAVOK, a division of Oliver Wyman 36
While repatriating widebody work is a good strategy for growing the otherwise stagnate markets of North America and
Western Europe, the global focus needs to be on meeting the demand by the growth being generated in Asia/Pacific,
China, and India.
MROs, such as Lufthansa Technik, are already beginning to expand their presence in Asia by expanding existing facilities
to increase capacity and opening new facilities be closer to their customers, but adding and improving facilities alone will
not adequately address the needs created by the Asian regions. MROs will need to better utilize advanced process analysis
efforts, such as Lean, to reduce turnaround times and expedite material delivery to increase competitiveness and
productivity while simultaneously reducing costs. And, in addition to increasing efficiency of operations, MROs will also
need to begin looking at forming partnerships with technical schools near their facilities to develop a skilled workforce that
is capable of keeping up with MRO growth in Asia.

37 Copyright © 2015 CAVOK, a division of Oliver Wyman
AIRFRAME MAINTENANCE MARKET FORECAST AND STRUCTURE
Air transport’s labor intensive airframe heavy maintenance and modifications MRO market is expected to be $14.5B in
2015, representing 22% of the total MRO spend for the year.
The total airframe market is forecast to increase at a rate of 1.9% CAGR through 2020. The growth will be notably slower
(1.0% CAGR) in the following five years, however, as the elevated retirement rate will continue unabated while the spend
from a high number of early 2000 vintage aircraft heavy checks dissipates.
In 2015, and through the full forecast period, the global airframe MRO market will be dominated by narrowbody spend.
Widebody and turboprop airframe MRO market share will remain effectively unchanged at 36% and 7%, respectively.
Airframe MRO spend for regional jets is expected to shrink by 10% and lose market share over the next ten years.
EXHIBIT 26: 2015 and 2025 Airframe MRO Market Share by Aircraft Class
Source: betterinsight™ and PlaneStats
The impact of new regional jet programs on the airframe MRO market is beyond the timeframe of this ten-year forecast;
once these deliveries begin to age, however, related maintenance events for these newer generational aircraft are
anticipated in the future. Thus, for the time being, the regional jet airframe market is expected to decline.

Copyright © 2015 CAVOK, a division of Oliver Wyman 38
Regionally, North America will be the largest market in 2015 and in 2025; however, it will lose 6 points of market share by
2025, slipping from the number one spot during the forecast period and replaced by Western Europe. The fastest growing
regions are all in developing areas, led by India, China, Latin America & Caribbean, and Asia Pacific.
EXHIBIT 27: 2015-2025 Airframe MRO Market by Region
Source: betterinsight™ and PlaneStats
The influence of improved technology and increased check intervals in new generation aircraft, particularly the heavy use
of composites and the maturing of software laden smart electronics, will influence the heavy maintenance and
modifications spend in the latter half of the forecast period. The 787 technology, for example, is anticipated to save some
30-35% over a similar sized, older technology, aircraft.
$4.3
$3.8
$2.3
$1.0
$1.0
$0.6
$0.8
$0.5
$0.2
$3.7
$4.0
$2.9
$1.4
$1.4
$0.8
$0.9
$0.5
$0.2
$3.9
$3.7
$3.1
$2.0
$1.1
$1.0
$1.0
$0.6
$0.4
$- $1 $2 $3 $4 $5
North America
Western Europe
Asia Pacific
China
Middle East
Latin America & Caribbean
Eastern Europe
Africa
India
Billions
2015 2020 2025

39 Copyright © 2015 CAVOK, a division of Oliver Wyman
1. MARKET STRUCTURE
Airframe maintenance involves work carried out on a regular, scheduled basis to inspect, maintain, repair, and conduct
preventive maintenance of the airframe’s structure and cabin interior. As a consequence, the aircraft is removed from
commercial service for a generally predetermined period of time and at specified intervals. Individual operators are
responsible for conducting this maintenance (either by themselves or through a qualified provider) in compliance with the
applicable aviation safety regulations (e.g., the Federal Aviation Administration (FAA), the European Aviation Safety
Administration (EASA), etc.). As such, these individual operators develop schedules for airframe maintenance that satisfy
safety and operational requirements.
Such scheduled work scopes are typically based on calendar time, a fixed number of flight hours, or a fixed number of flight
cycles. While some operators and aircraft types have highly-customized maintenance programs such as “phase checks”
and “overnight C checks,” the vast majority fit into a traditional model of a light C check and a heavy maintenance visit
(HMV). Each aircraft model is different, but for illustrative purposes, an average light C check occurs typically every 18-24
months while the HMV (often also called a “D check,” “4C Check,” or “Structural C Check”) usually occurs every 60-84
months. However, the C check interval can range from 12 to 36 months. HMV checks can range from 60 to 144 months.
Newer generation aircraft often have longer intervals; turboprops and older aircraft have the shortest intervals.
EXHIBIT 28: Airframe Scheduled Work Scopes
Activity Description Frequency Manhours Required
C Check Detailed inspection 12-36 Months 2,000-12,000 FH 1,000-15,000 FC
1,000-15,000 Mhrs 3,800 Weighted Average
HMV D Check 4C Check
Major reconditioning 48-144 months 8,000-36,000 FH 6,000-24,000 FC
2,000-70,000 Mhrs 11,600 Weighted Average
Note: All intervals are highly dependent on the flight profile of the actual aircraft.
Source: betterinsight™ and PlaneStats
Airframe maintenance providers can be classified into five categories.
Airline: Commercial air transport operators that perform maintenance utilizing in-house airframe maintenance
capabilities.
Airline Third Party: Maintenance subsidiaries of airlines, often operating with varying degrees of autonomy and
performing maintenance for other operators and possibly their own parent. These organizations leverage
maintenance capabilities at scale to offer competitive pricing to the marketplace.

Copyright © 2015 CAVOK, a division of Oliver Wyman 40
Independent: Dedicated maintenance providers with no relation to either OEMs or airlines. From large to small,
these maintenance providers often have lowest labor costs.
Joint Venture: Airframe maintenance providers that are formed by (typically) joining the resources of OEMs and
in-country capabilities to build indigenous capacity (e.g., Ameco Taikoo, GAMECO, etc.).
OEM: Airframe manufacturers, such as Airbus, Embraer, Bombardier, Sukhoi, ATR, etc., offering maintenance
capabilities for their respective aircraft types utilizing company owned facilities.
Based on known MRO contract information it is possible to estimate the market share that each market category enjoys.
Interestingly, for all the media and political discussion related to contracting work out, globally, the air transport market
still keeps nearly half of its airframe maintenance in-house (49% when combining work performed by the airline on its own
aircraft and the work performed by airline affiliated third party providers). Those airline providers that choose to pursue
the maintenance work of other airlines’ airframes capture an additional 10%. Independent maintenance providers carryout
nearly a third of the demand, while joint ventures (JVs) represent roughly 8% of the market. Finally, OEMs, recognizing the
value that the MRO aftermarket holds in the lifecycle of their products, have moved aggressively to capture a portion of
that work for themselves. Currently, OEMs hold a negligible share of the airframe MRO market; however, as new
generation aircraft begin to demand maintenance, the efforts of OEMs to sell those aircraft with maintenance packages
are expected to add to their share.
EXHIBIT 29: 2015 Airframe MRO Market Share by Maintenance Provider Classification
Source: betterinsight™ and PlaneStats
Airline28%
Airline Third Party - In House
22%
Airline Third Party -Contracted
10%
Independent31%
Joint Venture8%
OEM1%

41 Copyright © 2015 CAVOK, a division of Oliver Wyman
2. COST STRUCTURE
Airframe spend can be divided into labor and material elements.
Labor: Labor is the larger element of airframe work and accounts for 55% of the segment spend. This includes
labor for licensed technicians (mechanics or engineers) as well as the cost of benefits and overhead. When
differentiating the labor component between airframe and modifications work, labor represents 69% and 38%,
respectively.
Material: Material is the smaller element of airframe MRO, accounting for 45% of the segment spend. This
includes all required materials, hardware and consumables. When differentiating between airframe and
modifications activity, material represents 31% and 62%, respectively. Clearly, the nature of modifications work
drives a higher emphasis on materials.
Little change in this mix is expected over the forecast period.
EXHIBIT 30: 2015 Airframe MRO Market Labor and Material Mix
Source: betterinsight™ and PlaneStats
$5.4
$2.5
$7.9
$2.5
$4.1
$6.6
$14.5
$-
$2
$4
$6
$8
$10
$12
$14
$16
HMV MODS Airframe
Bil
lio
ns
Labor Materials

Copyright © 2015 CAVOK, a division of Oliver Wyman 42
3. SUPPLY CHAIN
The airframe maintenance material supply chain consists of four main sources: OEMs, PMA providers, distributors, and
surplus (used serviceable material) providers.
OEMs: Direct purchases from original equipment manufacturers represent more than 60% of the airframe
maintenance material parts demand.
PMA providers: PMA providers, despite significant barriers, have made some inroads into the airframe
maintenance market, providing some 8% of the material. Looking to the future, while PMA currently represents
the smallest share, several large PMA providers have implemented strategies which are expected to improve
PMA’s market share because of their attractiveness to airline customers focused on cost reductions.
Distributors: As intermediaries between the original equipment manufacturers and maintenance providers,
distributors provide about one-fifth of the material parts demand.
Surplus providers: Surplus providers, which purchase new and used material from other surplus providers, MROs,
operators, and/or directly from parted-out aircraft, provide 10% of the airframe maintenance parts demand.
EXHIBIT 31: 2015 Airframe Materials Market Share by Source
Source: betterinsight™ and PlaneStats

43 Copyright © 2015 CAVOK, a division of Oliver Wyman
ENGINE MAINTENANCE MARKET FORECAST AND STRUCTURE
The engine MRO market is forecast to represent $27.8B or 41% of total MRO spend in 2015.
It is forecast to grow at 5.9% over the next five years, then at a marginally slower rate of 4.8% per year over the following
five-year period, for a total ten-year growth rate of 5.3% per year. The full forecast period growth rate makes it the fastest
growing MRO segment because of the increasing costs of engine MRO with newer generation aircraft compared to earlier
generation aircraft.
In 2015, unlike other market segments, the global engine MRO market will be led by engines installed on widebody
aircraft. Widebody engine MRO is expected to constitute nearly half the segment spend. Importantly, this dominance will
only further increase as the widebody engine MRO market grows its share over the next five years. Narrowbody engine
MRO, at nearly 40% of the market in 2015, is also expected to grow its share and surpass widebody engine MRO by 2025,
particularly as the next-generation narrowbodies enter the market. The regional jet engine MRO spend will decline more
than $200 million by 2025, as it sheds 4 points of market share. The turboprop engine MRO spend is expected to grow, but
it will lose pace to the narrowbody and widebody fleets’ growth.
EXHIBIT 32: 2015 and 2025 Engine MRO Market Share by Aircraft Class
Source: betterinsight™ and PlaneStats

Copyright © 2015 CAVOK, a division of Oliver Wyman 44
Engine MRO in North America is expected to be the largest market of the segment in 2015, but Asia Pacific is expected to
rank first by 2020. This spells a loss of 8 points in market share for North America over the five year period. Asia Pacific’s
engine MRO demand is expected to grow substantially faster in the first half of the forecast than the second half. In fact,
this slower second half growth rate is expected across all regions, which is largely attributed to the increased presence of
aircraft powered by engines with longer on-wing times.
EXHIBIT 33: 2015-2025 Engine MRO Market by Region
Source: betterinsight™ and PlaneStats
$6.0
$8.2
$5.0
$2.9
$2.1
$1.2
$1.2
$0.9
$0.3
$8.9
$7.9
$7.3
$4.5
$3.1
$2.1
$1.4
$0.9
$0.9
$10.5
$9.3
$8.6
$5.7
$5.5
$3.0
$2.0
$1.2
$1.1
$- $2 $4 $6 $8 $10 $12
Asia Pacific
North America
Western Europe
Middle East
China
Latin America & Caribbean
Eastern Europe
Africa
India
Billions
2015 2020 2025

45 Copyright © 2015 CAVOK, a division of Oliver Wyman
In 2015 the largest engine fleets (in terms of engine MRO demand) are the V2500, GE-90, CFM56-7B, CF6-80C2, and
CFM56-5B, each driving no less than $1.5B in MRO demand, respectively. Collectively, these engines represent
approximately 51% of the total segment market, while the top ten engine variants constitute more than 72% of the market.
By the end of the ten year forecast period, the CFM56-7B, which has the third largest fleet in terms of engine MRO demand
today, is expected to become the largest fleet in terms of MRO spend and require more than $7.5B in MRO services. To
reach this level, its market share will have to grow by 7 points to 16%. This engine, powering the Boeing 737NG, will have
a fleet size exceeding 12,000 installed units.
EXHIBIT 34: 2015-2025 Top Engine Fleets by Engine MRO Spend
Engine Model 2015 2020 2025
CFM56-7B $2.5B 3 $4.5B 3 $7.5B 1
V2500 $4.8B 1 $7.3B 1 $6.1B 2
GE90 $3.6B 2 $4.5B 2 $4.7B 3
Trent XWB $0.0B $0.9B $3.2B 4
GEnx $0.0B $1.7B $3.0B 5
CFM56-5B $1.5B 5 $2.5B 4 $2.9B
Trent 700 $1.4B $2.3B 5 $1.9B
CF6-80C2 $2.0B 4 $1.3B $1.0B
Other $12.1B $12.0B $16.5B
Note: Top five rankings for each year are displayed to the right of the MRO spend dollar value.
Source: betterinsight™ and PlaneStats
Over this period, the CF6-80C2 will fall to fourteenth in terms of MRO demand, and the Trent XWB and GEnx engines will
assume the fourth and fifth place rankings, respectively. The Trent XWB, which is dedicated to the Airbus A350, is especially
noteworthy because its growth will come entirely within the forecast period.
The Leap 1A and 1B engines which power the A320NEO family and 737MAX series are not expected to drive much engine
MRO demand over the forecast period. In 2025 these two engine models combined will have less than 7% of the market.
Pratt & Whitney’s PW1000G and its derivatives, which will have much broader installed base than the Leap engines, is
expected to drive nearly $2.6B in spend, representing 5.5% of the market in 2025.
Looking just at the engines powering the regional jet fleet, in 2015 the five largest fleets (in terms of MRO spend) are the
CF34-8, AE3007, CF34-3, and CF34-10. The CF34-8 is the only regional jet engine expected to drive more than $1B in MRO
demand; representing nearly half of all engine MRO spend on regional jets. These top four engines represent 95% of the
total engine MRO market. By 2025, the top four engines in terms of MRO demand (the CF34-8, CF34-10, PW1000G, CF34-

Copyright © 2015 CAVOK, a division of Oliver Wyman 46
3) are expected to drive 96% of the market. Of the engines in the top four in 2015, the AE3007 and the CF34-3 should be
all but retired by 2025 and the CF34-8 MRO spend will be reduced by 33% of its 2015 demand.
Among turboprop engines, the PW100, which has the largest installed based on turboprop aircraft by far, not surprisingly
is expected to also have the largest MRO spend in 2015; and this engine’s market share will further increase slightly by
2025.
Engine costs reflect the continued increases in annual material pricing, modestly offset by PMA influences on older engine
models, and higher on-wing life as engines mature. Concentration of pricing power in the engine MRO value chain with
the engine OEMs remains a commanding driver in the engine MRO market.
The price of fuel and additional environment-related issues brought on in part as the European Union Emissions Trading
Scheme (EU ETS), which could come into force for all airlines flying to or from the EU sometime after the end of 2016, are
expected to drive a continued push for better engine designs and new drop-in fuels as well as improved aircraft and air
traffic control systems designs.
Although the effects of these changes on the engine MRO market remain uncertain, it will surely require continued
improvement in engine performance and care. This alone will impact the engine MRO market.

47 Copyright © 2015 CAVOK, a division of Oliver Wyman
1. MARKET STRUCTURE
Engine maintenance involves work carried out on a scheduled or on-condition basis to inspect, maintain, repair, and
conduct preventive maintenance for the purpose of returning the engine to service or restoring performance margins. For
this MRO segment, the activity being accounted for is the off-wing work that requires significant effort to disassemble,
repair, restore, and return to service each engine or module that powers the aircraft. Engine maintenance is often divided
into shop visit overhaul and repair work, and the replacement of life-limited parts (LLP) which represent a significant
investment. While individual air transport airline operators exercise a degree of autonomy over when the engine overhaul
occurs, LLP replacement events must, by very definition, adhere to more rigid intervals. This, in turn, will dramatically
influence the cost of shop visits when LLP’s are being replaced.
EXHIBIT 35: Engine Scheduled Work Scopes
Activity Description Frequency SV Cost LLP Cost Total Cost
Overhaul Offwing disassembly, inspection, repair and/or replacement of parts, reassembly, and testing
3,000-24,000 Flight Hours 1,500-15,000 Flight Cycles
$200K-$6.5M $2.3M Weighted Average
$0-$2.1M $900K Weighted Average
$200K-$8.6M $3.2M Weighted Average
Note: All intervals are highly dependent on the flight profile and specific LLP limits of the actual engine.
Source: betterinsight™ and PlaneStats
Engine maintenance providers can be classified into five categories.
Airline: Commercial air transport operators that perform maintenance utilizing in-house engine maintenance
capabilities. Generally, this is limited to operators that have a large enough fleet and experience to merit
conducting engine maintenance for themselves.
Airline Third Party: Maintenance subsidiaries of airlines, often operating with varying degrees of autonomy and
performing maintenance for other operators and possibly their own parent. These organizations leverage
maintenance capabilities at scale to offer competitive pricing to the marketplace.
Independent: Dedicated maintenance providers with no relation to either airlines or OEMs (i.e. not part of an
authorized service center network). From large to small, these maintenance providers often have lowest labor
costs.
Joint Venture: Airframe maintenance providers that are formed (typically) by joining the resources of OEMs and
in-country capabilities to build indigenous capacity (e.g., TAESL, HAESL, Ameco, Turkish Engine Center, etc.).

Copyright © 2015 CAVOK, a division of Oliver Wyman 48
OEM: Engine manufacturers, such as GE, CFM, Rolls Royce, Pratt & Whitney, Snecma, IAE, etc., offering
maintenance capabilities for their respective engine types utilizing company owned facilities.
Based on known MRO contract information, it is possible to estimate the market share that each category enjoys. In the air
transport segment, OEMs are by far the dominant player in the engine MRO space, controlling more than half of the market
capacity. Airlines perform just under 20% of the engine MRO spend themselves (when combining airline work and the
insourced work of airline third party providers). Airline third party providers servicing other airlines’ engines tack on
another 10%.
Independent providers capture just 9% of the market spend, though it will be interesting to see how their collective effort
to obtain more and better repair information from OEMs improves their market position. JVs, which benefit from their OEM
connections, control 11% of the market. For the foreseeable future, it seems that OEMs are sure to maintain a strong hold
on this market.
EXHIBIT 36: 2015 Engine Market Share by Maintenance Provider Classification
Source: betterinsight™ and PlaneStats
Airline8%
Airline Third Party -In House
9%
Airline Third Party -Contracted
10%
Independent9%
Joint Venture11%
OEM53%

49 Copyright © 2015 CAVOK, a division of Oliver Wyman
2. COST STRUCTURE
Engine MRO spend can be divided into three elements: labor, parts, and parts repair.
Labor: Labor (excluding labor expending while repairing individual piece parts) is the smallest element of engine
work. Labor accounts for just 9% of the engine spend. This includes direct labor for all engine maintenance labor
services including disassembly, inspection, reassembly, and testing. It also includes the cost of benefits and
overhead of the labor resources utilized.
Parts: Parts (or materials) represent, by far, the largest element of engine overhaul work. Materials can be new or
surplus parts (from the OEM, distributor or a PMA provider) or used serviceable parts (after refurbishment).
Parts Repair: Parts repair refers to the costs associated with refurbishing used unserviceable parts to a serviceable
and airworthy condition.
Little change in this mix is expected over the forecast period. However, as many particular engines age, their material costs
often decline as alternative parts are developed, more used serviceable material becomes available from disassembled
engines, and improved repair processes are implemented.
EXHIBIT 37: 2015 Engine Market Labor and Material Mix
Source: betterinsight™ and PlaneStats
Labor$0.1 B
Parts$20.6 B
Parts Repair$0.2 B

Copyright © 2015 CAVOK, a division of Oliver Wyman 50
3. SUPPLY CHAIN
The engine overhaul maintenance material supply chain consists of five main sources: OEMs, PMA providers, distributors,
surplus providers, and, because of the significant material involved, parts repair providers.
OEMs: Original equipment manufacturers provide nearly two-thirds of the material needed for engine overhaul
in large part because of their dominant engine MRO market position as well as fierce intellectual property rights
protection of their highly complex designs and manufacturing processes.
PMA providers: PMA providers have encountered especially difficult challenges penetrating the engine parts
market for newer generation engines, and this difficulty is expected to endure for the foreseeable future.
Distributors: As intermediaries between the OEMs and maintenance providers, distributors represent about 9%
of the material parts demand. Ultimately this 9% market share, less typical 15% markups, flows back to the OEMs
and their manufacturing partners.
Surplus providers: Surplus providers, which purchase new and used material from other surplus providers,
MROs, operators, and/or directly from parted-out aircraft, satisfy 9% of the engine maintenance parts demand.
Parts repair providers: Because engine material is such a significant share of the cost of engine repair, parts repair
providers are included separately and comprise just over 15% of the material cost.
EXHIBIT 38: 2015 Engine Materials Market Share by Source
Source: betterinsight™ and PlaneStats

51 Copyright © 2015 CAVOK, a division of Oliver Wyman
COMPONENT MAINTENANCE FORECAST AND STRUCTURE
Component MRO, consisting of work on such equipment as auxiliary power units (APUs), avionics, wheel/brakes, landing
gear, flight controls, pneumatics, hydraulics, equipment/furnishings, cabin systems, etc., represents a $12.5B segment of
the MRO activity or 19% of the total.
Component MRO, not unlike engine MRO, represents an area where the costs continue to rise because of the relative
concentration of power in the value chain among a smaller set of major competitors.
The market is expected to grow at 4.1% over the first five-year period and 4.7% over the second five-year period, for a total
growth of 4.4% over the full ten year period.
EXHIBIT 39: 2015 Component MRO Market Share by Aircraft Class
Source: betterinsight™ and PlaneStats
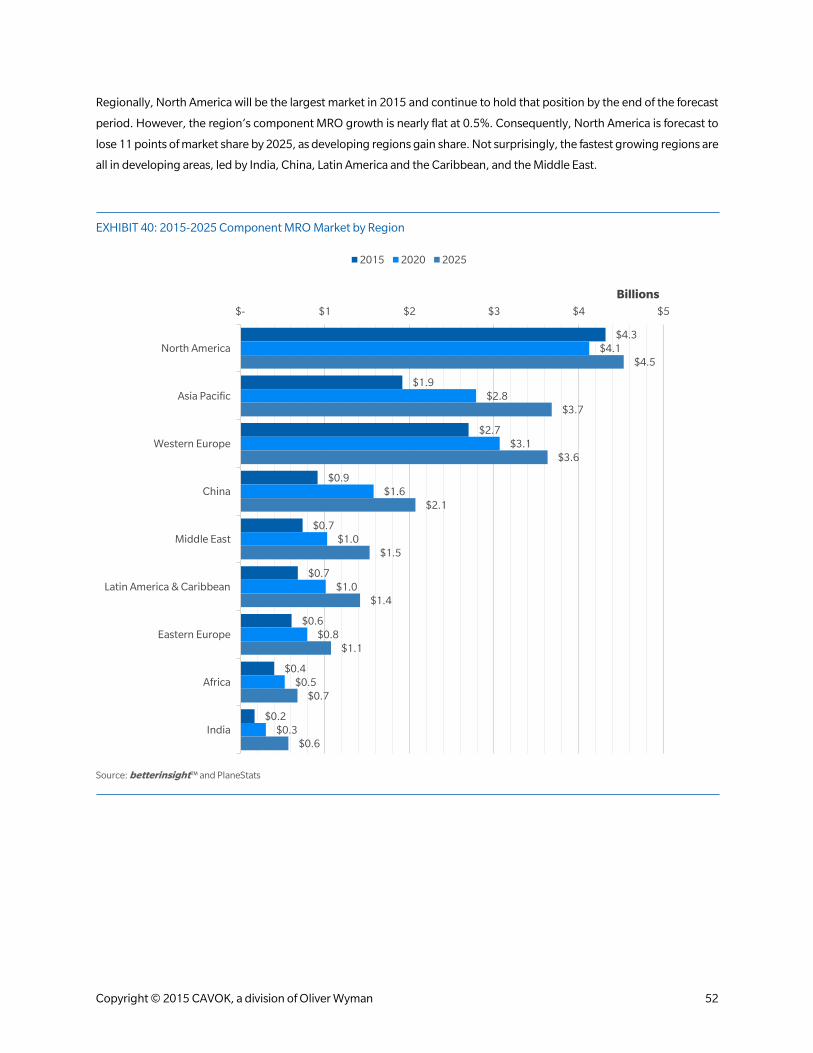
Copyright © 2015 CAVOK, a division of Oliver Wyman 52
Regionally, North America will be the largest market in 2015 and continue to hold that position by the end of the forecast
period. However, the region’s component MRO growth is nearly flat at 0.5%. Consequently, North America is forecast to
lose 11 points of market share by 2025, as developing regions gain share. Not surprisingly, the fastest growing regions are
all in developing areas, led by India, China, Latin America and the Caribbean, and the Middle East.
EXHIBIT 40: 2015-2025 Component MRO Market by Region
Source: betterinsight™ and PlaneStats
$4.3
$1.9
$2.7
$0.9
$0.7
$0.7
$0.6
$0.4
$0.2
$4.1
$2.8
$3.1
$1.6
$1.0
$1.0
$0.8
$0.5
$0.3
$4.5
$3.7
$3.6
$2.1
$1.5
$1.4
$1.1
$0.7
$0.6
$- $1 $2 $3 $4 $5
North America
Asia Pacific
Western Europe
China
Middle East
Latin America & Caribbean
Eastern Europe
Africa
India
Billions
2015 2020 2025

53 Copyright © 2015 CAVOK, a division of Oliver Wyman
1. MARKET STRUCTURE
Component MRO involves work carried out in the shop environment when components have been removed from an
aircraft due to condition or schedule to inspect, maintain, repair, and conduct preventive maintenance in order to return
them to serviceable and airworthy condition. Individual airlines develop policies and procedures for handling component
maintenance to meet safety and operational requirements, but the majority of this maintenance is on-condition, meaning
it occurs when the part fails in service.
EXHIBIT 41: Component Maintenance Segments
Component Segment Description
Avionics Maintenance related to auto flight, communications, indicating/recording systems, navigation, and integrated modular avionics
Auxillary Power Unit Maintenance of the auxiliary power unit
Cabin Systems Maintenance of cabin core systems, inflight entertainment system (such as audio, video, and WIFI equipment), external communication system, cabin mass memory system, cabin monitoring system, miscellaneous cabin system
Equipment Furnishings Maintenance of the aircraft equipment and/or furnishings, such as buffets/galleys, lavatories, cargo compartments, emergency equipment, accessory compartments, and insulation
Electrical Maintenance of the generator drive, AC generation, DC generation, external power, etc.
Engine Accessories Maintenance of the ignition, engine air, engine controls, engine indicating systems, engine exhaust systems (excluding thrust reversers), engine oil systems, and engine starting systems
Flight Controls Maintenance of the flight controls, such as aileron, rudder, elevator, stabilizer, flaps, spoiler, etc.
Fuel Systems Maintenance of the fuel, inflight fuel dispensing, and engine fuel and control systems
Hydraulics Maintenance of the hydraulic power systems
Pneumatics Maintenance of the pneumatic systems, such as packs, air cycle machines, distribution and indicating
Landing Gear Maintenance of the landing gear systems, including main gear and doors, nose gear and doors, extension and retraction, etc.
Wheels and Brakes Maintenance of the wheels and brakes
Thrust Revereser Maintenance of the nacelles/pylons and thrust reversers
Other Maintenance of the air conditioning/environmental control systems, fire protection systems, ice and rain protection systems, lights (flight compartment, passenger compartment, cargo compartment, exterior, and emergency), oxygen systems, vacuum systems, multisystem, diagnostic and maintenance systems, information systems, and inert gas systems.
Source: betterinsight™ and PlaneStats

Copyright © 2015 CAVOK, a division of Oliver Wyman 54
As a result of increasing well understood individual component reliability predictions, coupled with airlines expanding
hesitancy to invest in spare parts, component work is frequently contracted to MRO service providers, inclusive of spare
parts availability guarantees, on a cost per flight hour or cost per flight cycle basis.
Component MRO providers can be classified into five categories.
Airline: Commercial air transport operators that perform maintenance utilizing in-house component
maintenance capabilities. Generally, this is limited to operators that have a large enough fleet and experience to
merit conducting component maintenance for themselves.
Airline Third Party: Maintenance subsidiaries of airlines, often operating with varying degrees of autonomy and
performing maintenance for other operators and possibly their own parent. These organizations are developed
to leverage maintenance capabilities at scale to offer competitive pricing to the marketplace.
Independent: Dedicated maintenance providers with no relation to either airlines or OEMs (i.e. not part of an
authorized service center network). From large to small, these maintenance providers often have lowest labor
costs.
Joint Venture: Component maintenance providers that are formed by (typically) joining the resources of OEMs
and in-country capabilities to build indigenous capacity (e.g., Ameco, CAMSSL, GAMECO, OEM Services,
Spairliners, TAECO, etc.).
OEM: Tier 1 component manufacturers, such as BAE, Eaton, UTC-Aerospace Systems Goodrich, UTC-
Aerospace Systems Hamilton Sundstrand, Honeywell, Meggitt, Messier, Panasonic, Rockwell Collins, Thales,
etc., offering maintenance capabilities for their respective line replaceable components.
Based on known MRO contract information, it is possible to estimate the market share that each category enjoys. In the
air transport segment, OEMs are by far the dominant player in the component MRO space for the most complex
component types. Airlines (along with their affiliated third party providers) and independent MROs enjoy notable market
share as well.
EXHIBIT 42: 2015 Component MRO Market Share by Maintenance Provider Classification
Source: betterinsight™ and PlaneStats
Airline8% Airline Third Party - In House
5%
Airline Third Party - Contracted23%
Independent38%
Joint Venture3%
OEM23%

55 Copyright © 2015 CAVOK, a division of Oliver Wyman
2. COST STRUCTURE
The component MRO spend can be divided into two elements: labor and material. The cost structure split between labor
and material depends on the component type.
Labor: Labor is the smaller element of component work for the most part and represents the activity associated
with disassembly, inspection, reassembly and test of the component.
Material: With a few exceptions, material tends to represent the larger share of the component MRO spend and
represents the piece-part material required to restore the line replaceable component to a serviceable and
airworthy condition once reassembled. This is especially true of wheels and brakes, APU, and avionics.
EXHIBIT 43: 2015-2025 Component MRO Market Labor and Material Mix
Source: betterinsight™ and PlaneStats
25%
25%
35%
85%
80%
20%
95%
45%
35%
35%
65%
20%
60%
50%
75%
75%
65%
15%
20%
80%
5%
55%
65%
65%
35%
80%
40%
50%
0% 10% 20% 30% 40% 50% 60% 70% 80% 90% 100%
Avionics
APU
Cabin Systems
Equipment
Electrical
Engine Accessories
Flight Controls
Fuel Systems
Hydraulics
Pneumatics
Landing Gear
Wheels/Brakes
Nacelles/Thrust Reversers
Other
Labor Materials

Copyright © 2015 CAVOK, a division of Oliver Wyman 56
3. SUPPLY CHAIN
The component MRO material supply chain consists of four main sources: OEMs, PMA providers, distributors, and surplus
providers.
OEMs: Original equipment manufacturers provide nearly 80% of the material required in the component MRO
segment.
PMA providers: For the same reasons as engine PMA providers, component PMA providers are expected to
struggle as the fleet grows. However, because of the broad spectrum of technologies in this segment, some being
less complex in design, PMA is expected to see marginally better success.
Distributors: As intermediaries between the OEMs and maintenance providers, distributors represent about 11%
of the material parts demand. Also like engine material distributors, this 11% market share, less markups, flows
back to the OEMs and their piece-part manufacturing partners.
Surplus providers: Surplus providers, which purchase new and used material from other surplus providers,
MROs, operators, and/or directly from parted-out aircraft, satisfy 9% of the component MRO parts demand.
EXHIBIT 44: 2015 Component Materials Market Share by Source
Source: betterinsight™ and PlaneStats

57 Copyright © 2015 CAVOK, a division of Oliver Wyman
LINE MAINTENANCE MARKET FORECAST AND STRUCTURE
Line maintenance represents a $12.3B segment of the global MRO activity, or 18% of the total.
This segment is expected to grow 4.0% annually over the first five-year period and 3.5% annually over the second five-year
period, for a total growth of 3.7% per year for the entire period.
Due to high sensitivity of potential operational impact, as well as economy of scale benefits at large stations, most carriers
still control their own line maintenance and this characteristic is not expected to change dramatically. Increased
contracting at locations where airlines have limited flight schedules, however, represents a growth opportunity for third-
party providers who are working to expand their coverage.
In 2015, the global line maintenance market will be dominated by narrowbody spend, and this dominance should continue
into the future. Widebody line maintenance should grow at a healthy rate, but it will command roughly the same share in
2025. The regional jet line maintenance spend is expected to decline over the period. Turboprop line maintenance spend
is forecast to increase moderately. Both regional jet and turboprop line maintenance are expected to see a decline in
market share.
EXHIBIT 45: 2015 Line MRO Market Share by Aircraft Class
Source: betterinsight™ and PlaneStats

Copyright © 2015 CAVOK, a division of Oliver Wyman 58
Regionally, North America and Western Europe are virtually tied for line maintenance demand in 2015. Western Europe
should widen its lead over North America throughout the forecast period; however, both Western Europe and North
America are forecast to lose market share by 2025, as developing regions, particularly Asia/Pacific, China, and India,
increase their total flight activity.
EXHIBIT 46: 2015-2025 Line MRO Market by Region
Source: betterinsight™ and PlaneStats
$3.3
$3.2
$2.1
$1.1
$0.8
$0.7
$0.6
$0.2
$0.3
$3.8
$3.4
$2.8
$1.4
$1.1
$0.9
$0.9
$0.3
$0.4
$3.9
$3.6
$3.3
$2.1
$1.5
$1.1
$1.1
$0.6
$0.6
$- $1 $2 $3 $4 $5
Western Europe
North America
Asia Pacific
China
Middle East
Latin America & Caribbean
Eastern Europe
India
Africa
Billions
2015 2020 2025
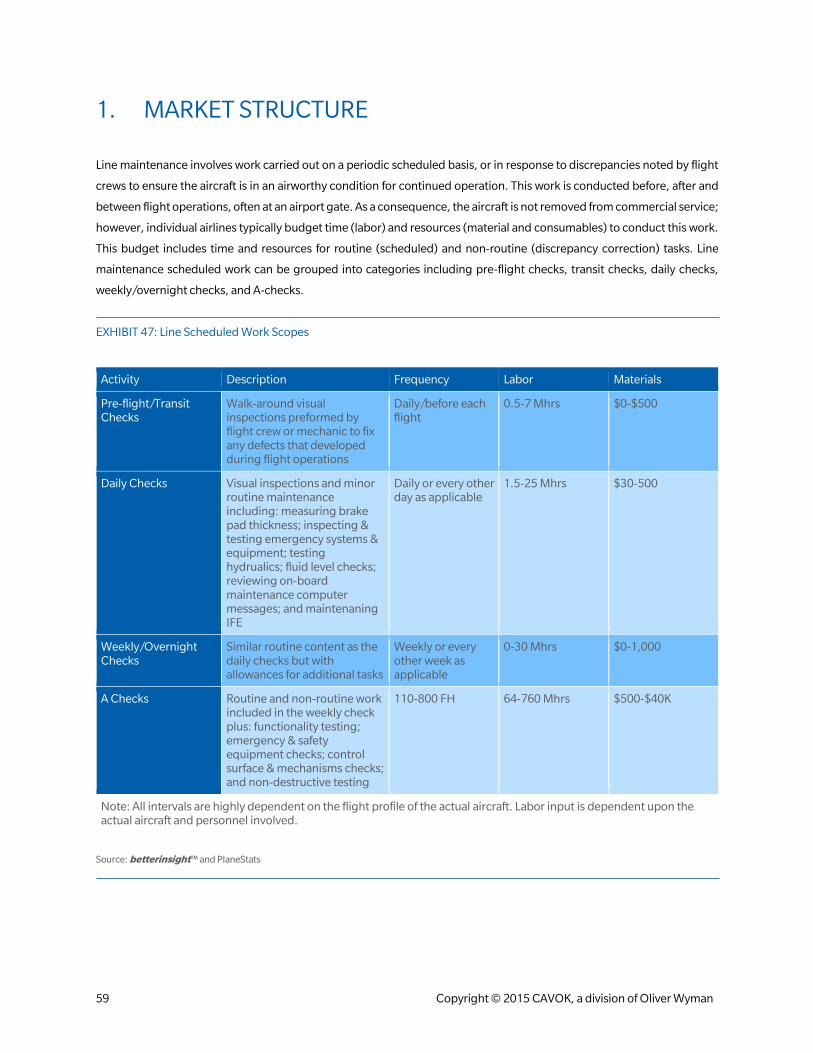
59 Copyright © 2015 CAVOK, a division of Oliver Wyman
1. MARKET STRUCTURE
Line maintenance involves work carried out on a periodic scheduled basis, or in response to discrepancies noted by flight
crews to ensure the aircraft is in an airworthy condition for continued operation. This work is conducted before, after and
between flight operations, often at an airport gate. As a consequence, the aircraft is not removed from commercial service;
however, individual airlines typically budget time (labor) and resources (material and consumables) to conduct this work.
This budget includes time and resources for routine (scheduled) and non-routine (discrepancy correction) tasks. Line
maintenance scheduled work can be grouped into categories including pre-flight checks, transit checks, daily checks,
weekly/overnight checks, and A-checks.
EXHIBIT 47: Line Scheduled Work Scopes
Activity Description Frequency Labor Materials
Pre-flight/Transit Checks
Walk-around visual inspections preformed by flight crew or mechanic to fix any defects that developed during flight operations
Daily/before each flight
0.5-7 Mhrs
$0-$500
Daily Checks Visual inspections and minor routine maintenance including: measuring brake pad thickness; inspecting & testing emergency systems & equipment; testing hydrualics; fluid level checks; reviewing on-board maintenance computer messages; and maintenaning IFE
Daily or every other day as applicable
1.5-25 Mhrs $30-500
Weekly/Overnight Checks
Similar routine content as the daily checks but with allowances for additional tasks
Weekly or every other week as applicable
0-30 Mhrs $0-1,000
A Checks Routine and non-routine work included in the weekly check plus: functionality testing; emergency & safety equipment checks; control surface & mechanisms checks; and non-destructive testing
110-800 FH 64-760 Mhrs $500-$40K
Note: All intervals are highly dependent on the flight profile of the actual aircraft. Labor input is dependent upon the actual aircraft and personnel involved.
Source: betterinsight™ and PlaneStats

Copyright © 2015 CAVOK, a division of Oliver Wyman 60
Line maintenance is typically either performed by the operator or contracted out.
While most programs are fairly standardized for given airframe types, different aircraft and varying flight profiles can
dictate different needs. Moreover, line maintenance requirements will gradually increase as the rate of technical defects
and discrepancies climbs as components and equipment age and wear.
Because of its importance in keeping an aircraft airworthy for daily operations, operators seek to control line maintenance
carefully, often performing the bulk of the work in-house and contracting emergency on-call maintenance at non-hub
stations. Compared to the other sectors though, contract line maintenance is less common.
An operator’s decision to contract line maintenance is often tied to locations where the operator has limited demand,
particularly at airports removed from the main network. Such situations represent opportunities for contract line
maintenance providers.
Based on MRO contract information it is possible to estimate the share of the market that is in-house and contracted. In
the air transport segment, airlines conduct most of their own line maintenance. Nearly 80% of the demand is carried out
in-house. When contracting line maintenance out, operators look to those providers that have experience for the aircraft
in transit at that station. Key considerations include: (1) reputation; (2) the ability to provide Aircraft On Ground (AOG)
service; (3) response times; (4) turnaround times; and (5) labor rates (especially given that line maintenance labor rates
tend to be higher than that of airframe heavy maintenance rates).
EXHIBIT 48: 2015 Line MRO Market Share by Maintenance Provider Classification
Source: betterinsight™ and PlaneStats
Airline25%
Airline Third Party -In House
8%
Airline Third Party -Contracted
18%
Independent40%
Joint Venture9%
OEM0%

61 Copyright © 2015 CAVOK, a division of Oliver Wyman
2. COST STRUCTURE
The line maintenance spend can be divided into two elements: labor and material.
Labor: Labor is the major element of line work, constituting more than three quarters of total spend of the
segment. Skilled labor is required to inspect, troubleshoot, remove, and replace parts as needed.
Material: Material tends to represent the smaller of the line MRO spend, driving just less than a quarter. Line
maintenance material spend tends to be dominated by expendables and consumables. Repairable and rotable
component repair costs, even if replaced during line maintenance, are captured in the component MRO
segment.
EXHIBIT 49: 2015 Line MRO Labor and Material Mix
Source: betterinsight™ and PlaneStats
Labor$0.8 B
Material$2.9 B

Copyright © 2015 CAVOK, a division of Oliver Wyman 62
3. SUPPLY CHAIN
The nature of line maintenance suggests that it contains elements of both airframe and component material. The supply
chain consists of three main sources: OEMs, distributors, and PMA providers. Line maintenance also requires consumable
materials, such as oil and solvents, for preventive maintenance servicing and lubrication.
OEMs: Original equipment manufacturers provide nearly 60% of the line maintenance material demand.
Proprietary designs, particularly with cabin materials of high wear components (seats, overhead bins, lavatories,
etc.), drive their share of the market.
Distributors: As intermediaries between the OEMs and maintenance providers, distributors represent about 40%
of the market.
PMA providers: PMA providers currently supply only a small share of line maintenance material. However, the
lower technologies employed in much line maintenance material (particularly cabin material and light structural
material used in A checks) make certification of alternates considerably easier and as a result the potential for
PMA expansion in this segment is significant, especially as airlines seek cost savings.
EXHIBIT 50: 2015 Line Materials Market Share by Source
Source: betterinsight™ and PlaneStats

63 Copyright © 2015 CAVOK, a division of Oliver Wyman
GLOBAL MRO BALANCE OF TRADE
The following discusses the supply and demand of MRO services in the major world regions. Comparing the relative
amounts of supply and demand provides an estimate of the balance of trade among regions and countries participating in
the MRO industry. To determine the relative supply of MRO services based on the forecasted demand each operator
generates in each segment, contract information is compiled at the fleet type level. This data is analyzed then at the
operator level to assess the balance of trade between regions.
A few definitions are important to clearly convey the conclusions of the analysis:
Net Importer: a region whose value of Imported MRO
Work is higher than its value of Exported MRO Work over
a given period of time
Net Exporter: a region whose value of Exported MRO
Work is higher than its value of Imported MRO Work
over a given period of time
Imported MRO Work: MRO work the operator sends
outside its home region to be performed; essentially, the
operator is importing the MRO service, even though it
must physically send the airframe/engine/component
outside its home region to have the work accomplished
Exported MRO Work: MRO work supplied in a given
region for other regions’ operators; essentially the MRO
is exporting its MRO services, even though it must
physically bring the airframe/engine/component into its
home region to perform the work
EXHIBIT 51: 2015 Balance of Trade by Region (Excluding Line Maintenance)
Region Import Export Trade Balance
Africa $971.8M $13.6M Net Importer
Asia Pacific $4,243.6M $2,753.6M Net Importer
China $2,135.7M $685.5M Net Importer
Eastern Europe $2,146.3M $53.4M Net Importer
India $384.7M $0.0M Net Importer
Latin America & Caribbean $1,548.2M $539.6M Net Importer
Middle East $3267.5M $320.7M Net Importer
North America $4,134.6M $3,377.3M Net Importer
Western Europe $1,256.7M $12,345.6M Net Exporter
Source: betterinsight™ and PlaneStats

63 Copyright © 2015 CAVOK, a division of Oliver Wyman
1. AIRFRAME MAINTENANCE (excluding modifications)
Africa (AF) is a net importer of airframe maintenance services. African operators generate $293M in airframe maintenance
demand. 81% of this demand is met by airframe MRO providers in Africa. Approximately $57M of this airframe
maintenance demand is performed in regions outside Africa, and an additional $14M is conducted for other regions,
primarily Western Europe. This results in a total of $249M of airframe maintenance supplied by African airframe
maintenance providers.
Top three airline/airline affiliated, independent, and Joint Venture MROs in the region based on airframe check spend
expected in 2015: SAA Technical; EgyptAir Maintenance & Engineering; Ethiopian Airlines.
Asia Pacific (AP) is a net exporter of airframe maintenance services. Asia Pacific operators generate $1.3B in airframe
maintenance demand. 94% of this demand is met by airframe MRO providers in Asia Pacific, while approximately $80M of
this airframe maintenance demand is performed in regions outside Asia Pacific, namely North America, and an additional
$588M is conducted for other regions. This results in a total of $1.8B of airframe maintenance supplied by Asia Pacific
airframe maintenance providers.
Top three airline/airline affiliated, independent, and Joint Venture MROs in the region based on airframe check spend
expected in 2015: Hong Kong Aircraft Engineering Co.; ST Aerospace; SAI Engineering.
China (CH) is a net exporter of airframe maintenance services. Chinese operators generate $516M in airframe
maintenance demand. 88% of this demand is met by airframe MRO providers in China. Approximately $64M of this
airframe maintenance demand is performed in regions outside China, chiefly Eastern and Western Europe, and an
additional $188M is conducted for other regions. This results in a total of $640M of airframe maintenance supplied by
Chinese airframe maintenance providers.
Top three airline/airline affiliated, independent, and Joint Venture MROs in the region based on airframe check spend
expected in 2015: Aircraft Maintenance & Engineering Corp.; Guangzhou Aircraft Maintenance Engineering Co.; Shanghai
Technologies Aerospace Co.
Eastern Europe (EE) is a net importer of airframe maintenance services. Eastern European operators generate $413M in
airframe maintenance demand. Just 21% of this demand is met by airframe MRO providers in Eastern Europe, however.
Approximately $328M of this airframe maintenance demand is performed in regions outside Eastern Europe, and an
additional $53M is conducted for other regions, principally Western Europe. This results in a total of $139M of airframe
maintenance supplied by Eastern European airframe maintenance providers.
Top three airline/airline affiliated, independent, and Joint Venture MROs in the region based on airframe check spend
expected in 2015: Lufthansa Technik Budapest; Aeroflot Russian Airlines; CSA Czech Airlines.

Copyright © 2015 CAVOK, a division of Oliver Wyman 64
India (IN) is a net importer of airframe maintenance services. Indian operators generate $79M in airframe maintenance
demand. 52% of this demand is met by airframe MRO providers in India. Approximately $38M of this airframe maintenance
demand is performed in regions outside India. This results in a total of $41M of airframe maintenance supplied by Indian
airframe maintenance providers.
Top two airline/airline affiliated, independent, and Joint Venture MROs in the region based on airframe check spend
expected in 2015: Air India; Blue Dart Aviation.
Latin America & the Caribbean (LA&C) is a net exporter of airframe maintenance services. LA&C operators generate
$354M in airframe maintenance demand. 86% of this demand is met by airframe MRO providers in Latin America.
Approximately $51M of this airframe maintenance demand is performed in regions outside Latin America, and an
additional $130M is conducted for other regions, mainly North America. This results in a total of $432M of airframe
maintenance supplied by Latin American airframe maintenance providers.
Top three airline/airline affiliated, independent, and Joint Venture MROs in the region based on airframe check spend
expected in 2015: Aeromexico; TAM Linhas Aereas; Aeroman.
Middle East (ME) is a net importer of airframe maintenance services. Middle Eastern operators generate $548M in
airframe maintenance demand. 87% of this demand is met by airframe MRO providers in the Middle East. Approximately
$69M of this airframe maintenance demand is performed in regions outside the Middle East, and an additional $53M is
conducted for other regions, primarily Western Europe. This results in a total of $533M of airframe maintenance supplied
by Middle Eastern airframe maintenance providers.
Top three airline/airline affiliated, independent, and Joint Venture MROs in the region based on airframe check spend
expected in 2015: Emirates Airline; Abu Dhabi Aircraft Technologies; JorAMCo.
North American (NA) operators generate $2.4B in airframe maintenance demand. 74% of this demand is met by airframe
MRO providers in North America. Approximately $619M of this airframe maintenance demand is performed in regions
outside North America, and an additional $66M is conducted for other regions, namely Latin America and the Caribbean.
This results in a total of $1.9B of airframe maintenance supplied by North American airframe maintenance providers. Thus,
North America is a net importer of airframe maintenance services.
Top four airline/airline affiliated, independent, and Joint Venture MROs in the region based on airframe check spend
expected in 2015: VT Aerospace; Southwest Airlines; American Airlines Maintenance, Repair & Overhaul; Delta TechOps.

65 Copyright © 2015 CAVOK, a division of Oliver Wyman
Western Europe (WE) is a net exporter of airframe maintenance services. Western European operators generate $2.0B
in airframe maintenance demand. 89% of this demand is met by airframe MRO providers in Western Europe.
Approximately $220M of this airframe maintenance demand is performed in regions outside Western Europe, and an
additional $435M is conducted for other regions, Eastern Europe chief among them. This results in a total of $2.2B of
airframe maintenance supplied by Western European airframe maintenance providers.
Top four airline/airline affiliated, independent, and Joint Venture MROs in the region based on airframe check spend
expected in 2015: Lufthansa Technik; Air France Industries KLM Engineering & Maintenance; British Airways Engineering;
SR Technics.
EXHIBIT 52: 2015 Airframe Maintenance Balance of Trade
Supply Demand
AF AP CH EE IN LA&C ME NA WE
AF 81% 4% 1% NEGL NEGL NEGL NEGL 3% 11%
AP NEGL 94% 1% NEGL NEGL NEGL NEGL 1% 5%
CH NEGL 10% 88% NEGL NEGL NEGL NEGL 2% NEGL
EE NEGL NEGL 17% 21% NEGL 6% 1% NEGL 55%
IN NEGL 24% 1% NEGL 52% NEGL 7% NEGL 17%
LA&C NEGL NEGL NEGL NEGL NEGL 86% NEGL 7% 7%
ME NEGL 3% NEGL NEGL NEGL NEGL 87% NEGL 10%
NA NEGL 18% 2% NEGL NEGL 4% 1% 74% 1%
WE 1% 3% 3% 3% NEGL NEGL 2% NEGL 89%
Note: Left column indicates region demand is generated in (region of operator). Top row indicates region maintenance is supplied/performed in (region of MRO). NEGL = Negligible
Source: betterinsight™ and PlaneStats
$-
$500
$1,000
$1,500
$2,000
$2,500
MIL
LIO
NS
Demand Supply

Copyright © 2015 CAVOK, a division of Oliver Wyman 66
2. ENGINE MAINTENANCE
Africa (AF) is a net importer of engine overhaul maintenance services. African operators generate $862M in engine
overhaul demand. 32% of this demand is met by engine MRO providers in Africa. Approximately $588M of this engine
maintenance demand is performed in regions outside Africa. This results in a total of $274M of engine maintenance
supplied by African engine maintenance providers.
Asia Pacific (AP) operators generate $6.0B in engine overhaul demand. 56% of this demand is met by engine MRO
providers in Asia Pacific. This likely will continue to grow as Asia Pacific builds its engine MRO capacity. Approximately
$2.7B of this engine maintenance demand is performed in regions outside Asia Pacific, and an additional $2.0M is
conducted for other regions. This results in a total of $5.3B of engine maintenance supplied by Asia Pacific engine
maintenance providers. Thus, Asia Pacific is a net importer of engine overhaul maintenance services.
China (CH) is a net importer of engine overhaul maintenance services. Chinese operators generate $2.1B in engine
overhaul demand. 16% of this demand is met by engine MRO providers in China. Approximately $1.8B of this engine
maintenance demand is performed in regions outside China, and an additional $408M is conducted for other regions,
namely China and the Middle East. This results in a total of $746M of engine maintenance supplied by Chinese engine
maintenance providers.
Eastern Europe (EE) is a net importer of engine overhaul maintenance services. Eastern European operators generate
$1.2B in engine maintenance demand. Just 1% of this demand is met by engine MRO providers in Eastern Europe.
Approximately $1.2B of this engine maintenance demand is performed in regions outside Eastern Europe (primarily
Western Europe). It appears that Eastern Europe is attracting very little engine work from abroad. This results in a total of
just $16M of engine maintenance supplied by Eastern European engine maintenance providers.
India (IN) is a net importer of engine overhaul maintenance services. Indian operators generate $282M in engine overhaul
demand. 28% of this demand is met by engine MRO providers in India. Approximately $204M of this engine maintenance
demand is performed in regions outside India, namely Asia Pacific. This results in $78M of engine maintenance supplied
by Indian engine maintenance providers.
Latin America & the Caribbean (LA&C) is a net importer of engine overhaul maintenance services. LA&C operators
generate $1.2M in engine maintenance demand. Just 24% of this demand is met by engine MRO providers in Latin
America. Approximately $941M of this engine maintenance demand is performed in regions outside Latin America, and
an additional $318M is conducted for other regions, namely North America. This results in a total of just $620M of engine
maintenance supplied by LA&C engine maintenance providers.
Middle East (ME) is a net importer of engine overhaul maintenance services. Middle Eastern operators generate $2.9B in
engine overhaul demand. 11% of this demand is met by engine MRO providers in the Middle East. Approximately $2.6B
of this engine maintenance demand is performed in regions outside the Middle East, chiefly in Western Europe, and an

67 Copyright © 2015 CAVOK, a division of Oliver Wyman
additional $75M is conducted for other regions. This results in a total of $388M of engine maintenance supplied by Middle
Eastern engine maintenance providers.
North American (NA) operators generate $8.1B in annual engine overhaul demand. 72% of this demand is met by engine
MRO providers in North America. Approximately $2.3B of this engine maintenance demand is performed in regions
outside North America, principally Western Europe, and an additional $1.8B is conducted for other regions, China in
particular. This results in a total of $7.8B of engine maintenance supplied by North American engine maintenance
providers. Thus, North America is a net importer of engine overhaul maintenance services.
Western Europe (WE) operators generate $5.0B in engine overhaul demand. 88% of this demand is met by engine MRO
providers in Western Europe. Approximately $574B of this engine maintenance demand is performed in regions outside
Western Europe, mainly in North America, and an additional $8.2B is conducted for other regions, primarily Asia Pacific.
This results in a total of $12.6B of engine maintenance supplied by Western Europe engine maintenance providers -
unsurprising given the number of OEM facilities within the region. Thus, Western Europe is a net exporter of engine
overhaul maintenance services
EXHIBIT 53: 2015 Engine Maintenance Balance of Trade
Supply Demand
AF AP CH EE IN LA&C ME NA WE
AF 32% 9% NEGL NEGL NEGL NEGL 3% NEGL 56%
AP NEGL 56% 6% NEGL NEGL NEGL NEGL 4% 34%
CH NEGL 25% 16% NEGL NEGL NEGL NEGL 25% 34%
EE NEGL 2% NEGL 1% NEGL NEGL NEGL 20% 77%
IN NEGL 66% NEGL NEGL 28% NEGL NEGL NEGL 7%
LA&C NEGL 15% NEGL NEGL NEGL 24% NEGL 24% 37%
ME NEGL 16% NEGL NEGL NEGL NEGL 11% 7% 67%
NA NEGL 4% NEGL NEGL NEGL 4% NEGL 72% 20%
WE NEGL 4% NEGL NEGL NEGL NEGL 1% 7% 88%
Note: Left column indicates region demand is generated in (region of operator). Top row indicates region maintenance is supplied/performed in (region of MRO). NEGL = Negligible
Source: betterinsight™ and PlaneStats
$-
$5,000
$10,000
$15,000
MIL
LIO
NS
Demand Supply
Copyright © 2015 CAVOK, a division of Oliver Wyman 68
3. COMPONENT MAINTENANCE
Africa (AF) is a net importer of component maintenance services. African operators generate $403M in component
demand. 19% of this demand is met by component MRO providers in Africa. Approximately $327M of this component
maintenance demand is performed in regions outside Africa. This results in a total of $403M of component maintenance
supplied by African component maintenance providers.
Asia Pacific (AP) operators generate $1.9B in component maintenance demand. 22% of this demand is met by
component MRO providers in Asia Pacific. Approximately $1.5B of this component maintenance demand is performed in
regions outside Asia Pacific, and an additional $203M is conducted for other regions. This results in a total of $631B of
component maintenance supplied by Asia Pacific component maintenance providers. Thus, Asia Pacific is a net importer
of component maintenance services.
China (CH) is a net importer of component maintenance services. Chinese operators generate $916B in component
demand. 67% of this demand is met by component MRO providers in China. Approximately $306M of this component
maintenance demand is performed in regions outside China, and an additional $89M is conducted for other regions. This
results in a total of $699M of component maintenance supplied by Chinese component maintenance providers.
Eastern Europe (EE) is a net importer of component maintenance services. Eastern European operators generate $608M
in component maintenance demand. Just 3% of this demand is met by component MRO providers in Eastern Europe.
Approximately $590M of this component maintenance demand is performed in regions outside Eastern Europe, and less
than $0.5M is conducted for other regions. This results in a total of just $18M of component maintenance supplied by
Eastern European component maintenance providers.
India (IN) is a net importer of component maintenance services. Indian operators generate $170M in component demand.
16% of this demand is met by component MRO providers in India. Approximately $142M of this component maintenance
demand is performed in regions outside India. This results in $27M of component maintenance supplied by Indian
component maintenance providers.
Latin America & the Caribbean (LA&C) is a net importer of component maintenance services. LA&C operators generate
$682M in component maintenance demand. Just 18% of this demand is met by component MRO providers in Latin
America. Approximately $557M of this component maintenance demand is performed in regions outside Latin America,
and an additional $92M is conducted for other regions. This results in a total of just $682M of component maintenance
supplied by LA&C component maintenance providers.
Middle East (ME) is a net importer of component maintenance services. Middle Eastern operators generate $737M in
component demand. 18% of this demand is met by component MRO providers in the Middle East. Approximately $605M
of this component maintenance demand is performed in regions outside the Middle East, and an additional $192M is
conducted for other regions. This results in a total of $324M of component maintenance supplied by Middle Eastern
component maintenance providers.
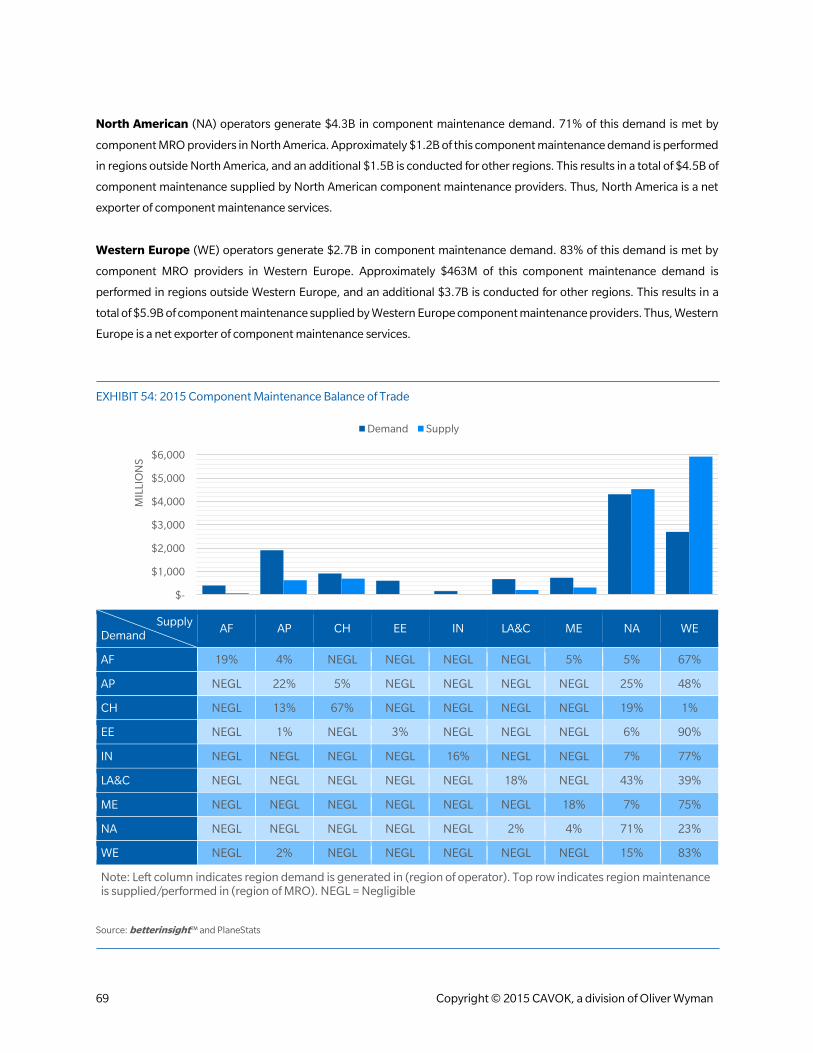
69 Copyright © 2015 CAVOK, a division of Oliver Wyman
North American (NA) operators generate $4.3B in component maintenance demand. 71% of this demand is met by
component MRO providers in North America. Approximately $1.2B of this component maintenance demand is performed
in regions outside North America, and an additional $1.5B is conducted for other regions. This results in a total of $4.5B of
component maintenance supplied by North American component maintenance providers. Thus, North America is a net
exporter of component maintenance services.
Western Europe (WE) operators generate $2.7B in component maintenance demand. 83% of this demand is met by
component MRO providers in Western Europe. Approximately $463M of this component maintenance demand is
performed in regions outside Western Europe, and an additional $3.7B is conducted for other regions. This results in a
total of $5.9B of component maintenance supplied by Western Europe component maintenance providers. Thus, Western
Europe is a net exporter of component maintenance services.
EXHIBIT 54: 2015 Component Maintenance Balance of Trade
Supply Demand
AF AP CH EE IN LA&C ME NA WE
AF 19% 4% NEGL NEGL NEGL NEGL 5% 5% 67%
AP NEGL 22% 5% NEGL NEGL NEGL NEGL 25% 48%
CH NEGL 13% 67% NEGL NEGL NEGL NEGL 19% 1%
EE NEGL 1% NEGL 3% NEGL NEGL NEGL 6% 90%
IN NEGL NEGL NEGL NEGL 16% NEGL NEGL 7% 77%
LA&C NEGL NEGL NEGL NEGL NEGL 18% NEGL 43% 39%
ME NEGL NEGL NEGL NEGL NEGL NEGL 18% 7% 75%
NA NEGL NEGL NEGL NEGL NEGL 2% 4% 71% 23%
WE NEGL 2% NEGL NEGL NEGL NEGL NEGL 15% 83%
Note: Left column indicates region demand is generated in (region of operator). Top row indicates region maintenance is supplied/performed in (region of MRO). NEGL = Negligible
Source: betterinsight™ and PlaneStats
$-
$1,000
$2,000
$3,000
$4,000
$5,000
$6,000
MIL
LIO
NS
Demand Supply

Copyright © 2015 CAVOK, a division of Oliver Wyman 70
GLOBAL BUSINESS AVIATION OUTLOOK FOR 2015 While the global air transport jet and turboprop fleet stands at roughly 24,000 aircraft in 2015, the business aviation fleet
is comprised of approximately 31,400 aircraft, making up 57% of the global civil commercial and business aircraft fleet.
EXHIBIT 55: 2015 Civil Aviation Fleet by Market Segment
Source: betterinsight™ and PlaneStats
Today, the global business aviation fleet of is comprised of 1,460 very light jets, 5,691 light jets, 3,818 midsize jets, 2,607
medium jets, heavy jets, and 2,502 ultra-long range jets. 657 regional jets, 968 narrowbodies, and 202 widebodies make
up an additional 6% of the business aviation fleet. The remaining 39% of the global business aviation fleet is comprised of
both large air transport category turboprops as well as small turboprops such as the Cessna Caravan. General aviation
aircraft with a maximum takeoff weight (MTOW) of 8,000 pounds or less are not included in the business aviation fleet.
EXHIBIT 56: 2015 Business Aviation Fleet by Class
Source: betterinsight™ and PlaneStats
Business Aviation Fleet
31,35757%
Air Transport Fleet23,927
43%
12,225
5,691
3,8182,607 2,502
1,460 1,227 968 657 2020
2,000
4,000
6,000
8,000
10,000
12,000
14,000

71 Copyright © 2015 CAVOK, a division of Oliver Wyman
Nearly 67% (17,814) of the business aviation fleet is domiciled in North America. Latin America & the Caribbean is the
second largest market with 3,193 aircraft, followed by Western Europe with nearly 2,532 aircraft. The remaining regions,
including Antarctica, make up merely 11% of the business aviation fleet.
EXHIBIT 57: 2015 Business Aviation Fleet by Region
Source: betterinsight™ and PlaneStats
As with the commercial air transport jet and turboprop fleet, aircraft utilization is the key driver of MRO services. While the
business aviation fleet is significantly larger than the commercial air transport fleet, the utilization of the fleet as a whole is
substantially lower. An air transport aircraft, on average, may be utilized more than 8-10 hours each day of the year while a
business aircraft may average less than one hour per day over the same period. The business aviation MRO spend
complexion and scale is, therefore, quite different as well.
17,814
3,1932,532
1,059 843452 312 167 68 5
0
2,000
4,000
6,000
8,000
10,000
12,000
14,000
16,000
18,000
20,000
NorthAmerica
LatinAmerica &Caribbean
WesternEurope
Asia Pacific Africa MiddleEast
India EasternEurope
China Antarctica

Copyright © 2015 CAVOK, a division of Oliver Wyman 72
Total MRO spend for the business aviation segment is $8.8 billion, and consists of four major segments: airframe,
modifications, engine, and component. Checks and other maintenance tasks that fall under line maintenance for air
transport aircraft are captured by airframe maintenance. At 29% of total MRO spend, modifications make up the largest
portion of business aviation MRO, followed closely by component MRO spend at 27%. The remaining 44% of total MRO is
split evenly between airframe spend and engine spend.
Unlike air transport MRO, there is no aircraft class that dominates MRO spend globally. The business aviation turboprop
fleet constitutes approximately 39% of the global fleet but only accounts for 19% of the business aviation MRO spend.
Ultra-long range jets, on the other hand, make up 8% of the global fleet and account for 17% of the business aviation MRO
market in 2015 due to higher utilization rates, and thus increased engine and component MRO spend.
EXHIBIT 58: 2015 Business Aviation MRO Market by MRO Segment
Source: betterinsight™ and PlaneStats
$1,714
$1,484
$1,265 $1,221 $1,206
$650 $634
$274 $265
$131
Total MRO Spend$8.8 Billion
0
200
400
600
800
1,000
1,200
1,400
1,600
1,800
Mil
lio
ns
Airframe Modifications Engine Component Column2

73 Copyright © 2015 CAVOK, a division of Oliver Wyman
Similar to the air transport market, a relatively small number of aircraft manufacturers dominate the market. Together,
Cessna, Bombardier, Gulfstream Beechcraft (Hawker/Beechcraft), and Dassault comprise more than 70% of the global
business aviation fleet and also account for more than 75% of the business aviation MRO spend expected in 2015. Boeing,
Embraer, Airbus, BAE Systems, Piper, and Pilatus combined make up 17% of the global fleet and 19% of the MRO spend
forecast in 2015. The remaining 11% of the fleet and 5% of 2015 MRO spend is split between 28 aircraft manufactures.
EXHIBIT 59: 2015 Global Fleet and MRO Market by Aircraft Manufacturer
Source: betterinsight™ and PlaneStats
7,105$1.6 B
4,140$1.5 B
2,623
$1.4 B
7,329
$1.4 B
1,774$.8 B
8,908$2.1 B
22% of the Fleet18% of MRO Spend
13% of the Fleet17% of MRO Spend
8% of the Fleet16% of MRO Spend
23% of the Fleet16% of MRO Spend
6% of the Fleet9% of MRO Spend
28% of the Fleet24% of MRO Spend
0%
10%
20%
30%
40%
50%
60%
70%
80%
90%
100%
Fleet Percentage of the FleetPercentage of MRO Spend
MRO
Cessna Bombardier Gulfstream Beechcraft (Hawker/Beechcraft) Dassult Other

Copyright © 2015 CAVOK, a division of Oliver Wyman 74
AVIATION MAINTENANCE INDUSTRY EMPLOYMENT & ECONOMIC IMPACT
There are approximately 378,7621 employees from some 4,7432 firms worldwide participating in the civil MRO market.
79.8%1 of firms are SMEs. Globally, there are about 278,0732 technicians – 21.4%2 of which are certificated. In the USA,
there are nearly 4,0232 firms with 192,2011 employees in the civil MRO market. SMEs comprise 84.2%1 of all firms and
account for 20.51 of all employees. There are over 141,7072 technicians in the USA and approximately 37.4%2 are
certificated.
EXHIBIT 60: 2015 Civil Aviation MRO Entities and Employment
Source: betterinsight™ and PlaneStats
1 Source: FAA Repair Station Data, betterinsight™ by CAVOK, a division of Oliver Wyman 2 Source: FAA Repair Station Data
3,783 3,388
960
635
0
500
1,000
1,500
2,000
2,500
3,000
3,500
4,000
4,500
5,000
GLOBAL USA
Number of Entities
SME NON-SME
46,691 39,330
332,071
152,871
0
50,000
100,000
150,000
200,000
250,000
300,000
350,000
400,000
GLOBAL USA
Number of Employees
SME NON-SME

75 Copyright © 2015 CAVOK, a division of Oliver Wyman
1. AIRFRAME & LINE MAINTENANCE
Heavy airframe maintenance facilities employ 300,4893 employees within 2,8204 companies; nearly 76.9%3 are SMEs,
which employ over 27,8273 people worldwide. In the US, there are 139,0053 employees in the heavy airframe maintenance
supply chain within 2,3944 companies; nearly 83.5%4 of the providers in the US are SMEs – employing nearly 23,9453
people.
According to the FAA, there are 220,2824 technicians engaged in heavy airframe maintenance, with nearly 25.6%4 being
FAA certificated individuals. In the US, there are 102,3094 technicians – approximately 48.8%4 or 49,9514 are FAA
certificated.
EXHIBIT 61: 2015 Civil Aviation MRO Entities and Employment
Source: betterinsight™ and PlaneStats
Labor, which is internal to the line maintenance facility, accounts for approximately 94,6903 employees; an additional
10,4153 employees support work in other parts of the line maintenance supply chain. In the US, it is estimated that
approximately 25,9293 employees are in line maintenance supply chain.
3 Source: FAA Repair Station Data, betterinsight™ by CAVOK, a division of Oliver Wyman 4 Source: FAA Repair Station Data
2,201 1,999
619
395
0
500
1,000
1,500
2,000
2,500
3,000
GLOBAL USA
Number of Entities
SME NON-SME
27,827 23,945
272,662
115,060
0
50,000
100,000
150,000
200,000
250,000
300,000
350,000
GLOBAL USA
Number of Employees
SME NON-SME

Copyright © 2015 CAVOK, a division of Oliver Wyman 76
2. ENGINE MAINTENANCE
The global engine overhaul supply chain employs 282,6485 employees within 1,8346 companies; approximately 69.8%5
are SMEs, employing 19,4905 people worldwide. In the US, there are 125,4385 employees in the engine overhaul supply
chain within 1,5506 entities; nearly 76.8%5 are SMEs – employing17,3595 people.
Globally, there are 206,9016 technicians in the engine overhaul supply chain, around 25.2%6 of which are FAA certificated.
In the US there are 92,1016 technicians – approximately 50.36 or 46,3096 are FAA certificated.
EXHIBIT 62: 2015 Civil Aviation MRO Entities and Employment
Source: betterinsight™ and PlaneStats
5 Source: FAA Repair Station Data, betterinsight™ by CAVOK, a division of Oliver Wyman 6 Source: FAA Repair Station Data
1,280 1,191
554
359
0
200
400
600
800
1,000
1,200
1,400
1,600
1,800
2,000
GLOBAL USA
Number of Entities
SME NON-SME
19,490 17,359
263,158
108,079
0
50,000
100,000
150,000
200,000
250,000
300,000
GLOBAL USA
Number of Employees
SME NON-SME

77 Copyright © 2015 CAVOK, a division of Oliver Wyman
3. COMPONENT MAINTENANCE
The global component maintenance supply chain employs 325,4087 employees within 3,4208 companies; approximately
77.5%7 are SMEs, employing nearly 34,0237 people worldwide. In the US, there are 156,4627 employees in the component
maintenance supply chain within 2,8388 entities; about 82.4%7 are SMEs – employing 27,8757 people.
Globally, there are 238,6708 technicians in the component maintenance supply chain; around 22.6%8 are FAA certificated.
In the US there are 115,2028 technicians – approximately 41.4%8 or 47,6418 are FAA certificated.
EXHIBIT 63: 2015 Civil Aviation MRO Entities and Employment
Source: betterinsight™ and PlaneStats
7 Source: FAA Repair Station Data, betterinsight™ by CAVOK, a division of Oliver Wyman 8 Source: FAA Repair Station Data
2,649 2,338
771
500
0
500
1,000
1,500
2,000
2,500
3,000
3,500
4,000
GLOBAL USA
Number of Entities
SME NON-SME
34,023 27,875
291,385
128,587
0
50,000
100,000
150,000
200,000
250,000
300,000
350,000
GLOBAL USA
Number of Employees
SME NON-SME

Copyright © 2015 CAVOK, a division of Oliver Wyman 78
4. U.S. EMPLOYMENT AND ECONOMIC IMPACT
The US civil aviation maintenance industry employs over 289,2819 people and generates $43.2B in economic activity. MRO
accounts for 75.4%10 of the total employment in the US with 218,13010 employees; within the MRO industry, companies
that are certificated by the FAA under part 145 are the largest employers with192,20111 employees. The remaining
25,92912 are employed by other companies involved in civil aviation. Parts manufacturing and distribution, accounts for
the remaining 24.6%13 of employment with 71,15113 employees. MRO generates over 42.8% of the economic activity or
$19.0B. With 24.6%13 of the total employment, parts manufacturing and distribution, accounts for 56.0% of the total
economic activity or $24.2B.
EXHIBIT 64: 2015 Civil Aviation MRO Entities and Employment
Source: betterinsight™ and PlaneStats
Analyzing the MRO industry at the state level, CAVOK estimates that California, Florida, Georgia, and Texas9 combined
represent 35.0%9 of the total US civil aviation maintenance employment with an estimated 101,1479 employees; the top
ten states represent 63.2%9 of the total employment in the US.
9 Source: FAA Repair Station Data, BLS, RITA, betterinsight™ by CAVOK, a division of Oliver Wyman 10 Source: FAA Repair Station Data, RITA, betterinsight™ by CAVOK, a division of Oliver Wyman 11 Source: FAA Repair Station Data, betterinsight™ by CAVOK, a division of Oliver Wyman 12 Source: RITA, betterinsight™ by CAVOK, a division of Oliver Wyman 13 Source: BLS, betterinsight™ by CAVOK, a division of Oliver Wyman
Part 145 Repair
Station, 192,201
Air Carrier Maintenance
25,929
Parts Manufactuing/
Distribution71,151
Number of Employees
Maintenance,
Repair and
Overhaul (MRO),
$19,041,233
Parts Manufacturing/
Distribution$24,202,330
Economic Activity (In Thousands)

79 Copyright © 2015 CAVOK, a division of Oliver Wyman
California and Arizona also generate the most economic activity followed by Washington, Texas, Connecticut, and
Kansas14; together, these six states generate nearly 50%14 of the total economic activity.
EXHIBIT 65: 2015 Civil Aviation MRO Entities and Employment
Source: betterinsight™ and PlaneStats
14 Source: FAA Repair Station Data, BLS, RITA, betterinsight™ by CAVOK, a division of Oliver Wyman
0 10,000 20,000 30,000 40,000
VIMPGUWYPRSDRI
MTND
IDVT
NMHI
NHMSDEAK
WVUT
MENV
MDKY
MOSC
COORWILA
NEMAAR
MNPAIN
TNVANCNJALILIA
MINYOHKS
OKCTAZGA
WAFLTXCA
Number of Employees
$0 $2,000 $4,000 $6,000
VIMPGUWYPR
MTRIID
NDHI
SDNMNHAK
WVDEMSVT
MENVKY
MOSC
COUTWIORLA
MDAR
MAMN
PAAL
NCTNNJ
NEINIL
VAOKMINYOH
IAFL
GAKSCTTX
WAAZCA
Economic Activity (in Millions)

Copyright © 2015 CAVOK, a division of Oliver Wyman 80
EXHIBIT 66: 2015 U.S. Aviation Maintenance Industry Employment and Economic Impact
Source: betterinsight™ and PlaneStats

81 Copyright © 2015 CAVOK, a division of Oliver Wyman
CONCLUSION
This report detailed the air transport and business aviation jet and turboprop fleets and corresponding MRO markets.
Cautiously optimistic economic forecasts suggest an improved market environment for air transport, but concerns remain.
Because MRO activity is so closely tied to air transport, it is crucial that MRO providers are aware of these outlooks and
prepare accordingly.
Globally, the air transport fleet growth is solid; however, in the U.S., where fleet growth is virtually flat, new deliveries
largely will be used as replacement aircraft. Still, North America is a large market and will remain so even as other regions
grow their fleets to comparable proportions. Developing regions such as Asia/Pacific and China are poised for substantial
fleet growth. As a whole, Asia is the engine of fleet growth, and in turn, the engine for global MRO growth.
Globally, the air transport jet and turboprop MRO market in 2015 is expected to be $67.1B, growing to $100.4B by 2025.
This represents a healthy 4.1% CAGR. North America is the single largest region for MRO spend, driving $20.1B in 2015.
This is forecast to grow very modestly though through 2025 by just 0.6% to $21.3B.
Regionally, Asia Pacific, China, and the Middle East represent the greatest absolute net growth.
EXHIBIT 67: 2015-2025 Net Increase in Air Transport MRO Market by Region
Net Increase AF AP CH EE IN LA&C ME NA WE
2015-2025 $968 $8,173 $6,545 $1,837 $1,768 $3,284 $4,324 $1,278 $5,147
Source: betterinsight™ and PlaneStats
$-
$1,000
$2,000
$3,000
$4,000
$5,000
$6,000
$7,000
$8,000
$9,000
MIL
LIO
NS

Copyright © 2015 CAVOK, a division of Oliver Wyman 82
Looking at the vintages expected to drive this MRO growth by the end of the forecast, the 1990’s and 2000’s era aircraft
will dominate.
EXHIBIT 68: 2015-2025 Net Increase in Air Transport MRO Market by Aircraft Vintage
Net Increase 1970’s 1980’s 1990’s 2000’s 2010’s
2015-2025 $968 $8,173 $6,545 $1,837 $1,768
Source: betterinsight™ and PlaneStats
Airframe MRO spend is forecast to be $14.5B for 2015. Airlines themselves and their affiliated third party providers
maintain a solid hold on this market. The airframe MRO market typically is considered a low-margin, labor intensive
segment.
Engine MRO is expected to be $27.9B in 2015. Unlike airframe MRO, engine MRO is largely contracted out and engine
OEMs have the largest share of this market. The engine MROs typically enjoy higher margins, as a result of the segments
more material intensive nature.
Component MRO is forecast to be $12.4B in 2015. Like the engine MRO business, much of the component MRO market is
contracted out, although it varies greatly from one component type to the next. Similarly, the labor/material mix can vary.
Finally, line maintenance is pegged at $12.3B in 2015. The nature of line maintenance work and its outsized impact on
airline operational performance makes it less prone to contracting.
An examination of the regional balance of trade revealed that North America is a net importer of airframe and engine
maintenance services while Western Europe, as North America’s largest peer, is a net exporter for both airframe and
engine maintenance. Developing regions with low-cost but skilled labor tend to be net exporters of airframe maintenance.
Regions with limited indigenous skills often must rely on other regions. Line maintenance, by its nature, does not allow for
as much contracting or off-shoring.
$(15,000)
$(10,000)
$(5,000)
$-
$5,000
$10,000
$15,000
$20,000
MIL
LIO
NS

83 Copyright © 2015 CAVOK, a division of Oliver Wyman
The business aviation fleet currently consists of nearly 31,400 aircraft requiring roughly $8.8B in MRO market in 2015.
Nearly 67% (17,814) of the business aviation fleet is domiciled in North America.
In the U.S., roughly 4,000 firms with over 218,000 employees operate in the civil MRO market (including airline
employees). Small and medium-sized enterprises (SME) account for 84% of these U.S. firms and 20% of all employees.
There are over 141,000 technicians in the U.S. and approximately 37% are certificated.