Team3 presentation
21
Halim Abbas Rashid Ali Amanda Gilbert LaTia Jefferson THINK BIG BOOTCAMP PROJECT
-
Upload
amanda-gilbert -
Category
Technology
-
view
157 -
download
0
Transcript of Team3 presentation
Halim AbbasRashid AliAmanda GilbertLaTia Jeff erson
THINK BIG BOOTCAMP PROJECT

DATA INGESTION

Created Python MapReduce job to format the data for ingestion Python dictionary to deal with paired data Logic to ignore lines with data issues
Executed a Hadoop streaming job to ingest the dataLoaded the data into tables via hive Ingested FAA’s Aircraft Registry dataRe-ingested data by site
METHODOLOGY


PRELIMINARY ANALYSIS
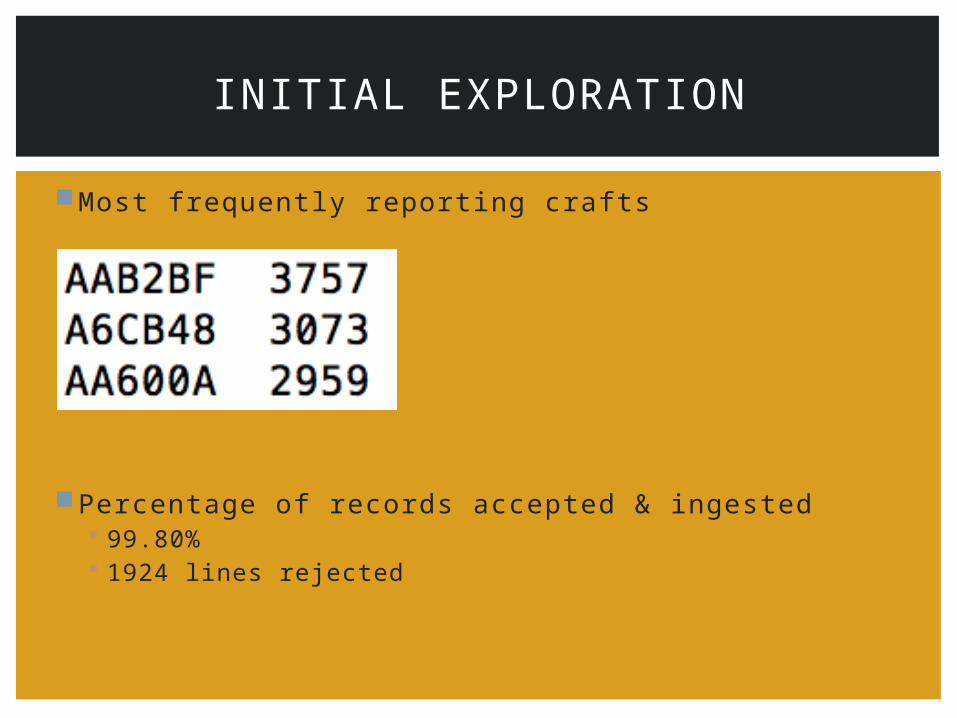
Most frequently reporting crafts
Percentage of records accepted & ingested 99.80% 1924 lines rejected
INITIAL EXPLORATION

Site 1 Site 2
Number of Sightings 563715 449904
Average Speed 342.02 395.37
Average Alt 15919.28 20295.33
SITE COMPARISON

Sampled latitude and longitude data both sitesFound average latitude and longitude for each
Site one: 42.22, -70.85 Site two: 42.12, -71.49
SITE LATITUDE LONGITUDE DATA

SITE 1 RELATIVE LOCATION

SITE 2 RELATIVE LOCATION

CREATE TABLE model_summary AS SELECT mdl_code, make, model, max(speed), max(alt) FROM master_data GROUP BY mdl_code, make, model;
CREATE TABLE aircraft_summary AS SELECT ident, make, model, max(speed), max(alt) FROM master_data GROUP BY ident, make, model;
CREATE TABLE owner_summary AS SELECT owner_name, count(distinct(hexid)) AS count_hex FROM master_data GROUP BY owner_name;
MASTER DATA QUERIES

DATA SCIENCE & VISUALIZATIONS

FASTEST PLANES

TOP SPEED VS CRUISING ALTITUDE
BY MAKE


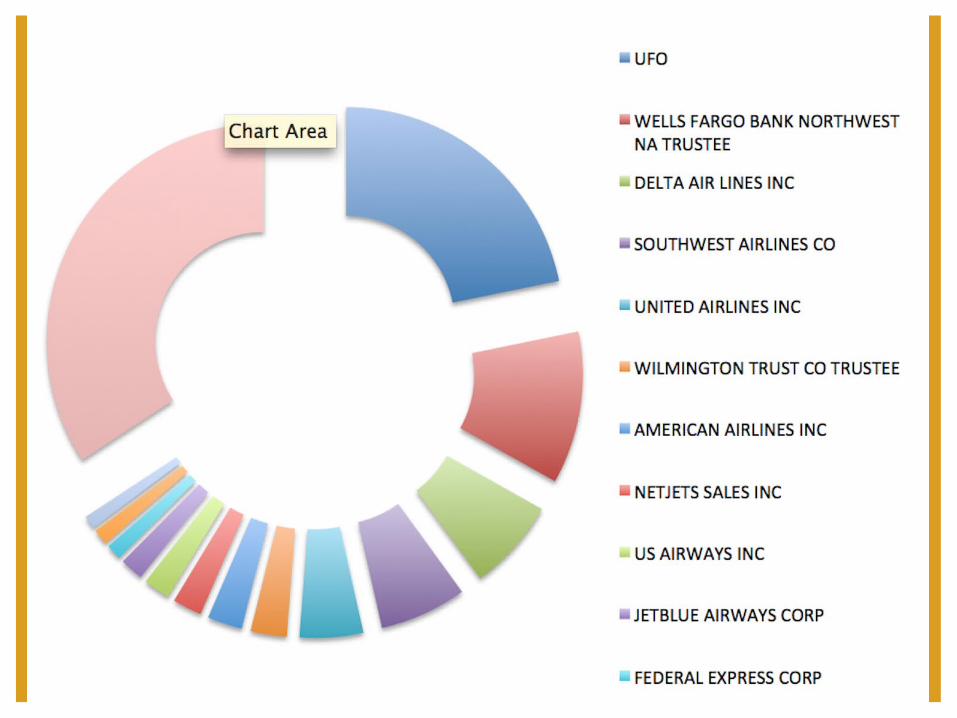
UNIQUE FLIGHTS BY AIRLINE

NUMBER OF SIGHTINGS BY
AIRCRAFT MAKE