Team project management tutorial
27
+ Team project management tutorial
Transcript of Team project management tutorial

+
Team project management tutorial


Apps for Slack
Wrike
Trello
+Poll apps!

How do the online communication patterns of student product design teams vary?
Do these patterns relate to the strengths of their design processes?
4
Primary research questions
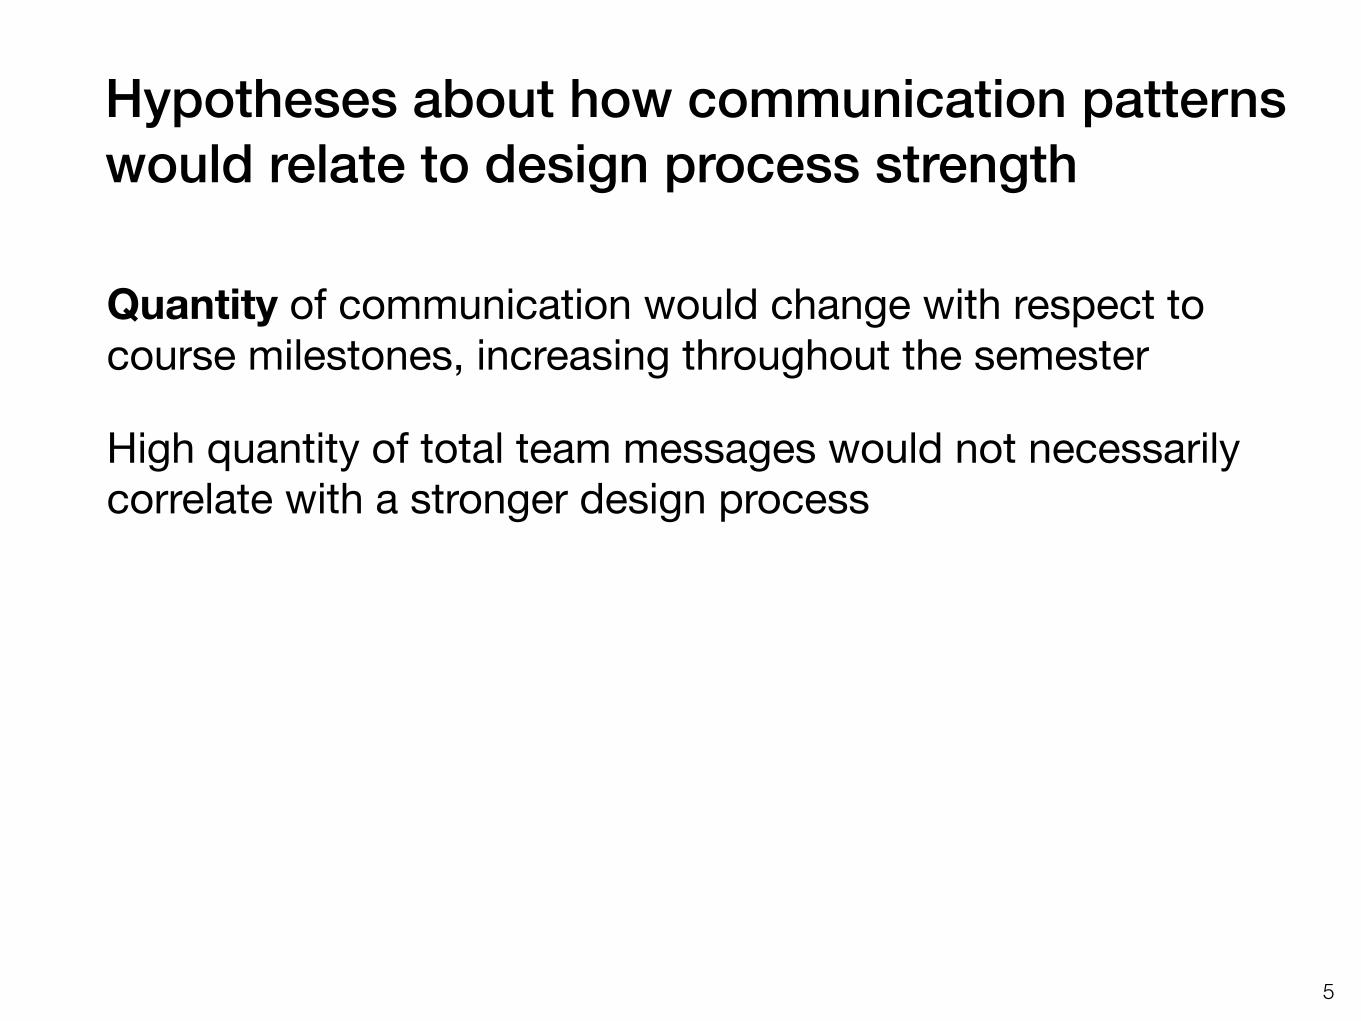
Hypotheses about how communication patterns would relate to design process strength
Quantity of communication would change with respect to course milestones, increasing throughout the semester
High quantity of total team messages would not necessarily correlate with a stronger design process
5
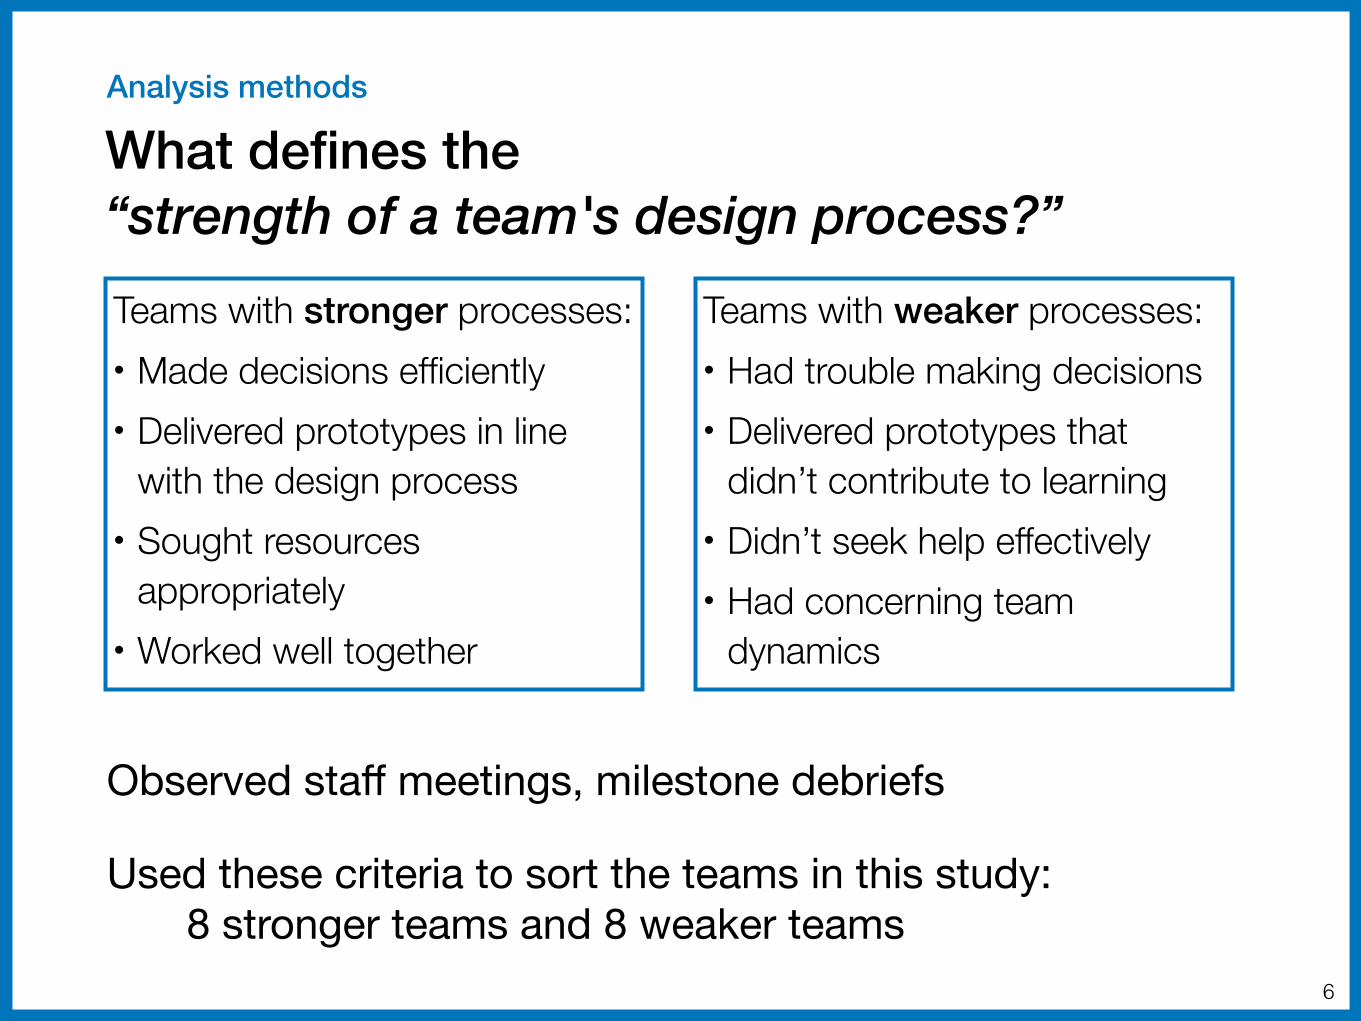
What defines the “strength of a team's design process?”
Observed staff meetings, milestone debriefs
Used these criteria to sort the teams in this study:8 stronger teams and 8 weaker teams
6
Teams with stronger processes: • Made decisions efficiently • Delivered prototypes in line
with the design process • Sought resources
appropriately • Worked well together
Teams with weaker processes: • Had trouble making decisions • Delivered prototypes that
didn’t contribute to learning • Didn’t seek help effectively • Had concerning team
dynamics
Analysis methods

Quantity of communication would change with respect to course milestones, increasing throughout the semester
High quantity of total team messages would not necessarily correlate with a stronger design process
7
Uniformity of a team’s online communication would correlate with a stronger design process
• Consistency of daily team messages sent throughout the semester
• Equality of percentages of team messages sent by individuals
Hypotheses about how communication patterns would relate to design process strength
0100200300400500600700800
0 50 100
Qua
ntity
of m
essa
ges
Time (Days)
0100200300400500600700800
0 50 100
Qua
ntity
of m
essa
ges
Time (Days)
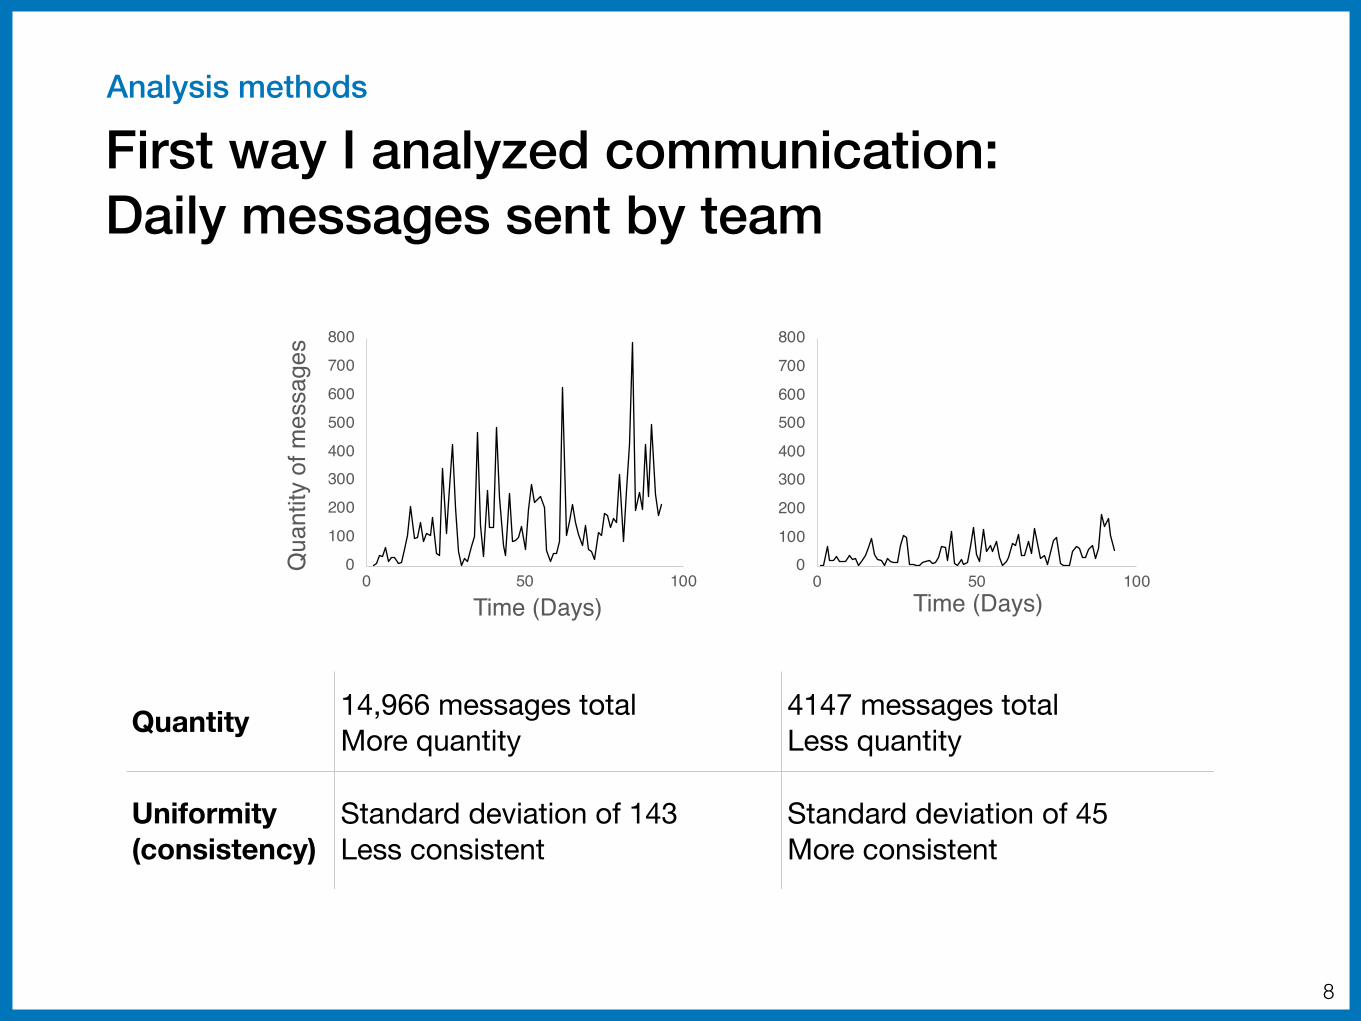
First way I analyzed communication: Daily messages sent by team
8
Quantity 14,966 messages totalMore quantity
4147 messages totalLess quantity
Uniformity (consistency)
Standard deviation of 143Less consistent
Standard deviation of 45More consistent
Analysis methods

Second way I analyzed communication: Percent of team messages sent by individuals
9
Quantity 29% messages sent by most communicative individual
12% messages sent by most communicative individual
Uniformity (equality)
Standard deviation of 7Less equal
Standard deviation of 3More equal
One slice represents one individual
Analysis methods

Quantity of communication changed throughout semester
10
Total daily Slack activity of all 2016 and 2017 teams (282 students) throughout the semester compared to course milestones
Dips in communication after every milestone
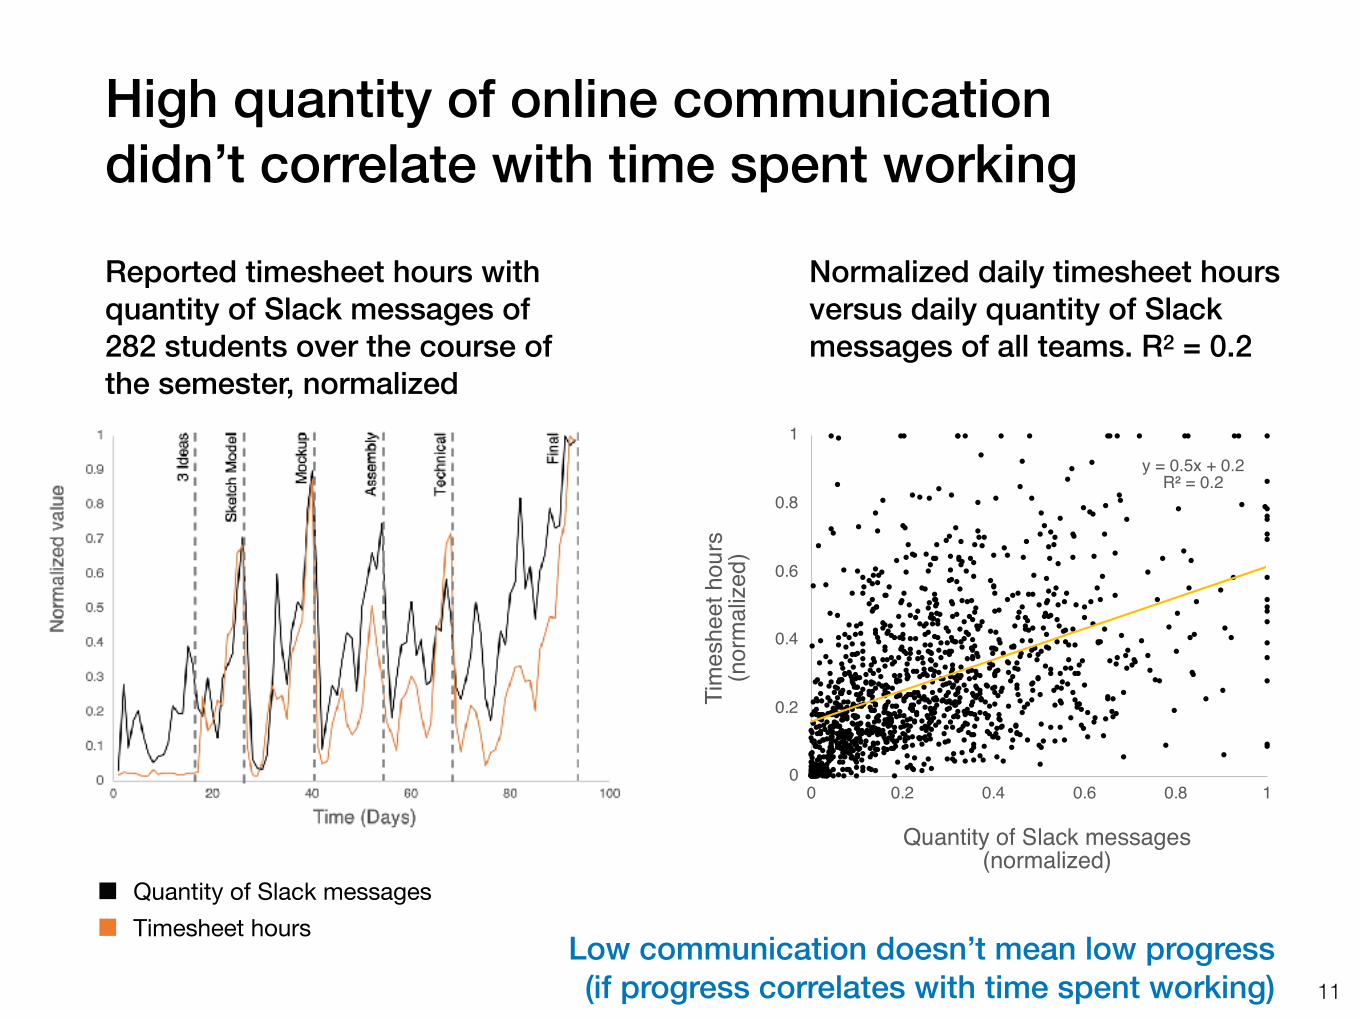
High quantity of online communication didn’t correlate with time spent working
11
Reported timesheet hours with quantity of Slack messages of 282 students over the course of the semester, normalized
y = 0.5x + 0.2R² = 0.2
0
0.2
0.4
0.6
0.8
1
0 0.2 0.4 0.6 0.8 1
Tim
eshe
et h
ours
(n
orm
aliz
ed)
Quantity of Slack messages(normalized)
Normalized daily timesheet hours versus daily quantity of Slack messages of all teams. R2 = 0.2
Quantity of Slack messagesTimesheet hours
Low communication doesn’t mean low progress (if progress correlates with time spent working)
12
Quantity of messages stronger teams
Quantity of messages of weaker teams
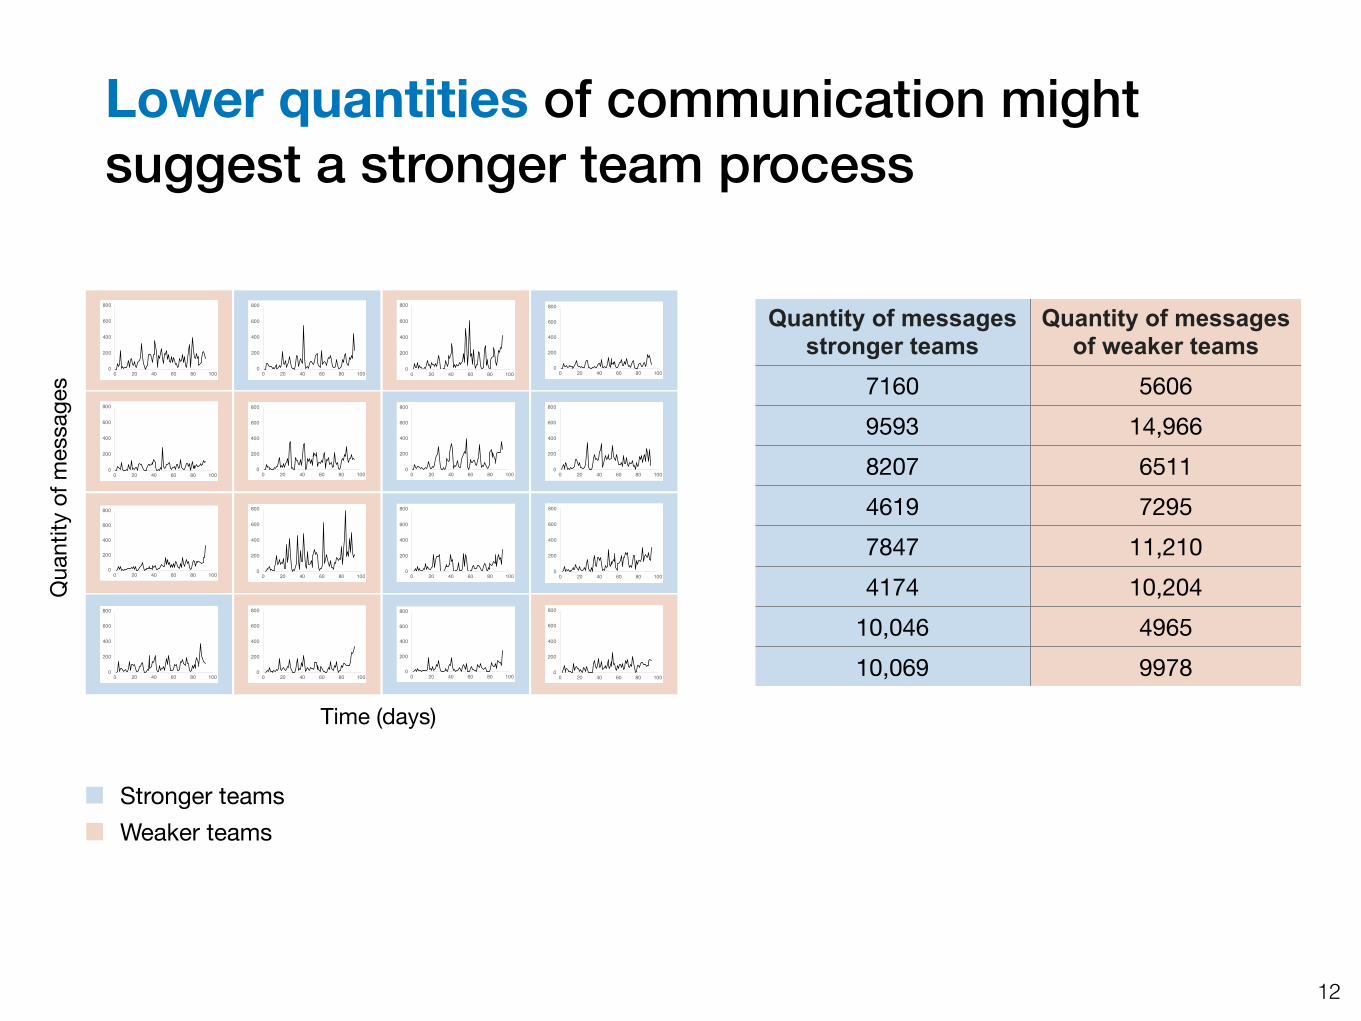
7160 56069593 14,9668207 65114619 72957847 11,2104174 10,204
10,046 496510,069 9978
Qua
ntity
of m
essa
ges
Time (days)
0
200
400
600
800
0 20 40 60 80 1000
200
400
600
800
0 20 40 60 80 1000
200
400
600
800
0 20 40 60 80 100
0
200
400
600
800
0 20 40 60 80 1000
200
400
600
800
0 20 40 60 80 1000
200
400
600
800
0 20 40 60 80 1000
200
400
600
800
0 20 40 60 80 100
0
200
400
600
800
0 20 40 60 80 1000
200
400
600
800
0 20 40 60 80 1000
200
400
600
800
0 20 40 60 80 1000
200
400
600
800
0 20 40 60 80 100
0
200
400
600
800
0 20 40 60 80 1000
200
400
600
800
0 20 40 60 80 1000
200
400
600
800
0 20 40 60 80 1000
200
400
600
800
0 20 40 60 80 100
0
200
400
600
800
0 20 40 60 80 100
Lower quantities of communication might suggest a stronger team process
Stronger teamsWeaker teams

13
Bootstrap resampling
1 2 3 4 5 6 7 8

14
Bootstrap resampling
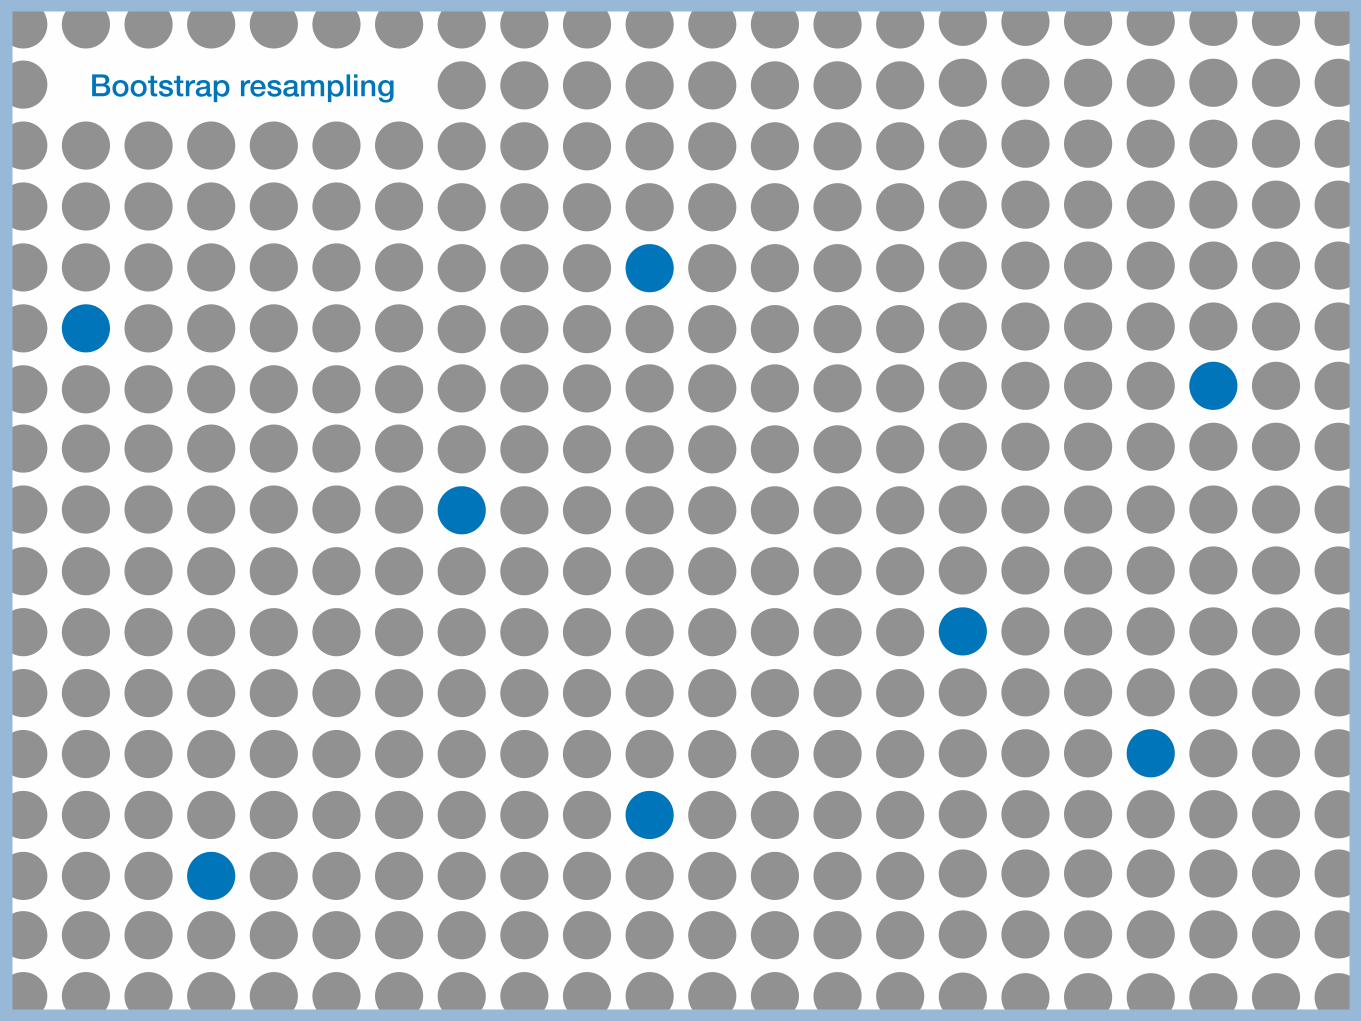
15
Bootstrap resampling

5000 6000 7000 8000 9000 10000 11000 12000 13000Quantity of messages
0
100
200
300
400
500
600StrongerWeaker
16
Bootstrap distributions of stronger and weaker teams’ quantity measurements
Occ
urre
nce
out o
f 10,
000
resa
mpl
es Stronger teamsWeaker teams
Mean quantity of messages sent by team (end of semester measurement)
One-tailed z-test showed that stronger teams had lower communication quantities
p-value of 0.21
Lower quantities of communication might suggest a stronger team process

17
σ of stronger teams σ of weaker teams
74 5782 14376 7757 5792 8745 11998 5082 87
Qua
ntity
of m
essa
ges
Time (days)
0
200
400
600
800
0 20 40 60 80 1000
200
400
600
800
0 20 40 60 80 1000
200
400
600
800
0 20 40 60 80 100
0
200
400
600
800
0 20 40 60 80 1000
200
400
600
800
0 20 40 60 80 1000
200
400
600
800
0 20 40 60 80 1000
200
400
600
800
0 20 40 60 80 100
0
200
400
600
800
0 20 40 60 80 1000
200
400
600
800
0 20 40 60 80 1000
200
400
600
800
0 20 40 60 80 1000
200
400
600
800
0 20 40 60 80 100
0
200
400
600
800
0 20 40 60 80 1000
200
400
600
800
0 20 40 60 80 1000
200
400
600
800
0 20 40 60 80 1000
200
400
600
800
0 20 40 60 80 100
0
200
400
600
800
0 20 40 60 80 100
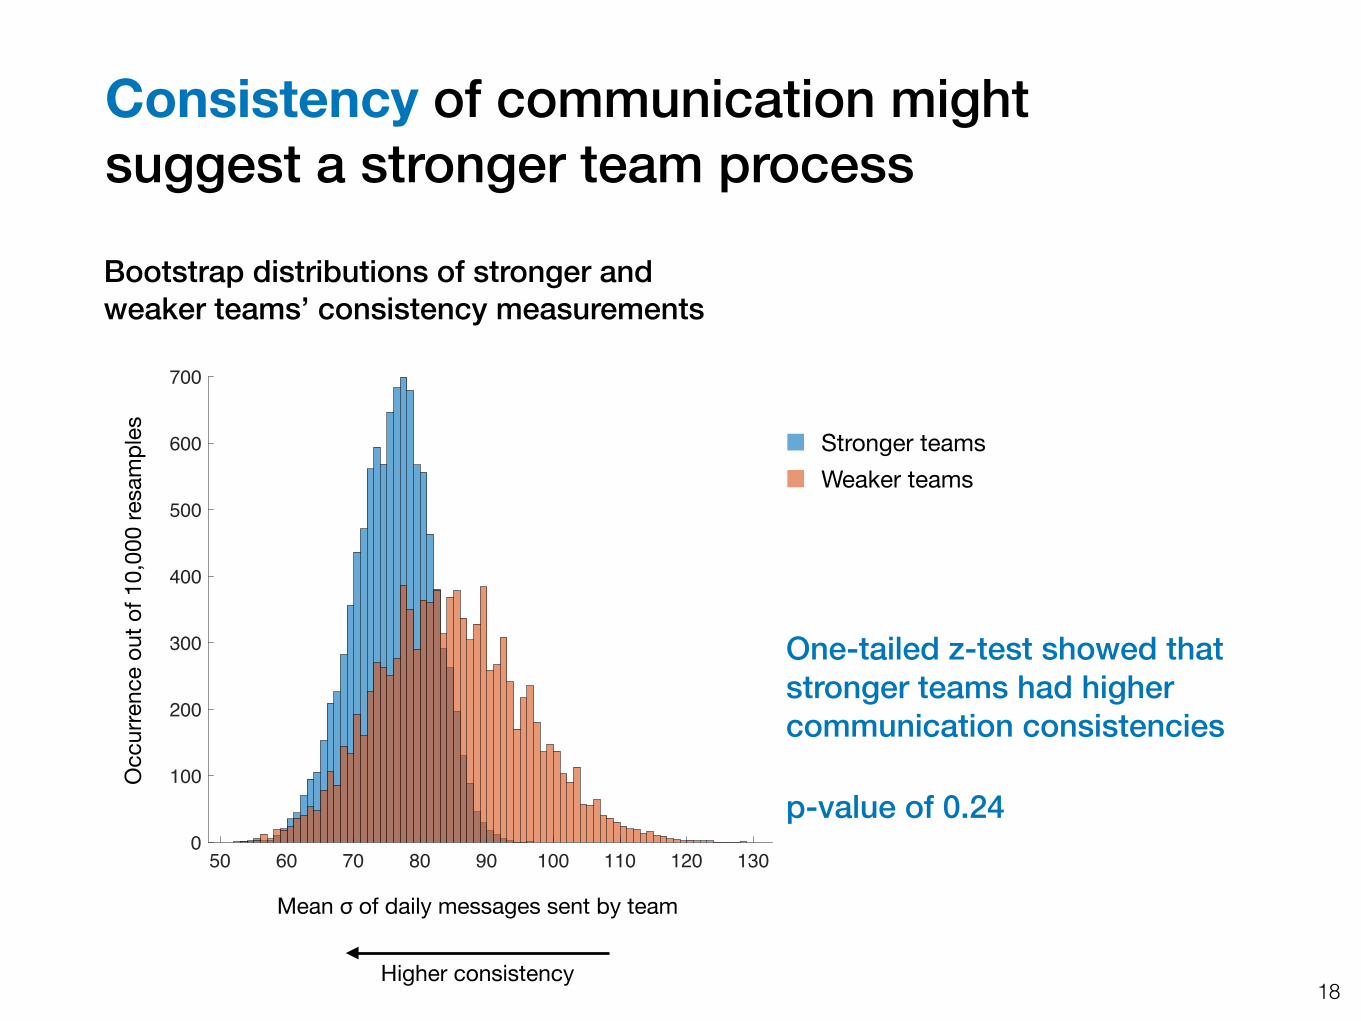
Consistency of communication might suggest a stronger team process
Consistency of communication might suggest a stronger team process
18
Bootstrap distributions of stronger and weaker teams’ consistency measurements
Occ
urre
nce
out o
f 10,
000
resa
mpl
es
50 60 70 80 90 100 110 120 130<----- Consistency <-----
0
100
200
300
400
500
600
700StrongerWeaker
Higher consistency
Stronger teamsWeaker teams
Mean σ of daily messages sent by team
One-tailed z-test showed that stronger teams had higher communication consistencies
p-value of 0.24
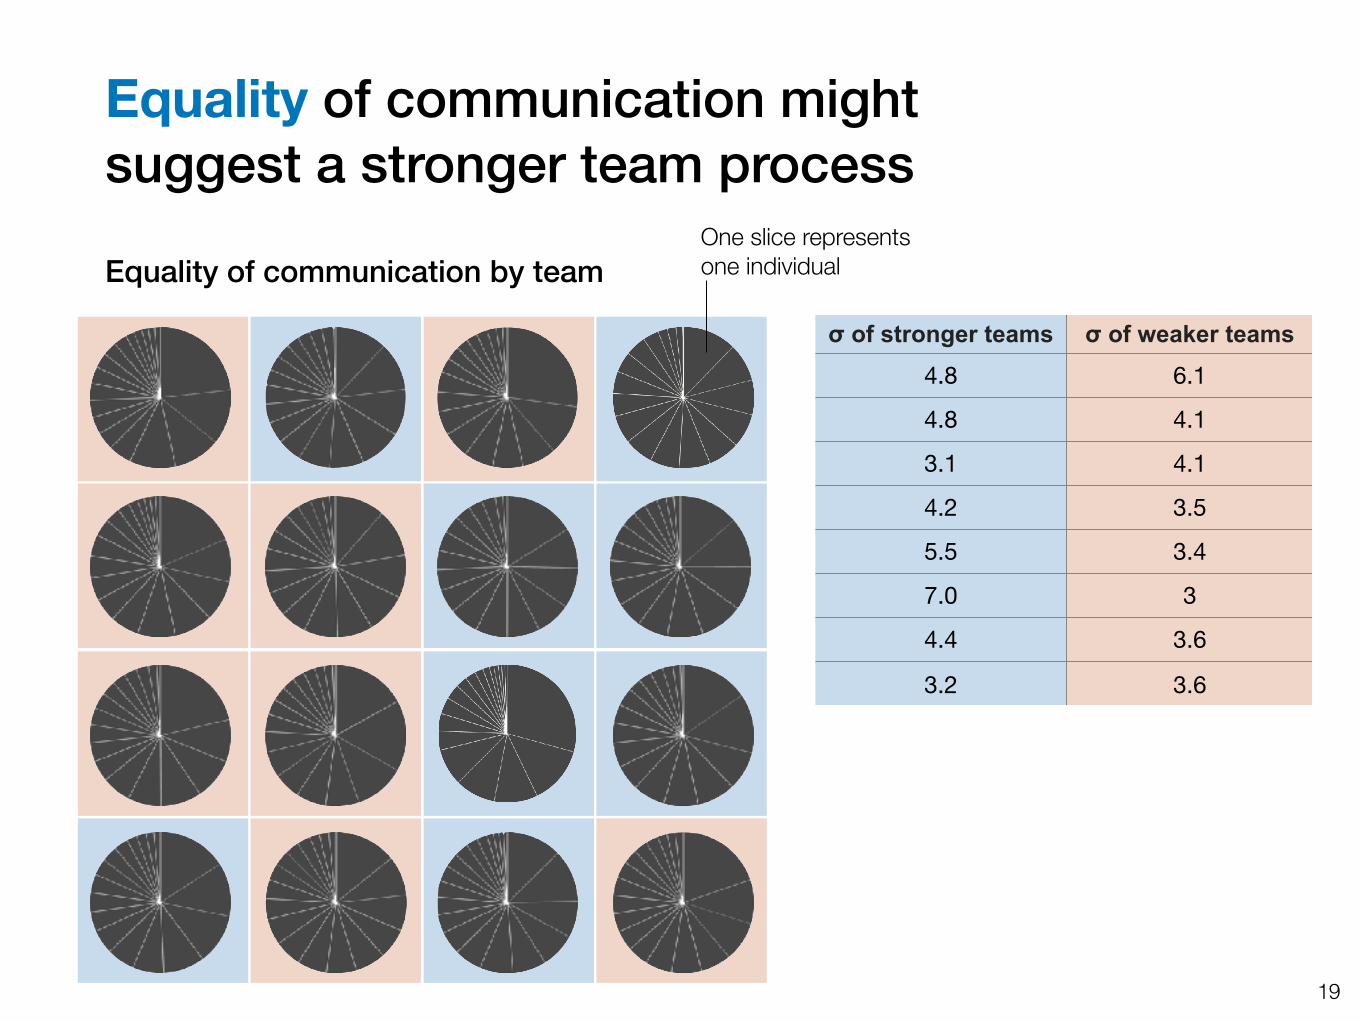
Equality of communication by team
Equality of communication might suggest a stronger team process
19
One slice represents one individual
σ of stronger teams σ of weaker teams
4.8 6.1
4.8 4.1
3.1 4.1
4.2 3.5
5.5 3.4
7.0 3
4.4 3.6
3.2 3.6
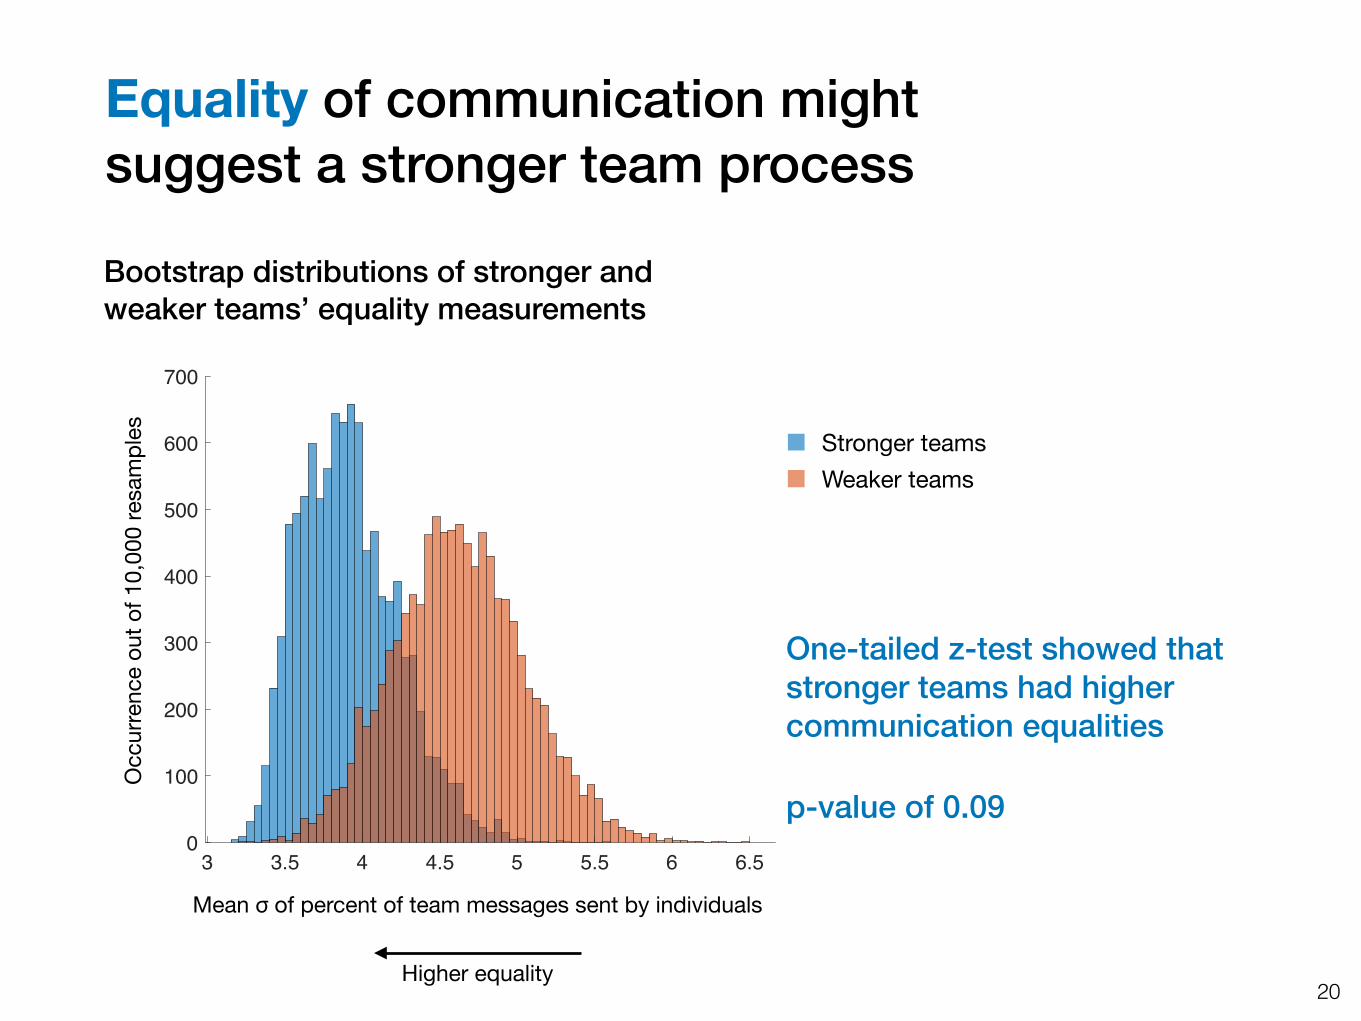
3 3.5 4 4.5 5 5.5 6 6.5 of percent of messages sent by individuals
0
100
200
300
400
500
600
700StrongerWeaker
20
Bootstrap distributions of stronger and weaker teams’ equality measurements
Occ
urre
nce
out o
f 10,
000
resa
mpl
es
Higher equality
Stronger teamsWeaker teams
Mean σ of percent of team messages sent by individuals
Equality of communication might suggest a stronger team process
One-tailed z-test showed that stronger teams had higher communication equalities
p-value of 0.09
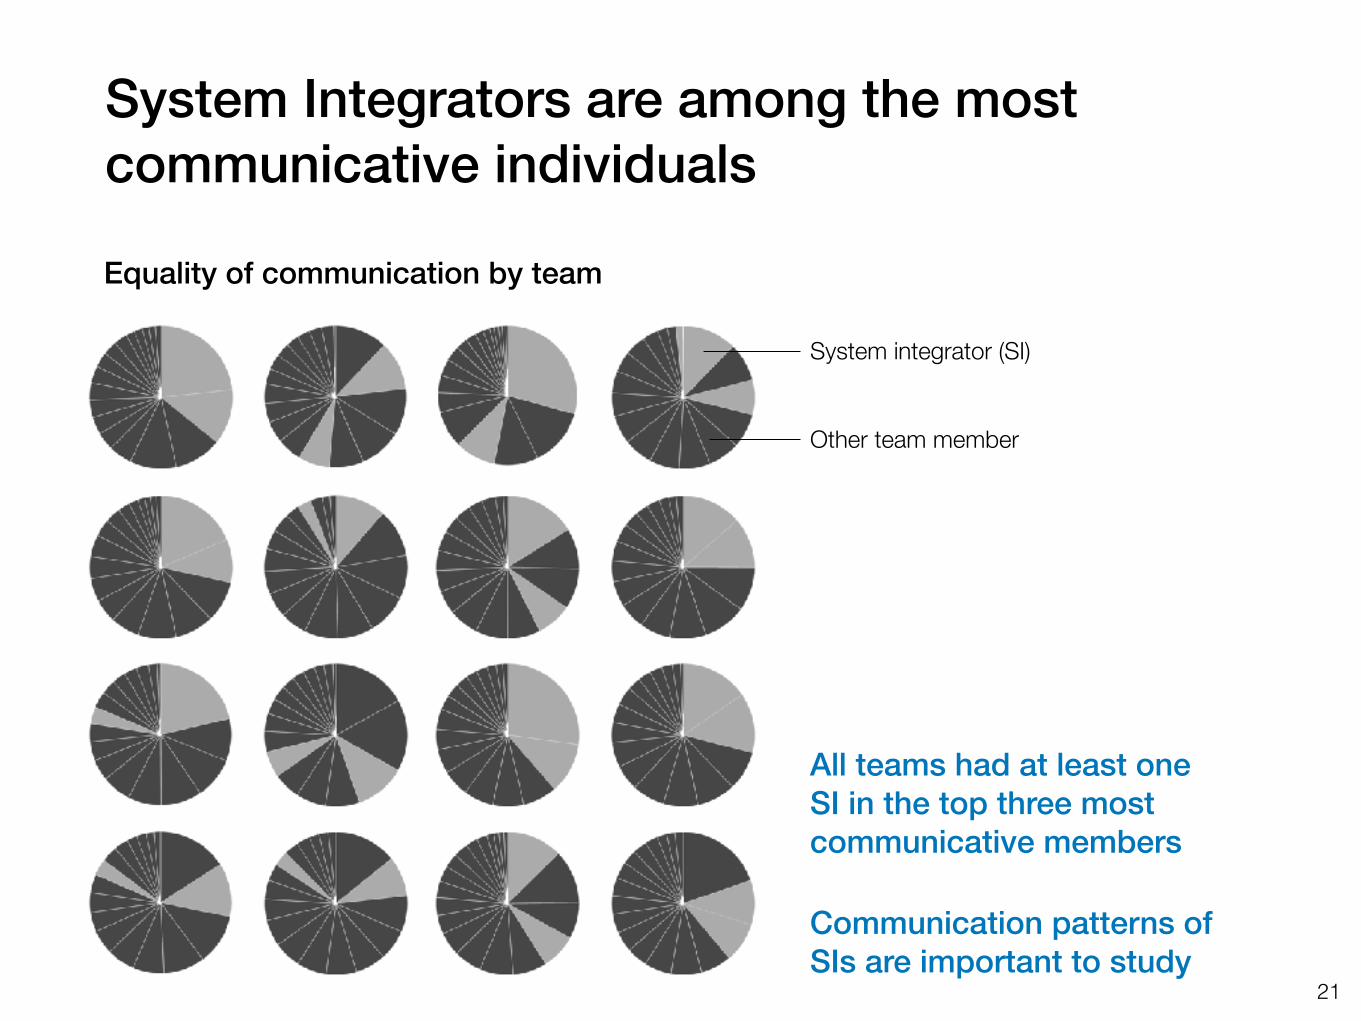
System Integrators are among the most communicative individuals
21
System integrator (SI)
Other team member
All teams had at least one SI in the top three most communicative members
Communication patterns of SIs are important to study
Equality of communication by team
Slack communication: Take-aways
Communication patterns were quite varied between teams
Quantity of communication isn’t necessarily an indicator of progress; low communication doesn’t always mean low project progress
Uniformity of communication is possibly a better indicator; teams with uniformity have tended to follow stronger design processes and have better outcomes

Now for four year’s worth of data!
Analysis of virtual communication within engineering design teams and its impact on team effectiveness. Lauren Adolphe, Georgia D. Van de Zande, David Wallace, Alison Olechowski

Now for four year’s worth of data!
Analysis of virtual communication within engineering design teams and its impact on team effectiveness. Lauren Adolphe, Georgia D. Van de Zande, David Wallace, Alison Olechowski

Now for four year’s worth of data!
Analysis of virtual communication within engineering design teams and its impact on team effectiveness. Lauren Adolphe, Georgia D. Van de Zande, David Wallace, Alison Olechowski

Other ways to communicate

+
Questions?