Team Collective Intelligence: Developing and testing a ... · Team Collective Intelligence:...
41
Team Collective Intelligence: Developing and testing a digital team intervention for knowledge integration Philip Runsten a b Andreas Werr a b a Stockholm School of Economics, Department of Management and Organization b Stockholm School of Economics Institute for Research SSE Working Paper Series in Business Administration No. 2020:3
Transcript of Team Collective Intelligence: Developing and testing a ... · Team Collective Intelligence:...
Team Collective Intelligence: Developing and testing a digital team intervention for knowledge integration
Philip Runsten a b Andreas Werr a b
a Stockholm School of Economics, Department of Management and Organization
b Stockholm School of Economics Institute for Research
SSE Working Paper Series in Business Administration No. 2020:3

0 / 39
Team Collective Intelligence:
Developing and testing a digital team
intervention for knowledge integration
Philip Runsten & Andreas Werr
Stockholm School of Economics Institute for Research,
Collective Intelligence Labs
SSE Working Paper Series in Business Administration
No 2020:3
May 20, 2020

1 / 39
TABLE OF CONTENTS
2 / 39
ABSTRACT

3 / 39
ACKNOWLEDGEMENTS

4 / 39
BACKGROUND
ORGANIZATIONAL INTELLIGENCE
THROUGH TEAM INTELLIGENCE
1 We will use the term teams here, although work life today often consists of people cooperating, regularly without necessarily
defining themselves as teams. For them, maybe a more accurate term would be group or micro-system. Our interest is
cooperation at group level, between people with different knowledge and skills, but who have a common task. It could be for
example work or management teams. They need to meet and communicate directly in order to share ideas, interpretations
and knowledge, as well as decide on how to divide work tasks. Micro-system has been used as a term, primarily within health
care research, and allows for less permanent and loose constellations of people working together, solving problems, making
decisions, and dividing work between them. This would therefore be a more accurate term, but we believe that the problems
and concepts that we discuss here will be easier to relate to and reflect upon if we use the more commonly known term of
teams.

5 / 39
2 A nominal group is the same number of people, but who does not cooperate.
3 Team training is team members using tools and methods to become aware of, learn about, and practice requisite team
competencies and performance processes while receiving feedback on their performance. Team building is intervening in the
process of a specific team for improving interpersonal relations, social interactions, goal setting, role setting etc.
THE CASE FOR DEVELOPING A DIGITAL
TEAM INTERVENTION

6 / 39
•
•
•
.
•

7 / 39
SUPPORTING TEAM
KNOWLEDGE INTEGRATION;
THE CONCEPT OF TEAM
DEBRIEFS
SELF-GUIDING DEBRIEFS

8 / 39
DEVELOPING THE
INTERVENTION
AN EXPERT MODEL OF KNOWLEDGE
INTEGRATION
4 For an extensive theoretical background to the model, see Team collective intelligence report 1, Runsten & Werr, 2020

9 / 39
•
•
•
•
10 / 39
DEVELOPING THE DEBRIEF
INTERVENTION
•
•
•
•
•

11 / 39
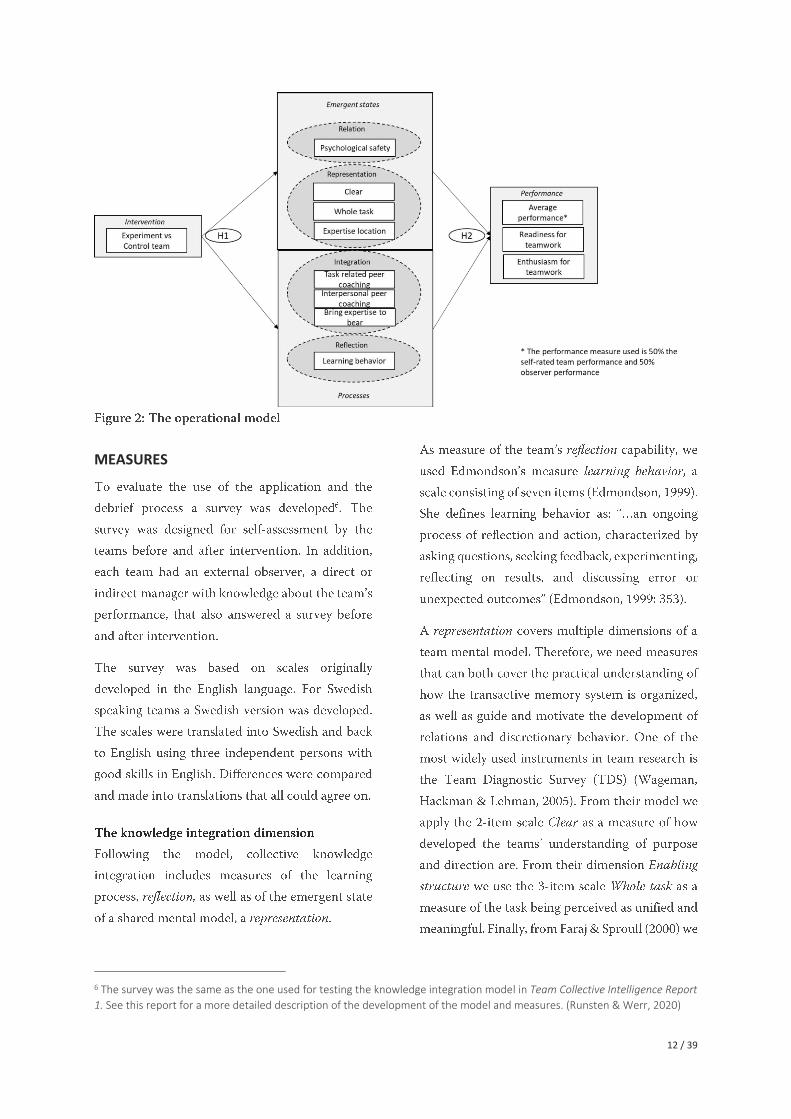
HYPOTHESES
5 The model was developed and tested in Team Collective Intelligence: Developing and testing a model (Runsten & Werr, 2020).
See this report for a more detailed description of the development of the model.
RESEARCH DESIGN
12 / 39
MEASURES
6 The survey was the same as the one used for testing the knowledge integration model in Team Collective Intelligence Report
1. See this report for a more detailed description of the development of the model and measures. (Runsten & Werr, 2020)
13 / 39

14 / 39
THE SAMPLE
-
-
-
-
-
Public Private
# Organizations 22 8 14
Swedish 8 10
International 0 4
Response rate Female Male Not stated
# Control teams 21
# Respondents 155 52,45% 41,96% 5,59%
Responses measure 1 143 92%
Responses measure 2 149 96%
# Observers 21 61,90% 38,10% 0,00%
Responses measure 1 16 76%
Responses measure 2 19 90%
# Experiment teams 50
# Respondents 356 50,58% 46,78% 2,63%
Responses measure 1 348 98%
Responses measure 2 305 86%
# Observers 50 60,00% 40,00% 0,00%
Responses measure 1 44 88%
Responses measure 2 43 86%

15 / 39
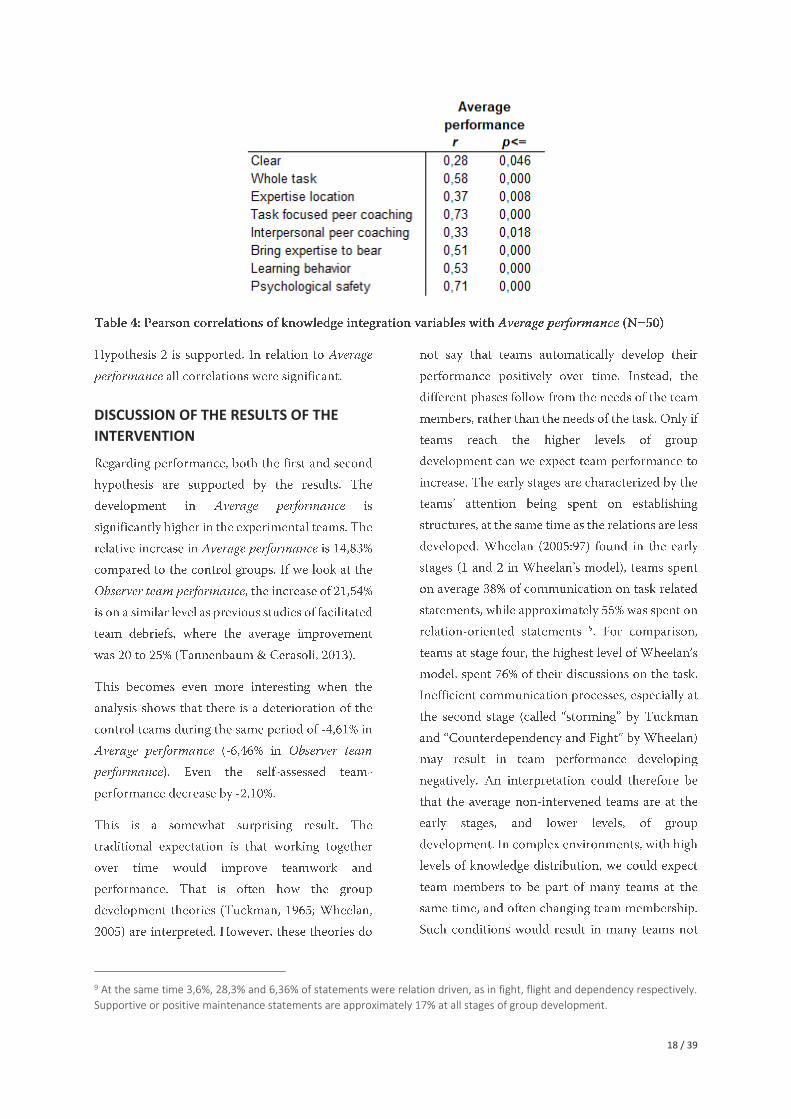
RESULTS
DOES THE INTERVENTION WORK?
7 In total there were 120 points of measures. Twice for the 30 experimental teams, and three times for the 20 control teams.
-
-
-
-
-
-
-
-
-
-
-

16 / 39
Clear Whole task
Expertise
locaction
Task
focused
peer
coaching
Interpers-
onal peer
coaching
Bring
expertise
to bear
Learning
behavior
Psycho-
logical
safety
Average
perform-
ance
Team
perform-
ance
Observer
team
perform-
ance
Experiment
teams
(N=50)
M 5,00 5,75 5,02 5,11 5,14 5,85 4,34 5,64 5,13 5,33 4,89
SD 0,87 0,50 0,55 0,66 0,65 0,51 0,52 0,54 0,58 0,55 0,84
Control
teams
(N=21)
M 4,78 5,70 4,97 4,87 4,93 5,73 4,26 5,60 5,22 5,32 5,01
SD 0,90 0,59 0,54 0,70 0,64 0,56 0,63 0,50 0,42 0,46 0,61
Diff.Before
Exp - ContM 0,21 0,05 0,05 0,24 0,20 0,12 0,08 0,04 -0,09 0,01 -0,12
diff % 4,45% 0,94% 0,91% 4,85% 4,15% 2,10% 1,80% 0,70% -1,74% 0,15% -2,43%
F (1,69) 0,87 0,15 0,10 1,83 1,47 0,78 0,28 0,08 0,43 0,00 0,281
p 0,354 0,699 0,751 0,180 0,229 0,379 0,597 0,775 0,515 0,954 0,599
Experiment
teams
(N=50)
M 5,31 5,84 5,47 5,55 5,47 5,88 4,72 5,88 5,62 5,69 5,56
SD 0,93 0,55 0,54 0,60 0,66 0,59 0,63 0,51 0,51 0,51 0,76
Control
teams
(N=21)
M 4,79 5,62 4,94 5,04 5,10 5,74 4,23 5,51 4,98 5,21 4,68
SD 0,80 0,51 0,56 0,77 0,70 0,58 0,58 0,55 0,53 0,54 0,80
Diff. After
Exp - ContM 0,52 0,22 0,52 0,51 0,37 0,14 0,49 0,37 0,64 0,48 0,87
diff % 10,79% 3,83% 10,61% 10,22% 7,17% 2,41% 11,61% 6,63% 12,83% 9,12% 18,59%
F (1,69) 4,96 2,35 13,68 9,11 4,41 0,82 9,29 7,13 22,87 12,27 16,862
p 0,029 0,130 0,000 0,004 0,039 0,370 0,003 0,009 0,000 0,001 0,000
Difference
Exp after -
Exp before
M 0,31 0,09 0,45 0,44 0,33 0,03 0,38 0,24 0,49 0,36 0,67
diff % 6,26% 1,52% 8,95% 8,62% 6,39% 0,44% 8,88% 4,23% 9,54% 6,66% 13,69%
F (1,69) 3,03 0,69 16,88 12,18 6,26 0,06 11,03 5,15 10,39 11,17 15,15
p 0,085 0,410 0,000 0,001 0,014 0,815 0,001 0,025 0,000 0,001 0,000
Difference
Cont after -
Cont before
M 0,01 -0,07 -0,03 0,16 0,17 0,01 -0,03 -0,09 -0,24 -0,11 -0,32
diff % 0,18% -1,30% -0,61% 3,32% 3,39% 0,14% -0,70% -1,57% -4,61% -2,10% -6,46%
F (1,40) 0,01 0,19 0,03 0,51 0,66 0,00 0,03 0,29 2,65 0,52 1,693
p 0,974 0,667 0,859 0,481 0,422 0,964 0,876 0,591 0,111 0,476 0,193
Difference
Expdelta -
Contdelta
M 0,30 0,16 0,48 0,28 0,16 0,02 0,41 0,33 0,73 0,47 0,99
diff % 6,06% 2,86% 9,61% 5,12% 2,90% 0,30% 9,64% 5,89% 14,83% 8,96% 21,54%5
F (1,69) 2,12 2,70 20,56 4,25 1,05 0,03 12,02 9,24 28,27 17,95 13,294
p 0,150 0,105 0,000 0,043 0,310 0,870 0,001 0,003 0,000 0,000 0,0011F(1,58)
2F(1,60)
3F(1,33)
Before intervention
Relative development
4F(1,52) Calculated using only teams with observer assessment both before and after intervention.
5 Calculated using the mean of all observer assessments before and after intervention.
Development within each group
After intervention

17 / 39
8 The values are calculated using the mean values of the groups before and after intervention. Some of the teams did not have
observer assessment for both measurements (6 control and 11 experiment teams). We also calculated the observer
assessment means and differences using only teams having values at both measurements. Then the control teams decreased
their performance with 3,58%, while the experiment teams had an increase of 11,7% during the same period, giving a relative
difference of 15,53%.
-
-
-
-
-
-
-
-
-
-
-
-
-
IS IT THE IMPROVED KNOWLEDGE
INTEGRATION THAT DRIVES
PERFORMANCE INCREASES?
18 / 39
DISCUSSION OF THE RESULTS OF THE
INTERVENTION
9 At the same time 3,6%, 28,3% and 6,36% of statements were relation driven, as in fight, flight and dependency respectively.
Supportive or positive maintenance statements are approximately 17% at all stages of group development.
19 / 39
WHICH TEAMS DEVELOP – AND WHICH
DON’T?
HOW DO THE TEAMS DEVELOP IN
PERFORMANCE?
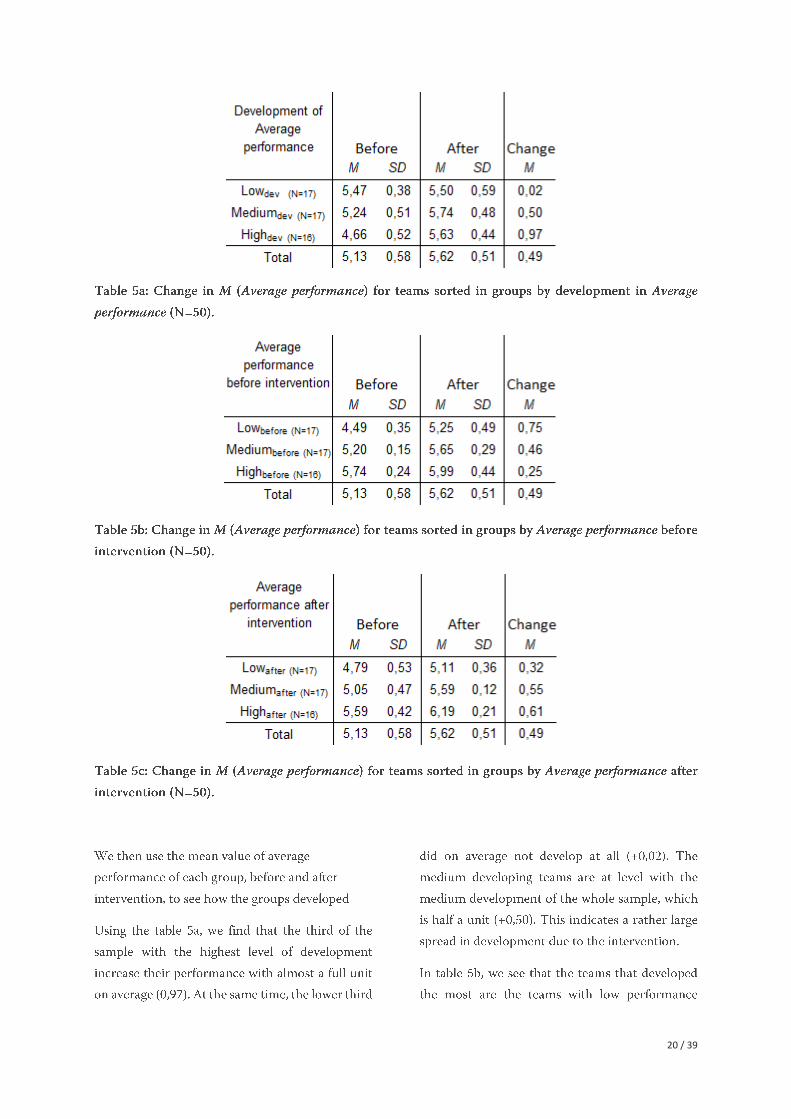
20 / 39

21 / 39
10 We compare the three groups and use an ANOVA to see where the means are significantly different. Controlling the sample
size for each group, it needs to be at least 14 teams (13,9) for this ANOVA, with a Power level of 80%, Effect size of 0,5 and
significance level of 5%. The number of each group were 16, 17 and 17 teams.
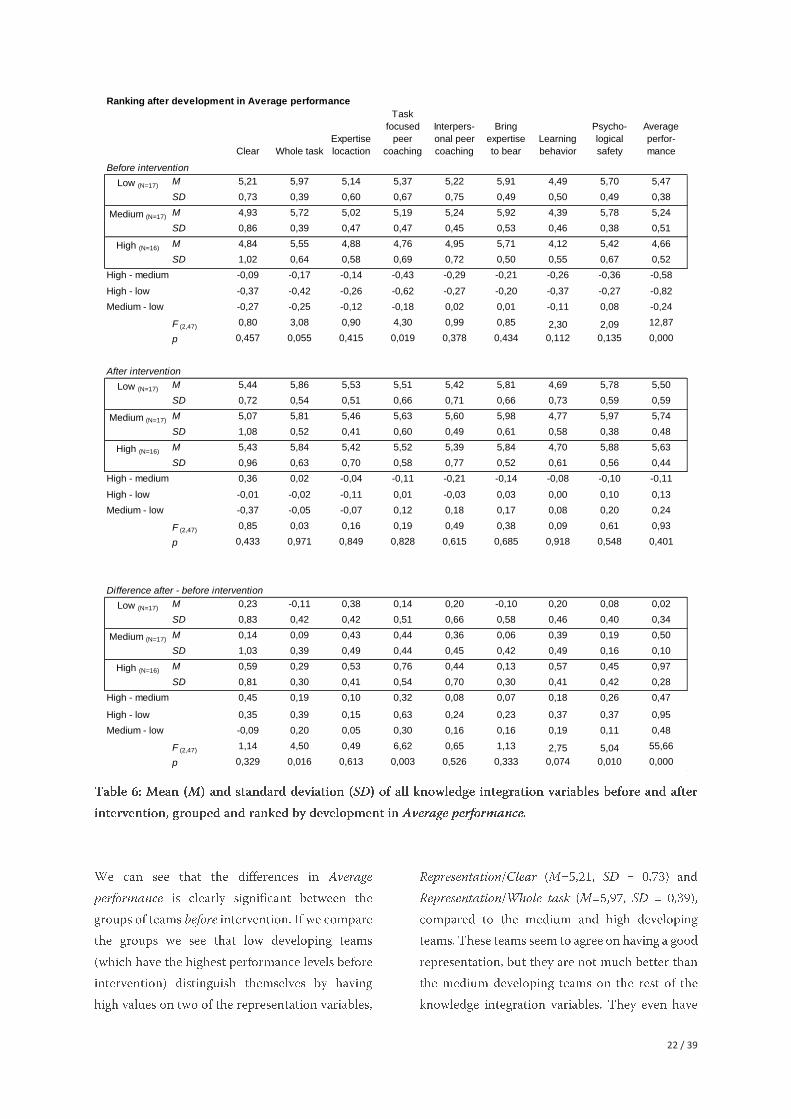
HOW DO THE DIFFERENT GROUPS OF
TEAMS DEVELOP THEIR KNOWLEDGE
INTEGRATION VARIABLES?
22 / 39
Clear Whole task
Expertise
locaction
Task
focused
peer
coaching
Interpers-
onal peer
coaching
Bring
expertise
to bear
Learning
behavior
Psycho-
logical
safety
Average
perfor-
mance
Before intervention
Low (N=17)M 5,21 5,97 5,14 5,37 5,22 5,91 4,49 5,70 5,47
SD 0,73 0,39 0,60 0,67 0,75 0,49 0,50 0,49 0,38
Medium (N=17)M 4,93 5,72 5,02 5,19 5,24 5,92 4,39 5,78 5,24
SD 0,86 0,39 0,47 0,47 0,45 0,53 0,46 0,38 0,51
High (N=16)M 4,84 5,55 4,88 4,76 4,95 5,71 4,12 5,42 4,66
SD 1,02 0,64 0,58 0,69 0,72 0,50 0,55 0,67 0,52
High - medium -0,09 -0,17 -0,14 -0,43 -0,29 -0,21 -0,26 -0,36 -0,58
High - low -0,37 -0,42 -0,26 -0,62 -0,27 -0,20 -0,37 -0,27 -0,82
Medium - low -0,27 -0,25 -0,12 -0,18 0,02 0,01 -0,11 0,08 -0,24
F (2,47)0,80 3,08 0,90 4,30 0,99 0,85 2,30 2,09 12,87
p 0,457 0,055 0,415 0,019 0,378 0,434 0,112 0,135 0,000
After intervention
Low (N=17)M 5,44 5,86 5,53 5,51 5,42 5,81 4,69 5,78 5,50
SD 0,72 0,54 0,51 0,66 0,71 0,66 0,73 0,59 0,59
Medium (N=17)M 5,07 5,81 5,46 5,63 5,60 5,98 4,77 5,97 5,74
SD 1,08 0,52 0,41 0,60 0,49 0,61 0,58 0,38 0,48
High (N=16)M 5,43 5,84 5,42 5,52 5,39 5,84 4,70 5,88 5,63
SD 0,96 0,63 0,70 0,58 0,77 0,52 0,61 0,56 0,44
High - medium 0,36 0,02 -0,04 -0,11 -0,21 -0,14 -0,08 -0,10 -0,11
High - low -0,01 -0,02 -0,11 0,01 -0,03 0,03 0,00 0,10 0,13
Medium - low -0,37 -0,05 -0,07 0,12 0,18 0,17 0,08 0,20 0,24
F (2,47)0,85 0,03 0,16 0,19 0,49 0,38 0,09 0,61 0,93
p 0,433 0,971 0,849 0,828 0,615 0,685 0,918 0,548 0,401
Difference after - before intervention
Low (N=17)M 0,23 -0,11 0,38 0,14 0,20 -0,10 0,20 0,08 0,02
SD 0,83 0,42 0,42 0,51 0,66 0,58 0,46 0,40 0,34
Medium (N=17)M 0,14 0,09 0,43 0,44 0,36 0,06 0,39 0,19 0,50
SD 1,03 0,39 0,49 0,44 0,45 0,42 0,49 0,16 0,10
High (N=16)M 0,59 0,29 0,53 0,76 0,44 0,13 0,57 0,45 0,97
SD 0,81 0,30 0,41 0,54 0,70 0,30 0,41 0,42 0,28
High - medium 0,45 0,19 0,10 0,32 0,08 0,07 0,18 0,26 0,47
High - low 0,35 0,39 0,15 0,63 0,24 0,23 0,37 0,37 0,95
Medium - low -0,09 0,20 0,05 0,30 0,16 0,16 0,19 0,11 0,48
F (2,47)1,14 4,50 0,49 6,62 0,65 1,13 2,75 5,04 55,66
p 0,329 0,016 0,613 0,003 0,526 0,333 0,074 0,010 0,000
Ranking after development in Average performance
23 / 39
11 The items of this measure that were the most influenced by the intervention are: Members of this team take initiatives to
promote high shared motivation and commitment; Members of this team take initiatives to make sure the team develops and
uses the best possible approach to its work.; Members of this team take individual initiatives to help build the team, and use
team members knowledge and skills well.
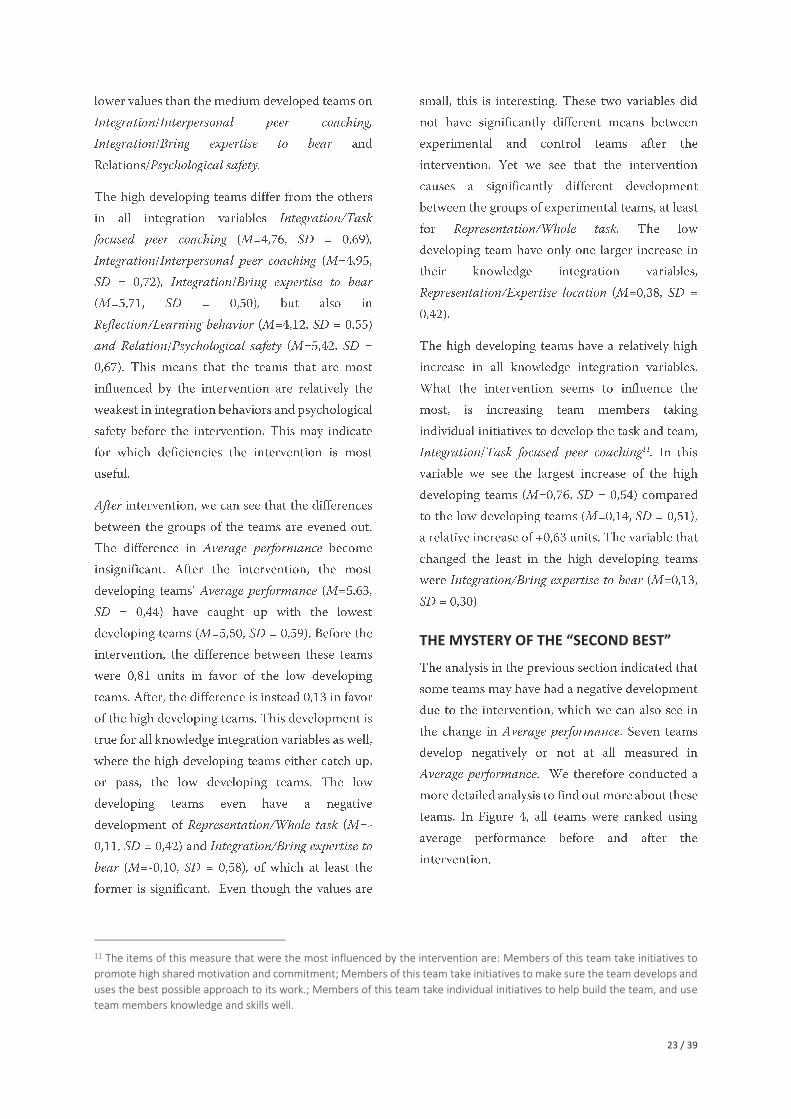
THE MYSTERY OF THE “SECOND BEST”
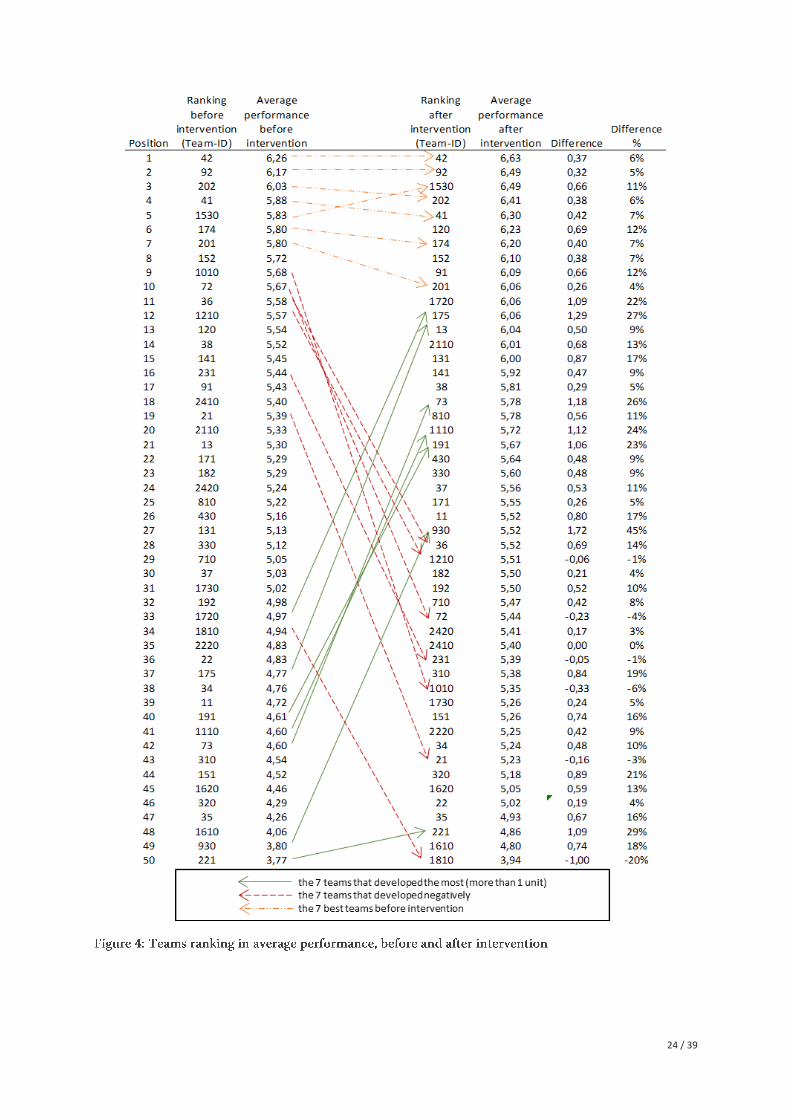
24 / 39

25 / 39
12 With the exception of team 1810 that is an outlier in relation to the other “second best” teams and is found at number 34
on the list of performance before intervention.

26 / 39
Clear Whole task
Expertise
locaction
Task
focused
peer
coaching
Interpers-
onal peer
coaching
Bring
expertise
to bear
Learning
behavior
Psycho-
logical
safety
Average
perfor-
mance
Before intervention
Best (N=7)M 5,68 6,15 5,40 5,70 5,54 6,36 4,67 6,05 5,97
SD 0,51 0,23 0,65 0,34 0,48 0,23 0,38 0,17 0,19
Second best (N=7)M 5,20 5,88 5,11 5,32 5,17 5,74 4,44 5,53 5,47
SD 0,63 0,26 0,64 0,78 0,96 0,48 0,58 0,59 0,26
Rest (N=7)M 5,49 5,94 5,24 5,31 5,24 6,07 4,60 5,87 5,48
SD 0,55 0,30 0,45 0,62 0,54 0,38 0,46 0,30 0,13
Second best -
Best
-0,48 -0,27 -0,29 -0,37 -0,36 -0,62 -0,23 -0,52 -0,50
Second best -
Rest
-0,29 -0,07 -0,13 0,01 -0,06 -0,33 -0,16 -0,34 -0,02
F (2,47)1,27 2,00 0,44 0,91 0,54 4,73 0,41 3,11 14,52
p 0,305 0,165 0,650 0,421 0,591 0,022 0,673 0,069 0,000
After intervention
Best (N=7)M 5,65 6,15 5,83 6,12 5,78 6,35 5,37 6,29 6,37
SD 0,74 0,49 0,48 0,23 0,27 0,19 0,37 0,14 0,19
Second best (N=7)M 5,06 5,57 5,20 5,15 5,18 5,26 4,42 5,35 5,20
SD 0,80 0,55 0,37 0,50 0,57 0,59 0,60 0,50 0,56
Rest (N=7)M 5,88 6,15 5,67 5,87 5,71 6,07 4,96 6,09 5,94
SD 0,63 0,29 0,44 0,47 0,97 0,37 0,50 0,48 0,27
Second best -
Best
-0,59 -0,57 -0,63 -0,97 -0,60 -1,09 -0,95 -0,95 -1,17
Second best -
Rest
-0,82 -0,57 -0,47 -0,72 -0,53 -0,81 -0,54 -0,74 -0,74
F (2,47)2,38 3,69 4,06 10,21 1,69 12,87 6,29 10,30 17,16
p 0,121 0,045 0,035 0,001 0,213 0,000 .008 0,001 0,000
Difference after - before intervention
Best (N=7)M -0,03 0,00 0,43 0,43 0,24 0,00 0,70 0,25 0,40
SD 0,48 0,29 0,40 0,17 0,42 0,20 0,15 0,16 0,12
Second best (N=7)M -0,14 -0,30 0,09 -0,17 0,01 -0,48 -0,02 -0,18 -0,27
SD 0,95 0,45 0,36 0,55 0,79 0,60 0,34 0,44 0,34
Rest (N=7)M 0,39 0,20 0,43 0,56 0,47 0,00 0,36 0,22 0,45
SD 0,56 0,34 0,26 0,32 0,80 0,17 0,54 0,25 0,25
Second best -
Best
-0,12 -0,30 -0,34 -0,60 -0,23 -0,48 -0,72 -0,43 -0,67
Second best -
Rest
-0,54 -0,51 -0,34 -0,73 -0,46 -0,48 -0,38 -0,40 -0,72
F (2,47)1,16 3,39 2,24 7,50 0,77 3,70 6,44 4,38 17,64
p 0,337 0,056 0,136 0,004 0,476 0,045 0,008 0,028 0,000
Ranked in top 7 teams before intervention (Best), 7 lowest developed teams during intervention (Second best) and 7
remaining teams of top 21 before intervention (Rest)

27 / 39
-
-
-
-
-
-
-
-
-

28 / 39
DISCUSSION FROM COMPARING GROUPS
OF TEAMS
29 / 39
30 / 39
-
-
-
SUMMARY AND
DISCUSSION

31 / 39

32 / 39
REFERENCES

33 / 39

34 / 39

35 / 39
36 / 39

37 / 39
APPENDIX A: CONFIRMING
THE STATISTICAL MODEL
AND MEASURES
VALIDITY
CONVERGENT VALIDITY
DISCRIMINANT VALIDITY
•
•
Scale EV
Cronbach's
alpha
Bounded 0,65 0,66Interdependent 0,60 0,65
Stable 0,85 0,82
Expertise needed 0,82 0,89
Clear 0,77 0,70
Whole task 0,54 0,51
Expertise location 0,61 0,77Task-focused peer
coaching 0,77 0,85Interpersonal peer
coaching N/A N/A
Bring expertise to
bear 0,58 0,74
Learning behavior 0,46 0,79
Psychological safety 0,43 0,77
Team performance 0,43 0,80
Emotional
Intelligence * 0,84
* The scale did not load on one factor

38 / 39
• VERIFYING THE MEASURES AS GROUP
CONCEPTS

39 / 39
13 ICC is here calculated as: (average squared variance between groups – average squared variance within groups)/(average squared variance between groups + (n-1) * average squared variance within groups). Where N is the average number of cases (participants) per group. In this case N is 341/50. ICC is large and positive when there is no variation within the groups, but large variation between groups.
TEST OF COMMON-METHOD-BIAS
NOMOLOGIC AND PRACTICAL VALIDITY
Sum of
Squares df
Mean
Square F (50,341) Sig. (p ) ICC
bounded Between
Groups
75,055 49 1,532 1,711 0,00 0,083
Within
Groups
260,453 291 0,895
Total 335,509 340
inter-
dependent
Between
Groups
142,579 49 2,910 3,031 0,00 0,206
Within
Groups
279,388 291 0,960
Total 421,967 340
stable Between
Groups
324,665 49 6,626 4,972 0,00 0,337
Within
Groups
387,762 291 1,333
Total 712,427 340
Expertise
needed
Between
Groups
176,956 49 3,611 2,050 0,00 0,118
Within
Groups
512,734 291 1,762
Total 689,690 340
Emotional
intelligence
Between
Groups
16,557 49 0,338 1,252 0,13 0,031
Within
Groups
78,510 291 0,270
Total 95,068 340
Clear Between
Groups
257,793 49 5,261 3,792 0,00 0,263
Within
Groups
403,693 291 1,387
Total 661,485 340
Whole task Between
Groups
86,803 49 1,771 3,640 0,00 0,252
Within
Groups
141,636 291 0,487
Total 228,440 340
Expertise
location
Between
Groups
95,679 49 1,953 2,287 0,00 0,141
Within
Groups
248,456 291 0,854
Total 344,135 340
Task focused
peer coaching
Between
Groups
128,724 49 2,627 2,614 0,00 0,171
Within
Groups
292,472 291 1,005
Total 421,196 340
Interpersonal
peer coaching
Between
Groups
124,057 49 2,532 1,964 0,00 0,110
Within
Groups
375,110 291 1,289
Total 499,167 340
Bring expertise
to bear
Between
Groups
78,436 49 1,601 2,544 0,00 0,165
Within
Groups
183,079 291 0,629
Total 261,515 340
Learning
behavior
Between
Groups
91,512 49 1,868 2,266 0,00 0,139
Within
Groups
239,879 291 0,824
Total 331,391 340
Psychogogical
safety
Between
Groups
77,611 49 1,584 3,194 0,00 0,219
Within
Groups
144,312 291 0,496
Total 221,923 340
Team
performance
Between
Groups
85,554 49 1,746 4,032 0,00 0,279
Within
Groups
126,019 291 0,433
Total 211,573 340
Observer team
performance
Between
Groups
180,393 40 4,510 N/A
Within
Groups
0,000 239 0,000
Total 180,393 279


![Collective intelligence - esalq.usp.br€¦ · Contents [hide] 1 Collective intelligence as a property of the living 2 Collective intelligence as a research field 3 Collective intelligence](https://static.fdocuments.in/doc/165x107/5b98bbed09d3f2ef798c9bc3/collective-intelligence-esalquspbr-contents-hide-1-collective-intelligence.jpg)