Teaching the Structural Nature of Biological Molecules ... · biochemistry and cell biology...
14
CHEMISTRY EDUCATION: RESEARCH AND PRACTICE IN EUROPE 2001, Vol. 2, No. 2, pp. 109-122 INVITED THEME ISSUE: Structural concepts Contribution from science and science education David R. CANNING 1 and James R. COX 2 1 Department of Biological Sciences, Murray State University 2 Department of Chemistry, Murray State University TEACHING THE STRUCTURAL NATURE OF BIOLOGICAL MOLECULES: MOLECULAR VISUALIZATION IN THE CLASSROOM AND IN THE HANDS OF STUDENTS Received 1 February 2001 ABSTRACT: The use of molecular visualization software has made a tremendous impact in the biochemistry and cell biology classroom. Instructors no longer have to rely on static images in textbooks to teach the structural nature of biological molecules. The emergence of many different molecular graphics programs and technology-based classrooms has enhanced the ability of instructors to teach structural concepts such as noncovalent interactions and levels of organization in proteins. Many web-based tutorials are also available for instructors to use during lecture or for students to explore outside of the classroom. Students can also obtain hands-on experience with the graphics programs to explore the structural aspects of macromolecular systems. This report shows that students involved in visualization projects become skilled at identifying various structural motifs they have discussed in class or are discovering for the first time. This student-centered approach enhances the ability of students to comprehend structural concepts and to realize the importance of weak interactions in the structure of large molecules. [Chem. Educ. Res. Pract. Eur.: 2001, 2, 109-122] KEY WORDS: biochemistry; cell biology; molecular visualization; intermolecular forces INTRODUCTION In the teaching of life science, the interface between biology and chemistry is at the level of the biomolecular organization of the cell. Students of biological chemistry approach the interface by attempting to understand biomolecular interactions creating cell function, whereas biology students view the same interface as the ultimate dissection of the organism. Central to both of these viewpoints is biomolecular structure as related to function. Teaching the subtle aspects of the three-dimensional structure and dynamics of biological molecules to undergraduates is a daunting challenge. At the introductory level, instructors may be confronted with students who have very diverse backgrounds in biological chemistry. Basic structural concepts need to be taught before the class can be taken to the next level of understanding. In more advanced classes, students necessarily have different perspectives on what they think they need to know about biomolecular structures, largely dependent on their own curricular specializations. In the more biochemical-orientated courses, focus tends to be on the structural anatomy of biomolecules and how this relates to functional chemical interactions. On the other hand, cell biology-orientated courses seek an overall understanding
-
Upload
nguyenminh -
Category
Documents
-
view
215 -
download
0
Transcript of Teaching the Structural Nature of Biological Molecules ... · biochemistry and cell biology...

CHEMISTRY EDUCATION: RESEARCH AND PRACTICE IN EUROPE 2001, Vol. 2, No. 2, pp. 109-122
INVITED THEME ISSUE: Structural concepts Contribution from science and science education
David R. CANNING1 and James R. COX2 1 Department of Biological Sciences, Murray State University 2 Department of Chemistry, Murray State University
TEACHING THE STRUCTURAL NATURE OF BIOLOGICAL MOLECULES: MOLECULAR VISUALIZATION IN THE
CLASSROOM AND IN THE HANDS OF STUDENTS
Received 1 February 2001
ABSTRACT: The use of molecular visualization software has made a tremendous impact in the biochemistry and cell biology classroom. Instructors no longer have to rely on static images in textbooks to teach the structural nature of biological molecules. The emergence of many different molecular graphics programs and technology-based classrooms has enhanced the ability of instructors to teach structural concepts such as noncovalent interactions and levels of organization in proteins. Many web-based tutorials are also available for instructors to use during lecture or for students to explore outside of the classroom. Students can also obtain hands-on experience with the graphics programs to explore the structural aspects of macromolecular systems. This report shows that students involved in visualization projects become skilled at identifying various structural motifs they have discussed in class or are discovering for the first time. This student-centered approach enhances the ability of students to comprehend structural concepts and to realize the importance of weak interactions in the structure of large molecules. [Chem. Educ. Res. Pract. Eur.: 2001, 2, 109-122]
KEY WORDS: biochemistry; cell biology; molecular visualization; intermolecular forces
INTRODUCTION
In the teaching of life science, the interface between biology and chemistry is at the level of the biomolecular organization of the cell. Students of biological chemistry approach the interface by attempting to understand biomolecular interactions creating cell function, whereas biology students view the same interface as the ultimate dissection of the organism. Central to both of these viewpoints is biomolecular structure as related to function. Teaching the subtle aspects of the three-dimensional structure and dynamics of biological molecules to undergraduates is a daunting challenge. At the introductory level, instructors may be confronted with students who have very diverse backgrounds in biological chemistry. Basic structural concepts need to be taught before the class can be taken to the next level of understanding. In more advanced classes, students necessarily have different perspectives on what they think they need to know about biomolecular structures, largely dependent on their own curricular specializations. In the more biochemical-orientated courses, focus tends to be on the structural anatomy of biomolecules and how this relates to functional chemical interactions. On the other hand, cell biology-orientated courses seek an overall understanding

CANNING & COX
110
of how biomolecules function within the context of cellular identity and cellular interactions, with less emphasis on structural anatomy.
Whether at the introductory or advanced level, proteins present a special challenge to student understanding. Large numbers of structural motifs and the formation of multimeric protein complexes are especially perplexing concepts for introductory students. Students are taught that various levels of protein structure combine to yield the overall shape and fold of a protein. Understanding the three-dimensional nature of these structural elements is essential if students are to understand how proteins fold into thermodynamically favorable structures and form biologically relevant complexes.
Until recently, the only tools available to teach the structural nature of biological molecules were written descriptions and illustrations in textbooks. Molecular models are much less effective in biochemistry, compared to organic chemistry, because it takes many atoms to demonstrate structural motifs. Large models of proteins and DNA can be purchased, but they can cost thousands of dollars and will only show a limited number of structures. A better and more versatile way to view the three-dimensional structure of biological molecules is through the use of molecular visualization (graphics) software. Until a few years ago, this required a large computer workstation and specialized computer software not available to students. It is now possible to use a desktop or laptop computer and free software to facilitate the understanding of the structural nature of biological molecules.
Molecular visualization has become a powerful teaching tool in the biology and chemistry classroom (Weiner, Cerpovicz, Dixon, Harden, Hobbs & Gosnell, 2000; Cox, 2000; Parrill & Gervay, 1997; Leon, Uridil & Miranda, 1998). There are many programs available that allow the user to render and manipulate both small and large molecules. For several years, the most popular program for molecular graphics has been RasMol, which was developed by Roger Sayle in the early 1990s (Sayle & Milner-White, 1995; Horton, 1997). The latest version is RasMol 2.7 (Bernstein, 2000) and is available from Bernstein-Plus-Sons (http://www.openrasmol.org). A great deal of information about RasMol, along with its derivative, Protein Explorer, can be found at the molecular visualization freeware page (http://www.umass.edu/microbio/rasmol/). Protein Explorer is a powerful program developed by Eric Martz that offers an interface based on RasMol but is implemented in Chime (MDL Information Systems; http://www.mdli.com), a web-based plug-in. Other popular and useful programs for visualization are Deep View (Swiss-PDB Viewer, http://www.expasy.ch.spdbv/) and Mage (http://www.proteinscience.org/Kinemage/). Each of the programs mentioned above are free and offer unique features in the quest to study the structural nature of biological molecules. Additional information on these programs can be found at the indicated web sites. The rest of this report focuses on how to best utilize these programs to increase the learning experience for students. Molecular visualization in the classroom and in the hands of students are two alternate yet complementary strategies that have proved useful in increasing understanding of molecular structures.
AVAILABILITY OF FILES
For visualization programs to be useful, a rich source of coordinate files (.pdb or .ent)
is necessary. The best location to obtain the coordinate files of proteins, nucleic acids and carbohydrates is the Research Collaboratory for Structural Bioinformatics (RCSB, http://www.rcsb.org). This Protein Data Bank (PDB) contains over 14,000 structures derived from X-ray crystallographic methods, nuclear magnetic resonance studies or theoretical calculations. Coordinate files can be downloaded from the PDB or the structures can be viewed on the web directly using First Glance (requires Chime), Protein Explorer (requires

TEACHING THE STRUCTURAL NATURE OF BIOLOGICAL MOLECULES
111
Chime), RasMol, or Virtual Reality Modeling Language (VRML). Coordinate files of smaller molecules, many of them with important biological activity, can be found at the following sites: Molecular Models from Chemistry at Okanagan University College (http://www.okanagan.bc.ca/chem/molecule/molecule.html), Klotho’s Models (http://www.ibc.wustl.edu/klotho/) and Molecules of the Month (http://www.chem.ox.ac.uk/ mom/). These sites also allow the visitor to interactively view the molecules using the Chime or VRML plug-in. A comprehensive list of web sites that catalog a variety of coordinate files can be found at the World Index of Molecular Visualization Resources (http://www.molvisindex.org).
MOLECULAR VISUALIZATION IN THE CLASSROOM
Computer-aided instruction in the science classroom has certainly changed the way
material is presented. Many instructors are now using programs such as Microsoft Powerpoint to deliver lectures to enhance the classroom experience. However, if used without due consideration, these methods of lecture presentation are simply a high-tech replacement for traditional overheads, slide shows, etc. The real power in a computer-assisted lecture presentation lies in on-screen visualization becoming part of the interactivity that students have with the instructor.
The use of web browser software and Chime is perhaps the easiest approach to bringing interactivity into the classroom. Apart from the obvious connectivity to the world wide web for source material, the cross-platform nature of scripting and plug-in architecture allows for a great deal of flexibity in lecture presentation. A particularly useful example of this is in the combination of javascript with the Chime plug-in producing an integrated visualization tool for the enhancement of the understanding of biomolecular structures. Chime can be used in several ways. An instructor can have Chime installed on a local computer and used to show RasMol-saved script files that he/she has generated. As mentioned previously, Protein Explorer (http://www.proteinexplorer.org) is a powerful program that can be used via the web or downloaded on a local computer. This graphics program uses the Chime plug-in and allows the user to quickly load a coordinate file and find a variety of noncovalent interactions such as salt bridges and cation-π interactions in biological molecules. Another alternative is to use existing tutorials that can be accessed through the internet. A great deal of work has been directed toward the creation of web-based tutorials that demonstrate different aspects of biomolecular structure. The World Index of Molecular Visualization Resources (http://www.molvisindex.org) catalogs these tutorials created by a variety of authors. The tutorials are quite diverse with most of the pages based on the Chime plug-in. Detailed instructions on how to create RasMol-saved scripts that can be implemented in Chime are also provided. Two other web sites, Molecular Models for Biochemistry at CMU (http://www.bio.cmu.edu/Courses/BiochemMols/BCMolecules.html) and The Online Macromolecular Museum (http://www.clunet.edu/BioDev/omm/gallery.htm), are also excellent sites that contain tutorials and allow visitors to interactively investigate the structure of many important macromolecular systems.
Another resource available to instructors is MolVisions (http://www.molvisions.com), which is dedicated to creating customized visualization resources that use the Chime plug-in. For example, Biochemistry in 3D (http://www.worthpublishers.com/lehninger3d/) is a site used in conjunction with the 3rd edition of the Lehninger Principles of Biochemistry textbook [Nelson & Cox, 2000]. This site has a collection of interactive tutorials that are simply excellent. These tutorials can be used during lecture to supplement the normal static
CANNING & COX
112
renderings of proteins such as hemoglobin or viewed by students outside of class to complement textbook discussions.
Molecular visualization can have the largest impact on courses such as Biochemistry and Cell Biology. In the biochemistry class, the use of visualization software to display molecular structures can be used to simply display custom views of the particular molecules or molecular interactions. For example, instructors can project favored views of the different structural motifs found in proteins, show the difference between the A and B forms of DNA and explain the sheet-like structure of cellulose. When demonstrating molecular interactions, customized views of specific residues of a protein can be rendered to demonstrate the formation of H-bonds, salt bridges, or the under appreciated π-type interactions. When presenting the anatomy of a particular protein it is important for students to see specific interactions involving protein side chains. This provides three-dimensional evidence of the importance of amino acids being placed in the correct position for the formation of functional proteins or protein complexes. This type of approach also works well when studying protein complexes involving nucleic acids or carbohydrates. Specific intermolecular interactions between protein side chains and functional groups on other biological molecules must occur to have complex formation. Students gain a better appreciation for the specificity of protein complexes if they can visualize unambiguous interactions between participating molecules.
In an introductory level biology course, the emphasis is generally on getting students to know the basics of protein structure. Generally, at this level of instruction, the goal is to demonstrate how the linear genetic code can be translated into a three-dimensional structure. A useful approach is to select a specific protein and use Rasmol-generated scripts in a Chime-based presentation to build the protein in class. The following is an example of how a lecture may be structured to effectively utilize visualization. Starting with the simplest amino acid glycine, one can explore different representations of the molecule using backbone, ball and stick and van der Waals radii representations (space filling)(Figure 1). This is then repeated with different amino acids to show the commonality of amino and carboxyl termini and highlight R-group differences with respect to polarity and charge.
In the next step, two amino acids are joined with a single peptide bond. A Chime-based representation is useful here in rotational mode since the angles of the R-groups can be shown in three-dimensional relativity. Again, switching between different representations
FIGURE 1. Representations of the amino acid glycine.

TEACHING THE STRUCTURAL NATURE OF BIOLOGICAL MOLECULES
113
gives clear indication of backbone angles versus potential interactions using van der Waals radii. Stepwise additions of amino acids are presented next to complete a portion of a polypeptide chain. As the primary amino-acid sequence is built, students dynamically see aspects of secondary structure in the building of the chain. Individual coloring of amino acids allows the instructor to return to the issue of R-group differences. After discussion of how specific portions of the chain may interact with other portions of the chain, the concept of α-helices and β-pleated sheets can be explored. Here, the cartoon mode is employed to highlight helices, sheets and loops of random structure.
The modular construction of proteins can be emphasized at this point. The Immunoglobulin molecule is a good example of this since the protein contains chains of repeated Ig domains. The Ig domains can be represented in various modes. Students can be shown that the complete van der Waals radii representation is underlain by the backbone representation (Figure 2). At this point, the individual components of the domain can be reviewed on the screen. Zooming in and out repeatedly in response to student requests is particularly useful.
Once the class grasps the idea of domain organization, these structures can be concatenated to show the full chain. Showing alternate representations of the chain gives students the idea where the structure came from and its overall shape using van der Waals radii. At this point, the complete Ig molecule can be put together, using different chain colors and the zoom feature on disulfide bridges. The Ig molecule is a particularly useful model since it is symmetrical and easily understood how the chains fit and wrap together. The instantaneous nature of chime allows for a review of any level of structure not understood by the class.
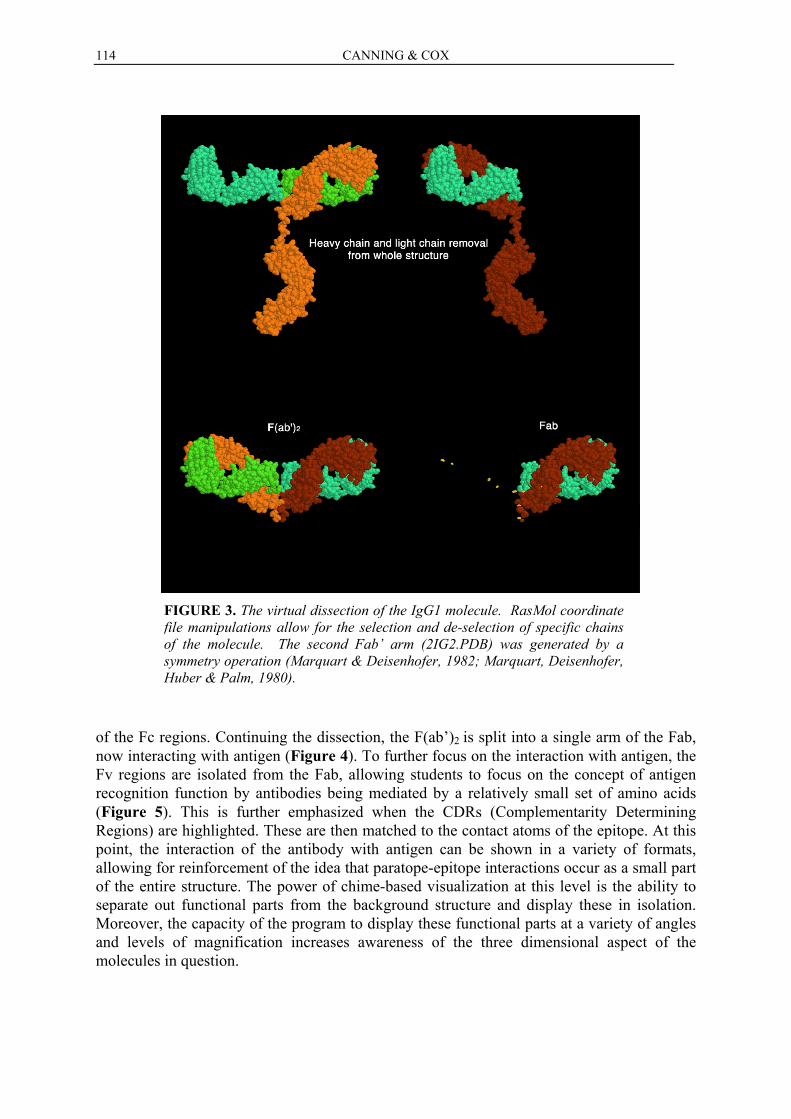
In the more advanced cell biology class, students are more familiar with the basic structures of biomolecules. The emphasis here is on teaching function as a product of structure. Taking the opposite approach to visualization in the introductory classroom, selected molecules can be dissected to show their functional parts and interactions. For example, considering the same molecule used in the introductory classroom, the Ig molecule, now interacting with an antigen. To begin, the F(ab’)2 fraction of the Ig molecule can be dissected away from the whole Ig structure (Figure 3). The heavy chains and light chains are shown joined by disulfide bonds, so that the antigen recognition function of the Ig molecule can be separated from the class-determing structure
FIGURE 2. The complete IgG1 structure. The top structure shows heavy and light chain associations in spacefill view; the bottom is a wireframe of the same IgG1 structure with only the carbohydrate associated with the heavy chains in spacefill. This PDB file was kindly provided by Eduardo A. Padlan, who combined the Fab' from 2IG2.PDB with the Fc from 1FC2.PDB, and modeled in the hinge region (Padlan, 1994).
CANNING & COX
114
FIGURE 3. The virtual dissection of the IgG1 molecule. RasMol coordinatefile manipulations allow for the selection and de-selection of specific chains of the molecule. The second Fab’ arm (2IG2.PDB) was generated by asymmetry operation (Marquart & Deisenhofer, 1982; Marquart, Deisenhofer, Huber & Palm, 1980).
of the Fc regions. Continuing the dissection, the F(ab’)2 is split into a single arm of the Fab, now interacting with antigen (Figure 4). To further focus on the interaction with antigen, the Fv regions are isolated from the Fab, allowing students to focus on the concept of antigen recognition function by antibodies being mediated by a relatively small set of amino acids (Figure 5). This is further emphasized when the CDRs (Complementarity Determining Regions) are highlighted. These are then matched to the contact atoms of the epitope. At this point, the interaction of the antibody with antigen can be shown in a variety of formats, allowing for reinforcement of the idea that paratope-epitope interactions occur as a small part of the entire structure. The power of chime-based visualization at this level is the ability to separate out functional parts from the background structure and display these in isolation. Moreover, the capacity of the program to display these functional parts at a variety of angles and levels of magnification increases awareness of the three dimensional aspect of the molecules in question.

TEACHING THE STRUCTURAL NATURE OF BIOLOGICAL MOLECULES
115
MOLECULAR VISUALIZATION IN THE HANDS OF STUDENTS
The tremendous potential of molecular visualization to enhance the way structural concepts are taught and learned can only be realized if put in the hands of students. The availability of technology-enhanced classrooms and laboratories has accelerated the increased presence of computers in the science curriculum. As a result, some students must improve their own computer skills to keep pace. This is especially true for chemistry students as computers are now used in the classroom and laboratory to evaluate data using spreadsheets, solve complex mathematical equations, investigate the geometry and electronic properties of molecules (computational chemistry) and retrieve information on the physical and chemical properties of substances (Zielinski & Swift, 1997; Swift & Zielinski, 1995; Shusterman & Shusterman, 1997; Martin, 1998). Molecular visualization can certainly be added to the list because of its application in investigating the structure of different types of molecules. The time invested in training students how to use the various programs is well spent once they start independently investigating the structure of biological molecules. In the biochemistry curriculum, students are required to complete a project where they investigate the structure of a particular protein or protein complex. Depending on class size, students work individually or in groups of five or less. Protein structures are downloaded from the PDB and loaded into one of the aforementioned graphics programs. Students investigate the
FIGURE 4. . Demonstration of antibody interacting with antigen. Toprepresentations show how the antigen (lysozyme; red) is latched to the Fabfragment. Bottom representations highlight the paratope atoms responsible for epitope recognition.

CANNING & COX
116
structural nature of the proteins and are asked to find and discuss specific noncovalent interactions that help stabilize the structure of the protein. At the end of the semester, oral presentations are given where students discuss their protein and answer questions from the instructor and the rest of the class. The presentations are computer-based and involve students providing background information and describing the basic structural elements of their protein system using the graphics programs.
The search for noncovalent interactions in proteins emphasizes the importance of weak interactions in the structure of proteins. The students are asked to find at least one example of a π-type interaction, as they are under appreciated in the biochemistry curriculum (Cox, 2000). Generally, students find the typical examples of structural motifs associated with proteins. For example, the presentations usually yield many examples of H-bonds between backbone atoms that stabilize the structure of α-helices and β-sheets, the β-α-β loop and the formation of multimers among protein subunits. Students are also very good at finding ionic interactions between acidic and basic amino acids and H-bonds between polar side chains or polar side chains and backbone atoms. It has been striking the number of π-type interactions discovered in the student-centered projects. Examples of all the π-type interactions (face-to-face, face-to-edge, cation-π, CH-π, π-facial H-bond) have been a part of student presentations and it is clear that these types of interactions are prevalent in protein systems and need to be included
FIGURE 5. Views of the contact atoms responsible for IgG1 binding to antigen (lysozyme) [1FDL.PDB] (Fischmann, Bentley, Bhat, Boulot, Mariuzza, Phillips, Tello & Poljak, 1991).

TEACHING THE STRUCTURAL NATURE OF BIOLOGICAL MOLECULES
117
in any discussion of intra- and intermolecular forces that stabilize proteins (McGaughey, Gagnés & Rappé, 1998; Burley & Petsko, 1985).
One of the most exciting aspects of the projects is to see how students dig into the structures and find some truly interesting structural elements that were not specifically discussed in class or the textbook. This approach to teaching protein structure is inquiry-based and allows students to take the concepts they have learned in the classroom and apply them in their own way to explore the structure of biological molecules. The rest of this section describes some observations made by students in the biochemistry curriculum that have participated in the visualization projects. Selected examples from the student presentations can be found at a web site devoted to the search for noncovalent interactions (http://campus.murraystate.edu/academic /faculty/ricky.cox/pi/pi_inter.htm).
Figure 6 shows the structure of alkaline protease (Miyatake, Hata, Fujii, Hamada, Morihara & Katsube, 1995) where the ammonium group (-NH3
+) of the N-terminal Gly residue is involved in an ionic interaction with the carboxylate group (-COO−) of the C-terminal Val residue. This is a large protein (470 residues) and the student that discovered this interaction thought it was remarkable that the two terminal amino acids are near each other in the folded conformation and can participate in a stabilizing interaction.
The structure of the human growth hormone in complex with its receptor (deVos, Ultsch & Kossiakoff, 1992) is shown in Figure 7. The panel on the bottom shows how the edge of the aromatic indole ring of Trp interacts with the carboxylate oxygens of two acidic amino-acid side chains. The Trp residue is on the receptor (red) and the Glu and Asp residues are on the hormone (blue). The student who observed these interactions suggested that the attractive forces were electrostatic in nature. In lecture, he had learned about the quadrupolar nature of the benzene ring and face-to-edge interactions between aromatic amino acids containing the benzene ring. In this case, the distance between C-6 of the indole ring of Trp-104 and a carboxylate oxygen of Asp-116 is 3.12 Ǻ. The student reasoned that the distance between the hydrogen atom attached to C-6 and the oxygen will be approximately 1.80 Ǻ, a distance appropriate for an ion-quadrupole interaction. This particular type of interaction was not discussed in class and the student met some resistance from the class and the instructor about the importance of these interactions in stabilizing the protein complex. However, a subsequent search of the literature revealed that this type of interaction has been observed in proteins and recognized as a stabilizing force (Thomas, Smith, Thomas & Feldmann, 1982; Gould, Gray, Taylor & Walkinshaw, 1985). The structure of concanavalin A (Parkin, Rupp & Hope, 1996) is shown in Figure 8. This protein consists mainly of two large β-sheets. In the bottom panel, the larger of the β-sheets is highlighted and colored according to the polarity of the amino acids in the sheet.
FIGURE 6. The top panel shows the structure of alkaline protease (1AKL.PDB). The bottom panel shows the N- and C-terminal amino acids. The α-amino group of Gly-1 is close enough to form an ionic interaction with the α-carboxyl group of Val-470, the C-terminal residue.

CANNING & COX
118
Polar amino-acid side chains are located in the yellow regions and nonpolar amino-acid side chains are located in the green regions. The student realized that under cellular conditions, one face of this sheet will be exposed to solvent while the other face will be buried. Therefore, she concluded that the distribution of nonpolar amino acids should put a majority of these side chains facing into the core of the protein. The student clearly demonstrated this was the case in her presentation and explained how this was accomplished by discussing the placement of amino acids along the strands of the sheet. The bottom panel of Figure 8 shows that, in many cases, the polar and nonpolar amino acids alternate positions, which will lead to an amphipathic β-sheet. She also discovered an interesting π-stacking interaction between Trp-88 and His-180 that may help stabilize the structure of the protein. The nature and frequency of this type of π-stacking interaction has not been investigated; however, it would be a viable research project. A dimeric structure of alcohol dehydrogenase (Li, Hallows, Punzi, Pankiewicz, Watanabe & Goldstein, 1994) is shown in Figure 9. There is a large β-sheet in the center of the protein with strands from both subunits involved in sheet formation. This is demonstrated in the bottom panel of Figure 9, which shows the interface where backbone atoms of strands from different subunits form H-bonds to stabilize the structure of the dimer. This is also an interesting structural element as amino-acid side chains usually interact to stabilize the quaternary structure of a protein.
FIGURE 7. The top panel shows thehuman growth hormone in complexwith its receptor (3HHR.PDB). Thebottom panel shows Trp-104 (on thereceptor) interacting with two acidicamino acids on the hormone (blue).
FIGURE 8. The top panel shows the structure of concavalin A (1JBC.PDB). The bottom panel highlights a β-sheet within the protein and a π-stacking interaction between Trp-88 and His-180.

TEACHING THE STRUCTURAL NATURE OF BIOLOGICAL MOLECULES
119
Figure 10 shows a dimeric structure of phosphofructokinase-1 (Shirakihara & Evans, 1988). The bottom panel of this figure shows ADP bound in its allosteric binding site. A student team discovered another under appreciated π-stacking interaction between Tyr-55A and the adenine ring of ADP. A residue from the other subunit (Arg-154B) also interacts with the ligand by forming an ionic interaction with a phosphate group of the bound nucleotide. Therefore, residues from both subunits participate in the recognition of ADP. In fact, the biologically active form of PFK-1 is a tetramer and the interaction of the subunits with various allosteric effectors is necessary for the regulation of enzyme activity and control of glycolysis (Nelson & Cox, 2000).
STUDENT COMMENTS CONCERNING MOLECULAR VISUALIZATION
Students who have participated in the biochemistry class projects were asked to
comment on the use of molecular visualization in the classroom and in their own investigation of protein structures. For the most part, students used RasMol in their projects and this is reflected in the comments below. However, similar comments will most likely result if other visualization programs are used. The comments below are a representative sample obtained in a survey conducted at the end of the student presentations. These comments were selected as they capture the opinion and enthusiasm shown by a great majority of students. Nearly 100 students have participated in the visualization projects described in this report. The survey mentioned above also revealed that approximately 85% of the students thought the use of visualization software in class and in the class projects enhanced their understanding of the structural nature of biological molecules and the role of
FIGURE 9. The top panel showsthe structure of alcoholdehydrogenase (1ADB.PDB). Thebottom panel shows how β-sheet formation between the subunitsstabilizes the quaternary structure ofthe protein.
FIGURE 10. The top panel shows a dimeric structure of phospho-fructokinase (1PFK.PDB). The panel on the bottom shows how ADP (bound in its allosteric site) interacts with side chains from the enzyme.

CANNING & COX
120
noncovalent interactions in protein structure. This is reflected in the following student comments:
“RasMol was very helpful in my study of biochemistry, to say the least. Not only did it allow me to visualize molecules, but it also enhanced my understanding of the three-dimensional nature of biological molecules.”
“…the presentation of interactions among amino acids in RasMol certainly helped when trying to learn about noncovalent interactions in proteins.”
“I believe RasMol was a valuable learning tool and I feel it made the understanding of three-dimensional structure much easier.”
“It was more beneficial for me to use RasMol myself as opposed to just watching the instructor use it in class. It really helped me dissect the structure of an enzyme”
“I thought RasMol was an excellent tool in the classroom for helping visualize what was being discussed about the structural nature of proteins”
CONCLUSIONS
The major conclusion of this paper is that molecular visualization can be an effective
teaching/learning tool that allows students to take a step beyond what they traditionally learn about biological molecules. When students are required to use visualization software, the exercise becomes inquiry-based and allows students to discover specific structural elements and noncovalent interactions in macromolecules with no direct guidance from the instructor. Oral presentations by the students force them to assume the role of the instructor and to present their work in a way that is beneficial to the rest of the class. The visualization software plays an important role because it allows them to present the structure of biological molecules in the way they believe is most descriptive, without relying on existing figures in textbooks.
ACKNOWLEDGMENTS: Students in the biochemistry curriculum who participated in the visualization projects. CORRESPONDENCE: James Ricky Cox, Department of Chemistry, Murray State University, 456 Blackburn Science Building, Murray, KY 42071-3346, USA; e-mail: [email protected]; Website: http://www.mursuky.edu/qacd/cos/che/faculty/jrc.htm David Canning is an Assistant Professor of Developmental Biology in the Department of Biological Sciences, Murray State University. He is from the United Kingdom, where he received his D.Phil. from the University of Oxford. His research focuses on the epigenetic nature of cell differentiation during embryonic development and neural regeneration. J. Ricky Cox is an Assistant Professor in the Department of Chemistry, Murray State University. He is from the state of Tennessee (USA) where he obtained his Ph.D. in Biochemistry at The University of Tennessee at Knoxville. His research and teaching interests are in the area of molecular visualization and computational methods to study the interaction of aromatic systems in proteins.

TEACHING THE STRUCTURAL NATURE OF BIOLOGICAL MOLECULES
121
REFERENCES Bernstein, H. J. (2000). Recent Changes to RasMol, Recombining the Variants. Trends in
Biochemical Sciences, 25, 453-455. Burley, S. K. & Petsko, G. A. (1985). Aromatic-Aromatic Interaction: A Mechanism of Protein
Structure Stabilization. Science, 229, 23-28. Cox, J. R. (2000). Teaching Noncovalent Interactions in the Biochemistry Curriculum through
Molecular Visualization: The Search for π Interactions. Journal of Chemical Education, 77, 1424-1428.
deVos, A. M.; Ultsch, M.; Kossiakoff, A. A. (1992). Human Growth Hormone and Extracellular Domain of its Receptor: Crystal Structure of the Complex. Science, 255, 306-312.
Fischmann, T. O.; Bentley, G. A.; Bhat, T. N.; Boulot, G.; Mariuzza, R. A.; Phillips, S. E.; Tello, D. & Poljak, R. J. (1991). Crystallographic Refinement of the Three-Dimensional Structure of the FabD1.3-Lysozyme Complex at 2.5 Å Resolution. Journal of Biological Chemistry, 266, 12915-12920.
Gould, R. O.; Gray, A. M.; Taylor, P. & Walkinshaw, M. D. (1985). Crystal Environments and geometries of Leucine, Isoleucine, Valine, and Phenylalanine Provide Estimates of Minimum Nonbonded Contact and preferred van der Waals Interaction Distances. Journal of the American Chemical Society, 107, 5921-5927.
Horton, R. M. (1997). An Introduction to Molecular Visualization: Seeing in Stereo with RasMol. BioTechniques, 22, 660-662.
Leon, D.; Uridil, S. & Miranda, J. (1998). Structural Analysis and Modeling of Proteins on the Web. Journal of Chemical Education, 75, 731-734.
Li, H.; Hallows, W. H.; Punzi, J. S.; Pankiewicz. K. W.; Watanabe, K. A. & Goldstein, B. (1994). Crystallographic Studies of Isosteric NAD Analogues Bound to Alcohol Dehydrogenase: Specificity and Substrate Binding in Two Ternary Complexes. Biochemistry, 33, 11734-11744.
Marquart, M.; Deisenhofer, J.; Huber, R. & Palm, W. (1980). Crystallographic Refinement and Atomic Models of the Intact Immunoglobin Molecule KOL and its Antigen-Binding Fragment at 3.0 Å and 1.0 Å Resolution. Journal of Molecular Biology, 141, 369-391.
Marquart, M. & Deisenhofer, J. (1982). The Three-Dimensional Structure of Antibodies. Immunology Today, 3, 160.
Martin, N. H. (1998). Integration of Computational Chemistry into the Chemistry Curriculum. Journal of Chemical Education, 75, 241-243.
McGaughey, G. B.; Gagnés, M. & Rappé, A. K. (1998). π-Stacking Interactions: Alive and Well in Proteins. Journal of Biological Chemistry, 273, 15458-15463.
Miyatake, H.; Hata, Y.; Fujii, T.; Hamada, K.; Morihara, K. & Katsube, Y. (1995). Crystal Structure of the Unliganded Alkaline Protease from Pseudomonas aeruginosa IFO3080 and its Conformational Changes on Ligand Binding. Journal of Biochemistry (Tokyo), 118, 474-479.
Nelson, D. L. & Cox, M.M. (2000). Lehninger Principles of Biochemistry, 3rd ed. New York: Worth Publishers.
Northrup, S. N. (1997). Molecular Graphics and Simulation of Proteins and Nucleic Acids. In Using Computers in Chemistry and Chemical Education, Zielinski, T. J.; Swift, M. L., Eds. American Chemical Society: Washington, DC (Chapter 16).
Parkin, S.; Rupp, B. & Hope, H. (1996). Atomic Resolution Structure of Concanavalin A at 120 K. Acta Crystallographica Section D Biological Crystallography, 52,1161.
Padlan, E. A. (1994). Anatomy of the Antibody Molecule. Molecular Immunology, 31, 169-217. Parrill, A. L. & Gervay, J. (1997). Fostering Curiosity-Driven Learning through Interactive
Multimedia Representations of Biological Molecules. Journal of Chemical Education, 74, 1141-1142.
Sayle, R. A. (1995). RASMOL: biomolecular graphics for all. Trends in Biochemical Sciences, 20, 374-376.
Shirakihara, Y. & Evans, P. R. (1988). Crystal Structure of the Complex of Phosphofructokinase Escherichia coli with its Reaction Products. Journal of Molecular Biology, 204, 973-974.

CANNING & COX
122
Shusterman, G. P. & Shusterman, A. J. (1997). Teaching Chemistry with Electron Density Models. Journal of Chemical Education, 74, 771-776.
Swift, M. L. & Zielinski, T. J. (1995). What Chemists (or Chemistry Students) Need to Know About Computing. Journal of Science Education and Technology, 4, 171-179.
Thomas, K. A.; Smith, G. M.; Thomas, T. B.; Feldmann, R. J. (1982). Electronic distributions within protein phenylalanine aromatic rings by the three-dimensional oxygen atom environments. Proceedings of the National Academy of Sciences, 79, 4843-4847.
Weiner, S. W.; Cerpovicz, P. F.; Dixon, D. W.; Harden, D. B.; Hobbs, D. S. & Gosnell, D. L. (2000). RasMol and Mage in the Undergraduate Biochemistry Curriculum. Journal of Chemical Education, 77, 401-406.
Zielinski, T. J. & Swift, M. L. (1997). What Every Chemist Should Know About Computers, II. The Chemical Educator, 2.