Teacher Voice Omnibus Survey June 2019 - NFER
37
Presentation of Teacher Voice Data Teacher Voice Omnibus Survey June 2019 Provision of Services within Schools: Changes in the use of Budgets and Staff Time National Foundation for Educational Research (NFER)
Transcript of Teacher Voice Omnibus Survey June 2019 - NFER
Presentation of Teacher Voice Data
Teacher Voice Omnibus Survey June 2019
Provision of Services within Schools: Changes in the use
of Budgets and Staff Time
National Foundation for Educational Research (NFER)

Teacher Voice Omnibus Survey June 2019
National Foundation for Educational Research
Published in December 2019
By the National Foundation for Educational Research,
The Mere, Upton Park, Slough, Berkshire SL1 2DQ
www.nfer.ac.uk
© 2019 National Foundation for Educational Research
Registered Charity No. 313392

Teacher Voice Omibus Survey June 2019 i
Senior leader views on the provision of services: changes in the use of budgets and staff time
About the research
In June1, we used NFER’s Teacher Voice Survey to ask a sample of senior leaders
questions relating to the provision of specific services.
A total of 448 senior leaders (272 primary senior leaders and 176 secondary senior leaders)
from 435 schools completed the survey.2
The questions asked can be organised into six categories :
− SEND Provision
− Mental Health and Wellbeing Services (outside of curriculum)
− Prevention of Crime (e.g. radicalisation, violent crime)
− Financial Support for Disadvantaged Children (e.g. trips, travel, uniforms and food other
than school lunch)
− Safeguarding (e.g. visits to pupils in the home/social care)
− Before and After School Clubs
For each category the following questions were asked:
Budget
− Have you spent a larger percentage of your budget than you did last academic year?
− Where expenditure has increased, have you received additional funding to cover those
costs?
Staff
− Are your staff spending more of their time than they did last academic year?
− Who provides these services?
− What impact have these additional demands had on staff workload?
1 Teachers completed the survey online between the 21 and 26 June 2019. 2 The wider Teacher Voice Omnibus Survey June 2019 consisted of a panel of 1,571 practising teachers (classroom teachers and senior leaders) from 1,357 schools in the publicly funded sector in England. The data presented in this report draws exclusively on the views of senior leaders.
Teacher Voice Omnibus Survey ii
Both the primary school and combined primary/secondary senior leadership samples are
nationally representative by free school meals eligibility. The secondary school senior
leadership sample was not nationally representative by free school meals eligibility. To
address this, weights were calculated using free school meals eligibility data and then
applied to create a more representative sample of secondary school senior leaders.
Reported base sizes (N) are unweighted.
Percentages may not sum to 100 due to rounding.

Teacher Voice Omnibus Survey June 2019 3
1 SEND Provision
Over 80% of primary school leaders and more than half of secondary school leaders reported spending a larger proportion of their budget than last year on SEND provision.
Notes:
1. Response: n = 444 (Primary n = 269, Secondary n = 175)
2. Percentages may not sum to 100 due to rounding.
3. Responses are from Senior Leaders.
Teacher Voice Omnibus Survey June 2019 4
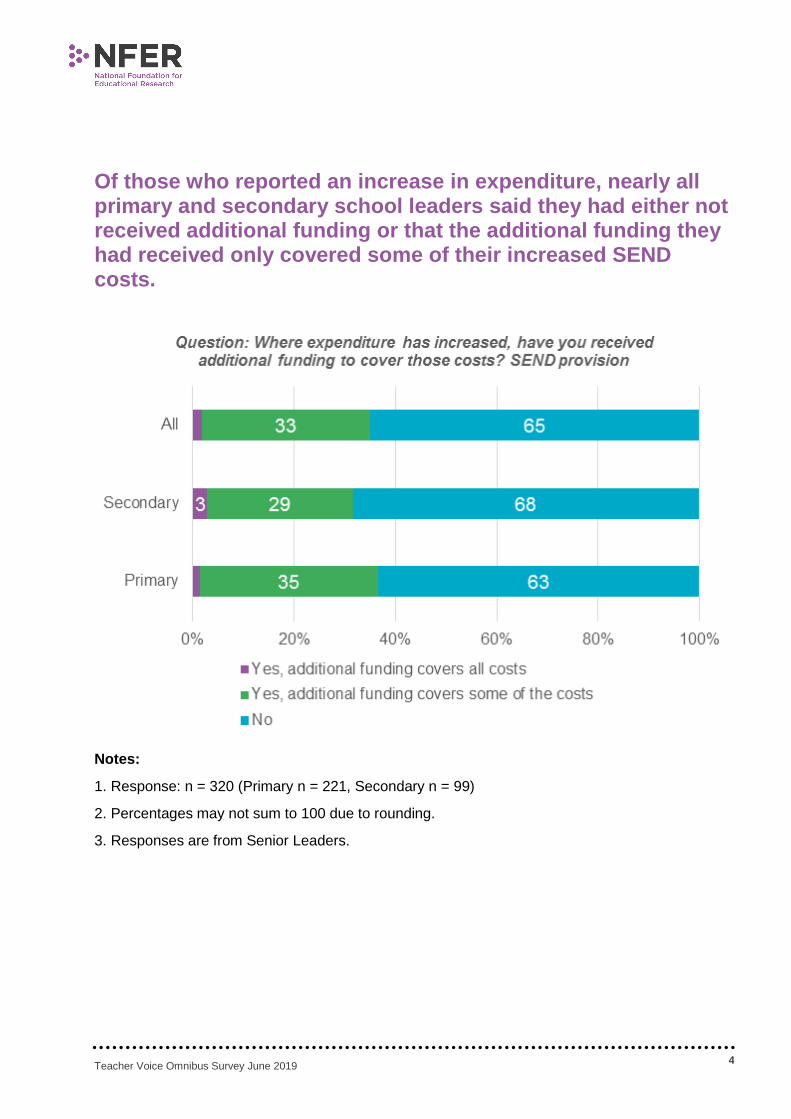
Of those who reported an increase in expenditure, nearly all primary and secondary school leaders said they had either not received additional funding or that the additional funding they had received only covered some of their increased SEND costs.
Notes:
1. Response: n = 320 (Primary n = 221, Secondary n = 99)
2. Percentages may not sum to 100 due to rounding.
3. Responses are from Senior Leaders.

Teacher Voice Omnibus Survey June 2019 5
Over three-quarters of all school leaders said that their staff were spending more of their time on SEND provision.
Notes:
1. Response: n = 445 (Primary n = 269, Secondary n = 176)
2. Percentages may not sum to 100 due to rounding.
3. Responses are from Senior Leaders.

Teacher Voice Omnibus Survey June 2019 6
Around 65% of all school leaders said they had used trained members of the school management team for SEND provision.
Notes:
1. Response: n = 344 (Primary n= 225, Secondary n= 119)
2. Percentages do not sum to 100 as multiple selections are possible.

Teacher Voice Omnibus Survey June 2019 7
Of the primary school leaders that reported their staff were spending more of their time on SEND provision, around half said that these additional demands ‘greatly increased’ workload.
Notes:
1. Response: n = 165 (Primary n = 103, Secondary n = 62).
2. Percentages may not sum to 100 due to rounding.
3. Responses are from Senior Leaders.

Teacher Voice Omnibus Survey June 2019 8
2 Mental Health and Wellbeing Services (outside of curriculum)
72% of all school leaders reported spending a larger proportion of their budget than last year on Mental Health and Wellbeing.
Notes:
1. Response: n = 445 (Primary n = 270, Secondary n = 175)
2. Percentages may not sum to 100 due to rounding.
3. Responses are from Senior Leaders.

Teacher Voice Omnibus Survey June 2019 9
Of all the school leaders who reported an increase in expenditure, 85% said they had not received additional funding to cover their increased Mental Health and Wellbeing costs.
Notes:
1. Response: n = 321 (Primary n = 194, Secondary n = 127)
2. Percentages may not sum to 100 due to rounding.
3. Responses are from Senior Leaders.

Teacher Voice Omnibus Survey June 2019 10
85% of all school leaders said that their staff were spending more of their time on Mental Health and Wellbeing.
Notes:
1. Response: n = 445 (Primary n = 270, Secondary n = 175)
2. Percentages may not sum to 100 due to rounding.
3. Responses are from Senior Leaders.

Teacher Voice Omnibus Survey June 2019 11
Over half of secondary school leaders reported they had used specialists on contract to deliver Mental Health and Wellbeing services.
Notes:
1. Response: n = 379 (Primary n = 227, Secondary n = 152)
2. More than one answer could be given so percentages may sum to more than 100.

Teacher Voice Omnibus Survey June 2019 12
Of the secondary school leaders that reported their staff were spending more of their time on Mental Health and Wellbeing, almost half said that these additional demands ‘greatly increased’ workload.
Notes:
1. Response: n = 136 (Primary n = 53, Secondary n = 83)
2. Percentages may not sum to 100 due to rounding.
3. Responses are from Senior Leaders.

Teacher Voice Omnibus Survey June 2019 13
3 Prevention of Crime (e.g. radicalisation, violent crime)
Over a quarter of secondary school leaders reported spending a larger proportion of their budget than last year on the Prevention of Crime.
Notes:
1. Response: n = 442 (Primary n = 267, Secondary n = 175)
2. Percentages may not sum to 100 due to rounding.
3. Responses are from Senior Leaders.

Teacher Voice Omnibus Survey June 2019 14
Of all school leaders who reported an increase in expenditure on the Prevention of Crime, 86% said they had not received additional funding to cover their increased costs.
Notes:
1. Response: n = 76 (Primary n = 29, Secondary n = 47)
2. Percentages may not sum to 100 due to rounding.
3. Responses are from Senior Leaders.

Teacher Voice Omnibus Survey June 2019 15
Half of secondary school leaders said that their staff were spending more of their time on the Prevention of Crime.
Notes:
1. Response: n = 440 (Primary n = 266, Secondary n = 174)
2. Percentages may not sum to 100 due to rounding.
3. Responses are from Senior Leaders.

Teacher Voice Omnibus Survey June 2019 16
58% of school leaders said they had used trained members of the school management team for the Prevention of Crime.
Notes:
1. Response: n = 137 (Primary n = 53, Secondary n = 84).
2. More than one answer could be given so percentages may sum to more than 100.
Teacher Voice Omnibus Survey June 2019 17
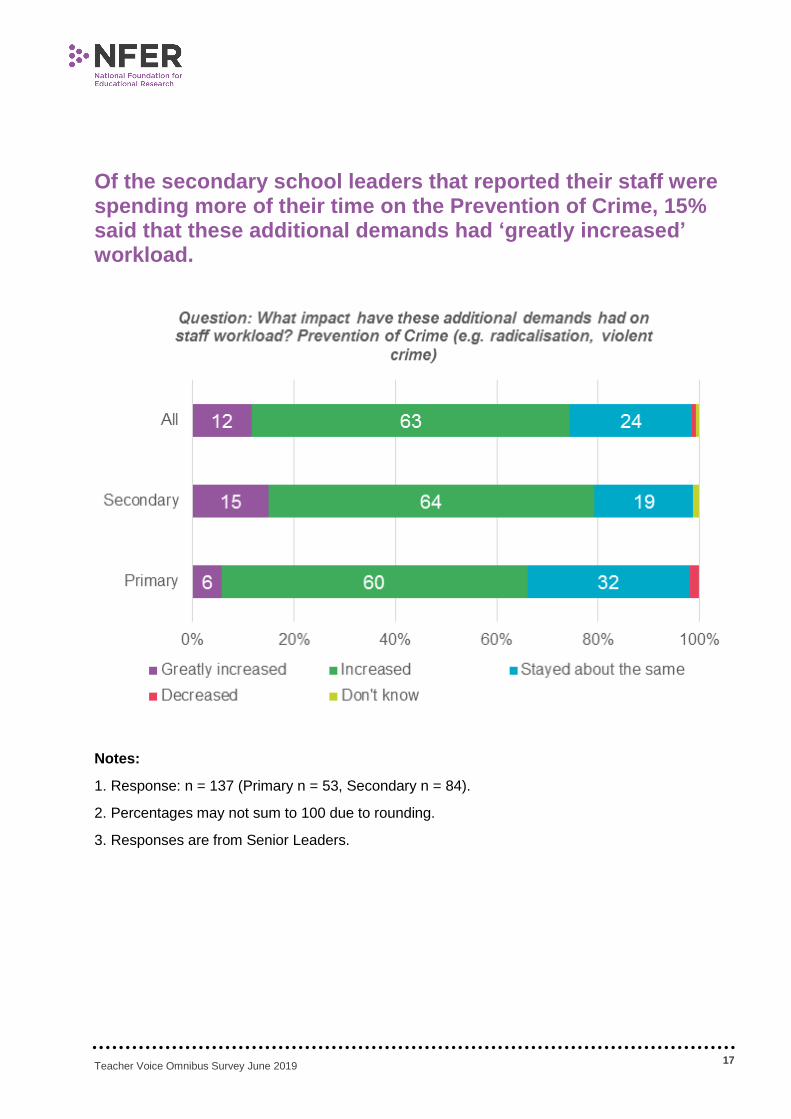
Of the secondary school leaders that reported their staff were spending more of their time on the Prevention of Crime, 15% said that these additional demands had ‘greatly increased’ workload.
Notes:
1. Response: n = 137 (Primary n = 53, Secondary n = 84).
2. Percentages may not sum to 100 due to rounding.
3. Responses are from Senior Leaders.

Teacher Voice Omnibus Survey June 2019 18
4 Financial support for disadvantaged children (e.g. trips, travel, uniforms and food other than school lunch)
Over 70% of primary school leaders and just over half of secondary school leaders reported spending a larger proportion of their budget than last year on financial support for disadvantaged children.
Notes:
1. Response: n = 446 (Primary n =270, Secondary n = 176)
2. Percentages may not sum to 100 due to rounding.
3. Responses are from Senior Leaders.

Teacher Voice Omnibus Survey June 2019 19
Of the school leaders who reported an increase in expenditure, over 60% said they had not received additional funding to cover their increased costs.
Notes:
1. Response: n = 287 (Primary n = 191, Secondary n = 96).
2. Percentages may not sum to 100 due to rounding.
3. Responses are from Senior Leaders.
Teacher Voice Omnibus Survey June 2019 20
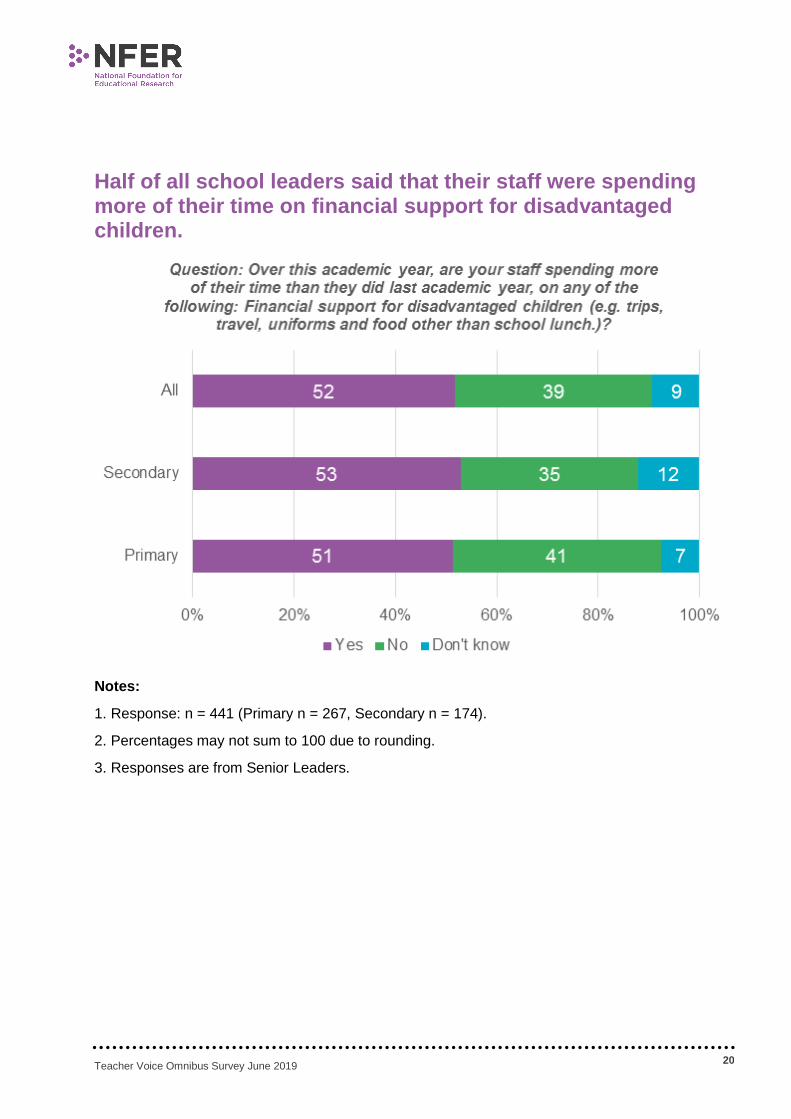
Half of all school leaders said that their staff were spending more of their time on financial support for disadvantaged children.
Notes:
1. Response: n = 441 (Primary n = 267, Secondary n = 174).
2. Percentages may not sum to 100 due to rounding.
3. Responses are from Senior Leaders.

Teacher Voice Omnibus Survey June 2019 21
Half of all school leaders said they had used trained members of the school management team on financial support for disadvantaged children.
Notes:
1. Response: n = 228 (Primary n = 137, Secondary n = 91)
2. More than one answer could be given so percentages may sum to more than 100.

Teacher Voice Omnibus Survey June 2019 22
Of the school leaders that reported their staff were spending more of their time on financial support for disadvantaged children, 16% said that these additional demands had ‘greatly increased’ workload.
Notes:
1. Response: n = 228 (Primary n = 137, Secondary n = 91)
2. Percentages may not sum to 100 due to rounding.
3. Responses are from Senior Leaders.
Teacher Voice Omnibus Survey June 2019 23
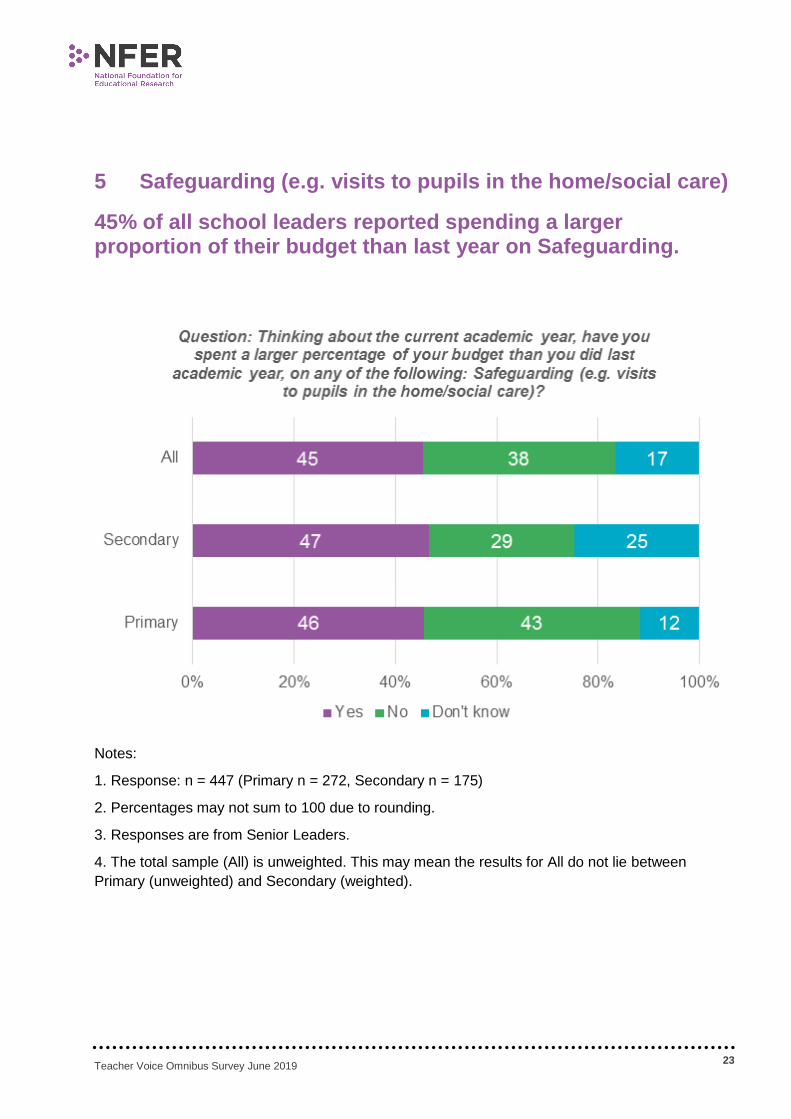
5 Safeguarding (e.g. visits to pupils in the home/social care)
45% of all school leaders reported spending a larger proportion of their budget than last year on Safeguarding.
Notes:
1. Response: n = 447 (Primary n = 272, Secondary n = 175)
2. Percentages may not sum to 100 due to rounding.
3. Responses are from Senior Leaders.
4. The total sample (All) is unweighted. This may mean the results for All do not lie between
Primary (unweighted) and Secondary (weighted).

Teacher Voice Omnibus Survey June 2019 24
Of the school leaders who reported an increase in expenditure, 86% said they had not received additional funding to cover their increased Safeguarding costs.
Notes:
1. Response: n = 203 (Primary n = 124, Secondary n = 79).
2. Percentages may not sum to 100 due to rounding.
3. Responses are from Senior Leaders.

Teacher Voice Omnibus Survey June 2019 25
68% of all school leaders said that their staff were spending more of their time on Safeguarding.
Notes:
1. Response: n = 448 (Primary n = 272, Secondary n= 176).
2. Percentages may not sum to 100 due to rounding.
3. Responses are from Senior Leaders.

Teacher Voice Omnibus Survey June 2019 26
67% of all school leaders said that the used trained members of the school management team for Safeguarding.
Notes:
1. Response: n = 303 (Primary n = 183, Secondary n = 120)
2. More than one answer could be given so percentages may sum to more than 100.

Teacher Voice Omnibus Survey June 2019 27
Of the school leaders that reported their staff were spending more of their time on the Safeguarding, almost a third said that these additional demands had ‘greatly increased’ workload.
Notes:
1. Response: n = 303 (Primary n = 183, Secondary n = 120).
2. Percentages may not sum to 100 due to rounding.
3. Responses are from Senior Leaders.
Teacher Voice Omnibus Survey June 2019 28
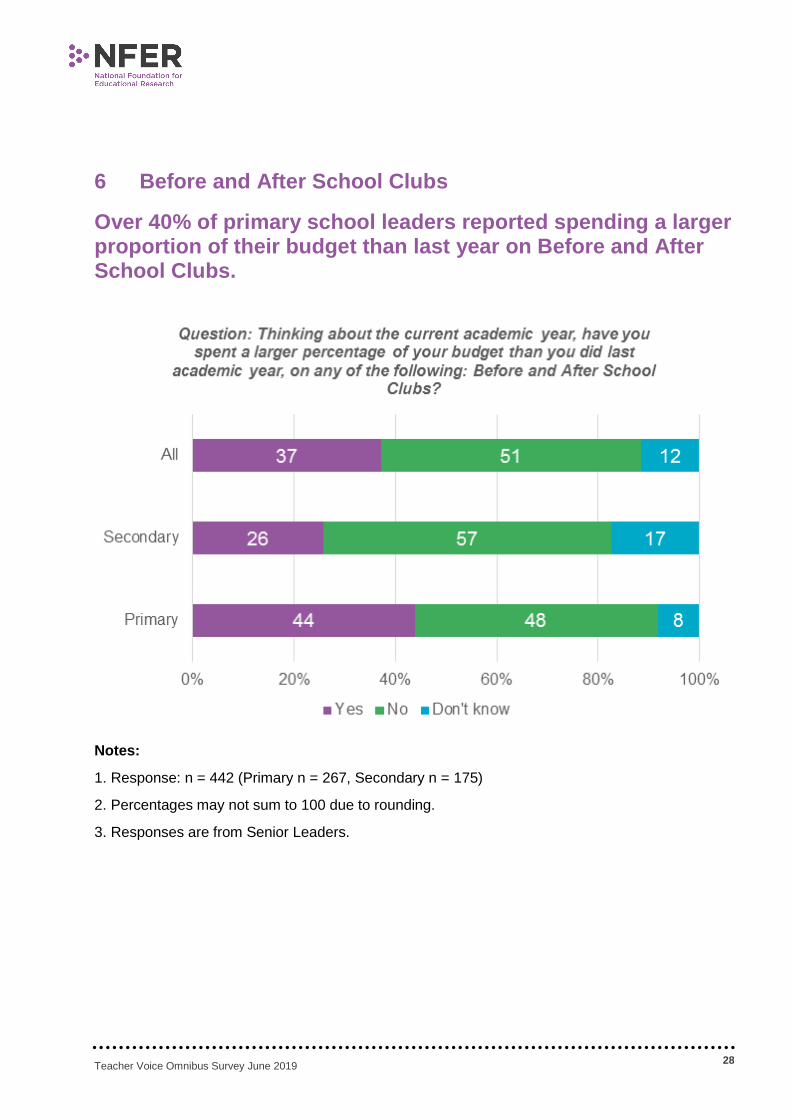
6 Before and After School Clubs
Over 40% of primary school leaders reported spending a larger proportion of their budget than last year on Before and After School Clubs.
Notes:
1. Response: n = 442 (Primary n = 267, Secondary n = 175)
2. Percentages may not sum to 100 due to rounding.
3. Responses are from Senior Leaders.

Teacher Voice Omnibus Survey June 2019 29
Of the primary school leaders who reported an increase in expenditure, almost 80% said they had not received additional funding to cover their increased costs.
Notes:
1. Response: n = 161 (Primary n = 116, Secondary n = 45)
2. Percentages may not sum to 100 due to rounding.
3. Responses are from Senior Leaders.
Teacher Voice Omnibus Survey June 2019 30
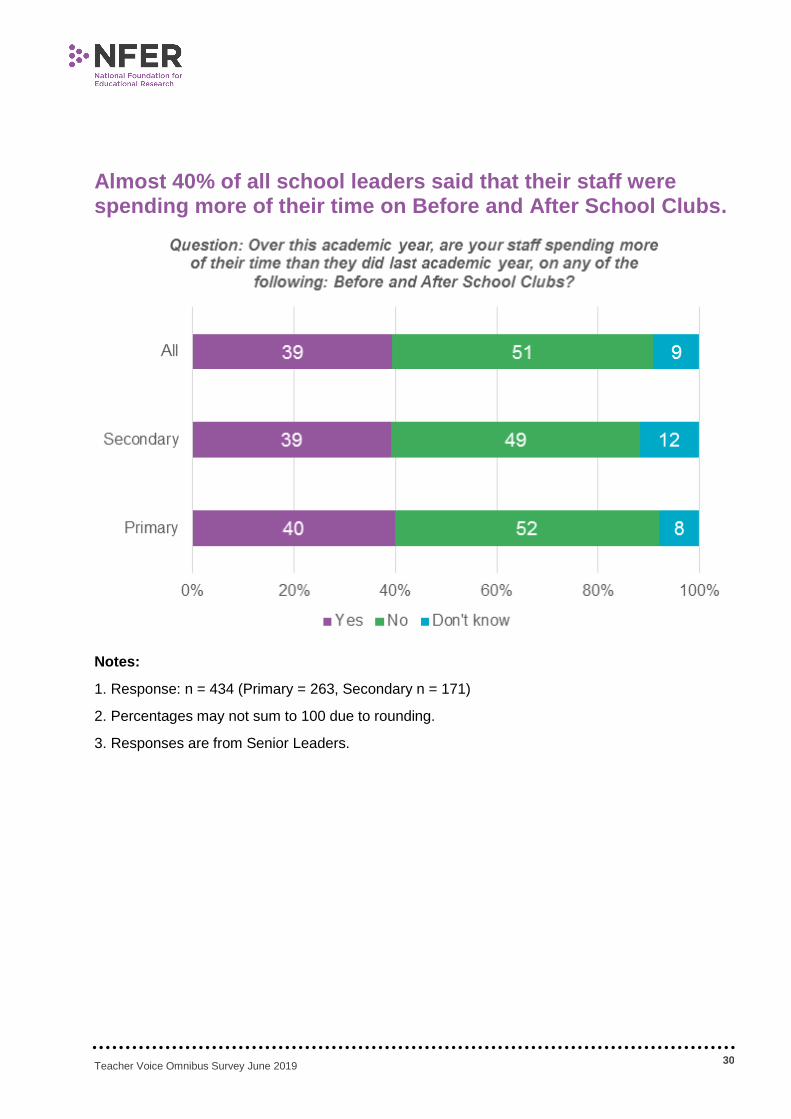
Almost 40% of all school leaders said that their staff were spending more of their time on Before and After School Clubs.
Notes:
1. Response: n = 434 (Primary = 263, Secondary n = 171)
2. Percentages may not sum to 100 due to rounding.
3. Responses are from Senior Leaders.

Teacher Voice Omnibus Survey June 2019 31
Almost 60% of school leaders said that teachers and teaching assistants with training had provided Before and After School Clubs.
Notes:
1. Response: n = 171 (Primary n = 105, Secondary n = 66)
2. More than one answer could be given so percentages may sum to more than 100.

Teacher Voice Omnibus Survey June 2019 32
Of the school leaders that reported their staff were spending more of their time on Before and After School Clubs, 14% said that these additional demands had ‘greatly increased’ workload.
Notes:
1. Response: n = 168 (Primary = 104, Secondary n = 64).
2. Percentages may not sum to 100 due to rounding.
3. Responses are from Senior Leaders.

Teacher Voice Omnibus Survey June 2019 33
7 Combined effects
Almost 70% of primary school leaders and 57% of secondary school leaders reported increased expenditure in three or more categories.
Notes:
1. Response: n = 448 (Primary n = 272, Secondary n = 176).
2. Percentages may not sum to 100 due to rounding.

Teacher Voice Omnibus Survey June 2019 34
Around 70-75% of primary and secondary school leaders reported increases in staff time spent on three or more categories. Almost 20% of secondary school leaders reported increases in all six categories.
Notes:
1. Response: n = 448 (Primary n = 272, Secondary n = 176)
2. Percentages may not sum to 100 due to rounding.

Evidence for excellence in education
Public
© National Foundation for Educational Research 2019
All rights reserved. No part of this document may be reproduced or transmitted
in any form or by any means, electronic, mechanical, photocopying, or otherwise,
without prior written permission of NFER.
The Mere, Upton Park, Slough, Berks SL1 2DQ
T: +44 (0)1753 574123 • F: +44 (0)1753 691632 • [email protected]
www.nfer.ac.uk