TEACHER RETIREMENT SYSTEM OF TEXAS Documents/actuarial...October 27, 2017 Board of Trustees Teacher...
71
TEACHER RETIREMENT SYSTEM OF TEXAS Actuarial Valuation Report As of August 31, 2017
-
Upload
phungnguyet -
Category
Documents
-
view
216 -
download
0
Transcript of TEACHER RETIREMENT SYSTEM OF TEXAS Documents/actuarial...October 27, 2017 Board of Trustees Teacher...

TEACHER RETIREMENT SYSTEM OF TEXAS Actuarial Valuation Report As of August 31, 2017

October 27, 2017
Board of Trustees
Teacher Retirement System of Texas
1000 Red River Street
Austin, TX 78701-2698
Subject: Actuary’s Certification of the Actuarial Valuation as of August 31, 2017
We certify that the information included herein and contained in the 2017 Actuarial Valuation Report
is accurate and fairly presents the actuarial position of the Teacher Retirement System of Texas (TRS)
as of August 31, 2017. This report was prepared at the request of the Board and is intended for use
by the TRS staff and those designated or approved by the Board. This report may be provided to
parties other than TRS staff only in its entirety and only with the permission of the Board.
All calculations have been made in conformity with generally accepted actuarial principles and
practices, and with the Actuarial Standards of Practice issued by the Actuarial Standards Board. In our
opinion, the results presented comply with the requirements of the Texas statutes and, where
applicable, the Internal Revenue Code, ERISA, and the Statements of the Governmental Accounting
Standards Board. The undersigned are independent actuaries. Mr. Siblik and Mr. Newton are
Enrolled Actuaries, members of the American Academy of Actuaries and are qualified to give a
Statement of Opinion. All are experienced in performing valuations for large public retirement
systems.
ACTUARIAL VALUATIONS
The primary purpose of the valuation report is to determine the adequacy of the statutory
contribution rates through measuring the resulting funding period, to describe the current financial
condition of the System, and to analyze changes in the System’s condition. In addition, the report
provides various summaries of the data. This report may not be appropriate for other purposes. The
information required by the System in connection with Governmental Accounting Standards Board
Statement No. 67 (GASB No. 67) will be provided under separate cover.
Valuations are prepared annually, as of August 31 of each year, the last day of the System’s plan and
fiscal year.
FINANCING OBJECTIVE OF THE PLAN
The employee, employer, and State contribution rates are established by Law that, over time, are
intended to remain level as a percent of payroll and provide assets to cover benefits when due. The

Board of Trustees October 27, 2017 Page 2
actuarially determined employer contribution rates determined in this actuarial valuation are
intended to provide for the normal cost plus the level percentage of payroll required to amortize
the unfunded actuarial accrued liability over a period not in excess of 30 years.
PROGRESS TOWARD REALIZATION OF FINANCING OBJECTIVE
The actuarial accrued liability, the unfunded actuarial accrued liability (UAAL), and the calculation of
the resulting funding period illustrate the progress toward the realization of financing objectives.
Based on this actuarial valuation as of August 31, 2017, the System’s under-funded status has
remained relatively unchanged at $35.5 billion as of August 31, 2017 compared to $35.5 billion as of
August 31, 2016. The System’s UAAL was expected to increase from the prior year based on the
deferral of investment losses from prior valuations. However, due to higher than expected
investment performance during the year, the System actually experienced a gain on the actuarial
value of assets. In addition, the System also experienced a gain due to demographic experience.
These two gains combined to decrease the UAAL by $1.1 billion. However, there was also a legislative
change to TRS-CARE which resulted in a change to the expected retirement patterns of TRS. The
legislative change was a reversal of changes to the expected retirement behavior that were adopted
following the 2013 session and increased the UAAL by $0.7 billion.
This valuation shows a normal cost equal to 9.94% of pay plus an addition to the normal cost of 0.12%
of pay to cover the annual cost of administrative expenses. The State began contributing the current
contribution rate of 6.80% in fiscal year 2014 and it is assumed the rate will remain at that level. In
addition, covered employers whose employees are not participating in Social Security began
contributing 1.50% of salary (capped at the minimum salary schedule) in fiscal year 2015. Combined
these contributions are assumed to approximate 7.70% of total payroll. The member contribution
began increasing in fiscal year 2015 and reached its ultimate rate of 7.70% in fiscal year 2017. As a
result, for FY2018 and thereafter, the System is expected to receive a total contribution rate of
15.40% of pay.
Hence, there is expected to be 5.34% of pay available to amortize the UAAL (15.40% less normal cost
of 9.94% less administrative expenses of 0.12%). If payroll grows as expected (2.5% per year), the
contributions provided by this portion of the contribution rate are sufficient to amortize the current
unfunded actuarial accrued liabilities of the System over a period of 32.2 years based on the
smoothed asset value as the valuation date. Therefore, the financing objectives of the System are not
currently being met.
The actuarial valuation report as of August 31, 2017 reveals that the funded ratio (the ratio of
actuarial assets to actuarial accrued liability) is 80.5%. The funded status is one of many metrics used
to show trends and develop future expectations about the health of the System. The funded status
measure itself is not appropriate for assessing the sufficiency of plan assets to cover the estimated
cost of settling the plan’s benefit obligations or assessing the need for or the amount of future
contributions since it does not reflect normal cost contributions, the timing of amortization
payments, or future experience other than expected.

Board of Trustees October 27, 2017 Page 3
The System earned more than the assumed rate of return during fiscal year 2017 (12.9% on market
value compared to an assumed 8.0%). This return more than offset the prior year’ deferred
investment losses. In fact, the System experienced an actuarial gain on assets and is now deferring
net investment gains of $1.1 billion and the funded status using the market value of assets is 81.1%.
If there are no significant investment losses or other actuarial losses over the next several years, the
funded status of the System would be expected to increase towards this number. This $1.1 billion in
net deferred gains compares to the last valuation when the System was deferring $4.8 billion in net
deferred losses and had a 76.9% funded ratio based on the market value of assets.
As stated previously, the System’s UAAL is relatively unchanged from the prior year. The UAAL had
been expected to increase by $0.4 billion without any gains or losses thus the UAAL decreased by $0.4
billion more than expected during the year. The fiscal year 2017 investment return completely offset
the prior years’ deferred investment losses and resulted in a gain of $0.3 billion on the actuarial value
of assets. Therefore, the liabilities actually increased $0.1 billion less than expected. This $0.1 billion
gain can split into the impact of the legislative change which increased the liabilities by $0.7 billion
and a liability experience gain of $0.8 billion. This $0.8 billion represents a gain of 0.46% of total
liabilities and was due to the liabilities growing slower than expected due to salary increases being
less than expected, more terminations than expected and fewer retirements than expected during
the year.
Based on the actuarial (smoothed) value of assets, the number of years needed to amortize the
UAAL will decrease annually if all assumptions are met. Please note that this annual decrease in the
funding period will only occur if the currently scheduled contribution levels remain in place over the
funding period. Any decrease in the contribution rates will result in higher funding periods. It
should be noted that with the $1.1 billion in deferred investment gains still to be recognized in the
actuarial value of assets, future gains in the actuarial value of assets will result in a decrease in the
funding period in future valuations until the gains are fully recognized.
Due to the current funding policy which utilizes level percentage of payroll amortization, the
amortization payments will not be sufficient to cover all of the interest charges on the UAAL until the
funding period reaches approximately 20 years. Table 11a provides a 10 year projection of various
valuation results, including the UAAL, and that projection shows the UAAL is expected to increase to
$38.7 billion in 2027. Extending the projection further would show the UAAL starts to decrease in
2028 and is fully amortized 20 years after that (assuming 8% return on the market value of assets).
Please note these expectations are based on the current benefit provisions, assumptions, and
contribution rates. Any additional benefit enhancements (ad hoc COLAs) granted without additional
funding would increase the ultimate UAAL and extend the period before the funding status begins to
improve. Thus, we continue to advise against any future benefit enhancements without additional
sources of funding.

Board of Trustees October 27, 2017 Page 4
PLAN PROVISIONS
The plan provisions used in the actuarial valuation are described in Appendix 1 of the valuation report. There have been no changes to the benefit and contribution provisions of the System since the prior valuation. DISCLOSURE OF PENSION INFORMATION
Beginning with fiscal year 2014, the System began reporting financial information in accordance with
Governmental Accounting Standards Board (GASB) Statement No. 67. The disclosure information for
GASB No. 67 is provided in a separate report and is not contained herein.
This report should not be relied on for any purpose other than the purpose described above. Determinations of the financial results associated with the benefits described in this report in a manner other than the intended purpose may produce significantly different results.
ACTUARIAL METHODS AND ASSUMPTIONS
The actuarial methods and assumptions have been selected by the Board of Trustees of the Teacher Retirement System of Texas based upon our analysis and recommendations. These assumptions and methods are detailed in Appendix 2 of the valuation report. The Board of Trustees has sole authority to determine the actuarial assumptions used for the plan. The actuarial methods and assumptions are primarily based on a study of actual experience for the four year period ending August 31, 2014 and adopted on September 24, 2015. The retirement rates for selected individuals were modified to reflect changes to TRS-CARE. No other changes in the actuarial assumptions or methods were made since the prior valuation. The next experience study is scheduled to be performed in the spring of 2018.
The results of the actuarial valuation are dependent on the actuarial assumptions used. Actual
results can and almost certainly will differ, as actual experience deviates from the
assumptions. Even seemingly minor changes in the assumptions can materially change the
liabilities, calculated contribution rates and funding periods. To illustrate this point, on page 8 of
this report we have shown illustrative results based on future investment experience deviating from
the assumptions. Based on the scope of this engagement, we have not performed analysis on the
potential range of future measurements based on other factors. The actuarial calculations are
intended to provide information for rational decision making.
In our opinion, the actuarial assumptions used are appropriate for purposes of the valuation and
are internally consistent and reasonably related to the experience of the System and to reasonable
expectations.
Data
Member data for retired, active and inactive members was supplied as of August 31, 2017 by the
TRS staff. The staff also supplied asset information as of August 31, 2017. We did not audit this

Board of Trustees October 27, 2017 Page 5
data, but we did apply a number of tests to the data and concluded that it was reasonable and
consistent with the prior year's data. GRS is not responsible for the accuracy or completeness of the
information provided to us by TRS.
The following schedules in the Actuarial Section of the TRS CAFR were prepared by GRS:
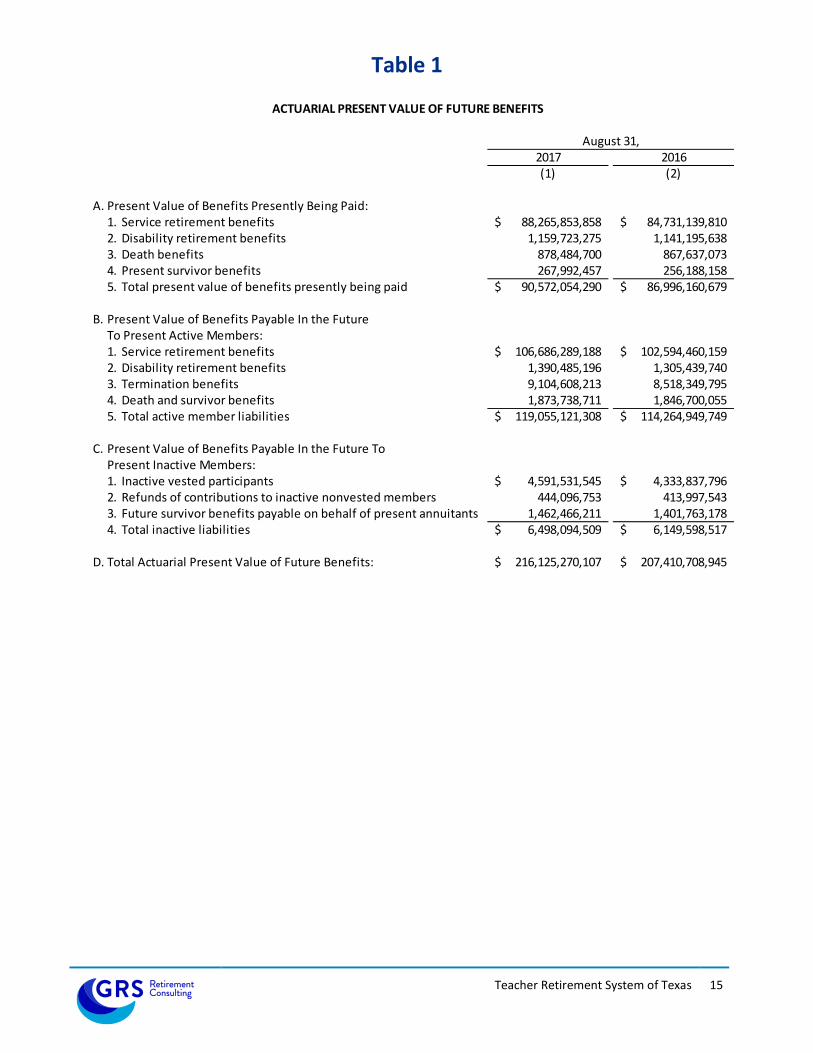
Actuarial Present Value of Future Benefits
Schedule of Retirees and Beneficiaries Added to and Removed from Rolls
Schedule of Funding Progress
Post-Retirement Mortality
Rates of Retirement
Probability of Decrement due to Withdrawal
Active Mortality
All other schedules shown in the actuarial section were prepared by TRS staff based upon our work.
For further information please see the full actuarial valuation report.
This document and the PowerPoint presentation of the actuarial valuation results presented to the
TRS Board on December 7, 2017 comprise the full actuarial report.
Respectfully submitted,
Gabriel, Roeder, Smith & Company
Lewis Ward Daniel J. Siblik, ASA, EA, MAAA Consultant Consultant
Joseph P. Newton, FSA, EA, MAAA Pension Market Leader and Actuary J:\3013\2017\VAL\2017 TRS Val Report.docx

Table of Contents
Teacher Retirement System of Texas
Page
COVER LETTER
SECTION A DISCUSSION 1
EXECUTIVE SUMMARY 2
INTRODUCTION 5
FUNDED STATUS OF THE SYSTEM 6
SENSITIVITY TO INVESTMENT PERFORMANCE 8
GASB DISCLOSURE 9
CHANGE IN ASSETS DURING THE YEAR 10
ACTUARIAL GAINS/(LOSSES) AND THE FUNDING PERIOD 11
SUMMARY AND CLOSING COMMENTS 12
SECTION B ACTUARIAL TABLES 14
APPENDIX 1 SUMMARY OF BENEFIT PROVISIONS OF THE RETIREMENT SYSTEM 40
APPENDIX 2 SUMMARY OF ACTUARIAL ASSUMPTIONS AND METHODS 53
GLOSSARY DEFINITIONS OF ACTUARIAL TERMS 63

0
SECTION A
DISCUSSION
Teacher Retirement System of Texas 2
Executive Summary
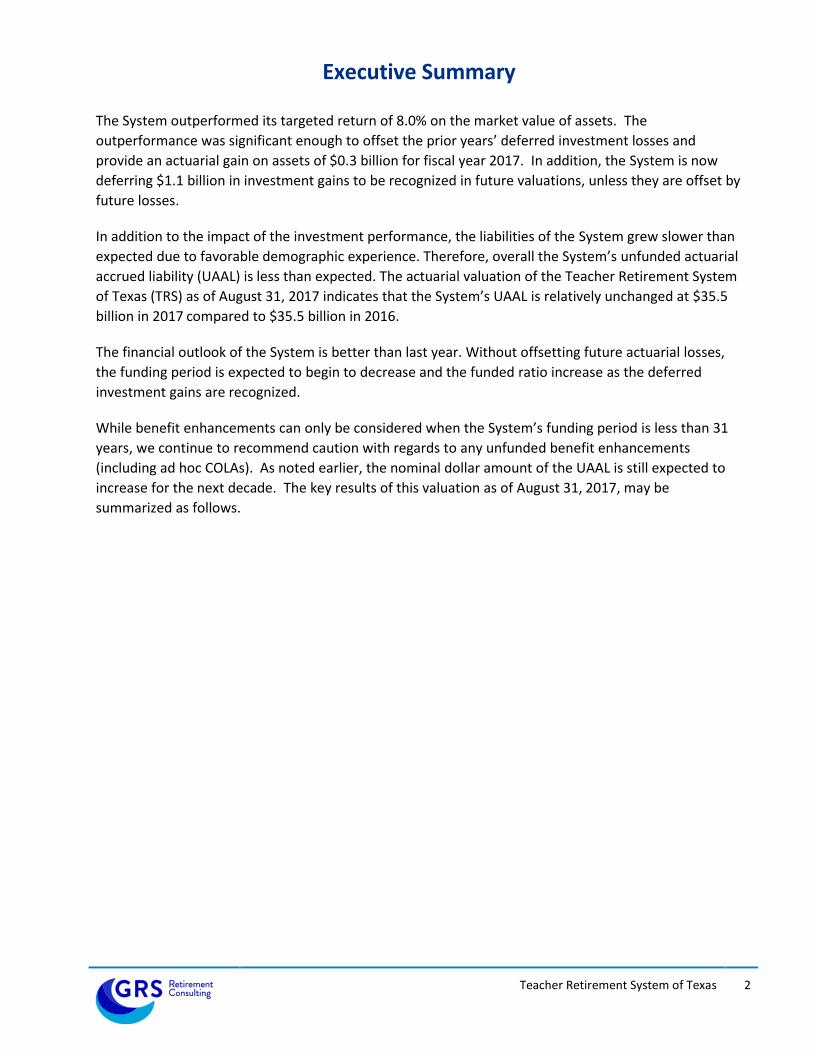
The System outperformed its targeted return of 8.0% on the market value of assets. The
outperformance was significant enough to offset the prior years’ deferred investment losses and
provide an actuarial gain on assets of $0.3 billion for fiscal year 2017. In addition, the System is now
deferring $1.1 billion in investment gains to be recognized in future valuations, unless they are offset by
future losses.
In addition to the impact of the investment performance, the liabilities of the System grew slower than
expected due to favorable demographic experience. Therefore, overall the System’s unfunded actuarial
accrued liability (UAAL) is less than expected. The actuarial valuation of the Teacher Retirement System
of Texas (TRS) as of August 31, 2017 indicates that the System’s UAAL is relatively unchanged at $35.5
billion in 2017 compared to $35.5 billion in 2016.
The financial outlook of the System is better than last year. Without offsetting future actuarial losses,
the funding period is expected to begin to decrease and the funded ratio increase as the deferred
investment gains are recognized.
While benefit enhancements can only be considered when the System’s funding period is less than 31
years, we continue to recommend caution with regards to any unfunded benefit enhancements
(including ad hoc COLAs). As noted earlier, the nominal dollar amount of the UAAL is still expected to
increase for the next decade. The key results of this valuation as of August 31, 2017, may be
summarized as follows.

Teacher Retirement System of Texas 3
Executive Summary (Continued)
2017 2016
Membership
• Number of
- Active members# 864,261 847,673
- Service retirees 379,765 370,761
- Disabled retirees 11,802 9,650
- Beneficiaries 16,201 13,503
- Inactive, vested 98,110 95,078
- Inactive, nonvested 174,918 167,275
- Total 1,545,057 1,503,940
• Projected Payroll for Contributions $ 43.164 billion $ 42.376 billion
Statutory contribution rates
• Combined State/Employers * 7.700% 7.700%
• Member 7.700% 7.700%
Actuarial Information
• Normal cost % 9.94% 9.93%
• Unfunded actuarial accrued liability (UAAL) $ 35.471 billion $ 35.453 billion
• UAAL as % of pay 82.2% 83.7%
• Funded ratio 80.5% 79.7%
• Funding period (years) 32.2 33.6
• Actuarially Determined Employer Contribution (ADEC) 7.85% 7.94%
(30 Year Amortization based on the Actuarial Value of
Assets) **
Item
# Includes members in DROP * Beginning in fiscal year 2015, covered employers whose employees are not participating in Social Security began
contributing 1.50% of the minimum salary schedule. Combined it is expected that these contributions will be approximately 7.70% of total payroll.
** Aggregate contribution rate for State and local employers.

Teacher Retirement System of Texas 4
Executive Summary (Continued)
2017 2016
Assets
• Market value $ 147.362 billion $ 134.009 billion
• Actuarial value 146.282 billion 138.786 billion
• Estimated yield on market value 12.9% 7.3%
• Estimated yield on actuarial value 8.2% 6.9%
• Ratio of actuarial to market value 99.3% 103.6%
• Employee contributions, including service purchases $ 3,297.6 million $ 2,981.1 million
• State contributions 1,722.9 million 1,699.6 million
• Employer contributions 1,588.3 million 1,483.4 million
• Benefit, refund, and expense payments 10,698.0 million 10,200.0 million
• Net external cash flow (4,089.1) million (4,036.0) million
Gains/(losses)
• Asset experience $ 270.0 million $ (1,503.5) million
• Assumption changes/Legislative changes (700.9) million 0.0 million
• Liability experience 827.9 million (455.8) million
• Total $ 397.0 million $ (1,959.3) million
Actuarial Information based on Market Value of Assets
• Unfunded actuarial accrued liability (UAAL) $ 34.391 billion $ 40.230 billion
• UAAL as % of pay 79.7% 94.9%
• Funded ratio 81.1% 76.9%
• Funding period (years) 29.6 53.5
• Actuarially Determined Employer Contribution (ADEC) 7.69% 8.70%
Item
UAAL
($ Millions) Funding Period
(2) (3)
1. 2016 Valuation $35,453 34
2. Restated 2016 Valuation with Legislative changes (if applicable) 35,453 34
3. Expected 2017 UAAL using actual contributions* 35,868 32
4. 2017 UAAL using expected assets and actual liabilities 35,040 31
5. 2017 UAAL using actual assets and liabilities, expected payroll 34,770 30
6. 2017 UAAL using actual payroll 34,770 31
7. 2017 UAAL after impact of legislative change to TRS Care 35,471 32
* The funding period for this entry uses the expected UAAL and expected payroll.
Expected payroll is the prior year's valuation payroll, increased by the 2.5% payroll growth rate.
(1)
Item

Teacher Retirement System of Texas 5
Introduction
The valuation of the Teacher Retirement System of Texas (TRS) as of August 31, 2017, reflects the
following contribution rates: (a) a member contribution rate of 7.70%, and (b) a State/Employer
combined contribution rate approximating 7.70%. For purposes of determining the funding period, it
was assumed that these contribution rates (both member and State/employer) would remain in place
indefinitely.
In preparing this valuation, Gabriel, Roeder, Smith & Company (GRS) has relied on employee data and
asset information provided by the staff of the Teacher Retirement System. While not verifying the data
at their source, GRS has performed such tests for consistency and reasonableness as has been deemed
necessary to be satisfied with the appropriateness of using the data supplied.
Section A contains an executive summary of the most significant valuation results. The basic results of
the valuation are covered on pages 6 – 7. Page 8 discusses the sensitivity of the funded status to future
investment performance. Page 10 provides analysis and discussion of changes in assets. Page 11
produces a determination of actuarial gains and losses for the year and an analysis of the change in the
funding period since the prior year's valuation. Page 12 summarizes the findings of the valuation, and
Section B provides the tables supporting the report.
There have been no changes in the benefit provisions of TRS since the prior valuation. Please see
Appendix 1 of this report for a summary of the major benefit provisions of the System.
As noted previously, the retirement rates for a certain group of employees were modified to reflect the
legislative changes to TRS-CARE. There have been no other changes to the actuarial assumptions or
methods since the prior valuation. The current actuarial assumptions were adopted by the Board of
Trustees on September 24, 2015 and were effective with the August 31, 2015 valuation. For a detailed
description of the actuarial assumptions and methods please see Appendix 2 of this report.

Teacher Retirement System of Texas 6
Funded Status of the System
Table 3 details the normal cost of the Retirement System by its various components. This normal cost is
developed based on the valuation method known as the entry-age-normal actuarial cost method. The
normal cost to pay for the benefits earned under the Retirement System is 9.94% of pay, this amount
being inclusive of the amount contributed by the employees. In addition, to the cost of benefits we add
an addition to the normal cost to cover annual administrative expenses. It is estimated that
administrative expense will be approximately 0.12% of payroll. Thus, the total normal cost is 10.06% of
pay and the net employer normal cost is 2.36% of pay based on the member contribution rate of 7.70%.
The State’s contribution rate increased to 6.8% in fiscal year 2014. Beginning in fiscal year 2015, covered
employers whose employees are not participating in Social Security began contributing 1.50% of the
minimum salary schedule. Combined with the State contribution, it is expected that these aggregate
contributions will be approximately 7.70% of total payroll. Since the total State/employer contribution
rate is 7.70%, this allows 5.34% of pay contributed by the State to be available to amortize any unfunded
actuarial accrued liabilities.
As stated above, the funding period for the System is determined under the entry-age-normal actuarial
cost method based on a level percentage of pay. The key points of this method are as follows:
1. The "normal cost" for the System is deemed to be equal to the average cost of benefits for
newly hired participants.
2. The "actuarial accrued liability" for benefits payable in the future to present active members is
calculated as the present value of benefits payable in the future to present active members
less the present value of future normal costs.
3. Funding of the unfunded actuarial accrued liability (UAAL) is a function of the rate of future
growth in total covered payroll and the contributions established in state statute.
Table 5 develops the funding period under the above approach not only for the current valuation, but also for the valuation as of August 31, 2016. As shown in Item A3 of Table 5, the normal cost for the System consists of the entire 7.70% of pay contributed by the members plus 2.36% of pay from the State/employers. As developed in Item A4, the 7.70% of pay contributed by the State/employers is 5.34% of pay more than the State’s share of the normal cost. From an actuarial perspective, the contribution rate in excess of the System’s normal cost should be sufficient to amortize the UAAL over a reasonable period of time. The ultimate contribution rate in excess of the System’s normal cost (5.34%) is sufficient to amortize the System’s UAAL over a period of 32.2 years (assuming all actuarial assumptions are exactly met).
Table 2 provides an overall summary of key actuarial data for the 2017 valuation, with comparative data
for 2016. This information is summarized from the other tables, which supply more detail. Its value is in
providing in one convenient place key comparative valuation results.

Teacher Retirement System of Texas 7
Funded Status of the System (Continued)
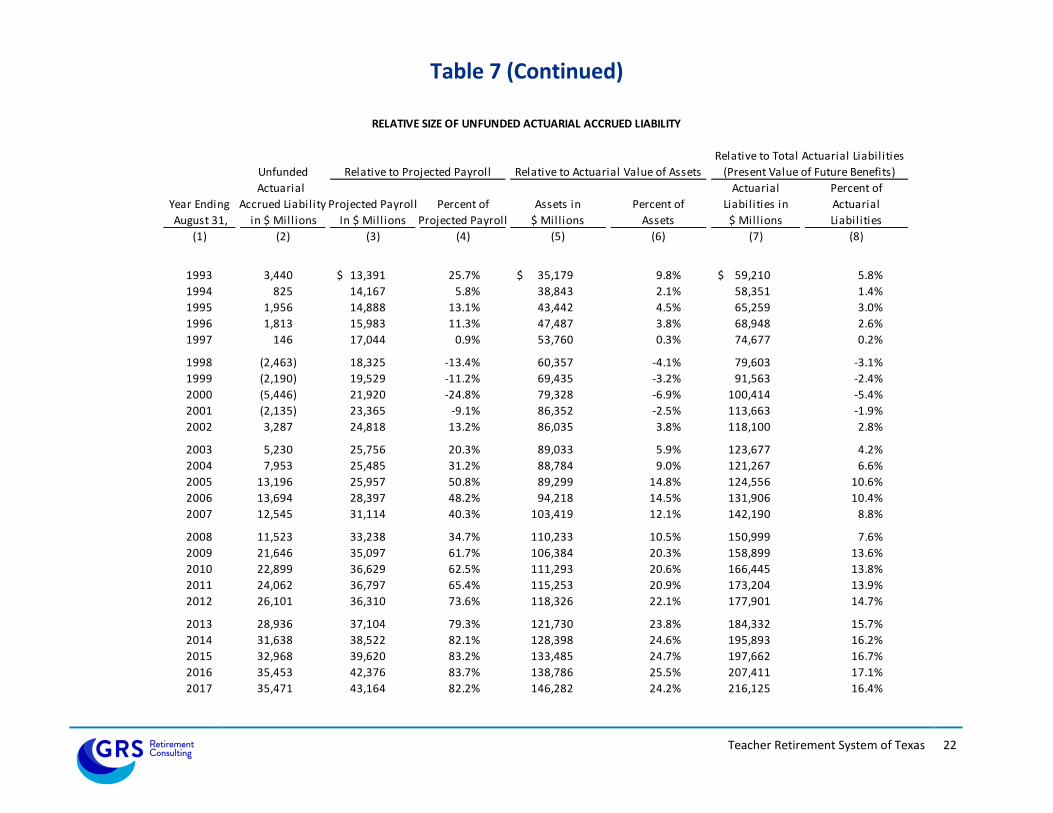
Table 7 offers a comparative view of the unfunded actuarial accrued liability (UAAL). It compares the
UAAL with three items: the covered payroll for the year, the total actuarial value of assets at the end of
the year, and the total actuarial liabilities (or, equivalently, the total present value of future benefits) as of
the valuation date.
The UAAL as shown in Item B4 of Table 5 is $35.5 billion for 2017, relatively the same as $35.5 billion in
2016. As indicated in the table, the UAAL equals the difference between the total actuarial accrued
liability (Item B2d) and current actuarial assets (Item B3). The excess contributions above the normal cost
will be used to help reduce the UAAL. As a result of favorable investment experience from the past year,
the System is now deferring $1.1 billion in net investment gains (the difference between the market value
of assets and the actuarial value of assets).
In determining the number of years that will be required to amortize the UAAL, an assumption is made
concerning future growth of the payroll of the System. Our current assumption is 2.50% per year. There
is no provision for membership growth in the payroll growth assumption.
As shown in Item B6 of Table 5 and using the assumed rate of increase in covered payroll of 2.50%, the
period to fund the UAAL is 32.2 years. The funding periods using alternate payroll growth assumptions
are also shown. An analysis of the change in the UAAL and the funding period since the 2016 valuation is
shown on Table 10.
The actuarial value of assets is developed in Table 4. It should be remembered that the intent of the
actuarial asset valuation method is to smooth out year-to-year fluctuations in market rates of return. The
current asset method determines the expected actuarial value of assets and then recognizes at least 20%
of the difference between that expected actuarial value of assets and the actual market value of assets.
As shown in Item 8 of Table 4, if the current year’s difference between expected and actual investment
income is of the opposite sign from the remaining deferred excesses/shortfalls, then this year’s difference
is directly offset against any prior year bases of the opposite sign (starting with the oldest base and
working forward).
Any remaining bases are then recognized over the remaining number of years. This is intended to ensure
the smoothed value of assets will converge towards the market value in a reasonable and finite amount of
time. This year’s excess investment income of $6.1 billion completely offset the prior years’ remaining
investment losses, with $1.3 billion remaining. After recognizing 20% of this amount ($270 million) in this
year’s actuarial assets, $1.1 billion in deferred investment gains remain to be recognized in future
valuations. The actuarial value of assets is $146.3 billion as shown in Item 9 of Table 4.
The actuarial asset yield for 2017 is 8.2%, which is more than the assumed rate of 8.0%. The market return
for fiscal year 2017 was 12.9%. As noted above, the System has a funding period of 32.2 years. The
System has an unfunded liability of $35.5 billion, and $1.1 billion in net deferred investment gains.
Without offsetting actuarial losses, the funding period is expected to decrease more rapidly over the next
several years.

Teacher Retirement System of Texas 8
Sensitivity to Investment Performance
Table 11b provides several additional risk metrics that can help relate the size of the investment risk to
the System, the Sponsor, and the membership. As shown on Table 11b, the assets are currently 3.4
times as large as the covered payroll (source of funding). Based on this ratio, a 10% decrease in the
asset levels that was never recovered by future gains would increase the 30-year contribution
requirement by 2.27% of payroll (from the current 7.85% employer ADEC to 10.12%) and decrease the
funded ratio by 8% (from 80.5% to 72.5%). Table 11b also shows how these metrics have changed over
time. As a System matures and/or achieves higher funded ratios, these risk metrics will actually show
proportionately higher investment risk.
The following exhibit projects the actuarial status of the System as of August 31, 2017 based on varying
actual investment returns over the next few years. All other assumptions are assumed to be met,
including the continuation of the new statutory member and employer contribution rates.
Based on an 4.0% Actual Investment Return on
Market
Based on an 8.0% Actual Investment Return on
Market
Based on an 12.0% Actual Investment Return on
Market
Funded Ratio Measured By:
August 31,
Actuarial Value of Assets
Market Value of Assets
Actuarial Value of Assets
Market Value of Assets
Actuarial Value of Assets
Market Value of Assets
(1) (2) (3) (4) (5) (6) (7)
2017 80.5% 81.1% 80.5% 81.1% 80.5% 81.1%
2018 80.3% 78.4% 81.0% 81.4% 81.6% 84.5% 2019 79.8% 75.9% 81.7% 82.0% 83.6% 88.4% 2020 78.6% 73.4% 82.4% 82.6% 86.3% 92.5% 2021 76.7% 70.8% 83.1% 83.1% 89.8% 97.0% 2022 74.3% 68.2% 83.7% 83.7% 94.1% 101.7%
The future liability is calculated by rolling forward the liabilities as of August 31, 2017, taking into
account interest and benefit payments for the year, including mortality incidence and anticipated cost
of living increases (none in this case). The 8.0% scenario above coincides with the actuarial investment
return assumption of 8.0%. The 4.0% and 12.0% scenarios were selected because there is statistically a
high probability of the return for a five-year period being within +/- 4% of the expected return.
The scenarios above are for illustration purposes only and are in no way to be used as expected
investment performance. There are no other deviations from the expected taken into consideration
besides the asset performance. Careful consideration of this projection should be taken into account
before any benefit enhancement is adopted. Note that under the 8% return scenario, the funded ratio
based on actuarial assets and market assets will have converged by FY2022 and are both expected to
trend upward.

Teacher Retirement System of Texas 9
GASB Disclosure
The System prepares its financial accounting and disclosure information in accordance with
Governmental Accounting Standards Board (GASB) Statement No. 67.
We provide a separate accounting report with the required disclosures under this accounting standard.

Teacher Retirement System of Texas 10
Change in Assets During the Year
This section provides an analysis of the change in the Plan Net Assets during the year and an estimate
of the yield on mean assets of the total System. Table 8a shows a rearrangement of some of the tables
included in the annual financial statements of the System. Table 8b shows the estimated yield on a
market value basis and on the actuarial asset valuation method.
To determine estimated yield on "mean assets", the traditional insurance company formula for yield
rates is used. The estimated yield is derived by dividing the appropriate income by the corresponding
mean assets. This is a “dollar weighted” rate of return, and will differ slightly from the “time weighted”
return shown in the System’s CAFR.
As indicated by Item A4 of Table 8b, the estimated yield on mean market value is 12.9%, following a
7.3% return in 2016. The actuarial asset yield (Item B4) is 8.2%, compared to 6.9% in 2016, and
compared to the 8% assumption rate. This difference in the estimated yield on market value and
actuarial value illustrates the smoothing effect of the asset valuation method.
As mentioned earlier in the report, the investment results on an actuarial value basis are favorable for
the 2016/2017 plan year. On an actuarial value basis the System is above its 8% assumption rate by
0.2%. As a result, the System had an actuarial investment gain of $0.4 billion. It should also be noted
that the asset valuation method is still deferring $1.1 billion in unrecognized net gains into future years.
Absent future adverse investment experience, these deferred gains will be recognized over future
actuarial valuations.

Teacher Retirement System of Texas 11
Actuarial Gains/( Losses) and the Funding Period
As previously noted, the unfunded actuarial accrued liability (UAAL) remained relatively unchanged at
$35.5 billion in 2016 compared to $35.5 billion in 2017. Since the UAAL was expected to increase, we
are better off than expected. As such, the System’s funding period has decreased from 33.6 in 2016 to
32.2 years in 2017. The purpose of this section is to determine the source of the gains and losses and
the impact of those gains and losses on the funding period.
The previous section has discussed the change in assets for the year. Table 4 takes the information
contained in Table 8 and develops the actuarial assets for this valuation, based on the investment
return assumption of 8%. Table 8b develops the estimated yield for the year based on two measures of
asset values
As shown in Table 4, the expected value of actuarial assets as of August 31, 2017 is $146.0 billion
(expected if the fund would have earned 8% on the actuarial value), and the actual value of actuarial
assets as of the valuation date is $146.3 billion. Thus the asset gain for the year is the difference
between the actual value and the expected value, or $0.3 billion (as shown in Item 10). Item 11
indicates that this gain represents 0.18% of this year's actuarial assets. This asset gain for the year is a
direct reflection of the estimated yield for the year based on the value of actuarial assets, namely 8.2%
(as shown in Item B4 of Table 8b).
Table 9 develops the total actuarial gain/(loss) for the year and separates it between the asset
gain/(loss) and the liability gain/(loss). The items in Table 9 that are used to develop the expected UAAL
as of August 31, 2017 are derived from Table 5 and Table 8. The total actuarial gain for the year is seen
to be $0.4 billion.
In addition to the $0.3 billion asset gain for the year there was a $0.7 billion increase in the UAAL due to
a legislative change and a net liability experience gain of $0.8 billion. The most significant source of
liability gains came from salary increases being lower than expected and the number of terminations
being greater than assumed. It should be noted that the $0.8 billion represents approximately 0.46% of
the total liability, so this magnitude of variance is well within normal patterns.
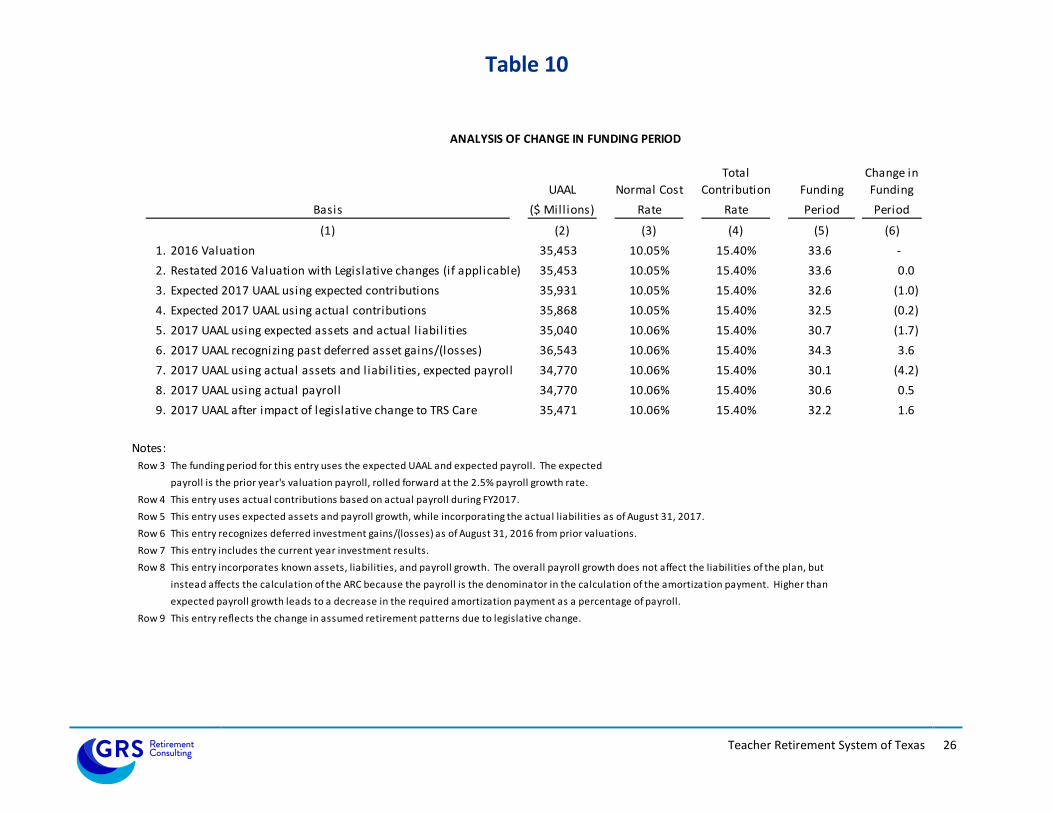
Table 10 traces the changes in the UAAL and the funding period from the valuation as of August 31,
2016, to August 31, 2017. Item 4 of Table 10 shows the funding status if there had been no actuarial
gains or losses in the areas of assets, liabilities, and reflecting the actual State contributions for the
2016/2017 plan year. The UAAL would have increased during the year to $35.9 billion. Item 5 of Table
10 illustrates that the overall liability gain decreased the UAAL to $35.0 billion and that the prior years’
investment experience, as shown in Item 6, was expected to increase the UAAL to $36.5 billion.
However, Item 7 shows that the current year’s investment experience completely offset the prior years’
impact and further decreased the UAAL to $34.8 billion and decreased the funding period to 30.1 years.
Item 8 shows the impact on the funding period of the covered compensation growing at a slower rate
than the prior year’s assumed rate of 2.5%, which increase the funding period to 30.6 years. Finally,
Item 9 shows the expected impact of the legislative changes to TRS-CARE. The legislative change
increased the UAAL to $35.5 billion and the funding period to 32.2 years.

Teacher Retirement System of Texas 12
Summary and Closing Comments
The results of the actuarial valuation of the Teacher Retirement System as of August 31, 2017 are
positive. There was both a liability experience gain and an actuarial gain on the actuarial value of assets
which kept the UAAL approximately the same as the prior year, compared to the expected increase of
$0.4 billion. In addition, the funding period, which was expected to increase due to the recognition of
the prior years’ deferred investment losses, decreased.
The System’s funded status is 80.5% on actuarial basis, and the funded status using the market value of
assets is 81.1%. If there are no significant investment losses or other actuarial losses over the next
several years, the funded status of the System would be expected to increase as the deferred
investment gains are fully recognized.
It is important to understand that while the negotiation process by the Legislature included an ad hoc
COLA paid to retirees in September of 2013, the legislation also included substantial increases in
contribution rates. This should be the model used in any future year that a COLA is considered. In past
negotiations, there were times that COLAs and retroactive benefit enhancements were granted without
additional funding sources and that eventually deteriorated the financial health of the System.
Thus, we continue to urge caution in granting future unfunded additional liabilities without additional
funding. As of now, based on the current benefit levels, the dollar amount of the unfunded actuarial
accrued liability is expected to increase for more than a decade before it is projected to begin
decreasing. Adding additional unfunded liabilities will only increase the amount further and place more
risk on future generations.

SECTION B
ACTUARIAL TABLES
Teacher Retirement System of Texas 14
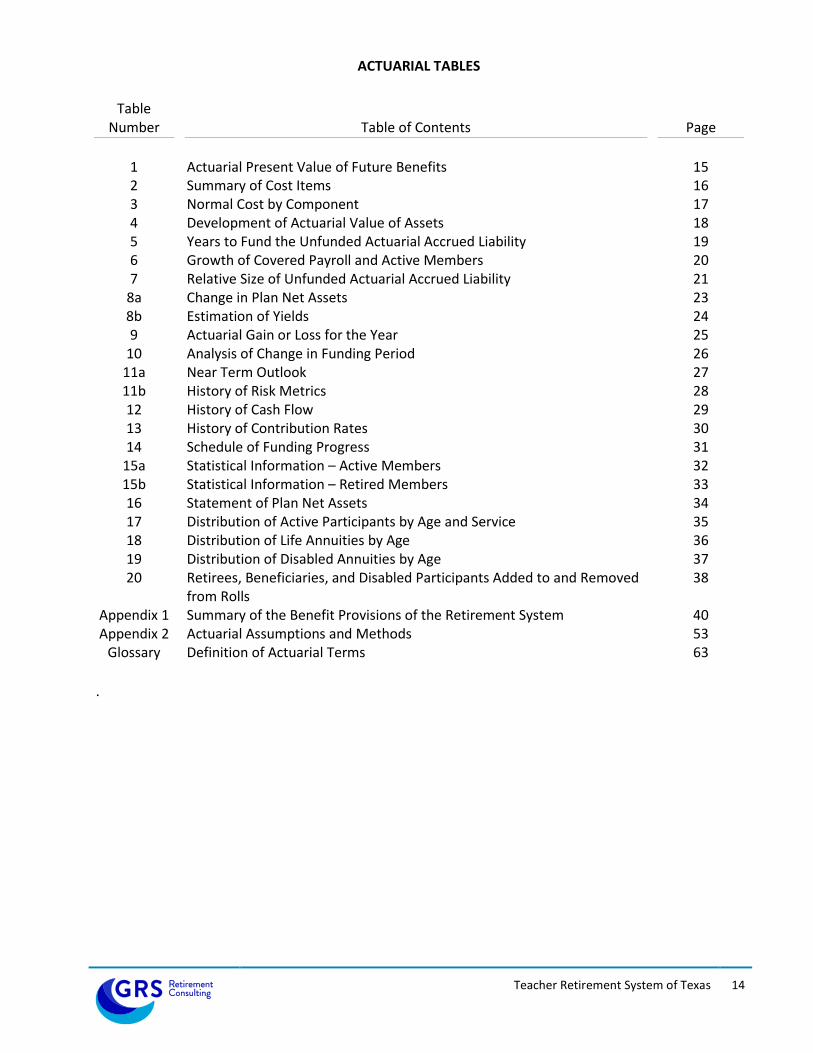
ACTUARIAL TABLES
Table Number
Table of Contents
Page
1 Actuarial Present Value of Future Benefits 15 2 Summary of Cost Items 16 3 Normal Cost by Component 17 4 Development of Actuarial Value of Assets 18 5 Years to Fund the Unfunded Actuarial Accrued Liability 19 6 Growth of Covered Payroll and Active Members 20 7 Relative Size of Unfunded Actuarial Accrued Liability 21
8a Change in Plan Net Assets 23 8b Estimation of Yields 24 9 Actuarial Gain or Loss for the Year 25
10 Analysis of Change in Funding Period 26 11a Near Term Outlook 27 11b History of Risk Metrics 28 12 History of Cash Flow 29 13 History of Contribution Rates 30 14 Schedule of Funding Progress 31
15a Statistical Information – Active Members 32 15b Statistical Information – Retired Members 33 16 Statement of Plan Net Assets 34 17 Distribution of Active Participants by Age and Service 35 18 Distribution of Life Annuities by Age 36 19 Distribution of Disabled Annuities by Age 37 20 Retirees, Beneficiaries, and Disabled Participants Added to and Removed
from Rolls 38
Appendix 1 Summary of the Benefit Provisions of the Retirement System 40 Appendix 2 Actuarial Assumptions and Methods 53
Glossary Definition of Actuarial Terms 63
.
Teacher Retirement System of Texas 15
Table 1
ACTUARIAL PRESENT VALUE OF FUTURE BENEFITS
August 31,2017 2016(1) (2)
A. Present Value of Benefits Presently Being Paid:1. Service retirement benefits 88,265,853,858$ 84,731,139,810$ 2. Disability retirement benefits 1,159,723,275 1,141,195,638 3. Death benefits 878,484,700 867,637,073 4. Present survivor benefits 267,992,457 256,188,158 5. Total present value of benefits presently being paid 90,572,054,290$ 86,996,160,679$
B. Present Value of Benefits Payable In the Future
To Present Active Members:1. Service retirement benefits 106,686,289,188$ 102,594,460,159$ 2. Disability retirement benefits 1,390,485,196 1,305,439,7403. Termination benefits 9,104,608,213 8,518,349,7954. Death and survivor benefits 1,873,738,711 1,846,700,055 5. Total active member liabilities 119,055,121,308$ 114,264,949,749$
C. Present Value of Benefits Payable In the Future To Present Inactive Members:1. Inactive vested participants 4,591,531,545$ 4,333,837,796$ 2. Refunds of contributions to inactive nonvested members 444,096,753 413,997,543 3. Future survivor benefits payable on behalf of present annuitants 1,462,466,211 1,401,763,178 4. Total inactive liabilities 6,498,094,509$ 6,149,598,517$
D. Total Actuarial Present Value of Future Benefits: 216,125,270,107$ 207,410,708,945$

Teacher Retirement System of Texas 16
Table 2
SUMMARY OF COST ITEMS
Cost as % Cost as %
Cost Item of Pay Cost Item of Pay
(1) (2) (3) (4)
1. Participants
a. Active contributing members
1. Not in DROP 864,233 847,631
2. In DROP 28 42
b. Active subtotal 864,261 847,673
c. Inactive members w/deferred benefits 98,110 95,078
d. Retired members and beneficiaries 407,768 393,914
e. Subtotal, members 1,370,139 1,336,665
f. Inactive nonvested members
due refunds 174,918 167,275
g. Total membership 1,545,057 1,503,940
2. Average for Active Members
a. Average age 44.6 44.5
b. Average years of service 10.3 10.2
c. Average pay 47,330$ 46,343$
3. Present Value of Future Pay 361,060,623,065$ 349,071,274,166$
4. Normal Cost Rate
a. Gross normal cost 9.94% 9.93%
b. Less employee contribution rate* (7.70%) (7.70%)
c. Administrative Expenses 0.12% 0.12%
d. State normal cost 2.36% 2.35%
5. Present Value of Future Benefits
a. Retired members - in pay or deferred 90,572,054,290$ 86,996,160,679$
b. Retired members - future survivor
benefits 1,462,466,211 1,401,763,178
c. Vested inactive members 4,591,531,545 4,333,837,796
d. Active members 119,055,121,308 114,264,949,749
e. Inactive nonvested members 444,096,753 413,997,543
f. Total 216,125,270,107$ 500.7% 207,410,708,945$ 489.5%
6. Present Value of Future Normal Costs
(employee plus employer) 34,372,473,392$ 79.6% 33,171,982,143$ 78.3%
7. Actuarial Accrued Liability 181,752,796,715$ 421.1% 174,238,726,802$ 411.2%
8. Actuarial Value of Assets 146,282,044,842$ 338.9% 138,786,120,728$ 327.5%
9. Unfunded Actuarial Accrued Liability 35,470,751,873$ 82.2% 35,452,606,074$ 83.7%
10. Projected Payroll for Contributions 43,163,898,280$ 42,375,840,262$
11. Employer Contribution Rate ** 7.700% 7.700%
12. Funding Period 32.2 years 33.6 years
13. Estimated Yield on Actuarial Assets 8.2% 6.9%
14. Funded Ratio - Smoothed Basis 80.5% 79.7%
15. Actuarially Determined Employer
Contribution (ADEC)*** 7.85% 7.94%
*
**
*** Aggregate contribution rate for State and local employers.
Valuation as of August 31, 2017 Valuation as of August 31, 2016
The member contribution rate began increasing in fiscal year 2015 to 6.70% of pay and will continue to
increase each year until the rate reaches 7.70% of pay in fiscal year 2017 (7.20% of pay in fiscal year 2016).
The State contribution rate for FY2014 was set at 6.80% of pay. Beginning in fiscal year 2015, covered
employers whose employees are not participating in Social Security began contributing 1.50% of pay.
Combined it is expected that these contributions will be approximately 7.70% of total payroll.

Teacher Retirement System of Texas 17
Table 3
ANALYSIS OF NORMAL COST BY COMPONENT
8/31/2017 8/31/2016
Benefit Component Cost as % of Pay Cost as % of Pay
(1) (2) (3)
1. Normal Cost
a. Retirement Benefits 6.99% 6.98%
b. Disability Benefits 0.24% 0.24%
c. Death Benefits (including survivor benefits) 0.26% 0.26%
d. Termination benefits 2.45% 2.45%
e. Total 9.94% 9.93%
2. Employee Contribution Rate (7.70%) (7.70%)
3. Administrative Expenses 0.12% 0.12%
4. State Normal Cost (Item 1e - Item 2+ Item 3) 2.36% 2.35%

Teacher Retirement System of Texas 18
Table 4 DEVELOPMENT OF ACTUARIAL VALUE OF ASSETS
Year Ending
August 31, 2017
1. Actuarial value of assets at beginning of year 138,786,120,728$
2. Net new investments
a. Contributions 6,608,895,283$
b. Benefits and refunds paid (10,292,527,269)$
c. Administrative Expenses (44,189,998)$
d. Subtotal (3,727,821,984)$
3. Assumed investment return rate for fiscal year 8.00%
4. Assumed investment return for fiscal year (Item 1 + Item 2 / 2) x Item 3 10,953,776,779$
5. Expected Actuarial Value at end of year (1+ 2 + 4) 146,012,075,523$
6. Market value of assets at end of year 147,361,922,120$
7. Excess/(Shortfall) (6 - 5) 1,349,846,597$
8.
Fiscal
Year
End
Remaining Deferrals of
Excess (Shortfall) of
Investment Income
Offsetting of
Gains/(Losses)
Net Deferrals
Remaining
Years
Remaining
Recognized for
this valuation
Remaining after
this valuation
(1) (2) (3) = (1) + (2) (4) (5) = (3) / (4) (6) = (3) - (5)
2013 0$ 0$ 0$ 1 0$ 0$
2014 0 0 0 2 0 0
2015 (3,709,861,072) 3,709,861,072 0 3 0 0
2016 (1,067,622,183) 1,067,622,183 0 4 0 0
2017 6,127,329,852 (4,777,483,255) 1,349,846,597 5 269,969,319 1,079,877,278
Total 1,349,846,597$ 0$ 1,349,846,597$ 269,969,319$ 1,079,877,278$
9. Actuarial value of plan net assets, end of year 146,282,044,842$
10. Asset gain (loss) for year (Item 9 - Item 5) 269,969,319$
11. Asset gain (loss) as % of actual actuarial assets 0.18%
12. Ratio of actuarial value to market value 99.3%
Notes: Remaining deferrals in Column (1) for prior years are from last year's report column (6). The number in the current year is
the difference between the remaining deferrals for prior years and the total Excess/(Shortfall) return shown in Item 7.
Column 2 is a direct offset of the current year's excess/(shortfall) return against prior years' excess/(shortfall) of the opposite type.
Development of amounts to be recognized as of August 31, 2017:

Teacher Retirement System of Texas 19
Table 5
DEVELOPMENT OF YEARS TO FUND THE UNFUNDED
ACTUARIAL ACCRUED LIABILITY
As of August 31, 2017 As of August 31, 2016
(1) (2)
A. Basic Data
1. Projected Payroll for Contributions 43,163,898,280$ 42,375,840,262$
2. Present value of future pay 361,060,623,065$ 349,071,274,166$
3. Normal cost rate of benefits
a. Total normal cost rate 9.94% 9.93%
b. Less employee contribution rate (7.70%) (7.70%)
c. Administrative Expenses 0.12% 0.12%
d. State normal cost rate 2.36% 2.35%
4. State contribution rate for funding unfunded
actuarial accrued liability
a. Total State/employer contribution rate** 7.700% 7.700%
b. Less State normal cost rate (2.360%) (2.350%)
c. State contribution rate available 5.340% 5.350%
5. Actuarial accrued liability for present active members
a. Present value of benefits payable in the future
to present members 119,055,121,308$ 114,264,949,749$
b. Less present value of future normal costs (34,372,473,392) (33,171,982,143)
c. Actuarial accrued liability 84,682,647,916$ 81,092,967,606$
B. Development of Funding Period
1. Normal cost
a. Employee normal cost (Item A3b x Item A1) 3,323,620,168$ 3,262,939,700$
b. State normal cost (Item A3c x Item A1) 1,018,667,999 995,832,246
c. Total normal cost 4,342,288,167$ 4,258,771,946$
2. Total actuarial accrued liability
a. Present value of benefits presently being paid 90,572,054,290$ 86,996,160,679$
b. Actuarial accrued liability for present active 84,682,647,916 81,092,967,606
members (Item A5c)
c. Present value of benefits for inactive members 6,498,094,509$ 6,149,598,517$
d. Total 181,752,796,715$ 174,238,726,802$
3. Current actuarial assets 146,282,044,842 138,786,120,728
4. Unfunded actuarial accrued liability (UAAL)
(Item B2d - Item B3) 35,470,751,873$ 35,452,606,074$
5. Amount of State contribution available to fund
unfunded actuarial accrued liability
(Item A4c x Item A1) 2,304,952,168$ 2,267,107,454$
6. Years to fund unfunded actuarial accrued liability 32.2 years 33.6 years
Rate of Increase in Covered Payroll
0.00% Never Never
2.00% 38.3 40.7
2.50% 32.2 33.6
3.00% 28.4 29.4
4.00% 23.8 24.4
7. Actuarially Determined Employer Contribution Rate (ADEC)
(Normal cost + 30-year amortization of UAAL)*** 7.85% 7.94%
**
*** Aggregate contribution rate from State and local employers.
Beginning in fiscal year 2015, covered employers whose employees are not participating in Social
Security will begin contributing 1.50% of pay. Combined it is expected that these contributions will be
approximately 7.70% of total payroll.

Teacher Retirement System of Texas 20
Table 6
GROWTH OF COVERED PAYROLL AND ACTIVE MEMBERS
Total Annualized Salaries Active Members Average Salary
Compound Increase Compound Increase
Year Ending Amount in $ Percent Percent Between Year Indicated Average Percent Between Year Indicated
August 31, Millions Increase Number Increase and 08-31-2017 Salary Increase and 08-31-2017
(1) (2) (3) (4) (5) (6) (7) (8) (9)
1997 17,044 $ 6.6% 678,749 4.1% 1.2% 25,112 $ 2.5% 3.2%
1998 18,325 7.5% 705,447 3.9% 1.1% 25,977 3.4% 3.2%
1999 19,529 6.6% 736,058 4.3% 0.9% 26,533 2.1% 3.3%
2000 21,920 12.2% 766,906 4.2% 0.7% 28,583 7.7% 3.0%
2001 23,365 6.6% 797,339 4.0% 0.5% 29,303 2.5% 3.0%
2002 24,818 6.2% 745,923 (6.4%) 1.0% 33,272 13.5% 2.4%
2003 25,756 3.8% 754,715 1.2% 1.0% 34,127 2.6% 2.4%
2004 25,485 (1.1%) 729,411 (3.4%) 1.3% 34,939 2.4% 2.4%
2005 25,957 1.9% 715,495 (1.9%) 1.6% 36,278 3.8% 2.2%
2006 28,397 9.4% 761,658 6.5% 1.2% 37,284 2.8% 2.2%
2007 31,114 9.6% 777,789 2.1% 1.1% 40,003 7.3% 1.7%
2008 33,238 6.8% 801,455 3.0% 0.8% 41,472 3.7% 1.5%
2009 35,097 5.6% 817,537 2.0% 0.7% 42,930 3.5% 1.2%
2010 36,629 4.4% 834,060 2.0% 0.5% 43,916 2.3% 1.1%
2011 36,797 0.5% 828,919 (0.6%) 0.7% 44,392 1.1% 1.1%
2012 36,310 (1.3%) 815,155 (1.7%) 1.2% 44,543 0.3% 1.2%
2013 37,104 2.2% 831,302 2.0% 1.0% 44,634 0.2% 1.5%
2014 39,195 5.6% 857,342 3.1% 0.3% 45,717 2.4% 1.2%
2015 37,122 (5.3%) 828,851 (3.3%) 2.1% 44,787 (2.0%) 2.8%
2016 39,281 5.8% 847,631 2.3% 2.0% 46,343 3.5% 2.1%
2017 40,904 4.1% 864,233 2.0% -- 47,330 2.1% --
Note: Beginning August 31, 2002, the definition of active member was changed.
Beginning August 31, 2005, the method of determining new entrant errors was changed.
Beginning August 31, 2015, the definition of active member was changed.

Teacher Retirement System of Texas 21
Table 7
RELATIVE SIZE OF UNFUNDED ACTUARIAL ACCRUED LIABILITY
Relative to Total Actuarial Liabilities
Unfunded Relative to Projected Payroll Relative to Actuarial Value of Assets (Present Value of Future Benefits)
Actuarial Actuarial Percent of
Year Ending Accrued Liability Projected Payroll Percent of Assets in Percent of Liabilities in Actuarial
August 31, in $ Mill ions In $ Mill ions Projected Payroll $ Mill ions Assets $ Mill ions Liabilities
(1) (2) (3) (4) (5) (6) (7) (8)
1969 1,312 $ 1,299 $ 101.0% 1,364 $ 96.2% 3,960 $ 33.1%
1970 1,444 1,528 94.5% 1,534 94.1% 4,384 32.9%
1971 1,632 1,758 92.8% 1,726 94.6% 5,100 32.0%
1972 1,720 1,904 90.5% 1,937 88.8% 5,551 31.0%
1973 1,633 2,079 78.5% 2,171 75.2% 5,733 28.5%
1974 1,739 2,246 77.4% 2,394 72.6% 6,207 28.0%
1975 1,998 2,583 77.4% 2,764 72.3% 7,143 28.0%
1976 2,445 2,875 85.0% 3,103 78.8% 8,067 30.3%
1977 2,879 3,246 88.7% 3,531 81.5% 9,626 29.9%
1978 2,422 3,636 66.6% 4,016 60.3% 9,858 24.6%
1979 3,322 3,928 84.6% 4,529 73.3% 12,336 26.9%
1980 2,785 4,378 63.6% 5,342 52.1% 12,181 22.9%
1981 3,300 4,970 66.4% 6,386 51.7% 13,890 23.8%
1982 3,864 5,616 68.8% 7,373 52.4% 16,135 23.9%
1983 4,549 6,378 71.3% 8,586 53.0% 20,277 22.4%
1984 4,849 6,652 72.9% 9,851 49.2% 22,456 21.6%
1985 6,474 7,547 85.8% 12,096 53.5% 29,618 21.9%
1986 5,365 8,237 65.1% 14,939 35.9% 32,273 16.6%
1987 4,096 8,646 47.4% 18,055 22.7% 34,801 11.8%
1988 3,890 9,166 42.4% 20,096 19.4% 37,332 10.4%
1989 3,489 9,764 35.7% 23,302 15.0% 41,084 8.5%
1990 3,343 10,446 32.0% 26,111 12.8% 45,685 7.3%
1991 3,429 11,181 30.7% 28,860 11.9% 49,515 6.9%
1992 3,441 11,959 28.8% 31,201 11.0% 53,123 6.5%
Teacher Retirement System of Texas 22
Table 7 (Continued)
RELATIVE SIZE OF UNFUNDED ACTUARIAL ACCRUED LIABILITY
Relative to Total Actuarial Liabilities
Unfunded Relative to Projected Payroll Relative to Actuarial Value of Assets (Present Value of Future Benefits)
Actuarial Actuarial Percent of
Year Ending Accrued Liability Projected Payroll Percent of Assets in Percent of Liabilities in Actuarial
August 31, in $ Mill ions In $ Mill ions Projected Payroll $ Mill ions Assets $ Mill ions Liabilities
(1) (2) (3) (4) (5) (6) (7) (8)
1993 3,440 13,391 $ 25.7% 35,179 $ 9.8% 59,210 $ 5.8%
1994 825 14,167 5.8% 38,843 2.1% 58,351 1.4%
1995 1,956 14,888 13.1% 43,442 4.5% 65,259 3.0%
1996 1,813 15,983 11.3% 47,487 3.8% 68,948 2.6%
1997 146 17,044 0.9% 53,760 0.3% 74,677 0.2%
1998 (2,463) 18,325 -13.4% 60,357 -4.1% 79,603 -3.1%
1999 (2,190) 19,529 -11.2% 69,435 -3.2% 91,563 -2.4%
2000 (5,446) 21,920 -24.8% 79,328 -6.9% 100,414 -5.4%
2001 (2,135) 23,365 -9.1% 86,352 -2.5% 113,663 -1.9%
2002 3,287 24,818 13.2% 86,035 3.8% 118,100 2.8%
2003 5,230 25,756 20.3% 89,033 5.9% 123,677 4.2%
2004 7,953 25,485 31.2% 88,784 9.0% 121,267 6.6%
2005 13,196 25,957 50.8% 89,299 14.8% 124,556 10.6%
2006 13,694 28,397 48.2% 94,218 14.5% 131,906 10.4%
2007 12,545 31,114 40.3% 103,419 12.1% 142,190 8.8%
2008 11,523 33,238 34.7% 110,233 10.5% 150,999 7.6%
2009 21,646 35,097 61.7% 106,384 20.3% 158,899 13.6%
2010 22,899 36,629 62.5% 111,293 20.6% 166,445 13.8%
2011 24,062 36,797 65.4% 115,253 20.9% 173,204 13.9%
2012 26,101 36,310 73.6% 118,326 22.1% 177,901 14.7%
2013 28,936 37,104 79.3% 121,730 23.8% 184,332 15.7%
2014 31,638 38,522 82.1% 128,398 24.6% 195,893 16.2%
2015 32,968 39,620 83.2% 133,485 24.7% 197,662 16.7%
2016 35,453 42,376 83.7% 138,786 25.5% 207,411 17.1%
2017 35,471 43,164 82.2% 146,282 24.2% 216,125 16.4%

Teacher Retirement System of Texas 23
Table 8-a
CHANGE IN PLAN NET ASSETS
Year Ending Year Ending
August 31, 2017 August 31, 2016
(1) (2)
I. Revenue for the Year
A. Contribution and fees
1. Member contributions 3,242,556,261$ 2,943,669,320$
2. State contributions - State of Texas 1,719,928,098 1,696,007,980
3. State contributions - 415 Excess Plan 3,008,838 3,574,146
4. State contributions - Employers 1,588,309,345 1,483,389,348
5. State contributions - Legislative Appropriations - -
6. Purchase of Service Credit-Refundable 27,561,982 18,818,999
7. Purchase of Service Credit-Non-Refundable 27,530,759 18,570,535
8. Total 6,608,895,283$ 6,164,030,328$
B. Income
1. Interest -$ -$
2. Dividends - -
3. Net appreciation in fair value of investments 17,203,713,635 9,338,243,204
4. Income from Securities Lending 237,357,886 165,668,053
5. Investment expenses (361,264,174) (310,630,697)
6. Total 17,079,807,347 9,193,280,560
C. Other Adjustments 1,299,284$ 1,993,029$
D. Total Revenue 23,690,001,914$ 15,359,303,917$
II. Expenditures for the Year
A. Refund of Contributions 513,742,959$ 462,273,069$
B. Benefit Payments
1. Service retirements 9,059,855,790$ 8,633,505,859$
2. DROP payments 5,231,060 5,166,851
3. Partial Lump Sum Option payments 263,705,342 300,420,702
4. 415 Excess Plan payments 3,008,838 3,574,146
5. Disability retirements 177,627,306 173,464,936
6. Death and survivor benefits 269,355,974 266,564,383
7. Total benefits 9,778,784,310$ 9,382,696,877$
C. Expenses
1. Gross expenses
a. Administrative expenses 44,189,998$ 44,402,710$
2. Miscellaneous reimbursements - -
3. Total expenses 44,189,998 44,402,710
D. Total Expenditures 10,336,717,267$ 9,889,372,656$
III. Net Increase in Plan Net Assets (Item I.D. - Item II.D.) 13,353,284,647$ 5,469,931,261$

Teacher Retirement System of Texas 24
Table 8-b
ESTIMATION OF YIELDS
Year Ending Year Ending
Item August 31, 2017 August 31, 2016
(1) (2) (3)
A. Market value yield
1. Beginning of year net market assets 134,008,637,473$ 128,538,706,212$
2. Investment income (net of investment expenses) 17,081,106,631 9,195,273,589
3. End of year market assets 147,361,922,120 134,008,637,473
4. Estimated market value yield 12.9% 7.3%
B. Actuarial value yield
1. Beginning of year actuarial assets 138,786,120,728$ 133,485,187,642$
2. Investment income 11,223,746,098 9,026,275,414
3. End of year actuarial assets 146,282,044,842 138,786,120,728
4. Estimated actuarial value yield 8.2% 6.9%

Teacher Retirement System of Texas 25
Table 9
Year Ending Year Ending
August 31, 2017 August 31, 2016
(2) (3)
A. CALCULATION OF TOTAL GAIN OR LOSS
1. Unfunded actuarial accrued liability (UAAL),
a. Previous year, before Assumption changes 35,452,606,074$ 32,967,736,862$
b. Previous year, after Assumption changes 35,452,606,074 32,967,736,862
2. Normal cost for the year 4,280,916,982 4,133,425,989
3. Contributions for the year (6,608,895,283) (6,164,030,328)
4. Interest at 8%
a. On UAAL 2,836,208,486$ 2,637,418,949$
b. On normal cost 171,236,679 165,337,040
c. On contributions (264,355,811) (246,561,213)
d. Total 2,743,089,354$ 2,556,194,776$
5. Expected UAAL (Sum of Items A1 through A4) 35,867,717,127 33,493,327,299
6. Actual UAAL 35,470,751,873 35,452,606,074
7. Gain/(loss) for the year (Item A5 - Item A6) 396,965,254$ (1,959,278,775)$
B. SOURCE OF GAINS AND LOSSES
1. Asset gain/(loss) for the year (Table 4) 269,969,319$ (1,503,525,904)$
2. Asset gain/(loss) as a % of actuarial assets 0.18% (1.08%)
3. Total actuarial accrued liability gain/(loss) for
year (Item A7 - Item B1) 126,995,935 (455,752,871)
4. Analysis of actuarial accrued liability gain/(loss)
a. Assumption/Legislative changes (700,880,288) -
b. Liability experience 827,876,223 (455,752,871)
c. Total 126,995,935$ (455,752,871)$
5. Experience liability gain/(loss) as % of total
actuarial accrued liability (Item B4b as % of
total actuarial accrued liability) 0.46% (0.26%)
Item
(1)
GAIN OR LOSS FOR THE YEAR
Teacher Retirement System of Texas 26
Table 10
ANALYSIS OF CHANGE IN FUNDING PERIOD
Total Change in
UAAL Normal Cost Contribution Funding Funding
Basis ($ Mill ions) Rate Rate Period Period
(1) (2) (3) (4) (5) (6)
1. 2016 Valuation 35,453 10.05% 15.40% 33.6 -
2. Restated 2016 Valuation with Legislative changes (if applicable) 35,453 10.05% 15.40% 33.6 0.0
3. Expected 2017 UAAL using expected contributions 35,931 10.05% 15.40% 32.6 (1.0)
4. Expected 2017 UAAL using actual contributions 35,868 10.05% 15.40% 32.5 (0.2)
5. 2017 UAAL using expected assets and actual l iabilities 35,040 10.06% 15.40% 30.7 (1.7)
6. 2017 UAAL recognizing past deferred asset gains/(losses) 36,543 10.06% 15.40% 34.3 3.6
7. 2017 UAAL using actual assets and liabilities, expected payroll 34,770 10.06% 15.40% 30.1 (4.2)
8. 2017 UAAL using actual payroll 34,770 10.06% 15.40% 30.6 0.5
9. 2017 UAAL after impact of legislative change to TRS Care 35,471 10.06% 15.40% 32.2 1.6
Notes:
Row 3 The funding period for this entry uses the expected UAAL and expected payroll. The expected
payroll is the prior year's valuation payroll, rolled forward at the 2.5% payroll growth rate.
Row 4 This entry uses actual contributions based on actual payroll during FY2017.
Row 5 This entry uses expected assets and payroll growth, while incorporating the actual liabilities as of August 31, 2017.
Row 6 This entry recognizes deferred investment gains/(losses) as of August 31, 2016 from prior valuations.
Row 7 This entry includes the current year investment results.
Row 8 This entry incorporates known assets, liabilities, and payroll growth. The overall payroll growth does not affect the liabilities of the plan, but
instead affects the calculation of the ARC because the payroll is the denominator in the calculation of the amortization payment. Higher than
expected payroll growth leads to a decrease in the required amortization payment as a percentage of payroll.
Row 9 This entry reflects the change in assumed retirement patterns due to legislative change.

Teacher Retirement System of Texas 27
Table 11-a
NEAR TERM OUTLOOK
Valuation
as of
August
31,
Unfunded
Actuarial Accrued
Liability (UAAL, in
Millions)
Funded
Ratio
Funding
Period
Actuarial
Value of
Assets (AVA,
in Millions)
For Fiscal
year Ending
August 31,
Projected
Payroll for
Contributions
(in Millions)
Employer
Contributions
(in Millions)
Employee
Contributions
(in Millions)
Benefit
Payments
and Refunds
for Following
FY
External
Cash Flow
(1) (2) (3) (4) (5) (6) (7) (8) (9) (10) (11)
2017 35,471$ 80.5% 32.2 146,282$ 2018 43,164$ 3,324$ 3,324$ 12,745$ (6,097)$
2018 35,996 80.8% 31.1 151,643 2019 44,368 3,416 3,416 11,067 (4,235)
2019 36,470 81.4% 30.1 159,371 2020 45,598 3,511 3,511 11,673 (4,651)
2020 36,912 81.9% 29.1 167,283 2021 46,860 3,608 3,608 12,289 (5,073)
2021 37,316 82.5% 28.1 175,390 2022 48,152 3,708 3,708 12,920 (5,504)
2022 37,677 83.0% 27.0 183,697 2023 49,481 3,810 3,810 13,553 (5,933)
2023 37,990 83.5% 26.0 192,222 2024 50,839 3,915 3,915 14,198 (6,368)
2024 38,250 84.0% 25.0 200,977 2025 52,228 4,022 4,022 14,864 (6,821)
2025 38,452 84.5% 23.9 209,961 2026 53,647 4,131 4,131 15,557 (7,295)
2026 38,590 85.0% 22.9 219,171 2027 55,095 4,242 4,242 16,280 (7,795)
2027 38,657 85.5% 21.9 228,597 2028 56,574 4,356 4,356 17,030 (8,318)
Assumes statutory member and State contribution rates
Assumes 8.00% investment return on actuarial value of assets each year
Assumes all other assumptions exactly met

Teacher Retirement System of Texas 28
Table 11-b
Actuarial Annual AVA as AAL as Change Change
Valuation Actuarial Accrued Projected % of Projected % of Projected in ADEC in Funded Ratio
As of Value of Assets Liability (AAL) Payroll Payroll Payroll if Assets Funded if Assets
August 31, (in Millions) (in Millions) (in Millions) (2) / (4) (3) / (4) Decrease 10% Ratio Decrease 10%
(1) (2) (3) (4) (5) (6) (7) (8) (8)
2017 146,282 $ 181,753 $ $ 43,164 $ 339% 421% 2.27% 80.5% 8.0% 2016 138,786 174,239 $ 39,195 354% 445% 2.13% 79.7% 8.0% 2015 133,485 166,453 $ 39,195 341% 425% 2.04% 80.2% 8.0% 2014 128,398 160,036 $ 37,104 346% 431% 2.08% 80.2% 8.0% 2013 121,730 150,666 $ 36,310 335% 415% 2.01% 80.8% 8.1%
2012 118,326 144,427 $ 36,310 326% 398% 1.96% 81.9% 8.2% 2011 115,253 139,315 $ 36,797 313% 379% 1.88% 82.7% 8.3% 2010 111,293 134,191 $ 36,629 304% 366% 1.82% 82.9% 8.3% 2009 106,384 128,029 $ 35,097 303% 365% 1.82% 83.1% 8.3% 2008 110,233 121,757 $ 33,238 332% 366% 1.99% 90.5% 9.1%
2007 103,419 115,964 $ 31,114 332% 373% 2.00% 89.2% 8.9% 2006 94,218 107,911 28,397 332% 380% 1.99% 87.3% 8.7% 2005 89,299 102,495 25,957 344% 395% 2.07% 87.1% 8.7% 2004 88,784 96,737 25,485 348% 380% 2.09% 91.8% 9.2% 2003 89,033 94,263 25,756 346% 366% 2.08% 94.5% 9.4%
2002 86,035 89,322 24,818 347% 360% 2.08% 96.3% 9.6% 2001 86,352 84,217 23,365 370% 360% 2.22% 102.5% 10.3% 2000 79,328 73,882 21,920 362% 337% 2.17% 107.4% 10.7% 1999 69,435 67,245 19,529 356% 344% 2.13% 103.3% 10.3% 1998 60,357 57,893 18,325 329% 316% 1.98% 104.3% 10.4%
HISTORY OF RISK METRICS

Teacher Retirement System of Texas 29
Table 12
HISTORY OF CASH FLOW
Expenditures During the Year
Transfer to
Year Employees External Cash External Cash
Ending Contributions Benefit Refund of Retirement Flow for the Market Value Flow as Percent
August 31, for the Year1 Payments Contributions System Expenses3 Total Year2 of Assets of Market Value
(1) (2) (3) (4) (5) (6) (7) (8) (9) (10)
1997 2,052,261,338$ (2,217,173,754)$ (166,125,695)$ -$ (24,468,347)$ (2,407,767,796)$ (355,506,458)$ 62,160,927,516$ (0.6%)
1998 2,197,477,431 (2,503,386,682) (183,430,398) - (26,803,767) (2,713,620,847) (516,143,416) 66,456,822,943 (0.8%)
1999 2,334,197,510 (2,639,947,187) (206,354,473) - (29,146,859) (2,875,448,519) (541,251,009) 79,910,553,792 (0.7%)
2000 2,569,218,427 (3,360,116,181) (214,999,991) - (31,133,307) (3,606,249,479) (1,037,031,052) 89,987,158,209 (1.2%)
2001 2,712,395,592 (3,667,711,511) (214,434,792) - (32,641,273) (3,914,787,576) (1,202,391,984) 79,428,239,521 (1.5%)
2002 2,920,429,953 (4,366,038,505) (186,421,065) - (37,518,541) (4,589,978,111) (1,669,548,158) 71,695,802,361 (2.3%)
2003 3,094,280,741 (4,753,849,401) (186,082,670) - (38,030,992) (4,977,963,063) (1,883,682,322) 77,633,002,461 (2.4%)
2004 3,156,205,813 (5,486,849,698) (220,396,709) - (41,092,036) (5,748,338,443) (2,592,132,630) 84,202,981,707 (3.1%)
2005 3,208,090,642 (5,387,605,428) (243,382,014) - (42,488,318) (5,673,475,760) (2,465,385,118) 93,707,816,093 (2.6%)
2006 3,454,514,897 (5,582,306,639) (265,487,479) - (45,543,800) (5,893,337,918) (2,438,823,021) 100,238,963,187 (2.4%)
2007 3,703,755,952 (5,807,036,778) (277,932,219) - (48,444,678) (6,133,413,675) (2,429,657,723) 112,128,799,849 (2.2%)
2008 4,142,958,389 (6,454,687,449) (275,482,331) - (55,452,812) (6,785,622,592) (2,642,664,203) 104,910,497,545 (2.5%)
2009 4,352,908,188 (6,343,563,704) (266,695,076) - (97,300,965) (6,707,559,745) (2,354,651,557) 88,652,971,682 (2.7%)
2010 4,587,520,751 (6,669,304,862) (265,186,589) - (141,911,262) (7,076,402,713) (2,488,881,962) 95,688,405,009 (2.6%)
2011 4,704,016,139 (7,175,255,376) (399,040,901) - (275,521,878) (7,849,818,155) (3,145,802,016) 107,420,786,893 (2.9%)
2012 4,391,331,052 (7,726,105,535) (452,217,315) - (249,825,059) (8,428,147,909) (4,036,816,857) 111,449,887,034 (3.6%)
2013 4,682,290,371 (8,077,729,314) (466,805,558) - (282,545,932) (8,827,080,804) (4,144,790,433) 117,388,143,859 (3.5%)
2014 5,036,110,456 (8,550,916,357) (490,764,166) - (292,157,107) (9,333,837,630) (4,297,727,174) 132,779,243,085 (3.2%)
2015 5,616,774,652 (8,937,328,045) (475,400,534) - (333,858,664) (9,746,587,243) (4,129,812,591) 128,538,706,212 (3.2%)
2016 6,164,030,328 (9,382,696,877) (462,273,069) - (355,033,407) (10,200,003,353) (4,035,973,025) 134,008,637,473 (3.0%)
2017 6,608,895,283 (9,778,784,310) (513,742,959) - (405,454,172) (10,697,981,441) (4,089,086,158) 147,361,922,120 (2.8%)
1 Column (2) includes employee and employer contributions, as well as any service purchase or account reinstatement receipts during the year2 Column (8) = Column (2) - Column (7)3 Column (6) includes both administrative and investment expenses

Teacher Retirement System of Texas 30
Table 13
HISTORY OF CONTRIBUTION RATES
Fiscal Year
Actuarially
Determined
Employer
Contribution
Rate
Aggregate
Employer
Contribution
Rate
Percentage
Contributed
Member
Contribution
Rate
Total
Contribution
Rate
(3) + (5)
(1) (2) (3) (4) (5) (6)
1978/79 7.500% 6.650% 14.150%
1979/80 8.500% 6.650% 15.150%
1980/81 8.500% 6.650% 15.150%
1981/82 8.500% 6.650% 15.150%
1982/83 8.500% 6.650% 15.150%
1983/84 7.100% 6.000% 13.100%
1984/85 7.100% 6.000% 13.100%
1985/86 8.000% 6.400% 14.400%
1986/87 8.000% 6.400% 14.400%
1987/88 7.200% 6.400% 13.600%
1988/89 7.200% 6.400% 13.600%
1989/90 7.650% 6.400% 14.050%
1990/91 7.650% 6.400% 14.050%
1991/92 7.310% 6.400% 13.710%
1992/93 7.310% 6.400% 13.710%
1993/94 7.310% 6.400% 13.710%
1994/95 7.310% 6.400% 13.710%
1995/96 6.000% 6.400% 12.400%
1996/97 6.00% 6.000% 100% 6.400% 12.400%
1997/98 6.00% 6.000% 100% 6.400% 12.400%
1998/99 4.12% 6.000% 146% 6.400% 12.400%
1999/00 4.92% 6.000% 122% 6.400% 12.400%
2000/01 4.12% 6.000% 146% 6.400% 12.400%
2001/02 5.70% 6.000% 105% 6.400% 12.400%
2002/03 7.15% 6.000% 84% 6.400% 12.400%
2003/04 7.39% 6.000% 81% 6.400% 12.400%
2004/05 7.31% 6.000% 82% 6.400% 12.400%
2005/06 7.19% 6.000% 83% 6.400% 12.400%
2006/07 7.02% 6.000% 85% 6.400% 12.400%
2007/08 6.47% 6.580% 102% 6.400% 12.980%
2008/09 6.10% 6.580% 108% 6.400% 12.980%
2009/10 7.72% 6.644% 86% 6.400% 13.044%
2010/11 7.77% 6.644% 86% 6.400% 13.044%
2011/12 8.13% 6.000% 74% 6.400% 12.400%
2012/13 8.62% 6.400% 74% 6.400% 12.800%
2013/14 8.67% 6.800% 78% 6.400% 13.200%
2014/15 8.25% 7.700% 93% 6.700% 14.400%
2015/16 7.92% 7.700% 97% 7.200% 14.900%
2016/17 7.94% 7.700% 97% 7.700% 15.400%
2017/18 7.85% 7.700% 98% 7.700% 15.400%
Note: Aggregate employer contribution rate and total contribution rate for fiscal year 2017/2018 is estimated

Teacher Retirement System of Texas 31
Table 14
SCHEDULE OF FUNDING PROGRESS
Actuarial Unfunded AAL Funding Ratio UAAL as a
Valuation Actuarial Accrued (UAAL) Assets as Projected % of Projected
As of Value of Assets Liability (AAL) (3) - (2) % of AAL Payroll Payroll
August 31, (in Mill ions) (in Mill ions) (in Mill ions) (2) / (3) (in Mill ions) (4) / (6)
(1) (2) (3) (4) (5) (6) (7)
2017 146,282 $ 181,753 $ $ 35,471 $ 80.5% $ 43,164 $ 82.2% 2016 138,786 174,239 $ 35,453 79.7% $ 42,376 83.7%
2015 133,485 166,453 $ 32,968 80.2% $ 39,620 83.2%
2014 128,398 160,036 $ 31,638 80.2% $ 38,522 82.1%
2013 121,730 150,666 $ 28,936 80.8% $ 37,104 78.0%
2012 118,326 144,427 $ 26,101 81.9% $ 36,310 71.9% 2011 115,253 139,315 $ 24,062 82.7% $ 36,797 65.4%
2010 111,293 134,191 $ 22,899 82.9% $ 36,629 62.5%
2009 106,384 128,029 $ 21,646 83.1% $ 35,097 61.7%
2008 110,233 121,757 $ 11,523 90.5% $ 33,238 34.7%
2007 103,419 115,964 $ 12,545 89.2% $ 31,114 40.3% 2006 94,218 107,911 $ 13,694 87.3% $ 28,397 48.2%
2005 89,299 102,495 $ 13,196 87.1% $ 25,957 50.8%
2004 88,784 96,737 $ 7,953 91.8% $ 25,485 31.2%
2003 89,033 94,263 $ 5,230 94.5% $ 25,756 20.3%
2002 86,035 89,322 $ 3,287 96.3% $ 24,818 13.2% 2001 86,352 84,217 $ (2,135) 102.5% $ 23,365 (9.1%)
2000 79,328 73,882 $ (5,446) 107.4% $ 21,920 (24.8%)
1999 69,435 67,245 $ (2,190) 103.3% $ 19,529 (11.2%)
1998 60,357 57,893 $ (2,463) 104.3% $ 18,325 (13.4%)
1997 53,760 53,906 $ 146 99.7% $ 17,044 0.9% 1996 47,487 49,300 $ 1,813 96.3% $ 15,983 11.3%
1995 43,442 45,398 1,956 95.7% 14,888 13.1%
1994 38,843 39,668 825 97.9% 14,167 5.8%
1993 35,179 38,619 3,440 91.1% 13,391 25.7%
1992 31,201 34,643 3,441 90.1% 11,959 28.8%
Note: Amount in $ mill ions.
Actuarial assumptions were modified effective August 31, 2004 and August 31, 2008.

Teacher Retirement System of Texas 32
Table 15-a
STATISTICAL INFORMATION - ACTIVE MEMBERS
August 31,
2017 2016 2015
(1) (2) (3)
A. Number
1. Active Members
a. Total active members 864,233 847,631 828,851
b. Average age 44.6 44.5 44.6
c. Average service 10.3 10.2 10.3
2. Inactive Vested Members
a. Male members 20,106 19,435 18,613
b. Female members 78,004 75,643 72,655
c. Total inactive vested members 98,110 95,078 91,268
3. Inactive Nonvested Members 174,918 167,275 161,292
B. Annualized Salaries
1. Active members
a. Total active members 40,904,273,685$ 39,281,469,186$ 37,121,560,597$
b. Average annual salary 47,330 46,343 44,787
C. Accumulated Members Contributions
1. Total Active Members 32,447,572,128 31,073,306,648 30,257,739,873
2. Inactive Vested Members
a. Male members 679,273,859$ 646,221,791$ 612,399,314$
b. Female members 2,635,336,621 2,515,161,045 2,390,472,904
c. Total inactive vested members 3,314,610,480$ 3,161,382,836$ 3,002,872,218$
3. Inactive Nonvested Members 444,096,753$ 413,997,543$ 400,439,304$
D. Active Members in DROP (not included in above totals)
1. Number 28 42 94
2. DROP Balance 2,677,479$ 3,921,984$ 9,090,375$

Teacher Retirement System of Texas 33
Table 15-b
STATISTICAL INFORMATION - RETIRED MEMBERS
August 31,2017 2016 2015(1) (2) (3)
E. Persons Receiving Benefits
1. Number
a. Life annuities 379,765 368,720 353,459
b. Annuities certain 2,108 2,041 1,925
c. Disability annuities - less than 10 years of service 202 209 219
d. Disability annuities - 10 or more years of service 11,600 ^ 9,441 9,276
e. Incomplete data records 0 0 0
f. Survivor annuities
1) Currently in pay 13,160 12,579 11,957
2) Deferred 933 924 902
3) Total 14,093 13,503 12,859
g. Total persons receiving benefits 407,768 393,914 377,738
2. Annual Annuities
a. Life annuities * 9,387,309,784$ 9,005,480,125$ 8,534,558,536$
b. Annuities certain * 28,457,471 27,184,510 24,834,549
c. Disability annuities - less than 10 years of service 363,600 376,200 394,200
d. Disability annuities - 10 or more years of service 163,985,308 ^ 139,506,557 136,493,481
e. Survivor annuities
1) Currently in pay 39,614,276 37,855,026 35,971,176
2) Deferred 2,788,460 2,762,960 2,697,800
3) Total 42,402,736 40,617,986 38,668,976
f. Total persons receiving benefits 9,622,518,899$ 9,213,165,378$ 8,734,949,742$
g. Average monthly annuities
1) Life annuities * 2,060$ 2,035$ 2,012$
2) Annuities certain * 1,125 1,110 1,075
3) Disability annuities - 10 or more years of service 1,178 1,231 1,226
h. DROP Lump Sum payments during year 5,231,060$ 5,166,851$ 9,643,121$
i. Partial Lump Sum Option payments during year 263,705,342$ 300,420,702$ 288,923,266$
* Annual and average life annuity amounts represent values after Partial Lump Sum Option Elections.
^ Prior to 2017 disabled retirees only included those receiving a standard annuity. Beginning in 2017 disabled retirees
include all benefit options.
Teacher Retirement System of Texas 34
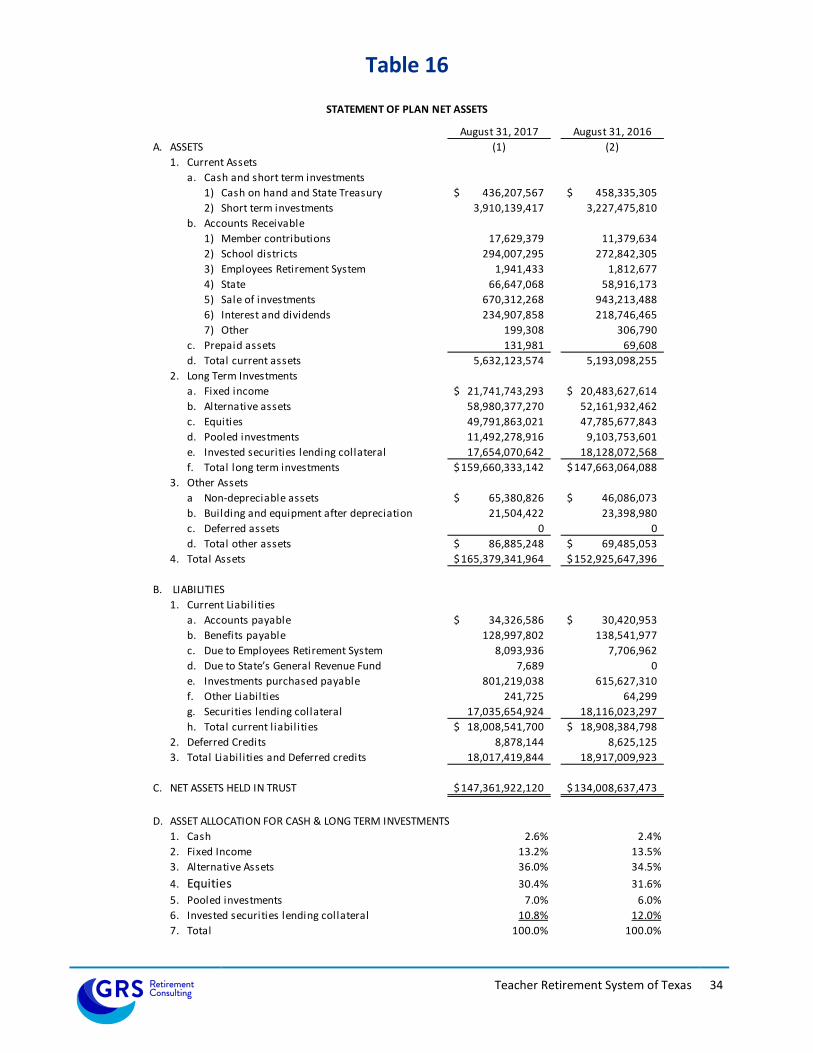
Table 16
STATEMENT OF PLAN NET ASSETS
August 31, 2017 August 31, 2016
A. ASSETS (1) (2)
1. Current Assets
a. Cash and short term investments
1) Cash on hand and State Treasury 436,207,567$ 458,335,305$
2) Short term investments 3,910,139,417 3,227,475,810
b. Accounts Receivable
1) Member contributions 17,629,379 11,379,634
2) School districts 294,007,295 272,842,305
3) Employees Retirement System 1,941,433 1,812,677
4) State 66,647,068 58,916,173
5) Sale of investments 670,312,268 943,213,488
6) Interest and dividends 234,907,858 218,746,465
7) Other 199,308 306,790
c. Prepaid assets 131,981 69,608
d. Total current assets 5,632,123,574 5,193,098,255
2. Long Term Investments
a. Fixed income 21,741,743,293$ 20,483,627,614$
b. Alternative assets 58,980,377,270 52,161,932,462
c. Equities 49,791,863,021 47,785,677,843
d. Pooled investments 11,492,278,916 9,103,753,601
e. Invested securities lending collateral 17,654,070,642 18,128,072,568
f. Total long term investments 159,660,333,142$ 147,663,064,088$
3. Other Assets
a Non-depreciable assets 65,380,826$ 46,086,073$
b. Building and equipment after depreciation 21,504,422 23,398,980
c. Deferred assets 0 0
d. Total other assets 86,885,248$ 69,485,053$
4. Total Assets 165,379,341,964$ 152,925,647,396$
B. LIABILITIES
1. Current Liabilities
a. Accounts payable 34,326,586$ 30,420,953$
b. Benefits payable 128,997,802 138,541,977
c. Due to Employees Retirement System 8,093,936 7,706,962
d. Due to State’s General Revenue Fund 7,689 0
e. Investments purchased payable 801,219,038 615,627,310
f. Other Liabilties 241,725 64,299
g. Securities lending collateral 17,035,654,924 18,116,023,297
h. Total current l iabilities 18,008,541,700$ 18,908,384,798$
2. Deferred Credits 8,878,144 8,625,125
3. Total Liabilities and Deferred credits 18,017,419,844 18,917,009,923
C. NET ASSETS HELD IN TRUST 147,361,922,120$ 134,008,637,473$
D. ASSET ALLOCATION FOR CASH & LONG TERM INVESTMENTS
1. Cash 2.6% 2.4%
2. Fixed Income 13.2% 13.5%
3. Alternative Assets 36.0% 34.5%
4. Equities 30.4% 31.6%
5. Pooled investments 7.0% 6.0%
6. Invested securities lending collateral 10.8% 12.0%
7. Total 100.0% 100.0%

Teacher Retirement System of Texas 35
Table 17
0 1 2 3 4 5-9 10-14 15-19 20-24 25-29 30-34 35-39 Total
Attained Count & Count & Count & Count & Count & Count & Count & Count & Count & Count & Count & Count & Count &
Age Avg. Comp. Avg. Comp. Avg. Comp. Avg. Comp. Avg. Comp. Avg. Comp. Avg. Comp. Avg. Comp. Avg. Comp. Avg. Comp. Avg. Comp. Avg. Comp. Avg. Comp.
Under 25 3 11,648 4,977 1,454 483 192 18,757
$6,446 $27,753 $30,676 $24,701 $24,027 $23,510 $28,149
25-29 2 20,122 19,195 16,191 12,550 13,299 160 81,519
$5,204 $33,237 $41,285 $43,983 $45,984 $46,611 $36,249 $41,416
30-34 3 13,675 12,444 11,545 11,022 42,280 11,252 118 102,339
$11,536 $32,820 $40,360 $42,927 $45,494 $50,906 $52,774 $41,117 $45,917
35-39 3 11,486 10,318 9,253 8,201 29,835 36,490 8,298 87 113,971
$14,392 $32,026 $39,690 $41,536 $44,416 $49,906 $55,909 $57,683 $49,297 $48,591
40-44 3 9,199 8,353 7,746 6,810 23,886 25,979 27,221 5,743 61 115,001
$7,862 $30,684 $38,716 $40,821 $42,510 $48,007 $54,072 $60,728 $63,066 $52,756 $50,272
45-49 1 7,843 7,222 6,891 6,186 22,627 24,138 21,529 21,536 5,301 87 123,361
$7,520 $30,272 $37,166 $39,605 $40,691 $45,317 $50,781 $56,833 $64,848 $65,835 $57,212 $50,711
50-54 1 6,158 5,699 5,079 4,710 17,886 20,491 18,278 14,513 14,858 3,426 92 111,191
$14,286 $28,939 $35,691 $37,104 $38,517 $42,057 $46,602 $50,421 $58,207 $66,902 $67,685 $58,091 $49,071
55-59 1 4,872 4,434 4,010 3,802 13,891 16,998 17,575 14,281 9,064 7,057 1,934 97,919
$11,454 $27,591 $34,996 $35,966 $38,515 $41,039 $45,445 $48,402 $52,786 $60,557 $70,333 $71,540 $48,110
60-64 2,795 2,520 2,571 2,345 9,280 11,392 12,072 8,983 6,159 3,240 3,011 64,368
$27,941 $33,182 $35,150 $36,270 $40,094 $45,081 $47,535 $50,964 $55,870 $63,569 $75,213 $47,088
65 + 1,725 1,661 1,594 1,518 6,094 6,590 5,524 4,183 3,270 1,831 1,817 35,807
$21,353 $26,895 $28,253 $31,662 $35,392 $41,760 $46,089 $48,663 $53,044 $56,661 $69,937 $42,671
Total 17 89,523 76,823 66,334 57,627 179,270 153,490 110,615 69,326 38,713 15,641 6,854 864,233
$8,532 $27,174 $36,225 $39,938 $42,428 $46,540 $50,729 $53,888 $58,030 $62,322 $66,679 $72,548 $47,330
Note: Table includes contributing members but excludes members in DROP.
DISTRIBUTION OF ACTIVE MEMBERS BY AGE AND BY YEARS OF SERVICE
AS OF 08/31/2017
Years of Credited Service
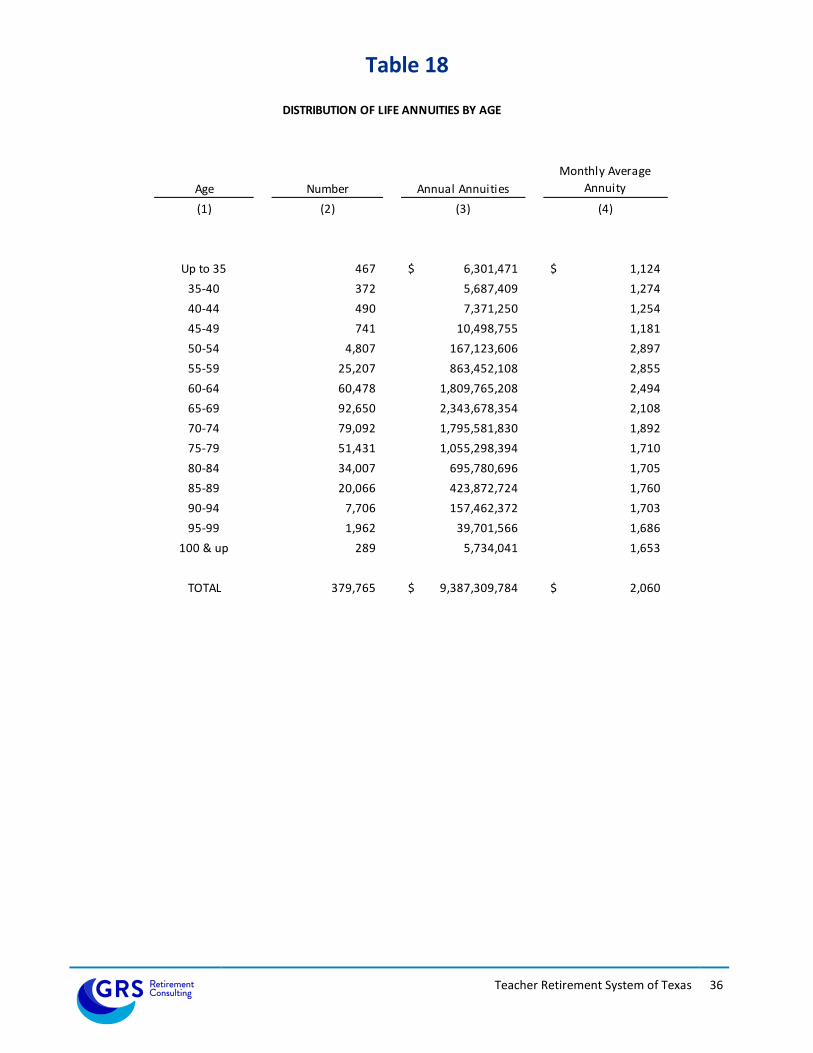
Teacher Retirement System of Texas 36
Table 18
DISTRIBUTION OF LIFE ANNUITIES BY AGE
Age Number Annual Annuities
Monthly Average
Annuity
(1) (2) (3) (4)
Up to 35 467 6,301,471$ 1,124$
35-40 372 5,687,409 1,274
40-44 490 7,371,250 1,254
45-49 741 10,498,755 1,181
50-54 4,807 167,123,606 2,897
55-59 25,207 863,452,108 2,855
60-64 60,478 1,809,765,208 2,494
65-69 92,650 2,343,678,354 2,108
70-74 79,092 1,795,581,830 1,892
75-79 51,431 1,055,298,394 1,710
80-84 34,007 695,780,696 1,705
85-89 20,066 423,872,724 1,760
90-94 7,706 157,462,372 1,703
95-99 1,962 39,701,566 1,686
100 & up 289 5,734,041 1,653
TOTAL 379,765 9,387,309,784$ 2,060$

Teacher Retirement System of Texas 37
Table 19
DISTRIBUTION OF DISABLED ANNUITIES BY AGE
Age Number Annual Annuities
Monthly Average
Annuity
(1) (2) (3) (4)
Up to 35 3 31,946$ 887$
35-40 32 386,931 1,008
40-44 152 2,067,415 1,133
45-49 444 7,302,870 1,371
50-54 1,069 17,803,680 1,388
55-59 1,919 29,082,004 1,263
60-64 2,476 34,145,735 1,149
65-69 2,173 27,548,911 1,056
70-74 1,330 15,751,571 987
75-79 834 10,919,293 1,091
80-84 610 9,294,100 1,270
85-89 403 7,272,131 1,504
90-94 128 1,985,202 1,292
95 -99 25 381,066 1,270
100 & up 2 12,453 519
TOTAL 11,600 163,985,308$ 1,178$

Teacher Retirement System of Texas 38
Table 20
% Increase Average
Valuation Annual Annual Annual in Annual Annual
August 31, Number Allowances Number Allowances Number Allowances Allowances Allowances
(1) (2) (3) (4) (5) (6) (7) (8) (9)
2002 19,678 $ 426,133,328 7,119 $ 100,259,400 201,441 $ 4,029,516,000 8.8% 20,003 $
2003 23,061 477,035,602 7,025 125,196,802 217,477 4,381,354,800 8.7% 20,146
2004 30,288 640,407,566 7,138 108,483,938 240,627 4,913,278,428 12.1% 20,419
2005 15,153 292,452,315 7,271 127,291,874 248,509 5,078,438,869 3.4% 20,436
2006 15,810 324,292,542 7,175 120,623,840 257,144 5,282,107,571 4.0% 20,541
2007 15,861 336,348,640 7,698 131,295,705 265,307 5,487,160,506 3.9% 20,682
2008 17,727 391,920,863 7,806 135,160,090 275,228 5,743,921,279 4.7% 20,870
2009 17,326 392,452,923 7,940 136,537,511 284,614 5,999,836,691 4.5% 21,081
2010 20,076 473,512,423 8,199 142,187,645 296,491 6,331,161,469 5.5% 21,354
2011 24,688 620,038,676 8,499 147,985,004 312,680 6,803,215,141 7.5% 21,758
2012 27,915 697,134,389 8,848 155,597,838 331,747 7,344,751,692 8.0% 22,140
2013 25,825 743,998,946 9,344 165,231,795 348,228 7,923,518,843 7.9% 22,754
2014 24,429 573,876,713 9,475 174,915,127 363,182 8,322,480,429 5.0% 22,915
2015 25,134 604,436,264 10,578 191,966,951 377,738 8,734,949,742 5.0% 23,124
2016 27,018 673,313,552 10,842 195,097,916 393,914 9,213,165,378 5.5% 23,389
2017 24,739 613,145,920 10,885 203,792,399 407,768 9,622,518,899 4.4% 23,598
RETIREES, BENEFICIARIES, AND DISABLED PARTICIPANTS ADDED TO AND REMOVED FROM ROLLS
Added to Rolls Removed from Rolls Rolls-End of Year

APPENDIX 1
SUMMARY OF BENEFIT PROVISIONS OF THE RETIREMENT SYSTEM

Teacher Retirement System of Texas 40
APPENDIX 1 Summary of Benefit Provisions of the Retirement System
As of August 31, 2017 The Teacher Retirement System of Texas makes retirement, disability, and death and survivor benefits to all employees of the public school system of Texas. The major provisions of the System may be summarized as follows:
A. RETIREMENT BENEFITS
1. Grandfather Criteria:
To be grandfathered, you must have met at least one of the following requirements as a member on or before August 31, 2005: (i) at least 50 years old, or (ii) age and years of service credit equal at least 70, or (iii) have at least 25 years of service credit.
2. Normal Retirement:
(a) end of month following age 65 and 5 years of creditable service,
(b) (i) For members hired before August 31, 2007: end of month following attainment of “Rule of 80”
(ii) For members hired on or after August 31, 2007 and who are vested as of August 31, 2014: end of month following attainment of “Rule of 80” with minimum age of 60.
(iii) For members who are not vested as of August 31, 2014: end of month following attainment of “Rule of 80” with minimum age of 62.
Standard Annuity:
The product of 2.3% of the member's average compensation multiplied by years of creditable service. The average compensation is calculated as the average of the highest five annual salaries (based on creditable compensation). Members who as of August 31, 2005, were either age 50, had 25 years of service, or whose age plus service totaled 70 have their standard annuity calculated using the average of their highest three annual salaries.
Normal Retirement Benefits:
Greater of standard annuity, or $150 per month.
3. Early Retirement:
(a) after age 55 with 5 or more years of creditable service, or
(b) after 30 years of creditable service, regardless of age.
(c) For members hired after August 31, 2007, end of month following attainment of “Rule of 80”.

APPENDIX 1 (Continued)
Teacher Retirement System of Texas 41
Early Retirement Benefits:
(a) If a member was hired prior to September 1, 2007, has more than 30 years of service but does not meet the Rule of 80, and has maintained continuous membership until retirement, the early retirement benefit is equal to the normal retirement benefit earned to the date of retirement, reduced by 2% for each point the member is less than age 50.
(b) If a member is grandfathered the early retirement benefit is equal to the normal retirement benefit earned to the date of retirement, reduced according to the following table:
AGE AT DATE OF RETIREMENT
Years of Service
55
56
57
58
59
60
20 90% 92% 94% 96% 98% 100% 21 92% 94% 96% 98% 100% 100% 22 94% 96% 98% 100% 100% 100% 23 96% 98% 100% 100% 100% 100% 24 98% 100% 100% 100% 100% 100% 25 100% 100% 100% 100% 100% 100% 26 100% 100% 100% 100% 100% 100% 27 100% 100% 100% 100% 100% 100% 28 100% 100% 100% 100% 100% 100% 29 100% 100% 100% 100% 100% 100%
30 or more 100% 100% 100% 100% 100% 100%
(c) If the member was hired after August 31, 2007 and is vested as of August 31, 2014 and the member has met the “Rule of 80” or has 30 years of service the benefit is reduced 5% per year from age 60.
(d) If the member is not vested as of August 31, 2014 and the member has met the “Rule of 80” or has 30 years of service the benefit is reduced 5% per year from age 62.
(e) If the member does not meet any of the conditions (a) – (d) above, the early retirement benefit is equal to the normal retirement benefit earned to the date of retirement, reduced according to the following table:
AGE AT DATE OF RETIREMENT
55
56
57
58
59
60
61
62
63
64
65
47% 51% 55% 59% 63% 67% 73% 80% 87% 93% 100%

APPENDIX 1 (Continued)
Teacher Retirement System of Texas 42
4. Normal Form of Benefit:
Straight life annuity payable monthly with benefits commencing at end of month following retirement with the last payment payable on behalf of the annuitant in the month of death.
5. Optional Forms:
Option 1 - joint and 100% survivor, benefit reverts to normal form following the death of the joint annuitant.
Option 2 - joint and 50% contingent survivor, benefit reverts to normal form following the death of the joint annuitant.
Option 3 - 5 years certain and life.
Option 4 - 10 years certain and life.
Option 5 - Joint and 75% contingent survivor, benefit reverts to normal form following the death of the joint annuitant.
6. Deferred Retirement Option Plan (DROP):
(a). Eligibility:
1) Must be an active contributing member.
2) Must be eligible for a standard service retirement annuity that is not reduced for retirement at an early age.
3) Must have at least 25 years of creditable service.
4) Must have entered the DROP program before January 1, 2006.
(b). Program Summary:
1) Participation begins the 1st of the month following the member’s application and TRS approval of the application. Participation may begin in any month.
2) Participation may range from a minimum of one year to a maximum of five years, in 12-month increments. The member elects the period of participation at the outset.
3) The amount of the member’s standard annuity is established as of the date of participation in the DROP. This amount is also used in determining the monthly deposit to the DROP account. A member will not accumulate further retirement annuity benefits during DROP participation, i.e., no further credit will be achieved from years of service or compensation changes.
APPENDIX 1 (Continued)
Teacher Retirement System of Texas 43
4) Any special service credit that a member wishes to purchase must be paid in full prior to DROP participation.
5) A separate DROP account will be established for each participating member. Each month, an amount equal to 60 percent of the calculated standard annuity will be deposited into the account. At retirement, the account plus interest at the rate of five percent per annum will be distributed.
6) Member and employer contributions continue during DROP participation. Contributions are not deposited into the member’s DROP account and will not be refunded.
7) Three events terminate participation - death, retirement or expiration of the participation period.
8) Upon retirement, participating members will receive their retirement annuity plus the balance in their DROP account including interest. DROP balances may be paid by TRS in a lump sum or on a time payout selected by the member.
7. Partial Lump-Sum Option Program:
Members, eligible for unreduced retirement and either (1) grandfathered or (2) meeting the Rule of 90, and not participating in the DROP program, may select a partial lump-sum distribution not to exceed an amount equal to 36 months of a standard service retirement annuity. When this option is selected, the member’s annuity will be actuarially reduced to reflect that distribution and will be computed so that no actuarial loss results to TRS.
The percentage shown in the following table will be applied to reduce the standard annuity when the partial lump-sum option is elected.

APPENDIX 1 (Continued)
Teacher Retirement System of Texas 44
Percentage of Standard Annuity
Age 12 Months 24 Months 36 Months
45
46 47
48 49 50
51 52
53 54 55
56 57 58
59 60
61 62 63
64 65
66 67 68
69 70
71 72 73
74 75
76 77 78
79 80 81
82 83
84 85 86
87 88
89 90 91
91.66
91.62 91.57
91.51 91.46 91.40
91.33 91.26
91.18 91.10 91.01
90.92 90.81 90.70
90.58 90.46
90.32 90.24 90.01
89.85 89.67
89.48 89.28 89.06
88.84 88.59
88.32 88.03 87.72
87.37 87.00
86.59 86.15 85.68
85.16 84.59 83.98
83.32 82.61
81.83 81.00 80.09
79.09 78.00
76.81 75.52 74.13
83.32
83.23 83.13
83.03 82.92 82.79
82.66 82.52
82.37 82.20 82.03
81.84 81.63 81.41
81.17 80.91
80.64 80.48 80.03
79.69 79.34
78.96 78.56 78.13
77.67 77.18
76.65 76.07 75.43
74.74 74.00
73.19 72.31 71.35
70.31 69.18 67.96
66.64 65.21
63.67 62.00 60.18
58.19 56.00
53.62 51.04 48.26
74.98
74.85 74.70
74.54 74.37 74.19
73.99 73.78
73.55 73.31 73.04
72.75 72.44 72.11
71.75 71.37
70.95 70.71 70.04
69.54 69.01
68.44 67.84 67.19
66.51 65.77
64.97 64.10 63.15
62.12 61.00
59.78 58.46 57.03
55.47 53.78 51.94
49.96 47.82
45.50 42.99 40.27
37.28 34.00
30.43 26.56 22.39

APPENDIX 1 (Continued)
Teacher Retirement System of Texas 45
8. Minimum Annuity Payments:
Total annuity payments shall in no case be less than the member's accumulated contributions at retirement. Upon the death of a retiree, the excess, if any, of accumulated contributions over total annuity payments received prior to death will be paid to the beneficiary.
B. DISABILITY BENEFITS
1. Less than 10 years of creditable service: $150.00 per month for the shorter of:
(a) disability, or
(b) number of months of creditable service as of date of disability retirement.
2. At least 10 years of creditable service: the greater of accrued retirement income or $6.50 per month per year of creditable service, payable for duration of disability; disability presumed continuous if it continues past age 60. The minimum disability payment made on behalf of a member will be no less than $150.00 per month.
C. DEATH BENEFITS
1. Eligibility: applicable if death occurs:
(a) in service,
(b) while absent from service for good cause,
(c) while not in service but eligible to retire,
(d) while not in service but would be eligible to retire without additional service before April 15 of the sixth school year after last creditable year of service, or
(e) while receiving a disability benefit, but only eligible for 2f, below.
2. Benefit: any one of the following, at the option of the beneficiary:
(a) a lump sum (not to exceed $80,000) equal to two times the rate of pay for the last year of service,
(b) a lump sum (not to exceed $80,000) equal to two times annual pay for the year preceding last year of service,
(c) 60 monthly payments of accrued standard annuity,
(d) a life annuity payable under Option 1 as if the member had retired on the last day of the month preceding death,
(e) a refund of accumulated contributions, or

APPENDIX 1 (Continued)
Teacher Retirement System of Texas 46
(f) the survivor benefits, if eligible.
Note: Items (c) and (d) available only if member has at least 5 years of creditable service.
3. Benefit if Absent from Service Without Good Cause: return of accumulated contributions.
D. SURVIVOR BENEFITS
1. Benefits: (a) or (b) at the election of the beneficiary:
(a) lump sum payment of $10,000, or
(b) lump sum payment of $2,500 plus one of the following, if the designated beneficiary is eligible:
(i) if a spouse or dependent parent, $250 per month commencing at age 65,
(ii) if a spouse with children under age 18, $350 per month until youngest child reaches 18, then $250 per month commencing at spouse's age 65, or
(iii) if dependent children, $350 per month as long as at least two dependent children under 18, reducing to $250 per month when there is only one child under 18.
If benefits are payable under (i) or (ii) above and eligible spouse or dependent dies, payments will revert in accordance with (iii) above.
2. Eligibility:
(a) all employees eligible for a death benefit other than refund of accumulated contributions,
(b) any retired member, in addition to any benefit provided by his or her option of payment, or
(c) any disabled participant, in lieu of other death benefits (Item C2).
E. VESTING OF BENEFITS
1. Vesting: a member is fully vested after 5 years of creditable service.
2. Benefits upon Vesting: a fully vested member is entitled to the following:
(a) upon becoming inactive, not required to withdraw accumulated contributions within seven years,

APPENDIX 1 (Continued)
Teacher Retirement System of Texas 47
(b) may apply at age 65 for normal retirement benefit equal to accrued standard annuity, or
(c) may apply for any other retirement benefits for which he or she is eligible upon satisfying age requirement (if applicable) if he or she satisfied the corresponding service requirement at time of last termination; benefit is based on his or her full accrued standard annuity.
F. MEMBER CONTRIBUTIONS
6.70% of compensation per year for fiscal year 2015, 7.20% for fiscal year 2016, and 7.70% for years on and after 2017.
G. STATE CONTRIBUTIONS
State will contribute 6.80% of member compensation for FY2015, and each year thereafter. Beginning in fiscal year 2015, covered employers whose employees are not participating in Social Security will begin contributing 1.50% of pay (capped at the minimum salary schedule). Combined it is expected that these contributions will be approximately 7.70% of total payroll.
H. LEGISLATIVE CHANGES MADE BY THE 1991 STATE LEGISLATURE
1. The minimum retirement benefit increased from $75 to $100 per month.
2. The disability death benefit changed to the same as a service retirement death benefit.
3. An ad hoc cost of living increase was approved for members who retired prior to May 1, 1989. The increase does not apply to a survivor benefit or to a disability benefit for a member who had less than 10 years of service at the time of retirement or death. The amount of the increase is five-tenths of one percent of each full six-month period between the latest effective date of retirement (or date of death) and August 1, 1991. The increase begins August 1991.
I. LEGISLATIVE CHANGES MADE BY THE 1993 STATE LEGISLATURE
1. Increase in survivor benefit by $50 per month.
2. Retroactive minimum benefit of $6.50 per year of service for members retired as of November 1, 1991.
3. An ad hoc cost of living increase approximating a 25% CPI catch-up. The actual percentage increase varies by year of retirement and has a minimum increase of 5%. The increase begins with the January, 1994 annuity check and covers all benefit recipients who began receiving benefits before August 31, 1991, except that it does not apply to survivor benefits or to a disability benefit for a member who had less than 10 years of service at the time of retirement or death.
4. ERS/TRS transfer provisions.

APPENDIX 1 (Continued)
Teacher Retirement System of Texas 48
(a) Service credit transfers allowed if the participant is a member of both ERS and TRS and has at least three years of service credit in the System from which the member is retiring.
(b) A member may reinstate or purchase service credit in the other System prior to making the transfer if that member has at least three years of service credit in the current System.
(c) TRS and ERS will jointly set rules for the assumptions used in computing asset transfer amounts. The transfer of funds between ERS and TRS takes place at the time of actual retirement.
J. LEGISLATIVE CHANGES MADE BY THE 1995 STATE LEGISLATURE
1. Unreduced benefits at retirement were expanded to include participants age 50 or older with 30 or more years of service.
2. Annuitants' benefits increased in an amount equal to the greater of:
(a) A recalculation of benefits based on
(i) January 1, 1995 law with all intervening ad hoc increases, plus
(ii) A CPI catch-up increase.
(b) A recalculation of benefits for retirees who retired before September 1, 1993, based on a 2% multiplier and a minimum annual salary of a classroom teacher or full-time librarian as described by the Education Code. This annual salary is currently $17,000 based on current Education Code.
3. Treat all Option 1 and Option 2 benefits as including the pop-up feature.
4. The annuity payment in the month of death is payable on behalf of the annuitant.
5. The disability benefit payable when a member has less than ten years of service increased from $50 per month to $150 per month for both current and future disabled members. The minimum disability payment made on behalf of a member with ten or more years of service shall be no less than $150 per month.
6. The benefit increase reserve account in TRS was eliminated, resulting in the liability for all annuity benefits being included within the retired reserve account.
7. The maximum two-times-pay death benefit payable on behalf of a member would increase from $60,000 to $80,000.
K. LEGISLATIVE CHANGES MADE BY THE 1997 STATE LEGISLATURE

APPENDIX 1 (Continued)
Teacher Retirement System of Texas 49
1. Driver’s education pay is added to plan compensation for the determination of a member’s best 3-year average compensation.
2. Disabled participants are allowed to select a Joint and Survivor annuity option after commencement of disability benefits, if they become married after date of disability.
3. Retirees are allowed to change the designated beneficiary for pension benefits payable after their death under certain conditions.
4. Adoption of “Rule of 80” criteria for unreduced standard retirement annuity (i.e., sum of member’s age & credited service is greater than or equal to 80).
5. Elimination of $6.50 per month per year of service minimum standard retirement annuity benefit.
6. Addition of $50.00 to the minimum survivor benefit.
7. Creation of a Deferred Retirement Option Program (DROP), described in Item A8 above.
8. A CPI catch-up ad hoc cost-of-living increase for retired members.
L. LEGISLATIVE CHANGES MADE BY THE 1999 STATE LEGISLATURE
1. Increased multiplier from 2.0% to 2.2% effective September 1, 1999, and an equivalent 10% increase for all retirees.
2. A CPI catch-up ad hoc cost-of-living increase for retired members.
3. Established a partial lump-sum option at time of retirement.
4. DROP participant enrolled on or before August 31, 1999, have a one-year window from September 1, 1999 to revoke DROP participation.
5. For members entering DROP on or after September 1, 1999, the monthly DROP deposit will be reduced from 79% to 60% of the standard annuity.
4. Provides a lump-sum death benefit of $160,000 for an active member employed by a school district who dies due to a physical assault during the performance of their regular duties.
5. Allows a return to teaching after being retired at least 12 months without a reduction in the retirement benefit under certain circumstances.
M. LEGISLATIVE CHANGES MADE BY THE 2001 STATE LEGISLATURE
1. Increased multiplier from 2.2% to 2.3% effective September 1, 2001, and an equivalent 4.5% increase for all retirees.

APPENDIX 1 (Continued)
Teacher Retirement System of Texas 50
2. A 6% ad hoc increase for retired members.
3. Increase in survivor benefits of $50 per month.
4. Allows a return to work as a bus driver with no reduction in the monthly benefit if retired with an unreduced benefit.
5. Permits purchase of up to 3 years of “air time” if the member has at least 7 years of actual membership service. Purchase price is the full actuarial cost of the purchased service.
N. LEGISLATIVE CHANGES MADE BY THE 2003 STATE LEGISLATURE
1. For employees hired on or after September 1, 2003, a 90-day waiting period is required for participation in TRS. Members may have the option to purchase this service. This provision is set to expire on September 1, 2005.
2. Limits the collection of overpayments to the three years prior to the overpayment discovery, except in cases of fraud or knowledge by the participant that the payments were incorrect.
3. Repealed the requirement that in order to reinstate service withdrawn after August 31, 2003, for the purposes of ERS/TRS transfer, the member must belong to the system from which the service is purchased.
4. Retirees who are employed by a third-party entity are considered to be employees of the school for return to work purposes unless the retiree does not perform duties or provide services in behalf of the school
5. Retirees may work as a substitute and on a half-time basis during a single calendar month as long as the total days worked do not exceed the number of days for one-half time employment for that month.
O. LEGISLATIVE CHANGES MADE BY THE 2005 STATE LEGISLATURE
1. Final average salary at retirement will be determined by the highest five years (instead of three years) of salary, subsidized early retirement will be eliminated, and partial lump sum option eligibility will require a combined age plus years of creditable service that equals at least 90 (“Rule of 90”).
2. Future members (those who establish TRS membership on or after September 1, 2007) will have the following eligibility requirements to qualify for an unreduced annuity at retirement: (i) age 65 with 5 years of service, or (ii) age 60 with at least 5 years of service and meets the Rule of 80 (combined age and years of service equal at least 80).
3. Employers will be required to pay a monthly surcharge to the pension fund for each retiree working in a TRS-covered position and reported to TRS.

APPENDIX 1 (Continued)
Teacher Retirement System of Texas 51
4. The Deferred Retirement Option Plan (DROP) is being discontinued for new participation effective December 31, 2005.
P. LEGISLATIVE CHANGES MADE BY THE 2007 STATE LEGISLATURE
1. The State contribution rate was increased to 6.58% for fiscal year 2008. In addition, the new law requires the State contribution rate to be at least equal to the member contribution rate.
2. The Legislature authorized TRS to make a one-time payment (13th check) in January 2008, if the August 31, 2007 actuarial valuation showed that the funding period would be less than 31 years with the payment. The payment is equal to the lesser of the member’s December monthly payment or $2,400. To be eligible a retiree must have retired on or before December 31, 2006.
Q. LEGISLATIVE CHANGES MADE BY THE 2009 STATE LEGISLATURE
The Legislature included funding for a one-time supplemental payment of $500 million for current retirees. This appropriation was contingent upon a ruling by the Attorney General’s office that such a payment is permissible under State law. The Attorney General determined this payment was not permissible, and therefore the additional appropriation will be contributed to the Trust as additional contributions, increasing the State contribution rate to an effective 6.644% for the biennium.
R. LEGISLATIVE CHANGES MADE BY THE 2013 STATE LEGISLATURE
1. The normal retirement eligibility for members who are not vested as of August 31, 2014 to the “Rule of 80” with minimum age 62 (was minimum age of 60).
2. For members who are not vested as of August 31, 2014, their early retirement benefit will be reduced from age 62 (was 60) if they meet the Rule of 80” but are not eligible for normal retirement.
3. The Legislature granted an ad hoc COLA for members in payment status since August 31, 2004. The payment is equal to the lesser of $100 or 3% of their monthly payment.
4. The member contribution rate will increase to 6.70% in fiscal year 2015, 7.20% in fiscal year 2016, and 7.70% for fiscal years on and after 2017.
5. The State’s contribution rate increased to 6.80% in fiscal year 2014.
6. Covered employers whose employees are not participating in Social Security whose positions are subject to the state statutory minimum salary schedule will begin contributing 1.50% of pay in fiscal year 2015.
APPENDIX 2
ACTUARIAL ASSUMPTIONS AND METHODS

Teacher Retirement System of Texas 53
APPENDIX 2 Actuarial Assumptions and Methods
(Adopted September 24, 2015)
The following assumptions were developed and recommended based on an experience study performed in 2015. All of the assumptions are based on a combination of anticipated future experience and market observations. We believe all of the assumptions are reasonable and appropriate for this measurement. Please see our report dated September 9, 2015 for more discussion about the selection of these assumptions.
ACTUARIAL ASSUMPTIONS
1. Investment Return Rate 8.00% per annum, compounded annually, composed of an assumed 2.50% inflation rate and a 5.50% real rate of return, net of investment expenses
2. Mortality, Withdrawal, Disability Retirement, and Service Retirement Rates:
Rates and scales developed in the actuarial investigation as August 31, 2014, with values at specimen ages shown in the tables below:
a. Active Mortality: RP-2014 Employee Mortality Tables for male and female multiplied by 90%, with full generational projection using Scale BB. Below are the samples rates for 2014 and 2044.
Age Male Female
20 0.000365 0.000146
30 0.000407 0.000196
40 0.000565 0.000356
50 0.001517 0.000992
60 0.004219 0.002198
70 0.012469 0.005678
80 0.034930 0.016542
90 0.123749 0.092945
2014 Mortality Rates
Age Male Female
20 0.000334 0.000133
30 0.000372 0.000179
40 0.000516 0.000326
50 0.001387 0.000906
60 0.003417 0.001626
70 0.007923 0.003953
80 0.022196 0.011516
90 0.088804 0.066698
2044 Mortality Rates

APPENDIX 2 (Continued)
Teacher Retirement System of Texas 54
b. Rates of Termination (net of applying rehire assumption)
The following table is used for all years after the first ten years of employment.
Years of
Service Male Female
1 0.149027 0.143098
2 0.119756 0.117329
3 0.096637 0.097896
4 0.072275 0.076765
5 0.062453 0.068443
6 0.055556 0.060368
7 0.047176 0.049631
8 0.041464 0.043108
9 0.036978 0.038477
10 0.033777 0.035264
Probability of Decrement Due
to Withdrawal
Years
from NR Male Female
Years
from NR Male Female
1 0.012140 0.009500 17 0.024208 0.027793
2 0.014373 0.012353 18 0.024547 0.028402
3 0.015865 0.014405 19 0.024873 0.028990
4 0.017017 0.016064 20 0.025185 0.029559
5 0.017968 0.017481 21 0.025487 0.030110
6 0.018783 0.018731 22 0.025777 0.030646
7 0.019502 0.019858 23 0.026058 0.031166
8 0.020147 0.020888 24 0.026329 0.031673
9 0.020733 0.021842 25 0.026592 0.032166
10 0.021273 0.022731 26 0.026848 0.032648
11 0.021772 0.023567 27 0.027096 0.033118
12 0.022239 0.024357 28 0.027337 0.033578
13 0.022676 0.025107 29 0.027571 0.034027
14 0.023090 0.025822 30 0.027800 0.034467
15 0.023481 0.026506 31 0.028023 0.034898
16 0.023853 0.027162 32 0.028241 0.035320
Probability of Decrement Due to Withdrawal Based on Years
from Normal Retirement

APPENDIX 2 (Continued)
Teacher Retirement System of Texas 55
c. Rates of Disability Retirement
d. Rates of Retirement
Age Male Female Male Female
20 0.000184 0.000276 0.000037 0.000055
30 0.000184 0.000276 0.000037 0.000055
40 0.000430 0.000469 0.000086 0.000094
50 0.001993 0.001817 0.000399 0.000363
60 0.003505 0.002754 0.000701 0.000551
Probability of Decrement Due to Disability
For Service >= 10 For Service < 10
Age AgeMale Female Male Female
50 0.1300 0.3000 45 0.0100 0.0100
51 0.1300 0.1200 46 0.0100 0.0100
52 0.1300 0.1300 47 0.0100 0.0200
53 0.1300 0.1400 48 0.0200 0.0300
54 0.1400 0.1500 49 0.0300 0.0400
55 0.1500 0.1600 50 0.0100 0.0100
56 0.1600 0.1700 51 0.0100 0.0100
57 0.1700 0.1800 52 0.0100 0.0100
58 0.1800 0.1900 53 0.0100 0.0100
59 0.1800 0.2000 54 0.0100 0.0100
60 0.2200 0.2100 55 0.0100 0.0100
61 0.2000 0.2200 56 0.0100 0.0100
62 0.2400 0.2300 57 0.0100 0.0100
63 0.2000 0.2300 58 0.0100 0.0100
64 0.2000 0.2300 59 0.0100 0.0200
65 0.2200 0.2300 60 0.0200 0.0200
66 0.2200 0.2300 61 0.0200 0.0200
67 0.2200 0.2300 62 0.0500 0.0400
68 0.2200 0.2300 63 0.0500 0.0500
69 0.2200 0.2300 64 0.0600 0.0600
70 0.2200 0.2300 65 0.0500 0.0500
71 0.2200 0.2300
72 0.2200 0.2300
73 0.2200 0.2300
74 0.2200 0.2300
75 1.0000 1.0000
Normal Retirement Early Retirement

APPENDIX 2 (Continued)
Teacher Retirement System of Texas 56
For members hired after August 31, 2007 and who are vested as of August 31, 2014, the retirement rates for members once they reach unreduced retirement eligibility at age 60 are increased 10% for each year the member is beyond the Rule of 80 (i.e. if the member reached the Rule of 80 at age 58 then the probability of retirement at age 60 is 120% of the rate shown above).
For members hired after August 31, 2007 and who are not vested as of August 31, 2014, or, for members hired after August 31, 2014, the retirement rates for members once they reach unreduced retirement eligibility at age 62 are increased 10% for each year the member is beyond the Rule of 80 (i.e. if the member reached the Rule of 80 at age 58 then the probability of retirement at age 62 is 140% of the rate shown above).
3. Rates of Salary Increase
Inflation rate of 2.50%, plus productivity component of 1.00%, plus step-rate/promotional component as shown:
Years of Service
Merit, Promotion,
Longevity General Total
1 6.00 % 3.50 % 9.50 %
2 2.50 3.50 6.00
3 1.90 3.50 5.40
4 1.70 3.50 5.20
5 1.50 3.50 5.00
6 1.40 3.50 4.90
7 1.20 3.50 4.70
8 1.00 3.50 4.50
9 1.00 3.50 4.50
10 1.00 3.50 4.50
11 1.00 3.50 4.50
12 1.00 3.50 4.50
13 0.80 3.50 4.30
14 0.70 3.50 4.20
15 0.60 3.50 4.10
16 0.50 3.50 4.00
17 0.50 3.50 4.00
18 0.40 3.50 3.90
19 0.30 3.50 3.80
20 0.30 3.50 3.80
21 0.20 3.50 3.70
22 0.20 3.50 3.70
23 0.10 3.50 3.60
24 0.10 3.50 3.60
25 & up 0.00 3.50 3.50
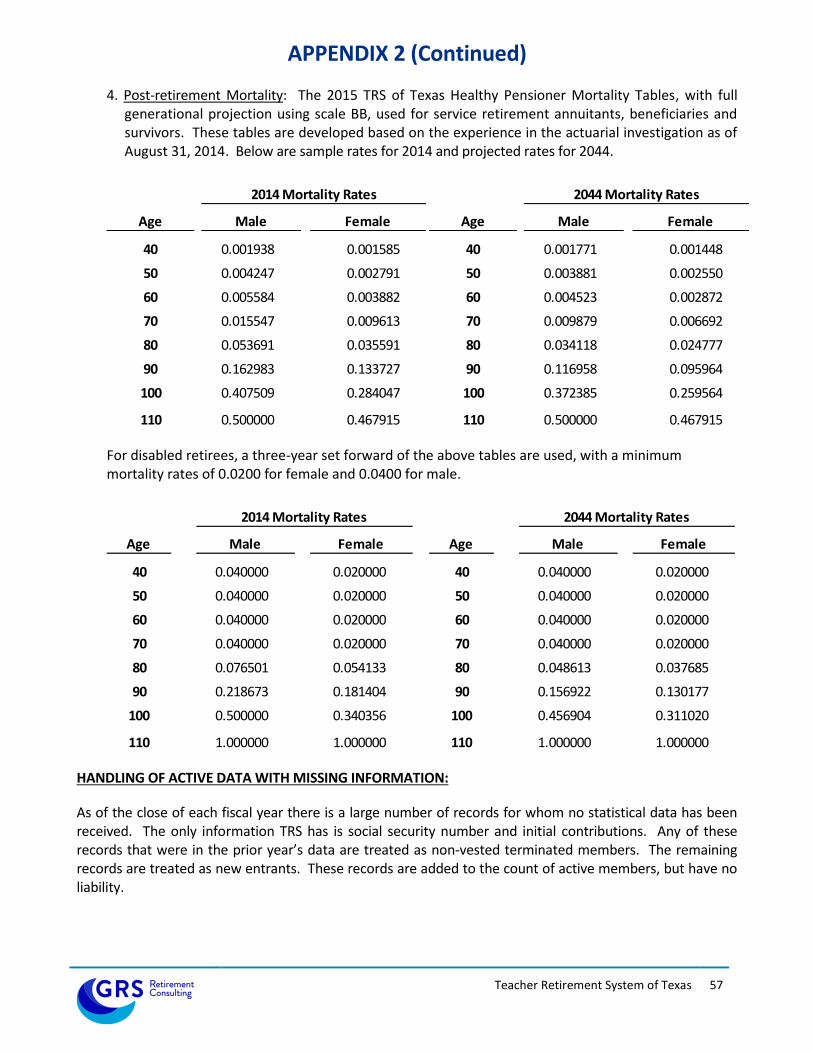
APPENDIX 2 (Continued)
Teacher Retirement System of Texas 57
4. Post-retirement Mortality: The 2015 TRS of Texas Healthy Pensioner Mortality Tables, with full generational projection using scale BB, used for service retirement annuitants, beneficiaries and survivors. These tables are developed based on the experience in the actuarial investigation as of August 31, 2014. Below are sample rates for 2014 and projected rates for 2044.
For disabled retirees, a three-year set forward of the above tables are used, with a minimum mortality rates of 0.0200 for female and 0.0400 for male.
HANDLING OF ACTIVE DATA WITH MISSING INFORMATION:
As of the close of each fiscal year there is a large number of records for whom no statistical data has been received. The only information TRS has is social security number and initial contributions. Any of these records that were in the prior year’s data are treated as non-vested terminated members. The remaining records are treated as new entrants. These records are added to the count of active members, but have no liability.
Age Male Female
40 0.001938 0.001585
50 0.004247 0.002791
60 0.005584 0.003882
70 0.015547 0.009613
80 0.053691 0.035591
90 0.162983 0.133727
100 0.407509 0.284047
110 0.500000 0.467915
2014 Mortality Rates
Age Male Female
40 0.001771 0.001448
50 0.003881 0.002550
60 0.004523 0.002872
70 0.009879 0.006692
80 0.034118 0.024777
90 0.116958 0.095964
100 0.372385 0.259564
110 0.500000 0.467915
2044 Mortality Rates
Age Male Female
40 0.040000 0.020000
50 0.040000 0.020000
60 0.040000 0.020000
70 0.040000 0.020000
80 0.076501 0.054133
90 0.218673 0.181404
100 0.500000 0.340356
110 1.000000 1.000000
2014 Mortality Rates
Age Male Female
40 0.040000 0.020000
50 0.040000 0.020000
60 0.040000 0.020000
70 0.040000 0.020000
80 0.048613 0.037685
90 0.156922 0.130177
100 0.456904 0.311020
110 1.000000 1.000000
2044 Mortality Rates

APPENDIX 2 (Continued)
Teacher Retirement System of Texas 58
There are other records provided by TRS that have missing gender and/or missing date of births. These records are handled as follows:
1. 80% of records with missing gender are assumed to be female. The overall male/female ratio of the active membership is used to set this assumption.
2. Records with missing dates of birth are assigned a date of birth that produces an entry age equal to the average entry age for the overall active population, based on the member’s actual service.
ASSUMPTION FOR DROP PARTICIPATION
Current active members are not eligible to participate in DROP, therefore no new DROP members are assumed.
BENEFIT ELECTION OF VESTED TERMINATING MEMBERS:
In determining the liabilities developed for future terminating vested members, it is assumed that the member elects either a refund or a deferred vested benefit, whichever is more valuable. The deferred benefit is assumed to commence at the earliest age the member is eligible for unreduced retirement.
ELECTION RATES FOR ACTIVE MEMBER DEATH BENEFITS:
It is assumed that the beneficiary will elect the death benefit option with the greatest value.
DECREMENT TIMING:
Retirement is assumed to occur at the end of the year. Termination from service is assumed to occur at the beginning of the year. All other decrements are assumed to occur mid-year.
BENEFIT ELECTION OPTIONS:
It is assumed that future healthy retirees will select the normal form of payment. For disabled members, 80% are assumed to select the normal form of payment and 20% to select the 100% joint and survivor option.
MARRIAGE ASSUMPTION:
While not implicitly used in the valuation, 100% of active members are assumed to be married when setting other benefit election and eligibility assumptions.
SPOUSAL AGE DIFFERENCE:
Husbands are assumed to be three years older than their wives.

APPENDIX 2 (Continued)
Teacher Retirement System of Texas 59
CLASSIFICATION OF WHO ARE ACTIVE MEMBERS:
Members who contributed during the just-completed plan year but did not retire before August 31st are considered active.
AVERAGE SURVIVOR BENEFIT LIABILITY:
One of the options on the death of an active member, a disabled member, or a retired member is a survivor benefit. To determine the liability for this benefit the following average values are used.
Males Females
1. Active member $62,200 $59,000
2. Disabled member $13,000 $11,000
3. Retired member $12,000 $12,000
ACTUARIAL VALUE OF ASSETS:
A. The actuarial value of assets is equal to the market value of assets less a five-year phase in of the excess (shortfall) between expected investment return and actual income. The actual calculation is based on the difference between actual market value and the expected actuarial value of assets each year, and recognizes the cumulative excess return (or shortfall) over a minimum rate of 20% per year. Each year a base is set up to reflect this difference. If the current year’s base is of opposite sign to the deferred bases then it is offset dollar for dollar against the deferred bases. Any remaining bases are then recognized over the remaining period for the base (5 less the number of years between the bases year and the valuation year). This is intended to ensure the smoothed value of assets will converge towards the market value in a reasonable amount of time.
B. Expected earnings are determined using the assumed investment return rate and the beginning of year actuarial value of assets (adjusted for receipts and disbursements during the year). Beginning in fiscal year 2016, the returns are computed net of investment expenses.
PAYROLL GROWTH FOR FUNDING OF UNFUNDED ACTUARIAL ACCRUED LIABILITY:
Total payroll is expected to grow at 2.50% per year. The total general wage increase assumption of 3.00% is made up of an inflation rate of 2.50% plus a 0.50% real wage growth. This value is used to increase the wages for each annual cohort of new entrants in an open group projection based on the current demographics and the current assumptions. Because of the larger than normal number of members either eligible to retire or expected to retire in the next 5-10 years, the projection anticipates that without population growth, the growth in overall payroll will be damped to below the general wage increase assumption.

APPENDIX 2 (Continued)
Teacher Retirement System of Texas 60
ACTUARIAL COST METHOD:
The funding period required to amortize the unfunded actuarial accrued liability (UAAL) is determined using the Entry Age Actuarial Cost Method. This method assigns the plan's total unfunded liabilities (the actuarial present value of future benefits less the actuarial value of assets) to various periods. The unfunded actuarial accrued liability is assigned to years prior to the valuation, and the normal cost is assigned to the year following the valuation. The remaining costs are assigned to future years.
The normal cost is determined using the "ultimate entry age normal" method. Under this cost method, a calculation is made to determine the average uniform and constant percentage rate of employer contribution which, if applied to the compensation of each participant during the entire period of his/her anticipated covered service, would be required to meet the cost of all benefits payable on his behalf based on the benefits provisions for new employees hired on or after August 31, 2016.
The actuarial accrued liability (AAL) for each member is the difference between their present value of future benefits (PVFB), based on the tier of benefits that apply to the member, and their present value of future normal costs determined using the normal cost rate described above. For inactive and retired members their AAL is equal to their PVFB.
The unfunded actuarial accrued liability (UAAL) is the excess of the actuarial accrued liability over the actuarial value of assets.
Since the State statutes governing the System establish the current employee and State contribution rates, the actuarial valuation determines the number of years required to amortize (or fund) the UAAL on a level percentage of payroll basis, taking into account the payroll growth assumption and the normal cost expressed as a percent of pay.
Because of this amortization procedure, any change in the unfunded actuarial accrued liability due to (i) actuarial gains and losses, (ii) changes in actuarial assumptions, or (iii) amendments, affects the funding period. The statutory goal is that the State contribution rate be sufficient to keep the funding period below 31 years.
PROJECTED PAYROLL FOR CONTRIBUTIONS:
The aggregate projected payroll for the fiscal year following the valuation date is calculated by increasing the actual payroll paid during the previous fiscal year by the payroll growth rate.
USE OF CELLED DATA:
For valuation purposes, every record in the census is valued individually.
For legislative purposes, the active valuation data is celled by benefit tier, gender, years of service, month and year of birth. The individual cell is valued using the sum of the salary and account balances of the members in the cell. Every year we test this approach against using the individual records and the results are consistently less than 0.02% different in total present value of benefits.

APPENDIX 2 (Continued)
Teacher Retirement System of Texas 61
FUNDING OF UNFUNDED ACTUARIAL ACCRUED LIABILITY:
The unfunded actuarial accrued liability is funded by the excess of future State/employer contributions required by Law over the amount of such contributions required to fund the normal cost of benefits. Under the actuarial funding method and the benefit provisions for new hires, the ultimate normal cost for benefits provided by the System is 9.94% of payroll (7.70% by members plus 2.24% by the State). An additional 0.12% of payroll is used to pay for the administrative expenses of the System, leaving 5.34% of payroll less than the ultimate total contribution rate required by Law. It is intended that the excess amount of 5.34% of payroll will be used to amortize any unfunded actuarial accrued liabilities of the System, assuming that total payroll increases by 2.50% per year.
As of the valuation as of August 31, 2017, these excess contributions of 5.34% of pay are sufficient to amortize the UAAL, but not under a 30 year funding period.
CHANGES SINCE THE PRIOR VALUATION:
In the 2013 valuation, following legislative changes to TRS-CARE in the 2013 session, there were adjustments made to the retirement rates for members eligible to retire but who were not TRS-CARE grandfathered as of August 31, 2014. Due to changes in TRS-CARE by the 2017 Texas Legislature, these adjustments to the retirement rates are no longer appropriate and they have been eliminated.

0
GLOSSARY
DEFINITION OF ACTUARIAL TERMS

Teacher Retirement System of Texas 63
GLOSSARY
Definition of Actuarial Terms
H.B. 2206 as passed by the 1979 Legislature requires that any actuarial study of a public retirement system include "a complete definition of each actuarial term used in the study". In our report we have attempted to avoid the use of a multitude of complex actuarial terminology, but we realize that different users of our reports may have differing opinions as to what constitutes an "actuarial term". Accordingly, in keeping with the intent and the spirit of the law, we offer the following definitions of several terms contained in this report which might be considered actuarial in nature. Any qualified user of our report who believes that additional terms should be included is invited to communicate such terms either directly to us or through the Teacher Retirement System of Texas.
1. Actuarial Accrued Liability - for benefits payable in the future to present members, it will equal the present value of benefits payable in the future to them less the present value of future normal costs.
2. Actuarial Assumptions - assumptions as to future experience under the System. Current actuarial assumptions are detailed in Table 21 of the current annual valuation report. Assumptions include future fund earning rates, rates of future salary increases, and rates of death (both before and after retirement), disability, retirement, and withdrawal. Effective August 31, 1985, select and ultimate assumptions were adopted for retirement and withdrawal rates and the salary scale.
3. Actuarial Gain or Actuarial Loss - a measure of the difference between actual experience and assumed experience of the System. Through the actuarial assumptions, rates of decrements, rates of salary increases, and rates of fund earnings have been forecasted. To the extent that actual experience differs from that assumed, actuarial liabilities emerge which may be the same as forecasted, or they may be larger or smaller than projected. Actuarial gains are due to favorable experience, e.g., the System's assets earn more than projected, salaries do not increase as fast as assumed, members retire later than assumed, etc. Favorable experience means actual results produce actuarial liabilities not as large as projected by the actuarial assumptions. On the other hand, actuarial losses are the result of unfavorable experience, i.e., actual results that produce actuarial liabilities which are larger than projected. Actuarial gains will shorten the time required for funding of the actuarial balance sheet deficiency while actuarial losses will lengthen the funding period.
4. Actuarial Liabilities - the actuarially determined present value of future benefits to be provided by the System. There are separate actuarially determined present values for retired members and non-retired members (either active or inactive). When applied to active members, it takes into account benefits which will be earned through future service and future salary increases.
5. Actuarial Value of Present Assets - the value of present System assets for valuation purposes. Prior to August 31, 1985, this value was the same as the book value of assets. Beginning August 31, 1985, through August 31, 1993, this value was calculated under the “market over book adjusted asset valuation method.” Beginning August 31, 1993, this value is calculated under a five-year phase in of the excess (shortfall) between expected and actual income return on the market value of assets.

Glossary (Continued)
Teacher Retirement System of Texas 64
6. Actuarially Determined - values which have been determined utilizing the principles of actuarial science. An actuarially determined value is derived by application of the appropriate actuarial assumptions to specified values determined by provisions of the law.
7. Decrements - those types of activities by members of the System which cause them no longer to be members, i.e., death, retirement, disability, and withdrawal. It is a general term referring to any or all of these membership terminating events.
8. Defined Benefits - in a retirement plan, benefits which are defined by a specific formula applied to specific member compensation and/or specific years of service. The amount of the benefit is not a function of contributions or actual earnings on those contributions.
9. Defined Contributions - in a retirement plan, periodic contributions to the plan which are defined as a specific percent of compensation.
10. Experience Study - a periodic review and analysis of the actual experience of the System which may lead to a revision of one or more actuarial assumptions. Actual rates of decrement and salary increases are compared to the actuarially assumed values and modified as deemed appropriate by the Actuary.
11. Funding Period - the number of years in the future that will be required to fund (i.e., pay off or eliminate) the unfunded actuarial accrued liability, based on the actuarial assumptions and assuming no future actuarial gains or losses.
12. Future Benefits - benefits specified in the law which will become payable at some time in the future when the member satisfies the requirement to receive such benefits.
13. Future Contributions - contributions to be made by the member or the State in the future, as required by the law.
14. Normal Cost - the actuarial cost to fund the benefits provided by the System were the funding to begin at date of hire. It is expressed as a percent of pay and is equal to the present value at hire of all possible benefits of the System divided by the present value of anticipated future compensation to be received by the new member. In the aggregate, it must be less than the total future contribution to the System if the unfunded actuarial accrued liability is to be amortized. Otherwise there must be a funding surplus sufficient in size to offset any contribution rate shortfall.
15. Present Value - the actuarially determined lump sum value as of the valuation date of a series of payments to be made in the future, where the lump sum value is equal to the sum of the discounted value of each future payment. The discounted value of each payment is the product of (a) the amount of the payment, (b) the probability that the payment will be made (based on the current actuarial assumptions as to future experience), and (c) the time value of money (based on the current assumed interest rate).
16. Unfunded Actuarial Accrued Liability - that portion of the actuarial accrued liability (including the present value of benefits presently being paid to retired members) that exceeds the value of current actuarial assets. A funding surplus exists if the actuarial accrued liability is less than the actuarial assets.