Psychology 110: General Psychology Ann Voorhies. What is Psychology?
Oxford Cambridge and RSA
AS and A LEVELTeacher Guide
PSYCHOLOGYH167/H567For first teaching in 2015
QualificationAccredited
www.ocr.org.uk/psychology
Descriptive Statistics Version 2
2
If you have any feedback on this Teacher Guide or suggestions for other resources you would like OCR to develop, please email [email protected]
A LEVELPSYCHOLOGY
1. Introduction Page 3
2. Raw data Page 5
3. Measures of central tendency Page 7
4. Measures of dispersion Page 8
5. Levels of measurement Page 9
6. Graphs and charts Page 10
7. Types of Data Page 12
Intr
oduc
tion
3
Sect
ion
1: In
trod
ucti
onIntroduction
This teacher guide provides information and teaching and learning ideas for research methods content relating to raw data, levels and types of data as well as descriptive statistics which is a key requirement of the AS and A Level. It should be used alongside the student workbook which contains a wide range of exercises.
The guide and workbook should help students:
• To understand measures of central tendency and measures of dispersion and what they are used for. • To be able to calculate the mean, median and mode.• To be able to interpret descriptive statistics and draw inferences from them.• To be able to understand and identify levels of measurement• To be able to draw appropriate graphs or tables.• To be able to interpret graphs and tables and draw conclusions from them. Data is a new part of the AS and A Level specification:
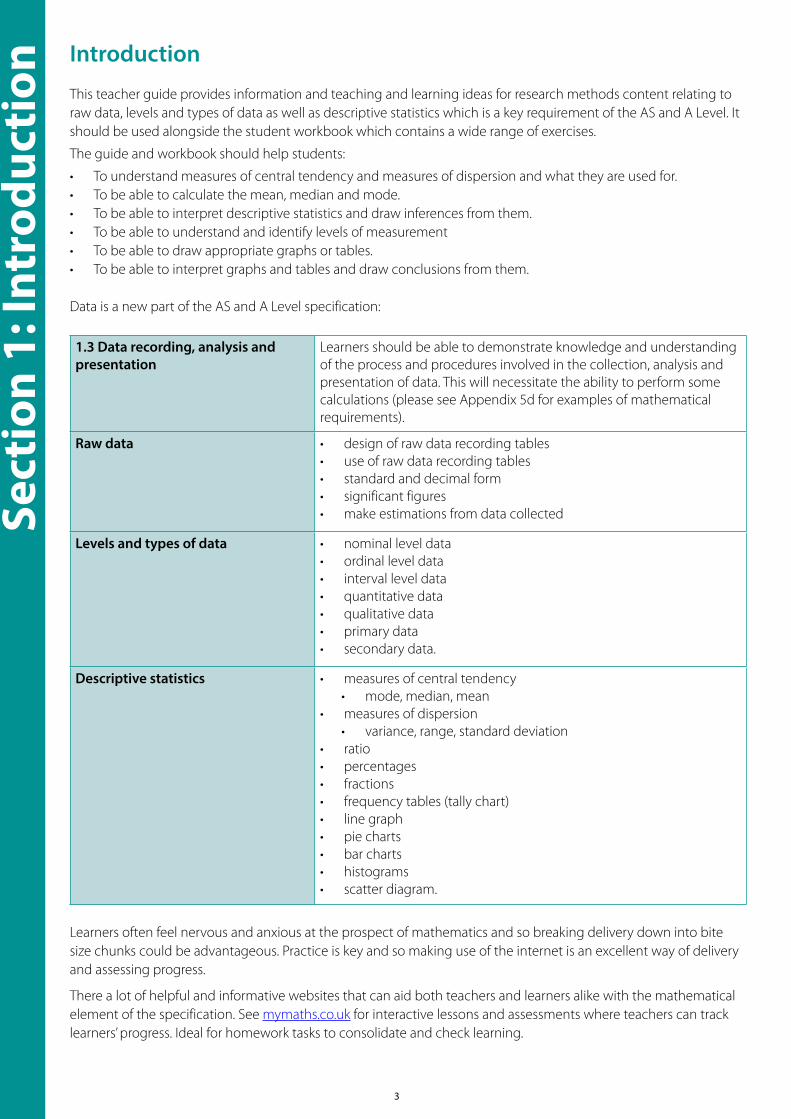
1.3 Data recording, analysis and presentation
Learners should be able to demonstrate knowledge and understanding of the process and procedures involved in the collection, analysis and presentation of data. This will necessitate the ability to perform some calculations (please see Appendix 5d for examples of mathematical requirements).
Raw data • design of raw data recording tables • use of raw data recording tables • standard and decimal form • significant figures • make estimations from data collected
Levels and types of data • nominal level data • ordinal level data • interval level data • quantitative data • qualitative data • primary data • secondary data.
Descriptive statistics • measures of central tendency• mode, median, mean
• measures of dispersion • variance, range, standard deviation
• ratio• percentages • fractions • frequency tables (tally chart) • line graph • pie charts • bar charts • histograms • scatter diagram.
Learners often feel nervous and anxious at the prospect of mathematics and so breaking delivery down into bite size chunks could be advantageous. Practice is key and so making use of the internet is an excellent way of delivery and assessing progress.
There a lot of helpful and informative websites that can aid both teachers and learners alike with the mathematical element of the specification. See mymaths.co.uk for interactive lessons and assessments where teachers can track learners’ progress. Ideal for homework tasks to consolidate and check learning.
4
Sect
ion
1: In
trod
ucti
onBBC GCSE bitesize is ideal for less able students to refresh their memory of the skills and rules surrounding the calculations.
YouTube has some brilliant short video clips on carrying out the calculations which are ideal for visual learners.
By way of supporting less able learners, a template has been provided with all the calculations on. It is anticipated that these could be photocopied onto cardboard and cut down to size so learners can keep them to use in class tests.
Sect
ion
2: R
aw D
ata
5
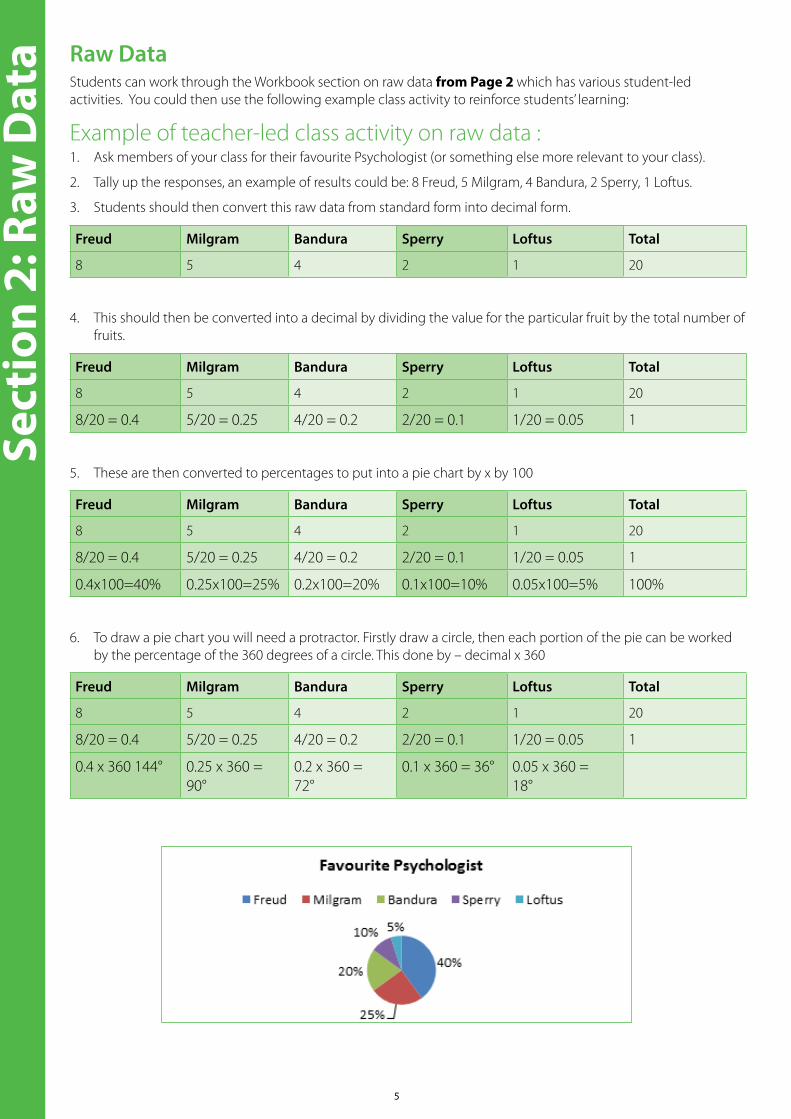
Raw DataStudents can work through the Workbook section on raw data from Page 2 which has various student-led activities. You could then use the following example class activity to reinforce students’ learning:
Example of teacher-led class activity on raw data : 1. Ask members of your class for their favourite Psychologist (or something else more relevant to your class).
2. Tally up the responses, an example of results could be: 8 Freud, 5 Milgram, 4 Bandura, 2 Sperry, 1 Loftus.
3. Students should then convert this raw data from standard form into decimal form.
Freud Milgram Bandura Sperry Loftus Total
8 5 4 2 1 20
4. This should then be converted into a decimal by dividing the value for the particular fruit by the total number of fruits.
Freud Milgram Bandura Sperry Loftus Total
8 5 4 2 1 20
8/20 = 0.4 5/20 = 0.25 4/20 = 0.2 2/20 = 0.1 1/20 = 0.05 1
5. These are then converted to percentages to put into a pie chart by x by 100
Freud Milgram Bandura Sperry Loftus Total
8 5 4 2 1 20
8/20 = 0.4 5/20 = 0.25 4/20 = 0.2 2/20 = 0.1 1/20 = 0.05 1
0.4x100=40% 0.25x100=25% 0.2x100=20% 0.1x100=10% 0.05x100=5% 100%
6. To draw a pie chart you will need a protractor. Firstly draw a circle, then each portion of the pie can be worked by the percentage of the 360 degrees of a circle. This done by – decimal x 360
Freud Milgram Bandura Sperry Loftus Total
8 5 4 2 1 20
8/20 = 0.4 5/20 = 0.25 4/20 = 0.2 2/20 = 0.1 1/20 = 0.05 1
0.4 x 360 144° 0.25 x 360 =90°
0.2 x 360 =72°
0.1 x 360 = 36° 0.05 x 360 =18°
Sect
ion
2: R
aw D
ata
6
Example of teacher-led class activity on ratiosThis can done by using data from core studies, or this could be data they have collected from their own practical activities. For the purpose of ratios, you only need to collect two sets of data. In order to make it fun and relevant to psychology you could give them a questionnaire and divide them into extroverts or introverts, or maybe you could show a clip from the Simons and Chabris study and categorise into those you did see the gorilla and those didn’t in either the hard or easy task, black team or white.
http://www.youtube.com/watch?v=vJG698U2Mvo
For example if in your class 15 saw the figure walk across and 10 did not, your ratio would be 15:10 and simplified as 3:2.
For further practice, give your student a list of ratios to simplify.
Sect
ion
3: M
easu
re o
f Cen
tral
Ten
denc
y
7
Measures of central tendencyDescriptive statistics are the first step to any data analysis. They are used to describe the data and show a summary of the results.
Measures of central tendency include the mean, median and mode. Students are required to be able to calculate these and draw inferences from tables of results.
Worksheet 1 Worksheet 1 on Page 12 of the student workbook introduces students to the different descriptive statistics including measures of central tendency and measures of dispersion. Candidates often confuse the two and so it is important they understand the distinction between them.
Measures of central tendency show the averages. By contrast, measures of dispersion show the spread of scores around the mean value.
Students need to be familiar with the mean, median and mode. They should know how to calculate them as well as when they are used. Knowing the advantages and disadvantages to each is also required.
The activities in the workbook starting on Page 13 will give them practice at calculating each one.
You could use the experiments on Pages 15 and 16 to test students’ understanding of when it is appropriate to use each of the measures of central tendency and hold a class discussion.
Useful websiteswww.bbc.co.uk (KS2 Bitesize) is an excellent resource enabling students to re-visit how to calculate the measures of central tendency. Although designed for key stage 2, it is ideal for weaker students and could be set as a homework activity.
www.purplemath.com/modules/meanmode.htm offers a step by step guide to calculating the averages. There are some examples and exercises where students are required to practice their calculations. This is ideal for students who need more practice beyond the activity on the worksheet.
Common misconceptionsStudents are often familiar with the mean, median and mode and so may just need to re-familiarise themselves with the calculations. Interpreting results appears to be more challenging and so giving students plenty of opportunity to practice this is encouraged.
It is also encouraged that students are given the opportunity to carry out research for themselves. Analysing their own data and drawing conclusions is a very effective way of consolidating and reinforcing learning.
Sect
ion
4: M
easu
res
of d
ispe
rsio
n
8
Measures of dispersion: range, variation and standard deviation Worksheet 2 on Page 17 is designed to introduce students to the three measures of dispersion: range, variance and standard deviation (SD). Students should know how to calculate the range, variance and standard deviation, as well as interpreting them and analysing results from these calculations.
This is how you calculate the Population Standard Deviation:
1. Calculate the mean.
2. For each number subtract the mean.
3. Square the result.
4. Work out the mean of the squared differences (this is the variance).
5. Square root this score.
The standard deviation tells us about the spread of scores around the mean. A large SD indicates that the scores are spread widely around the mean. A small SD indicates that the scores are very closely spread around the mean.
Example of teacher-led class activity on standard deviationThe following is an effective way to help students understand the standard deviation without having to work it, it also gives them awareness of what a high, low and a zero standard deviation scores equate to.
Psychology classes were given a test on quantitative skills by their teachers. As some students revised and others didn’t, performance was a little mixed. The following were the scores out of 20. Firstly calculate the mean for each class.
CLASS 1 – 18, 2, 15, 5, 13, 7, 19, 1, 14, 6 – MEAN SCORE =CLASS 2 – 11, 10, 11, 9, 10, 9, 12, 8, 11, 9 – MEAN SCORE =CLASS 3 – 10, 10, 10, 10, 10, 10, 10, 10, 10 – MEAN SCORE =
Students should find that the mean score for each class are the same, however the standard deviation for the three groups is quite different.
Useful websitesStudents often find the standard deviation the most challenging of all the descriptive statistics. The following are some excellent websites that illustrate how it is calculated and what it means.
www.mathsisfun.com/data/standard-deviation.html
www.mathsrevision.net is an excellent resource for the more able student. It includes a video clip for those who prefer visual demonstrations.
www.mymaths.co.uk An excellent resource. Teachers can log in and create class lists by registering each student individually. The students then complete the online lesson and complete the assessment at the end. Teachers are informed of each student’s progress and whether they passed the assessment. Great as a homework exercise to consolidate learning.
The learner resource is available to show the standard deviation calculations are carried out. Students could be given some data and as a homework exercise, using the step by step guide, calculate the standard deviations accordingly.
Sect
ion
5: L
evel
s of
mea
sure
men
t
9
Levels of measurement Students are required to have an understanding of three levels of measurement: nominal, ordinal and interval data. This will also help them to know when the measures of central tendency and dispersion are most appropriate. See Page 22 of the accompanying workbook.
Sect
ion
6: G
raph
s an
d ch
arts
10
Graphs and chartsWorksheet 4 on Page 25 of the student workbook is designed to introduce students to the use and production of different graphs and charts. Each one is illustrated and examples where they can be used are given. It is important that students can draw graphs themselves and the activity should help with this. As students are required to be able to interpret data also, they could be asked to draw conclusions from each of the graphs.
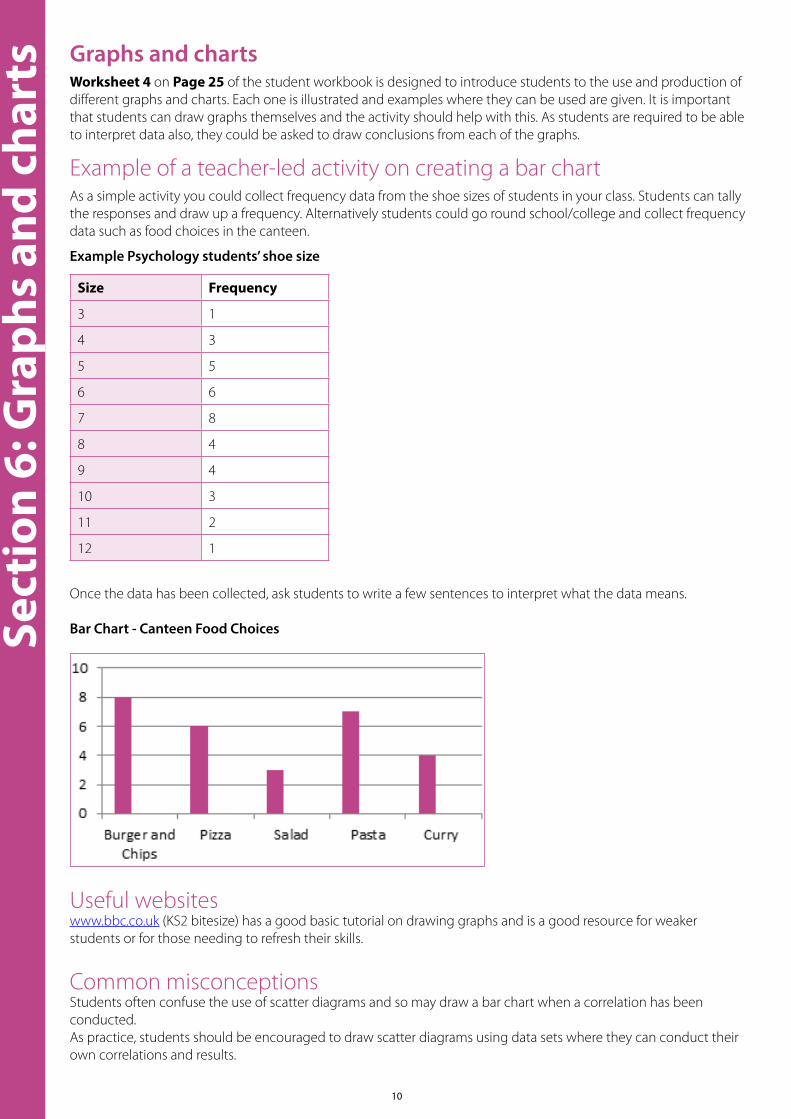
Example of a teacher-led activity on creating a bar chartAs a simple activity you could collect frequency data from the shoe sizes of students in your class. Students can tally the responses and draw up a frequency. Alternatively students could go round school/college and collect frequency data such as food choices in the canteen.
Example Psychology students’ shoe size
Size Frequency
3 1
4 3
5 5
6 6
7 8
8 4
9 4
10 3
11 2
12 1
Once the data has been collected, ask students to write a few sentences to interpret what the data means.
Bar Chart - Canteen Food Choices
Useful websites www.bbc.co.uk (KS2 bitesize) has a good basic tutorial on drawing graphs and is a good resource for weaker students or for those needing to refresh their skills.
Common misconceptionsStudents often confuse the use of scatter diagrams and so may draw a bar chart when a correlation has been conducted. As practice, students should be encouraged to draw scatter diagrams using data sets where they can conduct their own correlations and results.
Sect
ion
6: G
raph
s an
d ch
arts
11
Some ideas for potential correlations are:• Look for a relationship between age and social networking.• Look for a relationship between number of hours’ sleep and mood.• Look for a relationship between GCSE grades and AS grades.
Students often forget to give a graph a title or to fully label both axes. This should therefore be highlighted to them as an area of focus.As a consolidation exercise, the following assessment activity could be used (also in the workbook).
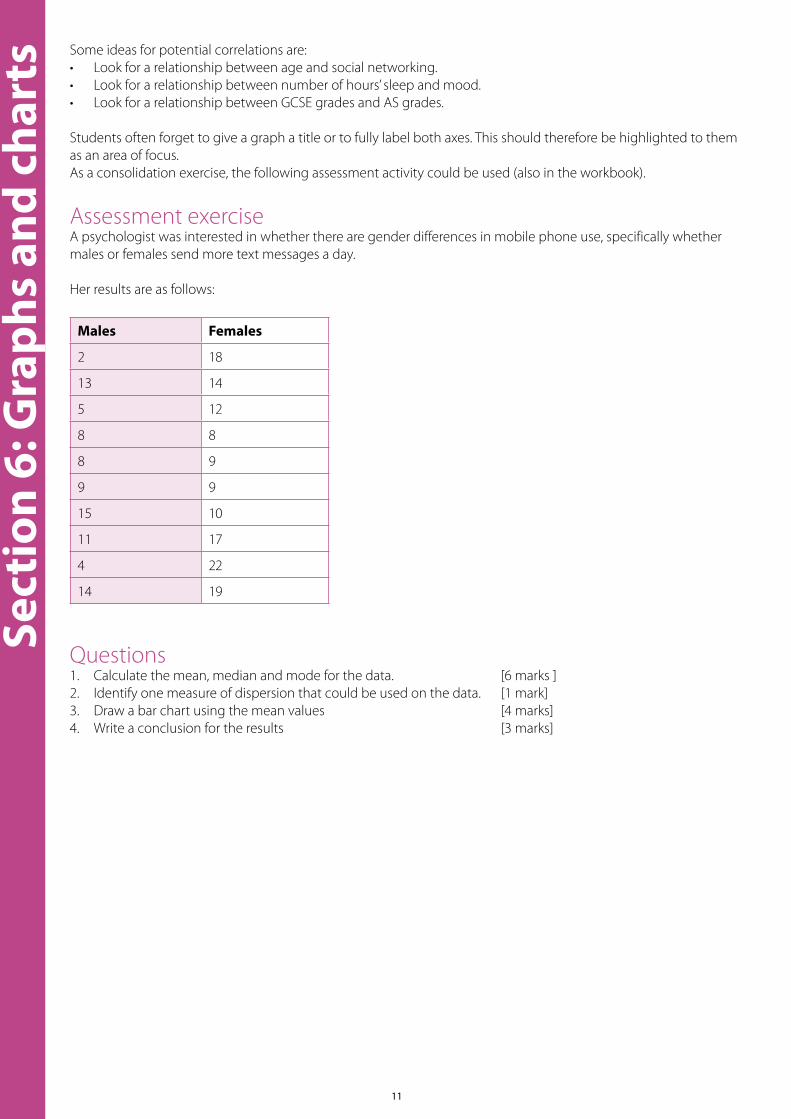
Assessment exerciseA psychologist was interested in whether there are gender differences in mobile phone use, specifically whether males or females send more text messages a day.
Her results are as follows:
Males Females
2 18
13 14
5 12
8 8
8 9
9 9
15 10
11 17
4 22
14 19
Questions1. Calculate the mean, median and mode for the data. [6 marks ]2. Identify one measure of dispersion that could be used on the data. [1 mark]3. Draw a bar chart using the mean values [4 marks]4. Write a conclusion for the results [3 marks]
Sect
ion
7: T
ypes
of D
ata
12
Types of DataThe key types of data to familiarise students with are:
• Qualitative and quantitative data
• Primary and secondary data.
Lesson GuidanceLearners are required to know how qualitative and quantitative data differ and the difference between primary and secondary data. They should be able to give examples of each to illustrate and explain the differences and evaluate them.
Ask students to work through Worksheet 5 of the workbook, which starts on Page 33
Quantitative and qualitative dataLearners could be given a topic and asked to produce a questionnaire on it. In groups, they could be divided so half collect quantitative data and half collect qualitative data (achieved by varying the use of open and closed questions). Once complete, the questionnaires could be rotated between groups in such a way that those learners who produced quantitative data complete a questionnaire using qualitative and vice versa. From completing this activity, learners should be able to identify and explain strengths and weaknesses of each data type.
NB: There is an opportunity to link to data analysis here as learners could be asked to analyse the data they have obtained (using the mean, median, mode, range etc) or to produce a visual representation of the findings.
Learner resource: learners should complete the boxes to provide them with a summary of the data. This could be completed as a plenary task, for homework or as revision.
The
smal
l pri
nt
We’d like to know your view on the resources we produce. By clicking on the ‘Like’ or ‘Dislike’ button you can help us to ensure that our resources work for you. When the email template pops up please add additional comments if you wish and then just click ‘Send’. Thank you.
Whether you already offer OCR qualifications, are new to OCR, or are considering switching from your current provider/awarding organisation, you can request more information by completing the Expression of Interest form which can be found here: www.ocr.org.uk/expression-of-interest
OCR Resources: the small printOCR’s resources are provided to support the delivery of OCR qualifications, but in no way constitute an endorsed teaching method that is required by OCR. Whilst every effort is made to ensure the accuracy of the content, OCR cannot be held responsible for any errors or omissions within these resources. We update our resources on a regular basis, so please check the OCR website to ensure you have the most up to date version.
This resource may be freely copied and distributed, as long as the OCR logo and this small print remain intact and OCR is acknowledged as the originator of this work.
OCR acknowledges the use of the following content:Square down and Square up: alexwhite/Shutterstock.com, Pie: Crepesoles/Shutterstock.com, Meerkat: Aaron Amat/Shutterstock.com, Rat: Pakhnyushchy/Shutterstock.com, Student listening to music: Ivonne Wierink/Shutterstock.com, Teacher: Robert Kneschke/Shutterstock.com, Racing car: Digital Storm/Shutterstock.com
Please get in touch if you want to discuss the accessibility of resources we offer to support delivery of our qualifications: [email protected]
OCR is part of Cambridge Assessment, a department of the University of Cambridge. For staff training purposes and as part of our quality assurance programme your call may be recorded or monitored.
© OCR 2018 Oxford Cambridge and RSA Examinations is a Company Limited by Guarantee. Registered in England. Registered office 1 Hills Road, Cambridge CB1 2EU. Registered company number 3484466. OCR is an exempt charity.
General qualificationsTelephone 01223 553998Facsimile 01223 552627Email [email protected]
www.ocr.org.uk
OCR Customer Contact Centre
Looking for a resource?There is now a quick and easy search tool to help find free resources for your qualification:
www.ocr.org.uk/i-want-to/find-resources/