Teacher Guide PSYCHOLOGY · • A week before the experimental session, participants completed a...
28
GCSE (9–1) Teacher Guide PSYCHOLOGY J203 For first teaching in 2017 Guide to Core Studies 1 Version 1 www.ocr.org.uk/psychology Qualification Accredited
Transcript of Teacher Guide PSYCHOLOGY · • A week before the experimental session, participants completed a...

GCSE (9–1)Teacher Guide
PSYCHOLOGYJ203For first teaching in 2017
Guide to Core Studies 1Version 1
www.ocr.org.uk/psychology
QualificationAccredited

We will inform centres about any changes to the specification. We will also publish changes on our website. The latest version of our specification will always be the one on our website (www.ocr.org.uk) and this may differ from printed versions.
Copyright © 2017 OCR. All rights reserved.
Copyright OCR retains the copyright on all its publications, including the specifications. However, registered centres for OCR are permitted to copy material from this specification booklet for their own internal use.
Oxford Cambridge and RSA Examinations is a Company Limited by Guarantee. Registered in England. Registered company number 3484466.
Registered office: 1 Hills Road Cambridge CB1 2EU
OCR is an exempt charity.
DISCLAIMERThis resource was designed using the most up to date information from the specification at the time it was published. Specifications are updated over time, which means there may be contradictions between the resource and the specification, therefore please use the information on the latest specification at all times. If you do notice a discrepancy please contact us on the following email address: [email protected]

3 © OCR 2016
GCSE (9–1)PSYCHOLOGY
CONTENTS
Criminal Psychology Cooper and Mackie (1986) Page 4 Video Games and Aggression in Children
Heaven (1996) Page 10 Personality and Self-Reported Delinquency: A Longitudinal Analysis
Psychological Problems Daniel, D. G., Weinberger, D. R., Jones, D. W., et al. (1991) Page 13 The effect of amphetamine on regional cerebral blood flow during cognitive activation in Schizophrenia. The Journal of Neuroscience.11(7), 1907 -1917.
Tandoc, Ferrucci and Duffy (2015) Page 16 Facebook use, envy, and depression among college students: Is facebooking depressing?
Development Piaget(1952) Page 20 An Experiment to Test the Conservation of Number
Blackwell, Trzesniewski and Dweck (2007) Page 23 Implicit Theories of intelligence Predict Achievement across Adolescent Transition: A Longitudinal Study and an Intervention

4 © OCR 2016
Criminal Psychology Cooper and Mackie
COOPER, J. and MACKIE, D. (1986) Video Games an Aggression in Children Journal of Applied Social Psychology, vol.16, no. 8, pp. 726-744.
1. Background
• Previous research had indicated that violence on television produces an increased tendency towards aggressive behaviour in children.
• Most of the research that implicates television’s role in promoting aggression had had males as participants.
• Viewing aggression heightens arousal, which in turn makes aggressive behaviour more likely. There is evidence to suggest that heavy watchers of violence display less physiological arousal in response to new violence than controls. Therefore, children who watch the least violence will be most aroused and most likely to behave aggressively. As girls have less exposure to and experience with violence, they are the group likely to be most aroused by exposure, suggesting that girls’ reactions to any violent context may be more pronounced than boys’.
• Video games have revolutionised children’s leisure time activities over recent years.
• Many people believe that playing video games is having a negative effect on children’s behaviour.
• The video games phenomenon is largely dominated by males so girls’ relative experience with video violence makes it plausible to hypothesise that any effect of violence will more pronounced in females than males.
• Television watchers are generally passive recipients of information whereas video game players participate in the action. Video games enable the effects of active engagement in and passive reception of violent context to be compared because the games allow both participation (by the player) and concurrent observation (by those watching).
2. Aim
• The aim of this study was to investigate whether computer-generated games depicting a lot of violence affected children, and, in particular whether they affected boys and girls differently.

5 © OCR 2016
Criminal Psychology Cooper and Mackie
COOPER, J. and MACKIE, D. (1986) Video Games an Aggression in Children Journal of Applied Social Psychology, vol.16, no. 8, pp. 726-744.
3. Hypothesis
• Boys and girls will perceive video games differently.
• Aggressive video games will have a greater impact on children’s behaviour than non-aggressive video games.
4. Method
(i) Research method/design• This was a laboratory experiment with an independent measures design. The independent variables (IV) were:
(a) Whether participants were placed in the high aggression, low aggression or control group. (Participants only took part in one condition). (b) Whether participants were players or observers. (Participants were either player or observer, not both).
• Observation was used to gather data in the experimental section.
• The self-report method was used to gather other data: questionnaires were used to find out about video gaming experience, perception of video games and interpersonal aggression measures.
(ii) Sample• 84 children (44 males, 40 females) from the fourth- and fifth-grades in schools in suburban Trenton, New Jersey, USA.
• For the experimental session, the children were paired randomly with the constraint that they were of the same sex and from the same grade.
• Consent was gained from the children’s parents.
(iii) Apparatus/materials• An aggressive video game – Missile Command – in which players must destroy laser beams before they in turn demolish the players’ cities.
Considerable violence is involved towards both people and inanimate objects, and lots of shooting.
• A less aggressive video games – Pac-Man – in which the player-controlled Pac-Man alternately chases and is chased by ghosts through a maze. This involves less violence towards both people and inanimate objects, and almost no shooting.
• Televisions and video players.

6 © OCR 2016
Criminal Psychology Cooper and Mackie
COOPER, J. and MACKIE, D. (1986) Video Games an Aggression in Children Journal of Applied Social Psychology, vol.16, no. 8, pp. 726-744.
4. Method
. . . continued • A pen and paper game in which participants are given magic markers and asked to solve mazes featuring characters (Star Wars and Tron)
popular, at the time, for the age group.
• Four toys: a three foot high plastic Shogun Warrior with spring-releasing fist and dart-firers (aggressive toy), Nerf Basketball set including shooting net (active toy), table-top Pop-up Pinball game (skill based game), a large set of Lincoln Logs and roofing pieces – a building set (quiet toy).
(iv) Procedure• A week before the experimental session, participants completed a questionnaire about their experience with video games.
• For the experiment: each pair of children entered the experimental room and was randomly allocated to either the high aggression (Missile Command), low aggression (Pac-Man) or control (maze-solving) condition.
• One member of the pair was then randomly chosen to play the designated game for eight minutes while the other participant observed.
• During the eight minute playing session an experimenter recorded the participant’s cumulative score on the designated game.
• Observers were told to watch the game and advise or encourage their partner if they wished to but they were not to participate in the game.
• The players were then sent to a toy room, containing the four pre-selected and coded toys, where aggressive play was measured. On arrival at the toy room, participants were told they could do anything they liked and play with any of the toys whilst waiting for a second observer to ‘work some things out’. This observer sat in a corner and covertly recorded which toys were played with, in what order and for how long.
• Meanwhile the observer participants were sent to another room where a measure of interpersonal aggression was recorded. Here the children were given a description of three behaviours (talking back, hitting someone, stealing something) and asked to choose the one they thought was the worst. They then had to imagine that another child had performed the chosen bad behaviour and asked to choose one of three possible punishments (not being allowed out of the house to play, having restricted TV, being sent to their room). Once participants had chosen a punishment they then had to press a red button to show how much of the chosen punishment they would administer to the other child for performing the bad behaviour – the longer the button was pressed, the more the punishment. The child was then asked to consider what they would do if the other child behaved badly again. They were allowed to use the same punishment or choose one of the others. The procedure with the red button was then repeated. The whole procedure was repeated once more with the participant considering what they would do if the other child behaved badly for a third time. In each of the three scenarios the amount of time the red button was held down for was recorded. A similar procedure was then carried out for ‘doing something good’ (helping someone, stopping a fight, cleaning up their room). The choice of rewards was: getting a surprise, not having to do a chore, staying up later. When all the measures had been recorded, the child was asked to rank the punishments and rewards from worst to best.

7 © OCR 2016
Criminal Psychology Cooper and Mackie
COOPER, J. and MACKIE, D. (1986) Video Games an Aggression in Children Journal of Applied Social Psychology, vol.16, no. 8, pp. 726-744.
4. Method
. . . continued • After the players had been playing in the toy room for 8 minutes they were sent for the interpersonal aggression measure, while their partners
went to the toy room.
• Then, before returning to class, all the participants completed:
(a) a manipulation check questionnaire
(b) a questionnaire about their perceptions of the games using 5-point rating scales which measured:
(i) action
(ii) violence
(iii) they also indicated how much they liked the game
(iv) (for players) how much they wanted to keep playing / (for observers) how much they had wanted to play.
5. Key Findings
Experience with video games• 34/44 boys reported having video games at home compared to 17/40 girls.
• 73/84 children (though fewer girls than boys) reported having previously played some type of video game.
• The average time spent playing video games per day was 42.57 minutes.
Perceptions of the games played• The maze game was perceived as the least violent and active, followed by Pac-Man and then Missile Command.
• Players in all three conditions perceived their game as more active than their observer partners.
• Female players of the maze game and Pac-Man thought they had played better than female players of Missile Command whilst boys were equally and more strongly confident about their performance in all three games.

8 © OCR 2016
Criminal Psychology Cooper and Mackie
COOPER, J. and MACKIE, D. (1986) Video Games an Aggression in Children Journal of Applied Social Psychology, vol.16, no. 8, pp. 726-744.
5. Key Findings
. . . continued Perceptions of how enjoyable the game was• Boys perceived the game as more enjoyable if they were playing rather than watching while girl observers enjoyed the game more than girl
players, except in the maze game.
• Female players of the maze game liked playing more than female players of either Pac-Man or Missile Command whereas boys were equally happy playing all three games.
• Female players wanted to keep playing less than female observers wanted to play, whereas boy players felt more strongly that they wanted to keep playing, especially in the Missile Command condition than boy observers wanted to play.
Effects of game on toy play• The video games, especially Missile Command, had much more effect on girls’ compared with boys’ free play: Missile Command produced
increases in girls’ aggressive play and general activity relative to the other two games, and reduced the amount of quiet and skill play they engaged in. Pac-Man tended to increase girls’ quiet play and decrease general activity.
• Apart from decreases in skill play in the two video game conditions and in overall activity in the Pac-Man condition, boys’ behaviour was hardly influenced by the video game condition.
Interpersonal aggression• Boys used the buzzer more than girls in both the ‘bad’ and ‘good’ conditions but:
(a) There were no effects for game played (b) The amount of time spent pressing the buzzer increased over trials with the greatest increase being shown by participants who had played rather than observed.

9 © OCR 2016
Criminal Psychology Cooper and Mackie
6. Conclusions
• There are measurable consequences of playing and observing video games on girls’ behaviour.
• Playing aggressive video games increases girls’ activity as well as the likelihood that they will subsequently play with aggressive toys.
• Boys are not affected by playing video games.
• Playing or observing video games does not affect boys’ or girls’ behaviour in relation to interpersonal measures of aggression.
• The effects of playing and observing video games are the same.
COOPER, J. and MACKIE, D. (1986) Video Games an Aggression in Children Journal of Applied Social Psychology, vol.16, no. 8, pp. 726-744.

10 © OCR 2016
Criminal Psychology Heaven
HEAVEN, P. C. L. (1996) Personality and Self-Reported Delinquency: A Longitudinal Analysis Journal of Child Psychology and Psychiatry, vol. 27, no. 6, pp. 747-751.
1. Background
• Research has shown a range of attitudinal and individual differences to be implicated in antisocial and delinquent behaviour (e.g. Farrington, 1992; Heaven, 1993. 1994).
• Many studies on the relationship between personality and delinquency have used the Eysenckian model which proposes that the three personality dimensions of extroversion (E), psychoticism (P) and neuroticism (N) are implicated in criminal behaviour.
• Although there is considerable evidence to support the role of these three personality dimensions in relation to criminal behaviour and delinquency, not all research findings are supportive (e.g. Farrington, 1992; Furnham and Thompson, 1991).
2. Aim
• This study was designed with one specific aim in mind:
To test the model that psychoticism, extroversion and self-esteem at Time 1 are significant predictors of self-reported delinquency two years later.
• It was decided to include self-esteem rather that neuroticism because:
(a) Furnham and Thompson (1991) and Farrington (1992) had questioned the value of N in predicting self-reported delinquency.
(b) Low self-esteem is often regarded as a facet of neuroticism and several researchers have argued that delinquent behaviour serves as compensation for youths with low and inadequate self- esteem (e.g. Rice, 1992).
3. Hypothesis
• Measures of psychoticism, extroversion and self-esteem are significant predictors over time of self-reported delinquency.

11 © OCR 2016
4. Method
(i) Research method/design• This was a longitudinal study which assessed the ability of the personality factors psychoticism, extroversion and self-esteem to predict self-
reported delinquency over a two year period.• Data was gathered using the self-report method. At the beginning of the study and two years later, participants completed a questionnaire
booklet. The data gathered was analysed through correlations.
(ii) SampleAt the beginning of the study - August 1992 (Time 1):• 282 adolescents (146 females, 136 males) attending two Catholic high schools in New South wales, Australia.• Students ages ranged from 13 to 15 years, modal age = 14 years.• The schools were situated in a large provincial centre and were classified as independent rather than private schools. School fees were modest
and so attracted students from a relatively wide socio-economic background.
After two years - June 1994 (Time 2):• The sample consisted of 123 females (an 84% follow-up rate) and 112 males (82.3% follow-up rate).• Modal age at Time 2 was 16 years.
(iii) Materials• At Times 1 and 2 students completed a test booklet which measured the following:
(a) Psychoticism and extroversion using the revised short forms of these measures (Eysenck, Eysenck and Barrett, 1985).(b) Self-esteem using a 10 item measure which assessed global self-esteem.(c) Self-reported delinquency using (i) a 6 item measure of interpersonal violence and (ii) an 8 item measure of vandalism/theft. Here
respondents used four response options from Never (scored 1) to Often (scored 4).
(iv) Procedure• All students in the respective classes were tested and although they had the option of withdrawing, none did so.• Students were tested at Time 1 and again at Time 2.• Questionnaires were completed anonymously and during class time. Numbers were printed on questionnaires to allow follow-up.• Students were assured of the confidentiality of their responses and were told that individual responses would not be available to school authorities.• Questionnaires took about 30 to 40 minutes to complete.
Criminal Psychology Heaven
HEAVEN, P. C. L. (1996) Personality and Self-Reported Delinquency: A Longitudinal Analysis Journal of Child Psychology and Psychiatry, vol. 27, no. 6, pp. 747-751.

12 © OCR 2016
5. Key Findings
• Males were more likely than females to engage in delinquency at both Time 1 and Time 2.• Psychoticism at both Time 1 and Time 2 correlated with delinquency at Time 1 and Time 2. These findings showed that psychoticism was
associated with self-reported delinquency.• Extroversion at Time 2 correlated with delinquency at Time 2.• Psychoticism, extroversion and self-esteem measured at Time 1 were used to predict delinquency at both Times 1 and 2 and coefficients
suggested that the best predictor of delinquency at both Times was psychoticism. These findings support Eysenck’s Criminal Personality Theory.• Overall, however, the measures of psychoticism, extroversion and low self-esteem explained only a modest percentage of the variance of
delinquency so their influence on delinquency over time was relatively weak.
6. Conclusions
• The findings did not show significant support for the hypothesis.
• Although the three personality factors of psychoticism, extroversion and low self-esteem may be correlated with self-reported delinquency they cannot be said to be the cause of delinquency.
• It is possible that other psycho-social and environmental variables may be determinants of whether or not some children engage in delinquent behaviour.
• It is possible that other psycho-social and environmental variables may better predict delinquency over time.
• The personality factors reviewed in this study have only limited utility as longitudinal predictors of social behaviours such as delinquency.
Criminal Psychology Heaven
HEAVEN, P. C. L. (1996) Personality and Self-Reported Delinquency: A Longitudinal Analysis Journal of Child Psychology and Psychiatry, vol. 27, no. 6, pp. 747-751.

13 © OCR 2016
Psychological Problems Daniel, Weinberger and Jones et al
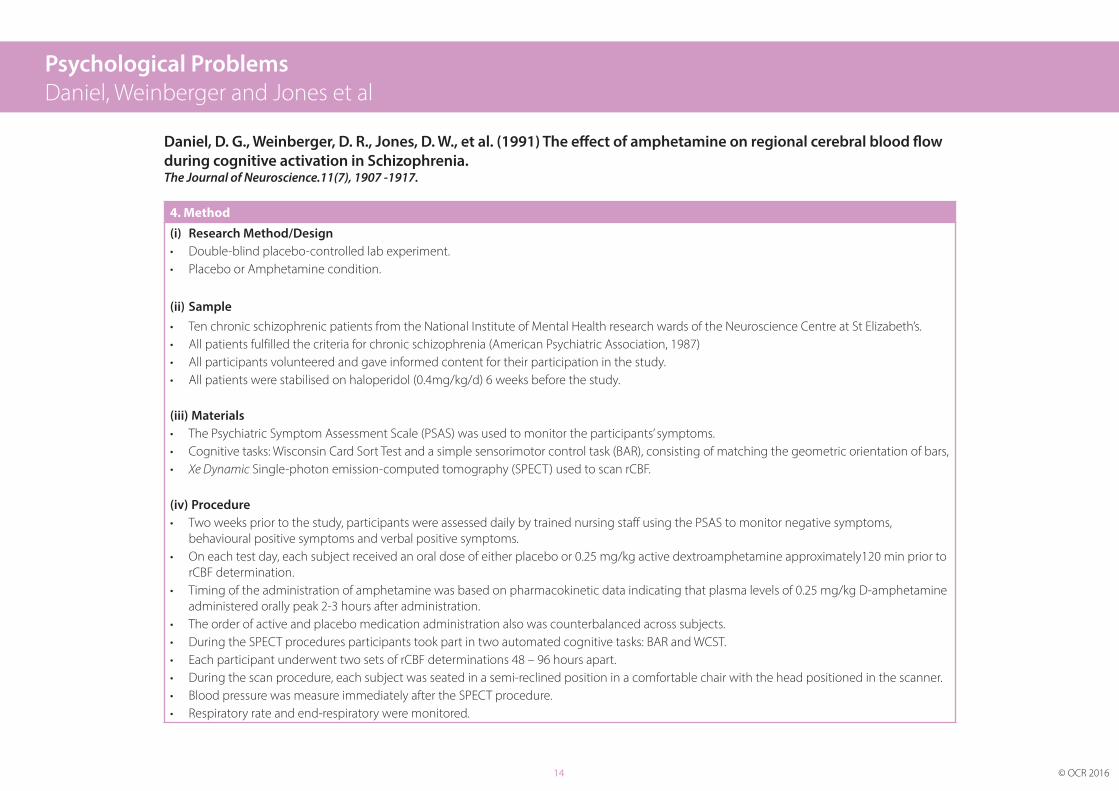
Daniel, D. G., Weinberger, D. R., Jones, D. W., et al. (1991) The effect of amphetamine on regional cerebral blood flow during cognitive activation in Schizophrenia. The Journal of Neuroscience.11(7), 1907 -1917.
1. Background
• Previous studies of regional metabolism and blood flow in patients with schizophrenia have suggested physiological hypoactivity of the prefrontal cortex (PFC).
• Weinberger et al (1986) observed a negative correlation between central dopaminergic hypoactivity and the physiological activation of PFC during the performance of the Wisonsin Card Sort Test (WCST) in Parkinson’s patients.
• Dopamine has been shown to enhance ‘signal to noise’ by supressing spontaneous neural activity and enhancing neural activity responding to specific stimulus or task.
• Centrally active dopaminergic agonist should increase dorsolateral prefrontal cortex (DLPFC) activation during performance of a prefrontal specific task in Schizophrenic patients.
2. Aim
• The aim of the study was to investigate the effects of dextroamphetamine on DLPFC and regional cerebral blood flow (rCBF) during Wisconsin Card Sort Test in Schizophrenic patients.
3. Hypothesis
• Based on previous empirical and theoretical work Daniel, Weinberger and Jones et al’s hypothesis was:
- Schizophrenic patients administered with dextroamphetamine will have an increased ratio of PFC to non-frontal blood flow during performance of the WCST, compared to patients administered with a Placebo.
14 © OCR 2016
4. Method
(i) Research Method/Design• Double-blind placebo-controlled lab experiment.• Placebo or Amphetamine condition.
(ii) Sample• Ten chronic schizophrenic patients from the National Institute of Mental Health research wards of the Neuroscience Centre at St Elizabeth’s.• All patients fulfilled the criteria for chronic schizophrenia (American Psychiatric Association, 1987)• All participants volunteered and gave informed content for their participation in the study.• All patients were stabilised on haloperidol (0.4mg/kg/d) 6 weeks before the study.
(iii) Materials• The Psychiatric Symptom Assessment Scale (PSAS) was used to monitor the participants’ symptoms.• Cognitive tasks: Wisconsin Card Sort Test and a simple sensorimotor control task (BAR), consisting of matching the geometric orientation of bars,• Xe Dynamic Single-photon emission-computed tomography (SPECT) used to scan rCBF.
(iv) Procedure• Two weeks prior to the study, participants were assessed daily by trained nursing staff using the PSAS to monitor negative symptoms,
behavioural positive symptoms and verbal positive symptoms.• On each test day, each subject received an oral dose of either placebo or 0.25 mg/kg active dextroamphetamine approximately120 min prior to
rCBF determination. • Timing of the administration of amphetamine was based on pharmacokinetic data indicating that plasma levels of 0.25 mg/kg D-amphetamine
administered orally peak 2-3 hours after administration. • The order of active and placebo medication administration also was counterbalanced across subjects. • During the SPECT procedures participants took part in two automated cognitive tasks: BAR and WCST.• Each participant underwent two sets of rCBF determinations 48 – 96 hours apart.• During the scan procedure, each subject was seated in a semi-reclined position in a comfortable chair with the head positioned in the scanner.• Blood pressure was measure immediately after the SPECT procedure.• Respiratory rate and end-respiratory were monitored.
Psychological Problems Daniel, Weinberger and Jones et al
Daniel, D. G., Weinberger, D. R., Jones, D. W., et al. (1991) The effect of amphetamine on regional cerebral blood flow during cognitive activation in Schizophrenia. The Journal of Neuroscience.11(7), 1907 -1917.

15 © OCR 2016
5. Key Findings
• The effects of amphetamine during the BAR control task and the WCST produced a modest, statistically non-significant, global reduction of flow (See Table 3 and Table 4.)
• Amphetamine levels did not significantly correlate with rCBF during the BAR task or the WCST.• Amphetamine levels did not correlate significantly with cognitive change scores on WCST.• As seen in Table 6 amphetamine had a small but significant effect on two parameters of performance on the WCST, number of correct responses, and
percent conceptual level responses.• Placebo condition: there was no significant correlation between rCBF in the DLPFC and any measure of performance.
Note: Results tables can be viewed in the original study here:http://www.jneurosci.org/content/jneuro/11/7/1907.full.pdf
6. Conclusions
• Conclusions made in this study are tentative due to the modest sample size.
• Amphetamine appeared to enhance the ability of the cortex to focus activity in response to the WSCT task.
• Amphetamine enhances task-specific activation in the DLFC (consistent with previous research).
• Amphetamine with regional and task specificity significantly increased DLPFC activation during performance of a PFC-linked cognitive task despite its globally reducing rCBF.
Psychological Problems Daniel, Weinberger and Jones et al
Daniel, D. G., Weinberger, D. R., Jones, D. W., et al. (1991) The effect of amphetamine on regional cerebral blood flow during cognitive activation in Schizophrenia. The Journal of Neuroscience.11(7), 1907 -1917.

16 © OCR 2016
Psychological Problems Tandoc, Ferrucci and Duffy
TANDOC Jr, E. C., FERRUCCI, P. AND DUFFY, M (2015) Facebook use, envy, and depression among college students: Is facebooking depressing? Computers in Human Behaviour, vol. 43, pp. 139-146.
1. Background
• For young adults, the transition to college life can be daunting. It can mean gaining unprecedented freedom, moving away from home, making new platonic and romantic relationships and managing a large amount of homework and exams. Because of these and other factors, college students have been found to be particularly prone to depression (e.g. Wright et al., 2012).
• The multiple factors likely to contribute to this increased incidence of depression include better diagnostics and attention paid by higher education health professionals to student wellbeing. However, policy makers and researchers have hypothesised that heavy use of online social networks such as Facebook and mobile technologies may contribute to the phenomenon (e.g. Soo Jeong et al., 2013).
• The link between Facebook use and depression among college students is attracting scholarly attention though there is disagreement about the nature of the relationship.
• Some studies have found associations between Facebook use and depression. For example, Wright et al. (2012) found that the number of hours students spent on Facebook was positively correlated with depression. Other studies have, however, found no link between Facebook use and depression (e.g. Jelenchick et al., 2013).
• Facebook envy:
- Envy occurs when someone else has something we want but cannot have (Smith & Kim, 2007).
- Researchers have found that one of the causes of envy can be consumption of social information on SNS such as Facebook (e.g. Burke, Marlow & Lento, 2010).
- Heavy users of SNS such as Facebook are likely to have more friends than light users and therefore have more points of comparison which might lead to Facebook envy. When college students experience Facebook envy over a long period of time they may become depressed because they develop negative life satisfaction and feelings of inferiority.
- Facebook envy is therefore used to describe the envy felt after spending time consuming others’ personal information on Facebook.
2. Aim
• The aim of this study was to contribute to the growing area of research into Facebook usage and depression by examining whether or not heavy Facebook use leads to depression among college students.
• Tandoc et al. aimed to use the framework of the social rank theory of depression to show that feelings of subordination can trigger depression. They therefore assumed that Facebook use can lead to depression when it triggers the feeling of envy among users.

17 © OCR 2016
3. Research questions and hypothesis
• Research Question 1: What is the relationship between frequency of Facebook use and depression among college students?
• Research Question 2: What specific uses of Facebook predict Facebook envy?
• Research Question 3: Does Facebook envy mediate the relationship between Facebook use and depression among college students?
From these questions Tandoc et al. tested the following hypotheses:
• H1: Heavy Facebook users tend to feel higher levels of Facebook envy than light Facebook users.
• H2: Facebook users with a big network of friends tend to feel higher levels of Facebook envy than users with a small network of friends.
• H3: Those who report feeling higher levels of Facebook envy tend to report more symptoms of depression than those who feel lower levels of Facebook envy.
4. Method
(i) Research method/design• This study used the self–report method to gather data about Facebook usage and depression. Participants completed an online survey. Survey research
‘collects information by asking people questions’ and coding their responses in numerical form ‘suitable for statistical analysis’ (Shoemaker & McCombs, 2003). The survey may also be considered a questionnaire.
(ii) Sample• 854 students from four sections of introduction to journalism courses in a large Midwestern university in the USA were invited to participate by
researchers going to their classes and sending out email invitations.• 736 students actually participated in the survey.• 68% (500) of the participants were female, 32% (235) were male.• The average age was about 19 years.• 78% (574) were White Americans.• All participants used Facebook for an average of 2 hours per day.
Psychological Problems Tandoc, Ferrucci and Duffy
TANDOC Jr, E. C., FERRUCCI, P. AND DUFFY, M (2015) Facebook use, envy, and depression among college students: Is facebooking depressing? Computers in Human Behaviour, vol. 43, pp. 139-146.

18 © OCR 2016
4. Method
... continued
(iii) Materials• An online questionnaire which asked participants about the following variables: Facebook use: Participants were asked to:
(a) Report about the average number of hours per day they used Facebook.
(b) Rate on a 5-point scale, from very frequently (5) to never (1), how often they “write a status update; post your photos; comment on a friend’s post; read the ‘newsfeed’; read a friend’s status update; view a friend’s photo; and browse a friend’s timeline.”
EnvyEight items relating to Facebook envy were generated and participants were asked to rate each item on a 5-point Likert Scale. Participants were asked to rate how much they agreed with the following statements:
(a) I generally feel inferior to others. (b) It is so frustrating to see some people always having a good time.
(c) It somehow doesn’t seem fair that some people seem to have all the fun. (d) I wish I could travel as much as some of my friends do.
(e) Many of my friends have a better life than me. (f ) Many of my friends are happier than me.
(g) My life is more fun than those of my friends. (h) Life is fair.
DepressionParticipants completed the Center for Epidemiology Studies Depression Scale (CES-D) which consists of 20 items asking questions about symptoms associated with depression.
(iv) Procedure• Participants completed and submitted the survey/questionnaire online.
Psychological Problems Tandoc, Ferrucci and Duffy
TANDOC Jr, E. C., FERRUCCI, P. AND DUFFY, M (2015) Facebook use, envy, and depression among college students: Is facebooking depressing? Computers in Human Behaviour, vol. 43, pp. 139-146.

19 © OCR 2016
5. Key Findings
• Research Question 1: No significant direct relationship was found.
• Research Question 2: After applying a scale referred to as ‘surveillance use of Facebook’ (this referred to activities where a user keeps track of other people’s post e.g. photos) and three other uses, findings showed that only surveillance use Facebook was positively associated with envy.
• Research Question 3: Findings showed that although the total effect of surveillance use of Facebook on depression was not significant, surveillance use of Facebook does exert an indirect effect of depression through Facebook envy. Further analysis showed that surveillance use of Facebook can actually lessen depression when it does not trigger feelings of envy but that surveillance use of Facebook can lead to depression when is triggers Facebook envy.
• HI: This was supported as findings showed that heavy Facebook users experienced stronger feelings of envy than light Facebook users.
• H2: This was not supported as findings showed that the size of a Facebook user’s network did not matter.
• H3: This was supported as findings showed that those who reported feeling higher levels of Facebook envy also reported more symptoms of depression than those who felt lower levels of Facebook envy.
6. Conclusions
• Facebook use on its own does not directly lead to depression.
• Facebook envy can be linked to depression symptoms.
• The effect of surveillance use of Facebook on depression is mediated by Facebook envy.
• When Facebook envy is controlled for, Facebook use can actually lessen depression.
• Social rank theory is a useful framework to understand the complex process of depression among college students.
Psychological Problems Tandoc, Ferrucci and Duffy
TANDOC Jr, E. C., FERRUCCI, P. AND DUFFY, M (2015) Facebook use, envy, and depression among college students: Is facebooking depressing? Computers in Human Behaviour, vol. 43, pp. 139-146.

20 © OCR 2016
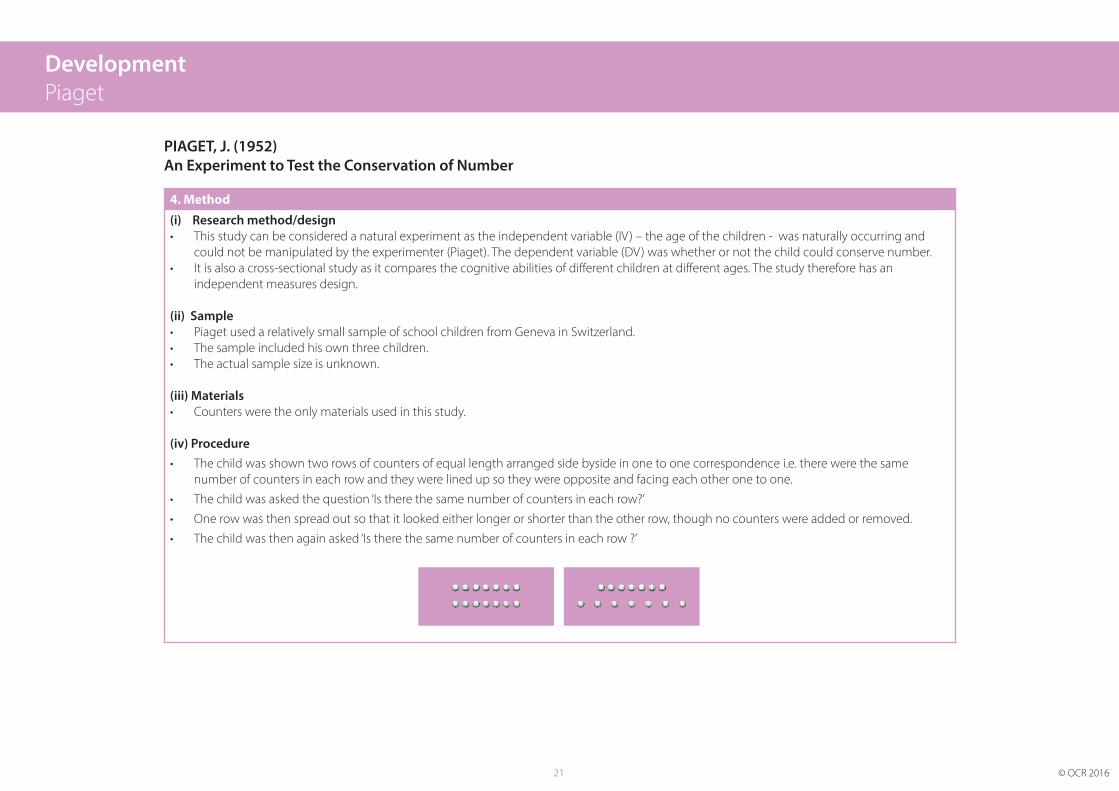
PIAGET, J. (1952) An Experiment to Test the Conservation of Number
1. Background
• Conservation is the ability to understand that certain physical characteristics of objects remain the same even if their outward appearance changes.
• Piaget’s theory of cognitive development proposes that pre-operational children under the age of 7 years are heavily influenced by the way things look and are therefore unable to conserve. However, between the ages of 7 and 11 years children pass through the concrete operational stage during which this ability develops.
• Different conservation abilities develop at different times throughout the concrete operational stage. The conservation of number seems to be the first ability to develop, followed by the ability to conserve mass and then liquid.
• Piaget was a French-speaking Swiss. He devised numerous conservation tasks, including tests for the conservation of number. These tests are reported in detail in his book ‘The Child’s Conception of Number’ which was translated from French into English in 1952.
• The study describes one of the tests devised by Piaget to test conservation f number.
2. Aim
• The aim of this study was to show that children in the concrete operational stage are more likely to be able to conserve number than children in the pre-operational stage of cognitive development.
3. Hypothesis
• Children in the concrete operational stage of cognitive development will be able to conserve number whereas children in the pre-operational stage will not.
Development Piaget
21 © OCR 2016
4. Method
(i) Research method/design• This study can be considered a natural experiment as the independent variable (IV) – the age of the children - was naturally occurring and
could not be manipulated by the experimenter (Piaget). The dependent variable (DV) was whether or not the child could conserve number.• It is also a cross-sectional study as it compares the cognitive abilities of different children at different ages. The study therefore has an
independent measures design.
(ii) Sample• Piaget used a relatively small sample of school children from Geneva in Switzerland.• The sample included his own three children.• The actual sample size is unknown.
(iii) Materials• Counters were the only materials used in this study.
(iv) Procedure• The child was shown two rows of counters of equal length arranged side byside in one to one correspondence i.e. there were the same
number of counters in each row and they were lined up so they were opposite and facing each other one to one.
• The child was asked the question ‘Is there the same number of counters in each row?’
• One row was then spread out so that it looked either longer or shorter than the other row, though no counters were added or removed.
• The child was then again asked ‘Is there the same number of counters in each row ?’
PIAGET, J. (1952) An Experiment to Test the Conservation of Number
Development Piaget

22 © OCR 2016
5. Key findings
• 3-4 year olds were typically found to state that the longer, transformed row had ‘more’.
• Although some children in the late pre-operational stage (aged 5-6) were able to correctly identify that both rows contained the same number of counters both before and after the transformation, they were rarely able to provide adequate justifications for their judgements.
• Many children in the concrete operational stage, particularly the older ones, were able to recognise that both rows contained the same number of counters, both before and after the transformation. They were also able to supply logical justifications for their judgements.
6. Conclusions
• Children in Piaget’s concrete operational stage of cognitive development (aged between 7 and 11 years) are more likely to be able to conserve number than children in the pre-operational stage (aged between 2 and 7 years).
7. Criticisms
• Asking the same question twice confused the children. As the same question was repeated by a ‘significant other’ the children thought their answer must be wrong and so changed it. They were therefore responding to demand characteristics by giving the answer they thought the experimenter wanted and so were not actually showing that they did, in fact, have the ability to conserve number. Subsequent research by both Rose and Blank and Samuel and Bryant showed that when children were only asked the question once – after the transformation – a far higher number got the right answer.
• The nature of the task was unrealistic and so lacked ecological validity. McGarrigle and Donaldson devised an experiment in which the transformation was made to appear accidental. When two rows of sweets were laid out and the child was satisfied there were the same number, a ‘naughty teddy’ appeared and whilst playing around actually messed up one of the rows. Once he was safely back in a box the children were asked if there were still the same number of sweets. The children were between 4 and 6 years old, and more than half gave the correct answer. This again suggests that Piaget’s methodology interfered with the child’s understanding of the situation producing results which suggest conservation of number develops much later than it actually does.
• There were problems with Piaget’s sample. It was a small sample, drawn from one particular culture and geographical area (Geneva, Switzerland). This means the sample may not have been representative of all children and so findings should be generalised with caution. However a study which looked at children from many countries (Australia, Netherlands, England, New Zealand, Poland, and Uganda) and tested for the ages at which conservation appears, found that the rate at which children acquired conservation varied slightly in different countries, but that the age trends for when conservation develops are similar across borders despite cultural upbringing. Another review of cross-cultural studies looking at Piagetian tasks found that while the general stages of cognitive development outlined by Piaget do occur across cultures, the rate of development is not consistent across cultures seems to be influenced by environmental factors.
Source: Billingham, M. and Groves, D.(2009) OCR GCSE Psychology. Pearson Education Limited. London. pp.114-115. ISBN: 9780435807702.
PIAGET, J. (1952) An Experiment to Test the Conservation of Number
Development Piaget

23 © OCR 2016
Development Blackwell, Trzesniewski and Dweck
BLACKWELL, L. S., TRZESNIEWSKI, K. H. and DWECK, C. S. (2007) Implicit Theories of intelligence Predict Achievement across Adolescent Transition: A Longitudinal Study and an Intervention. Child Development, vol. 78, no. 1, pp. 246-263.
1. Background
• The move (in the USA) from elementary school to junior high school (at age 12 or 13) offers many challenges and changes for young adolescents. How students manage these has major implications for their academic future.
• The application of a ‘Motivational Model of Achievement’ helps one to understand what helps or hinders student’s motivation and achievement as they negotiate the transition from elementary school to junior high school.
• In a ‘Motivational Model of Achievement’ students may hold different ‘theories’ about the nature of intelligence. Some believe intelligence to be an unchangeable fixed entity (Dweck’s fixed mindset), while others believe intelligence to be a malleable quality that can be developed (Dweck’s growth mindset).
• Previous research found that students holding an incremental (growth) mindset gained significantly higher grades in the first year of junior high school than students holding an entity (fixed) mindset (Aronson et al. 2002). Other research also found that an intervention based on possessing an incremental (growth) mindset led to significant improvement in adolescents’ achievement test scores compared with a control group who did not receive an academic intervention (Good et al. 2003).
2. Aim
• The aim of this study was to examine the relationship between theory of intelligence and achievement and to test the impact of an academic intervention on this relationship. To do this Blackwell et al. conducted two studies.
3. Hypothesis – Study 1
• There will be a relationship between adolescents’ theories of intelligence and achievement grades (in mathematics).

24 © OCR 2016
4. Method – Study 2
(i) Research method/design• Study 1 can be considered a correlational field study. The study was conducted in the natural environment of a public secondary school in New
York City. Correlations were used to assess the relationship between students’ theories of intelligence and achievement-related beliefs as they entered junior high school and then their achievement grades in mathematics as they progressed through the seventh and eighth grades.
(ii) Sample• 373 students (198 females, 175 males) in four successive seventh grade entry cohorts at a public secondary school in New York City. (The four
individual cohorts were combined for the presentation of the findings.)
• The sample varied in ethnicity, achievement and socioeconomic status.
• All participants were moderately high-achieving.
• Informed consent was obtained from all parents and students. Participation was voluntary and students could withdraw at any time without penalty.
(iii) Materials• A motivational questionnaire assessing theory of intelligence, goals, beliefs about effort, and helpless versus mastery-oriented responses to
failure. The questionnaire asked participants to apply a 6-point rating scale to assess these motivational variables (1 = Agree Strongly, 6 = Disagree Strongly).
• Mathematics achievement scores for tests taken in the spring of sixth grade (whilst still at elementary school).
• Mathematics achievement scores for tests taken at the end of both the autumn and spring terms in the seventh and eighth grades.
(iv) Procedure• The study lasted five years and followed the students as they progressed through seventh and eighth grades.
• At the beginning of the autumn term of their seventh grade, participants completed the motivational questionnaire.
• Questionnaires were administered by trained research assistants during a normal lesson, with the teacher’s permission.
• Maths lessons were taught as normal as participants progressed through grades seven and eight.
Development Blackwell, Trzesniewski and Dweck
BLACKWELL, L. S., TRZESNIEWSKI, K. H. and DWECK, C. S. (2007) Implicit Theories of intelligence Predict Achievement across Adolescent Transition: A Longitudinal Study and an Intervention. Child Development, vol. 78, no. 1, pp. 246-263.

25 © OCR 2016
5. Findings – Study 2
• Theory of intelligence and other motivational variables measured at the beginning of seventh grade did not correlate significantly with maths test scores.
• As students made the transition to junior high school, their theory of intelligence became a significant predictor of their mathematical achievement in the autumn term of seventh grade and the spring term of eighth grade.
• An incremental theory of intelligence (growth mindset) at the beginning of junior high school predicted higher maths grades at the end of the second year of junior high school (eighth grade).
• Students with growth mindsets showed greater improvements in maths test scores than students with fixed mindsets.
6. Hypothesis – Study 2
• The use of an intervention programmes informing participants that intelligence is malleable and can be developed will have a positive effect on motivation and subsequent achievement (in mathematics).
7. Method– Study 2
(i) Research method/design• Study 2 can be considered a correlational field study with an experimental section. The field situation was a different public secondary school in
New York City to the one used in Study 1.
• For the experimental section the independent variable (IV) was whether the participant was in the incremental theory intervention group or the control group which did not participate in an intervention programme. The dependent variables (DVs) were motivation levels and mathematical achievement. Correlations were used to assess the relationship between students’ theories of intelligence and achievement-related beliefs at the end of the seventh grade and achievement grades (in maths) over the course of the study.
• The experimental section of this study had an independent measures design.
Development Blackwell, Trzesniewski and Dweck
BLACKWELL, L. S., TRZESNIEWSKI, K. H. and DWECK, C. S. (2007) Implicit Theories of intelligence Predict Achievement across Adolescent Transition: A Longitudinal Study and an Intervention. Child Development, vol. 78, no. 1, pp. 246-263.

26 © OCR 2016
7. Method – Study 2
... continued(ii) Sample• 99 students (49 females, 50 males) in the seventh grade class at a different public secondary school in New York City to the one used in Study 1.
• The sample varied in ethnicity and socioeconomic status.
• All participants were relatively low-achieving.
• All 99 students took part in the questionnaire study.
• 91 of the original 99 students took part in the experimental section - 48 in the incremental theory (experimental) group and 43 in the control group.
(iii) Materials• The same motivational (Theory of Intelligence) questionnaire as used in Study 1.
• Sixth grade mathematics grades as measures of prior achievement.
• Seventh grade autumn and spring term final mathematics grades.
(iv) Procedure• Participants completed the motivational questionnaire (Theory of Intelligence) questionnaire.
• They were then told they could take part in a voluntary eight week workshop in which they would learn about the brain and be given instruction that could help them with their study skills.
• Students in both the experimental and control groups participated in similarly structured workshops.
• In addition, students in the experimental group - the motivational intervention programme - were taught through science-based readings, activities, and discussions that intelligence is malleable and can be developed. Students in the control group on the other hand had a lesson on memory and took part in discussions of academic issues of personal interest to them.
• Sixteen undergraduate assistants were trained to teach either the motivational intervention group or the control group workshops.
• At the end of the eight week period all participants were given a multiple choice quiz on the content of the workshops.
• The Theory of Intelligence questionnaire was re-administered to participants three weeks after the last workshop.
• The maths teacher was asked to indicate in writing any students who had shown changes in their motivational behaviour in the term after the workshops. They were also asked to describe these changes.
Development Blackwell, Trzesniewski and Dweck
BLACKWELL, L. S., TRZESNIEWSKI, K. H. and DWECK, C. S. (2007) Implicit Theories of intelligence Predict Achievement across Adolescent Transition: A Longitudinal Study and an Intervention. Child Development, vol. 78, no. 1, pp. 246-263.
27 © OCR 2016
8. Findings
• In the multiple-choice quiz:
(i) The groups did not differ on their scores for general workshop content i.e. on information taught to both groups.
(ii) The experimental group scored significantly higher than the control group on items that tested the incremental theory intervention content i.e. that tested the development of growth mindsets.
• In the Motivational (Theory of Intelligence) questionnaire:
(i) Participants in the experimental group changed significantly in their theory of intelligence and showed more positive mindsets after participating in the intervention workshops whereas participants in the control group did not change.
• Teacher reports indicated that more students in the experimental group than the control group showed a positive change in motivation.
• There was a significant effect of experimental condition on grade changes for mathematics across the intervention with participants in the experimental group gaining better grades in maths than those in the control group in the autumn and spring tests.
9. Conclusions
• Adolescents who hold an incremental theory of intelligence (a growth mindset) also have stronger learning goals, hold more positive beliefs about effort and make fewer ability-based ‘helpless’ attributions than those who hold an entity theory (fixed mindset).
• Possessing a growth mindset boosts achievement (in mathematics) over the junior high school transition period more than a fixed mindset.
• Teaching a malleable theory of intelligence enhances students’ motivation and achievements (in mathematics).
• A students’ theory of intelligence is a key factor in their achievement motivation.
• Focusing on the potential of students to develop their intellectual capacity provides many motivational benefits.
Development Blackwell, Trzesniewski and Dweck
BLACKWELL, L. S., TRZESNIEWSKI, K. H. and DWECK, C. S. (2007) Implicit Theories of intelligence Predict Achievement across Adolescent Transition: A Longitudinal Study and an Intervention. Child Development, vol. 78, no. 1, pp. 246-263.

The
smal
l pri
nt
We’d like to know your view on the resources we produce. By clicking on the ‘Like’ or ‘Dislike’ button you can help us to ensure that our resources work for you. When the email template pops up please add additional comments if you wish and then just click ‘Send’. Thank you.
Whether you already offer OCR qualifications, are new to OCR, or are considering switching from your current provider/awarding organisation, you can request more information by completing the Expression of Interest form which can be found here: www.ocr.org.uk/expression-of-interest
OCR Resources: the small printOCR’s resources are provided to support the teaching of OCR specifications, but in no way constitute an endorsed teaching method that is required by the Board and the decision to use them lies with the individual teacher. Whilst every effort is made to ensure the accuracy of the content, OCR cannot be held responsible for any errors or omissions within these resources. We update our resources on a regular basis, so please check the OCR website to ensure you have the most up to date version.
© OCR 2017 – This resource may be freely copied and distributed, as long as the OCR logo and this message remain intact and OCR is acknowledged as the originator of this work.
OCR acknowledges the use of the following content:Square down and Square up: alexwhite/Shutterstock.com
Please get in touch if you want to discuss the accessibility of resources we offer to support delivery of our qualifications: [email protected]
OCR is part of Cambridge Assessment, a department of the University of Cambridge. For staff training purposes and as part of our quality assurance programme your call may be recorded or monitored.
© OCR 2017 Oxford Cambridge and RSA Examinations is a Company Lim-ited by Guarantee. Registered in England. Registered office 1 Hills Road, Cambridge CB1 2EU. Registered company number 3484466. OCR is an exempt charity.
General qualificationsTelephone 01223 553998Facsimile 01223 552627Email [email protected]
www.ocr.org.uk/gcsereform
OCR Customer Contact Centre
Looking for a resource?There is now a quick and easy search tool to help find free resources for your qualification:
www.ocr.org.uk/i-want-to/find-resources/