Teacher Education Institutional
110
Baseline Study of Government Teacher Education Institutions in Bihar State Council of Education Research and Training, Bihar Teacher Education Institutional Development Index (TEIDI)
Transcript of Teacher Education Institutional

Baseline Study of Government Teacher Education
Institutions in Bihar
State Council of Education Research and Training, Bihar
Teacher Education Institutional Development Index (TEIDI)

Baseline Report TEIDI, Bihar Page 2
May 2016
© State Council of Education Research and Training, Bihar, Patna
The Report "Baseline Survey of Teacher Education Institutions in Bihar" is available on request Website www.scertbihar.co.in e-mail [email protected]
This report is prepared by SCERT with technical and expert assistance from World Bank
Table of Contents

Baseline Report TEIDI, Bihar Page 3
List of Figures ........................................................................................................................................................... 4
List of Tables ............................................................................................................................................................ 5
Abbreviations .......................................................................................................................................................... 6
Project Team ............................................................................................................................................................ 7
Preface ..................................................................................................................................................................... 8
Executive Summary.................................................................................................................................................. 9
CHAPTER 1 INTRODUCTION................................................................................................................................... 13
CHAPTER 2 STATUS OF SCERT ................................................................................................................................ 24
CHAPTER 3 STATUS OF DIET, PTEC AND BITE .......................................................................................................... 28
CHAPTER 4 STATUS OF BRCs…………………………………………………………………………………………………………………..................45
CHAPTER 5 STATUS OF CTES…………………………………………………………………………………………………………………………………..55
ANNEXURE 1 QUESTIONNAIRE FOR SCERT .............................................................................................................. 56
ANNEXURE – 2 QUESTIONNAIRE FOR DIET/PTEC/BITs ............................................................................................. 71
ANNEXURE – 3 QUESTIONNAIRE FOR BRC ............................................................................................................... 87
ANNEXURE -4 INDEX GENERATION FRAMEWORK FOR SCERT I ................................................................................ 94
ANNEXURE -5 INDEX GENERATION FRAMEWORK FOR DIs ....................................................................................... 98
ANNEXURE -6 INDEX GENERATION FOR BRC ........................................................................................................ 101
ANNEXURE -7 INFRASTRUCTURE BASELINE DIs ...................................................................................................... 103
ANNEXURE -8 EQUITY BASELINE OF DIs ................................................................................................................. 105
ANNEXCURE-9 ACADEMIC BASELINE OF DIs .......................................................................................................... 107
ANNEXURE -10 INSTITUTIONAL CAPACITY /EFFECTIVENESS BASELINE OF DIs......................................................... 109

Baseline Report TEIDI, Bihar Page 4
List of Figures
Figure 1 Development framework of TEIDI ............................................................................................. 17
Figure 2 Baseline Infrastructure of DIETs ................................................................................................ 29
Figure 3 Baseline Infrastructure PTEC ..................................................................................................... 30
Figure 4 Baseline Infrastructure Comparison between DIETs and PTECs ................................................. 30
Figure 5 Baseline principal's Room ......................................................................................................... 31
Figure 6 Baseline of Availability of Resource Rooms in DIETs / PTECs and BIETs ...................................... 32
Figure 7 Baseline Availability of support infrastructure in DIETs, PTECs and BIETs................................... 33
Figure 8 Baseline of Toilet Facilities in DIETs, PTECs and BIETs ................................................................ 33
Figure 9 Baseline Safety and Environment Friendly Provisions in DIETs, PTECs and BIETs ....................... 34
Figure 10 Baseline Teaching Aids and Equipment ................................................................................... 34
Figure 11 Baseline Comparison Between DIETs and PTECs ..................................................................... 35
Figure 12 Baseline Toilet Facilities for women & handicapped and Hostel failities .................................. 36
Figure 13 Baseline Average Number of Hours Spent Per Week ............................................................... 39
Figure 14 Baseline of Teaching Method Used Per Week (In Hours) ......................................................... 40
Figure 15 Baseline Of Institutional Capacity / Effectiveness Of DIETs, PTECs and BIETs ........................... 41
Figure 16 Baseline Institutional Capacity / Effectiveness between DIETs and PTECs ............................... 42
Figure 17 Baseline Vacancies in DIETs, PTECs and BIETs .......................................................................... 42
Figure 18 Baseline Use of Computers in DIETs, PTECs and BIETs ............................................................. 43
Figure 19 Baseline Academic Planning in DIETs, PTECs and BIETs............................................................ 43
Figure 20 Baseline Year of Audit of PTECs, DIETs and BIETs .................................................................... 44
Figure 21 Baseline Training Hall BRCs ..................................................................................................... 48
Figure 22 Baseline ICT Room in BRCs ...................................................................................................... 48
Figure 23 Baseline Office Room in BRCs ................................................................................................. 49
Figure 24 Baseline Students Participating in CPD Course ........................................................................ 50
Figure 25 Baseline BRCs Functions as Study Center ................................................................................ 51
Figure 26 Baseline Mode of interaction in BRCs ..................................................................................... 52
Figure 27 Baseline Mode of Reporting in BRCs ....................................................................................... 53
Figure 28 Baseline Type of Reports Sent to Higher Authority ................................................................ 53
Figure 29 Baseline Year of last Audit Performed in BRCs......................................................................... 54

Baseline Report TEIDI, Bihar Page 5
List of Tables
Table 1 Number of Institutions in Bihar .................................................................................................. 14
Table 2 Data Collection format summary ............................................................................................... 19
Table 3 Indicators, Sub-indicators and weightage for indexing of performance of SCERT ........................ 20
Table 4 Indicator, Sub-Indicator and their Weightage for indexing of performance of District Institutions
.............................................................................................................................................................. 21
Table 5 Indicator, Sub-Indicator and their Weightage for indexing of performance of BRCs .................... 22
Table 6 Baseline Infrastructure: SCERT ................................................................................................... 25
Table 7 Baseline Equity: SCERT ............................................................................................................... 26
Table 8 Baseline Academics: SCERT ........................................................................................................ 26
Table 9 Baseline Institutional Capacity / Effectiveness: SCERT ................................................................ 27
Table 10 Baseline Overall Development Index: SCERT ............................................................................ 27
Table 11 Baseline Infrastructure DIETs, PTECs and BIETS ........................................................................ 29
Table 12 Baseline Equity in DIETs, PTECs and BIETs ................................................................................ 35
Table 13 Baseline Enrolment Composition ............................................................................................. 36
Table 14 Baseline Academic Environment of DIETs, PTECs and BIETs ...................................................... 37
Table 15 Baseline Comparison of Academic performance Between DIET and PTEC................................. 38
Table 16 Baseline of Training Programme Conducted by DIETs, PTEs and BIETS...................................... 39
Table 17 Indicators and Weightage for Block level Teacher Education Institution ................................... 46
Table 18 Baseline of Infrastructure of Block Level Institutions (BRCs) ..................................................... 47
Table 19 Baseline Equity Index of BRC .................................................................................................... 49
Table 20 Baseline of Academic Index of BRCs ......................................................................................... 51
Table 21 Baseline of Institutional Capacity / Effectiveness ...................................................................... 52
Table 22 Baseline Overall Performance Index of BRCs ............................................................................ 55

Baseline Report TEIDI, Bihar Page 6
Abbreviations
BIET Block Institute for Education and Training
BRC Block Resource Center
BI Block Institution
CTE College for Teacher Education
CSS Centrally Sponsored Scheme
CWSN Children With Special Needs
DIs District Institutions
DIET District Institute for Education and Training
GIS Geographical Information System
GOB Government of Bihar
ICT Information and Communication Technology
IT Information Technology
NCF National Curriculum Framework
NCTE National Council for Teacher Education
NPE New Policy on Education
NCFTE National Curriculum Framework for Teacher Education
NCERT National Council for Education Research and Training
PTR Pupil Teacher Ratio
PH Physical Handicapped
PMU Project Management Unit
PTEC Primary Teacher Education College
RTE Right to Education
SCERT State Council for Education Research and Training
TEI Teacher Education Institution
TEIDI Teacher Education Institutional and Development Index

Baseline Report TEIDI, Bihar Page 7
Project Team
Survey Team
Mr. Sanjay Pandeya Project Management Unit , TEIDI
Mr Pankaj Kumar Project Management Unit , TEIDI
Ms. Kumar Bharat Bhushan Project Management Unit , TEIDI
Ms. Kumari Savita Singh Project Management Unit , TEIDI
Dr Sarika Project Management Unit , TEIDI
Data Processing Team
Mr. Sanjay Pandeya Project Management Unit , TEIDI
Mr Pankaj Kumar Project Management Unit , TEIDI
Ms. Kumar Bharat Bhushan Project Management Unit , TEIDI
Ms. Kumari Savita Singh Project Management Unit , TEIDI
Dr Sarika Project Management Unit , TEIDI
Report Writing Team
Mr. Sanjiwan Sinha Director, SCERT
Mr. Sanjay Pandeya Project Management Unit , TEIDI
Mr Pankaj Kumar Project Management Unit , TEIDI
Ms. Kumari Savita Singh Project Management Unit , TEIDI

Baseline Report TEIDI, Bihar Page 8
Preface With the enactment of Right to Education Act 2009, ensuring adequate numbers and quality of teachers became a legal obligation for the states. Several states including Bihar struggled to match the number of teachers required to maintain the PTR as laid down by RTE. In Bihar, to meet the numbers, a large number of teachers were recruited through Panchayati Raj Institutions.
Although this recruitment process has helped to get more teachers, it has also stemmed into a larger challenge of training them as majority of them lies in untrained teacher’s category.
For the past few years, the state Government has struggled to ensure the certified training of these untrained teachers. In this process, a good number of private partners have entered into the training business as well. At present only one- third of the total teachers are being trained by the government training institutions.
To improve the quality of teachers, the World Bank has come forward and agreed to support Government teacher education institutions in Bihar. This support would be provided to institutions at state and at the block level. Four areas of improvement have been identified. These are infrastructure, equity, academics and institutional capacity / effectiveness.
So, a baseline of the present scenario is necessary before implementing any program, a study has been conducted at state level (SCERT), 60, district level (DIETs, PTECs and BIETs) and 184 block level institutions (BRCs).
In this report, an effort has been made to summarize the findings of the baseline survey done. This document gives a comprehensive picture of the present state of affairs in these Government Teacher Education Institutions. It may act as a benchmark to measure improvement in these institutions over the coming years.
I express my sincere thanks to Mr. K. Senthil Kumar, I.A.S. Director DRT Bihar, Patna, Task Team Leader Ms. Shabnam Sinha from World Bank, Mr. Fabian Toegel, consultant WB and WB team of the project who efficiently guided us to complete this task. The present study could not have been completed without the active support from my colleagues in state office, SCERT, DIETs, PTECs, CTEs, BRCs and experts from PMU, World Bank project “Enhancing Teacher effectiveness in Bihar operation”. I sincerely thank all of them.
I earnestly hope that this document will be useful to policy makers, planners, researchers and all others who are embarking to improve the quality in teacher and development of the Government institutions in the Bihar state and even across the country.
SanjIwan Sinha
Director Patna State Council of Education Research and Training
May 2016

Baseline Report TEIDI, Bihar Page 9
Executive Summary
Introduction Over 60% of the total teaching staff out of about in 70 thousand elementary schools of the state remains untrained. This is one of the biggest hurdles in achieving quality in education. The quality of teacher education needs improvement and it has to be lead by the SCERT, which is the state level apex institution to regulate monitor and support teacher training institutions in Bihar. SCERT, the apex institution is supported by categories of institutions set up by government at different level- Categories of Institution These institutions are as follows;
1. District level Institutions. This Includes DIETs, PTECs and BIETs. At present there 33 District Institute for Education and Training (DIETs), 23 Primary Teacher Education College (PTECs) and 4 Block Institute for Education and Training (BIETs) in the state.
2. Block Level Institutions 184 BRCs have been developed as Block level institutions. These institutions are supporting the recurrent training and CPD programmes.
3. College for Teacher Education. There are 6 such institutions in Bihar. These Institutions
are government teacher training colleges reorganized by NCTE and affiliated by universities.
4. Open Universities. Nalanda Open University has been established under Open University
Act. Apart from this IGNOU is also operating through its study centers in the State. Colleges established in private sector. These colleges have been running as affiliated units of different universities. The combined intake of private colleges is three times more than the combined intake of institutions established in government sector.
The government has direct control over DIETs, PTECs, BIETs, CTEs and BRCs. The world Bank has agreed to support the state government institutions in improving their performance and efficiency. Four teacher education institution development indicators have been agreed on which the World Bank will support Government of Bihar. These indicators are infrastructure, equity, academics and institutional capacity / effectiveness. For each of the indicators, the sub indicators are agreed on. These sub indicators vary depending on the category and level of institution.

Baseline Report TEIDI, Bihar Page 10
Baseline Study: a pre-requisite for any development program In order to assess the present scenario, a baseline study was conducted. For this purpose, weightage for indicators and their sub-indicators were agreed and finalized. Based on the framework, 3 questionnaires were developed for the three levels of institutions namely state, district and block. Indicators and Weightage
Performance Indicators Weightage
Infrastructure 35 %
Equity 15 %
Academics 35 %
Institutional Capacity / Effectiveness 15 %
The Survey and data Analysis The data was collected on real time basis, compiled, processed and analyzed to get the performance indices of institutions operating in government sector at state, district and block level. These indices will be benchmarks to measure the improvement taking place in future. To measure the improvement overtime same indicators (questionnaires) will be administered. Baseline Index of state level institution At state level, the baseline survey is conducted in SCERT. The figure below tells us that the institution is running much below the standards on performance efficiency. A lot has to be done to improve infrastructure and equity indicators. The performance of indicators in other two areas namely academic and institutional capacity / effectiveness is average
Performance Baseline of State Level Institutions (SCERT)
Indicators Performance
Index of the
Indicator
Weightage of the
indicator in total (in
percentage)
Overall
Performance
Index of DIs
Infrastructure 0.23 35
0.34
Equity 0.12 15
Academic 0.50 35
Institutional capacity / Effectiveness 0.48 15
Baseline Report TEIDI, Bihar Page 11
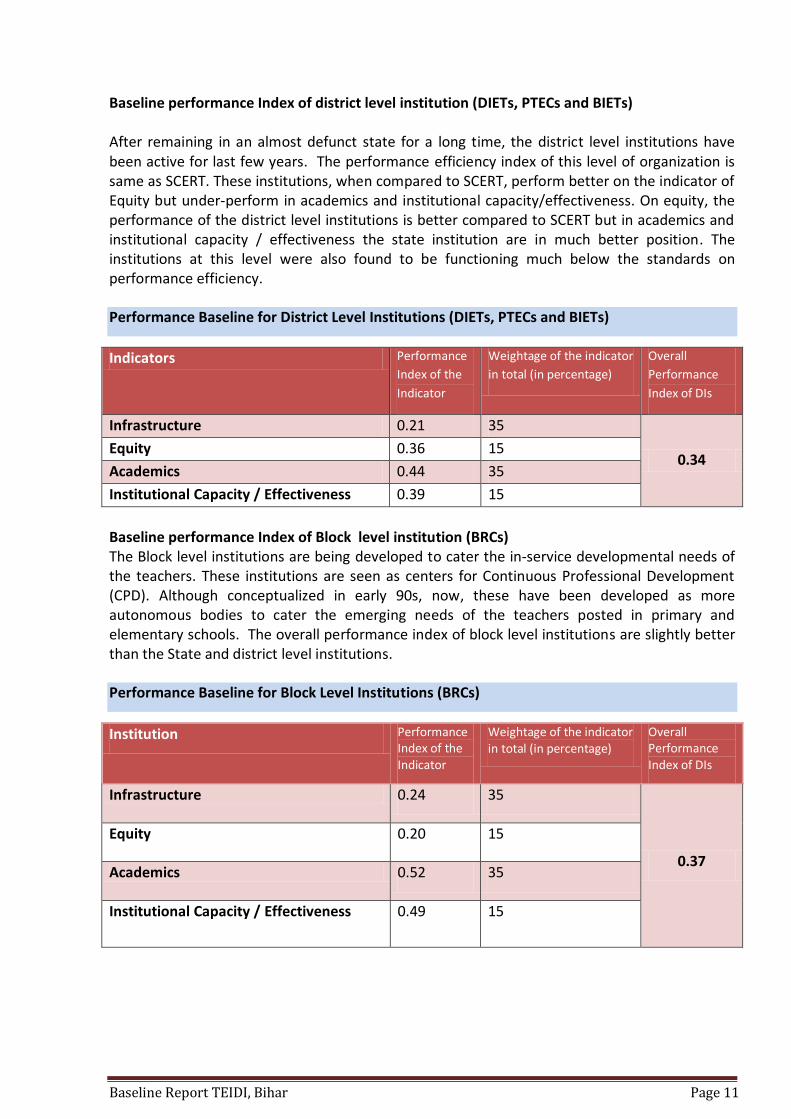
Baseline performance Index of district level institution (DIETs, PTECs and BIETs) After remaining in an almost defunct state for a long time, the district level institutions have been active for last few years. The performance efficiency index of this level of organization is same as SCERT. These institutions, when compared to SCERT, perform better on the indicator of Equity but under-perform in academics and institutional capacity/effectiveness. On equity, the performance of the district level institutions is better compared to SCERT but in academics and institutional capacity / effectiveness the state institution are in much better position. The institutions at this level were also found to be functioning much below the standards on performance efficiency. Performance Baseline for District Level Institutions (DIETs, PTECs and BIETs)
Indicators Performance
Index of the
Indicator
Weightage of the indicator
in total (in percentage)
Overall
Performance
Index of DIs
Infrastructure 0.21 35
0.34 Equity 0.36 15
Academics 0.44 35
Institutional Capacity / Effectiveness 0.39 15
Baseline performance Index of Block level institution (BRCs) The Block level institutions are being developed to cater the in-service developmental needs of the teachers. These institutions are seen as centers for Continuous Professional Development (CPD). Although conceptualized in early 90s, now, these have been developed as more autonomous bodies to cater the emerging needs of the teachers posted in primary and elementary schools. The overall performance index of block level institutions are slightly better than the State and district level institutions. Performance Baseline for Block Level Institutions (BRCs)
Institution Performance Index of the Indicator
Weightage of the indicator in total (in percentage)
Overall Performance Index of DIs
Infrastructure 0.24 35
0.37
Equity 0.20 15
Academics 0.52 35
Institutional Capacity / Effectiveness 0.49 15

Baseline Report TEIDI, Bihar Page 12
Conclusion
The baseline study suggests that much has to be done to meet the modern day
standards set for educational institutions established at different levels.
Improvements are urgently required in' infrastructure ' of the institutions.
More exposure is also required to introduce new 'teaching- learning methodologies'.
Vacant positions are required to be filled as early as possible. Efforts to assess additional
staff requirements should also be made.
A good monitoring and support system would boost the system.
Efforts are required to improve the overall efficiency which is the key to effective
performance of all individuals and institutions .

Baseline Report TEIDI, Bihar Page 13
CHAPTER 1 INTRODUCTION 1.1 Background Improving teachers’ quality and the need to enhance the relevance and quality of teacher education in India has been pronounced in the national policies of education and curriculum frameworks since 1968 (NPE, 1968; 1986/1992; NCTE regulation, 1998; NCF, 2005; NCFTE 2010). The quest for quality teachers and the need for high quality teacher education programme are gaining momentum with the implementation of Right to Education Act. The Right to Education act clearly guided states to ensure appropriate numbers of qualified teachers possessing specific qualities to impart quality education. To meet the requirements of NCF and RTE, a framework for teachers’ education aligned with the changing educational environment was also developed in 2010. In light of RTE, a large number of teachers have been recruited through a decentralized recruitment process. These teachers have been recruited through 'Panchayati Raj Institutions'. Although, the number gap was filled to a certain extent; however, through this process a large numbers of untrained teachers were recruited into the system. Their training has now become a huge challenge for the government. It has become mandatory as well under National Council of Teacher Education (NCTE) regulations. The escalating demand for trained teachers and the belief that a training certificate acts as a collateral against future employment has led to proliferation of private Teacher Education institutions. It has witnessed a rapid expansion and mushrooming of the private sector teacher education institutions with less robust and weak implementation of NCTE regulations on monitoring, the quality of such programs goes un-monitored with poor information on the competency levels of teachers graduating from these private institutions. Over the decades, the total teacher education institutions have grown manifold, most of them in the private sector with an uneven distribution across the states, districts and blocks. Bihar has been grappling with inadequate resources and in-capacity to address this task of immense magnitude. The institutions are burdened with lack of capacity, including inadequate modern facilities, technology, or computers. Bihar requires teacher education institution (TEIs) with strong service delivery mechanisms and governance to reverse years of neglect in the sub-sector. To address this situation the Government of Bihar (GoB) asked for support from the World Bank to improve the situation of teacher development at Government institutions so that the quality and quantity matches the demand for qualified and trained teachers.

Baseline Report TEIDI, Bihar Page 14
1.1.2 NCERT study An evaluative study on CSS (Centrally Sponsored Scheme) of teacher education conducted by NCERT in 2010 reveals deficit in the infrastructural, learning resources, and human resources. These deficits become an obstacle for realizing the mission and vision of these institutions. While taking cognizance of these issues, it proposes higher financial allocation to strengthen these institutions by identifying several performance indicators. They include –
Expansion and strengthening of DIETs, PTECs, BITEs & CTEs together with SCERTs serving as state nodal agencies;
Engagement of DIETs to provide both pre and in service teacher training at secondary level;
Setting up centres on curriculum and pedagogy;
Creation of a cadre of teacher educators and filling up vacancies;
Professional development of teachers, head teachers and teacher educators; etc.
Integration of technology into teacher education (i.e. ICT) and creation of synergic linkages amongst the institutions.
1.1.3 Institutions in place
SCERT is leading DIETs PTEC, CTE and BITEs in the state. The following are the number of institutions under SCERT in Bihar. Table 1 Number of Institutions in Bihar
Apart from above mentioned institutions there is large number of institutions opened in private sector. The government sector has only 25 % of the total seats approved by NCTE, rest 75 percent students are studying in private sector.
1.1.4 The Challenge
One of the persisting concerns in teacher education is enhancement of its relevance, quality and inclusion for an optimal impact; however the growth of teacher education systems and institutions, over the decades, has been resisting any changes in the process of teacher preparation. Further, the teacher education curriculum and practices are yet to incorporate and
SL Name of Institution Number of Institutions
College for Teacher Education - CTE 06
District Institute for Education and Training- DIET
33
Primary Teacher Education College – PTEC
23
Block Institute for Education and Training
4
BRC 184 (under phase-1 of the programme)

Baseline Report TEIDI, Bihar Page 15
evolve methodologies to increase community participation, use of ICT and distance education as enshrined in NCFTE 2010. The financing of teacher education institutions is a challenge in terms of poor infrastructure, deficient learning recourses and sub-optimal access and human resource inputs. Expenditure for preparing teachers, therefore, varies across the states. In this context, the challenges before teacher education reforms program are three fold:
a. One that needs to deal with quantity i.e. of producing large number of teachers required for the system;
b. One that needs to deal with quality, in which the teacher education system itself needs to reform to meet the new developments in pedagogy and training; and
c. One where the system develops a way to ensure that not only adequate numbers of teachers are produced and provided with quality education, but also provided with a mechanism to develop and grow in their career i.e. developing a teacher professional development program.
One of the ways to evolve solutions around these issues is through an effective and timely information system not only on quantitative parameters but also on qualitative and procedural parameters.
Department of Education, Government of Bihar is developing a series of tools to help improve the information system of Teacher Education Institutions like Annual Work Planning and Budget documents, GIS mapping and an Index to capture qualitative processes in the institutions and provide necessary technical and financial support to improve the overall quality of the institutions and thereby the teachers.
1.1.5 World Bank Intervention The World Bank financed program titled “Enhancing Teacher Effectiveness in Bihar Operation “aims to develop an effective teacher management system with rigorous monitoring and evaluation mechanism. The state has developed a TEIDI framework with technical assistance from the World Bank. TEIDI is a reporting format that is aimed at assessing institutional functioning for their eventual grading. Institutions are assessed based on four key parameters: (1) Infrastructure (2) Equity (3) Academic (4) Institutional Capacity/Effectiveness. The TEIDI has a quantified and weighted checklist of indicators to measure institutional performance. The TEIDI aims to inform planning for effective decision making at the state and institutional levels.
This document is a comprehensive framework to develop the Teacher Education Institutional Development Index (TEIDI). The framework is visualized as a dynamic and comprehensive approach for the planning, management and governance of teacher education institutions and diagnosing institutional strengths and weaknesses.
The framework would help in immediate and sustainable planning process. It would also help in mapping the progress of each institution through regular flow of information. Further, TEIDI would help capture micro-level information and aggregate it at the District level and Block Level. The TEIDI would help in identifying areas where resources need to be deployed and generate group specific assessments to help focus on minority groups, women and other disadvantaged sections. This framework will be usefu measure to assess coherence between different stages of planning, resource investment, implementation and the subsequent results.

Baseline Report TEIDI, Bihar Page 16
1.2 Goals and Objectives
The Goal of the Teacher Education Institutional Development Index (TEIDI) Framework is to provide a tool to identify the needs for teacher education provisioning, institutional requirements, pedagogical readiness levels, efficient service delivery mechanism, including sensitivity to the needs of the disadvantaged and minority groups, to improve the accountability of the school system and prepare good quality teachers. The Vision of the framework is to institutionalise the concept of Teacher Education as a continuum and further professionalise the teacher education programme. It strengthens the World Bank assisted project “Enhancing Teacher Effectiveness in Bihar Operation” by addressing the following needs:
Access to good quality teacher education institutions to meet the supply and demand of teachers at elementary and secondary level;
Increased provisioning of teacher education institutions for teachers from socially disadvantaged and minority groups to address the equity need of the schooling process;
Improved quality of teacher education institutions by strengthening inputs, processes, and outputs for improved performance;
Enhanced accountability in teacher education institutions through a transparent assessment strategy;
The major objectives of developing the Framework for TEIDI are to:
Map the readiness of the teacher education institutions in terms of access, location and jurisdiction to meet the demands especially in the educationally backward districts, minority dominant districts and SC/ST dominant regions;
Assess the quality infrastructural facilities, learning resources, and human resources as per the prescribed standards and specific needs;
Evaluate curricular shifts and innovative approaches of teacher education curriculum and pedagogic practices reflected in NCFTE-2010;
Develop a successful indicator system, at state, district and sub-district levels to assess the performance readiness and suggest solutions for teacher education at elementary and secondary levels;
Develop a matrix of indictors for developing the TEIDI to inform planning and implementation for effective decision-making at the District and Block levels.
1.3 Approach towards Teacher Education Institutional Development Index (TEIDI) Framework of the
study
An inclusive approach for developing a framework for TEIDI has been attempted. The objective of the TEIDI is to develop a method for estimating a comprehensive SCERT (state level), DIETs (district levels), and BRCs (sub-district or block levels) indicators that builds on the existing information and can be used to assess the efficiency of teacher education system and identify further challenges. The approach is consistent with many of the policy- governed principles underlying recent educational reforms reflected in NCF-2005, NCFTE 2010. The steps to develop the framework for TEIDI are as follows:

Baseline Report TEIDI, Bihar Page 17
Figure 1 Development framework of TEIDI
1.4 Methodology
1.4.1 Development of tools
For this survey, questionnaires were developed and tried out in Bhojpur and Vaishali district of Bihar. After tryout, questionnaires were fine tuned and used to collect information from the Teacher Education Institutions.
The teacher development framework aims to measure the preparedness of the teacher education institutions in order to produce better quality teachers. A number of indicators, namely access, equity, support to schools, pedagogy in pre-service training, methods of in-service training, ICT preparedness, governance, etc. have been clubbed into four key domains i.e. Infrastructure, Equity, Academic and Institutional capacity/Effectiveness.
1.4.2 Indicators and sub indicators of Tools Developed
The data collection format has 5 parts. First part is about basic information, second part is focused on infrastructure, third part is on equity, fourth part is all about academic information and in last part, the issues related to institutional capacities / effectiveness have been captured.
Basic Information and Physical Access
It is important to map the physical location of the institution in order to assess balanced reach between districts and even remote places. This is important from the point of view of prospective students getting constrained to join institutions due to the lack of distance or connectivity. Physical access index would measure the coverage of teacher education institutions per district and the availability of public transportations to the institutions.

Baseline Report TEIDI, Bihar Page 18
Infrastructure
Institutional infrastructure, facility, and learning resources index measures access of students to learning resources and measured against the norms prescribed by the NCTE and MHRD. Even though all other indicators are achieved and students from various backgrounds are admitted, if the teacher education institutions do not have adequate infrastructure, facility, and learning resources, students will not have access to learning.
Quality of teaching depends not only on availability of learning resources and facility but also on how frequently are the resources updated, upgraded and utilized. It, therefore, is important to keep track of the quality of infrastructure including books, labs, computers, equipment etc.
Use of ICT index measures the availability of ICT at teacher education institutions, training courses provided for trainees on various tools utilizing ICT and available online teacher education courses and digital resources for teacher education. It also captures information on how computers and IT-based learning materials are being used and their application in classroom teaching.
Equity
Equity index assesses the institutions’ capacity to admit students who are women and from marginalized groups. The indicators comprise of the share of students admitted from minority groups and who are women as well from diverse backgrounds. The student diversity is important not only from the point of view of equal participation from all communities and classes but also given the field reality where students may prefer teachers with whom they could relate to more easily. The equity index addresses this issue to ensure that teacher education institutions are providing equal opportunities to women and other marginalized groups through enabling provision of learning resources. To add to it, the share of under privileged candidates admitted to course is also a determining factor.
Financial access index would measure the provision of enabling conditions and scholarships for poor students, especially from disadvantaged sections.
Admission index would look at the selection of students in each institution and also the capacity of the institutions to admit students who have applied. The balance between openness and competitiveness has to be maintained in terms of gender composition at admission and dropout rates of female against male should be considered to maintain a balance.
Academic In addition parameters like frequency of the training programs, methodologies used in the training, need assessment and its inputs in the design of such programs are also captured. Quality of teacher educators is an important component to improve the quality of teaching. This index assesses the quality of teacher educators by developing profile of teacher educators, including their teaching experience, academic background, completion of necessary trainings and fellowship and awards received. In addition, this index assesses the availability and contribution of teacher educators in their own professional development program as well. With the recent curriculum reform at the national level, it is important to ensure that the state syllabus of teacher education is aligned with the NCFTE 2010 and national level policy reforms.

Baseline Report TEIDI, Bihar Page 19
Institutional Capacity/Effectiveness The administrative and management processes in the institution carry the same importance as the teaching practices in achieving institutional excellence. Whether it is statutory compliances or putting together governance structures, the efficient running of the institution has a direct correlation to the quality of teaching and learning. The table given below prepares the framework of data collection Format developed to collect data from the three levels of the institutions. Table 2 Data Collection format summary
Key Indicators Sub- Indicators
I. Infrastructure
1. Basic Information and Physical Access 2. Availability of utility and facility services 3. Building conditions 4. Safety and environmental friendliness 5. Availability of ICT facilities and its usage for training 6. Availability of training hall 7. Availability of alternate source of energy
II. Equity
1. Applicability of gender composition in admission. 2. Dropout rate of female against male in the sections. 3. Share of under privileged candidates admitted in courses being offered. 4. Share of students receiving scholarships. 5. Availability of utility and facilities services and physically challenged persons.
iii. Academic
1. Training and material development efficiency. 2. Research activities under taken or initiated at the level of TEIs. 3. Filled in faculty positions and their qualifications with their respective TEIs. 4. Programme initiated for the capacity development and strengthening of faculties development. 5. Capacity utilization and its trainees performance at the TEIs. 6. Mode of teacher- taught interaction and teacher taught ratio out of TEIs. 7. RPs in position against sanctioned standard.
iv. Institutional Capacity / Effectiveness.
1. Share of non teaching HR in position at TEIs. 2. Use of ICT in academic and administration at TEIs. 3. Availability of grievance redressal mechanism, existence of academic planning and review group at TEIs. 4. Budget utilization and use of ICT in its accounting. 5. Existence of website for TEIs and its updation.
1.4.3 Sample Design The target population of the survey was all teacher education institutions including all DIETs, all PTECs, 6 CTEs 4 BITEs and selected 184 BRCs from phase 1 of the programme.

Baseline Report TEIDI, Bihar Page 20
1.4.4 Data Collection
TEIDI baseline survey of 250 Teacher Education institutions was conducted in two phases, first in May 2015 and second in February 2016. 1.5 Weightage and Indexing
The index provides information on the strength and effectiveness of the organization and leadership of the institution. The index measures among other aspects the quality assurance and accountability of the institution, and existence of policy compliance mechanisms. The index further captures the extent of partnerships and networks which the institute is proactively developing to ensure non-duplication of work, best practices compilation and knowledge management.
For indexing of institutions some weightage has been given to these parameters. Under each indicator of development, there are sub indicators and weightage also assigned to these indicators and sub-indicators. Following table would give us clear-cut understanding about weightage assigned for indexing. At different level, there are differences in number of sub indicators and weightage assigned to them Table 3 Indicators, Sub-indicators and weightage for indexing of performance of SCERT
Pri
nci
pal
D
imen
sio
n
Ind
icat
ors
Ind
icat
or
Wei
ght
Dim
ensi
on
W
eigh
t
Infrastructure Condition of building 25%
35%
Availability of toilet facilities 20%
Safety and environment-friendliness 10%
ICT Facilities 10%
Availability of Computers for Training 15%
Availability of Alternate Source of Energy 20% Equity Toilet for Females 60% 15
% Toilets for Physically Handicapped 40% Academic Training/Material development 15%
35%
Research Activities 25%
Share of filled-in faculty positions 20%
Faculty qualifications 20%
Faculty development 20% Institutional
Capacity / Effectiveness
Use of computers in academic & administration 20%
15%
Grievance redressal mechanisms 10%
Budget utilization 20%
Availability of financial management staff 10%
ICT in Accounting 20%
Website of TEI and its updation 10%
Share of filled-in non-teaching Staff positions 10%

Baseline Report TEIDI, Bihar Page 21
Table 4 Indicator, Sub-Indicator and their Weightage for indexing of performance of District Institutions
Principal Dimension
Indicators Indicator Weight
Indicator Weight Totals
1 Infrastructure 1.1 Condition of buildings 25% 35%
1.2 Availability of toilet facilities 20%
1.3 Safety and environment-friendliness 10%
1.4 ICT facilities 10%
1.5 Availability of computers for training 15%
1.6 Availability of alternative source of energy 20%
2 Equity 2.1 Toilets for female 60% 15%
2.2 Toilets for Physically Handicapped 40%
3 Academic 3.1 Training/Material development 15% 35%
3.2 Research Activities 25%
3.3 Share of filled-in faculty positions 20%
3.4 Faculty qualifications 20%
3.5 Faculty development 20%
4 Institutional Capacity/
Effectiveness
4.1 Use of computers in academic and administration
20% 15%
4.2 Grievance redressal mechanisms 10%
4.3 Budget utilization 20%
4.4 Availability of financial management staff 10%
4.5 ICT in Accounting 20%
4.6 Website of TEI and its updation 10%
4.7 Share of filled-in non-teaching staff positions
10%

Baseline Report TEIDI, Bihar Page 22
Table 5 Indicator, Sub-Indicator and their Weightage for indexing of performance of BRCs
Principal Dimension Indicators Indicator
Weight
Dimension
Weight
Infrastructure
1.1 Available Training Hall 25%
35%
1.2 Toilets Facilities 25%
1.3 Safety and environment-friendliness
25%
1.4 ICT Infrastructure 25%
Equity 2.1 Gender composition 70%
15% 2.2 Toilet for Physically Challenged 30%
Academic 3.1 Academic Interaction 50%
35% 3.2 Resource Persons in Position 50%
Institutional Capacity
/Effectiveness
4.1 Use of computers in administration 40%
15% 4.2 Budget utilization 40%
4.3 Availability of financial management staff
20%
Across state, district and block level institutions, the indexing of each institution saw 35% weightage was given to the Infrastructure and Academic components each and 15% weightage was given to the equity and institutional capacity / effectiveness components. These major areas of improvement are in-turn divided into sub-areas. The sub-areas are different in different level of institutions. The data collected on the above indicators and sub-indicators were considered for the construction of the overall index, averaged across the institutions of the district-level (DIETs, PTECs, BITEs) and block level (BRCs). Administration of Tools:- The set of questionnaire were developed with the expert guidance and technical support of World Bank and used for data capturing and collection through personal visits by field investigators comprising of PMU officials.
1.6 Data Management and Analysis
Based on the above weightage, the data was collected, compiled, processed and then analysed to get the institution level wise indices on four indicators. These indices give present status or baseline of the Teacher Education Institutions. After an interval,l the same exercise with same sub-indicators and their weightage a survey will be conducted in-order to understand the direction in which these institutions are heading.

Baseline Report TEIDI, Bihar Page 23
The baseline data also highlights the areas in which more in-depth focus and thrust would be required. The index can help in assessing the efficiency of training institutions and be a source of information to identify any issues pertaining to training the prospective teachers.

Baseline Report TEIDI, Bihar Page 24
CHAPTER 2 STATUS OF SCERT
2.1 Role of SCERT
SCERT is visualized as the apex academic and academic planning institution at state level providing support to different types of institutions and also engaging in educational research and training. It is engaged in providing advice to state governments on policy issues, support to implementation and appraisal of programmes and to undertake programmes for quality improvement in school education and teacher education. Some of the envisaged roles are as follows:-
SCERT will have to play a lead academic institution role, providing support to DIETs, PTCEs, BITEs and CTEs and also engaging in educational research and training. They would also provide policy advice to state governments, support implementation and undertake programs for quality improvement in school education and teacher education.
SCERT would also function as the academic authority to lay down the curriculum and evaluation procedure to be followed by the schools in the elementary level.
SCERT would function as the nodal agency in the state for coordination and collaboration amongst Board of Textbooks, Board of Secondary Education, and Board of Elementary education etc.
SCERT in addition to the current in-service training programs would also evolve short-term and long-term teacher education programs on specific themes of specialization for secondary and senior secondary teachers, administrators and teacher educators.
SCERT would also have to offer doctoral and PG programs in education/ teacher education.
Develop and conduct training through resource persons for educational administrators, head teachers in planning and management.
Conduct training of the newly recruited teacher educators and faculty of the DIETs etc.
2.2 Areas of Improvement
Based on the TEIDI baseline, the SCERT, Department of Education and GOB may create a State level Dashboard which could have one glance information about number and types of institutions, vacancies, projected growth and gaps, school information on enrolment, as well as trained and untrained teachers. A similar compilation could be done at the district level. These compilations would be helpful in assessing the resources at each level and map them in a way to optimize for effective resource utilization in every institution. This way some targeted strategies and resources could be envisaged to improve teacher quality in those institutions or regions. The SCERT could also assess training capacities in different institutions and make provisions to rationalise seats in a way to respond to the demand of teachers and availability of prospective students. SCERT could also simultaneously plan to enhance seats in the existing institutions, and

Baseline Report TEIDI, Bihar Page 25
may explore partnerships in capacity building of State level master trainers, use of technology in communication, monitoring and evaluation or reaching the difficult areas. The SCERT may also think of ways to enrich and update state teacher education curriculum with the help of experts. 2.3 Baseline Study Baseline data of SCERT on infrastructure, equity, academics and institutional capacity / effectiveness has been collected and analysed to know the index of development of the institution. The data collection format is there as annexure 1 of this document. For Indexing, the analysis has been done on the basis of weightage assigned to different indicators (ref Table 3) 2.2.1 Baseline of Infrastructure in SCERT Infrastructure baseline was done on building condition, toilet facilities, safety and environment friendliness, ICT facilities, availability of computers and alternative energy sources. The information gathered around these indicators as given in Annexure 1. These information are then compared to the standards to arrive at infrastructure development index. Total weightage to infrastructure index on overall indexing of SCERT is 35 %, which is similar to all other TEIs surveyed. Table 6 Baseline Infrastructure: SCERT
Code Name Address Building
Condition
Toilet
Facilities
Safety and
Environment
friendliness
ICT
Facilities
Availability
of
Computers
for training
Availability
of
alternative
source of
energy
Infrastructure
Development
Index
1 SCERT 0.09 0.43 0.00 0.40 0.50 0.00 0.23
The building condition is almost 10 % of the standard requirement. The facilities like toilets, ICT and computers are fulfilling almost half of the requirements. It would require improving safety and environment friendliness outlook and need to install alternative energy plants like solar energy equipment as back-up power arrangement. The infrastructure index in 0.225 which means infrastructure wise the institution is meeting about one-fourth of the total requirement. 2.2.3 Baseline of equity in SCERT This baseline index in this dimension was done on the basis of two sub-indicators i.e. female toilets and toilets for physically handicapped. Total weightage to equity index on overall indexing of SCERT is 15% .

Baseline Report TEIDI, Bihar Page 26
Table 7 Baseline Equity: SCERT
Code Name_Address Toilets for female Toilets for PH Equity Development
Index
1 SCERT 0.20 0.00 0.12
AS per information available the toilet facility for female staff is not sufficient, it needs to improve by 5 times to meet the standard requirement. The institution does not have toilet for the physically handicapped. This facility need to be installed as early as possible. 2.2.2 Baseline Academics of SCERT
This index is related to academic environment in SCERT. The overall index on this front is 0.5. In this section, information about the training material, research activities and faculty positions, their qualifications and self development have been considered. On each of the activity, a number of information gathered. Following table gives the index of each indicator in SCERT. The weightage to academics in overall indexing of SCERT is 35 %. Table 8 Baseline Academics: SCERT
Cod
e
Name
Address
Training /
Material
Development
Research
Activities
Faculty
position
Faculty
qualification
Faculty
development
Academic
Development
Index
1 SCERT 0.46 0.59 0.16 0.85 0.41 0.50
The above analysis shows that more training materials need to be developed and research activities to be undertaken and promoted. It also shows that a large number of positions of academic staffs are vacant. The institution is working on almost 20 % of staff. The qualification of the staff is good but still it needs to take steps for faculty development. 2.3.4 Baseline of Institutional Capacity / Effectiveness of SCERT The table below shows the indices of the indicators taken into consideration for calculation of baseline of institutional capacity and effectiveness of the institution. These indicators collectively tell us how well the institution is being governed. Its weightage in overall SCERT development index is 15 % . The focus is on availability of non teaching staff, management and use of modern concepts and ICT in the administration.
Baseline Report TEIDI, Bihar Page 27
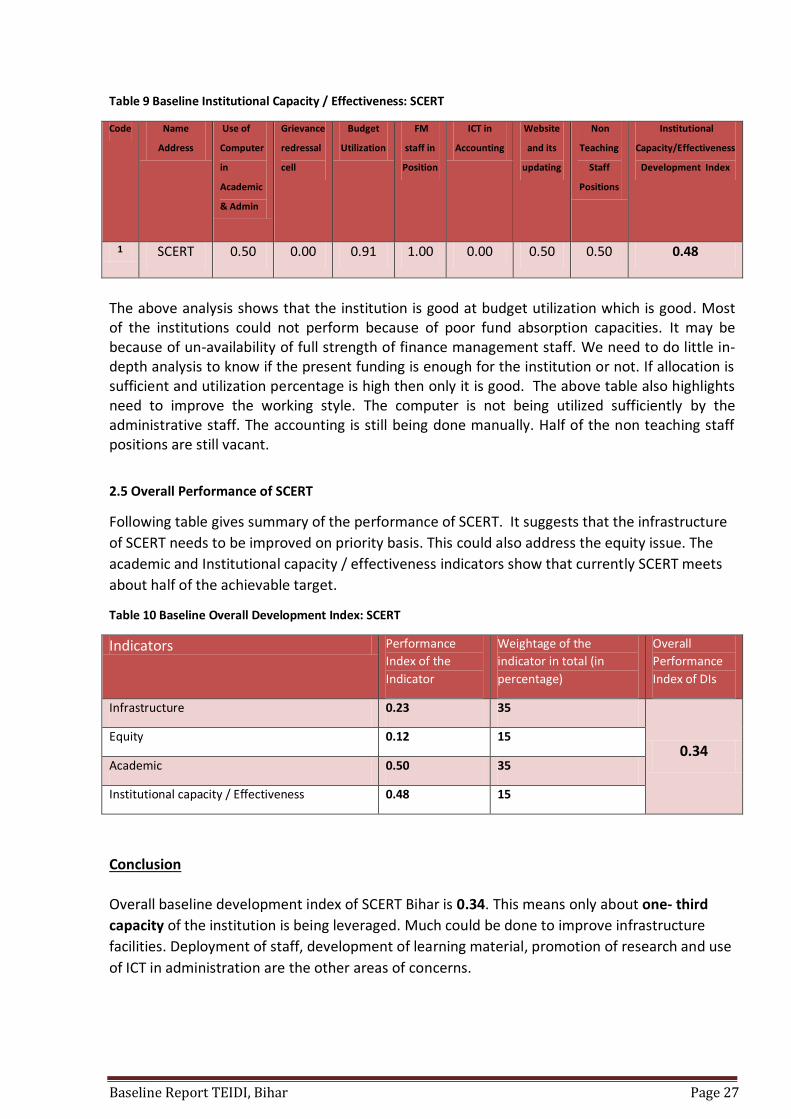
Table 9 Baseline Institutional Capacity / Effectiveness: SCERT
Code Name
Address
Use of
Computer
in
Academic
& Admin
Grievance
redressal
cell
Budget
Utilization
FM
staff in
Position
ICT in
Accounting
Website
and its
updating
Non
Teaching
Staff
Positions
Institutional
Capacity/Effectiveness
Development Index
1 SCERT 0.50 0.00 0.91 1.00 0.00 0.50 0.50 0.48
The above analysis shows that the institution is good at budget utilization which is good. Most of the institutions could not perform because of poor fund absorption capacities. It may be because of un-availability of full strength of finance management staff. We need to do little in-depth analysis to know if the present funding is enough for the institution or not. If allocation is sufficient and utilization percentage is high then only it is good. The above table also highlights need to improve the working style. The computer is not being utilized sufficiently by the administrative staff. The accounting is still being done manually. Half of the non teaching staff positions are still vacant.
2.5 Overall Performance of SCERT
Following table gives summary of the performance of SCERT. It suggests that the infrastructure
of SCERT needs to be improved on priority basis. This could also address the equity issue. The
academic and Institutional capacity / effectiveness indicators show that currently SCERT meets
about half of the achievable target.
Table 10 Baseline Overall Development Index: SCERT
Indicators Performance
Index of the
Indicator
Weightage of the
indicator in total (in
percentage)
Overall
Performance
Index of DIs
Infrastructure 0.23 35
0.34 Equity 0.12 15
Academic 0.50 35
Institutional capacity / Effectiveness 0.48 15
Conclusion
Overall baseline development index of SCERT Bihar is 0.34. This means only about one- third
capacity of the institution is being leveraged. Much could be done to improve infrastructure
facilities. Deployment of staff, development of learning material, promotion of research and use
of ICT in administration are the other areas of concerns.

Baseline Report TEIDI, Bihar Page 28
CHAPTER 3 STATUS OF DIET, PTEC AND BITE
3.1 Role of DIETs, PTECs and BITEs
DIETs are nodal institutions for improving the quality of elementary education in the district. They are mandated to transact pre-service and in-service training programs for elementary school teachers. In their current form, DIETs would benefit from being strengthened in all respects, in terms of organizational structure, physical infrastructure, academic programmes, human resources and financial support. The DIETs envisage with many-fold responsibilities and not limited to teacher training but as an institution to manage quality aspects in schools, professional development of teachers, intra-district academic coordination in the district, active academic monitoring, action research and academic planning in the district. Some of the envisaged roles of DIET as per the GOI sponsored Teacher Education Scheme are -
DIET would continue to be nodal institutions at the district level to transact pre-service and in-service training for elementary school teachers.
DIET will also be responsible for in-service training of secondary school teachers, if there is no CTE for the district or the existing CTE is not able to fulfil the requirement due to its incapacity or the large number of teachers to be trained.
DIET would also organise and support teacher professional development and leadership development programs for Head Masters, senior teachers, and School Management Committees on a continued basis.
DIET would perform Academic monitoring and supervision of schools, school improvement and school development.
Serve as an Education Resource Centre for the district in conjunction with BITEs, BRCs, CRCs.
Address district specific material development, action research programs for special groups in the District.
Develop district academic plans and monitor the teaching-learning quality in schools and its teaching-learning practices to be followed on regular basis.
Design interventions for direct support to schools and work with special groups in the district.
3.2 Baseline of DIET, PTEC and BIETs
The baseline data has been collected from all 33 DIETs, 23 PTECs and 4 BITEs. The data collection format was used to collect information with regard to infrastructure, equity, academic and institutional capacity / effectiveness from these institutions ( refer to annexure 2 of this document). For indexing of these institutions weightages were assigned to the above mentioned four indicators. For, Infrastructure and academics, each were assigned 35 % weightage. For equity and institution capacity / effectiveness, each were assigned 15 % weightage.

Baseline Report TEIDI, Bihar Page 29
Under each of the indicators, there are sub-indicators. These sub-indicators have further assigned weightage as percentage of the major indicator. The table 4 given on page 20 gives the detail of the weightage assigned to indicators and sub-indicators.
3.2.1 Baseline Infrastructure of DIETs, PTECs and BIETs
The baseline survey collected Infrastructure related information under 5 sub- indicators. These sub indicators are condition of building and other facilities, availability of toilet facilities, safety and environment friendliness, availability of ICT equipment as per BSEIDC specification and availability of electricity. Table 11 Baseline Infrastructure DIETs, PTECs and BIETS
Institutions Building
Condition
Toilet Safety ICT Electricity Infrastructure
Index
DIETs , PTECs and BIETs 0.17 0.13 0.05 0.18 0.45 0.21
Above analysis shows that the overall condition of building and toilets are shabby, requiring heavy infrastructure investments. Another area of improvement is ICT. Similar to the SCERT, these institutions also need to ensure much better safety conditions. the overall infrastructure index is 21 or about one-fifth of the achievable target. Figure 2 Baseline Infrastructure of DIETs
0.4
0
0.3
6
0.3
4
0.3
2
0.3
1
0.3
0
0.3
0
0.2
9
0.2
8
0.2
8
0.2
7
0.2
6
0.2
5
0.2
4
0.2
3
0.2
3
0.2
3
0.2
1
0.2
0
0.2
0
0.2
0
0.1
8
0.1
8
0.1
6
0.1
5
0.1
5
0.1
5
0.1
4
0.1
4
0.1
3
0.1
2
0.1
2
0.0
5
0.00
0.10
0.20
0.30
0.40
0.50
0.60
0.70
0.80
0.90
1.00

Baseline Report TEIDI, Bihar Page 30
Figure 3 Baseline Infrastructure PTEC
If we compare the infrastructure facilities between DIET and PTEC, there is a very little difference except in the case of availability and use of electricity. This may be due to the location of these institutions. The DIETs are located in comparatively prosperous pockets of economies. Figure 4 Baseline Infrastructure Comparison between DIETs and PTECs
Principal’s Room The room for the head of the institution is very essential in any organization. This is the place where almost all the managerial decisions are taken. The baseline survey reveals that only 7% of DIETs / PTEC / BIETs have adequate principals’ room.
0.3
7
0.3
6
0.3
5
0.3
4
0.3
3
0.3
3
0.3
3
0.3
2
0.3
1
0.3
1
0.2
4
0.2
2
0.1
6
0.1
4
0.1
3
0.1
3
0.1
3
0.1
2
0.1
2
0.0
9
0.0
8
0.0
6
0.0
6
0.0
6
0.0
3
0.0
2
0.0
2
0.00
0.10
0.20
0.30
0.40
0.50
0.60
0.70
0.80
0.90
1.00 P
TEC
MA
HEN
DR
U,
PA
TNA
BIT
E B
ALM
IKI
NA
GA
R,
WES
T C
HA
MP
AR
AN
BIT
E D
AR
IYA
PU
R,
EAST
CH
AM
PA
RA
N
BN
R T
rain
ing
Co
llege
,Gu
lzar
ba
gh,P
atn
a
PTE
C P
atah
i,Mu
zaff
arp
ur
PTE
C P
okh
rair
a M
uza
ffar
Pu
r
PTE
C,
BA
RH
, P
ATN
A
PTE
C M
anh
ara
Sukh
asan
Mad
hep
ura
PTE
C C
han
dw
ara
PTE
C R
AM
PU
R J
ALA
LPU
R,
SAM
AST
IPU
R
PTE
C M
asau
rhi,P
atn
a
PTE
C S
hah
pu
r
PTE
C S
her
ghat
i, G
aya
PTE
C/B
ITE
MA
DH
OP
ATT
I, D
AR
BH
AN
GA
PTE
C M
oka
ma,
Pat
na
PTE
C,B
angr
a
PTE
C B
ihiy
a
PTE
C S
hap
ur-
Pat
ori
, Sa
mas
tip
ur
PTE
C B
SHN
UP
UR
, B
EGU
SAR
AI
Mah
ila P
rim
ary
Teac
her
s Tr
ain
ing
Co
llege
, M
usa
pu
r,K
atih
ar
PTE
C P
hu
lwar
ia
PTE
C N
agar
pad
a B
hag
alp
ur
PTE
C S
orh
atth
a, V
aish
ali
PTE
C H
Kh
arag
pu
r
PTE
C S
iwan
PTE
C S
asar
am
PTE
C G
HO
GH
AR
DIH
A,
MA
DH
UB
AN
I
0.17 0.14 0.06
0.17
0.52
0.17 0.12
0.04
0.18
0.38
0.00
0.10
0.20
0.30
0.40
0.50
0.60
0.70
0.80
0.90
1.00
Building Condition Toilet Safety ICT Electricity
DIET PTEC
Baseline Report TEIDI, Bihar Page 31
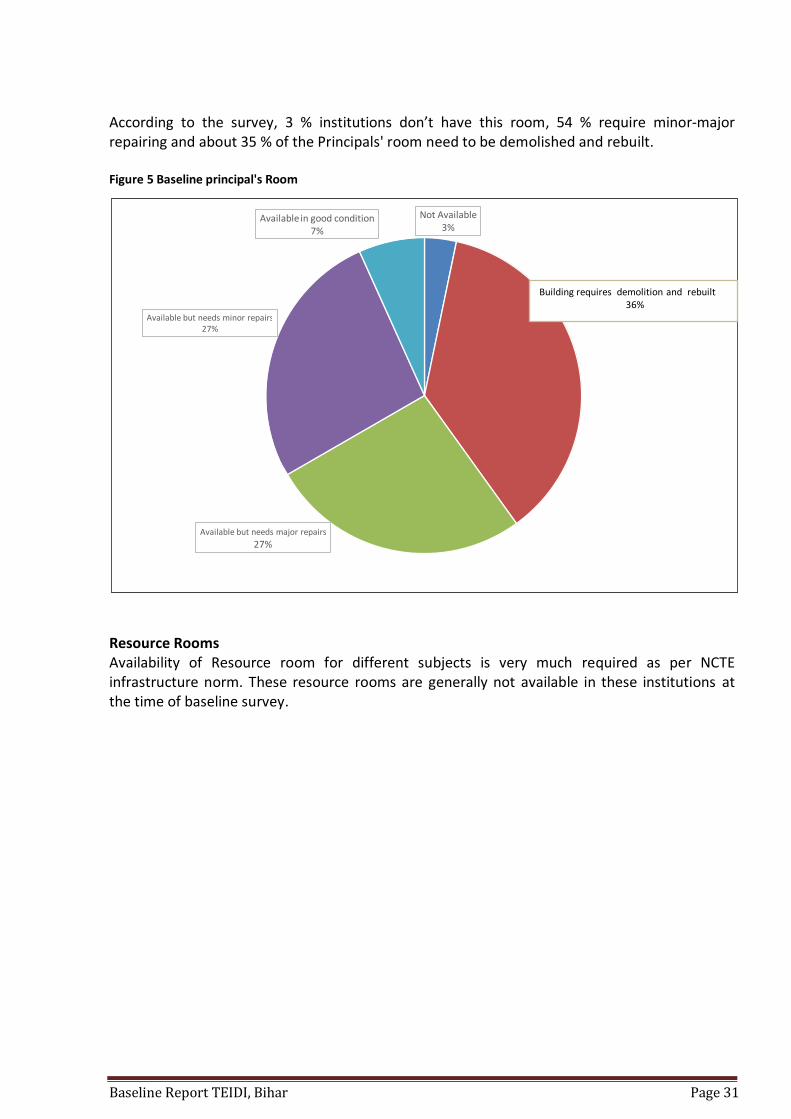
According to the survey, 3 % institutions don’t have this room, 54 % require minor-major repairing and about 35 % of the Principals' room need to be demolished and rebuilt. Figure 5 Baseline principal's Room
Resource Rooms Availability of Resource room for different subjects is very much required as per NCTE infrastructure norm. These resource rooms are generally not available in these institutions at the time of baseline survey.
Not Available 3%
Available but needs major repairs 27%
Available but needs minor repairs 27%
Available in good condition 7%
Building requires demolition and rebuilt 36%

Baseline Report TEIDI, Bihar Page 32
Figure 6 Baseline of Availability of Resource Rooms in DIETs / PTECs and BIETs
51 53 45 44
51 51 51
4 3
8 5
5 5 5 4 4
3 6
2 2 1 1 0
2 4 2 2 3 0 0 2 1 0 0 0
0
10
20
30
40
50
60
Maths Social Science ICT Science Psychology Language Art & Craft
Nu
mb
er o
f D
IETs
/PTE
Cs
and
BIE
Ts
Subjects
Not available Existing building requires demolition and rebuilding
Available but needs majo repairs Available but need minor repairs
Available in good condition

Baseline Report TEIDI, Bihar Page 33
Support Infrastructural Facilities Library, laboratories and computer rooms are backbone of educational institution of modern era. These institutions are lagging behind on this front largely.
Figure 7 Baseline Availability of support infrastructure in DIETs, PTECs and BIETs
Toilet Facilities The baseline figures reveal that 21 District level institutions neither have toilets nor urinal for men. Out of 60 DIETs/PTECs/BITEs 37 didn't have appropriate drinking water facility . All the training institutes are supposed to be residential but 40 % institutions didn't have bath facilities.
Figure 8 Baseline of Toilet Facilities in DIETs, PTECs and BIETs
42
20
33
45 54
59 56
9
17
5
7
3 0
1 3
11 12
4 0 0 0 4
7 4 2 3 0 1 2 5 6 2 0 1 2
0
10
20
30
40
50
60
Auditorium/Multi purpose Hall
Library Playground Common room Physical Edu. Room Sick Room Ramps
Nu
mb
er o
f D
IETs
, P
TEC
s an
d B
IETs
Not available Existing building requires demolition and rebuilding
Available but needs majo repairs Available but need minor repairs
Available in good condition
39 39 36
47
23
21 21 24
13
37
0
10
20
30
40
50
60
Toilets for Men Urinals for men Bath Units Wather facility at Bathrooms and
toilets
Drinking water facility
Nu
mb
er o
f D
IETs
, PTE
Cs,
Facilities Available
Yes No

Baseline Report TEIDI, Bihar Page 34
Safety and environment friendly provisions.
The overall score on safety and environment provisions was found to be lacking. Information on five aspects was collected but the result is not very encouraging. Also, it is really strange to find that these institutions do not have solid waste management system.
Figure 9 Baseline Safety and Environment Friendly Provisions in DIETs, PTECs and BIETs
Teaching Aids and Equipment
Following figure describes the availability and range of teaching aids and equipment used at this level of institutions. Most institutions were running without internet facility, without printers and without photocopy machine at the time of survey. Electricity availability was intermittent and very few institutions had invertors or generators and nor had solar panels.
Figure 10 Baseline Teaching Aids and Equipment
6 4 0
5 2
54 56 60
55 58
0
10
20
30
40
50
60
Provision for Fire safety
Provision for Electrical Safety
Solid Waste Management
Water Disposal System Barier free Infrastructure
Nu
mb
er o
f D
IETs
, PTE
Cs
and
BIE
TS
No
Yes
46 44 46 44 36
26
11 15 5
18
6 4
16
0
14 16 14 16 24
24 49 45
55
42
54 56
44
60
0
10
20
30
40
50
60
Nu
mb
er o
f D
IETs
, PTE
Cs
and
BIE
TS
Yes No

Baseline Report TEIDI, Bihar Page 35
3.2.2 Baseline Equity of DIETs, PTECs and BIETs
Equity addresses issues around gender composition and disadvantaged groups. The baseline survey tried to access the equity issues in DIETs PTECs and BIETs in terms of gender composition, number of dropouts, students getting enrolled in reservation quota and distribution of scholarships. Regarding gender composition, the percentage of enrolment of male and female student- teachers were recorded. Similarly the dropout percentages of male and female student teachers were compared. All the above information’s were then compared with population norms to get the index numbers for each of the sub indicators.
Table 12 Baseline Equity in DIETs, PTECs and BIETs
Institutions Gender
composition
Dropouts Reservation
share
Scholarship Equity
Index
DIETs, PTECs and BIETs 0.34 0.19 0.60 0.09 0.36
Despite the prevalent notion that a large number of female candidates are showing interest in teaching job but the table above depicts that the reserved seats are not filling up. There may be many reasons for this result.
It is good that dropout level is low. Comparison between DIET and PTEC In DIETs the dropout percentage was found to be higher than in PTECs. Comparatively lesser number of females have been enrolled in the DIETS than PTECs. The scholarship distribution in PTEC is poorer than in DIETs. Figure 11 Baseline Comparison Between DIETs and PTECs
0.32
0.23
0.63
0.15
0.40
0.14
0.57
0.02
0.00
0.10
0.20
0.30
0.40
0.50
0.60
0.70
0.80
0.90
1.00
Gender Composition Dropouts Reservation share Scholarship
DIET PTEC
Baseline Report TEIDI, Bihar Page 36
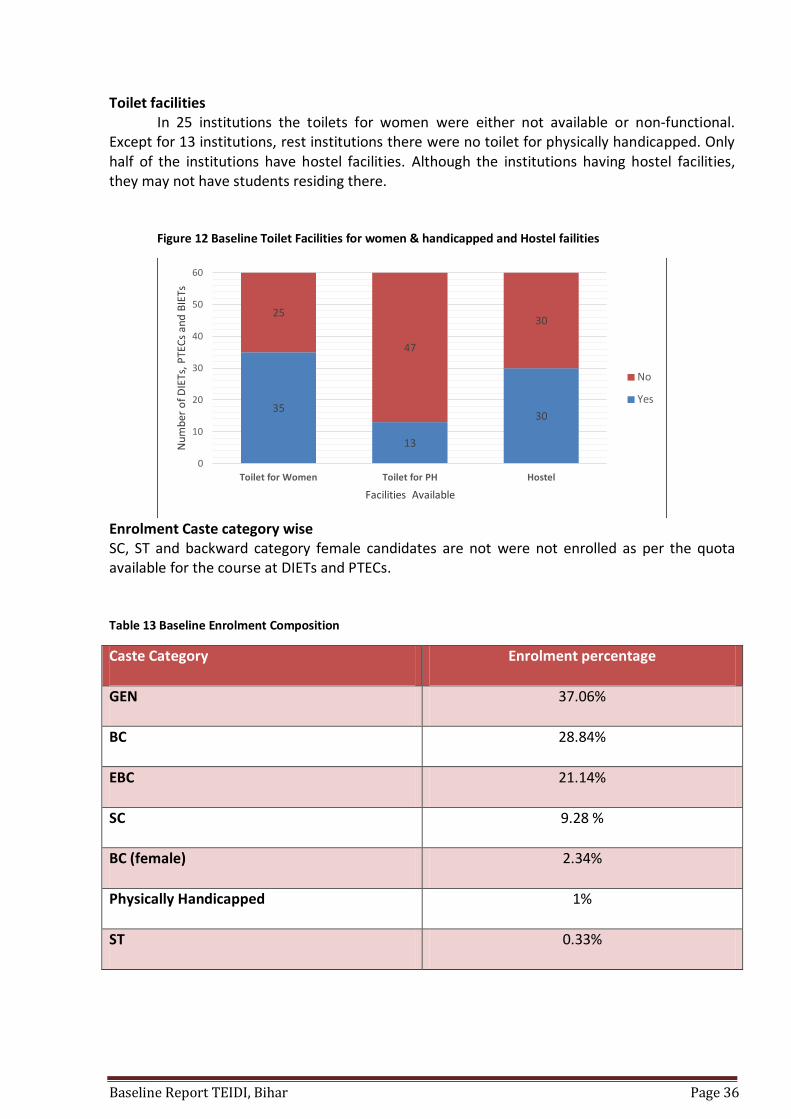
Toilet facilities In 25 institutions the toilets for women were either not available or non-functional.
Except for 13 institutions, rest institutions there were no toilet for physically handicapped. Only half of the institutions have hostel facilities. Although the institutions having hostel facilities, they may not have students residing there.
Figure 12 Baseline Toilet Facilities for women & handicapped and Hostel failities
Enrolment Caste category wise SC, ST and backward category female candidates are not were not enrolled as per the quota available for the course at DIETs and PTECs.
Table 13 Baseline Enrolment Composition
Caste Category Enrolment percentage
GEN 37.06%
BC 28.84%
EBC 21.14%
SC 9.28 %
BC (female) 2.34%
Physically Handicapped 1%
ST 0.33%
35
13
30
25
47
30
0
10
20
30
40
50
60
Toilet for Women Toilet for PH Hostel
Nu
mb
er o
f D
IETs
, P
TEC
s an
d B
IETs
Facilities Available
No
Yes

Baseline Report TEIDI, Bihar Page 37
Hostel Facilities
Total capacity of hostel for male students in the state is 400 seats but only 37 male students were residing in hostels. Out of this, 69% students belong to same district in which TEIs are located. The capacity of hostel for female is 170 seats but no-one resides in the female hostels.
Scholarship
The baseline study reveals that out of 287 male students who applied for scholarship only 41 students received the same. In case of female students, 81 students applied for and only 4 of them received it.
In baseline survey it had been revealed that the applicant for scholarships applied for it independently. The TEIs did not have any say on it, which is again surprising fact.
3.2.3 Baseline of Academic Performance in DIETs, PTECs and BIETs
Several indicators were gathered to measure the academic environment (refer to annexure 2). To measure academic performance, information was recorded around capacity utilisation, performance of trainees and faculty working in these institutions. This indicator has been assigned 35 % weightage in overall performance of DIETs, PTECs and BIETs. The performance index of this indicator for above mentioned institutions is 0.44.
Table 14 Baseline Academic Environment of DIETs, PTECs and BIETs
Institutions Capacity
utilization
Trainee
Performance
Faculty in-
position
Faculty
qualification
Faculty
development
Academic
Index
DIETs, PTECs and
BIETs 0.73 0.57 0.32 0.47 0.15 0.44
Above table provides details about the academic performance of these institutions. It suggests that the level of utilization of existing capacities is adequate whereas the faculty development has been largely ignored. Only one third of the total sanctioned faculty strength is in-position with many vacant positions. Approximately 50 % of the faculties were found to have appropriate qualification. Performance of trainees as a critical indicator of all academic indicators showed deficiencies with the trainees performance index being just half (57%) of the expected level . Comparison between DIET and PTEC On the basis of trainees performance one may infer that the DIETs are running slightly poorer than the PTECs. Generally, on infrastructure and equity parameters DIETs and PTECs are almost same but in terms of faculty development there is significant gap.

Baseline Report TEIDI, Bihar Page 38
Table 15 Baseline Comparison of Academic performance Between DIET and PTEC
Almost 90 % male and female candidates pass final exams. Among male, 32 % pass with first division marks and only 15 % of females pass with first division marks. The performance of female student-teacher were therefore significantly lower. Faculty Over 90 % of the faculty had a post graduation degree, only, 0.31 % had done an M.Phil and 9.22% had a Ph.D . All of them had on-the- job experience with; 2 % faculty having less than 2 years teaching experience, 15 % faculty having 2 to 5 years teaching experience and rest 83% having more than 5 years of teaching experience. Training Programme conducted The DIETs, PTECs and BIETs are comparatively less engaged in in-service training programmes. Following table provides details about the number of institutions which conducted in-service training programmes.
0.78
0.56
0.26
0.52
0.23
0.66 0.60
0.39 0.42
0.05
0.00
0.10
0.20
0.30
0.40
0.50
0.60
0.70
0.80
0.90
1.00
Capacity Utilisation Trainee Performance Filled Faculty Position
Faculty Development Faculty Development
DIET PTEC

Baseline Report TEIDI, Bihar Page 39
Table 16 Baseline of Training Programme Conducted by DIETs, PTEs and BIETS
SL Training Programmes Number of Institutions who conducted such programmes
Percentage of Institutions
1 In-service training programmes for teacher educations conducted at DIET/PTECs
33 55
2 Other in-service training programmes/ workshops conducted
17 28
3 For Professional development of faculty of DIET/PTEC
20 33
4 On the spot support provided to BRCs, CRCs and school
24 40
Engagement of Principal and Faculty Per week hour engagement analysis shows that at the time of survey, more than half of the time of the principal was spent on administrative work. Furthermore, the faculty was also engaged in administrative work with about 15 % of their time spent on it. This situation might be because of the fact that there may be less number of administrative staffs positioned in these institutions Both, Principal and faculty, were found to spend more time with pre-service diploma students. Overall 15 % of the week’s engagement was for the ODL programme. The faculty reported that the ODL programme generally runs on Saturdays and Sundays. Figure 13 Baseline Average Number of Hours Spent Per Week
11
21 2
6
2
2
3
5
22
6
0
5
10
15
20
25
30
35
40
Principal Faculty
Nu
mb
er o
f h
ou
rs p
er w
eek
Teaching in Pre-service Diploma course Teaching in ODL programme
Teaching in in-service training courses Taking part in continuous support to schools adopted
Attending to administrative work
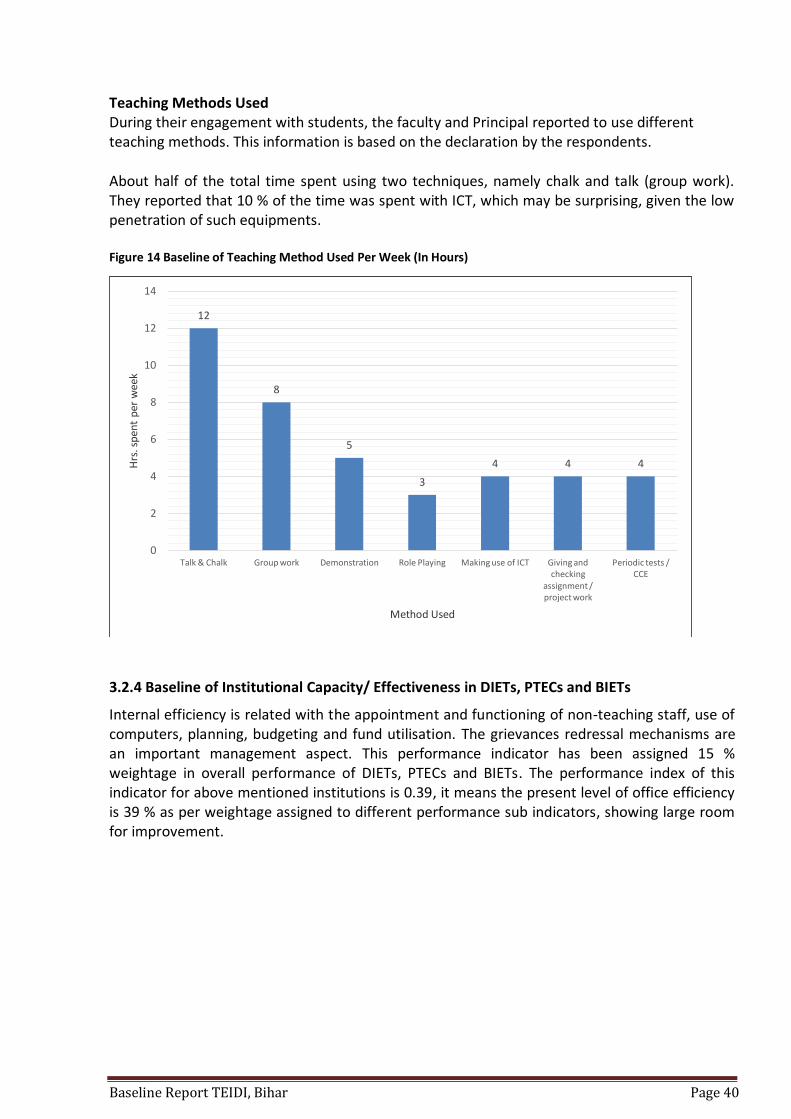
Baseline Report TEIDI, Bihar Page 40
Teaching Methods Used During their engagement with students, the faculty and Principal reported to use different teaching methods. This information is based on the declaration by the respondents. About half of the total time spent using two techniques, namely chalk and talk (group work). They reported that 10 % of the time was spent with ICT, which may be surprising, given the low penetration of such equipments. Figure 14 Baseline of Teaching Method Used Per Week (In Hours)
3.2.4 Baseline of Institutional Capacity/ Effectiveness in DIETs, PTECs and BIETs
Internal efficiency is related with the appointment and functioning of non-teaching staff, use of computers, planning, budgeting and fund utilisation. The grievances redressal mechanisms are an important management aspect. This performance indicator has been assigned 15 % weightage in overall performance of DIETs, PTECs and BIETs. The performance index of this indicator for above mentioned institutions is 0.39, it means the present level of office efficiency is 39 % as per weightage assigned to different performance sub indicators, showing large room for improvement.
12
8
5
3
4 4 4
0
2
4
6
8
10
12
14
Talk & Chalk Group work Demonstration Role Playing Making use of ICT Giving and checking
assignment / project work
Periodic tests / CCE
Hrs
. sp
ent
per
wee
k
Method Used
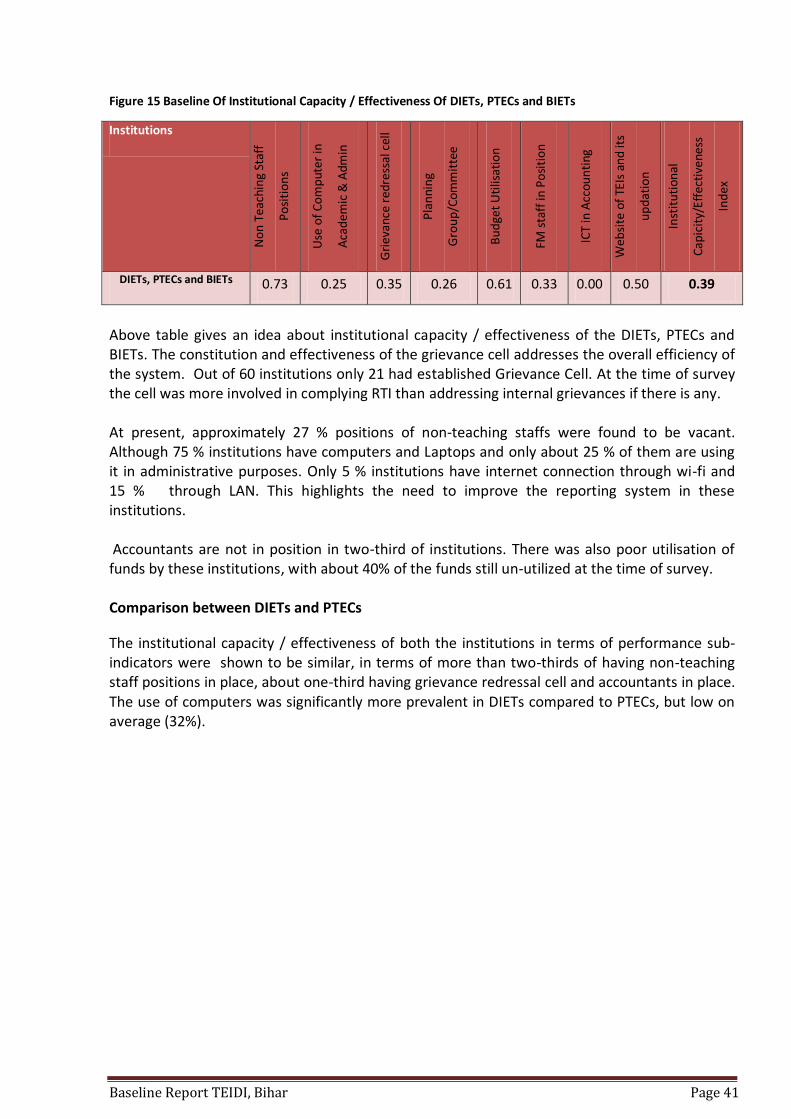
Baseline Report TEIDI, Bihar Page 41
Figure 15 Baseline Of Institutional Capacity / Effectiveness Of DIETs, PTECs and BIETs
Institutions
No
n T
each
ing
Staf
f
Po
siti
on
s
Use
of
Co
mp
uter
in
Aca
dem
ic &
Adm
in
Gri
evan
ce r
edre
ssal
cel
l
Pla
nni
ng
Gro
up
/Com
mit
tee
Bu
dge
t U
tilis
atio
n
FM s
taff
in P
osi
tio
n
ICT
in A
ccou
nti
ng
Web
site
of
TEIs
an
d it
s
up
dat
ion
Inst
itu
tion
al
Cap
icit
y/Ef
fect
iven
ess
Ind
ex
DIETs, PTECs and BIETs 0.73 0.25 0.35 0.26 0.61 0.33 0.00 0.50 0.39
Above table gives an idea about institutional capacity / effectiveness of the DIETs, PTECs and BIETs. The constitution and effectiveness of the grievance cell addresses the overall efficiency of the system. Out of 60 institutions only 21 had established Grievance Cell. At the time of survey the cell was more involved in complying RTI than addressing internal grievances if there is any. At present, approximately 27 % positions of non-teaching staffs were found to be vacant. Although 75 % institutions have computers and Laptops and only about 25 % of them are using it in administrative purposes. Only 5 % institutions have internet connection through wi-fi and 15 % through LAN. This highlights the need to improve the reporting system in these institutions. Accountants are not in position in two-third of institutions. There was also poor utilisation of funds by these institutions, with about 40% of the funds still un-utilized at the time of survey. Comparison between DIETs and PTECs
The institutional capacity / effectiveness of both the institutions in terms of performance sub-indicators were shown to be similar, in terms of more than two-thirds of having non-teaching staff positions in place, about one-third having grievance redressal cell and accountants in place. The use of computers was significantly more prevalent in DIETs compared to PTECs, but low on average (32%).

Baseline Report TEIDI, Bihar Page 42
Figure 16 Baseline Institutional Capacity / Effectiveness between DIETs and PTECs
Vacancies Up to two-third of the administrative staff, technical staff and class IV staff were found to be vacant at the time of survey. The proportion of vacancies for office assistants and data entry operators was even higher. The below figure showcase the positions that were filled at the time of survey. Figure 17 Baseline Vacancies in DIETs, PTECs and BIETs
0.77
0.32 0.36
0.25
0.60
0.33
0.68
0.17
0.33 0.26
0.63
0.33
0.00
0.10
0.20
0.30
0.40
0.50
0.60
0.70
0.80
0.90
1.00
Non Teaching Staff Positions
Use of Computer Grievance redressal Cell
Planning Budget Utilisation
FM staff in Position
DIET PTEC
36%
14%
33% 33%
17%
0%
10%
20%
30%
40%
50%
60%
70%
80%
90%
100%
Administrative staff
Office Assistant Technical Staff Class IV staff Others (Data Entry Operator)
% o
f TD
Is

Baseline Report TEIDI, Bihar Page 43
Use of Computers Computers were being largely used for reporting purposes; however, none of the institutions had computerized their admission process or accounting work. Only 14 institutions maintained students’ evaluation records in computers. Figure 18 Baseline Use of Computers in DIETs, PTECs and BIETs
Grievance Cell
Out of 60 TEIs, only 21 TEIs had grievance redressal cells which on an average took 30 days to
reply RTI requests. 53 TEIs reported that meeting of faculty/students were held to discuss the
issue related to complaints/feedback of faculty members, trainees or teachers. 29 TEIs reported
that complaints were generally forwarded to higher authorities for appropriate action.
Academic Planning
Figure 19 Baseline Academic Planning in DIETs, PTECs and BIETs
Only 21 (out of 60) TEIs have Academic Planning and Review Group or Committee, which on average held 6 to 12 meetings of Academic Planning and Review Group or Committee is held per year and every committee has 6 members comprises of head of the institution, faculty and student teacher.
32 29
14
0 0 0
5
10
15
20
25
30
35
40
Communication with SCERT & other
institutions by e-mail
Reporting to higher authorities done by
sending e-mail
Record of evaluation of
students maintained on
computer
Admission procedure
computerised
Computerised accounts
Nu
mb
er o
f D
IETs
, PTE
Cs
and
BIE
Ts
Yes, 35%
No, 65%
Yes No

Baseline Report TEIDI, Bihar Page 44
Financial Management Both, state and central government fund these TEIs with state Govt. funding for Program & activities, annual function, faculty training and Salary and central Govt. funds are for faculties training, Seminar and workshops and special programmes for disadvantaged group.
None of the TEIs has provided information related to budget and expenditure of construction work Only 2 TEIs (out of 60) have provided budget information related to Furniture & Equipment.
Out of total 60 District level institutions only 44 District Institutions (DIs) could provide information related to budget of teaching and non-teaching staff salaries. Only 9 TEIs have given information related to budget of Scholar Funds. 12 TEIs provided information related to budget of other items.
Out of 60 DIs 20 do not have dedicated staff for Financial Management. 5 TEIs have not provided information related to year of Audit. Book of Accounts is maintained by all TEIs. In all 60 TEIs, accounting is done manually, due to unavailability of accounting software and lack of ICT enabled mechanism. Audit is performed by Accountant General Office, Finance Department, Govt. of Bihar. Figure given in next page gives an idea about the audit status of the TEIs. Figure 20 Baseline Year of Audit of PTECs, DIETs and BIETs
About 41 institutions have got their audit done before 2010. Only 14 DIs have got their Audit done in last 5 years prior to the survey. It is strange to note from above figure that 5 DIs are not aware about their audit status.
1
4
1
9
5
6
1 1 1
2 2
3
5
4
1
5
4
5
0
1
2
3
4
5
6
7
8
9
10
Nu
mb
er o
f TD
Is
Number of TDIs with Year of Audit

Baseline Report TEIDI, Bihar Page 45
3.2.5 Overall Performance of DIs (DIETs, PTECs and BIETs) The overall performance of the District level institutions is shown below;
Indicators Performance
Index of the
Indicator
Weightage of the indicator
in total (in percentage)
Overall
Performance
Index of DIs
Infrastructure 0.21 35
0.34 Equity 0.36 15
Academics 0.44 35
Institutional Capacity / Effectiveness 0.39 15
Although indicator wise performance indices are different for SCERT and DIs but the overall performance indices for state and district level teacher training institutions are same. The overall performance indicators of the DIs suggest that these institutions are working at 34 % of their capacities.

Baseline Report TEIDI, Bihar Page 46
CHAPTER 4 STATUS OF BRCs
4.1 Role of BRC in Teacher Education
BRCs or the Block Recourse Centres are entrusted with imparting in-service training with the help of qualified BRPs (Block Resource Persons) with their (allied) specific subject expertise. BRPs are trained by SCERT. BRPs discuss learning outcomes, difficult concepts / hard spots in teaching, teaching-learning methodologies and also suggest remedial measures. 4.2 Baseline Survey and Weightage Baseline survey of 184 BRCs of phase 1 of the programme was conducted during the same period using the questionnaire in annexure 3 of this document. As with the SCERT and district level institutions, the four indicators were to measure overall performance of block level institutions are the same but the sub-indicators differ based on the role of BRC play The indicators, sub indicators and their corresponding weightage have been mentioned in the table given below;
Table 17 Indicators and Weightage for Block level Teacher Education Institution
Indicator and Weightage Sub Indicators Weightage
Infrastructure / Access (35%)
Available Training Hall 25%
Toilet facilities 25%
Safety and environment-friendliness 25%
ICT infrastructure 25%
Equity (15 %)
Percentage of Female participation in CPD & Certification
70%
Toilet facilities for physically challenged 30%
Academic (35 %) Academic Interaction 50%
RPs in position 50%
Institutional Capacity /Effectiveness (15%)
Use of computers in academic & administration
40%
Budget utilization 40%
Availability of financial management staff 20%
4.2.1 Baseline of Infrastructure of BRC

Baseline Report TEIDI, Bihar Page 47
The BRCs were established, constructed and furnished under DPEP-III and SSA programme. These BRCs have training hall, dormitories for ladies and gents, separate toilets for male and female, library, kitchen and two office rooms. This infrastructure was originally conceptualized as teachers' resource centers at Block level with main functions to conduct training of teachers. Later these institutions were equipped with computers and are developed as Block Information Centers. This facility helped education department in preparing all types of reporting and documentation. Later a space in this BRC is used to support children with special needs (CWSN) children and one room was developed as Resource room. Previously this infrastructure was also used as focal point for distribution of books and other learning materials also. Table 18 Baseline of Infrastructure of Block Level Institutions (BRCs)
Institution Available
Training Hall
Toilet
facilities
Safety and
environment
friendliness
ICT
infrastructure
Performance
Index
Infrastructure 0.25 0.56 0.04 0.10 0.24
All BRCs are equipped with a training hall and toilet facilities but the baseline reveals that only 25 % surveyed BRCs had a training hall and only 56 % had functional toilet facilities. The Safety and environment friendliness aspect was shown to be low. Despite all the BRCs have been provided with desktop computers when the Block Information Centers were established; aspects like poor maintenance and lack of ability to use or obsolete technology, the ICT infrastructure score is poor. Training Hall
Training hall is the most important space required for any teacher training to take place. Although training halls exist, training halls were found to be in good conditions in 20 % of the cases, half of them require minor repairing and 22 % of it need major repairing work.

Baseline Report TEIDI, Bihar Page 48
Figure 21 Baseline Training Hall BRCs
ICT Room
Only 14% are in good condition, in 39% of institutions it was not available and 46% required repairing. Figure 22 Baseline ICT Room in BRCs
10%
2%
22%
51%
20%
0
10
20
30
40
50
60
70
80
90
100
Not Available Existing building requires demolition
and rebuilding
Available but needs major repairs
Available but needs minor repairs
Available in good condition
39%
2%
12%
34%
14%
0
10
20
30
40
50
60
70
80
Not Available Existing building requires demolition
and rebuilding
Available but needs major repairs
Available but needs minor repairs
Available in good condition
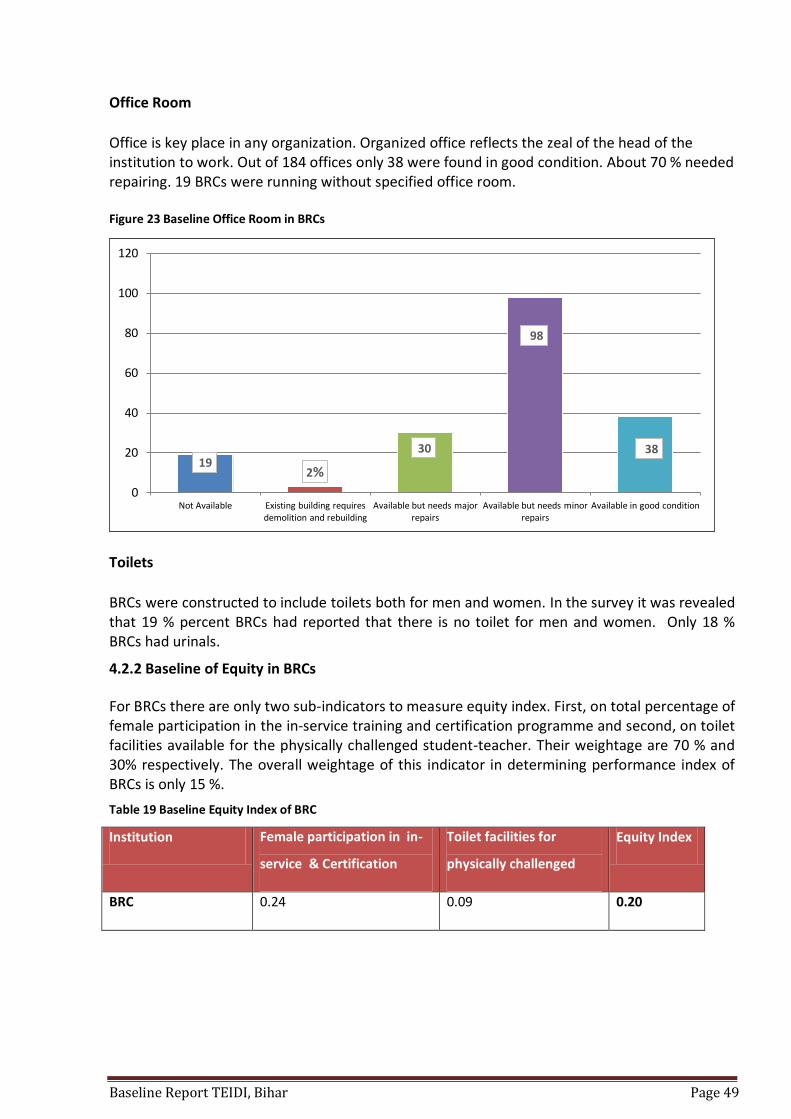
Baseline Report TEIDI, Bihar Page 49
Office Room
Office is key place in any organization. Organized office reflects the zeal of the head of the institution to work. Out of 184 offices only 38 were found in good condition. About 70 % needed repairing. 19 BRCs were running without specified office room. Figure 23 Baseline Office Room in BRCs
Toilets
BRCs were constructed to include toilets both for men and women. In the survey it was revealed that 19 % percent BRCs had reported that there is no toilet for men and women. Only 18 % BRCs had urinals.
4.2.2 Baseline of Equity in BRCs
For BRCs there are only two sub-indicators to measure equity index. First, on total percentage of female participation in the in-service training and certification programme and second, on toilet facilities available for the physically challenged student-teacher. Their weightage are 70 % and 30% respectively. The overall weightage of this indicator in determining performance index of BRCs is only 15 %.
Table 19 Baseline Equity Index of BRC
Institution Female participation in in-
service & Certification
Toilet facilities for
physically challenged
Equity Index
BRC 0.24 0.09 0.20
19 2%
30
98
38
0
20
40
60
80
100
120
Not Available Existing building requires demolition and rebuilding
Available but needs major repairs
Available but needs minor repairs
Available in good condition

Baseline Report TEIDI, Bihar Page 50
An encouraging 41.3% of total participants were women who took admission for in-service and certification courses. 10% of students took admission for Urdu subject. The share of Physically Challenged students in admission was 3%. The detail of participation of student teachers in the in-service training and and certification programme is given below
Figure 24 Baseline Students Participating in in-service Course
4.2.3 Baseline Academic Performance of BRCs
The academic performance of the BRCs was measured in terms of academic interaction taking place at the BRC level and availability of the resource persons there. The weightage of this indicator in overall performance index of the BRC is 35%. The BRCs are facilitating in-service training programmes for the teachers. Areas of training are Assessment / CCE, EVS/Social Studies/Science, Math, Primary Language and Secondary language. Training are specially organised for Primary/Upper Primary level teachers. These training programme are supported by SSA and DIETs. The in-service training programmes like Falak, Prerna, Udbhav and Inclusive education etc are conducted in BRCs. Total 64% BRCs are facilitating in-service training.
241
313
59
552
687
351
0
100
200
300
400
500
600
700
800
General SC ST BC EBC BC (Female)
In-service training
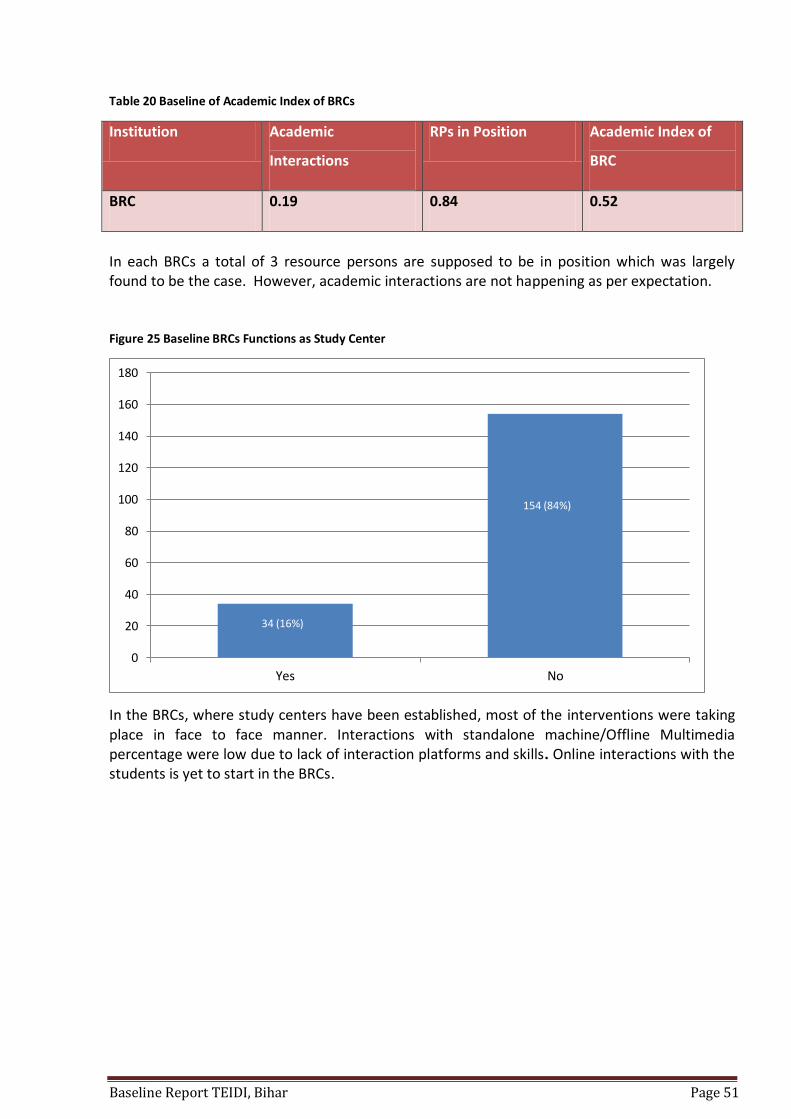
Baseline Report TEIDI, Bihar Page 51
Table 20 Baseline of Academic Index of BRCs
Institution Academic
Interactions
RPs in Position Academic Index of
BRC
BRC 0.19 0.84 0.52
In each BRCs a total of 3 resource persons are supposed to be in position which was largely found to be the case. However, academic interactions are not happening as per expectation.
Figure 25 Baseline BRCs Functions as Study Center
In the BRCs, where study centers have been established, most of the interventions were taking place in face to face manner. Interactions with standalone machine/Offline Multimedia percentage were low due to lack of interaction platforms and skills. Online interactions with the students is yet to start in the BRCs.
34 (16%)
154 (84%)
0
20
40
60
80
100
120
140
160
180
Yes No

Baseline Report TEIDI, Bihar Page 52
Figure 26 Baseline Mode of interaction in BRCs
4.2.4 Baseline Institutional Capacity / effectiveness of BRCs
Under this performance indicator, there are three performance sub-indicators, which were looked at the use of computers in academic and administrative work, budget utilization and availability of financial management staff in the BRC. Compared to the use of computers in administrative and academics work, the other two performance sub-indicators were found better. To measure this indicator, 40% weightage is given on each of first two sub indicators. The overall weightage of this performance indicator on performance of BRC was 15 %. Table 21 Baseline of Institutional Capacity / Effectiveness
Institution Use of Computer in academics and administration
Budget utilization
Availability of Financial Management Staff
Institutional Capacity / Effectiveness Index
BRCs 0.09 0.81 0.66 0.49
Staff In position In 95% of BRCs the Coordinators had been posted and 84 % BRPs are in position. These academic staff are supported by guard cum peon and Assistant cum clerk. Total 46 % positions of Assistant cum clerks and 30 % Guard cum peon positions are vacant. Use of computers In 4% of BRCs attendance of trainees are maintained in computers and 3 % of BRCs are maintaining accounts in computers.
65%
4% 0%
0%
10%
20%
30%
40%
50%
60%
70%
Face to face teacher taught interaction
Interaction with stand alone machine/Offline Multimedia
Online interaction with Curseware by trainee
% o
f B
RC
Mode of classroom interaction

Baseline Report TEIDI, Bihar Page 53
Reporting channel
The reports were generally sent by hand. One third of the reports were sent through posts. One-fifth of the BRCs had started using Emails also to send their reports. The detail of mode of reporting is as follows; Figure 27 Baseline Mode of Reporting in BRCs
Type of Reports
These reports may be categorized into three types, finance related, Administration Related and academics related. Almost 90 % of the BRCs maintained reports on the latter aspect. Figure 28 Baseline Type of Reports Sent to Higher Authority
94%
29%
20%
0%
10%
20%
30%
40%
50%
60%
70%
80%
90%
100%
By Hand By Post By E-mail
% o
f B
RC
Mode of Reporting
82%
87%
89%
78%
80%
82%
84%
86%
88%
90%
Finance related Administration related Academic related
% o
f B
RC

Baseline Report TEIDI, Bihar Page 54
Financial Management
A total of 184 positions for financial management staff were sanctioned, out of which 63 posts or about one-third were vacant. Overall, 90% BRCs maintain their Books of Accounts. BRCs generally maintain accounts manually, of these 97% do it manually and only 3% doing it with computers. Online accounting system has not been introduced yet at this level. The status of Audit performed in BRCs is depicted in the figure given below-
Figure 29 Baseline Year of last Audit Performed in BRCs
1%
3%
1%
10%
3%
15%
18%
30%
18%
0%
5%
10%
15%
20%
25%
30%
35%
2008 2009 2010 2011 2012 2013 2014 2015 Information not available
% o
f B
RC
Year of last Audit

Baseline Report TEIDI, Bihar Page 55
Overall Performance index of the BRCs
Regarding the composite TEIDI of BRCs, the first two indicators that is infrastructure and equity were found to be 0.24 and 0.20 respectively and the last two indicators that is academics and institutional capacity / effectiveness were found to be 0.52 and 0.59 respectively. The table below suggests that improvement on the infrastructure and academics score can impact on the overall performance index of the BRCs. Table 22 Baseline Overall Performance Index of BRCs
Institution Performance Index of the Indicator
Weightage of the indicator in total (in percentage)
Overall Performance Index of DIs
Infrastructure 0.24 35
0.37
Equity 0.20 15
Academics 0.52 35
Institutional Capacity / Effectiveness 0.49 15
The overall baseline performance index of BRCs was higher at 0.37 compared to that of either SCERT or the District level institutions, both of which were calculated to be 0.34.

Baseline Report TEIDI, Bihar Page 56
CHAPTER 5 STATUS OF CTEs
5.1 Role of College for Teacher Education
The colleges of teacher education (CTEs) were established following the National Policy on
Education (NPE) 1986, which states that Teacher Education is a continuous process and its pre-
service and in-service components are inseparable. The CTEs are meant to work in the field of
secondary teacher education- both pre service and in-service . In addition , they also have the
responsibility of carrying out research, innovations, material development and provide
extension support to schools etc.
CTEs would continue to conduct pre-service and in-service training programs for
secondary school teachers.
CTEs would conduct training need analysis and baseline surveys for organizing training
programs including teacher handbooks and training modules.
CTEs would conduct impact studies effect of training in classrooms processes and
learning outcomes. This would have to be done through substantial school visits and
classroom observations.
CTE would also prepare implementation guidelines for plan activities including training
and projects.
NOTE:
These are government institutions affiliated with universities although they are covered in
baseline survey, but not in the analysis course primarily because, The World Bank Project”
Enhancing Teacher Effectiveness in Bihar Operation” is based on to fill the wide ranging gap of
trained versus untrained teachers at elementary level schools in Bihar and to the extent
improve the classroom transactions at the elementary level in government schools of Bihar.

Baseline Report TEIDI, Bihar Page 57
ANNEXURE 1 QUESTIONNAIRE FOR SCERT
(To be filled by Director SCERT, Patna)
Name of the Director:
Address:
Phone No. E-mail:
1. Sanctioned and filled up posts
S.No. Post Sanctioned
Posts
Filled up Posts
GN BC EBC SC ST Female Muslim Min.
1. Academic
(i) Director
(ii) Jt. Director
(Acad)
(iii) Head of
Deptt.
(iv) Reader
(v) Lecturer
(vi) Research
Officer
2. Administrative
J D (Admn)
Dy. Director/ Incharge
Head Clerk & Clerk
Accountants
Lab Asstt
Librarian/Asstt
Librarian
Others
2. (a) Academic Staff by subject specialization
S.No. Subject Sanctioned posts Filled up Vacancies

Baseline Report TEIDI, Bihar Page 58
(i) Language (Hindi / Urdu)
(ii) English
(iii) Mathematics
(iv) Science
(v) Social Studies/Social Sc.
(vi) Psychology
(vii) Computer Education
(viii) Physical Education
(ix) Art & Craft
(x) Others (Please Specify)
(b) Is there any system of maintaining the staff attendance? Yes (1) / No (2) 3. Long term Training programme
(a) Is there any regular training programme Yes (1) / No (2) (If yes, answer the following)
(b) Name of Programme/Course _________________________________________ (c) Its duration (in months ) (d) No. of trainees enrolled in 2012-13 (e) Category of trainees (teachers/administrators/others) _________________
4. Short term training/workshops conducted in 2013-14 on its own or in collaboration with other
institutions
S.No. Name of programme Collaborating institution (if any)
Duration (in days)
No. of participants
Category of
participants 1
2
3
4
5
6
7
8
9
10
*Teacher educators (1), School heads (2), Teachers (3), Administrators (4), others- mention (5)

Baseline Report TEIDI, Bihar Page 59
5. Physical access to SCERT
(a) Distance of nearest bus stop (in Km)
(b) Distance from the office of State Education Department
(c) Distance from other Departments and institutions which SCERT deals with
Sl.No. Name Distance (Km)
(i)
(ii)
(iii)
(iv)
(v)
6. Facilities and Learning Resources
(a) Rooms and other facilities
Sl.No. Facilities Number Total Area
(Sq.m)
Condition good (Y) Needs
Improvement (N)
If response is ‘N’ Please Specify as
given below*
1 Director’s room
2 Jt. Director’s room
3 Rooms for HODs/ Faculty
Members
4 Office room(s)
5 Lecture/Seminar Hall
6 Library
7 Staff room
8 Computer room
9 Resource
Centres/Laboratory
10 Art & Crafts room
11 Other rooms (if any)
*New Construction (1), Major Repair (2), Minor Repair (3), Need Equipment/Apparatus/Furniture
(4), Others (5)
(b) Toilets/Drinking Water
(i) Toilets for males (no. of Toilet Units)

Baseline Report TEIDI, Bihar Page 60
(ii) Toilets for females (no. of Toilet Units)
(iii) Urinals for males (no. of Toilet Units)
(iv) Accessible Toilet facilities for Physically Challenged (no. of Toilet Units)
(v) Drinking water Units
Filtered or RO treated (1) ; Unfiltered (2)
(vi) Water Supply
(c) ICT Facilities
(i) No. of computers for training purpose
(ii) Internet facililities
(iii) Wi-fi facilities
(iv) Use of multi-media (subject wise) for teachers training purpose
(v) Virtual classes facilities (if yes)
(vi) Whether virtual classes being conducted?
(d) Social Effectiveness Facilities
a. Availability of non-conventional sources of energy (solar panel etc.)
b. smokeless and soundless generator
c. Fire safety Arrangements
d. First Aid arrangements
e. Barrier Free Access for physically challenged
f. Solid Waste Management
g. Attendance
7. Is the infrastructure of SCERT having sufficient space and capacity for execution of different
components of the program?
8. Is there any provision of other sources of energy for SCERT building?
9. Are those sources meet the criteria as per the norms?
10. Curriculum revision
(a) Has SCERT revised curriculum according to NCF – 2005? Yes (1) No (2)

Baseline Report TEIDI, Bihar Page 61
(b) When was the last revision? Year :
(c) After how many years it is revised?
11. Revision of textbooks in last 5 years
List the textbooks that were revised
S.No. Textbook Subject Class Year of
Revision
1
2
3
4
5
6
7
8
9
10
11
12
13
14
15
12. Does SCERT have special cells/Resource Centresfor some subjects or purposes (e.g. computers,
language, Science and Mathematics, teaching, etc.)? If yes, mention their names, exclusive staff
and equipment.
Sl.No. Name of Special units/Resource
Centres and their purpose
Exclusive Staff
(number)
Equipped
Fully (1); Partly (2);
Not at all (3)
1
2
3
4

Baseline Report TEIDI, Bihar Page 62
13. Has SCERT devised schemes or procedures for evaluation based on CCE for students in schools?
Yes (1) / No (2)
If yes, answer the following question
(a) In which year was it developed?
(b) Was there any action taken to introduce it in schools?
(c) Was there any manual or guidelines prepared for implementation of CCE in schools
Yes (1) / No (2)
(d) Where the experts from outside involved in preparation of Manual/Guidelines?
Yes (1) / No (2)
(e) Was there any workshop conducted to train DIET Staff/resource persons/ teachers in
implementation of CCE. If yes, please provide the details in response to Q 6.
14. Has SCERT prepared training modules or other materials for training the staff of DIETs, BITEs
and other institutions on
(a) NCF – 2005/BCF 2008 Yes (1) / No (2)
(b) NCFTE - 2009 / State Curriculum for Teacher Education Yes (1) / No (2)
15. (a) Did SCERT conduct any training programme for DIET staff on NCF-2005/BCF 2008, NCFTE-
2009 / SCTE 2012-13 Yes (1) / No (2)
(b) If yes, please include details under Q.6
16. Has SCERT developed curriculum and evaluation procedures for Diploma level pre-service
training conducted at DIETs and BITEs Yes (1) / No (2)
If yes, in which year (or years)
17. Has SCERT conducted any training of DIET staffs
(a) Training about the ODL mode instruction to be given to teachers.
Yes (1) / No (2)
(b) If yes, in which year / years?
18. If the training on ODL was given
(i) How many DIETs were covered?
(ii) No. of DIET staffs given training in last 3 years (year-wise)

Baseline Report TEIDI, Bihar Page 63
19. Is any teaching based on practical work/exercise/hands on given to DIET and BITE teaching staff
in the training workshop? Yes (1) / No (2)
If yes, what % of time was devoted to practical training out of total time spent on training in
2013-14&14-15?
20. Total number of days on which training of teacher educators of DIETs, PTECs and BITEs was
conducted in training workshops during 2013-14&14-15: No. of days
21. Which of the following elements of pedagogy were covered in their training and on which of
these training modules or other materials were prepared to be given to trainees? Write (1) for
Yes and (2) for no.in the cells against each item.
S.No. Item Whether covered in
Training
workshops
Instructional
modules given to
trainees
1. Teaching in multilingual medium (using both state and
local dialect while teaching)
2. Recent developments in the field of early reading
3. Inputs for improving language skills of trainees
4. Discussion of children’s literature and criteria for
evaluating the children’s books
5. Basic concepts in Mathematics
6. Difficulties faced by children in mathematics
7. Use of Mathematics kits for clarifying concepts
8. Features of Scientific methods and approach of
constructing knowledge (constructivist approach)

Baseline Report TEIDI, Bihar Page 64
9. Opportunity of working in laboratories/conducting
experiments
10. Discussion of Social issues of gender equity and
marginalized groups
11. Use of constructivist approach in Social sciences
12. Use of variety of resources and materials in teaching-
learning
13. Development of inter-disciplinary lesson plans
14. Actual use of lesson plans in practice teaching in
schools
15. Use of ICT in teaching
16. Use of local crafts, folk songs as resource in teaching
17. Knowledge of different methods of assessment of
students
18. Giving feedback to students from assessment
19. Features of CCE and its use in improving the learning of
students
20. Findings of Achievement surveys already conducted by
NCERT and SCERT and lessons learnt from them.
22. Library
(i) Number of books in the library
(ii) Number of research journals subscribed
(iii) Number of other periodicals/magazines subscribed
(iv) Number of books procured in 2013-14
(v) Number of newspapers subscribed for library
(vi) Number of reference books, encyclopedia, dictionaries etc. included in total books given
under (1)
(vii) Number of persons who can sit and read in library
(viii) Maximum number of books that can be issued to academic staff at a time
23. Science laboratory
(i) No. of experiments for which equipment is available
(ii) No. of new equipments procured in 2013-14
(iii) No. of trainees who can work in laboratory at a time
(iv) No. of experiments performed by trainees in 2013-14

Baseline Report TEIDI, Bihar Page 65
24. Are there laboratories/special rooms and kits for other subject? Write (1) for YES and (2) for NO.
(i) Geography lab/room
(ii) Mathematics lab/room
(iii) Science kit for classes _______________
(iv) Mathematics kit for classes ____________
25. Give the number of Teaching-learning materials (TLM) developed at the institute, which can be
used by teachers/students in schools in 2013-14
(i) TLM Developed by SCERT academic staff
(ii) TLM developed by trainees
26. Number of academic staff members deputed for training/seminar at other institutions in last 3
years
S.No. Name Where No. of days Purpose of training
1.
2.
3.
4.
5.
6.
27. Professional development programmes, seminars and conferences organised at SCERT in last 3
years and number of staff members who attended these programmes.
S.No. Programme Issues*
discussed
Duration
in days
No. of SCERT
participants
Others who
attended
No. of
outside
resource

Baseline Report TEIDI, Bihar Page 66
persons
1.
2.
3.
4.
5.
6.
28. Research by SCERT staff in 2013-14
a) No. of Research projects undertaken by SCERT in 2013-14
b) No. of research projects completed at SCERT in 2013-14
c) No. of research papers published by staff of SCERT
d) No. of papers presented at various seminars by SCERT staff
e) No. of Action Research projects undertaken
29. Mention titles and authors of papers
S.No. Title Author(s) Where published or presented
30. a) Whether the training programmes are evaluated by participants
Yes (1), No (2)
b) If yes, do the participants gives Comments (1) Grades (2)

Baseline Report TEIDI, Bihar Page 67
c) No. of training programmes rated over 50% trainees as
Satisfactory (1), average (2), Poor (3)
31. a) Is there a website of SCERT Yes (1), No (2)
b) If yes, Number of site hits by DIETs, PTCs, BITEs
GOVERNANCE
32. Budget and expenditure in 2013-14
Budget of SCERT, item-wise, for 2013-14
Item Amount budgeted Amount spent
(i) Academic staff salaries
(ii) Other salaries
(iii) Training programmes
(iv) Library books
(v) TLM and other materials
(vi) Purchase of new
equipment
(vii) Maintenance of facilities
(viii) Building of new facilities
(non-recurrent)
(ix) Other items
Total
33. Income by Source in 2013-14
Sl.No. Source Amount received Amount spent
a) Saving from previous year
b) Government grant for recurrent expenditure
c) Government grant for non-recurrent items
d) Funds from other sources and purpose
Total (b) to d)
34. Financial Management

Baseline Report TEIDI, Bihar Page 68
a) No. of dedicated Staff (sanctioned, Vacant posts)
b) Agencies performing Audit, Year of Audit, Compliance and Status of Audit Report
c) Maintenance of Book of Accounts, Software used for accounting (manual, offline, online)
d) Existing Auditing System
35. Is there is any reporting system from DIETs to SCERT
If yes, please mention
Monthly
Quarterly
Half early
Yearly
36. Governance (mechanism of accountability, performance)
a) Number of times SCERT sends reports to the government on its activities in a year
b) Number of complaints from staff handled by the Director of SCERT in 2013-14
c) No. of complaints/petitions forwarded to the government for decision in 2013-14
d) No. of meetings held with academic staff in 2013-14
e) No. of meetings held with administrative staff in 2013-14
Baseline Report TEIDI, Bihar Page 69
37. (a) Does SCERT have data base of DIETs, PTCs and BITEs
(b) Does SCERT publish an annual report of its activities?
(c) Does SCERT prepare an annual plan?
(d) If yes, is it appraised and approved by the government?
38. (a) Number of members in governing Body of SCERT
(b) How often did it meet in 2013-14
(c) Does SCERT have an Advisory body?
(d) How often did it meet in 2013-14?
39. How many projects are running with SCERT collaboration with other Institutions?
(a) Number of Institutions
(b) Project Completed
(c) Name of the Project and the Institution
40. Other agencies with which SCERT coordinates its programmes and from which it gets support?
(Mark 1 for YES and 2 for NO) and if yes, give information about the nature of coordination and
support.
(a) Textbooks Bureau
(b) Board of School Education

Baseline Report TEIDI, Bihar Page 70
(c) University of Patna
(d) SSA
(e) RMSA
(f) Any other (mention)
Signature of the Director
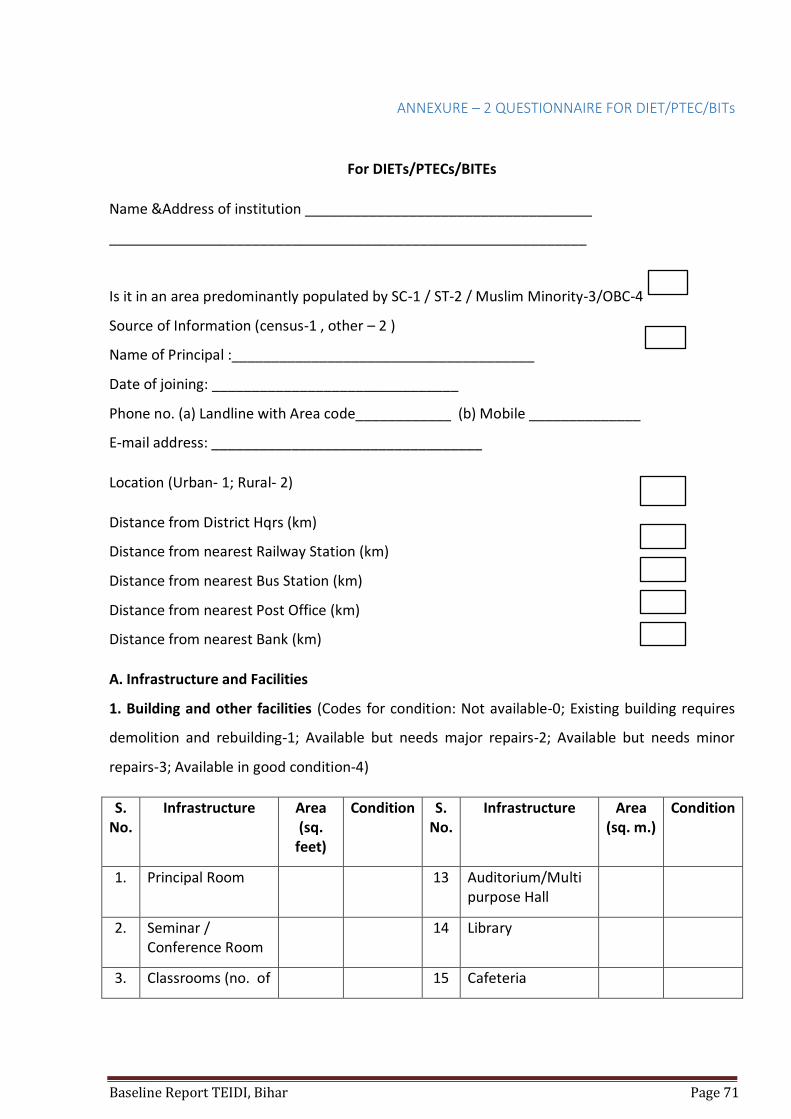
Baseline Report TEIDI, Bihar Page 71
ANNEXURE – 2 QUESTIONNAIRE FOR DIET/PTEC/BITs
For DIETs/PTECs/BITEs
Name &Address of institution ____________________________________
____________________________________________________________
Is it in an area predominantly populated by SC-1 / ST-2 / Muslim Minority-3/OBC-4
Source of Information (census-1 , other – 2 )
Name of Principal :______________________________________
Date of joining: _______________________________
Phone no. (a) Landline with Area code____________ (b) Mobile ______________
E-mail address: __________________________________
Location (Urban- 1; Rural- 2)
Distance from District Hqrs (km)
Distance from nearest Railway Station (km)
Distance from nearest Bus Station (km)
Distance from nearest Post Office (km)
Distance from nearest Bank (km)
A. Infrastructure and Facilities
1. Building and other facilities (Codes for condition: Not available-0; Existing building requires
demolition and rebuilding-1; Available but needs major repairs-2; Available but needs minor
repairs-3; Available in good condition-4)
S. No.
Infrastructure Area (sq.
feet)
Condition S. No.
Infrastructure Area (sq. m.)
Condition
1. Principal Room 13 Auditorium/Multi purpose Hall
2. Seminar / Conference Room
14 Library
3. Classrooms (no. of 15 Cafeteria

Baseline Report TEIDI, Bihar Page 72
rooms …………. ) 16. Store Room
17 Room for Warden
18 Room for Office Staff
4. Meeting Hall 19 Reception Lounge
5. Room for Faculty members
20 Hostel- No .of rooms
6. Resource Centre for Maths
21 Dormitories
7. Resource Centre for Social Sc.
22 Playground
8. Resource Centre for ICT
23. Common Room
9. Resource Centre for Science
24. Physical Edu. Room
10. Resource Centre for Psychology
25. Sick Room
11. Resource Centre for Language
26. Ramps
12. Resource Centre for Art & Craft
27. Any other room
2.ToiletFacilites
(a) Toilets for men (give no. of toilet seats)
(b) Toilets for women (give no. of toilet seats)
(c ) Urinals for men (give number of urinals)
(d) No. of Bath units (bathrooms)
(e) Toilet facilities for physically challenged persons (no. of units)
(f) Water facilities at Bathrooms and toilets (Yes – 1; No – 2)
3. (a) Number of male students who are day scholars

Baseline Report TEIDI, Bihar Page 73
(b) No. of female students who are day scholars
4. (a) Total area of land belonging to DIET (in acres)
(b) Total covered area of DIET building (excluding hostels in sq. m.)
(c ) Total areas of hostel/ dormitory building (in sq. meters)
5.Safety, and environmental friendly provisions
a) Provision for fire safety (Yes-1; No-2)
b) Provision for Electrical Safety (Yes-1; No-2)
c) Solid Waste Management(Yes-1; No-2)
d) Water Disposal System(Yes-1; No-2)
e) Barrier free Infrastructure (Yes-1; No-2)
If yes then please details of the provision made
______________________________________________________________________________
______________________________________________________________________________
f) Provisions for non-conventional source of energy(Yes-1; No-2)
If yes please give details ________
6. Equipment and Teaching Aids
Teaching aids Available (Give numbers)
Used in teaching and workshops
Used for administrative
purposes
Desktop
Laptops
Printer
Photocopy machine
LCD Projector
Science kit
Mathematics kit
Internet connection
Wi-fi

Baseline Report TEIDI, Bihar Page 74
Television
VCD player
Computer software(mention names):
Generator Set
Invertor
Solar Panels
Others
7. Availability of Electricity (avg. in 24 hours.) :_______________________________
8. Drinking water facility :_________________________________________________
B. Equity
9. For the Pre-service Diploma course provide the following information about students
a) No. of applicants for admission % of women applicants
b) No. of students selected for admission % of women selected
c) No. of students who took admission % of women admitted
d) Number of SC/ST/EBC/BC/Urdu and Physically Challenged students, who
applied for admission, who were selected and who finally took admission
S.
No.
Category No. of Reserved
Seats
No. of applicants
Number selected
Number admitted
1 General
2 SC
3 ST
4 BC
5 EBC
6 BC (Female)
7 Urdu
8 Physically Challenged
Total

Baseline Report TEIDI, Bihar Page 75
e) Total intake of the Institute (Maximum no, of students who can be admitted) ………
f) No. of Hostels
Boys
Girls
g) Capacity of hostel - No. of seats for (a) Male students
(b) Female students
h) Students living in hostel (a) Male students
(b) Female students
i) Number of students (out of those admitted)who belong to same
district in which DIET is located:
10. Scholarships given to students Male Female
a. Number of students who applied for scholarship
b. Number of students given scholarship
c. Amount of scholarship per student in a year
d. Comments
e. (if any) __________________________________________________
_________________________________________________________________
11. Sports/games and other activities in which students participate regularly.
SL Game/sport/other activities
Facility available
Yes (1) / No (2)
% of female participation in tournaments or competition.
No. of students who took part in tournaments or competitions in Semester.
1 Cricket
2 Football
3 Table Tennis
4 Hockey
5 Volleyball
6 Basketball
7 Athletics

Baseline Report TEIDI, Bihar Page 76
8 Badminton
9 Carom
10 Music
11 Dance/ drama
12 Debate/ elocution contests
13 Art/ craft
14. Math Mela
15 Science Mela
16 Sports Day
17 Any Other
12. Enrolment in Pre-service Diploma course
Batch 1st year 2nd year Total pass out students
Total Female Total Female Total Female
1st Batch
2nd Batch
13. Give details of prizes, trophies, medals etc won by students in 2013-14
Event/ competition Who won Prize/ trophy awarded
14. Dropout from Pre – service Diploma course
a % of female Dropouts
Baseline Report TEIDI, Bihar Page 77
b % of male Dropouts
15. Performance
a. % of pass in the batch
b. No. of students passed in 1st div.
c. No. of students passed in 2nd div.
d. No. of students passed in 3rd div
C. Academic
16. Sanctioned and vacant posts of faculty members
(a) Sanctioned posts
(b) Vacant posts
(c) Faculty in Position
17. Faculty Members
1. Percentage (%) of teachers with
a. Ph.D. Degree
b. M. Phil. Degree
c. Masters Degree
2. Percentages of teachers with
a. <2 years of teaching experience at school level/DIET/PTEC
b. 2 to 5 years teaching experience at school level/DIET/PTEC
c. >5 years teaching experiences at school level/DIET/PTEC
3. a. Average no. of instructional hours per week in Diploma course
b. Average no. of instructional hours per week in ODL programme
18. In-service training programmes and support to BRCs, CRCs and Schools
In-service training programmes for teacher educators conducted at DIET/ PTEC/
Sl. Title for No. of Date Course content Affiliation of

Baseline Report TEIDI, Bihar Page 78
No. training programme
participant (main topics covered)
Master
From To Trainers
1
2
3
4
5
6
7
8
9
10
19. (a) Provide information about other in-service training programmes/ workshops (e.g. for
headmasters and teachers, etc.)
Sl.
No.
Title for training
programme
Category of
participants
No. of
partici-
pants
Date Course
content From To
1
2
3
4

Baseline Report TEIDI, Bihar Page 79
(b) For professional development of faculty of DIET / PTEC
Sl. No.
Title for training programme
Category of participants
No. of participants
Date Course content
From To
1
2
3
4
20. On the spot support provided to BRCs, CRCs and schools (through visits)
Sl. No.
Nature of support /
mentoring or service given
Total no of
faculty member
Number of faculty
who covered
BRCs
Number of faculty
who covered
CRCs
No. of schools covered
No. of visits made
BRCs CRCs Schools
1
2
3
4
5
6
21. Number of schools adopted by the DIET/ PTEC for practice teaching and continuous
support:
(a) Primary schools _________
(b) Upper Primary schools _______

Baseline Report TEIDI, Bihar Page 80
22. Average no. of hours per week spent by faculty members on different academic and other
activities of the Institute.
Category Teaching in Pre-service
Diploma course
Teaching in ODL
programme
Teaching in in-service training courses
Taking part in continuous Support to
Schools Adopted
Attending to administrative
work
Principal
Faculty
23. Research and other activities / achievements
Number of seminars organized by the institute in which experts and faculty members of other
institutions participated
Topic Duration (days)
No. of participants
from outside
No. of Faculty members
involved in seminar work
No. of papers presented by
Faculty members
24. A) Research papers published by faculty members in last 3 years;
Topic of paper Author(s) Year Name of Journal

Baseline Report TEIDI, Bihar Page 81
B) No. of Action Research studies completed
No. of action research supervised
25. Books published/ participation in development of text-books, learning materials etc. by
faculty members
Author(s) Title of book Publisher Year
26. Teaching methods used
Teaching methods used by most of the faculty members
Method Hrs. spent per week on each
Talk & Chalk
Group work
Demonstration
Role playing
Making use of ICT
Giving and checking
Assignment/Project Work)
Periodic tests/ CCE

Baseline Report TEIDI, Bihar Page 82
D. Institutional Capacity / Effectiveness
27. Information about non-teaching staff
S. no.
Staff category Sanctioned posts Staff in position Vacant posts
1 Administrative staff
2 Office Assistant
3 Technical staff
4 Class IV staff
5 Any other
Total
28.Management, Planning and Governance
Is there any mechanism of fixing accountability and performance (please Specify)
_________________________________________________________________________
_________________________________________________________________________
_________________________________________________________________________
____________________________________________________________________
29. Do you hold meeting of faculty members to discuss academic/ administrative issues?
(1) Once a week
(2) Once in a month
(3) Any other fixed periodicity (mention periodicity)
30. Use of computers in administration
(1) Is the admission procedure computerized (yes- 1; no- 2)
(2) Is the record of evaluation of students maintained on computer?(yes- 1; no- 2)
(3) Are the accounts computerized? (yes- 1; no- 2)
(4) Is reporting to higher authorities done by sending e-mail? (yes- 1; no- 2)
(5) Do communicate with SCERT &other institutions by e-mail?(yes- 1; no- 2)

Baseline Report TEIDI, Bihar Page 83

Baseline Report TEIDI, Bihar Page 84
31. Do you submit a report to higher authorities about your Institute’s activities and data?
(1) If yes ,how ? (a) By hand ( b)By Post (c) By E-mail
(2) If yes, to whom?
(3)If yes, how often? (a) Monthly (2) Quarterly (3) Annually
(4)Mention what does the report cover normally?
Finance related Administration related Academic related
____________________________________________________________________________
____________________________________________________________________________
_________________________________________________________________________
32. Does the Institute prepare an Annual plan for its future activities, expansion or growth?
(Yes- 1; No- 2)
a) What are the main elements covered or targets fixed in the plan ? Mention in brief.
________________________________________________________________________
________________________________________________________________________
________________________________________________________________________
b) Who prepares the plan?
c) Who approves the plan?
d) When during the academic year is the plan prepared?
33. a) Is there any grievance redressal cell ?(Yes – 1: No-2)
b) How long it take to reply RTI ?
34.Action is taken on complaints/feedback of faculty members,trainees or teacher.
(1) Meeting of faculty/Students is held to discuss the issue
(2) Complaint is forwarded to higher authorities for appropriate action
35.(a) Is there an Academic Planning and Review Group or Committee?-(Yes-1; No-2)

Baseline Report TEIDI, Bihar Page 85
(b) If yes, how many times in a year does it meet? _______
(c) Number of members in it _________
(d) Mention in brief important decisions taken by it in its last meeting held on ______
______________________________________________________________________________
__________________________________________________________________
36. Finances of the Institute
Budget and expenditure for the year
Item of expenditure Amount approved
Amount spent
Previous unspent
sum, if any
Comments
Capital (non-recurring)
Construction work
Furniture, Equipment
Recurrent
Teaching staff salaries
Non- teaching staff salaries
Scholar Fund
Other items
Total
37. Financial Management
a) No. of dedicated Staff
Sanctioned,
Vacant posts
b) Agencies performing Audit

Baseline Report TEIDI, Bihar Page 86
_______________________________________________________________
c) Year of Audit____________________________________________________
d) Compliance and Status of Audit Report_______________________________
______________________________________________________________
e) Maintenance of Book of Accounts,
f) Software used for accounting
(Manual_______, Offline_______, Online_______)
g) Existing Auditing System__________________________________________
_______________________________________________________________
38. Source of funds and amount of grants received -State Government, Central government grants and other grants (Mention amounts and purpose for which it was given).
Source Amount (in rupees)
Purpose
State Govt.
Central Govt.
Other -1
Other-2
Mention any other points that highlight
(a) Good achievements of the Institute and
(b) The problems faced in running the institute efficiently.
Signature of Principal
Date

Baseline Report TEIDI, Bihar Page 87
ANNEXURE – 3 QUESTIONNAIRE FOR BRC
TO BE FILLED BY BRCC
Name and address of BRC:____________________________________________________
______________________________________________________
Name of BRC Coordinator:__________________________________________________
Phone no:. (a) Landline: ______________________ (b) Mobile: __________________
E-mail address:___________________________@___________________
Location (Urban- 1; Rural- 2)
Distance from District Institute of Education & Training (km)
Distance from nearest Bus Station (km)
Distance from nearest post office (km)
Distance from nearest Bank (km)
Land Area
(a) Total area of land belonging to BRC (in sq. meters)
(b) Total covered area of BRC building
A. Infrastructure
1. Building and other facilities (Code for condition: Not available-0; Existing building requires
demolition and rebuilding-1; Available but needs major repairs-2; Available but needs
minor repairs-3; Available in good condition-4)

Baseline Report TEIDI, Bihar Page 88
S.No. Infrastructure Area
(sq.
m.)
Condition S.No. Infrastructure Area
(sq.
m.)
Condition
1. Training Hall 4. Room for
Resource
Persons
2. Library 5. Store Room
3. Computer
Room
6. Room for
office/BRCC
Any Other (please
specify)
7. Ramp
2. Toilet Facilities
(a) Toilets for men (give no. of toilet seats)
(b) Toilets for women (give no. of toilet seats)
(c) Urinals for men (give number of urinals)
(d) Toilet facility for physically Challenged (no. of units)
(e) No. of Bath Units (bathrooms)
(f) Water facilities at Bathrooms and toilets (1- Yes 2-NO)
3. Safety, and environmental friendly provisions
g) Provision for fire safety (Yes-1; No-2)
h) Provision for Electrical Safety (Yes-1; No-2)
i) Solid Waste Management(Yes-1; No-2)
j) Water Disposal System(Yes-1; No-2)

Baseline Report TEIDI, Bihar Page 89
k) Barrier free Infrastructure (Yes-1; No-2)
If yes then please details of the provision made
______________________________________________________________________________
______________________________________________________________________________
l) Provisions for non-conventional source of energy(Yes-1; No-2)
If yes please give details ________
4. Equipment and Teaching aids available and used
Teaching aids Available (Give
numbers)
Used in teaching
and workshops
Used for
administrative
purposes
Desktop
Laptops
Printer
Photocopy machine
LCD Projector
Science kit
Mathematics kit
Internet connection
Television
VCD player
Computer software(mention names):
Generator Set
Solar Panel

Baseline Report TEIDI, Bihar Page 90
B. Equity
5. For the Certification or CPD course provide the following information about students
e) No. of applicants for course % of women applicants
f) No. of students selected for course % of women selected
g) No. of students who took the course % of women
h) Number of SC/ST/EBC/BC/Urdu and Physically Challenged students, who
finally took the course
Sl.
No.
Category % population
in the block
No. of
applicants
Number
selected
Number who
took course
1 General
2 SC
3 ST
4 BC
5 EBC
6 BC (Female)
7 Urdu
8 Physically Challenged
Total
C. Academic
6. Is BRC is working as Study Centre for D.El.Ed. or other teacher education certification
programme (if YES 1; NO 2)
7. If yes, please provide the following information about teacher education certification
(Diploma)programme.
a) Name of the Programme: ____________________________
b) Total no. of seats

Baseline Report TEIDI, Bihar Page 91
c) No. of untrained teachers admitted
Year
(batch)
Total of both years of the batch
Total Male Female
8. How many days contact classes were organized during last year
9. What mode/s are being used for classroom interaction in certification programme
Topics Specify (Yes/No) Ratio( If Yes)
Face to face teacher taught interaction
RP:Trainee
Interaction with stand alone machine/Offline Multimedia
Computer:Trainee
Online interaction with Courseware by trainee
Computer:Trainee
10. Whether BRC is facilitating Continuous Professional Development (CPD) Programmes for
teachers (Yes -1/ No - 2) _______
11. What are the areas of training under CPD of teachers
Topics Please Tick
Training specially for which group
Training Supported by (eg. SCERT, DIET, SSA, Others)
Assessment/CCE Primary/ Upper Primary
EVS/Social Studies/Science
Primary/ Upper Primary
Math Primary/ Upper Primary
Primary Language (Specify)
Primary/ Upper Primary
Secondary Language (Specify)
Primary/ Upper Primary
Others Primary/ Upper Primary
12. How many teachers are being imparted training under CPD programme during last year.

Baseline Report TEIDI, Bihar Page 92
Month/s & Year Name of Training Total No. of
Trainees
Male Trainees Female Trainees
13. What mode/s are being used for classroom interaction in CPD of teachers
Topics Specify (Yes/No) If Yes then Ratio
Face to face teacher taught interaction
RP:Trainee
Interaction with stand alone machine/Offline Multimedia
Computer:Trainee
Online interaction with Courseware
Computer:Trainee
Online interaction with of State level Resource Persons
RP:Trainee
Online interaction with of National/International level Resource Persons
RP:Trainee
14. Coordinator and Resource Persons (supporting Certification and CPD training)
Resource Persons for Teacher Education Certification Programme
Post Approved Positions Vacant Position RP in position
Coordinator
Resource Persons

Baseline Report TEIDI, Bihar Page 93
D. Institutional Capacity/Effectiveness
15. Academic and supporting staffs
Academic Staff
Post Sanction posts Vacant Posts Staff in position
BRCC
Block Resource Persons (BRP)
Supporting Staff
Post Sanction posts Vacant Posts Staff in position
Assistant-cum-Clerk
Guard-cum-Peon
16. Use of computers in administration
(1) Is the record of attendance of trainees maintained on computer? (yes- 1; no- 2)
(2) Are the accounts computerized? (yes- 1; no- 2)
17. Do you submit a report to higher authorities about your Institute’s activities and data?
(1) If yes, then specify the mode- By Hand By Post By E-mail
(2) If yes, how often? (a) Monthly……. (2) Quarterly…….(3) Annually……..
(3) Mention what does the report cover normally?
Finance related Administration related Academic related
18. Is there any complaints or feedback mechanism if yes please supply
(1) Decision is taken by you on the spot
(2) Complaint is forwarded to higher authorities for appropriate action
(3) No action is taken; matter is left to the concerned parties to sort out

Baseline Report TEIDI, Bihar Page 94
19. Expenditure under the project for the financial year-
Item Amount approved Amount spent Previous unspent sum,if any
Comments
Honorarium for Coordinator& RPs
TA for Trainees
DA for Trainees
Training Materials
Maintenance
Contingencies
20. Financial Management
e) No. of dedicated Staff
Sanctioned,
Vacant posts
f) Agencies performing Audit
_______________________________________________________________
g) Year of last Audit____________________________________________________
h) Compliance and Status of Audit Report_______________________________
______________________________________________________________
i) Maintenance of Book of Accounts,
j) Software used for accounting (Manual_______, Offline_______, Online_______)
k) Existing Auditing System__________________________________________
21. Mention special achievements and also problems encountered in efficient functioning of the
BRC.
Date Signature of BRCC
ANNEXURE -4 INDEX GENERATION FRAMEWORK FOR SCERT I

Baseline Report TEIDI, Bihar Page 95
Key Dimension 1: Infrastructure 1.1 Building Conditions: Calculate average of 11 building conditions (rated from 0 to 4) from
Item number 6 (1) to Item numbers 6 (11). Further the average is converted on 0 to 1 scale. 1.2 Toilet Facilities:Calculate the total no. of working toilets from item no. 6(b)i and 6(b)ii (male
and female) and divided by 16 (by assuming that SCERT has at least 16 toilets for its 7 departments and one Director cell. i.e. 2 toilets for every department other than in Hostels).
1.3 Safety & Environmental Friendliness: Average of item no. 6(d)(b) to 6(d)(f) to be calculated. 1(one) for ‘yes’ and 0(Zero) for ‘No’ would be reassigned.
1.4 ICT Facilities: Average of item no. 6(c)(ii) to 6(c)(iv) to be calculated. 1(one) for ‘yes’ and 0(Zero) for ‘No’ would be reassigned.
1.5 Availability of Computer for Training: Total no. of desktops and laptops would be divided by 30 (by assuming that at least 30 computers are required at SCERT for academic or training purpose). Maximum one would be credited under this dimension.
1.6 Availability of Alternative Source of Energy:Average of availability of generator set and renewal source of energy (Solar Panels) to be calculated. 1(one) for yes and 0(Zero) for No would be reassigned.
Key Dimension 2: Equity 2.1 Toilets for Females:Ratio of no. of women toilets to the half of total toilets would be calculated. Maximum score 1. 2.2 Toilet facility for Physically Challenged:Provision of toilet facility for Physically Challenged persons would be considered as 1 (one) and not provision of the same would be 0 (zero). Maximum score 1. Key Dimension 3: Academic 3.1 Training and Material Development:Calculated from item no.21 by assigning zero for no and one for yes. Total from item no. 21 would be divided by 40 to get score on 0 to 1 scale. 3.2 Research Activities: Research activities undertaken areconsidered under this section by assumption that each faculty member do lead one research project. Total research conducted divided by total faculty members would generated the score. 3.3 Filled Faculty Positions: Total number of faculties in position divided by sanctioned faculty positions from item no. 1. 3.4 Faculty Qualifications: Percentage of faculties having PhD+ Percentage of faculties having master degree in Education divided by 200. Faculty having master degree and PhD degree are equally weighted for this section. 3.5 Faculty Development: Faculty members getting in-service training meant for faculty development would be credit this section. The total number of faculty members get training under any faculty development training programme (either in-house or outstation) divided by total number of faculties from. Maximum assigned score to be one (1) for this dimension. Key Dimension 4: Institutional Capacity/Effectiveness 4.1 Use of Computers in Academic and Administration: Calculate the average of scores by assigning 1 for ÝES’ and zero for ‘No’. 4.2GrievanceRedressal: Calculate the scores by assigning 1 for ÝES’ and zero for ‘No’. 4.3Budget Utilization: Ratio of total amount spent divided by total amount approved from item number 32.

Baseline Report TEIDI, Bihar Page 96
4.4Financial Management Staff: Ratio of staff in position is to sectioned position of financial management staff from item number 34(a). Maximum score 1(One). 4.5ICT in Accounting: Availability of computer based accounting (score 0.5) from item no. 34(e) and working on online system of accounting from item no. 34(e) (Score 1). 4.6Website: Average of availability of website (maximum Score 1) and updated website at least in a fortnight (maximum Score 1). 4.7 Filled in position of non-teaching staffs:Total number of non-teaching staffs in position divided by sanctioned non-teaching staff positions from item no. 1(2).

Baseline Report TEIDI, Bihar Page 97
Weightage and Index Calculation:
Principal
Dimension
Indicators Indicat
or
Weight
Dimensi
on
Weight
Infrastructure 1.1 Condition of building 25%
35%
1.2 Availability of toilet facilities 20%
1.3 Safety and environment-friendliness 10%
1.4 ICT Facilities 10%
1.5 Availability of Computers for Training 15%
1.6 Availability of Alternate Source of
Energy
20%
Equity 2.1 Toilet for Females 60% 15%
2.2 Toilets for Physically Handicapped 40%
Academic 3.1 Training/Material development 15%
35%
3.2 Research Activities 25%
3.3 Share of filled faculty positions 20%
3.4 Faculty qualifications 20%
3.5 Faculty development 20%
Institutional
Capacity
/Effectiveness
4.1 Use of computers in academic &
administration
20%
15%
4.2 Grievance redressal mechanisms 10%
4.3 Budget utilization 20%
4.4 Availability of financial management
staff
10%
4.5 ICT in Accounting 20%
4.6 Website of TEI and its updation 10%
4.7 Filled in position of Non-teaching Staff 10%

Baseline Report TEIDI, Bihar Page 98
ANNEXURE -5 INDEX GENERATION FRAMEWORK FOR DIs
Key Dimension 1: Infrastructure
1.1 Building Conditions: Calculate average of 27 building conditions (rated from 0 to 4) from Item number 1 (1) to Item numbers 1 (27). Further the average is converted on 0 to 1 scale.
1.2 Toilet Facilities: Calculate the total no. of toilets from item no. 2(a) and 2(b)(male and female) and divided by 10 (byassuming that each center has at least 100 capacity and one toilet for 10 trainees).
1.3 Safety & Environmental Friendliness: Average of item no. 5(a) to 5(f) to be calculated. 1(one) for yes and 0(Zero) for No would be reassigned.
1.4 Availability of ICT Equipment: Total no. of desktops and laptops would be divided by 30 (by assuming that at least 30 computers are required at TEI). Maximum one would be credited under this dimension.
1.5 Availability of Electricity: available electricity hours (by all means including renewable source of energy) to be divided by 24.
Key Dimension 2: Equity 2.1 Gender Composition at Admission: Ratio of no. of women admitted to total number of trainees admitted from item no. 9(c). 2.2 Female Dropout: Female dropout percentage to be divided by male dropout percentage from item number 14(a) and 14(b) 2.3 Reserved Category admission: Ratio of no. of reserved categories admission to half of total number of seats available/intake capacity 9(d). 2.4 Scholarship: Total number of trainees who get scholarship divided by total number of candidate who applied for the scholarship from item no. 10. Key Dimension 3: Academic 3.1 Capacity Utilization: total male and female trainees enrolled to the TEI divided by total capacity of the institute including both years from item no. 12. 3.2 Trainee Performance:Average percentage of male and female results in final examination divided by 100 from item no. 15(a). 3.3 Filled Faculty Positions: Total number of faculties in position divided by sanctioned faculty positions from item no. 16(a) and 16(c). 3.4 Faculty Qualifications: Percentage of faculties having PhD+ Percentage of faculties having master degree in Education divided by 200 from item number 17(1)(c). Faculty having master degree and PhD degree are equally weighted for this section. 3.5 Faculty Development:Faculty members getting in-service training meant for faculty development would be credit this section. The total number of faculty members get training under any faculty development training programme (either in-house or outstation) divided by total number of faculties from. Maximum assigned score to be one(1) for this dimension. Key Dimension 4: Institutional Capacity/Effectiveness

Baseline Report TEIDI, Bihar Page 99
4.1 Non-Teaching Staff in Position: Total number of non-teaching staffs in position divided by sanctioned non-teaching staff positions from item no. 27. 4.2 Use of Computers in Academic and Administration: Calculate the average of scores of item numbers 30(1) to 30(5) by reassigning 1 for ÝES’ and zero for ‘No’. 4.3 GrievanceRedressal: Calculate the scores of item numbers 33(a) by reassigning 1 for ÝES’ and zero for ‘No’. 4.4 Academic Planning and Review Group: Calculate the average scores of item numbers 35(a) [by reassigning 1 for ÝES’ and zero for ‘No’] and score calculated by 35(b) [by dividing the numbers of meeting held by 12. Maximum score 1]. 4.5 Budget Utilization: Ratio of total amount spent divided by total amount approved from item number 36 4.6 Financial Management Staff: Ratio of staff in position is to sectioned position of financial management staff from item number 37(a). 4.7 ICT in Accounting:Average of availability of computer based accounting (maximum Score 1) from item no. 30(3) and working on online system of accounting from item no. 37(f) (maximum Score 1). 4.8 Website of TEI: Average of availability of website (maximum Score 1) and updated website at least in a fortnight (maximum Score 1).

Baseline Report TEIDI, Bihar Page 100
Weightage and Index Calculation:
Principal Dimension Indicators Indicator Weight
Dimension Weight
Infrastructure
1.1 Condition and availability of building 25%
35%
1.2 Availability of toilet facilities 20%
1.3 Safety and environment-friendliness 10%
1.4 Availability of ICT equipment 25%
1.5 Availability of electricity (hours during work day)
20%
Equity
2.1 Gender composition at admission 40%
15%
2.2 Dropout rates of women against men 20%
2.3 Share of underprivileged candidates admitted in courses
30%
2.4 Share of students receiving scholarship 10%
Academic
3.1 Capacity utilization 15%
35%
3.2 Performance of graduating candidates 25%
3.3 Share of filled faculty positions 20%
3.4 Faculty qualifications 20%
3.5 Faculty development 20%
Institutional Capacity /Effectiveness
4.1 Share of filled non-teaching staff positions 10%
15%
4.2 Use of computers in academic & administration
20%
4.3 Grievance redressal mechanisms 10%
4.4 Existence of Academic Planning and Review Group or Committee
10%
4.5 Budget utilization 20%
4.6 Availability of financial management staff 10%
4.7 ICT in Accounting 10%
4.8 Website of TEI and its updation 10%

Baseline Report TEIDI, Bihar Page 101
ANNEXURE -6 INDEX GENERATION FOR BRC
Key Dimension 1: Infrastructure
1.1 Training Hall: Number of Training halls would contribute to this section. It is assumed that four training rooms to be available at BRC. Maximum Sore is One (1).
1.2 Toilet Facilities: Calculate the total no. of toilets from item no. 2(a) and 2(b) (male and female) and divided by 10 (by assuming that each center has at least 10 toilets).
1.3 Safety & Environmental Friendliness: Average of item no. 3(a) to 3(f) to be calculated. 1(one) for yes and 0(Zero) for No would be reassigned.
1.4 Availability of ICT Equipment: Total no. of desktops and laptops would be divided by 30 (by assuming that at least 15 computers are required at each BRC). Maximum one would be credited under this dimension as per item no. 4.
Key Dimension 2: Equity 2.1 Gender Composition: Ratio of no. of women participated to total number of trainees admitted from item no. 9(c). (by assuming that each center has at least 50 percentage female participation) 2.2 Toilet facilities for Physically Challenged Trainees:Get the scores of item numbers 2(d) by reassigning 1 for ÝES’ or available toilets for physically challenged and zero for ‘No’. Key Dimension 3: Academic 3.1 Academic Interaction: Average of a), b) and c) would be calculated a) Teacher taught ratio at BRC would contribute this section and calculate by ratio multiplied by 10 (assuming 1:10 is standard teacher taught ratio) b) Interaction with stand-alone machines or computers c) Interaction with stand-alone machines or computers 3.2 Resource Persons in Position:Ratio of present Resource Persons in position to sanctioned positions of resource persons from item no. 14. Key Dimension 4: Institutional Capacity/Effectiveness 4.1 Computers in Administration: Calculate the average of scores of item numbers 16(1), 16(2) and 17(1)(c) by reassigning 1 for ÝES’ and zero for ‘No’. 4.2Spent Amount: Calculate the ratio of total amount spent is to total amount approved from item numbers 19. 4.3Financial Management Staff: Ratio of staff in position is to sanctioned position of financial management staff from item number 20.
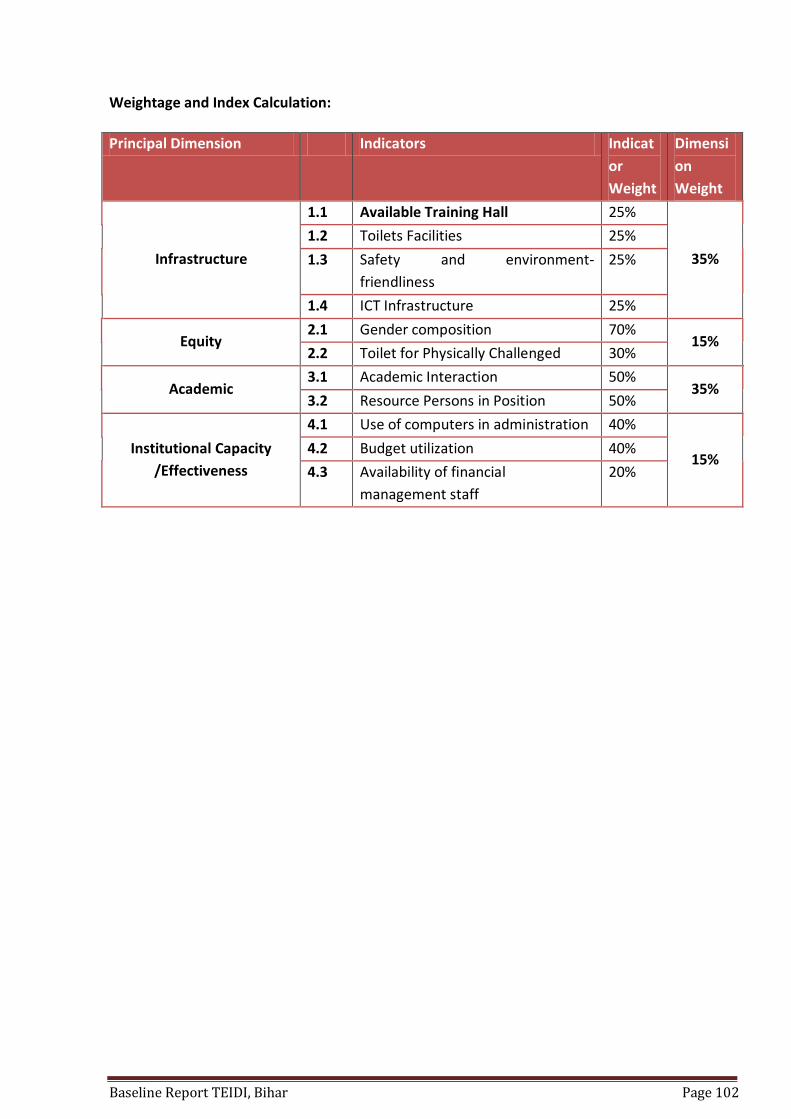
Baseline Report TEIDI, Bihar Page 102
Weightage and Index Calculation:
Principal Dimension Indicators Indicat
or
Weight
Dimensi
on
Weight
Infrastructure
1.1 Available Training Hall 25%
35%
1.2 Toilets Facilities 25%
1.3 Safety and environment-
friendliness
25%
1.4 ICT Infrastructure 25%
Equity 2.1 Gender composition 70%
15% 2.2 Toilet for Physically Challenged 30%
Academic 3.1 Academic Interaction 50%
35% 3.2 Resource Persons in Position 50%
Institutional Capacity
/Effectiveness
4.1 Use of computers in administration 40%
15% 4.2 Budget utilization 40%
4.3 Availability of financial
management staff
20%

Baseline Report TEIDI, Bihar Page 103
ANNEXURE -7 INFRASTRUCTURE BASELINE DIs
Code Name_Address Building Condition
Toilet Safety ICT Electricity Infrastructure Index
32101 DIET Sheikhpura 0.05 0.00 0.00 0.00 0.63 0.14 19101 DIET Lakhisarai 0.07 0.00 0.00 0.20 0.42 0.15
22101 DIET Poorabsarai, Munger 0.21 0.05 0.00 0.00 0.75 0.21 20201 PTEC Manhara Sukhasan
Madhepura 0.32 0.05 0.00 0.40 0.67 0.32
6201 PTEC Nagarpada, Bhagalpur 0.20 0.05 0.00 0.00 0.00 0.06 4101 DIET Banka 0.13 0.10 0.00 0.03 0.58 0.18 6101 DIET Bhagalpur 0.51 0.40 0.17 0.37 0.42 0.40 6202 PTEC Phulwaria 0.16 0.20 0.00 0.00 0.00 0.08
22201 PTEC H Kharagpur 0.22 0.00 0.00 0.00 0.00 0.06 20101 DIET Madhepura 0.16 0.10 0.00 0.20 0.83 0.28
5101 DIET SHAHPUR, BEGUSARAI 0.09 0.10 0.17 0.17 0.15 0.13 9101 DIET KILAGHAT,
DARBHANGA 0.08 0.10 0.00 0.23 0.67 0.23
5201 PTEC BSHNUPUR, BEGUSARAI
0.05 0.00 0.17 0.30 0.08 0.12
9301 PTEC/BITE MADHOPATTI, DARBHANGA
0.05 0.10 0.00 0.03 0.50 0.14
10101 DIET CHHATAUNI, MOTIHARI, EAST CHAMPARAN
0.06 0.20 0.17 0.23 0.67 0.26
10301 BITE DARIYAPUR, EAST CHAMPARAN
0.56 0.50 0.00 0.37 0.08 0.35
17101 DIET RAMGANJ SANSARPUR, KHAGARIA
0.06 0.20 0.17 0.13 0.63 0.23
21101 DIET NARAR, KALVAHI, MADHUBANI
0.01 0.00 0.00 0.10 0.13 0.05
21201 PTEC GHOGHARDIHA, MADHUBANI
0.01 0.00 0.00 0.00 0.08 0.02
25101 DIET NAWADA 0.01 0.00 0.17 0.27 0.96 0.28 30101 DIET PUSA, SAMASTIPUR 0.23 0.10 0.17 0.27 1.00 0.36 30201 PTEC RAMPUR JALALPUR,
SAMASTIPUR 0.06 0.35 0.00 0.43 0.58 0.31
38101 DIET KUMARBAGH, WEST CHAMPARAN
0.18 0.60 0.00 0.23 0.33 0.29
38301 BITE BALMIKI NAGAR, WEST CHAMPARAN
0.23 0.10 0.17 0.27 1.00 0.36
33101 DIET SHEOHAR 0.08 0.10 0.00 0.10 0.42 0.15 11101 DIET GAYA 0.22 0.30 0.00 0.23 0.75 0.32 23101 DIET Muzaffarpur 0.27 0.10 0.00 0.33 0.63 0.30 37201 DIET Vaishali 0.31 0.20 0.00 0.40 0.63 0.34 34101 DIET Dumra, Sitamadhi 0.14 0.40 0.00 0.33 0.17 0.23

Baseline Report TEIDI, Bihar Page 104
37201 PTEC Sorhattha, Vaishali 0.13 0.00 0.00 0.00 0.13 0.06 23203 PTEC Chandwara 0.15 0.30 0.17 0.13 0.83 0.31 23202 PTEC Pokhraira, MuzaffarPur 0.19 0.05 0.17 0.37 0.83 0.33 23201 PTEC Patahi, Muzaffarpur 0.14 0.25 0.17 0.53 0.50 0.33 11201 PTEC Sherghati, Gaya 0.19 0.30 0.00 0.00 0.29 0.16 16101 DIET TIKKAPATTI, KATIHAR 0.16 0.20 0.17 0.20 0.00 0.15 24101 DIET NOORSARAI, NALANDA 0.09 0.20 0.00 0.33 0.25 0.20
18101 DIET KISHANGANJ 0.21 0.40 0.00 0.07 0.63 0.27 27101 DIET PURNEA 0.07 0.10 0.00 0.00 0.63 0.16
163001 Mahila Primary Teachers Training College, Musapur, Katihar 0.23 0.10 0.00 0.03 0.00 0.09
26204 PTEC Mokama, Patna 0.38 0.10 0.17 0.00 0.00 0.13 26202 PTEC Masaurhi, Patna 0.14 0.10 0.00 0.33 0.50 0.24 26203 BNR Training College, Gulzarbagh, Patna 0.25 0.10 0.00 0.37 0.83 0.34 26101 DIET BIKRAM, PATNA 0.24 0.10 0.33 0.33 0.50 0.30
1101 DIET FORBESGANJ, ARARIA 0.21 0.10 0.33 0.03 0.67 0.25 26205 PTEC MAHENDRU, PATNA 0.06 0.35 0.00 0.47 0.83 0.37 26202 PTEC, BARH, PATNA 0.15 0.20 0.00 0.33 0.83 0.33 15101 DIET Mohania 0.19 0.15 0.00 0.10 0.50 0.20 28101 DIET Fazalganj 0.15 0.00 0.00 0.13 0.83 0.24
8101 DIET Buxar 0.08 0.00 0.00 0.13 0.33 0.12 12101 DIET Thawe 0.33 0.00 0.00 0.07 0.08 0.12
3101 DIET Tarar 0.22 0.00 0.00 0.10 0.50 0.18 7101 DIET Pirouta 0.45 0.00 0.00 0.13 0.25 0.20
31101 DIET, Sonepur, Saran 0.03 0.00 0.00 0.13 0.50 0.14 35101 DIET Siwan 0.36 0.35 0.00 0.10 0.63 0.31 28201 PTEC Sasaram 0.02 0.00 0.00 0.07 0.00 0.02 31201 PTEC,Bangra 0.27 0.00 0.00 0.10 0.17 0.13 35201 PTEC Siwan 0.04 0.00 0.00 0.07 0.00 0.03
3201 PTEC Shahpur 0.23 0.00 0.00 0.07 0.75 0.22 7201 PTEC Bihiya 0.10 0.00 0.00 0.13 0.33 0.13
30202 PTEC Shapur-Patori, Samastipur 0.08 0.00 0.00 0.13 0.33 0.12 Total 0.17 0.13 0.05 0.18 0.45 0.21

Baseline Report TEIDI, Bihar Page 105
ANNEXURE -8 EQUITY BASELINE OF DIs
Code Institution Gender composition
Dropouts Reservation share
Scholarship
Equity Index
32101 DIET Sheikhpura 0.22 0.00 0.44 0.00 0.22
19101 DIET Lakhisarai 0.52 1.00 0.36 1.00 0.62
22101 DIET PoorabsaraiMunger 0.30 0.00 0.60 0.00 0.30
20201 PTEC ManharaSukhasanMadhepura 0.00 0.00 0.68 0.00 0.20
6201 PTEC Nagarpada Bhagalpur 0.20 0.00 0.32 0.00 0.18
4101 DIET Banka 0.30 1.00 1.00 0.00 0.62
6101 DIET Bhagalpur 0.36 0.00 0.52 0.00 0.30
6202 PTEC Phulwaria 0.54 0.29 0.72 0.00 0.49
22201 PTEC H Kharagpur 0.00 0.00 0.08 0.00 0.02
20101 DIET Madhepura 0.22 0.18 0.32 0.00 0.22
5101 DIET SHAHPUR, BEGUSARAI 0.20 0.00 0.52 0.00 0.24
9101 DIET KILAGHAT, DARBHANGA 0.34 0.43 1.00 0.00 0.52
5201 PTEC BSHNUPUR, BEGUSARAI 0.64 0.00 0.76 0.00 0.48
9301 PTEC/BITE MADHOPATTI, DARBHANGA 0.18 0.00 1.00 0.00 0.37
10101 DIET CHHATAUNI, MOTIHARI, EAST CHAMPARAN
0.36 0.00 0.76 0.00 0.37
10301 BITE DARIYAPUR, EAST CHAMPARAN 0.02 0.00 0.28 0.00 0.09
17101 DIET RAMGANJ SANSARPUR, KHAGARIA 0.38 0.25 0.60 1.00 0.48
21101 DIET NARAR, KALVAHI, MADHUBANI 0.00 1.00 0.68 0.00 0.40
21201 PTEC GHOGHARDIHA, MADHUBANI 0.20 0.00 1.00 0.00 0.38
25101 DIET NAWADA 0.42 1.00 0.68 0.00 0.57
30101 DIET PUSA, SAMASTIPUR 0.60 0.40 1.00 0.00 0.62
30201 PTEC RAMPUR JALALPUR, SAMASTIPUR 0.36 0.00 0.58 0.00 0.32
38101 DIET KUMARBAGH, WEST CHAMPARAN 0.32 0.00 0.60 0.00 0.31
38301 BITE BALMIKI NAGAR, WEST CHAMPARAN 0.60 0.16 1.00 0.00 0.57
33101 DIET SHEOHAR 0.00 0.00 0.92 0.00 0.28
11101 DIET GAYA 0.48 0.00 1.00 0.65 0.56
23101 DIET Muzaffarpur 0.22 0.00 0.44 0.00 0.22
37201 DIET Vaishali 0.52 1.00 0.36 1.00 0.62
34101 DIET Dumra, Sitamadhi 0.00 0.00 0.68 0.00 0.20
37201 PTEC Sorhattha, Vaishali 0.10 0.00 0.72 0.00 0.26
23203 PTEC Chandwara 0.70 0.00 0.22 0.00 0.35
23202 PTEC PokhrairaMuzaffarPur 0.00 0.00 0.24 0.00 0.07
23201 PTEC Patahi,Muzaffarpur 0.00 0.00 0.08 0.00 0.02
11201 PTEC Sherghati, Gaya 0.48 0.00 0.68 0.65 0.46
16101 DIET TIKKAPATTI KATIHAR 0.22 0.00 0.72 0.00 0.30
24101 DIET NOORSARAI NALANDA 0.24 0.00 0.68 0.00 0.30
18101 DIET KISHANGANJ 0.50 0.55 0.80 0.00 0.55

Baseline Report TEIDI, Bihar Page 106
27101 DIET PURNEA 0.42 0.00 0.72 0.00 0.38
163001 Mahila Primary Teachers Training College, Musapur,Katihar
0.00 0.50 0.76 0.00 0.33
26204 PTEC Mokama,Patna 0.40 0.07 0.20 0.00 0.23
26202 PTEC Masaurhi,Patna 0.72 0.25 0.84 0.00 0.59
26203 BNR Training College,Gulzarbagh,Patna 1.00 0.00 0.76 0.00 0.63
26101 DIET BIKRAM, PATNA 0.00 0.00 0.08 0.00 0.02
1101 DIET FORBESGANJ, ARARIA 0.00 0.40 0.00 0.00 0.08
26205 PTEC MAHENDRU, PATNA 0.28 1.00 0.38 0.00 0.43
26202 PTEC, BARH, PATNA 0.60 0.00 0.16 0.00 0.29
15101 DIET Mohania 0.30 0.21 0.44 0.17 0.31
28101 DIET Fazalganj 0.36 0.00 0.60 0.00 0.32
8101 DIET Buxar 0.70 0.00 0.44 0.00 0.41
12101 DIET Thawe 0.42 0.31 0.96 1.00 0.62
3101 DIET Tarar 0.22 0.00 0.52 0.00 0.24
7101 DIET Pirouta 0.42 0.00 0.74 0.00 0.39
31101 DIET, Sonepur, Saran 0.28 0.00 1.16 0.00 0.46
35101 DIET Siwan 0.86 0.00 0.34 0.00 0.45
28201 PTEC Sasaram 0.96 0.00 1.00 0.00 0.68
31201 PTEC,Bangra 0.36 0.00 0.76 0.00 0.37
35201 PTEC Siwan 0.00 0.50 0.76 0.00 0.33
3201 PTEC Shahpur 0.40 0.07 0.20 0.00 0.23
7201 PTEC Bihiya 0.30 1.00 0.76 0.00 0.55
30202 PTEC Shapur-Patori, Samastipur 0.70 0.00 0.44 0.00 0.41
All DIETs, all PTECs and all BIETS 0.34 0.19 0.60 0.09 0.36
A

Baseline Report TEIDI, Bihar Page 107
ANNEXCURE-9 ACADEMIC BASELINE OF DIs
Code
Name_Address Capacity utilisation
Trainee Performance
filled faculty position
Faculty qualification
Faculty development
Academic Index
32101 DIET Sheikhpura 0.38 0.00 0.16 0.50 0.20 0.23
19101 DIET Lakhisarai 0.76 0.00 0.21 0.63 0.80 0.44
22101 DIET PoorabsaraiMunger 0.54 0.00 0.21 0.50 0.80 0.38
20201 PTEC ManharaSukhasanMadhepura 0.40 1.00 0.50 0.50 0.00 0.51
6201 PTEC Nagarpada Bhagalpur 0.42 1.00 0.30 0.33 0.24 0.49
4101 DIET Banka 1.00 1.00 0.11 0.50 0.25 0.57
6101 DIET Bhagalpur 0.56 1.00 0.16 0.50 0.00 0.47
6202 PTEC Phulwaria 1.00 1.00 0.30 0.33 0.00 0.53
22201 PTEC H Kharagpur 0.04 0.00 0.40 0.25 0.00 0.14
20101 DIET Madhepura 1.00 0.49 0.26 0.60 0.00 0.44
5101 DIET SHAHPUR, BEGUSARAI 1.00 1.00 0.30 0.50 0.00 0.56
9101 DIET KILAGHAT, DARBHANGA 1.00 0.98 0.26 0.60 0.50 0.67
5201 PTEC BSHNUPUR, BEGUSARAI 1.00 1.00 0.26 0.50 0.00 0.55
9301 PTEC/BITE MADHOPATTI, DARBHANGA 1.00 0.50 0.20 0.30 0.00 0.37
10101 DIET CHHATAUNI, MOTIHARI, EAST CHAMPARAN
1.00 0.00 0.26 0.50 0.70 0.44
10301 BITE DARIYAPUR, EAST CHAMPARAN 0.74 0.00 0.47 0.50 0.20 0.35
17101 DIET RAMGANJ SANSARPUR, KHAGARIA 1.00 1.00 0.21 0.50 0.00 0.54
21101 DIET NARAR, KALVAHI, MADHUBANI 0.22 0.44 0.21 0.50 0.00 0.29
21201 PTEC GHOGHARDIHA, MADHUBANI 0.32 0.42 0.32 0.50 0.00 0.31
25101 DIET NAWADA 0.15 0.93 0.37 0.58 0.00 0.44
30101 DIET PUSA, SAMASTIPUR 1.00 0.94 0.26 0.50 0.00 0.54
30201 PTEC RAMPUR JALALPUR, SAMASTIPUR 1.00 1.00 0.70 0.50 0.00 0.64
38101 DIET KUMARBAGH, WEST CHAMPARAN 0.32 0.43 0.26 0.60 0.36 0.40
38301 BITE BALMIKI NAGAR, WEST CHAMPARAN 1.00 0.90 0.26 0.50 0.00 0.53
33101 DIET SHEOHAR 1.00 0.50 0.21 0.60 0.00 0.44
11101 DIET GAYA 1.00 0.49 0.50 0.60 1.00 0.69
23101 DIET Muzaffarpur 0.38 0.00 0.32 0.67 0.00 0.25
37201 DIET Vaishali 0.76 0.00 0.32 0.75 0.00 0.33
34101 DIET Dumra, Sitamadhi 0.40 1.00 0.21 0.50 1.00 0.65
37201 PTEC Sorhattha, Vaishali 0.18 0.50 0.50 0.60 0.00 0.37
23203 PTEC Chandwara 0.00 0.47 0.36 0.50 0.00 0.29

Baseline Report TEIDI, Bihar Page 108
23202 PTEC PokhrairaMuzaffarPur 0.54 0.12 0.44 0.23 1.00 0.44
23201 PTEC Patahi,Muzaffarpur 0.04 0.00 0.82 0.43 0.00 0.26
11201 PTEC Sherghati, Gaya 0.75 0.50 0.30 0.55 0.00 0.41
16101 DIET TIKKAPATTI KATIHAR 1.00 0.16 0.33 0.40 0.00 0.34
24101 DIET NOORSARAI NALANDA 0.63 0.00 0.50 0.50 0.50 0.39
18101 DIET KISHANGANJ 1.00 0.00 0.16 0.08 0.00 0.20
27101 DIET PURNEA 0.76 0.00 0.05 0.25 0.00 0.17
163001 Mahila Primary Teachers Training College, Musapur,Katihar
1.00 0.22 0.40 0.25 0.00 0.34
26204 PTEC Mokama,Patna 0.24 0.50 0.40 0.38 0.00 0.32
26202 PTEC Masaurhi,Patna 1.00 0.49 0.40 0.40 0.00 0.43
26203 BNR Training College,Gulzarbagh,Patna 1.00 0.50 0.19 0.50 0.00 0.41
26101 DIET BIKRAM, PATNA 0.04 0.00 0.50 0.50 0.50 0.31
1101 DIET FORBESGANJ, ARARIA 1.00 0.00 0.16 0.50 0.00 0.28
26205 PTEC MAHENDRU, PATNA 1.00 0.50 0.05 0.50 0.00 0.39
26202 PTEC, BARH, PATNA 0.00 0.83 0.40 0.25 0.00 0.34
15101 DIET Mohania 1.00 1.00 0.21 0.50 1.00 0.74
28101 DIET Fazalganj 1.00 1.00 0.21 0.50 0.00 0.54
8101 DIET Buxar 1.00 1.00 0.26 0.50 0.00 0.55
12101 DIET Thawe 1.00 1.00 0.16 0.67 0.00 0.56
3101 DIET Tarar 1.00 1.00 0.26 0.50 0.00 0.55
7101 DIET Pirouta 1.00 1.00 0.26 0.60 0.00 0.57
31101 DIET, Sonepur, Saran 1.00 1.00 0.60 0.58 0.00 0.64
35101 DIET Siwan 0.93 1.00 0.16 0.50 0.00 0.52
28201 PTEC Sasaram 1.00 1.00 0.30 0.42 0.00 0.54
31201 PTEC,Bangra 1.00 1.00 0.40 0.40 0.00 0.56
35201 PTEC Siwan 1.00 0.22 0.40 0.38 0.00 0.36
3201 PTEC Shahpur 0.24 0.50 0.30 0.33 0.00 0.29
7201 PTEC Bihiya 1.00 1.00 0.50 0.35 0.00 0.57
30202 PTEC Shapur-Patori, Samastipur 1.00 1.00 0.60 0.58 0.00 0.64
All DIETs, all PTECs all BIETs 0.73 0.57 0.32 0.47 0.15 0.44
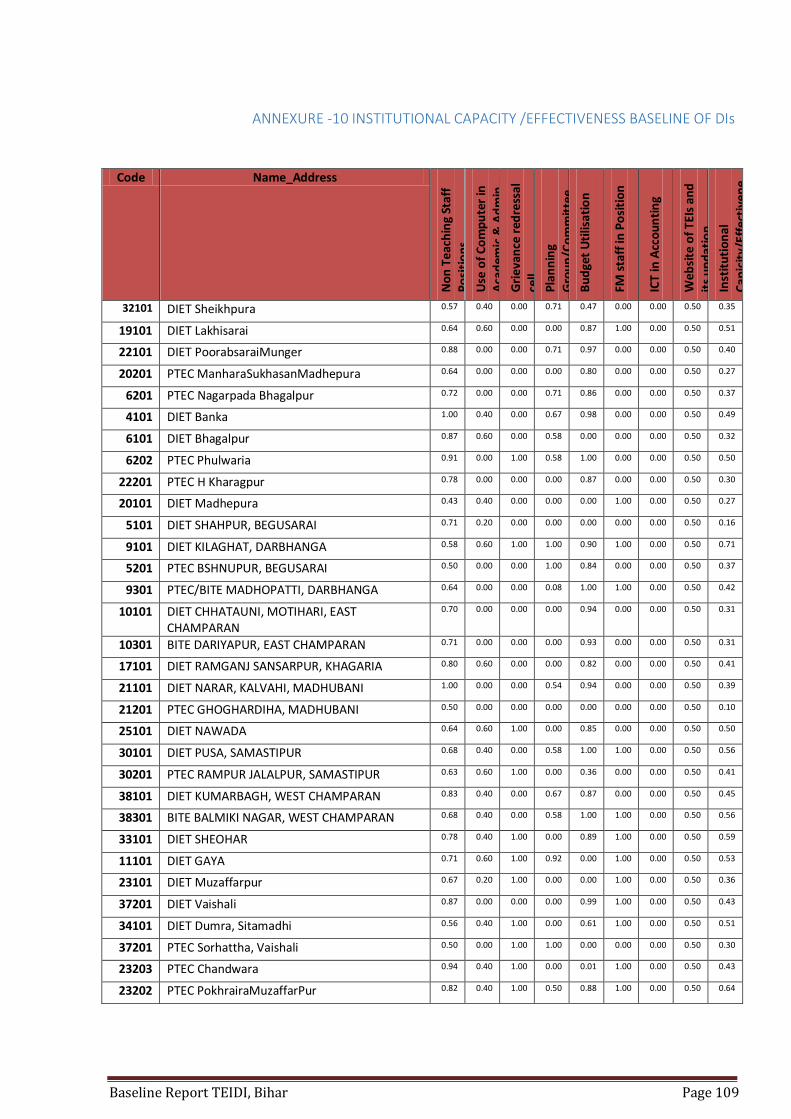
Baseline Report TEIDI, Bihar Page 109
ANNEXURE -10 INSTITUTIONAL CAPACITY /EFFECTIVENESS BASELINE OF DIs
Code Name_Address
No
n T
eac
hin
g St
aff
Po
siti
on
s
Use
of
Co
mp
ute
r in
A
cad
emic
& A
dm
in
Gri
eva
nce
red
ress
al
cell
Pla
nn
ing
Gro
up
/Co
mm
itte
e
Bu
dge
t U
tilis
atio
n
FM s
taff
in P
osi
tio
n
ICT
in A
cco
un
tin
g
Web
site
of
TEIs
an
d
its
up
dat
ion
Inst
itu
tio
nal
C
apic
ity/
Effe
ctiv
en
e
ss In
de
x Sc
ore
32101 DIET Sheikhpura 0.57 0.40 0.00 0.71 0.47 0.00 0.00 0.50 0.35
19101 DIET Lakhisarai 0.64 0.60 0.00 0.00 0.87 1.00 0.00 0.50 0.51
22101 DIET PoorabsaraiMunger 0.88 0.00 0.00 0.71 0.97 0.00 0.00 0.50 0.40
20201 PTEC ManharaSukhasanMadhepura 0.64 0.00 0.00 0.00 0.80 0.00 0.00 0.50 0.27
6201 PTEC Nagarpada Bhagalpur 0.72 0.00 0.00 0.71 0.86 0.00 0.00 0.50 0.37
4101 DIET Banka 1.00 0.40 0.00 0.67 0.98 0.00 0.00 0.50 0.49
6101 DIET Bhagalpur 0.87 0.60 0.00 0.58 0.00 0.00 0.00 0.50 0.32
6202 PTEC Phulwaria 0.91 0.00 1.00 0.58 1.00 0.00 0.00 0.50 0.50
22201 PTEC H Kharagpur 0.78 0.00 0.00 0.00 0.87 0.00 0.00 0.50 0.30
20101 DIET Madhepura 0.43 0.40 0.00 0.00 0.00 1.00 0.00 0.50 0.27
5101 DIET SHAHPUR, BEGUSARAI 0.71 0.20 0.00 0.00 0.00 0.00 0.00 0.50 0.16
9101 DIET KILAGHAT, DARBHANGA 0.58 0.60 1.00 1.00 0.90 1.00 0.00 0.50 0.71
5201 PTEC BSHNUPUR, BEGUSARAI 0.50 0.00 0.00 1.00 0.84 0.00 0.00 0.50 0.37
9301 PTEC/BITE MADHOPATTI, DARBHANGA 0.64 0.00 0.00 0.08 1.00 1.00 0.00 0.50 0.42
10101 DIET CHHATAUNI, MOTIHARI, EAST CHAMPARAN
0.70 0.00 0.00 0.00 0.94 0.00 0.00 0.50 0.31
10301 BITE DARIYAPUR, EAST CHAMPARAN 0.71 0.00 0.00 0.00 0.93 0.00 0.00 0.50 0.31
17101 DIET RAMGANJ SANSARPUR, KHAGARIA 0.80 0.60 0.00 0.00 0.82 0.00 0.00 0.50 0.41
21101 DIET NARAR, KALVAHI, MADHUBANI 1.00 0.00 0.00 0.54 0.94 0.00 0.00 0.50 0.39
21201 PTEC GHOGHARDIHA, MADHUBANI 0.50 0.00 0.00 0.00 0.00 0.00 0.00 0.50 0.10
25101 DIET NAWADA 0.64 0.60 1.00 0.00 0.85 0.00 0.00 0.50 0.50
30101 DIET PUSA, SAMASTIPUR 0.68 0.40 0.00 0.58 1.00 1.00 0.00 0.50 0.56
30201 PTEC RAMPUR JALALPUR, SAMASTIPUR 0.63 0.60 1.00 0.00 0.36 0.00 0.00 0.50 0.41
38101 DIET KUMARBAGH, WEST CHAMPARAN 0.83 0.40 0.00 0.67 0.87 0.00 0.00 0.50 0.45
38301 BITE BALMIKI NAGAR, WEST CHAMPARAN 0.68 0.40 0.00 0.58 1.00 1.00 0.00 0.50 0.56
33101 DIET SHEOHAR 0.78 0.40 1.00 0.00 0.89 1.00 0.00 0.50 0.59
11101 DIET GAYA 0.71 0.60 1.00 0.92 0.00 1.00 0.00 0.50 0.53
23101 DIET Muzaffarpur 0.67 0.20 1.00 0.00 0.00 1.00 0.00 0.50 0.36
37201 DIET Vaishali 0.87 0.00 0.00 0.00 0.99 1.00 0.00 0.50 0.43
34101 DIET Dumra, Sitamadhi 0.56 0.40 1.00 0.00 0.61 1.00 0.00 0.50 0.51
37201 PTEC Sorhattha, Vaishali 0.50 0.00 1.00 1.00 0.00 0.00 0.00 0.50 0.30
23203 PTEC Chandwara 0.94 0.40 1.00 0.00 0.01 1.00 0.00 0.50 0.43
23202 PTEC PokhrairaMuzaffarPur 0.82 0.40 1.00 0.50 0.88 1.00 0.00 0.50 0.64

Baseline Report TEIDI, Bihar Page 110
23201 PTEC Patahi,Muzaffarpur 0.67 0.20 1.00 0.00 0.91 1.00 0.00 0.50 0.54
11201 PTEC Sherghati, Gaya 0.70 0.00 1.00 0.00 0.00 1.00 0.00 0.50 0.32
16101 DIET TIKKAPATTI KATIHAR 0.90 0.40 1.00 0.58 0.58 1.00 0.00 0.50 0.59
24101 DIET NOORSARAI NALANDA 0.93 0.40 1.00 0.00 0.00 0.00 0.00 0.50 0.32
18101 DIET KISHANGANJ 1.00 0.40 1.00 0.00 0.94 0.00 0.00 0.50 0.52
27101 DIET PURNEA 0.73 0.40 1.00 0.00 0.79 0.00 0.00 0.50 0.46
163001 Mahila Primary Teachers Training College, Musapur,Katihar
0.71 0.40 1.00 0.58 0.74 0.00 0.00 0.50 0.51
26204 PTEC Mokama,Patna 0.43 0.40 0.00 0.67 0.48 0.00 0.00 0.50 0.34
26202 PTEC Masaurhi,Patna 0.67 0.60 0.00 0.67 0.78 1.00 0.00 0.50 0.56
26203 BNR Training College,Gulzarbagh,Patna 0.75 0.20 0.00 0.00 0.91 0.00 0.00 0.50 0.35
26101 DIET BIKRAM, PATNA 0.54 0.60 1.00 0.75 0.96 1.00 0.00 0.50 0.69
1101 DIET FORBESGANJ, ARARIA 0.93 0.20 1.00 0.58 0.00 0.00 0.00 0.50 0.34
26205 PTEC MAHENDRU, PATNA 0.70 0.20 0.00 0.58 0.96 1.00 0.00 0.50 0.51
26202 PTEC, BARH, PATNA 0.78 0.40 1.00 0.08 0.99 1.00 0.00 0.50 0.61
15101 DIET Mohania 0.71 0.40 0.00 0.00 0.79 0.00 0.00 0.50 0.36
28101 DIET Fazalganj 0.50 0.00 0.00 0.00 1.00 0.00 0.00 0.50 0.30
8101 DIET Buxar 0.83 0.20 0.00 0.00 0.00 0.00 0.00 0.50 0.17
12101 DIET Thawe 1.00 0.40 0.00 0.00 1.00 0.00 0.00 0.50 0.43
3101 DIET Tarar 0.88 0.20 0.00 0.00 0.79 0.00 0.00 0.50 0.33
7101 DIET Pirouta 0.67 0.00 0.00 0.00 0.00 0.00 0.00 0.50 0.12
31101 DIET, Sonepur, Saran 1.00 0.00 0.00 0.00 0.00 0.00 0.00 0.50 0.15
35101 DIET Siwan 0.71 0.00 0.00 0.00 1.00 0.00 0.00 0.50 0.32
28201 PTEC Sasaram 0.83 0.00 0.00 0.00 0.00 0.00 0.00 0.50 0.13
31201 PTEC,Bangra 0.60 0.00 0.00 0.00 0.99 0.00 0.00 0.50 0.31
35201 PTEC Siwan 0.50 0.20 0.00 0.00 0.63 0.00 0.00 0.50 0.27
3201 PTEC Shahpur 0.50 0.00 0.00 0.00 1.00 0.00 0.00 0.50 0.30
7201 PTEC Bihiya 0.83 0.00 0.00 0.00 0.00 0.00 0.00 0.50 0.13
30202 PTEC Shapur-Patori, Samastipur 0.83 0.20 0.00 0.00 0.00 0.00 0.00 0.50 0.17
0.73 0.25 0.35 0.26 0.61 0.33 0.00 0.50 0.39