Teacher Compensation Review Board Report to the Governor ... Teacher... · science, high school...
99
Teacher Compensation Review Board Report to the Governor and the Legislature September 4th, 2018
-
Upload
truongkhue -
Category
Documents
-
view
217 -
download
0
Transcript of Teacher Compensation Review Board Report to the Governor ... Teacher... · science, high school...

Teacher Compensation Review Board
Report to the Governor and the Legislature
September 4th 2018
DEPR15669
Rectangle
1
South Dakota Teacher Compensation Review Board 2018 Report
Background In 2015 Governor Dennis Daugaard convened the Blue Ribbon Task Force on Teachers and Students The Blue Ribbon Task Force was charged to ldquoreevaluate the current funding formula collect and analyze data engage with stakeholders and seek public inputrdquo
The twenty-six member task force was co-chaired by Senator Deb Soholt of Sioux Falls and Representative Jacqueline Sly of Rapid City Over the course of the year the task force held public meetings to seek public feedback consider data and make recommendations The task forcersquos final report which was issued on November 11 2015 made numerous recommendations relating to the funding formula and to teacher salaries Based on those recommendations Governor Daugaard proposed and the 2016 State Legislature passed three pieces of legislation House Bill 1182 Senate Bill 131 and Senate Bill 133
Among the task forcersquos recommendations was the creation of the Teacher Compensation Review Board The task force was concerned that its work not be a one-time event but that state policymakers continue to periodically consider the statersquos teacher salaries as compared to surrounding states This recommendation was included in Senate Bill 131 and codified at SDCL 1-45-39 That statute reads
There is hereby created the Teacher Compensation Review Board within the Department of Education The board shall review teacher compensation including comparable wage indexes in surrounding states at the completion of every three school years The board will report its findings to the Governor and the Legislature no later than September 30 2018 and by September thirtieth in every third year thereafter
The initial appointment of the members to the board shall be made no later than March 1 2018 The members shall serve a term of three years
The board shall consist of nine members to be appointed as follows
(1) Three members of the South Dakota Senate appointed by the president pro tempore of theSenate no more than two of whom may be from the same political party
(2) Three members of the South Dakota House of Representatives appointed by the speaker of theHouse of Representatives no more than two of whom may be from the same political party and
(3) Three members appointed by the Governor
Pursuant to that statute in February 2018 the following appointments were made to the Teacher Compensation Review Board
bull Senate President Pro Tempore Brock Greenfield appointedo Senator Jim Bolin (R-Canton)o Senator Troy Heinert (D-Mission)o Senator Deb Soholt (R-Sioux Falls)
2
bull Speaker of the House Mark Mickelson appointedo Representative Julie Bartling (D-Burke)o Representative Tom Holmes (R-Sioux Falls)o Representative David Lust (R-Rapid City)
bull Governor Daugaard appointedo Dr Becky Guffin the superintendent of schools in the Aberdeen School Districto Tony Venhuizen the governorrsquos chief of staffo Don Kirkegaard the secretary of education Kirkegaard resigned from the Board in July
2018 and Governor Daugaard appointed Dr Kelly Glodt the superintendent of schoolsin the Pierre School District to replace him
The Board met on June 20 2018 in Pierre At that meeting Senator Jim Bolin was elected chair and Representative Julie Bartling was elected vice chair A second meeting was held on August 29 2018 in Pierre and at that meeting this report was adopted with instructions that it be delivered to Governor Daugaard and to the Legislative Research Council no later than September 30 2018 pursuant to the statute
Presentations At the June 20 2018 meeting the Board considered four presentations which are attached to this report and briefly summarized below
National Teacher Workforce Pipeline Data ndash Dr Richard Ingersoll Dr Ingersoll had presented to the Blue Ribbon Task Force in 2015 and offered his presentation on ldquoWhy schools have difficulty staffing their classrooms with qualified teachersrdquo His report is based on national data
Dr Ingersollrsquos report found that the areas of teaching with the greatest hiring difficulties are mathematics science and special education Fifty-six percent of newly hired teachers in public school systems come from the ldquoreserve poolrdquo of qualified teachers rather than newly qualified teachers entering the profession
Turnover is a major issue in the teaching profession Based on 2003 data teaching has higher turnover than other professions including attorneys architects and nurses and the turnover rate is even slightly higher than that of police officers In the 2011-12 school year schools hired 343955 new teachers at the beginning of the year only to have 531340 depart at the end of the year Beginning teachers leave at the highest rates with 23 percent of teachers leaving the profession after two years or less
Job dissatisfaction is the most common reason that teachers depart Dr Ingersollrsquos study found that a number of workplace-related factors such as accountability and testing administration facilities and resources and student discipline all were sited more frequently than poor salaries as a reason for teacher to depart He noted however that his report was based on national data and that in South Dakota where salaries were unusually low this could be a more prevalent factor
3
Finally Dr Ingersollrsquos report found that efforts to recruit new teachers are futile if not paired with efforts to retain greater numbers of existing teachers For that reason he urges state and school leaders to improve retention programs such as teacher mentoring and applauded South Dakota for including a mentoring program in the Blue Ribbon package of legislation in 2016
South Dakota Teacher Workforce Pipeline Data ndash Abby Javurek Javurek the director of the South Dakota Department of Educationrsquos Division of Accountability Systems presented ldquoTrends in Educator Preparation and Employment in South Dakotardquo The report complements the Ingersoll presentation as it is based on up-to-date data that is specific to South Dakota
Javurekrsquos report includes exceptional detail about South Dakotarsquos teaching profession The report shows the impact of the Blue Ribbon legislation on teacher salaries In the 2015-16 school year the average teacher base salary in South Dakota was $32542 In 2016-17 base salaries increased to $37627 an increase of 156 as a result of the increased funding Preliminary data for 2017-18 indicates base salaries increased slightly more to $38147
The report also looks at average salaries for all teachers In 2015-16 the average salary was $42025 This increased to $46922 in 2016-17 an increase of 117 due to the Blue Ribbon legislation Salaries increased to $47631 based on preliminary 2017-18 data
Javurekrsquos report also looks at the five-year projection for the teacher pipeline in South Dakota The report finds that by the 2022-23 school year South Dakota schools will need to hire 2320 new teachers 876 to replace retiring teachers 988 to replace those who leave the teaching profession for other reasons and 456 to accommodate projected growth in students
Fortunately the report projects that South Dakota will have 2892 new teachers enter the pipeline during that five-year period exceeding the need of 2320 new teachers That includes 1742 new teachers who will graduate from a public or private university in South Dakota and remain in the state 855 teachers who will come to South Dakota from out-of-state and 295 teachers who enter the profession through alternative certification
Unfortunately despite this progress many schools still face hiring challenges Javurekrsquos report stated that at the beginning of the 2017-18 school year 5066 teaching FTEs in school districts remained unfilled This represented teaching positions at 78 schools in 39 school districts
Finally the report includes data indicating that the hardest-to-fill teaching positions are mathematics science high school language arts special education career and technical education and English as a second language The report also includes information about steps schools are taking to address these persistent shortages
National Spending and Salary Data ndash Michael Griffith Michael Griffith school finance consultant for the Education Commission of the States prepared a report comparing South Dakota teacher salaries administrator salaries and spending data to other
4
states The report was an update of a report that Griffith had presented to the Blue Ribbon Task Force However Griffithrsquos report did not include data from 2016-17 the first year in which the Blue Ribbon Task Force legislation affected teacher salaries and is of limited value in gauging South Dakotarsquos current position in relation to other states
Teacher salary rankings ndash Tony Venhuizen Tony Venhuizen chief of staff to Governor Daugaard presented three rankings of average teacher salaries by state
bull ldquoAverage salary of teachersrdquo for 2015-16 and 2016-17 as compiled by the National EducationAssociation in its ldquoRankings of the States 2017 and Estimates of School Statistics 2018rdquo (page26)
bull ldquoNEA average teacher salaries by state adjusted by 2016 BEA regional price paritiesrdquo Thisdocument adjusts the NEA average teacher salary for 2016-17 by the Bureau of EconomicAnalysisrsquo most recent Regional Price Parities which are an index of cost of living and ranks thestates by the cost-of-living adjusted average teacher salary
bull ldquoAverage teacher salaries adjusted for regional price parities and state taxesrdquo This documentprepared by the South Dakota Governorrsquos Office of Economic Development goes a step beyondthe prior document by also adjusting average salaries by the federal and state tax burden ineach state
Venhuizen noted that the NEA annual report has always been the source for the statement that South Dakota is ldquolast in the nationrdquo in teacher pay The latest report indicates that in the 2016-17 school year South Dakota rose from 51 in the nation to 48 making this the first school year since 1985 that South Dakota did not have the lowest average teacher salaries in the nation The NEA report also states that South Dakotarsquos average salaries increased from $42025 in 2015-16 to $46979 in 2016-17 an increase of $4954 or 118 Both as a dollar amount and as a percentage this was by far the largest increase in the nation that year
The statute creating the Board states that it ldquoshall review teacher compensation including comparable wage indexes in surrounding states at the completion of every three school yearsrdquo Accordingly the Board considered South Dakotarsquos position compared to surrounding states in each of the three methodologies presented
NEA Average Teacher Salaries 2016-17 State Salary Rank Wyoming $58187 16 South Dakota is the lowest among its surrounding Minnesota $57346 20 states SD would need to increase average salaries Iowa $55647 22 by $11209 (239) to reach the top or by $5989 N Dakota $52968 27 (127) to reach the median Nebraska $52338 30 Montana $51422 32 S Dakota $46979 48
Source National Education Association
5
NEA Average Teacher Salaries 2016-17 adjusted by 2016 BEA regional price parities State Salary Rank Iowa $6169290 14 South Dakota is the lowest among its surrounding Wyoming $6017270 17 states SD would need to increase average Minnesota $5881641 23 adjusted salaries by $848905 (160) to reach the N Dakota $5788852 25 top or by $468467 (88) to reach the median Nebraska $5783204 26 Montana $5464612 33 S Dakota $5320385 38
Source National Education Association US Department of Labor Bureau of Economic Analysis
NEA Average Teacher Salaries 2016 adjusted by RPP and SD GOED tax calculator State Salary Rank Wyoming $49263 11 South Dakota is sixth among the seven surrounding Iowa $47911 14 states SD would need to increase average N Dakota $47522 16 adjusted salaries by $4667 (105) to reach the Nebraska $45708 26 top or by $1112 (25) to reach the median Minnesota $45418 27 S Dakota $44596 30 Montana $42894 38
Source National Education Association US Department of Labor Bureau of Economic Analysis South Dakota Governorrsquos Office of Economic Development
Conclusion The Board discussed all of these reports at its June meeting and continued the discussion at its August meeting and makes the following findings
bull The data demonstrates that South Dakota has made significant strides in teacher pay as a resultof the Blue Ribbon legislation
bull This progress is due to the changes in the funding formula and the increase in funding thatwere a part of the Blue Ribbon legislation
bull South Dakotarsquos teacher salaries are now more regionally competitive However South Dakotastill has one of the lowest average teacher salaries in the nation and even when adjusted forcost of living is lower than most surrounding states
bull In order to remain market-competitive South Dakota should maintain and strive to improve itsnational ranking in average teacher salaries and to reach or exceed the median of surroundingstates when adjusted for regional price parities
Appendices
Why Schools Have Difficulty Staffing Their Classrooms with Qualified Teachers
Richard M IngersollProfessor of Education and Sociology
University of Pennsylvania and
Consortium for Policy Research in Education
The Schools and Staffing Survey with the Teacher Follow-up Survey
bull Conducted by the Census Bureau for the USDepartment of Education
bull 8 Cycles over 3 Decades1987-1989 1990-1992 1993-1995 1999-20012003-2005 2007-2009 2011-13 2015-16
bull The largest source of information on teachers-Sample 55000 teachers
12000 schools-Representing all 50 states
The Source of Data
Schools with Serious Teacher Shortages(Percent Public Secondary Schools with Teaching Vacancies and with
Serious Difficulties Filling those Vacancies by Field 2015-16)
Source Ingersoll R original an analyses of 2015-16 National Teacher Principal Survey data

Schools with Serious Teacher Shortages(Percent Public Secondary Schools with Teaching Vacancies and with
Serious Difficulties Filling those Vacancies by Field 2015-16)
Source Ingersoll R original an analyses of 2015-16 National Teacher Principal Survey data

Chart1
Vacancies
Hiring Difficulties
Percent
45
17
34
16
43
14
29
10
28
9
49
6
12
4
25
3
40
3
Sheet1
The Surprising Sources of Teacher Supply (Percent of Newly Hired Teachers in the Public School System
by Supply Source 2015-16)
Newly Qualified with only Education School
degrees 25
Newly Qualified with both Education and
Noneducation Degrees 5
Newly Qualified with only Noneducation
Degrees 14
Reserve Pool 56
Attrition in Teaching is Higher Than in Many OccupationsProfessions
(Among 1993 College Grads Who Entered Selected Occupations by 1997 Percent Gone From Occupation by 2003)
79
49
49
45
30
28
23
19
19
16
14
0 20 40 60 80 100
Secretaries
Child Care Workers
Paralegals
Correctional Officers
TEACHERS
Police
Architects
Nurses
Lawyers
Engineers
Pharmacists
Source Ingersoll R amp Perda D forthcoming How High is Teacher Turnover and is it a Problem Consortium for Policy Research in Education Univ Penn
Percent
Teaching Force3385171
Schools Suffer from a Revolving Door (Numbers of Public School Teachers in Transition Into
and Out of Schools Before and After 2011-12 School Year)
Turnover531340
Hires 343955
At Beginning of School Year During School Year After End of School Year
Source Ingersoll R original analyses of 2011-13 Schools and Staffing Survey Teacher Followup Survey
Beginning Teachers Leave Teaching at Highest Rates
(Cumulative Percent Teacher Attrition by Years of Experience 1993-2003
446
391
306
23
119
0 20 40 60 80 100
Less than 5 years
Less than 4 years
Less than 3 years
Less than 2 years
Less than 1 year
PercentSource Perda D 2013 Transitions Into and Out of Teaching A Longitudinal Analysis of Early Career Teacher Turnover PhD Dissertation Univ of Penn
Job Dissatisfaction a Leading Factor Behind Teacher Turnover
(Percent Public School Teachers Reporting that Various Reasons Were Important for their Turnover 2012-13)
557
36
444
202
187
0 20 40 60 80 100
Dissatisfaction
To Pursue Other Job
Family or Personal
School Staffing Action
Retirement
PercentSource Ingersoll R original analyses of 2012-13 Teacher Followup Survey
Teachersrsquo Working Conditions are Important for Turnover
(Of Those Public School Teachers Who Moved From or Left Their School Because of Dissatisfaction Percent Reporting Particular Sources of
Dissatisfaction 2012-13)
295
295
406
472
482
501
516
579
605
0 20 40 60 80 100
Class Sizes too Large
Poor SalaryBenefits
Dissatisfied with TchingAssignment
Poor Facilities amp Resources
Student Discipline Problems
Classroom Intrusions
Lack of Influence amp Autonomy
Dissatisfied with Administration
Dissatisfied withAccountabilityTesting
PercentSource Ingersoll R original analyses of 2012-13 Teacher Followup Survey
Teacher Recruitment Alone Does Not Work
In 2010 the federal ldquo100k in 10rdquo initiative was launchedRecruitment of 10000 New MathScience Teachers per year for 10 years
But between 2012 and 2013 alonehellip
- 40600 MathScience Teachers Left Teaching Altogether
- Of them
- 8900 Retired
- 15200 reported Dissatisfaction as a major reason for leaving
- 37000 MathScience Teachers Moved to Other Schools
- Of them- Four times as many moved to affluent as to poor schools
The Leaky Bucket
Research Shows Positive Effects of Induction amp Support Program for
Beginning Teachers
bull We examined 15 best empirical studies since the 1980s
bull three sets of outcomesndash teacher commitment and retentionndash teacher classroom instructional practices ndash student achievement
bull Most of the studies reviewed showed positive impacts
Source Ingersoll amp Strong 2011 The Impact of Induction and Mentoring for Beginning Teachers A Critical Review of the Researchrdquo Review of Educational Research 81(2) 201-233
For Further Information Copies of Articles Reports etc
wwwgseupennedufacultyingersoll
rmiupennedu
Trends in Educator Preparation and Employment in South Dakota
Presented byAbby Javurek
Director Division of Accountability SystemsSouth Dakota Department of Education
06202018
Setting the Stage Purpose amp Source Data
bull Purpose Examine South Dakota teacher pipelinebull Goal Help the committee to frame SD data in the
national contextbull Data sources SD DOE data sets South Dakota
Retirement System IPEDS federal reports Boardof Regents Teacher Graduate Reports
Overview of the South Dakota Teaching Field
8500
8600
8700
8800
8900
9000
9100
9200
9300
9400
9500
9600
110000
115000
120000
125000
130000
135000
South Dakota Number of elementary and secondary school teachers and students 2005-2018
K-12 Fall StudentEnrollment
Total ClassroomTeachers (FTE)
SOURCE SD DOE Statistical Digest amp SDDOE Fall Enrollment Reports
South Dakota Distribution of Teachers by Grade Span Type 2016-17
069594
4011
1774
2529
995
018 010 Pre-Kindergarten
Kindergarten
Elementary
MSHS
High School
Special Education
Gifted
DeafHearing ampBlindVisually Impaired
Pre-Kindergarten Teachers FTE 667Kindergarten Teachers FTE 57257Elementary Teachers FTE 3864MSHS Teachers FTE 170943High School Teachers FTE 243627Special Education Teachers FTE 95838
Gifted Teachers FTE 1747DeafHearing amp BlindVisually Impaired Teachers FTE 931TOTAL 963413
bull Elementary Self-Contained is largest group of teachers (nearly 40 of all FTE)
bull If combined with Kindergarten Elementary is greater than Middle and High School combined
SOURCE SD DOE Statistical Digest
South Dakota Overview of the field2016-17 Year
SOURCE SD DOE Personnel Record Form database SD DOE Statistical Digest
Teachers on Plans of Intent
654 Number of Non-Certified Educators
640
Percent of Teachers with Advanced Degrees
347 Average District Beginning Salary
$37680
Average Years of Experience
141 Average Salary $46922
Number Students (K-12 Fall Enrollment)
132520 Student to Teacher Ratio (K-12)
141 1
Of the 963413 Teacher FTE in South Dakota
SOURCE SD DOE Statistical Digest Plans of Intent from Personnel Record Form (PRF)
South Dakota District normsTeacher average years experience
SOURCE SD DOE statistical digest 2017-18 is preliminary only
2010-11 2011-12 2012-13 2013-14 2014-15 2015-16 2016-17 2017-18Max Average years Experience (teacher) 289 298 306 247 232 241 246 222Min Average Years experience (teacher) 73 83 72 50 70 46 46 43Average Years Experience (teacher) 150 149 150 144 140 138 134 137
00
50
100
150
200
250
300
350
South Dakota District normsAdministrator average years experience
SOURCE SD DOE statistical digest 2017-18 is preliminary only
2010-11 2011-12 2012-13 2013-14 2014-15 2015-16 2016-17 2017-18Max Average Administrator experience 300 370 320 330 340 420 360 370Min Average Administrator experience 00 00 00 00 00 00 00 00Average Administrator experience 116 118 117 118 115 113 113 119
00
50
100
150
200
250
300
350
400
450
South Dakota Age distribution of teachers 2016-17
bull About 30 of teachers in the state are over the age of 51
bull SD has seen the most growth in the numbers of younger teachers and a decline in teachers over the age of 51
Age 20-30 195118Age 31-40 255624Age 41-50 227132Age 51+ 278869
SOURCE SD DOE statistical digest
2039
26722374
2915 Age 20-30Age 31-40Age 41-50Age 51+
South Dakota District normsTeacher average startingbase salary
SOURCE SD DOE statistical digest 2017-18 is preliminary only
2012-13 2013-14 2014-15 2015-16 2016-17 2017-18Max teacher base salary $35870 $36010 $37510 $38510 $44950 $45400Min teacher base salary $22000 $22900 $24000 $25000 $28000 $30000Average teacher base salary $29100 $29950 $30153 $32542 $37627 $38147
$0
$5000
$10000
$15000
$20000
$25000
$30000
$35000
$40000
$45000
$50000
South Dakota District normsTeacher average salary (not total compensation)
SOURCE SD DOE statistical digest 2017-18 is preliminary only
2010-11 2011-12 2012-13 2013-14 2014-15 2015-16 2016-17 2017-18Max Average Teacher Salary $47315 $47438 $47196 $48343 $49825 $49778 $54703 $55353Min Average Teacher Salary $27212 $27093 $27479 $28125 $29916 $31303 $36587 $35906Average Salary $39253 $38807 $39018 $40023 $40935 $42025 $46922 $47631
$0
$10000
$20000
$30000
$40000
$50000
$60000
South Dakota District normsAdministrator average salary (not total compensation)
SOURCE SD DOE statistical digest 2017-18 is preliminary only
2010-11 2011-12 2012-13 2013-14 2014-15 2015-16 2016-17 2017-18Max Average Administrator Salary $100679 $148000 $132663 $132000 $134213 $110301 $116278 $116827Min Average Administrator Salary $45046 $32213 $42717 $42657 $48193 $42417 $50000 $22500Average Administrator Salary $72904 $72863 $73758 $75057 $77184 $78993 $82754 $83432
$0
$20000
$40000
$60000
$80000
$100000
$120000
$140000
$160000
2017-18 Headcount by Assignment Area
Assignment CategoryTotal 2018
Head Count Public
Non-Public School District
TribalBIE School
Cooperative or Multi-District
State Special School
Alternative School
Virtual Providers
Administrators 740 607 80 44 6 2 1 0
Career and Technical Education 882 765 44 24 23 2 1 23English Language Learner 71 70 1 0 0 0 0 0
Fine Arts 327 283 27 11 3 0 0 3Language Arts 1871 1666 97 81 4 5 4 14Math 1354 1178 85 71 3 4 1 12Military 6 4 0 2 0 0 0 0
Miscellaneous 1038 950 39 38 7 2 0 2Music 559 500 53 2 0 1 0 3Non-Credit 5110 4664 279 142 10 15 0 0
PE-Health 659 568 51 27 3 1 2 7Religion 60 1 59 0 0 0 0 0
Science 1074 927 69 53 3 4 2 16Elementary 3877 3375 353 146 1 0 0 2Social Science 1145 982 85 52 4 4 2 16Special Education 1209 1091 18 50 35 12 3World Language 261 177 37 29 1 0 0 17
20243 17808 1377 772 103 52 16 115SOURCE SD DOE Personnel Record Form
South Dakota Key pieces of pipeline data
SOURCE SD DOE Personnel Record Form and certification databases BOR data from BOR Reports Non BOR from IPEDS
2016-17 ldquoOtherrdquo Certificates (Preliminary)
Number of Graduates from South Dakota Teacher Prep-
Programs 2015-16 (most recent complete data available)
Number of Certificates Awarded to non-SD graduates
288
Number of Alternative (Non-TFA) Certificates Awarded
65Board of Regents Universities 509
Number of Teach for America Teachers 27 Private
Universities 161
TOTAL First Time Certificates Issued 1119 New Alternative Certificate Structure in 2017-18 with new certification rules
5 Year Projections Teacher Need
Need to meet student growth
South Dakota District NormsAverage Student to Teacher Ratio
Statewide average hovers
around 140
District Maximum and Minimum Student to Teacher Ratios
SOURCE SD DOE Statistical Digest 2017-18 is preliminary only
2010-11 2011-12 2012-13 2013-14 2014-15 2015-16 2016-17 2017-18Max Student to Teacher Ratio 176 177 172 175 176 168 174 174Min Student to Teacher Ratio 59 50 38 60 35 38 37 52Statewide Student to Teacher Ratio 135 140 141 140 140 141 141 142
00
20
40
60
80
100
120
140
160
180
200
South Dakota K-12 student enrollmentsincluding 5 year projections
Projections call for enrollments to increase by about 7400 over the next 5 years
SOURCE SD DOE statistical digest census data and SD K-12 enrollment trends
110000
115000
120000
125000
130000
135000
140000
145000
FY2010 FY2011 FY2012 FY2013 FY2014 FY2015 FY2016 FY2017 FY2018 FY2019 FY2020 FY2021 FY2022 FY2023
South Dakota Teacher need to meet anticipated student growth To maintain
current student to
teacher ratio averages an
additional 456 FTE are needed in the next 5
yearsEstimated Projected Teacher Need FY2019 FY2020 FY2021 FY2022 FY2023Teachers to Maintain 140 Student to Teacher ratio
966471 976971 987521 998186 1008964
800000
850000
900000
950000
1000000
1050000
FY2019 FY2020 FY2021 FY2022 FY2023
Teachers needed to maintain a 1401 student to teacher ratio
Need to replace retirees
South Dakota Administrator teacher and education specialist retirements
2011-2016471 of all
eligible education
retirees actually
retire
SOURCE South Dakota Retirement System 2015-16 Potential numbers not available
-
200
400
600
800
1000
1200
2011-12 2012-13 2013-14 2014-15 2015-16 2016-17
Potential
Actual
South Dakota One Five and ten-year retirementseligible versus estimated
State data indicates that
teachers comprised 718
of education retirees in the
most recent year
5 year estimate 876 teachers
retiring
Future Retirement Estimates- based on 4 year average
SOURCE Eligible from South Dakota Retirement System Estimated based on projections of 494 retiring
-
500
1000
1500
2000
2500
3000
3500
4000
4500
2017-18 Next 5 years Next 10 years
Eligible
Estimated
Need to replace teachers leaving for other reasons
South Dakota Reasons that K-12 teachers do not return to their position (Headcount)
Public School Districts 2014-15 2015-16 2016-17 2017-18
Employed in another schooldistrict outside of state 83 110 86 62
Familypersonal relocation 98 99 96 45
On Leave of Absence or Sabbatical 7 13 12 13
Other employment in education 119 72 75 79
Other employment outside of education 91 109 86 86
Reason Unknown 172 217 136 117
Retirement 293 261 236 178
Laid Off 5 2 11 10
Discharged 21 29 32 33
Employed in another accredited SD schooldistrict 254 269 216 183
Illness 5 7 6 3
Death 7 2 3 7
Mentor 5 7 2 3
Employed by district in another capacity not tracked 8 25 19 13
TOTAL 1168 1223 1018 833
SOURCE SD DOE personnel record form
South Dakota Reasons teachers do not return to prior position (201718 School Year)
Teachers Admin Educ SpecDeath 537 000 100Employed by District in another capacity not tracked 1017 200 17111Employed in another accredited SD schooldistrict 17488 1360 2141Employed in another schooldistrict out of state 6000 113 459Familypersonal relocation 4234 085 373Illness 300 041 000Non-Renewal 3139 160 000On Leave of Absence or Sabbatical 1150 000 100Other employment in education 7202 624 1117Other employment outside of education 7726 370 1013Mentor 300 000 000Reason Unknown 10842 300 1213Reduction-in-Force 880 000 140Retirement 16595 1200 2188
TOTAL 77410 4453 25955Percent of 2016-17 Staff 8 8 23
Percent of Staff Leaving Education in SD 4 3 4Percent of Staff Still in SD Education Field but in Different Position 3 4 18
Percent Unknown 1 1 1
SOURCE SD DOE personnel record form
South Dakota Estimated number of teachers leaving the field
Estimatesbull 2 of teachers will
continue to leave the field for reasons other
than retirement
bull In next 5 years 988 teachers will leave the education field in SD
Estimated number of Teachers
Estimated number No longer Employed
2018-19 9665 193
2019-20 9770 195
2020-21 9875 198
2021-22 9982 200
2022-23 10090 202
Five Year Total 988
Putting it all together 5 Year Projected Need
South Dakota 5-year projected teacher need
RETIREES NEED TO MEETSTUDENT GROWTH
TEACHERS LEAVINGTHE FIELD
NEED 876 456 988
0
200
400
600
800
1000
1200
South Dakota Teacher Pipeline
South Dakota Total FTE of Certified Teachers and Total Number of New Certificates last 5 years
SOURCE SD DOE Certification and Personnel Record Form databases
2010-11 2011-12 2012-13 2013-14 2014-15 2015-16 2016-17New Certificates Issued 1174 1103 1074 1083 1250 1198 1119FTE Certified Teachers PK-12 9321 9099 9196 9362 9483 951589 963413
0
2000
4000
6000
8000
10000
12000
Pipeline South DakotaCollege Graduates
South Dakota Teacher preparation graduates2002-03 to 2016-17
SOURCE 2002-201516 SD BOR data from SD BOR Non-BOR from IPEDS Completion report (2016-17 data is preliminary IPEDS data)
050
100150200250300350400450500550600650700
BOR Grand Total
Non-BOR Grand Total
2001-2002
2002-2003
2003-2004
2004-2005
2005-2006
2006-2007
2007-2008
2008-2009
2009-2010
2010-2011
2011-2012
2012-2013
2013-2014
2014-2015
2015-2016
2016-2017
Non-BOR Grand Total 193 189 193 187 166 176 169 169 159 177 170 185 194 173 161 162
BOR Grand Total 507 476 472 434 447 417 410 432 381 472 469 480 486 432 509 451
Combined Grand Total 700 665 665 621 613 593 579 601 540 649 639 665 680 605 670 613
BOR Teacher Graduate PlacementsFY 2002-2016 Approximately half
(554) of all undergraduate teacher education graduates since FY2002 have been placed in an in-state school district
Placement rates are dramatically higher for teacher education candidates who attended a South Dakota high school
South Dakota Trajectories for new teacher graduates next 5 years Per the most
recently available long term data 554 of all Board of Regents teacher education graduates were employed in South Dakota
This means that we expect 1742 of 3144 grads to take jobs in SD in the next 5 years
2016-17 2017-18 2018-19 2019-20 2020-21Board of Regents Universities 162 174 174 174 174Non-BOR Universities 451 458 458 459 460TOTAL 613 632 632 633 634
Five Year Total 3144
5 Years Estimated SD Teacher Graduates
Projected Grads
Projected Placed in SD
2016-17 613 3402017-18 632 3502018-19 632 3502019-20 633 3512020-21 634 351TOTAL 3144 1742
Estimated SD Placements
Pipeline Out of StateCollege Graduates
South Dakota Teachers from out-of-state 2010-2014 On average
5566 of out of state educators who apply for certification in South Dakota will be employed in South Dakota public schools
5 year trajectorybull 1536 out-of-
state applicants
bull 855 employed in the SD public schools
Certificates Issued to Out-of-State Graduates
SOURCE SD DOE Certification and Personnel Record Form databases
Certificates Issued
Employed in SD
Employed
Administration Endorsement
Educator Specialist Endorsement
Teacher Endorsement
2010 440 268 6091 27 24 3892011 414 247 5966 17 21 3762012 466 283 6073 24 30 4122013 490 320 6531 27 11 4522014 435 265 6092 21 20 3942015 416 192 4615 18 8 4002016 370 178 4811 14 11 358
2017 299 130 4348 14 8 288
Pipeline Alternative Certification
South Dakota Alternative certificates
Expectationsbull The alternative
Certification program will continue to grow but will stabilize under the new rules
bull Teach For America will remain steady at an average 23 teachers a year
bull 5 year conservative projection 295
bull new teachers
SOURCE SD DOE Certification and Personnel Record Form databases
Alternative Certificates
Teach For America
Total Alternative
2010-11 41 26 67
2011-12 37 17 54
2012-13 51 15 66
2013-14 48 23 71
2014-15 55 31 86
2015-16 86 29 115
2016-17 114 19 133
2017-18 188 20 208
Putting it all together 5-year teacher pipeline
projections
South Dakota Five-year teacher pipeline projections
Projected 5 Year new
teacher pool2892
1742
855
295
0
200
400
600
800
1000
1200
1400
1600
1800
2000
INCOMING SDGRADUATES
OUT OF STATEGRADUATES
ALTERNATIVEPROGRAMS
Projected Totals
South Dakota Pipeline Overview
The estimated supply of teachers
indicates the potential
teacher pool will be 572
more than the minimal five-
year need 876
456
988
1742
855
295
0
500
1000
1500
2000
2500
3000
3500
NEED PIPELINE
ALTERNATIVEPROGRAMS
OUT OF STATEGRADUATES
INCOMING SDGRADUATES
TEACHERS LEAVING THEFIELD
NEED TO MEET STUDENTGROWTH
RETIREES
Hard to Fill Positions
2018 Preliminary Plans of IntentEducator Assignment PLANS OF INTENT BY HEAD COUNT Percent on Plan of IntentAdministrators 18 3Career and Technical Education 108 14English Language Learner 13 19Fine Arts 13 5Language Arts 64 4Math 41 3Military 0 0Miscellaneous 4 0Music 14 3Non-Credit 3 0PE-Health 35 6Religion 0 0Science 59 6Elementary 77 2Social Science 63 6Special Education 39 4World Language 16 9
567 3
SOURCE SD DOE Personnel Record Form database
South Dakota Unfilled Vacancies First Day of School 2017-18
bull Includes ALL Public schools
bull Represents teaching positions at 78 schools 39 districts
bull Administrator and School Service Specialists at 11 districts
SOURCE SD DOE Personnel Record Form database
FTE CoursesAdministrators 1Career and Technical Education 348 22Education Specialists 1211 14English Learner ESL 1 1Fine Arts 115 2Language Arts 386 20Math 373 22Miscellaneous 2 8Music 08 1Non-Credit 546 24PE-Health 019 2Science 18 9Elementary 1346 15Social Science 097 4Special Education 1252 13World Language 024 2Total FTE 6377 161
South Dakota High School vacancies by FTE first day of school 2014-2015
bull Represents positions at 24 schools and districts (1194 of HS)
bull Math amp Science 8 high schools with at least 1 unfilled course (40 of HS)
bull English 3 high schools with at least 1 unfilled course (15 of HS)
SOURCE SD DOE Personnel Record Form database
FTEPercent of
ALL FTE vacancies
Administrators 066 6600Career and Technical Education 284 8161Education Specialists 05 413Fine Arts 015 1304Language Arts 244 6321Math 222 5952Miscellaneous 058 2900Non-Credit 442 8095PE-Health 006 3158Science 153 8500Social Science 05 5155Special Education 452 3610World Language 024 10000
TOTAL 2066 3240
Hard to Fill Positions
South Dakota Hard to fill positions Plans of Intent 2017-18 bull Includes all Public Schools
in the state
bull English as a Second Language World Language and CTE teachers were the most likely to be on Plans of Intent
bull Highest numbers of Plans of intent in Elementary CTE Language Arts amp Social Science
PLANS OF INTENT(HEAD COUNT)
OF CATEGORY
Administrators 18 3
CTE 108 14
ESL (Non-Core) 13 19
Fine Arts 13 5
Language Arts 64 4
Math 41 3
Military 0 0
Miscellaneous 4 0
Music 14 3
Non-Credit 3 0
PE-Health 35 6
Science 59 6
Elementary 77 2
Social Science 63 6
Special Ed (Non-Core) 39 4
World Language 16 9
SOURCE SD DOE Personnel Record Form database
South Dakota Plan of Intent Trends
bull One teacher may be on multiple plans of intent to teach multiple courses
bull Both the number of teachers and the number of plans of intent has been growing
bull Plans of Intent are issued for up to 2 years in most casesbull Educators have completed 2449 of Plans of Intent in recent years
on average This is down from pre-2015 percentages
SOURCE SD DOE Personnel Record Form database
2015 2016 2017 Plans of Intent 576 726 676
Not Completed NA 538 520Completed NA 188 156
Headcount 501 596 563
SOURCE SD DOE Personnel Record Form database
South Dakota Hard to fill position resolutionof Unfilled Vacancies 2014-15 (October 15)
bull Most common resolution was to re-assign duties to other staff
bull Vacant courses is down from 2015
SOURCE SD DOE Personnel Record Form database
of Courses of Vacancies
Eliminate CourseProgram 27 1677Additional duties given to other staff 38 2360
Hired certified candidate after school started 8 497
Increased Class size 16 994Position remains vacant 31 1925Use Distance Learning 14 870Other 27 1677
Total (including Administrators and School Service Specialists)
161
Hard to Fill PositionsFlexible Course Offerings
South Dakota Flexible Learning OptionsSouth Dakota Virtual School Courses
SOURCE SD Virtual School annual reports
bull Represents officially reported public school enrollments
bull 1622 increase in student enrollments since 2010-11
Districts CoursesTotal
Student EnrollmentsPublic Other Available Offered
2010-11 118 233 3446
2011-12 127 255 3389
2012-13 133 289 3750
2013-14 135 298 3837
2014-15 133 16 389 3952
2015-16 126 15 209 4078
2016-17 133 13 275 4005
South Dakota Flexible Learning OptionsSouth Dakota Virtual School Courses
SOURCE SD Virtual School annual reports
bull Over time offerings in more subjects have been added
bull Credit Recovery and World Languages have the highest enrollments
2010-2011
2011-2012
2012-2013
2013-2014
2014-2015
2015-2016
2016-2017
CTE 276 283 316 401 400 365 284Credit Recovery 842 942 946 727 627 559 609College Readiness 115 169 128 115 90
Fine Arts 188 114 127 132 132 107 59HealthPE 105 60 43 66 55 151 123ELA 320 299 351 297 255 411 287Math 340 194 246 286 334 653 344Sciences 280 334 396 413 524 403 310Social Sciences 798 137 165 190 285 311 200World Language 1008 1015 1098 1061 808 698Personal FianceEcon 1 7 40 44 66 45
Technology 14 10 9 9 3 7Elementary 84 89 17Other 38 3 13 9 14 37 0
bull Credit Recovery courseshad the lowestcompletion rates acrossthe board and accountfor a significant portionof enrollments
bull Completion rates haveincreased over time
bull Overall completion ratewithout Credit Recoverycourses included jumpsfrom 6424 to 7439
South Dakota Flexible Learning OptionsSouth Dakota Virtual School Courses
SOURCE SD Virtual School annual reports
2014-15 2015-16 2016-17
EnrolledCompletion
Rate EnrolledCompletion
Rate EnrolledCompletion
Rate
CTE 400 688 365 967 284 954
Credit Recovery 627 217 559 243 609 232
College Readiness 128 633 115 461 90 900
Fine Arts 132 705 107 766 59 780
HealthPE 555 618 151 483 123 545
ELA 255 416 411 496 287 530
Math 334 458 653 583 344 552
Sciences 524 523 403 806 310 868
Social Sciences 285 428 311 701 200 710
World Language 1061 523 808 783 698 807
Personal FianceEcon 44 796 66 773 45 778
Technology 9 556 3 1000 7 857
Elementary 84 524 89 472 17 647
Other 14 714 37 784 0
South Dakota Flexible Learning OptionsDual Credit Courses
SOURCE SD DOE dual credit program August 2015 reports
bull Total enrollments increased by 9337 and Credits earned by 9851 between 2014 and 2016
2014-15 (allterms)
2015-16 (allterms)
2016-17 (allterms)
2017-18(Fall only)
Total course enrollment 4227 6951 8174 4392Students taking at least 1
course 2135 2688 2717 1967
Credits earned 1141450 18590 22659 12943
000
500000
1000000
1500000
2000000
2500000
0
1000
2000
3000
4000
5000
6000
7000
8000
9000
South Dakota Flexible Learning OptionsDual Credit Courses by Institution
SOURCE SD DOE dual credit program August 2015 reports
2014-15 (all terms)
2015-16 (all terms)
2016-17 (all terms)
2017-18 (Fall only)
Black Hills State University 50 52 70 45Dakota State University 19 23 24 17Lake Area Technical Institute 51 64 65 60Mitchell Technical Institute 24 58 55 37Northern State University 30 46 43 33South Dakota School of Mines and Technology 23 26 35 15South Dakota State University 52 60 59 47Southeast Technical Institute 51 63 54 42University of South Dakota 37 54 63 39Western Dakota Tech 35 71 84 31
372 517 552 366
Questionsbull Abby Javurekbull SD Dept of Educationbull 6057733426bull AbbyJavurekstatesdusbull SD DOE website httpdoesdgov
Rankings of the States 2017 and
Estimates of School Statistics 2018
NEA RESEARCH April 2018
Reproduction No part of this report may be reproduced in any form without permission from NEA Research except by NEA-affiliated associations Any reproduction of the report materials must include the usual credit line and the copyright notice Address communications to NEA Research 1201 16th Street NW St 610 Washington DC 20036 or by email to RankingsEstimatesneaorg
Copyright copy 2018 by the National Education Association
All Rights Reserved
SALARY ($) RANK SALARY ($) RANK CHANGE () RANKAlabama 48518 38 50391 35 39 3 Alaska 67443 7 68138 8 10 34 Arizona 47218 43 47403 44 04 45 Arkansas 48218 39 48304 42 02 47 California 77179 2 79128 2 25 13 Colorado 51233 30 51808 31 11 32 Connecticut 72013 5 73147 5 16 25 Delaware 59960 14 60214 14 04 41 District of Columbia 73991 4 75692 4 23 18 Florida 46612 46 47267 45 14 26 Georgia 54190 23 55532 23 25 15 Hawaii 56049 20 56651 21 11 33 Idaho 46122 47 47504 43 30 8 Illinois 63475 11 64933 11 23 19 Indiana 53645 26 54308 26 12 30 Iowa 54386 22 55647 22 23 17 Kansas 47755 42 49422 40 35 4 Kentucky 52134 27 52338 29 04 46 Louisiana 49745 34 50000 37 05 40 Maine 50498 33 51077 33 11 31 Maryland 66456 8 68357 7 29 10 Massachusetts 76522 3 78100 3 21 20 Michigan 61875 12 62287 12 07 39 Minnesota 56913 17 57346 20 08 36 Mississippi 42744 50 42925 51 04 42 Missouri 47959 40 48618 41 14 27 Montana 51034 32 51422 32 08 38 Nebraska 51386 29 52338 30 19 21 Nevada 56943 16 57376 18 08 37 New Hampshire 56616 18 57522 17 16 24 New Jersey 69330 6 69623 6 04 44 New Mexico 47163 44 47122 47 -01 50 New York 79152 1 81902 1 35 5 North Carolina 47941 41 49970 39 42 2 North Dakota 51223 31 52968 27 34 6 Ohio 56441 19 58202 15 31 7 Oklahoma 45276 49 45292 50 00 49 Oregon 60395 13 61862 13 24 16 Pennsylvania 65151 10 66265 10 17 22 Rhode Island 66197 9 66477 9 04 43 South Carolina 48769 37 50000 38 25 14 South Dakota 42025 51 46979 48 118 1 Tennessee 48817 36 50099 36 26 12 Texas 51890 28 52575 28 13 29 Utah 46887 45 47244 46 08 35 Vermont 55726 21 57349 19 29 9 Virginia 49690 35 51049 34 27 11 Washington 53701 25 54433 25 14 28 West Virginia 45622 48 45555 49 -01 51 Wisconsin 54115 24 54998 24 16 23 Wyoming 58140 15 58187 16 01 48 United States 58479 - 59660 - 20 -
2016 2017 2016-17
B-6 AVERAGE SALARY OF TEACHERS
26
State RPP NEA Salary Adjusted Salary Rank State RPP NEA Salary Adjusted Salary RankMassachusetts 1078 $78100 $7244898 1 Vermont 1016 $57349 $5644587 27New York 1156 $81902 $7084948 2 Arkansas 869 $48304 $5558573 28California 1144 $79128 $6916783 3 Tennessee 902 $50099 $5554213 29Pennsylvania 984 $66265 $6734248 4 South Carolina 903 $50000 $5537099 30Connecticut 1087 $73147 $6729255 5 Louisiana 904 $50000 $5530973 31Michigan 933 $62287 $6675991 6 North Carolina 909 $49970 $5497250 32Rhode Island 996 $66477 $6674398 7 Montana 941 $51422 $5464612 33Illinois 989 $64933 $6565521 8 Kansas 905 $49422 $5460994 34DC 1159 $75692 $6530802 9 Missouri 895 $48618 $5432179 35Ohio 893 $58202 $6517581 10 New Hampshire 1059 $57522 $5431728 36Alaska 1054 $68138 $6464706 11 Texas 969 $52575 $5425697 37Maryland 1095 $68357 $6242648 12 South Dakota 883 $46979 $5320385 38Oregon 998 $61862 $6198597 13 West Virginia 876 $45555 $5200342 39Iowa 902 $55647 $6169290 14 Maine 984 $51077 $5190752 40New Jersey 1132 $69623 $6150442 15 Washington 1055 $54433 $5159526 41Georgia 921 $55532 $6029533 16 Idaho 930 $47504 $5107957 42Wyoming 967 $58187 $6017270 17 Oklahoma 890 $45292 $5088989 43Indiana 903 $54308 $6014175 18 New Mexico 936 $47122 $5034402 44Delaware 1002 $60214 $6009381 19 Colorado 1030 $51808 $5029903 45Kentucky 878 $52338 $5961048 20 Virginia 1023 $51049 $4990127 46Wisconsin 928 $54998 $5926509 21 Mississippi 864 $42925 $4968171 47Nevada 974 $57376 $5890760 22 Arizona 959 $47403 $4942961 48Minnesota 975 $57346 $5881641 23 Utah 973 $47244 $4855498 49Alabama 866 $50391 $5818822 24 Hawaii 1184 $56651 $4784713 50North Dakota 915 $52968 $5788852 25 Florida 997 $47267 $4740923 51Nebraska 905 $52338 $5783204 26
Sources NEA Ranking of the States 2017 and Estimates of School Statistics 2018 (April 2018)Bureau of Economic Analysis Regional Price Parities in 2016 (May 2018)
NEA 2017 AVERAGE TEACHER SALARIES BY STATEADJUSTED BY 2016 BEA REGIONAL PRICE PARITIES
61418 2)24 PMBEA News Release Real Personal Income for States and Metropolitan Areas 2016
Page 1 of 8httpswwwbeagovnewsreleasesregionalrpprpp_newsreleasehtm
EMBARGOED UNTIL RELEASE AT 830 AM EDT Thursday May 17 2018
BEA 18mdash23
3012789328
rppbeagov (mailtorppbeagov)
3012789003
Home (indexhtm) National (nationalindexhtm) International (internationalindexhtm)
Regional (regionalindexhtm) Industry (industryindexhtm) Interactive Data (itable) About BEA (aboutindexhtm)
FAQs (faqindexcfm)Contact Us (contactssearchhtm)
(indexhtm)
(httpwwwcommercegov)
Real Personal Income for States and MetropolitanAreas 2016
Real state personal income grew on average 11 percent in 2016after increasing 47 percent in 2015 according to estimates releasedtoday by the Bureau of Economic Analysis Real state personalincome is a states current-dollar personal income adjusted by thestates regional price parity and the national personal consumptionexpenditures price index The percent change in real state personalincome ranged from 33 percent in Utah and Georgia to -36 percentin Wyoming (table 1) In the District of Columbia real personalincome grew 45 percent Across metropolitan areas the percentchange ranged from 66 percent in Jacksonville NC to -81 percent inMidland TX and Odessa TX (table 4)
(newsreleasesregionalrpp2018_imagesrpp0518png)
Related Links
Full Release amp Tables (PDF)
(newsreleasesregionalrpp2018pdfrpp0518pdf)
State Tables Only(Excel)
(newsreleasesregionalrpp2018xlsrpp0518xlsx)
Metropolitan Area Tables Only(Excel)
(newsreleasesregionalrpp2018xlsrpp0518msaxlsx)
Highlights - State (PDF)
(newsreleasesregionalrpp2018pdfrpp0518_faxpdf)
Highlights - Metropolitan Area (PDF)
(newsreleasesregionalrpp2018pdfrpp0518b_faxpdf)
Interactive Tables (iTableiTableHtmlcfm
reqid=70ampstep=1ampisuri=1ampacrdn=8)
Contacts
Eric Figueroa (Technical)
Jeannine Aversa (Media)
Go
About Regional (regionalaboutcfm) Methodologies (regionalmethodscfm) Articles (regionalarticlescfm)
Release Schedule (newsreleasesnews_release_sort_regionalhtm) Staff Contacts (contactsemailhtm)
Email Subscriptions (_subscribe)
61418 2)24 PMBEA News Release Real Personal Income for States and Metropolitan Areas 2016
Page 2 of 8httpswwwbeagovnewsreleasesregionalrpprpp_newsreleasehtm
JeannineAversabeagov
(mailtoJeannineAversabeagov)
Real Personal Income in 2016
States with the fastest growth in real personal income wereUtah (33 percent) Georgia (33 percent) and Washington(30 percent) The District of Columbias real personalincome grew 45 percent
Eight states had declining real personal income The largestpercent declines were in Wyoming (-36 percent) Oklahoma(-27 percent) and Louisiana (-19 percent)
Large metropolitan areas ndash those with population greaterthan two million ndash with the fastest growth in real personalincome were Atlanta-Sandy Springs-Roswell GA (34percent) Orlando-Kissimmee-Sanford FL (33 percent) andCharlotte-Concord-Gastonia NC-SC (32 percent)
The three large metropolitan areas with declining realpersonal income were Houston-The Woodlands-Sugar LandTX (-33 percent) Denver-Aurora-Lakewood CO (-07percent) and Pittsburgh PA (-04 percent)
Regional Price Parities in 2016
Regional Price Parities (RPPs) measure the differences in price levelsacross states and metropolitan areas for a given year and areexpressed as a percentage of the overall national price level Allitems RPPs cover all consumption goods and services including rentsAreas with highlow RPPs typically correspond to areas with highlowprice levels for rents
States with the highest RPPs were Hawaii (1184) New York(1156) and California (1144) (table 3) The District ofColumbias RPP was 1159
States with the lowest RPPs were Mississippi (864) Alabama(866) and Arkansas (869)
Across states Hawaii had the highest rents RPP (1574) andAlabama and West Virginia had the lowest (632)
Large metropolitan areas with the highest RPPs were SanFrancisco-Oakland-Hayward CA (1247) New York-Newark-Jersey City NY-NJ-PA (1220) and Washington-Arlington-Alexandria DC-VA-MD-WV (1191) (table 6)
Large metropolitan areas with the lowest RPPs wereCincinnati OH-KY-IN (896) Cleveland-Elyria OH (902) andSt Louis MO-IL (908)
Across large metropolitan areas San Francisco-Oakland-Hayward CA had the highest rents RPP (1909) andCleveland-Elyria OH had the lowest (779)
Across all metropolitan areas San Jose-Sunnyvale-SantaClara CA had the highest rents RPP (2133) and Gadsden AL
Sign up (_subscribe) for e-mail notifications
Download (exit_siteasp
link=httpwwwadobecomproductsacrobatreadstep2html)
the Acrobat Reader
61418 2)24 PMBEA News Release Real Personal Income for States and Metropolitan Areas 2016
Page 3 of 8httpswwwbeagovnewsreleasesregionalrpprpp_newsreleasehtm
had the lowest (515)
Estimates of real personal income and regional priceparities for state metropolitan and nonmetropolitanportions can be found at httpswwwbeagovitable(iTableiTableHtmlcfmreqid=70ampstep=1ampisuri=1ampacrdn=8) Supplementaltables are available upon request
(newsreleasesregionalrpp2018_imagesrpp0518_chart_01png)
Updates to Real Personal Income
Today BEA also released revised real personal incomestatistics for states and metropolitan areas for 2014-2015 and real per capita personal income statistics forstates for 2010-2013 These revisions were made toincorporate newly available source data BEA willupdate real personal income for states on September25 2018 with the release of state personal incomeReal personal income for metropolitan areas will beupdated on November 15 2018 with the release of localarea personal income
Next release May 2019 ndash Real Personal Income for States andMetropolitan Areas 2017
Technical Notes on Regional Price Paritiesand Implicit Regional Price Deflators
61418 2)24 PMBEA News Release Real Personal Income for States and Metropolitan Areas 2016
Page 4 of 8httpswwwbeagovnewsreleasesregionalrpprpp_newsreleasehtm
Price indexes commonly measure price changes over time TheBEAs personal consumption expenditures (PCE) price index andthe Bureau of Labor Statistics consumer price index (CPI) aretwo examples Spatial price indexes measure price leveldifferences across regions for one time period An example ofthese type of indexes are purchasing power parities (PPPs)which measure differences in price levels across countries for agiven period and can be used to convert estimates of percapita GDP into comparable levels in a common currency Theregional price parities (RPPs) that BEA has developed compareregions within the United States but without the need forcurrency conversion An implicit regional price deflator (IRPD)can be derived by combining the RPPs and the US PCE priceindex
Regional Price Parities The RPPs are calculated using pricequotes for a wide array of items from the CPI which areaggregated into broader expenditure categories (such as foodtransportation or education) Data on rents are obtainedseparately from the Census Bureaus American CommunitySurvey (ACS) The expenditure weights for each category areconstructed using CPI expenditure weights BEAs personalconsumption expenditures and ACS rents expenditures
The broader categories and the data on rents are combinedwith the expenditure weights using a multilateral aggregationmethod that expresses a regions price level relative to theUS
For example if the RPP for area A is 120 and for area B is 90then on average prices are 20 percent higher and 10 percentlower than the US average for A and B respectively If thepersonal income for area A is $12000 and for area B is $9000then RPP-adjusted incomes are $10000 (or $12000120) and$10000 (or $9000090) respectively In other words thepurchasing power of the two incomes is equivalent whenadjusted by their respective RPPs
Implicit Regional Price Deflator The IRPD is a regional priceindex derived as the product of two terms the regional priceparity and the US PCE price index
The implicit regional price deflator will equal current dollarpersonal income divided by real personal income in chaineddollars The growth rate or year-to-year change in the IRPDs isa measure of regional inflation
Detailed information on the methodology used to estimate theRPPs may be found on the regional methodology page of theBEA website wwwbeagovregionalmethodscfm(regionalmethodscfm)
1
2
3
4
61418 2)24 PMBEA News Release Real Personal Income for States and Metropolitan Areas 2016
Page 5 of 8httpswwwbeagovnewsreleasesregionalrpprpp_newsreleasehtm
Additional Information
Resources
Stay informed about BEA developments by reading theBEA blog (httpblogbeagov) signing up for BEAsemail subscription service (_subscribe) or followingBEA on Twitter BEA_News(httpwwwtwittercomBEA_News)
Historical time series for these estimates can beaccessed in BEAs Interactive Data Application(itable)
Access BEA data by registering for BEAs DataApplication Programming Interface (APIsignup)(API)
For more on BEAs statistics see our monthly onlinejournal the Survey of Current Business (scb)
BEAs news release schedule(newsreleasesnews_release_schedulehtm)
Definitions
Personal income is the income received by or on behalf of allpersons from all sources from participation as laborers inproduction from owning a home or business from theownership of financial assets and from government andbusiness in the form of transfers It includes income fromdomestic sources as well as the rest of world It does notinclude realized or unrealized capital gains or losses
Per capita personal income is calculated as the total personalincome of the residents of a given area divided by thepopulation of the area In computing per capita personalincome BEA uses Census Bureau mid-year populationestimates
Personal income is measured before the deduction of personalincome taxes and other personal taxes and is reported incurrent dollars (no adjustment is made for price changes)Comparisons for different regions and time periods reflectchanges in both the price and quantity components of regionalpersonal income
The estimate of personal income for the United States is thesum of the state estimates and the estimate for the District ofColumbia it differs slightly from the estimate of personalincome in the national income and product accounts (NIPAs)because of differences in coverage in the methodologies usedto prepare the estimates and in the timing of the availabilityof source data
61418 2)24 PMBEA News Release Real Personal Income for States and Metropolitan Areas 2016
Page 6 of 8httpswwwbeagovnewsreleasesregionalrpprpp_newsreleasehtm
Regional price parities (RPPs) are regional price levelsexpressed as a percentage of the overall national price levelfor a given year The price level is determined by the averageprices paid by consumers for the mix of goods and servicesconsumed in each region
Detailed CPI price data are adjusted to obtain average pricelevels for BLS-defined areas These are allocated to countiesin combination with direct price and expenditure data on rentsfrom the ACS
County data are then aggregated to states and metropolitanareas
Personal income at RPPs is current-dollar personal incomedivided by the price parity for a given year and region Abalancing factor is applied so that the sum of personal incomeat RPPs across regions equals the current dollar sum
Real personal income is personal income at RPPs divided bythe national PCE chain-type price index The result is realpersonal income in chained dollars (using 2009 as the referenceyear) Using Alaska in 2016 as an example
(newsreleasesregionalrpp2018_imagesrpp0518_formula_01png)
Estimates of real personal income in the United States arederived as the sum of the regional estimates divided by theUS PCE Price Index
Implicit Regional Price Deflator (IRPD) is the product of theRPP times the national PCE price index It is equal to personalincome divided by real personal income See also the TechnicalNote
List of News Release Tables
Table 1 Real Personal Income and Implicit Regional PriceDeflators by State 2015-2016
5
6
61418 2)24 PMBEA News Release Real Personal Income for States and Metropolitan Areas 2016
Page 7 of 8httpswwwbeagovnewsreleasesregionalrpprpp_newsreleasehtm
Contact All of Us(contactssearchhtm)
Frequently AskedQuestions(faqindexcfm)
About BEA
News
US Economy ata Glance(newsreleasesglancehtm)
Current Releases(newsreleasesrelshtm)
News Release
InformationFor
Media(newsroomindexhtm)
CongressionalUsers(congressionalindexhtm)
Factsheets
Regional PI ampGDP(regionalbearfacts)
Intl Trade ampInvestment(internationalfactsheet)
Publications
Survey ofCurrent Business(scbindexhtm)
Papers by Topic(researchby_topichtm)
Resources
Interactive Data(itableindexcfm)
Research at BEA(researchindexhtm)
Developers(developers)
Table 2 Real Per Capita Personal Income by State 2015-2016
Table 3 Regional Price Parities by State 2016
Table 4 Real Personal Income and Implicit Regional PriceDeflators by Metropolitan Area 2015-2016
Table 5 Real Per Capita Personal Income by Metropolitan Area2015-2016
Table 6 Regional Price Parities by Metropolitan Area 2016
The BEA Regional Price Parity statistics are based in part onrestricted access Consumer Price Index data from the Bureauof Labor Statistics (BLS) The BEA statistics presented hereinare products of BEA and not BLS
To estimate RPPs CPI price quotes are quality adjusted andpooled over 5 years The ACS rents are also quality adjustedand are either annual for states or pooled over 3 years formetropolitan areas The expenditure weights are specific foreach year
The multilateral system that is used is the Geary additivemethod Any region or combination of regions may be used asthe base or reference region without loss of consistency
The growth rate of the implicit regional price deflators willnot necessarily equal the region or metro area price deflatorspublished by the BLS This is because the CPI deflators arecalculated directly while the IRPDs are indirect estimates andbecause of differences in the source data and methodology
The CPI represents about 93 percent of the total USpopulation including almost all residents of urban ormetropolitan areas In the Northeast region rural area prices(exclusive of rents) are assumed to be the same as those in thesmall metropolitan areas of the CPI in the Midwest South andWest regions they are assumed to be the same as those in thenonmetropolitan urban areas of the CPI
RPP should first be divided by 100
1
2
3
4
5
6
61418 2)24 PMBEA News Release Real Personal Income for States and Metropolitan Areas 2016
Page 8 of 8httpswwwbeagovnewsreleasesregionalrpprpp_newsreleasehtm
(aboutindexhtm)
Policies(aboutpolicieshtm)Privacy Policy(aboutPrivacy_Statementhtm)
FOIA(httpwwwosecdocgovomoFOIAFOIAWebsitehtm)
Accessibility(aboutaccessibilityhtm)
Commitment to ScientificIntegrity(_pdfscientific_integrity_statement_of_the_principal_statistical_agenciespdf)
Information Quality Guidelines(aboutinfoqualhtm)
Data Dissemination Practices(aboutBEAdisseminationhtm)
Open Data (datahtm)
ESR System (statusindexcfm)
USAgov (wwwusagov)
US Department of Commerce(wwwcommercegov)
Archive(newsreleasesrelease_archivehtm)
eFile Users(efile)
BE-13Respondents(surveysrespondent_be13htm)
Private FundReporters(surveysprivatefunds)
Job Seekers(jobsindexhtm)
Industry GDP(industryfactsheet)
Multimedia(videoindexhtm)
FAQs(faqindexcfm)
More
Directors Page(aboutdirectorhtm)
Conferences(agencyexhibit_schedulehtm)
Guidelines forCiting BEAInformation(aboutBEAcitinghtm)
61418 2)24 PMrpp0518_chart_01png 2204times2389 pixels
Page 1 of 1httpswwwbeagovnewsreleasesregionalrpp2018_imagesrpp0518_chart_01png
Purchasing Power
The attached spreadsheets are designed to accurately calculate federal income tax state income tax and FICA tax (Social Security and Medicare tax) on an individualrsquos annual wagesalary Taxes are computed assuming a single filer standard deduction and no additional dependents The accounting firm Eide Bailly prepares the calculations and they should be accurate within $5 annually Once we know how much in taxes are due we can determine after tax wages (gross salary less taxes) This is how much money a worker has left over once the government has taken out the correct amount of payroll taxes We also know that different areasregions have different costs of living For example New York City has a much higher cost of living than Sioux Falls To determine the cost of living in any given city or state the US Bureau of Economic Analysis (BEA) compares millions of price points on goods and services across the nation and produces Regional Price Parities (RPP) The national average of all costs is 100 A state or city with lower average costs will have an RPP of less than 100 (SDrsquoS is 883) and a city or state with a higher cost of living will have an RPP over 100 (for example Hawaiirsquos RPP is 1184) So to determine purchasing power we divide after tax wages by a given city or statersquos RPP This is the only way to have a meaningful comparison of wages in different cities and states The true measure of how well yoursquore paid is not your gross pay rather it is how much you can buy with your wages after the government has taken its share Note The BEA will release the 2017 RPPs in May of 2019
Rank State
Average Teacher Salary
(NEA 2017) Total Federal and State
Adjustments to Pay Take Home Pay RPP Cost of Living Index (BEA 2016)
After Tax Wages Adjusted for Cost
of Living (RPP) 1 Massachusetts 78100 20118 57982 1078 53787 2 Pennsylvania 66265 14983 51282 0984 52116 3 Alaska 68138 13500 54638 1054 51839 4 New York 81902 22018 59884 1156 51803 5 Ohio 58202 11987 46215 0893 51753 6 Rhode Island 66477 15043 51434 0996 51641 7 Michigan 62287 14242 48045 0933 51495 8 California 79128 20967 58161 1144 50840 9 Connecticut 73147 18526 54621 1087 50249
10 Illinois 64933 15284 49649 0989 50201 11 Wyoming 58187 10550 47637 0967 49263 12 Nevada 57376 10311 47065 0974 48321 13 District of Columbia 75692 19942 55750 1159 48102 14 Iowa 55647 12431 43216 0902 47911 15 Indiana 54308 11127 43181 0903 47820 16 North Dakota 52968 9485 43483 0915 47522 17 Maryland 68357 16518 51839 1095 47341 18 New Jersey 69623 16243 53380 1132 47156 19 Georgia 55532 12605 42927 0921 46609 20 Kentucky 52338 11513 40825 0878 46498 21 Tennessee 50099 8211 41889 0902 46440 22 Alabama 50391 10261 40130 0866 46340 23 Delaware 60214 13819 46395 1002 46302 24 Oregon 61862 15991 45871 0998 45963 25 Wisconsin 54998 12348 42650 0928 45959 26 Nebraska 52338 10973 41365 0905 45708 27 Minnesota 57346 13063 44283 0975 45418 28 Texas 52575 8888 43687 0969 45085 29 Louisiana 50000 9683 40318 0904 44599 30 South Dakota 46979 7601 393785 0883 44596 31 New Hampshire 57522 10355 47167 1059 44539 32 Vermont 57349 12149 45200 1016 44488 33 Arkansas 48304 9847 38458 0869 44255 34 South Carolina 50000 10360 39641 0903 43899 35 Missouri 48618 9353 39265 0895 43871 36 Kansas 49422 9988 39434 0905 43573 37 North Carolina 49970 10456 39514 0909 43470 38 Montana 51422 11058 40364 0941 42894 39 Washington 54433 9437 44996 1055 42650 40 West Virginia 45555 9112 36443 0876 41602 41 Maine 51077 10908 40169 0984 40822
42 Oklahoma 45292 8979 36313 0890 40802 43 New Mexico 47122 9071 38051 0936 40653 44 Idaho 47504 9990 37514 0930 40338 45 Arizona 47403 8879 38524 0959 40171 46 Colorado 51808 10509 41299 1030 40096 47 Mississippi 42925 8385 34540 0864 39977 48 Florida 47267 7659 39609 0997 39728 49 Virginia 51049 10882 40167 1023 39264 50 Utah 47244 9543 37701 0973 38747 51 Hawaii 56651 13752 42899 1184 36232
Source SD Governors Office of Economic Development based on 2018 federal tax data and 2017 state tax data
Education Commission of the States
South Dakota Blue Ribbon Task Force on School Funding
Pierre South DakotaJuly 2015
Michael GriffithSchool Finance ConsultantEducation Commission of the States
Education Commission of the States
Education Commission of the States
Created by states for states in 1965 to track state policy trends translate academic research provide unbiased advice and create opportunities for state leaders to learn from one another
53 member states territories and the District of Columbia
Contact wwwecsorg (303) 2993600
2
Education Commission of the States
Per Pupil Expenditures 2006-07 to 2016-17
3
$0
$2000
$4000
$6000
$8000
$10000
$12000
2003-04 2004-05 2005-06 2006-07 2007-08 2008-09 2009-10 2010-11 2011-12 2012-13 2013-14 2014-15 2015-16 2016-17
National Average South Dakota
Source NEA Rankings amp Estimates
Education Commission of the States
Average Per Pupil Expenditures in Bordering States
4
$6500
$7500
$8500
$9500
$10500
$11500
$12500
$13500
Iowa
Minnesota
Montana
Nebraska
North Dakota
South Dakota
Source NEA Rankings amp Estimates
Education Commission of the States
Average Teacher Salaries in Bordering States
5
$35000
$40000
$45000
$50000
$55000
$60000
2006-07 2007-08 2008-09 2009-10 2010-11 2011-12 2012-13 2013-14 2014-15 2015-16
Iowa
Minnesota
Montana
Nebraska
North Dakota
South Dakota
Source NEA Rankings amp Estimates
Education Commission of the States
Teacher Salaries amp Average Per Pupil Expenditures FY 2015-16
6
$6000
$8000
$10000
$12000
$14000
$16000
$18000
$20000
$22000
$40000 $45000 $50000 $55000 $60000 $65000 $70000 $75000 $80000
South Dakota
National Average
Per P
upil
Expe
nditu
res
Teacher Salaries
Education Commission of the States
For More Information
7
Michael GriffithEducation Commission of the States
700 Broadway Suite 810Denver Colorado 80203
(303) 299-3600wwwecsorg
mgriffithecsorg
- Teacher Compensation Review Board Minutes 082918 (002)
- Ingersoll PowerPntSD Talk 62018
-
- Slide Number 1
- The Source of Data
- Schools with Serious Teacher Shortages(Percent Public Secondary Schools with Teaching Vacancies and with Serious Difficulties Filling those Vacancies by Field 2015-16)
- The Surprising Sources of Teacher Supply (Percent of Newly Hired Teachers in the Public School System by Supply Source 2015-16)
- Attrition in Teaching is Higher Than in Many OccupationsProfessions(Among 1993 College Grads Who Entered Selected Occupations by 1997 Percent Gone From Occupation by 2003)
- Slide Number 6
- Beginning Teachers Leave Teaching at Highest Rates (Cumulative Percent Teacher Attrition by Years of Experience 1993-2003
- Job Dissatisfaction a Leading Factor Behind Teacher Turnover (Percent Public School Teachers Reporting that Various Reasons Were Important for their Turnover 2012-13)
- Teachersrsquo Working Conditions are Important for Turnover(Of Those Public School Teachers Who Moved From or Left Their School Because of Dissatisfaction Percent Reporting Particular Sources of Dissatisfaction 2012-13)
- Teacher Recruitment Alone Does Not Work
- Slide Number 11
- Research Shows Positive Effects of Induction amp Support Program for Beginning Teachers
- For Further Information Copies of Articles Reports etc
-
- SD DOE Blue Ribbon Update Final
-
- Trends in Educator Preparation and Employment in South Dakota
- Setting the Stage Purpose amp Source Data
- Slide Number 3
- Slide Number 4
- South Dakota Distribution of Teachers by Grade Span Type 2016-17
- South Dakota Overview of the field2016-17 Year
- South Dakota District normsTeacher average years experience
- Slide Number 8
- South Dakota Age distribution of teachers 2016-17
- South Dakota District normsTeacher average startingbase salary
- South Dakota District normsTeacher average salary (not total compensation)
- South Dakota District normsAdministrator average salary (not total compensation)
- 2017-18 Headcount by Assignment Area
- South Dakota Key pieces of pipeline data
- 5 Year Projections Teacher Need
- Need to meet student growth
- South Dakota District NormsAverage Student to Teacher Ratio
- South Dakota K-12 student enrollments including 5 year projections
- South Dakota Teacher need to meet anticipated student growth
- Slide Number 20
- South Dakota Administrator teacher and education specialist retirements2011-2016
- South Dakota One Five and ten-year retirementseligible versus estimated
- Slide Number 23
- South Dakota Reasons that K-12 teachers do not return to their position (Headcount)
- South Dakota Reasons teachers do not return to prior position (201718 School Year)
- South Dakota Estimated number of teachers leaving the field
- Slide Number 27
- South Dakota 5-year projected teacher need
- Slide Number 29
- South Dakota Total FTE of Certified Teachers and Total Number of New Certificates last 5 years
- Slide Number 31
- South Dakota Teacher preparation graduates2002-03 to 2016-17
- BOR Teacher Graduate PlacementsFY 2002-2016
- South Dakota Trajectories for new teacher graduates next 5 years
- Slide Number 35
- South Dakota Teachers from out-of-state 2010-2014
- Slide Number 37
- South Dakota Alternative certificates
- Slide Number 39
- South Dakota Five-year teacher pipeline projections
- Slide Number 41
- South Dakota Pipeline Overview
- Slide Number 43
- 2018 Preliminary Plans of Intent
- South Dakota Unfilled Vacancies First Day of School 2017-18
- South Dakota High School vacancies by FTE first day of school 2014-2015
- Slide Number 47
- South Dakota Hard to fill positions Plans of Intent 2017-18
- South Dakota Plan of Intent Trends
- South Dakota Hard to fill position resolution of Unfilled Vacancies 2014-15 (October 15)
- Slide Number 51
- South Dakota Flexible Learning OptionsSouth Dakota Virtual School Courses
- South Dakota Flexible Learning OptionsSouth Dakota Virtual School Courses
- South Dakota Flexible Learning OptionsSouth Dakota Virtual School Courses
- South Dakota Flexible Learning OptionsDual Credit Courses
- South Dakota Flexible Learning OptionsDual Credit Courses by Institution
- Slide Number 57
-
- NEA teacher salary ranking
- NEA teacher salary ranking with regional price parities
- BEA 2016 real person income for states and metro areas (1)
- BEA 2016 regional price parities by state
- Purchasing Power
- Teacher Wage Calculator Short
- ECS Spending and Salary Data June 2018
-
- Slide Number 1
- Education Commission of the States
- Per Pupil Expenditures 2006-07 to 2016-17
- Average Per Pupil Expenditures in Bordering States
- Average Teacher Salaries in Bordering States
- Teacher Salaries amp Average Per Pupil Expenditures FY 2015-16
- For More Information
-
| Mathematics | Science | Special Educ | Foreign Lang | CareerTech Ed | English | Computer Sc | MusicArt | Social Studies | |||||||||||
| Vacancies | 45 | 34 | 43 | 29 | 28 | 49 | 12 | 25 | 40 | ||||||||||
| Hiring Difficulties | 17 | 16 | 14 | 10 | 9 | 6 | 4 | 3 | 3 |
| Mathematics | Mathematics | ||
| Science | Science | ||
| Special Educ | Special Educ | ||
| Foreign Lang | Foreign Lang | ||
| CareerTech Ed | CareerTech Ed | ||
| English | English | ||
| Computer Sc | Computer Sc | ||
| MusicArt | MusicArt | ||
| Social Studies | Social Studies |

Sheet1
The Surprising Sources of Teacher Supply (Percent of Newly Hired Teachers in the Public School System
by Supply Source 2015-16)
Newly Qualified with only Education School
degrees 25
Newly Qualified with both Education and
Noneducation Degrees 5
Newly Qualified with only Noneducation
Degrees 14
Reserve Pool 56
Attrition in Teaching is Higher Than in Many OccupationsProfessions
(Among 1993 College Grads Who Entered Selected Occupations by 1997 Percent Gone From Occupation by 2003)
79
49
49
45
30
28
23
19
19
16
14
0 20 40 60 80 100
Secretaries
Child Care Workers
Paralegals
Correctional Officers
TEACHERS
Police
Architects
Nurses
Lawyers
Engineers
Pharmacists
Source Ingersoll R amp Perda D forthcoming How High is Teacher Turnover and is it a Problem Consortium for Policy Research in Education Univ Penn
Percent
Teaching Force3385171
Schools Suffer from a Revolving Door (Numbers of Public School Teachers in Transition Into
and Out of Schools Before and After 2011-12 School Year)
Turnover531340
Hires 343955
At Beginning of School Year During School Year After End of School Year
Source Ingersoll R original analyses of 2011-13 Schools and Staffing Survey Teacher Followup Survey
Beginning Teachers Leave Teaching at Highest Rates
(Cumulative Percent Teacher Attrition by Years of Experience 1993-2003
446
391
306
23
119
0 20 40 60 80 100
Less than 5 years
Less than 4 years
Less than 3 years
Less than 2 years
Less than 1 year
PercentSource Perda D 2013 Transitions Into and Out of Teaching A Longitudinal Analysis of Early Career Teacher Turnover PhD Dissertation Univ of Penn
Job Dissatisfaction a Leading Factor Behind Teacher Turnover
(Percent Public School Teachers Reporting that Various Reasons Were Important for their Turnover 2012-13)
557
36
444
202
187
0 20 40 60 80 100
Dissatisfaction
To Pursue Other Job
Family or Personal
School Staffing Action
Retirement
PercentSource Ingersoll R original analyses of 2012-13 Teacher Followup Survey
Teachersrsquo Working Conditions are Important for Turnover
(Of Those Public School Teachers Who Moved From or Left Their School Because of Dissatisfaction Percent Reporting Particular Sources of
Dissatisfaction 2012-13)
295
295
406
472
482
501
516
579
605
0 20 40 60 80 100
Class Sizes too Large
Poor SalaryBenefits
Dissatisfied with TchingAssignment
Poor Facilities amp Resources
Student Discipline Problems
Classroom Intrusions
Lack of Influence amp Autonomy
Dissatisfied with Administration
Dissatisfied withAccountabilityTesting
PercentSource Ingersoll R original analyses of 2012-13 Teacher Followup Survey
Teacher Recruitment Alone Does Not Work
In 2010 the federal ldquo100k in 10rdquo initiative was launchedRecruitment of 10000 New MathScience Teachers per year for 10 years
But between 2012 and 2013 alonehellip
- 40600 MathScience Teachers Left Teaching Altogether
- Of them
- 8900 Retired
- 15200 reported Dissatisfaction as a major reason for leaving
- 37000 MathScience Teachers Moved to Other Schools
- Of them- Four times as many moved to affluent as to poor schools
The Leaky Bucket
Research Shows Positive Effects of Induction amp Support Program for
Beginning Teachers
bull We examined 15 best empirical studies since the 1980s
bull three sets of outcomesndash teacher commitment and retentionndash teacher classroom instructional practices ndash student achievement
bull Most of the studies reviewed showed positive impacts
Source Ingersoll amp Strong 2011 The Impact of Induction and Mentoring for Beginning Teachers A Critical Review of the Researchrdquo Review of Educational Research 81(2) 201-233
For Further Information Copies of Articles Reports etc
wwwgseupennedufacultyingersoll
rmiupennedu
Trends in Educator Preparation and Employment in South Dakota
Presented byAbby Javurek
Director Division of Accountability SystemsSouth Dakota Department of Education
06202018
Setting the Stage Purpose amp Source Data
bull Purpose Examine South Dakota teacher pipelinebull Goal Help the committee to frame SD data in the
national contextbull Data sources SD DOE data sets South Dakota
Retirement System IPEDS federal reports Boardof Regents Teacher Graduate Reports
Overview of the South Dakota Teaching Field
8500
8600
8700
8800
8900
9000
9100
9200
9300
9400
9500
9600
110000
115000
120000
125000
130000
135000
South Dakota Number of elementary and secondary school teachers and students 2005-2018
K-12 Fall StudentEnrollment
Total ClassroomTeachers (FTE)
SOURCE SD DOE Statistical Digest amp SDDOE Fall Enrollment Reports
South Dakota Distribution of Teachers by Grade Span Type 2016-17
069594
4011
1774
2529
995
018 010 Pre-Kindergarten
Kindergarten
Elementary
MSHS
High School
Special Education
Gifted
DeafHearing ampBlindVisually Impaired
Pre-Kindergarten Teachers FTE 667Kindergarten Teachers FTE 57257Elementary Teachers FTE 3864MSHS Teachers FTE 170943High School Teachers FTE 243627Special Education Teachers FTE 95838
Gifted Teachers FTE 1747DeafHearing amp BlindVisually Impaired Teachers FTE 931TOTAL 963413
bull Elementary Self-Contained is largest group of teachers (nearly 40 of all FTE)
bull If combined with Kindergarten Elementary is greater than Middle and High School combined
SOURCE SD DOE Statistical Digest
South Dakota Overview of the field2016-17 Year
SOURCE SD DOE Personnel Record Form database SD DOE Statistical Digest
Teachers on Plans of Intent
654 Number of Non-Certified Educators
640
Percent of Teachers with Advanced Degrees
347 Average District Beginning Salary
$37680
Average Years of Experience
141 Average Salary $46922
Number Students (K-12 Fall Enrollment)
132520 Student to Teacher Ratio (K-12)
141 1
Of the 963413 Teacher FTE in South Dakota
SOURCE SD DOE Statistical Digest Plans of Intent from Personnel Record Form (PRF)
South Dakota District normsTeacher average years experience
SOURCE SD DOE statistical digest 2017-18 is preliminary only
2010-11 2011-12 2012-13 2013-14 2014-15 2015-16 2016-17 2017-18Max Average years Experience (teacher) 289 298 306 247 232 241 246 222Min Average Years experience (teacher) 73 83 72 50 70 46 46 43Average Years Experience (teacher) 150 149 150 144 140 138 134 137
00
50
100
150
200
250
300
350
South Dakota District normsAdministrator average years experience
SOURCE SD DOE statistical digest 2017-18 is preliminary only
2010-11 2011-12 2012-13 2013-14 2014-15 2015-16 2016-17 2017-18Max Average Administrator experience 300 370 320 330 340 420 360 370Min Average Administrator experience 00 00 00 00 00 00 00 00Average Administrator experience 116 118 117 118 115 113 113 119
00
50
100
150
200
250
300
350
400
450
South Dakota Age distribution of teachers 2016-17
bull About 30 of teachers in the state are over the age of 51
bull SD has seen the most growth in the numbers of younger teachers and a decline in teachers over the age of 51
Age 20-30 195118Age 31-40 255624Age 41-50 227132Age 51+ 278869
SOURCE SD DOE statistical digest
2039
26722374
2915 Age 20-30Age 31-40Age 41-50Age 51+
South Dakota District normsTeacher average startingbase salary
SOURCE SD DOE statistical digest 2017-18 is preliminary only
2012-13 2013-14 2014-15 2015-16 2016-17 2017-18Max teacher base salary $35870 $36010 $37510 $38510 $44950 $45400Min teacher base salary $22000 $22900 $24000 $25000 $28000 $30000Average teacher base salary $29100 $29950 $30153 $32542 $37627 $38147
$0
$5000
$10000
$15000
$20000
$25000
$30000
$35000
$40000
$45000
$50000
South Dakota District normsTeacher average salary (not total compensation)
SOURCE SD DOE statistical digest 2017-18 is preliminary only
2010-11 2011-12 2012-13 2013-14 2014-15 2015-16 2016-17 2017-18Max Average Teacher Salary $47315 $47438 $47196 $48343 $49825 $49778 $54703 $55353Min Average Teacher Salary $27212 $27093 $27479 $28125 $29916 $31303 $36587 $35906Average Salary $39253 $38807 $39018 $40023 $40935 $42025 $46922 $47631
$0
$10000
$20000
$30000
$40000
$50000
$60000
South Dakota District normsAdministrator average salary (not total compensation)
SOURCE SD DOE statistical digest 2017-18 is preliminary only
2010-11 2011-12 2012-13 2013-14 2014-15 2015-16 2016-17 2017-18Max Average Administrator Salary $100679 $148000 $132663 $132000 $134213 $110301 $116278 $116827Min Average Administrator Salary $45046 $32213 $42717 $42657 $48193 $42417 $50000 $22500Average Administrator Salary $72904 $72863 $73758 $75057 $77184 $78993 $82754 $83432
$0
$20000
$40000
$60000
$80000
$100000
$120000
$140000
$160000
2017-18 Headcount by Assignment Area
Assignment CategoryTotal 2018
Head Count Public
Non-Public School District
TribalBIE School
Cooperative or Multi-District
State Special School
Alternative School
Virtual Providers
Administrators 740 607 80 44 6 2 1 0
Career and Technical Education 882 765 44 24 23 2 1 23English Language Learner 71 70 1 0 0 0 0 0
Fine Arts 327 283 27 11 3 0 0 3Language Arts 1871 1666 97 81 4 5 4 14Math 1354 1178 85 71 3 4 1 12Military 6 4 0 2 0 0 0 0
Miscellaneous 1038 950 39 38 7 2 0 2Music 559 500 53 2 0 1 0 3Non-Credit 5110 4664 279 142 10 15 0 0
PE-Health 659 568 51 27 3 1 2 7Religion 60 1 59 0 0 0 0 0
Science 1074 927 69 53 3 4 2 16Elementary 3877 3375 353 146 1 0 0 2Social Science 1145 982 85 52 4 4 2 16Special Education 1209 1091 18 50 35 12 3World Language 261 177 37 29 1 0 0 17
20243 17808 1377 772 103 52 16 115SOURCE SD DOE Personnel Record Form
South Dakota Key pieces of pipeline data
SOURCE SD DOE Personnel Record Form and certification databases BOR data from BOR Reports Non BOR from IPEDS
2016-17 ldquoOtherrdquo Certificates (Preliminary)
Number of Graduates from South Dakota Teacher Prep-
Programs 2015-16 (most recent complete data available)
Number of Certificates Awarded to non-SD graduates
288
Number of Alternative (Non-TFA) Certificates Awarded
65Board of Regents Universities 509
Number of Teach for America Teachers 27 Private
Universities 161
TOTAL First Time Certificates Issued 1119 New Alternative Certificate Structure in 2017-18 with new certification rules
5 Year Projections Teacher Need
Need to meet student growth
South Dakota District NormsAverage Student to Teacher Ratio
Statewide average hovers
around 140
District Maximum and Minimum Student to Teacher Ratios
SOURCE SD DOE Statistical Digest 2017-18 is preliminary only
2010-11 2011-12 2012-13 2013-14 2014-15 2015-16 2016-17 2017-18Max Student to Teacher Ratio 176 177 172 175 176 168 174 174Min Student to Teacher Ratio 59 50 38 60 35 38 37 52Statewide Student to Teacher Ratio 135 140 141 140 140 141 141 142
00
20
40
60
80
100
120
140
160
180
200
South Dakota K-12 student enrollmentsincluding 5 year projections
Projections call for enrollments to increase by about 7400 over the next 5 years
SOURCE SD DOE statistical digest census data and SD K-12 enrollment trends
110000
115000
120000
125000
130000
135000
140000
145000
FY2010 FY2011 FY2012 FY2013 FY2014 FY2015 FY2016 FY2017 FY2018 FY2019 FY2020 FY2021 FY2022 FY2023
South Dakota Teacher need to meet anticipated student growth To maintain
current student to
teacher ratio averages an
additional 456 FTE are needed in the next 5
yearsEstimated Projected Teacher Need FY2019 FY2020 FY2021 FY2022 FY2023Teachers to Maintain 140 Student to Teacher ratio
966471 976971 987521 998186 1008964
800000
850000
900000
950000
1000000
1050000
FY2019 FY2020 FY2021 FY2022 FY2023
Teachers needed to maintain a 1401 student to teacher ratio
Need to replace retirees
South Dakota Administrator teacher and education specialist retirements
2011-2016471 of all
eligible education
retirees actually
retire
SOURCE South Dakota Retirement System 2015-16 Potential numbers not available
-
200
400
600
800
1000
1200
2011-12 2012-13 2013-14 2014-15 2015-16 2016-17
Potential
Actual
South Dakota One Five and ten-year retirementseligible versus estimated
State data indicates that
teachers comprised 718
of education retirees in the
most recent year
5 year estimate 876 teachers
retiring
Future Retirement Estimates- based on 4 year average
SOURCE Eligible from South Dakota Retirement System Estimated based on projections of 494 retiring
-
500
1000
1500
2000
2500
3000
3500
4000
4500
2017-18 Next 5 years Next 10 years
Eligible
Estimated
Need to replace teachers leaving for other reasons
South Dakota Reasons that K-12 teachers do not return to their position (Headcount)
Public School Districts 2014-15 2015-16 2016-17 2017-18
Employed in another schooldistrict outside of state 83 110 86 62
Familypersonal relocation 98 99 96 45
On Leave of Absence or Sabbatical 7 13 12 13
Other employment in education 119 72 75 79
Other employment outside of education 91 109 86 86
Reason Unknown 172 217 136 117
Retirement 293 261 236 178
Laid Off 5 2 11 10
Discharged 21 29 32 33
Employed in another accredited SD schooldistrict 254 269 216 183
Illness 5 7 6 3
Death 7 2 3 7
Mentor 5 7 2 3
Employed by district in another capacity not tracked 8 25 19 13
TOTAL 1168 1223 1018 833
SOURCE SD DOE personnel record form
South Dakota Reasons teachers do not return to prior position (201718 School Year)
Teachers Admin Educ SpecDeath 537 000 100Employed by District in another capacity not tracked 1017 200 17111Employed in another accredited SD schooldistrict 17488 1360 2141Employed in another schooldistrict out of state 6000 113 459Familypersonal relocation 4234 085 373Illness 300 041 000Non-Renewal 3139 160 000On Leave of Absence or Sabbatical 1150 000 100Other employment in education 7202 624 1117Other employment outside of education 7726 370 1013Mentor 300 000 000Reason Unknown 10842 300 1213Reduction-in-Force 880 000 140Retirement 16595 1200 2188
TOTAL 77410 4453 25955Percent of 2016-17 Staff 8 8 23
Percent of Staff Leaving Education in SD 4 3 4Percent of Staff Still in SD Education Field but in Different Position 3 4 18
Percent Unknown 1 1 1
SOURCE SD DOE personnel record form
South Dakota Estimated number of teachers leaving the field
Estimatesbull 2 of teachers will
continue to leave the field for reasons other
than retirement
bull In next 5 years 988 teachers will leave the education field in SD
Estimated number of Teachers
Estimated number No longer Employed
2018-19 9665 193
2019-20 9770 195
2020-21 9875 198
2021-22 9982 200
2022-23 10090 202
Five Year Total 988
Putting it all together 5 Year Projected Need
South Dakota 5-year projected teacher need
RETIREES NEED TO MEETSTUDENT GROWTH
TEACHERS LEAVINGTHE FIELD
NEED 876 456 988
0
200
400
600
800
1000
1200
South Dakota Teacher Pipeline
South Dakota Total FTE of Certified Teachers and Total Number of New Certificates last 5 years
SOURCE SD DOE Certification and Personnel Record Form databases
2010-11 2011-12 2012-13 2013-14 2014-15 2015-16 2016-17New Certificates Issued 1174 1103 1074 1083 1250 1198 1119FTE Certified Teachers PK-12 9321 9099 9196 9362 9483 951589 963413
0
2000
4000
6000
8000
10000
12000
Pipeline South DakotaCollege Graduates
South Dakota Teacher preparation graduates2002-03 to 2016-17
SOURCE 2002-201516 SD BOR data from SD BOR Non-BOR from IPEDS Completion report (2016-17 data is preliminary IPEDS data)
050
100150200250300350400450500550600650700
BOR Grand Total
Non-BOR Grand Total
2001-2002
2002-2003
2003-2004
2004-2005
2005-2006
2006-2007
2007-2008
2008-2009
2009-2010
2010-2011
2011-2012
2012-2013
2013-2014
2014-2015
2015-2016
2016-2017
Non-BOR Grand Total 193 189 193 187 166 176 169 169 159 177 170 185 194 173 161 162
BOR Grand Total 507 476 472 434 447 417 410 432 381 472 469 480 486 432 509 451
Combined Grand Total 700 665 665 621 613 593 579 601 540 649 639 665 680 605 670 613
BOR Teacher Graduate PlacementsFY 2002-2016 Approximately half
(554) of all undergraduate teacher education graduates since FY2002 have been placed in an in-state school district
Placement rates are dramatically higher for teacher education candidates who attended a South Dakota high school
South Dakota Trajectories for new teacher graduates next 5 years Per the most
recently available long term data 554 of all Board of Regents teacher education graduates were employed in South Dakota
This means that we expect 1742 of 3144 grads to take jobs in SD in the next 5 years
2016-17 2017-18 2018-19 2019-20 2020-21Board of Regents Universities 162 174 174 174 174Non-BOR Universities 451 458 458 459 460TOTAL 613 632 632 633 634
Five Year Total 3144
5 Years Estimated SD Teacher Graduates
Projected Grads
Projected Placed in SD
2016-17 613 3402017-18 632 3502018-19 632 3502019-20 633 3512020-21 634 351TOTAL 3144 1742
Estimated SD Placements
Pipeline Out of StateCollege Graduates
South Dakota Teachers from out-of-state 2010-2014 On average
5566 of out of state educators who apply for certification in South Dakota will be employed in South Dakota public schools
5 year trajectorybull 1536 out-of-
state applicants
bull 855 employed in the SD public schools
Certificates Issued to Out-of-State Graduates
SOURCE SD DOE Certification and Personnel Record Form databases
Certificates Issued
Employed in SD
Employed
Administration Endorsement
Educator Specialist Endorsement
Teacher Endorsement
2010 440 268 6091 27 24 3892011 414 247 5966 17 21 3762012 466 283 6073 24 30 4122013 490 320 6531 27 11 4522014 435 265 6092 21 20 3942015 416 192 4615 18 8 4002016 370 178 4811 14 11 358
2017 299 130 4348 14 8 288
Pipeline Alternative Certification
South Dakota Alternative certificates
Expectationsbull The alternative
Certification program will continue to grow but will stabilize under the new rules
bull Teach For America will remain steady at an average 23 teachers a year
bull 5 year conservative projection 295
bull new teachers
SOURCE SD DOE Certification and Personnel Record Form databases
Alternative Certificates
Teach For America
Total Alternative
2010-11 41 26 67
2011-12 37 17 54
2012-13 51 15 66
2013-14 48 23 71
2014-15 55 31 86
2015-16 86 29 115
2016-17 114 19 133
2017-18 188 20 208
Putting it all together 5-year teacher pipeline
projections
South Dakota Five-year teacher pipeline projections
Projected 5 Year new
teacher pool2892
1742
855
295
0
200
400
600
800
1000
1200
1400
1600
1800
2000
INCOMING SDGRADUATES
OUT OF STATEGRADUATES
ALTERNATIVEPROGRAMS
Projected Totals
South Dakota Pipeline Overview
The estimated supply of teachers
indicates the potential
teacher pool will be 572
more than the minimal five-
year need 876
456
988
1742
855
295
0
500
1000
1500
2000
2500
3000
3500
NEED PIPELINE
ALTERNATIVEPROGRAMS
OUT OF STATEGRADUATES
INCOMING SDGRADUATES
TEACHERS LEAVING THEFIELD
NEED TO MEET STUDENTGROWTH
RETIREES
Hard to Fill Positions
2018 Preliminary Plans of IntentEducator Assignment PLANS OF INTENT BY HEAD COUNT Percent on Plan of IntentAdministrators 18 3Career and Technical Education 108 14English Language Learner 13 19Fine Arts 13 5Language Arts 64 4Math 41 3Military 0 0Miscellaneous 4 0Music 14 3Non-Credit 3 0PE-Health 35 6Religion 0 0Science 59 6Elementary 77 2Social Science 63 6Special Education 39 4World Language 16 9
567 3
SOURCE SD DOE Personnel Record Form database
South Dakota Unfilled Vacancies First Day of School 2017-18
bull Includes ALL Public schools
bull Represents teaching positions at 78 schools 39 districts
bull Administrator and School Service Specialists at 11 districts
SOURCE SD DOE Personnel Record Form database
FTE CoursesAdministrators 1Career and Technical Education 348 22Education Specialists 1211 14English Learner ESL 1 1Fine Arts 115 2Language Arts 386 20Math 373 22Miscellaneous 2 8Music 08 1Non-Credit 546 24PE-Health 019 2Science 18 9Elementary 1346 15Social Science 097 4Special Education 1252 13World Language 024 2Total FTE 6377 161
South Dakota High School vacancies by FTE first day of school 2014-2015
bull Represents positions at 24 schools and districts (1194 of HS)
bull Math amp Science 8 high schools with at least 1 unfilled course (40 of HS)
bull English 3 high schools with at least 1 unfilled course (15 of HS)
SOURCE SD DOE Personnel Record Form database
FTEPercent of
ALL FTE vacancies
Administrators 066 6600Career and Technical Education 284 8161Education Specialists 05 413Fine Arts 015 1304Language Arts 244 6321Math 222 5952Miscellaneous 058 2900Non-Credit 442 8095PE-Health 006 3158Science 153 8500Social Science 05 5155Special Education 452 3610World Language 024 10000
TOTAL 2066 3240
Hard to Fill Positions
South Dakota Hard to fill positions Plans of Intent 2017-18 bull Includes all Public Schools
in the state
bull English as a Second Language World Language and CTE teachers were the most likely to be on Plans of Intent
bull Highest numbers of Plans of intent in Elementary CTE Language Arts amp Social Science
PLANS OF INTENT(HEAD COUNT)
OF CATEGORY
Administrators 18 3
CTE 108 14
ESL (Non-Core) 13 19
Fine Arts 13 5
Language Arts 64 4
Math 41 3
Military 0 0
Miscellaneous 4 0
Music 14 3
Non-Credit 3 0
PE-Health 35 6
Science 59 6
Elementary 77 2
Social Science 63 6
Special Ed (Non-Core) 39 4
World Language 16 9
SOURCE SD DOE Personnel Record Form database
South Dakota Plan of Intent Trends
bull One teacher may be on multiple plans of intent to teach multiple courses
bull Both the number of teachers and the number of plans of intent has been growing
bull Plans of Intent are issued for up to 2 years in most casesbull Educators have completed 2449 of Plans of Intent in recent years
on average This is down from pre-2015 percentages
SOURCE SD DOE Personnel Record Form database
2015 2016 2017 Plans of Intent 576 726 676
Not Completed NA 538 520Completed NA 188 156
Headcount 501 596 563
SOURCE SD DOE Personnel Record Form database
South Dakota Hard to fill position resolutionof Unfilled Vacancies 2014-15 (October 15)
bull Most common resolution was to re-assign duties to other staff
bull Vacant courses is down from 2015
SOURCE SD DOE Personnel Record Form database
of Courses of Vacancies
Eliminate CourseProgram 27 1677Additional duties given to other staff 38 2360
Hired certified candidate after school started 8 497
Increased Class size 16 994Position remains vacant 31 1925Use Distance Learning 14 870Other 27 1677
Total (including Administrators and School Service Specialists)
161
Hard to Fill PositionsFlexible Course Offerings
South Dakota Flexible Learning OptionsSouth Dakota Virtual School Courses
SOURCE SD Virtual School annual reports
bull Represents officially reported public school enrollments
bull 1622 increase in student enrollments since 2010-11
Districts CoursesTotal
Student EnrollmentsPublic Other Available Offered
2010-11 118 233 3446
2011-12 127 255 3389
2012-13 133 289 3750
2013-14 135 298 3837
2014-15 133 16 389 3952
2015-16 126 15 209 4078
2016-17 133 13 275 4005
South Dakota Flexible Learning OptionsSouth Dakota Virtual School Courses
SOURCE SD Virtual School annual reports
bull Over time offerings in more subjects have been added
bull Credit Recovery and World Languages have the highest enrollments
2010-2011
2011-2012
2012-2013
2013-2014
2014-2015
2015-2016
2016-2017
CTE 276 283 316 401 400 365 284Credit Recovery 842 942 946 727 627 559 609College Readiness 115 169 128 115 90
Fine Arts 188 114 127 132 132 107 59HealthPE 105 60 43 66 55 151 123ELA 320 299 351 297 255 411 287Math 340 194 246 286 334 653 344Sciences 280 334 396 413 524 403 310Social Sciences 798 137 165 190 285 311 200World Language 1008 1015 1098 1061 808 698Personal FianceEcon 1 7 40 44 66 45
Technology 14 10 9 9 3 7Elementary 84 89 17Other 38 3 13 9 14 37 0
bull Credit Recovery courseshad the lowestcompletion rates acrossthe board and accountfor a significant portionof enrollments
bull Completion rates haveincreased over time
bull Overall completion ratewithout Credit Recoverycourses included jumpsfrom 6424 to 7439
South Dakota Flexible Learning OptionsSouth Dakota Virtual School Courses
SOURCE SD Virtual School annual reports
2014-15 2015-16 2016-17
EnrolledCompletion
Rate EnrolledCompletion
Rate EnrolledCompletion
Rate
CTE 400 688 365 967 284 954
Credit Recovery 627 217 559 243 609 232
College Readiness 128 633 115 461 90 900
Fine Arts 132 705 107 766 59 780
HealthPE 555 618 151 483 123 545
ELA 255 416 411 496 287 530
Math 334 458 653 583 344 552
Sciences 524 523 403 806 310 868
Social Sciences 285 428 311 701 200 710
World Language 1061 523 808 783 698 807
Personal FianceEcon 44 796 66 773 45 778
Technology 9 556 3 1000 7 857
Elementary 84 524 89 472 17 647
Other 14 714 37 784 0
South Dakota Flexible Learning OptionsDual Credit Courses
SOURCE SD DOE dual credit program August 2015 reports
bull Total enrollments increased by 9337 and Credits earned by 9851 between 2014 and 2016
2014-15 (allterms)
2015-16 (allterms)
2016-17 (allterms)
2017-18(Fall only)
Total course enrollment 4227 6951 8174 4392Students taking at least 1
course 2135 2688 2717 1967
Credits earned 1141450 18590 22659 12943
000
500000
1000000
1500000
2000000
2500000
0
1000
2000
3000
4000
5000
6000
7000
8000
9000
South Dakota Flexible Learning OptionsDual Credit Courses by Institution
SOURCE SD DOE dual credit program August 2015 reports
2014-15 (all terms)
2015-16 (all terms)
2016-17 (all terms)
2017-18 (Fall only)
Black Hills State University 50 52 70 45Dakota State University 19 23 24 17Lake Area Technical Institute 51 64 65 60Mitchell Technical Institute 24 58 55 37Northern State University 30 46 43 33South Dakota School of Mines and Technology 23 26 35 15South Dakota State University 52 60 59 47Southeast Technical Institute 51 63 54 42University of South Dakota 37 54 63 39Western Dakota Tech 35 71 84 31
372 517 552 366
Questionsbull Abby Javurekbull SD Dept of Educationbull 6057733426bull AbbyJavurekstatesdusbull SD DOE website httpdoesdgov
Rankings of the States 2017 and
Estimates of School Statistics 2018
NEA RESEARCH April 2018
Reproduction No part of this report may be reproduced in any form without permission from NEA Research except by NEA-affiliated associations Any reproduction of the report materials must include the usual credit line and the copyright notice Address communications to NEA Research 1201 16th Street NW St 610 Washington DC 20036 or by email to RankingsEstimatesneaorg
Copyright copy 2018 by the National Education Association
All Rights Reserved
SALARY ($) RANK SALARY ($) RANK CHANGE () RANKAlabama 48518 38 50391 35 39 3 Alaska 67443 7 68138 8 10 34 Arizona 47218 43 47403 44 04 45 Arkansas 48218 39 48304 42 02 47 California 77179 2 79128 2 25 13 Colorado 51233 30 51808 31 11 32 Connecticut 72013 5 73147 5 16 25 Delaware 59960 14 60214 14 04 41 District of Columbia 73991 4 75692 4 23 18 Florida 46612 46 47267 45 14 26 Georgia 54190 23 55532 23 25 15 Hawaii 56049 20 56651 21 11 33 Idaho 46122 47 47504 43 30 8 Illinois 63475 11 64933 11 23 19 Indiana 53645 26 54308 26 12 30 Iowa 54386 22 55647 22 23 17 Kansas 47755 42 49422 40 35 4 Kentucky 52134 27 52338 29 04 46 Louisiana 49745 34 50000 37 05 40 Maine 50498 33 51077 33 11 31 Maryland 66456 8 68357 7 29 10 Massachusetts 76522 3 78100 3 21 20 Michigan 61875 12 62287 12 07 39 Minnesota 56913 17 57346 20 08 36 Mississippi 42744 50 42925 51 04 42 Missouri 47959 40 48618 41 14 27 Montana 51034 32 51422 32 08 38 Nebraska 51386 29 52338 30 19 21 Nevada 56943 16 57376 18 08 37 New Hampshire 56616 18 57522 17 16 24 New Jersey 69330 6 69623 6 04 44 New Mexico 47163 44 47122 47 -01 50 New York 79152 1 81902 1 35 5 North Carolina 47941 41 49970 39 42 2 North Dakota 51223 31 52968 27 34 6 Ohio 56441 19 58202 15 31 7 Oklahoma 45276 49 45292 50 00 49 Oregon 60395 13 61862 13 24 16 Pennsylvania 65151 10 66265 10 17 22 Rhode Island 66197 9 66477 9 04 43 South Carolina 48769 37 50000 38 25 14 South Dakota 42025 51 46979 48 118 1 Tennessee 48817 36 50099 36 26 12 Texas 51890 28 52575 28 13 29 Utah 46887 45 47244 46 08 35 Vermont 55726 21 57349 19 29 9 Virginia 49690 35 51049 34 27 11 Washington 53701 25 54433 25 14 28 West Virginia 45622 48 45555 49 -01 51 Wisconsin 54115 24 54998 24 16 23 Wyoming 58140 15 58187 16 01 48 United States 58479 - 59660 - 20 -
2016 2017 2016-17
B-6 AVERAGE SALARY OF TEACHERS
26
State RPP NEA Salary Adjusted Salary Rank State RPP NEA Salary Adjusted Salary RankMassachusetts 1078 $78100 $7244898 1 Vermont 1016 $57349 $5644587 27New York 1156 $81902 $7084948 2 Arkansas 869 $48304 $5558573 28California 1144 $79128 $6916783 3 Tennessee 902 $50099 $5554213 29Pennsylvania 984 $66265 $6734248 4 South Carolina 903 $50000 $5537099 30Connecticut 1087 $73147 $6729255 5 Louisiana 904 $50000 $5530973 31Michigan 933 $62287 $6675991 6 North Carolina 909 $49970 $5497250 32Rhode Island 996 $66477 $6674398 7 Montana 941 $51422 $5464612 33Illinois 989 $64933 $6565521 8 Kansas 905 $49422 $5460994 34DC 1159 $75692 $6530802 9 Missouri 895 $48618 $5432179 35Ohio 893 $58202 $6517581 10 New Hampshire 1059 $57522 $5431728 36Alaska 1054 $68138 $6464706 11 Texas 969 $52575 $5425697 37Maryland 1095 $68357 $6242648 12 South Dakota 883 $46979 $5320385 38Oregon 998 $61862 $6198597 13 West Virginia 876 $45555 $5200342 39Iowa 902 $55647 $6169290 14 Maine 984 $51077 $5190752 40New Jersey 1132 $69623 $6150442 15 Washington 1055 $54433 $5159526 41Georgia 921 $55532 $6029533 16 Idaho 930 $47504 $5107957 42Wyoming 967 $58187 $6017270 17 Oklahoma 890 $45292 $5088989 43Indiana 903 $54308 $6014175 18 New Mexico 936 $47122 $5034402 44Delaware 1002 $60214 $6009381 19 Colorado 1030 $51808 $5029903 45Kentucky 878 $52338 $5961048 20 Virginia 1023 $51049 $4990127 46Wisconsin 928 $54998 $5926509 21 Mississippi 864 $42925 $4968171 47Nevada 974 $57376 $5890760 22 Arizona 959 $47403 $4942961 48Minnesota 975 $57346 $5881641 23 Utah 973 $47244 $4855498 49Alabama 866 $50391 $5818822 24 Hawaii 1184 $56651 $4784713 50North Dakota 915 $52968 $5788852 25 Florida 997 $47267 $4740923 51Nebraska 905 $52338 $5783204 26
Sources NEA Ranking of the States 2017 and Estimates of School Statistics 2018 (April 2018)Bureau of Economic Analysis Regional Price Parities in 2016 (May 2018)
NEA 2017 AVERAGE TEACHER SALARIES BY STATEADJUSTED BY 2016 BEA REGIONAL PRICE PARITIES
61418 2)24 PMBEA News Release Real Personal Income for States and Metropolitan Areas 2016
Page 1 of 8httpswwwbeagovnewsreleasesregionalrpprpp_newsreleasehtm
EMBARGOED UNTIL RELEASE AT 830 AM EDT Thursday May 17 2018
BEA 18mdash23
3012789328
rppbeagov (mailtorppbeagov)
3012789003
Home (indexhtm) National (nationalindexhtm) International (internationalindexhtm)
Regional (regionalindexhtm) Industry (industryindexhtm) Interactive Data (itable) About BEA (aboutindexhtm)
FAQs (faqindexcfm)Contact Us (contactssearchhtm)
(indexhtm)
(httpwwwcommercegov)
Real Personal Income for States and MetropolitanAreas 2016
Real state personal income grew on average 11 percent in 2016after increasing 47 percent in 2015 according to estimates releasedtoday by the Bureau of Economic Analysis Real state personalincome is a states current-dollar personal income adjusted by thestates regional price parity and the national personal consumptionexpenditures price index The percent change in real state personalincome ranged from 33 percent in Utah and Georgia to -36 percentin Wyoming (table 1) In the District of Columbia real personalincome grew 45 percent Across metropolitan areas the percentchange ranged from 66 percent in Jacksonville NC to -81 percent inMidland TX and Odessa TX (table 4)
(newsreleasesregionalrpp2018_imagesrpp0518png)
Related Links
Full Release amp Tables (PDF)
(newsreleasesregionalrpp2018pdfrpp0518pdf)
State Tables Only(Excel)
(newsreleasesregionalrpp2018xlsrpp0518xlsx)
Metropolitan Area Tables Only(Excel)
(newsreleasesregionalrpp2018xlsrpp0518msaxlsx)
Highlights - State (PDF)
(newsreleasesregionalrpp2018pdfrpp0518_faxpdf)
Highlights - Metropolitan Area (PDF)
(newsreleasesregionalrpp2018pdfrpp0518b_faxpdf)
Interactive Tables (iTableiTableHtmlcfm
reqid=70ampstep=1ampisuri=1ampacrdn=8)
Contacts
Eric Figueroa (Technical)
Jeannine Aversa (Media)
Go
About Regional (regionalaboutcfm) Methodologies (regionalmethodscfm) Articles (regionalarticlescfm)
Release Schedule (newsreleasesnews_release_sort_regionalhtm) Staff Contacts (contactsemailhtm)
Email Subscriptions (_subscribe)
61418 2)24 PMBEA News Release Real Personal Income for States and Metropolitan Areas 2016
Page 2 of 8httpswwwbeagovnewsreleasesregionalrpprpp_newsreleasehtm
JeannineAversabeagov
(mailtoJeannineAversabeagov)
Real Personal Income in 2016
States with the fastest growth in real personal income wereUtah (33 percent) Georgia (33 percent) and Washington(30 percent) The District of Columbias real personalincome grew 45 percent
Eight states had declining real personal income The largestpercent declines were in Wyoming (-36 percent) Oklahoma(-27 percent) and Louisiana (-19 percent)
Large metropolitan areas ndash those with population greaterthan two million ndash with the fastest growth in real personalincome were Atlanta-Sandy Springs-Roswell GA (34percent) Orlando-Kissimmee-Sanford FL (33 percent) andCharlotte-Concord-Gastonia NC-SC (32 percent)
The three large metropolitan areas with declining realpersonal income were Houston-The Woodlands-Sugar LandTX (-33 percent) Denver-Aurora-Lakewood CO (-07percent) and Pittsburgh PA (-04 percent)
Regional Price Parities in 2016
Regional Price Parities (RPPs) measure the differences in price levelsacross states and metropolitan areas for a given year and areexpressed as a percentage of the overall national price level Allitems RPPs cover all consumption goods and services including rentsAreas with highlow RPPs typically correspond to areas with highlowprice levels for rents
States with the highest RPPs were Hawaii (1184) New York(1156) and California (1144) (table 3) The District ofColumbias RPP was 1159
States with the lowest RPPs were Mississippi (864) Alabama(866) and Arkansas (869)
Across states Hawaii had the highest rents RPP (1574) andAlabama and West Virginia had the lowest (632)
Large metropolitan areas with the highest RPPs were SanFrancisco-Oakland-Hayward CA (1247) New York-Newark-Jersey City NY-NJ-PA (1220) and Washington-Arlington-Alexandria DC-VA-MD-WV (1191) (table 6)
Large metropolitan areas with the lowest RPPs wereCincinnati OH-KY-IN (896) Cleveland-Elyria OH (902) andSt Louis MO-IL (908)
Across large metropolitan areas San Francisco-Oakland-Hayward CA had the highest rents RPP (1909) andCleveland-Elyria OH had the lowest (779)
Across all metropolitan areas San Jose-Sunnyvale-SantaClara CA had the highest rents RPP (2133) and Gadsden AL
Sign up (_subscribe) for e-mail notifications
Download (exit_siteasp
link=httpwwwadobecomproductsacrobatreadstep2html)
the Acrobat Reader
61418 2)24 PMBEA News Release Real Personal Income for States and Metropolitan Areas 2016
Page 3 of 8httpswwwbeagovnewsreleasesregionalrpprpp_newsreleasehtm
had the lowest (515)
Estimates of real personal income and regional priceparities for state metropolitan and nonmetropolitanportions can be found at httpswwwbeagovitable(iTableiTableHtmlcfmreqid=70ampstep=1ampisuri=1ampacrdn=8) Supplementaltables are available upon request
(newsreleasesregionalrpp2018_imagesrpp0518_chart_01png)
Updates to Real Personal Income
Today BEA also released revised real personal incomestatistics for states and metropolitan areas for 2014-2015 and real per capita personal income statistics forstates for 2010-2013 These revisions were made toincorporate newly available source data BEA willupdate real personal income for states on September25 2018 with the release of state personal incomeReal personal income for metropolitan areas will beupdated on November 15 2018 with the release of localarea personal income
Next release May 2019 ndash Real Personal Income for States andMetropolitan Areas 2017
Technical Notes on Regional Price Paritiesand Implicit Regional Price Deflators
61418 2)24 PMBEA News Release Real Personal Income for States and Metropolitan Areas 2016
Page 4 of 8httpswwwbeagovnewsreleasesregionalrpprpp_newsreleasehtm
Price indexes commonly measure price changes over time TheBEAs personal consumption expenditures (PCE) price index andthe Bureau of Labor Statistics consumer price index (CPI) aretwo examples Spatial price indexes measure price leveldifferences across regions for one time period An example ofthese type of indexes are purchasing power parities (PPPs)which measure differences in price levels across countries for agiven period and can be used to convert estimates of percapita GDP into comparable levels in a common currency Theregional price parities (RPPs) that BEA has developed compareregions within the United States but without the need forcurrency conversion An implicit regional price deflator (IRPD)can be derived by combining the RPPs and the US PCE priceindex
Regional Price Parities The RPPs are calculated using pricequotes for a wide array of items from the CPI which areaggregated into broader expenditure categories (such as foodtransportation or education) Data on rents are obtainedseparately from the Census Bureaus American CommunitySurvey (ACS) The expenditure weights for each category areconstructed using CPI expenditure weights BEAs personalconsumption expenditures and ACS rents expenditures
The broader categories and the data on rents are combinedwith the expenditure weights using a multilateral aggregationmethod that expresses a regions price level relative to theUS
For example if the RPP for area A is 120 and for area B is 90then on average prices are 20 percent higher and 10 percentlower than the US average for A and B respectively If thepersonal income for area A is $12000 and for area B is $9000then RPP-adjusted incomes are $10000 (or $12000120) and$10000 (or $9000090) respectively In other words thepurchasing power of the two incomes is equivalent whenadjusted by their respective RPPs
Implicit Regional Price Deflator The IRPD is a regional priceindex derived as the product of two terms the regional priceparity and the US PCE price index
The implicit regional price deflator will equal current dollarpersonal income divided by real personal income in chaineddollars The growth rate or year-to-year change in the IRPDs isa measure of regional inflation
Detailed information on the methodology used to estimate theRPPs may be found on the regional methodology page of theBEA website wwwbeagovregionalmethodscfm(regionalmethodscfm)
1
2
3
4
61418 2)24 PMBEA News Release Real Personal Income for States and Metropolitan Areas 2016
Page 5 of 8httpswwwbeagovnewsreleasesregionalrpprpp_newsreleasehtm
Additional Information
Resources
Stay informed about BEA developments by reading theBEA blog (httpblogbeagov) signing up for BEAsemail subscription service (_subscribe) or followingBEA on Twitter BEA_News(httpwwwtwittercomBEA_News)
Historical time series for these estimates can beaccessed in BEAs Interactive Data Application(itable)
Access BEA data by registering for BEAs DataApplication Programming Interface (APIsignup)(API)
For more on BEAs statistics see our monthly onlinejournal the Survey of Current Business (scb)
BEAs news release schedule(newsreleasesnews_release_schedulehtm)
Definitions
Personal income is the income received by or on behalf of allpersons from all sources from participation as laborers inproduction from owning a home or business from theownership of financial assets and from government andbusiness in the form of transfers It includes income fromdomestic sources as well as the rest of world It does notinclude realized or unrealized capital gains or losses
Per capita personal income is calculated as the total personalincome of the residents of a given area divided by thepopulation of the area In computing per capita personalincome BEA uses Census Bureau mid-year populationestimates
Personal income is measured before the deduction of personalincome taxes and other personal taxes and is reported incurrent dollars (no adjustment is made for price changes)Comparisons for different regions and time periods reflectchanges in both the price and quantity components of regionalpersonal income
The estimate of personal income for the United States is thesum of the state estimates and the estimate for the District ofColumbia it differs slightly from the estimate of personalincome in the national income and product accounts (NIPAs)because of differences in coverage in the methodologies usedto prepare the estimates and in the timing of the availabilityof source data
61418 2)24 PMBEA News Release Real Personal Income for States and Metropolitan Areas 2016
Page 6 of 8httpswwwbeagovnewsreleasesregionalrpprpp_newsreleasehtm
Regional price parities (RPPs) are regional price levelsexpressed as a percentage of the overall national price levelfor a given year The price level is determined by the averageprices paid by consumers for the mix of goods and servicesconsumed in each region
Detailed CPI price data are adjusted to obtain average pricelevels for BLS-defined areas These are allocated to countiesin combination with direct price and expenditure data on rentsfrom the ACS
County data are then aggregated to states and metropolitanareas
Personal income at RPPs is current-dollar personal incomedivided by the price parity for a given year and region Abalancing factor is applied so that the sum of personal incomeat RPPs across regions equals the current dollar sum
Real personal income is personal income at RPPs divided bythe national PCE chain-type price index The result is realpersonal income in chained dollars (using 2009 as the referenceyear) Using Alaska in 2016 as an example
(newsreleasesregionalrpp2018_imagesrpp0518_formula_01png)
Estimates of real personal income in the United States arederived as the sum of the regional estimates divided by theUS PCE Price Index
Implicit Regional Price Deflator (IRPD) is the product of theRPP times the national PCE price index It is equal to personalincome divided by real personal income See also the TechnicalNote
List of News Release Tables
Table 1 Real Personal Income and Implicit Regional PriceDeflators by State 2015-2016
5
6
61418 2)24 PMBEA News Release Real Personal Income for States and Metropolitan Areas 2016
Page 7 of 8httpswwwbeagovnewsreleasesregionalrpprpp_newsreleasehtm
Contact All of Us(contactssearchhtm)
Frequently AskedQuestions(faqindexcfm)
About BEA
News
US Economy ata Glance(newsreleasesglancehtm)
Current Releases(newsreleasesrelshtm)
News Release
InformationFor
Media(newsroomindexhtm)
CongressionalUsers(congressionalindexhtm)
Factsheets
Regional PI ampGDP(regionalbearfacts)
Intl Trade ampInvestment(internationalfactsheet)
Publications
Survey ofCurrent Business(scbindexhtm)
Papers by Topic(researchby_topichtm)
Resources
Interactive Data(itableindexcfm)
Research at BEA(researchindexhtm)
Developers(developers)
Table 2 Real Per Capita Personal Income by State 2015-2016
Table 3 Regional Price Parities by State 2016
Table 4 Real Personal Income and Implicit Regional PriceDeflators by Metropolitan Area 2015-2016
Table 5 Real Per Capita Personal Income by Metropolitan Area2015-2016
Table 6 Regional Price Parities by Metropolitan Area 2016
The BEA Regional Price Parity statistics are based in part onrestricted access Consumer Price Index data from the Bureauof Labor Statistics (BLS) The BEA statistics presented hereinare products of BEA and not BLS
To estimate RPPs CPI price quotes are quality adjusted andpooled over 5 years The ACS rents are also quality adjustedand are either annual for states or pooled over 3 years formetropolitan areas The expenditure weights are specific foreach year
The multilateral system that is used is the Geary additivemethod Any region or combination of regions may be used asthe base or reference region without loss of consistency
The growth rate of the implicit regional price deflators willnot necessarily equal the region or metro area price deflatorspublished by the BLS This is because the CPI deflators arecalculated directly while the IRPDs are indirect estimates andbecause of differences in the source data and methodology
The CPI represents about 93 percent of the total USpopulation including almost all residents of urban ormetropolitan areas In the Northeast region rural area prices(exclusive of rents) are assumed to be the same as those in thesmall metropolitan areas of the CPI in the Midwest South andWest regions they are assumed to be the same as those in thenonmetropolitan urban areas of the CPI
RPP should first be divided by 100
1
2
3
4
5
6
61418 2)24 PMBEA News Release Real Personal Income for States and Metropolitan Areas 2016
Page 8 of 8httpswwwbeagovnewsreleasesregionalrpprpp_newsreleasehtm
(aboutindexhtm)
Policies(aboutpolicieshtm)Privacy Policy(aboutPrivacy_Statementhtm)
FOIA(httpwwwosecdocgovomoFOIAFOIAWebsitehtm)
Accessibility(aboutaccessibilityhtm)
Commitment to ScientificIntegrity(_pdfscientific_integrity_statement_of_the_principal_statistical_agenciespdf)
Information Quality Guidelines(aboutinfoqualhtm)
Data Dissemination Practices(aboutBEAdisseminationhtm)
Open Data (datahtm)
ESR System (statusindexcfm)
USAgov (wwwusagov)
US Department of Commerce(wwwcommercegov)
Archive(newsreleasesrelease_archivehtm)
eFile Users(efile)
BE-13Respondents(surveysrespondent_be13htm)
Private FundReporters(surveysprivatefunds)
Job Seekers(jobsindexhtm)
Industry GDP(industryfactsheet)
Multimedia(videoindexhtm)
FAQs(faqindexcfm)
More
Directors Page(aboutdirectorhtm)
Conferences(agencyexhibit_schedulehtm)
Guidelines forCiting BEAInformation(aboutBEAcitinghtm)
61418 2)24 PMrpp0518_chart_01png 2204times2389 pixels
Page 1 of 1httpswwwbeagovnewsreleasesregionalrpp2018_imagesrpp0518_chart_01png
Purchasing Power
The attached spreadsheets are designed to accurately calculate federal income tax state income tax and FICA tax (Social Security and Medicare tax) on an individualrsquos annual wagesalary Taxes are computed assuming a single filer standard deduction and no additional dependents The accounting firm Eide Bailly prepares the calculations and they should be accurate within $5 annually Once we know how much in taxes are due we can determine after tax wages (gross salary less taxes) This is how much money a worker has left over once the government has taken out the correct amount of payroll taxes We also know that different areasregions have different costs of living For example New York City has a much higher cost of living than Sioux Falls To determine the cost of living in any given city or state the US Bureau of Economic Analysis (BEA) compares millions of price points on goods and services across the nation and produces Regional Price Parities (RPP) The national average of all costs is 100 A state or city with lower average costs will have an RPP of less than 100 (SDrsquoS is 883) and a city or state with a higher cost of living will have an RPP over 100 (for example Hawaiirsquos RPP is 1184) So to determine purchasing power we divide after tax wages by a given city or statersquos RPP This is the only way to have a meaningful comparison of wages in different cities and states The true measure of how well yoursquore paid is not your gross pay rather it is how much you can buy with your wages after the government has taken its share Note The BEA will release the 2017 RPPs in May of 2019
Rank State
Average Teacher Salary
(NEA 2017) Total Federal and State
Adjustments to Pay Take Home Pay RPP Cost of Living Index (BEA 2016)
After Tax Wages Adjusted for Cost
of Living (RPP) 1 Massachusetts 78100 20118 57982 1078 53787 2 Pennsylvania 66265 14983 51282 0984 52116 3 Alaska 68138 13500 54638 1054 51839 4 New York 81902 22018 59884 1156 51803 5 Ohio 58202 11987 46215 0893 51753 6 Rhode Island 66477 15043 51434 0996 51641 7 Michigan 62287 14242 48045 0933 51495 8 California 79128 20967 58161 1144 50840 9 Connecticut 73147 18526 54621 1087 50249
10 Illinois 64933 15284 49649 0989 50201 11 Wyoming 58187 10550 47637 0967 49263 12 Nevada 57376 10311 47065 0974 48321 13 District of Columbia 75692 19942 55750 1159 48102 14 Iowa 55647 12431 43216 0902 47911 15 Indiana 54308 11127 43181 0903 47820 16 North Dakota 52968 9485 43483 0915 47522 17 Maryland 68357 16518 51839 1095 47341 18 New Jersey 69623 16243 53380 1132 47156 19 Georgia 55532 12605 42927 0921 46609 20 Kentucky 52338 11513 40825 0878 46498 21 Tennessee 50099 8211 41889 0902 46440 22 Alabama 50391 10261 40130 0866 46340 23 Delaware 60214 13819 46395 1002 46302 24 Oregon 61862 15991 45871 0998 45963 25 Wisconsin 54998 12348 42650 0928 45959 26 Nebraska 52338 10973 41365 0905 45708 27 Minnesota 57346 13063 44283 0975 45418 28 Texas 52575 8888 43687 0969 45085 29 Louisiana 50000 9683 40318 0904 44599 30 South Dakota 46979 7601 393785 0883 44596 31 New Hampshire 57522 10355 47167 1059 44539 32 Vermont 57349 12149 45200 1016 44488 33 Arkansas 48304 9847 38458 0869 44255 34 South Carolina 50000 10360 39641 0903 43899 35 Missouri 48618 9353 39265 0895 43871 36 Kansas 49422 9988 39434 0905 43573 37 North Carolina 49970 10456 39514 0909 43470 38 Montana 51422 11058 40364 0941 42894 39 Washington 54433 9437 44996 1055 42650 40 West Virginia 45555 9112 36443 0876 41602 41 Maine 51077 10908 40169 0984 40822
42 Oklahoma 45292 8979 36313 0890 40802 43 New Mexico 47122 9071 38051 0936 40653 44 Idaho 47504 9990 37514 0930 40338 45 Arizona 47403 8879 38524 0959 40171 46 Colorado 51808 10509 41299 1030 40096 47 Mississippi 42925 8385 34540 0864 39977 48 Florida 47267 7659 39609 0997 39728 49 Virginia 51049 10882 40167 1023 39264 50 Utah 47244 9543 37701 0973 38747 51 Hawaii 56651 13752 42899 1184 36232
Source SD Governors Office of Economic Development based on 2018 federal tax data and 2017 state tax data
Education Commission of the States
South Dakota Blue Ribbon Task Force on School Funding
Pierre South DakotaJuly 2015
Michael GriffithSchool Finance ConsultantEducation Commission of the States
Education Commission of the States
Education Commission of the States
Created by states for states in 1965 to track state policy trends translate academic research provide unbiased advice and create opportunities for state leaders to learn from one another
53 member states territories and the District of Columbia
Contact wwwecsorg (303) 2993600
2
Education Commission of the States
Per Pupil Expenditures 2006-07 to 2016-17
3
$0
$2000
$4000
$6000
$8000
$10000
$12000
2003-04 2004-05 2005-06 2006-07 2007-08 2008-09 2009-10 2010-11 2011-12 2012-13 2013-14 2014-15 2015-16 2016-17
National Average South Dakota
Source NEA Rankings amp Estimates
Education Commission of the States
Average Per Pupil Expenditures in Bordering States
4
$6500
$7500
$8500
$9500
$10500
$11500
$12500
$13500
Iowa
Minnesota
Montana
Nebraska
North Dakota
South Dakota
Source NEA Rankings amp Estimates
Education Commission of the States
Average Teacher Salaries in Bordering States
5
$35000
$40000
$45000
$50000
$55000
$60000
2006-07 2007-08 2008-09 2009-10 2010-11 2011-12 2012-13 2013-14 2014-15 2015-16
Iowa
Minnesota
Montana
Nebraska
North Dakota
South Dakota
Source NEA Rankings amp Estimates
Education Commission of the States
Teacher Salaries amp Average Per Pupil Expenditures FY 2015-16
6
$6000
$8000
$10000
$12000
$14000
$16000
$18000
$20000
$22000
$40000 $45000 $50000 $55000 $60000 $65000 $70000 $75000 $80000
South Dakota
National Average
Per P
upil
Expe
nditu
res
Teacher Salaries
Education Commission of the States
For More Information
7
Michael GriffithEducation Commission of the States
700 Broadway Suite 810Denver Colorado 80203
(303) 299-3600wwwecsorg
mgriffithecsorg
- Teacher Compensation Review Board Minutes 082918 (002)
- Ingersoll PowerPntSD Talk 62018
-
- Slide Number 1
- The Source of Data
- Schools with Serious Teacher Shortages(Percent Public Secondary Schools with Teaching Vacancies and with Serious Difficulties Filling those Vacancies by Field 2015-16)
- The Surprising Sources of Teacher Supply (Percent of Newly Hired Teachers in the Public School System by Supply Source 2015-16)
- Attrition in Teaching is Higher Than in Many OccupationsProfessions(Among 1993 College Grads Who Entered Selected Occupations by 1997 Percent Gone From Occupation by 2003)
- Slide Number 6
- Beginning Teachers Leave Teaching at Highest Rates (Cumulative Percent Teacher Attrition by Years of Experience 1993-2003
- Job Dissatisfaction a Leading Factor Behind Teacher Turnover (Percent Public School Teachers Reporting that Various Reasons Were Important for their Turnover 2012-13)
- Teachersrsquo Working Conditions are Important for Turnover(Of Those Public School Teachers Who Moved From or Left Their School Because of Dissatisfaction Percent Reporting Particular Sources of Dissatisfaction 2012-13)
- Teacher Recruitment Alone Does Not Work
- Slide Number 11
- Research Shows Positive Effects of Induction amp Support Program for Beginning Teachers
- For Further Information Copies of Articles Reports etc
-
- SD DOE Blue Ribbon Update Final
-
- Trends in Educator Preparation and Employment in South Dakota
- Setting the Stage Purpose amp Source Data
- Slide Number 3
- Slide Number 4
- South Dakota Distribution of Teachers by Grade Span Type 2016-17
- South Dakota Overview of the field2016-17 Year
- South Dakota District normsTeacher average years experience
- Slide Number 8
- South Dakota Age distribution of teachers 2016-17
- South Dakota District normsTeacher average startingbase salary
- South Dakota District normsTeacher average salary (not total compensation)
- South Dakota District normsAdministrator average salary (not total compensation)
- 2017-18 Headcount by Assignment Area
- South Dakota Key pieces of pipeline data
- 5 Year Projections Teacher Need
- Need to meet student growth
- South Dakota District NormsAverage Student to Teacher Ratio
- South Dakota K-12 student enrollments including 5 year projections
- South Dakota Teacher need to meet anticipated student growth
- Slide Number 20
- South Dakota Administrator teacher and education specialist retirements2011-2016
- South Dakota One Five and ten-year retirementseligible versus estimated
- Slide Number 23
- South Dakota Reasons that K-12 teachers do not return to their position (Headcount)
- South Dakota Reasons teachers do not return to prior position (201718 School Year)
- South Dakota Estimated number of teachers leaving the field
- Slide Number 27
- South Dakota 5-year projected teacher need
- Slide Number 29
- South Dakota Total FTE of Certified Teachers and Total Number of New Certificates last 5 years
- Slide Number 31
- South Dakota Teacher preparation graduates2002-03 to 2016-17
- BOR Teacher Graduate PlacementsFY 2002-2016
- South Dakota Trajectories for new teacher graduates next 5 years
- Slide Number 35
- South Dakota Teachers from out-of-state 2010-2014
- Slide Number 37
- South Dakota Alternative certificates
- Slide Number 39
- South Dakota Five-year teacher pipeline projections
- Slide Number 41
- South Dakota Pipeline Overview
- Slide Number 43
- 2018 Preliminary Plans of Intent
- South Dakota Unfilled Vacancies First Day of School 2017-18
- South Dakota High School vacancies by FTE first day of school 2014-2015
- Slide Number 47
- South Dakota Hard to fill positions Plans of Intent 2017-18
- South Dakota Plan of Intent Trends
- South Dakota Hard to fill position resolution of Unfilled Vacancies 2014-15 (October 15)
- Slide Number 51
- South Dakota Flexible Learning OptionsSouth Dakota Virtual School Courses
- South Dakota Flexible Learning OptionsSouth Dakota Virtual School Courses
- South Dakota Flexible Learning OptionsSouth Dakota Virtual School Courses
- South Dakota Flexible Learning OptionsDual Credit Courses
- South Dakota Flexible Learning OptionsDual Credit Courses by Institution
- Slide Number 57
-
- NEA teacher salary ranking
- NEA teacher salary ranking with regional price parities
- BEA 2016 real person income for states and metro areas (1)
- BEA 2016 regional price parities by state
- Purchasing Power
- Teacher Wage Calculator Short
- ECS Spending and Salary Data June 2018
-
- Slide Number 1
- Education Commission of the States
- Per Pupil Expenditures 2006-07 to 2016-17
- Average Per Pupil Expenditures in Bordering States
- Average Teacher Salaries in Bordering States
- Teacher Salaries amp Average Per Pupil Expenditures FY 2015-16
- For More Information
-
| Mathematics | Science | Special Educ | Foreign Lang | CareerTech Ed | English | Computer Sc | MusicArt | Social Studies | |||||||||||
| Vacancies | 45 | 34 | 43 | 29 | 28 | 49 | 12 | 25 | 40 | ||||||||||
| Hiring Difficulties | 17 | 16 | 14 | 10 | 9 | 6 | 4 | 3 | 3 |

The Surprising Sources of Teacher Supply (Percent of Newly Hired Teachers in the Public School System
by Supply Source 2015-16)
Newly Qualified with only Education School
degrees 25
Newly Qualified with both Education and
Noneducation Degrees 5
Newly Qualified with only Noneducation
Degrees 14
Reserve Pool 56
Attrition in Teaching is Higher Than in Many OccupationsProfessions
(Among 1993 College Grads Who Entered Selected Occupations by 1997 Percent Gone From Occupation by 2003)
79
49
49
45
30
28
23
19
19
16
14
0 20 40 60 80 100
Secretaries
Child Care Workers
Paralegals
Correctional Officers
TEACHERS
Police
Architects
Nurses
Lawyers
Engineers
Pharmacists
Source Ingersoll R amp Perda D forthcoming How High is Teacher Turnover and is it a Problem Consortium for Policy Research in Education Univ Penn
Percent
Teaching Force3385171
Schools Suffer from a Revolving Door (Numbers of Public School Teachers in Transition Into
and Out of Schools Before and After 2011-12 School Year)
Turnover531340
Hires 343955
At Beginning of School Year During School Year After End of School Year
Source Ingersoll R original analyses of 2011-13 Schools and Staffing Survey Teacher Followup Survey
Beginning Teachers Leave Teaching at Highest Rates
(Cumulative Percent Teacher Attrition by Years of Experience 1993-2003
446
391
306
23
119
0 20 40 60 80 100
Less than 5 years
Less than 4 years
Less than 3 years
Less than 2 years
Less than 1 year
PercentSource Perda D 2013 Transitions Into and Out of Teaching A Longitudinal Analysis of Early Career Teacher Turnover PhD Dissertation Univ of Penn
Job Dissatisfaction a Leading Factor Behind Teacher Turnover
(Percent Public School Teachers Reporting that Various Reasons Were Important for their Turnover 2012-13)
557
36
444
202
187
0 20 40 60 80 100
Dissatisfaction
To Pursue Other Job
Family or Personal
School Staffing Action
Retirement
PercentSource Ingersoll R original analyses of 2012-13 Teacher Followup Survey
Teachersrsquo Working Conditions are Important for Turnover
(Of Those Public School Teachers Who Moved From or Left Their School Because of Dissatisfaction Percent Reporting Particular Sources of
Dissatisfaction 2012-13)
295
295
406
472
482
501
516
579
605
0 20 40 60 80 100
Class Sizes too Large
Poor SalaryBenefits
Dissatisfied with TchingAssignment
Poor Facilities amp Resources
Student Discipline Problems
Classroom Intrusions
Lack of Influence amp Autonomy
Dissatisfied with Administration
Dissatisfied withAccountabilityTesting
PercentSource Ingersoll R original analyses of 2012-13 Teacher Followup Survey
Teacher Recruitment Alone Does Not Work
In 2010 the federal ldquo100k in 10rdquo initiative was launchedRecruitment of 10000 New MathScience Teachers per year for 10 years
But between 2012 and 2013 alonehellip
- 40600 MathScience Teachers Left Teaching Altogether
- Of them
- 8900 Retired
- 15200 reported Dissatisfaction as a major reason for leaving
- 37000 MathScience Teachers Moved to Other Schools
- Of them- Four times as many moved to affluent as to poor schools
The Leaky Bucket
Research Shows Positive Effects of Induction amp Support Program for
Beginning Teachers
bull We examined 15 best empirical studies since the 1980s
bull three sets of outcomesndash teacher commitment and retentionndash teacher classroom instructional practices ndash student achievement
bull Most of the studies reviewed showed positive impacts
Source Ingersoll amp Strong 2011 The Impact of Induction and Mentoring for Beginning Teachers A Critical Review of the Researchrdquo Review of Educational Research 81(2) 201-233
For Further Information Copies of Articles Reports etc
wwwgseupennedufacultyingersoll
rmiupennedu
Trends in Educator Preparation and Employment in South Dakota
Presented byAbby Javurek
Director Division of Accountability SystemsSouth Dakota Department of Education
06202018
Setting the Stage Purpose amp Source Data
bull Purpose Examine South Dakota teacher pipelinebull Goal Help the committee to frame SD data in the
national contextbull Data sources SD DOE data sets South Dakota
Retirement System IPEDS federal reports Boardof Regents Teacher Graduate Reports
Overview of the South Dakota Teaching Field
8500
8600
8700
8800
8900
9000
9100
9200
9300
9400
9500
9600
110000
115000
120000
125000
130000
135000
South Dakota Number of elementary and secondary school teachers and students 2005-2018
K-12 Fall StudentEnrollment
Total ClassroomTeachers (FTE)
SOURCE SD DOE Statistical Digest amp SDDOE Fall Enrollment Reports
South Dakota Distribution of Teachers by Grade Span Type 2016-17
069594
4011
1774
2529
995
018 010 Pre-Kindergarten
Kindergarten
Elementary
MSHS
High School
Special Education
Gifted
DeafHearing ampBlindVisually Impaired
Pre-Kindergarten Teachers FTE 667Kindergarten Teachers FTE 57257Elementary Teachers FTE 3864MSHS Teachers FTE 170943High School Teachers FTE 243627Special Education Teachers FTE 95838
Gifted Teachers FTE 1747DeafHearing amp BlindVisually Impaired Teachers FTE 931TOTAL 963413
bull Elementary Self-Contained is largest group of teachers (nearly 40 of all FTE)
bull If combined with Kindergarten Elementary is greater than Middle and High School combined
SOURCE SD DOE Statistical Digest
South Dakota Overview of the field2016-17 Year
SOURCE SD DOE Personnel Record Form database SD DOE Statistical Digest
Teachers on Plans of Intent
654 Number of Non-Certified Educators
640
Percent of Teachers with Advanced Degrees
347 Average District Beginning Salary
$37680
Average Years of Experience
141 Average Salary $46922
Number Students (K-12 Fall Enrollment)
132520 Student to Teacher Ratio (K-12)
141 1
Of the 963413 Teacher FTE in South Dakota
SOURCE SD DOE Statistical Digest Plans of Intent from Personnel Record Form (PRF)
South Dakota District normsTeacher average years experience
SOURCE SD DOE statistical digest 2017-18 is preliminary only
2010-11 2011-12 2012-13 2013-14 2014-15 2015-16 2016-17 2017-18Max Average years Experience (teacher) 289 298 306 247 232 241 246 222Min Average Years experience (teacher) 73 83 72 50 70 46 46 43Average Years Experience (teacher) 150 149 150 144 140 138 134 137
00
50
100
150
200
250
300
350
South Dakota District normsAdministrator average years experience
SOURCE SD DOE statistical digest 2017-18 is preliminary only
2010-11 2011-12 2012-13 2013-14 2014-15 2015-16 2016-17 2017-18Max Average Administrator experience 300 370 320 330 340 420 360 370Min Average Administrator experience 00 00 00 00 00 00 00 00Average Administrator experience 116 118 117 118 115 113 113 119
00
50
100
150
200
250
300
350
400
450
South Dakota Age distribution of teachers 2016-17
bull About 30 of teachers in the state are over the age of 51
bull SD has seen the most growth in the numbers of younger teachers and a decline in teachers over the age of 51
Age 20-30 195118Age 31-40 255624Age 41-50 227132Age 51+ 278869
SOURCE SD DOE statistical digest
2039
26722374
2915 Age 20-30Age 31-40Age 41-50Age 51+
South Dakota District normsTeacher average startingbase salary
SOURCE SD DOE statistical digest 2017-18 is preliminary only
2012-13 2013-14 2014-15 2015-16 2016-17 2017-18Max teacher base salary $35870 $36010 $37510 $38510 $44950 $45400Min teacher base salary $22000 $22900 $24000 $25000 $28000 $30000Average teacher base salary $29100 $29950 $30153 $32542 $37627 $38147
$0
$5000
$10000
$15000
$20000
$25000
$30000
$35000
$40000
$45000
$50000
South Dakota District normsTeacher average salary (not total compensation)
SOURCE SD DOE statistical digest 2017-18 is preliminary only
2010-11 2011-12 2012-13 2013-14 2014-15 2015-16 2016-17 2017-18Max Average Teacher Salary $47315 $47438 $47196 $48343 $49825 $49778 $54703 $55353Min Average Teacher Salary $27212 $27093 $27479 $28125 $29916 $31303 $36587 $35906Average Salary $39253 $38807 $39018 $40023 $40935 $42025 $46922 $47631
$0
$10000
$20000
$30000
$40000
$50000
$60000
South Dakota District normsAdministrator average salary (not total compensation)
SOURCE SD DOE statistical digest 2017-18 is preliminary only
2010-11 2011-12 2012-13 2013-14 2014-15 2015-16 2016-17 2017-18Max Average Administrator Salary $100679 $148000 $132663 $132000 $134213 $110301 $116278 $116827Min Average Administrator Salary $45046 $32213 $42717 $42657 $48193 $42417 $50000 $22500Average Administrator Salary $72904 $72863 $73758 $75057 $77184 $78993 $82754 $83432
$0
$20000
$40000
$60000
$80000
$100000
$120000
$140000
$160000
2017-18 Headcount by Assignment Area
Assignment CategoryTotal 2018
Head Count Public
Non-Public School District
TribalBIE School
Cooperative or Multi-District
State Special School
Alternative School
Virtual Providers
Administrators 740 607 80 44 6 2 1 0
Career and Technical Education 882 765 44 24 23 2 1 23English Language Learner 71 70 1 0 0 0 0 0
Fine Arts 327 283 27 11 3 0 0 3Language Arts 1871 1666 97 81 4 5 4 14Math 1354 1178 85 71 3 4 1 12Military 6 4 0 2 0 0 0 0
Miscellaneous 1038 950 39 38 7 2 0 2Music 559 500 53 2 0 1 0 3Non-Credit 5110 4664 279 142 10 15 0 0
PE-Health 659 568 51 27 3 1 2 7Religion 60 1 59 0 0 0 0 0
Science 1074 927 69 53 3 4 2 16Elementary 3877 3375 353 146 1 0 0 2Social Science 1145 982 85 52 4 4 2 16Special Education 1209 1091 18 50 35 12 3World Language 261 177 37 29 1 0 0 17
20243 17808 1377 772 103 52 16 115SOURCE SD DOE Personnel Record Form
South Dakota Key pieces of pipeline data
SOURCE SD DOE Personnel Record Form and certification databases BOR data from BOR Reports Non BOR from IPEDS
2016-17 ldquoOtherrdquo Certificates (Preliminary)
Number of Graduates from South Dakota Teacher Prep-
Programs 2015-16 (most recent complete data available)
Number of Certificates Awarded to non-SD graduates
288
Number of Alternative (Non-TFA) Certificates Awarded
65Board of Regents Universities 509
Number of Teach for America Teachers 27 Private
Universities 161
TOTAL First Time Certificates Issued 1119 New Alternative Certificate Structure in 2017-18 with new certification rules
5 Year Projections Teacher Need
Need to meet student growth
South Dakota District NormsAverage Student to Teacher Ratio
Statewide average hovers
around 140
District Maximum and Minimum Student to Teacher Ratios
SOURCE SD DOE Statistical Digest 2017-18 is preliminary only
2010-11 2011-12 2012-13 2013-14 2014-15 2015-16 2016-17 2017-18Max Student to Teacher Ratio 176 177 172 175 176 168 174 174Min Student to Teacher Ratio 59 50 38 60 35 38 37 52Statewide Student to Teacher Ratio 135 140 141 140 140 141 141 142
00
20
40
60
80
100
120
140
160
180
200
South Dakota K-12 student enrollmentsincluding 5 year projections
Projections call for enrollments to increase by about 7400 over the next 5 years
SOURCE SD DOE statistical digest census data and SD K-12 enrollment trends
110000
115000
120000
125000
130000
135000
140000
145000
FY2010 FY2011 FY2012 FY2013 FY2014 FY2015 FY2016 FY2017 FY2018 FY2019 FY2020 FY2021 FY2022 FY2023
South Dakota Teacher need to meet anticipated student growth To maintain
current student to
teacher ratio averages an
additional 456 FTE are needed in the next 5
yearsEstimated Projected Teacher Need FY2019 FY2020 FY2021 FY2022 FY2023Teachers to Maintain 140 Student to Teacher ratio
966471 976971 987521 998186 1008964
800000
850000
900000
950000
1000000
1050000
FY2019 FY2020 FY2021 FY2022 FY2023
Teachers needed to maintain a 1401 student to teacher ratio
Need to replace retirees
South Dakota Administrator teacher and education specialist retirements
2011-2016471 of all
eligible education
retirees actually
retire
SOURCE South Dakota Retirement System 2015-16 Potential numbers not available
-
200
400
600
800
1000
1200
2011-12 2012-13 2013-14 2014-15 2015-16 2016-17
Potential
Actual
South Dakota One Five and ten-year retirementseligible versus estimated
State data indicates that
teachers comprised 718
of education retirees in the
most recent year
5 year estimate 876 teachers
retiring
Future Retirement Estimates- based on 4 year average
SOURCE Eligible from South Dakota Retirement System Estimated based on projections of 494 retiring
-
500
1000
1500
2000
2500
3000
3500
4000
4500
2017-18 Next 5 years Next 10 years
Eligible
Estimated
Need to replace teachers leaving for other reasons
South Dakota Reasons that K-12 teachers do not return to their position (Headcount)
Public School Districts 2014-15 2015-16 2016-17 2017-18
Employed in another schooldistrict outside of state 83 110 86 62
Familypersonal relocation 98 99 96 45
On Leave of Absence or Sabbatical 7 13 12 13
Other employment in education 119 72 75 79
Other employment outside of education 91 109 86 86
Reason Unknown 172 217 136 117
Retirement 293 261 236 178
Laid Off 5 2 11 10
Discharged 21 29 32 33
Employed in another accredited SD schooldistrict 254 269 216 183
Illness 5 7 6 3
Death 7 2 3 7
Mentor 5 7 2 3
Employed by district in another capacity not tracked 8 25 19 13
TOTAL 1168 1223 1018 833
SOURCE SD DOE personnel record form
South Dakota Reasons teachers do not return to prior position (201718 School Year)
Teachers Admin Educ SpecDeath 537 000 100Employed by District in another capacity not tracked 1017 200 17111Employed in another accredited SD schooldistrict 17488 1360 2141Employed in another schooldistrict out of state 6000 113 459Familypersonal relocation 4234 085 373Illness 300 041 000Non-Renewal 3139 160 000On Leave of Absence or Sabbatical 1150 000 100Other employment in education 7202 624 1117Other employment outside of education 7726 370 1013Mentor 300 000 000Reason Unknown 10842 300 1213Reduction-in-Force 880 000 140Retirement 16595 1200 2188
TOTAL 77410 4453 25955Percent of 2016-17 Staff 8 8 23
Percent of Staff Leaving Education in SD 4 3 4Percent of Staff Still in SD Education Field but in Different Position 3 4 18
Percent Unknown 1 1 1
SOURCE SD DOE personnel record form
South Dakota Estimated number of teachers leaving the field
Estimatesbull 2 of teachers will
continue to leave the field for reasons other
than retirement
bull In next 5 years 988 teachers will leave the education field in SD
Estimated number of Teachers
Estimated number No longer Employed
2018-19 9665 193
2019-20 9770 195
2020-21 9875 198
2021-22 9982 200
2022-23 10090 202
Five Year Total 988
Putting it all together 5 Year Projected Need
South Dakota 5-year projected teacher need
RETIREES NEED TO MEETSTUDENT GROWTH
TEACHERS LEAVINGTHE FIELD
NEED 876 456 988
0
200
400
600
800
1000
1200
South Dakota Teacher Pipeline
South Dakota Total FTE of Certified Teachers and Total Number of New Certificates last 5 years
SOURCE SD DOE Certification and Personnel Record Form databases
2010-11 2011-12 2012-13 2013-14 2014-15 2015-16 2016-17New Certificates Issued 1174 1103 1074 1083 1250 1198 1119FTE Certified Teachers PK-12 9321 9099 9196 9362 9483 951589 963413
0
2000
4000
6000
8000
10000
12000
Pipeline South DakotaCollege Graduates
South Dakota Teacher preparation graduates2002-03 to 2016-17
SOURCE 2002-201516 SD BOR data from SD BOR Non-BOR from IPEDS Completion report (2016-17 data is preliminary IPEDS data)
050
100150200250300350400450500550600650700
BOR Grand Total
Non-BOR Grand Total
2001-2002
2002-2003
2003-2004
2004-2005
2005-2006
2006-2007
2007-2008
2008-2009
2009-2010
2010-2011
2011-2012
2012-2013
2013-2014
2014-2015
2015-2016
2016-2017
Non-BOR Grand Total 193 189 193 187 166 176 169 169 159 177 170 185 194 173 161 162
BOR Grand Total 507 476 472 434 447 417 410 432 381 472 469 480 486 432 509 451
Combined Grand Total 700 665 665 621 613 593 579 601 540 649 639 665 680 605 670 613
BOR Teacher Graduate PlacementsFY 2002-2016 Approximately half
(554) of all undergraduate teacher education graduates since FY2002 have been placed in an in-state school district
Placement rates are dramatically higher for teacher education candidates who attended a South Dakota high school
South Dakota Trajectories for new teacher graduates next 5 years Per the most
recently available long term data 554 of all Board of Regents teacher education graduates were employed in South Dakota
This means that we expect 1742 of 3144 grads to take jobs in SD in the next 5 years
2016-17 2017-18 2018-19 2019-20 2020-21Board of Regents Universities 162 174 174 174 174Non-BOR Universities 451 458 458 459 460TOTAL 613 632 632 633 634
Five Year Total 3144
5 Years Estimated SD Teacher Graduates
Projected Grads
Projected Placed in SD
2016-17 613 3402017-18 632 3502018-19 632 3502019-20 633 3512020-21 634 351TOTAL 3144 1742
Estimated SD Placements
Pipeline Out of StateCollege Graduates
South Dakota Teachers from out-of-state 2010-2014 On average
5566 of out of state educators who apply for certification in South Dakota will be employed in South Dakota public schools
5 year trajectorybull 1536 out-of-
state applicants
bull 855 employed in the SD public schools
Certificates Issued to Out-of-State Graduates
SOURCE SD DOE Certification and Personnel Record Form databases
Certificates Issued
Employed in SD
Employed
Administration Endorsement
Educator Specialist Endorsement
Teacher Endorsement
2010 440 268 6091 27 24 3892011 414 247 5966 17 21 3762012 466 283 6073 24 30 4122013 490 320 6531 27 11 4522014 435 265 6092 21 20 3942015 416 192 4615 18 8 4002016 370 178 4811 14 11 358
2017 299 130 4348 14 8 288
Pipeline Alternative Certification
South Dakota Alternative certificates
Expectationsbull The alternative
Certification program will continue to grow but will stabilize under the new rules
bull Teach For America will remain steady at an average 23 teachers a year
bull 5 year conservative projection 295
bull new teachers
SOURCE SD DOE Certification and Personnel Record Form databases
Alternative Certificates
Teach For America
Total Alternative
2010-11 41 26 67
2011-12 37 17 54
2012-13 51 15 66
2013-14 48 23 71
2014-15 55 31 86
2015-16 86 29 115
2016-17 114 19 133
2017-18 188 20 208
Putting it all together 5-year teacher pipeline
projections
South Dakota Five-year teacher pipeline projections
Projected 5 Year new
teacher pool2892
1742
855
295
0
200
400
600
800
1000
1200
1400
1600
1800
2000
INCOMING SDGRADUATES
OUT OF STATEGRADUATES
ALTERNATIVEPROGRAMS
Projected Totals
South Dakota Pipeline Overview
The estimated supply of teachers
indicates the potential
teacher pool will be 572
more than the minimal five-
year need 876
456
988
1742
855
295
0
500
1000
1500
2000
2500
3000
3500
NEED PIPELINE
ALTERNATIVEPROGRAMS
OUT OF STATEGRADUATES
INCOMING SDGRADUATES
TEACHERS LEAVING THEFIELD
NEED TO MEET STUDENTGROWTH
RETIREES
Hard to Fill Positions
2018 Preliminary Plans of IntentEducator Assignment PLANS OF INTENT BY HEAD COUNT Percent on Plan of IntentAdministrators 18 3Career and Technical Education 108 14English Language Learner 13 19Fine Arts 13 5Language Arts 64 4Math 41 3Military 0 0Miscellaneous 4 0Music 14 3Non-Credit 3 0PE-Health 35 6Religion 0 0Science 59 6Elementary 77 2Social Science 63 6Special Education 39 4World Language 16 9
567 3
SOURCE SD DOE Personnel Record Form database
South Dakota Unfilled Vacancies First Day of School 2017-18
bull Includes ALL Public schools
bull Represents teaching positions at 78 schools 39 districts
bull Administrator and School Service Specialists at 11 districts
SOURCE SD DOE Personnel Record Form database
FTE CoursesAdministrators 1Career and Technical Education 348 22Education Specialists 1211 14English Learner ESL 1 1Fine Arts 115 2Language Arts 386 20Math 373 22Miscellaneous 2 8Music 08 1Non-Credit 546 24PE-Health 019 2Science 18 9Elementary 1346 15Social Science 097 4Special Education 1252 13World Language 024 2Total FTE 6377 161
South Dakota High School vacancies by FTE first day of school 2014-2015
bull Represents positions at 24 schools and districts (1194 of HS)
bull Math amp Science 8 high schools with at least 1 unfilled course (40 of HS)
bull English 3 high schools with at least 1 unfilled course (15 of HS)
SOURCE SD DOE Personnel Record Form database
FTEPercent of
ALL FTE vacancies
Administrators 066 6600Career and Technical Education 284 8161Education Specialists 05 413Fine Arts 015 1304Language Arts 244 6321Math 222 5952Miscellaneous 058 2900Non-Credit 442 8095PE-Health 006 3158Science 153 8500Social Science 05 5155Special Education 452 3610World Language 024 10000
TOTAL 2066 3240
Hard to Fill Positions
South Dakota Hard to fill positions Plans of Intent 2017-18 bull Includes all Public Schools
in the state
bull English as a Second Language World Language and CTE teachers were the most likely to be on Plans of Intent
bull Highest numbers of Plans of intent in Elementary CTE Language Arts amp Social Science
PLANS OF INTENT(HEAD COUNT)
OF CATEGORY
Administrators 18 3
CTE 108 14
ESL (Non-Core) 13 19
Fine Arts 13 5
Language Arts 64 4
Math 41 3
Military 0 0
Miscellaneous 4 0
Music 14 3
Non-Credit 3 0
PE-Health 35 6
Science 59 6
Elementary 77 2
Social Science 63 6
Special Ed (Non-Core) 39 4
World Language 16 9
SOURCE SD DOE Personnel Record Form database
South Dakota Plan of Intent Trends
bull One teacher may be on multiple plans of intent to teach multiple courses
bull Both the number of teachers and the number of plans of intent has been growing
bull Plans of Intent are issued for up to 2 years in most casesbull Educators have completed 2449 of Plans of Intent in recent years
on average This is down from pre-2015 percentages
SOURCE SD DOE Personnel Record Form database
2015 2016 2017 Plans of Intent 576 726 676
Not Completed NA 538 520Completed NA 188 156
Headcount 501 596 563
SOURCE SD DOE Personnel Record Form database
South Dakota Hard to fill position resolutionof Unfilled Vacancies 2014-15 (October 15)
bull Most common resolution was to re-assign duties to other staff
bull Vacant courses is down from 2015
SOURCE SD DOE Personnel Record Form database
of Courses of Vacancies
Eliminate CourseProgram 27 1677Additional duties given to other staff 38 2360
Hired certified candidate after school started 8 497
Increased Class size 16 994Position remains vacant 31 1925Use Distance Learning 14 870Other 27 1677
Total (including Administrators and School Service Specialists)
161
Hard to Fill PositionsFlexible Course Offerings
South Dakota Flexible Learning OptionsSouth Dakota Virtual School Courses
SOURCE SD Virtual School annual reports
bull Represents officially reported public school enrollments
bull 1622 increase in student enrollments since 2010-11
Districts CoursesTotal
Student EnrollmentsPublic Other Available Offered
2010-11 118 233 3446
2011-12 127 255 3389
2012-13 133 289 3750
2013-14 135 298 3837
2014-15 133 16 389 3952
2015-16 126 15 209 4078
2016-17 133 13 275 4005
South Dakota Flexible Learning OptionsSouth Dakota Virtual School Courses
SOURCE SD Virtual School annual reports
bull Over time offerings in more subjects have been added
bull Credit Recovery and World Languages have the highest enrollments
2010-2011
2011-2012
2012-2013
2013-2014
2014-2015
2015-2016
2016-2017
CTE 276 283 316 401 400 365 284Credit Recovery 842 942 946 727 627 559 609College Readiness 115 169 128 115 90
Fine Arts 188 114 127 132 132 107 59HealthPE 105 60 43 66 55 151 123ELA 320 299 351 297 255 411 287Math 340 194 246 286 334 653 344Sciences 280 334 396 413 524 403 310Social Sciences 798 137 165 190 285 311 200World Language 1008 1015 1098 1061 808 698Personal FianceEcon 1 7 40 44 66 45
Technology 14 10 9 9 3 7Elementary 84 89 17Other 38 3 13 9 14 37 0
bull Credit Recovery courseshad the lowestcompletion rates acrossthe board and accountfor a significant portionof enrollments
bull Completion rates haveincreased over time
bull Overall completion ratewithout Credit Recoverycourses included jumpsfrom 6424 to 7439
South Dakota Flexible Learning OptionsSouth Dakota Virtual School Courses
SOURCE SD Virtual School annual reports
2014-15 2015-16 2016-17
EnrolledCompletion
Rate EnrolledCompletion
Rate EnrolledCompletion
Rate
CTE 400 688 365 967 284 954
Credit Recovery 627 217 559 243 609 232
College Readiness 128 633 115 461 90 900
Fine Arts 132 705 107 766 59 780
HealthPE 555 618 151 483 123 545
ELA 255 416 411 496 287 530
Math 334 458 653 583 344 552
Sciences 524 523 403 806 310 868
Social Sciences 285 428 311 701 200 710
World Language 1061 523 808 783 698 807
Personal FianceEcon 44 796 66 773 45 778
Technology 9 556 3 1000 7 857
Elementary 84 524 89 472 17 647
Other 14 714 37 784 0
South Dakota Flexible Learning OptionsDual Credit Courses
SOURCE SD DOE dual credit program August 2015 reports
bull Total enrollments increased by 9337 and Credits earned by 9851 between 2014 and 2016
2014-15 (allterms)
2015-16 (allterms)
2016-17 (allterms)
2017-18(Fall only)
Total course enrollment 4227 6951 8174 4392Students taking at least 1
course 2135 2688 2717 1967
Credits earned 1141450 18590 22659 12943
000
500000
1000000
1500000
2000000
2500000
0
1000
2000
3000
4000
5000
6000
7000
8000
9000
South Dakota Flexible Learning OptionsDual Credit Courses by Institution
SOURCE SD DOE dual credit program August 2015 reports
2014-15 (all terms)
2015-16 (all terms)
2016-17 (all terms)
2017-18 (Fall only)
Black Hills State University 50 52 70 45Dakota State University 19 23 24 17Lake Area Technical Institute 51 64 65 60Mitchell Technical Institute 24 58 55 37Northern State University 30 46 43 33South Dakota School of Mines and Technology 23 26 35 15South Dakota State University 52 60 59 47Southeast Technical Institute 51 63 54 42University of South Dakota 37 54 63 39Western Dakota Tech 35 71 84 31
372 517 552 366
Questionsbull Abby Javurekbull SD Dept of Educationbull 6057733426bull AbbyJavurekstatesdusbull SD DOE website httpdoesdgov
Rankings of the States 2017 and
Estimates of School Statistics 2018
NEA RESEARCH April 2018
Reproduction No part of this report may be reproduced in any form without permission from NEA Research except by NEA-affiliated associations Any reproduction of the report materials must include the usual credit line and the copyright notice Address communications to NEA Research 1201 16th Street NW St 610 Washington DC 20036 or by email to RankingsEstimatesneaorg
Copyright copy 2018 by the National Education Association
All Rights Reserved
SALARY ($) RANK SALARY ($) RANK CHANGE () RANKAlabama 48518 38 50391 35 39 3 Alaska 67443 7 68138 8 10 34 Arizona 47218 43 47403 44 04 45 Arkansas 48218 39 48304 42 02 47 California 77179 2 79128 2 25 13 Colorado 51233 30 51808 31 11 32 Connecticut 72013 5 73147 5 16 25 Delaware 59960 14 60214 14 04 41 District of Columbia 73991 4 75692 4 23 18 Florida 46612 46 47267 45 14 26 Georgia 54190 23 55532 23 25 15 Hawaii 56049 20 56651 21 11 33 Idaho 46122 47 47504 43 30 8 Illinois 63475 11 64933 11 23 19 Indiana 53645 26 54308 26 12 30 Iowa 54386 22 55647 22 23 17 Kansas 47755 42 49422 40 35 4 Kentucky 52134 27 52338 29 04 46 Louisiana 49745 34 50000 37 05 40 Maine 50498 33 51077 33 11 31 Maryland 66456 8 68357 7 29 10 Massachusetts 76522 3 78100 3 21 20 Michigan 61875 12 62287 12 07 39 Minnesota 56913 17 57346 20 08 36 Mississippi 42744 50 42925 51 04 42 Missouri 47959 40 48618 41 14 27 Montana 51034 32 51422 32 08 38 Nebraska 51386 29 52338 30 19 21 Nevada 56943 16 57376 18 08 37 New Hampshire 56616 18 57522 17 16 24 New Jersey 69330 6 69623 6 04 44 New Mexico 47163 44 47122 47 -01 50 New York 79152 1 81902 1 35 5 North Carolina 47941 41 49970 39 42 2 North Dakota 51223 31 52968 27 34 6 Ohio 56441 19 58202 15 31 7 Oklahoma 45276 49 45292 50 00 49 Oregon 60395 13 61862 13 24 16 Pennsylvania 65151 10 66265 10 17 22 Rhode Island 66197 9 66477 9 04 43 South Carolina 48769 37 50000 38 25 14 South Dakota 42025 51 46979 48 118 1 Tennessee 48817 36 50099 36 26 12 Texas 51890 28 52575 28 13 29 Utah 46887 45 47244 46 08 35 Vermont 55726 21 57349 19 29 9 Virginia 49690 35 51049 34 27 11 Washington 53701 25 54433 25 14 28 West Virginia 45622 48 45555 49 -01 51 Wisconsin 54115 24 54998 24 16 23 Wyoming 58140 15 58187 16 01 48 United States 58479 - 59660 - 20 -
2016 2017 2016-17
B-6 AVERAGE SALARY OF TEACHERS
26
State RPP NEA Salary Adjusted Salary Rank State RPP NEA Salary Adjusted Salary RankMassachusetts 1078 $78100 $7244898 1 Vermont 1016 $57349 $5644587 27New York 1156 $81902 $7084948 2 Arkansas 869 $48304 $5558573 28California 1144 $79128 $6916783 3 Tennessee 902 $50099 $5554213 29Pennsylvania 984 $66265 $6734248 4 South Carolina 903 $50000 $5537099 30Connecticut 1087 $73147 $6729255 5 Louisiana 904 $50000 $5530973 31Michigan 933 $62287 $6675991 6 North Carolina 909 $49970 $5497250 32Rhode Island 996 $66477 $6674398 7 Montana 941 $51422 $5464612 33Illinois 989 $64933 $6565521 8 Kansas 905 $49422 $5460994 34DC 1159 $75692 $6530802 9 Missouri 895 $48618 $5432179 35Ohio 893 $58202 $6517581 10 New Hampshire 1059 $57522 $5431728 36Alaska 1054 $68138 $6464706 11 Texas 969 $52575 $5425697 37Maryland 1095 $68357 $6242648 12 South Dakota 883 $46979 $5320385 38Oregon 998 $61862 $6198597 13 West Virginia 876 $45555 $5200342 39Iowa 902 $55647 $6169290 14 Maine 984 $51077 $5190752 40New Jersey 1132 $69623 $6150442 15 Washington 1055 $54433 $5159526 41Georgia 921 $55532 $6029533 16 Idaho 930 $47504 $5107957 42Wyoming 967 $58187 $6017270 17 Oklahoma 890 $45292 $5088989 43Indiana 903 $54308 $6014175 18 New Mexico 936 $47122 $5034402 44Delaware 1002 $60214 $6009381 19 Colorado 1030 $51808 $5029903 45Kentucky 878 $52338 $5961048 20 Virginia 1023 $51049 $4990127 46Wisconsin 928 $54998 $5926509 21 Mississippi 864 $42925 $4968171 47Nevada 974 $57376 $5890760 22 Arizona 959 $47403 $4942961 48Minnesota 975 $57346 $5881641 23 Utah 973 $47244 $4855498 49Alabama 866 $50391 $5818822 24 Hawaii 1184 $56651 $4784713 50North Dakota 915 $52968 $5788852 25 Florida 997 $47267 $4740923 51Nebraska 905 $52338 $5783204 26
Sources NEA Ranking of the States 2017 and Estimates of School Statistics 2018 (April 2018)Bureau of Economic Analysis Regional Price Parities in 2016 (May 2018)
NEA 2017 AVERAGE TEACHER SALARIES BY STATEADJUSTED BY 2016 BEA REGIONAL PRICE PARITIES
61418 2)24 PMBEA News Release Real Personal Income for States and Metropolitan Areas 2016
Page 1 of 8httpswwwbeagovnewsreleasesregionalrpprpp_newsreleasehtm
EMBARGOED UNTIL RELEASE AT 830 AM EDT Thursday May 17 2018
BEA 18mdash23
3012789328
rppbeagov (mailtorppbeagov)
3012789003
Home (indexhtm) National (nationalindexhtm) International (internationalindexhtm)
Regional (regionalindexhtm) Industry (industryindexhtm) Interactive Data (itable) About BEA (aboutindexhtm)
FAQs (faqindexcfm)Contact Us (contactssearchhtm)
(indexhtm)
(httpwwwcommercegov)
Real Personal Income for States and MetropolitanAreas 2016
Real state personal income grew on average 11 percent in 2016after increasing 47 percent in 2015 according to estimates releasedtoday by the Bureau of Economic Analysis Real state personalincome is a states current-dollar personal income adjusted by thestates regional price parity and the national personal consumptionexpenditures price index The percent change in real state personalincome ranged from 33 percent in Utah and Georgia to -36 percentin Wyoming (table 1) In the District of Columbia real personalincome grew 45 percent Across metropolitan areas the percentchange ranged from 66 percent in Jacksonville NC to -81 percent inMidland TX and Odessa TX (table 4)
(newsreleasesregionalrpp2018_imagesrpp0518png)
Related Links
Full Release amp Tables (PDF)
(newsreleasesregionalrpp2018pdfrpp0518pdf)
State Tables Only(Excel)
(newsreleasesregionalrpp2018xlsrpp0518xlsx)
Metropolitan Area Tables Only(Excel)
(newsreleasesregionalrpp2018xlsrpp0518msaxlsx)
Highlights - State (PDF)
(newsreleasesregionalrpp2018pdfrpp0518_faxpdf)
Highlights - Metropolitan Area (PDF)
(newsreleasesregionalrpp2018pdfrpp0518b_faxpdf)
Interactive Tables (iTableiTableHtmlcfm
reqid=70ampstep=1ampisuri=1ampacrdn=8)
Contacts
Eric Figueroa (Technical)
Jeannine Aversa (Media)
Go
About Regional (regionalaboutcfm) Methodologies (regionalmethodscfm) Articles (regionalarticlescfm)
Release Schedule (newsreleasesnews_release_sort_regionalhtm) Staff Contacts (contactsemailhtm)
Email Subscriptions (_subscribe)
61418 2)24 PMBEA News Release Real Personal Income for States and Metropolitan Areas 2016
Page 2 of 8httpswwwbeagovnewsreleasesregionalrpprpp_newsreleasehtm
JeannineAversabeagov
(mailtoJeannineAversabeagov)
Real Personal Income in 2016
States with the fastest growth in real personal income wereUtah (33 percent) Georgia (33 percent) and Washington(30 percent) The District of Columbias real personalincome grew 45 percent
Eight states had declining real personal income The largestpercent declines were in Wyoming (-36 percent) Oklahoma(-27 percent) and Louisiana (-19 percent)
Large metropolitan areas ndash those with population greaterthan two million ndash with the fastest growth in real personalincome were Atlanta-Sandy Springs-Roswell GA (34percent) Orlando-Kissimmee-Sanford FL (33 percent) andCharlotte-Concord-Gastonia NC-SC (32 percent)
The three large metropolitan areas with declining realpersonal income were Houston-The Woodlands-Sugar LandTX (-33 percent) Denver-Aurora-Lakewood CO (-07percent) and Pittsburgh PA (-04 percent)
Regional Price Parities in 2016
Regional Price Parities (RPPs) measure the differences in price levelsacross states and metropolitan areas for a given year and areexpressed as a percentage of the overall national price level Allitems RPPs cover all consumption goods and services including rentsAreas with highlow RPPs typically correspond to areas with highlowprice levels for rents
States with the highest RPPs were Hawaii (1184) New York(1156) and California (1144) (table 3) The District ofColumbias RPP was 1159
States with the lowest RPPs were Mississippi (864) Alabama(866) and Arkansas (869)
Across states Hawaii had the highest rents RPP (1574) andAlabama and West Virginia had the lowest (632)
Large metropolitan areas with the highest RPPs were SanFrancisco-Oakland-Hayward CA (1247) New York-Newark-Jersey City NY-NJ-PA (1220) and Washington-Arlington-Alexandria DC-VA-MD-WV (1191) (table 6)
Large metropolitan areas with the lowest RPPs wereCincinnati OH-KY-IN (896) Cleveland-Elyria OH (902) andSt Louis MO-IL (908)
Across large metropolitan areas San Francisco-Oakland-Hayward CA had the highest rents RPP (1909) andCleveland-Elyria OH had the lowest (779)
Across all metropolitan areas San Jose-Sunnyvale-SantaClara CA had the highest rents RPP (2133) and Gadsden AL
Sign up (_subscribe) for e-mail notifications
Download (exit_siteasp
link=httpwwwadobecomproductsacrobatreadstep2html)
the Acrobat Reader
61418 2)24 PMBEA News Release Real Personal Income for States and Metropolitan Areas 2016
Page 3 of 8httpswwwbeagovnewsreleasesregionalrpprpp_newsreleasehtm
had the lowest (515)
Estimates of real personal income and regional priceparities for state metropolitan and nonmetropolitanportions can be found at httpswwwbeagovitable(iTableiTableHtmlcfmreqid=70ampstep=1ampisuri=1ampacrdn=8) Supplementaltables are available upon request
(newsreleasesregionalrpp2018_imagesrpp0518_chart_01png)
Updates to Real Personal Income
Today BEA also released revised real personal incomestatistics for states and metropolitan areas for 2014-2015 and real per capita personal income statistics forstates for 2010-2013 These revisions were made toincorporate newly available source data BEA willupdate real personal income for states on September25 2018 with the release of state personal incomeReal personal income for metropolitan areas will beupdated on November 15 2018 with the release of localarea personal income
Next release May 2019 ndash Real Personal Income for States andMetropolitan Areas 2017
Technical Notes on Regional Price Paritiesand Implicit Regional Price Deflators
61418 2)24 PMBEA News Release Real Personal Income for States and Metropolitan Areas 2016
Page 4 of 8httpswwwbeagovnewsreleasesregionalrpprpp_newsreleasehtm
Price indexes commonly measure price changes over time TheBEAs personal consumption expenditures (PCE) price index andthe Bureau of Labor Statistics consumer price index (CPI) aretwo examples Spatial price indexes measure price leveldifferences across regions for one time period An example ofthese type of indexes are purchasing power parities (PPPs)which measure differences in price levels across countries for agiven period and can be used to convert estimates of percapita GDP into comparable levels in a common currency Theregional price parities (RPPs) that BEA has developed compareregions within the United States but without the need forcurrency conversion An implicit regional price deflator (IRPD)can be derived by combining the RPPs and the US PCE priceindex
Regional Price Parities The RPPs are calculated using pricequotes for a wide array of items from the CPI which areaggregated into broader expenditure categories (such as foodtransportation or education) Data on rents are obtainedseparately from the Census Bureaus American CommunitySurvey (ACS) The expenditure weights for each category areconstructed using CPI expenditure weights BEAs personalconsumption expenditures and ACS rents expenditures
The broader categories and the data on rents are combinedwith the expenditure weights using a multilateral aggregationmethod that expresses a regions price level relative to theUS
For example if the RPP for area A is 120 and for area B is 90then on average prices are 20 percent higher and 10 percentlower than the US average for A and B respectively If thepersonal income for area A is $12000 and for area B is $9000then RPP-adjusted incomes are $10000 (or $12000120) and$10000 (or $9000090) respectively In other words thepurchasing power of the two incomes is equivalent whenadjusted by their respective RPPs
Implicit Regional Price Deflator The IRPD is a regional priceindex derived as the product of two terms the regional priceparity and the US PCE price index
The implicit regional price deflator will equal current dollarpersonal income divided by real personal income in chaineddollars The growth rate or year-to-year change in the IRPDs isa measure of regional inflation
Detailed information on the methodology used to estimate theRPPs may be found on the regional methodology page of theBEA website wwwbeagovregionalmethodscfm(regionalmethodscfm)
1
2
3
4
61418 2)24 PMBEA News Release Real Personal Income for States and Metropolitan Areas 2016
Page 5 of 8httpswwwbeagovnewsreleasesregionalrpprpp_newsreleasehtm
Additional Information
Resources
Stay informed about BEA developments by reading theBEA blog (httpblogbeagov) signing up for BEAsemail subscription service (_subscribe) or followingBEA on Twitter BEA_News(httpwwwtwittercomBEA_News)
Historical time series for these estimates can beaccessed in BEAs Interactive Data Application(itable)
Access BEA data by registering for BEAs DataApplication Programming Interface (APIsignup)(API)
For more on BEAs statistics see our monthly onlinejournal the Survey of Current Business (scb)
BEAs news release schedule(newsreleasesnews_release_schedulehtm)
Definitions
Personal income is the income received by or on behalf of allpersons from all sources from participation as laborers inproduction from owning a home or business from theownership of financial assets and from government andbusiness in the form of transfers It includes income fromdomestic sources as well as the rest of world It does notinclude realized or unrealized capital gains or losses
Per capita personal income is calculated as the total personalincome of the residents of a given area divided by thepopulation of the area In computing per capita personalincome BEA uses Census Bureau mid-year populationestimates
Personal income is measured before the deduction of personalincome taxes and other personal taxes and is reported incurrent dollars (no adjustment is made for price changes)Comparisons for different regions and time periods reflectchanges in both the price and quantity components of regionalpersonal income
The estimate of personal income for the United States is thesum of the state estimates and the estimate for the District ofColumbia it differs slightly from the estimate of personalincome in the national income and product accounts (NIPAs)because of differences in coverage in the methodologies usedto prepare the estimates and in the timing of the availabilityof source data
61418 2)24 PMBEA News Release Real Personal Income for States and Metropolitan Areas 2016
Page 6 of 8httpswwwbeagovnewsreleasesregionalrpprpp_newsreleasehtm
Regional price parities (RPPs) are regional price levelsexpressed as a percentage of the overall national price levelfor a given year The price level is determined by the averageprices paid by consumers for the mix of goods and servicesconsumed in each region
Detailed CPI price data are adjusted to obtain average pricelevels for BLS-defined areas These are allocated to countiesin combination with direct price and expenditure data on rentsfrom the ACS
County data are then aggregated to states and metropolitanareas
Personal income at RPPs is current-dollar personal incomedivided by the price parity for a given year and region Abalancing factor is applied so that the sum of personal incomeat RPPs across regions equals the current dollar sum
Real personal income is personal income at RPPs divided bythe national PCE chain-type price index The result is realpersonal income in chained dollars (using 2009 as the referenceyear) Using Alaska in 2016 as an example
(newsreleasesregionalrpp2018_imagesrpp0518_formula_01png)
Estimates of real personal income in the United States arederived as the sum of the regional estimates divided by theUS PCE Price Index
Implicit Regional Price Deflator (IRPD) is the product of theRPP times the national PCE price index It is equal to personalincome divided by real personal income See also the TechnicalNote
List of News Release Tables
Table 1 Real Personal Income and Implicit Regional PriceDeflators by State 2015-2016
5
6
61418 2)24 PMBEA News Release Real Personal Income for States and Metropolitan Areas 2016
Page 7 of 8httpswwwbeagovnewsreleasesregionalrpprpp_newsreleasehtm
Contact All of Us(contactssearchhtm)
Frequently AskedQuestions(faqindexcfm)
About BEA
News
US Economy ata Glance(newsreleasesglancehtm)
Current Releases(newsreleasesrelshtm)
News Release
InformationFor
Media(newsroomindexhtm)
CongressionalUsers(congressionalindexhtm)
Factsheets
Regional PI ampGDP(regionalbearfacts)
Intl Trade ampInvestment(internationalfactsheet)
Publications
Survey ofCurrent Business(scbindexhtm)
Papers by Topic(researchby_topichtm)
Resources
Interactive Data(itableindexcfm)
Research at BEA(researchindexhtm)
Developers(developers)
Table 2 Real Per Capita Personal Income by State 2015-2016
Table 3 Regional Price Parities by State 2016
Table 4 Real Personal Income and Implicit Regional PriceDeflators by Metropolitan Area 2015-2016
Table 5 Real Per Capita Personal Income by Metropolitan Area2015-2016
Table 6 Regional Price Parities by Metropolitan Area 2016
The BEA Regional Price Parity statistics are based in part onrestricted access Consumer Price Index data from the Bureauof Labor Statistics (BLS) The BEA statistics presented hereinare products of BEA and not BLS
To estimate RPPs CPI price quotes are quality adjusted andpooled over 5 years The ACS rents are also quality adjustedand are either annual for states or pooled over 3 years formetropolitan areas The expenditure weights are specific foreach year
The multilateral system that is used is the Geary additivemethod Any region or combination of regions may be used asthe base or reference region without loss of consistency
The growth rate of the implicit regional price deflators willnot necessarily equal the region or metro area price deflatorspublished by the BLS This is because the CPI deflators arecalculated directly while the IRPDs are indirect estimates andbecause of differences in the source data and methodology
The CPI represents about 93 percent of the total USpopulation including almost all residents of urban ormetropolitan areas In the Northeast region rural area prices(exclusive of rents) are assumed to be the same as those in thesmall metropolitan areas of the CPI in the Midwest South andWest regions they are assumed to be the same as those in thenonmetropolitan urban areas of the CPI
RPP should first be divided by 100
1
2
3
4
5
6
61418 2)24 PMBEA News Release Real Personal Income for States and Metropolitan Areas 2016
Page 8 of 8httpswwwbeagovnewsreleasesregionalrpprpp_newsreleasehtm
(aboutindexhtm)
Policies(aboutpolicieshtm)Privacy Policy(aboutPrivacy_Statementhtm)
FOIA(httpwwwosecdocgovomoFOIAFOIAWebsitehtm)
Accessibility(aboutaccessibilityhtm)
Commitment to ScientificIntegrity(_pdfscientific_integrity_statement_of_the_principal_statistical_agenciespdf)
Information Quality Guidelines(aboutinfoqualhtm)
Data Dissemination Practices(aboutBEAdisseminationhtm)
Open Data (datahtm)
ESR System (statusindexcfm)
USAgov (wwwusagov)
US Department of Commerce(wwwcommercegov)
Archive(newsreleasesrelease_archivehtm)
eFile Users(efile)
BE-13Respondents(surveysrespondent_be13htm)
Private FundReporters(surveysprivatefunds)
Job Seekers(jobsindexhtm)
Industry GDP(industryfactsheet)
Multimedia(videoindexhtm)
FAQs(faqindexcfm)
More
Directors Page(aboutdirectorhtm)
Conferences(agencyexhibit_schedulehtm)
Guidelines forCiting BEAInformation(aboutBEAcitinghtm)
61418 2)24 PMrpp0518_chart_01png 2204times2389 pixels
Page 1 of 1httpswwwbeagovnewsreleasesregionalrpp2018_imagesrpp0518_chart_01png
Purchasing Power
The attached spreadsheets are designed to accurately calculate federal income tax state income tax and FICA tax (Social Security and Medicare tax) on an individualrsquos annual wagesalary Taxes are computed assuming a single filer standard deduction and no additional dependents The accounting firm Eide Bailly prepares the calculations and they should be accurate within $5 annually Once we know how much in taxes are due we can determine after tax wages (gross salary less taxes) This is how much money a worker has left over once the government has taken out the correct amount of payroll taxes We also know that different areasregions have different costs of living For example New York City has a much higher cost of living than Sioux Falls To determine the cost of living in any given city or state the US Bureau of Economic Analysis (BEA) compares millions of price points on goods and services across the nation and produces Regional Price Parities (RPP) The national average of all costs is 100 A state or city with lower average costs will have an RPP of less than 100 (SDrsquoS is 883) and a city or state with a higher cost of living will have an RPP over 100 (for example Hawaiirsquos RPP is 1184) So to determine purchasing power we divide after tax wages by a given city or statersquos RPP This is the only way to have a meaningful comparison of wages in different cities and states The true measure of how well yoursquore paid is not your gross pay rather it is how much you can buy with your wages after the government has taken its share Note The BEA will release the 2017 RPPs in May of 2019
Rank State
Average Teacher Salary
(NEA 2017) Total Federal and State
Adjustments to Pay Take Home Pay RPP Cost of Living Index (BEA 2016)
After Tax Wages Adjusted for Cost
of Living (RPP) 1 Massachusetts 78100 20118 57982 1078 53787 2 Pennsylvania 66265 14983 51282 0984 52116 3 Alaska 68138 13500 54638 1054 51839 4 New York 81902 22018 59884 1156 51803 5 Ohio 58202 11987 46215 0893 51753 6 Rhode Island 66477 15043 51434 0996 51641 7 Michigan 62287 14242 48045 0933 51495 8 California 79128 20967 58161 1144 50840 9 Connecticut 73147 18526 54621 1087 50249
10 Illinois 64933 15284 49649 0989 50201 11 Wyoming 58187 10550 47637 0967 49263 12 Nevada 57376 10311 47065 0974 48321 13 District of Columbia 75692 19942 55750 1159 48102 14 Iowa 55647 12431 43216 0902 47911 15 Indiana 54308 11127 43181 0903 47820 16 North Dakota 52968 9485 43483 0915 47522 17 Maryland 68357 16518 51839 1095 47341 18 New Jersey 69623 16243 53380 1132 47156 19 Georgia 55532 12605 42927 0921 46609 20 Kentucky 52338 11513 40825 0878 46498 21 Tennessee 50099 8211 41889 0902 46440 22 Alabama 50391 10261 40130 0866 46340 23 Delaware 60214 13819 46395 1002 46302 24 Oregon 61862 15991 45871 0998 45963 25 Wisconsin 54998 12348 42650 0928 45959 26 Nebraska 52338 10973 41365 0905 45708 27 Minnesota 57346 13063 44283 0975 45418 28 Texas 52575 8888 43687 0969 45085 29 Louisiana 50000 9683 40318 0904 44599 30 South Dakota 46979 7601 393785 0883 44596 31 New Hampshire 57522 10355 47167 1059 44539 32 Vermont 57349 12149 45200 1016 44488 33 Arkansas 48304 9847 38458 0869 44255 34 South Carolina 50000 10360 39641 0903 43899 35 Missouri 48618 9353 39265 0895 43871 36 Kansas 49422 9988 39434 0905 43573 37 North Carolina 49970 10456 39514 0909 43470 38 Montana 51422 11058 40364 0941 42894 39 Washington 54433 9437 44996 1055 42650 40 West Virginia 45555 9112 36443 0876 41602 41 Maine 51077 10908 40169 0984 40822
42 Oklahoma 45292 8979 36313 0890 40802 43 New Mexico 47122 9071 38051 0936 40653 44 Idaho 47504 9990 37514 0930 40338 45 Arizona 47403 8879 38524 0959 40171 46 Colorado 51808 10509 41299 1030 40096 47 Mississippi 42925 8385 34540 0864 39977 48 Florida 47267 7659 39609 0997 39728 49 Virginia 51049 10882 40167 1023 39264 50 Utah 47244 9543 37701 0973 38747 51 Hawaii 56651 13752 42899 1184 36232
Source SD Governors Office of Economic Development based on 2018 federal tax data and 2017 state tax data
Education Commission of the States
South Dakota Blue Ribbon Task Force on School Funding
Pierre South DakotaJuly 2015
Michael GriffithSchool Finance ConsultantEducation Commission of the States
Education Commission of the States
Education Commission of the States
Created by states for states in 1965 to track state policy trends translate academic research provide unbiased advice and create opportunities for state leaders to learn from one another
53 member states territories and the District of Columbia
Contact wwwecsorg (303) 2993600
2
Education Commission of the States
Per Pupil Expenditures 2006-07 to 2016-17
3
$0
$2000
$4000
$6000
$8000
$10000
$12000
2003-04 2004-05 2005-06 2006-07 2007-08 2008-09 2009-10 2010-11 2011-12 2012-13 2013-14 2014-15 2015-16 2016-17
National Average South Dakota
Source NEA Rankings amp Estimates
Education Commission of the States
Average Per Pupil Expenditures in Bordering States
4
$6500
$7500
$8500
$9500
$10500
$11500
$12500
$13500
Iowa
Minnesota
Montana
Nebraska
North Dakota
South Dakota
Source NEA Rankings amp Estimates
Education Commission of the States
Average Teacher Salaries in Bordering States
5
$35000
$40000
$45000
$50000
$55000
$60000
2006-07 2007-08 2008-09 2009-10 2010-11 2011-12 2012-13 2013-14 2014-15 2015-16
Iowa
Minnesota
Montana
Nebraska
North Dakota
South Dakota
Source NEA Rankings amp Estimates
Education Commission of the States
Teacher Salaries amp Average Per Pupil Expenditures FY 2015-16
6
$6000
$8000
$10000
$12000
$14000
$16000
$18000
$20000
$22000
$40000 $45000 $50000 $55000 $60000 $65000 $70000 $75000 $80000
South Dakota
National Average
Per P
upil
Expe
nditu
res
Teacher Salaries
Education Commission of the States
For More Information
7
Michael GriffithEducation Commission of the States
700 Broadway Suite 810Denver Colorado 80203
(303) 299-3600wwwecsorg
mgriffithecsorg
- Teacher Compensation Review Board Minutes 082918 (002)
- Ingersoll PowerPntSD Talk 62018
-
- Slide Number 1
- The Source of Data
- Schools with Serious Teacher Shortages(Percent Public Secondary Schools with Teaching Vacancies and with Serious Difficulties Filling those Vacancies by Field 2015-16)
- The Surprising Sources of Teacher Supply (Percent of Newly Hired Teachers in the Public School System by Supply Source 2015-16)
- Attrition in Teaching is Higher Than in Many OccupationsProfessions(Among 1993 College Grads Who Entered Selected Occupations by 1997 Percent Gone From Occupation by 2003)
- Slide Number 6
- Beginning Teachers Leave Teaching at Highest Rates (Cumulative Percent Teacher Attrition by Years of Experience 1993-2003
- Job Dissatisfaction a Leading Factor Behind Teacher Turnover (Percent Public School Teachers Reporting that Various Reasons Were Important for their Turnover 2012-13)
- Teachersrsquo Working Conditions are Important for Turnover(Of Those Public School Teachers Who Moved From or Left Their School Because of Dissatisfaction Percent Reporting Particular Sources of Dissatisfaction 2012-13)
- Teacher Recruitment Alone Does Not Work
- Slide Number 11
- Research Shows Positive Effects of Induction amp Support Program for Beginning Teachers
- For Further Information Copies of Articles Reports etc
-
- SD DOE Blue Ribbon Update Final
-
- Trends in Educator Preparation and Employment in South Dakota
- Setting the Stage Purpose amp Source Data
- Slide Number 3
- Slide Number 4
- South Dakota Distribution of Teachers by Grade Span Type 2016-17
- South Dakota Overview of the field2016-17 Year
- South Dakota District normsTeacher average years experience
- Slide Number 8
- South Dakota Age distribution of teachers 2016-17
- South Dakota District normsTeacher average startingbase salary
- South Dakota District normsTeacher average salary (not total compensation)
- South Dakota District normsAdministrator average salary (not total compensation)
- 2017-18 Headcount by Assignment Area
- South Dakota Key pieces of pipeline data
- 5 Year Projections Teacher Need
- Need to meet student growth
- South Dakota District NormsAverage Student to Teacher Ratio
- South Dakota K-12 student enrollments including 5 year projections
- South Dakota Teacher need to meet anticipated student growth
- Slide Number 20
- South Dakota Administrator teacher and education specialist retirements2011-2016
- South Dakota One Five and ten-year retirementseligible versus estimated
- Slide Number 23
- South Dakota Reasons that K-12 teachers do not return to their position (Headcount)
- South Dakota Reasons teachers do not return to prior position (201718 School Year)
- South Dakota Estimated number of teachers leaving the field
- Slide Number 27
- South Dakota 5-year projected teacher need
- Slide Number 29
- South Dakota Total FTE of Certified Teachers and Total Number of New Certificates last 5 years
- Slide Number 31
- South Dakota Teacher preparation graduates2002-03 to 2016-17
- BOR Teacher Graduate PlacementsFY 2002-2016
- South Dakota Trajectories for new teacher graduates next 5 years
- Slide Number 35
- South Dakota Teachers from out-of-state 2010-2014
- Slide Number 37
- South Dakota Alternative certificates
- Slide Number 39
- South Dakota Five-year teacher pipeline projections
- Slide Number 41
- South Dakota Pipeline Overview
- Slide Number 43
- 2018 Preliminary Plans of Intent
- South Dakota Unfilled Vacancies First Day of School 2017-18
- South Dakota High School vacancies by FTE first day of school 2014-2015
- Slide Number 47
- South Dakota Hard to fill positions Plans of Intent 2017-18
- South Dakota Plan of Intent Trends
- South Dakota Hard to fill position resolution of Unfilled Vacancies 2014-15 (October 15)
- Slide Number 51
- South Dakota Flexible Learning OptionsSouth Dakota Virtual School Courses
- South Dakota Flexible Learning OptionsSouth Dakota Virtual School Courses
- South Dakota Flexible Learning OptionsSouth Dakota Virtual School Courses
- South Dakota Flexible Learning OptionsDual Credit Courses
- South Dakota Flexible Learning OptionsDual Credit Courses by Institution
- Slide Number 57
-
- NEA teacher salary ranking
- NEA teacher salary ranking with regional price parities
- BEA 2016 real person income for states and metro areas (1)
- BEA 2016 regional price parities by state
- Purchasing Power
- Teacher Wage Calculator Short
- ECS Spending and Salary Data June 2018
-
- Slide Number 1
- Education Commission of the States
- Per Pupil Expenditures 2006-07 to 2016-17
- Average Per Pupil Expenditures in Bordering States
- Average Teacher Salaries in Bordering States
- Teacher Salaries amp Average Per Pupil Expenditures FY 2015-16
- For More Information
-
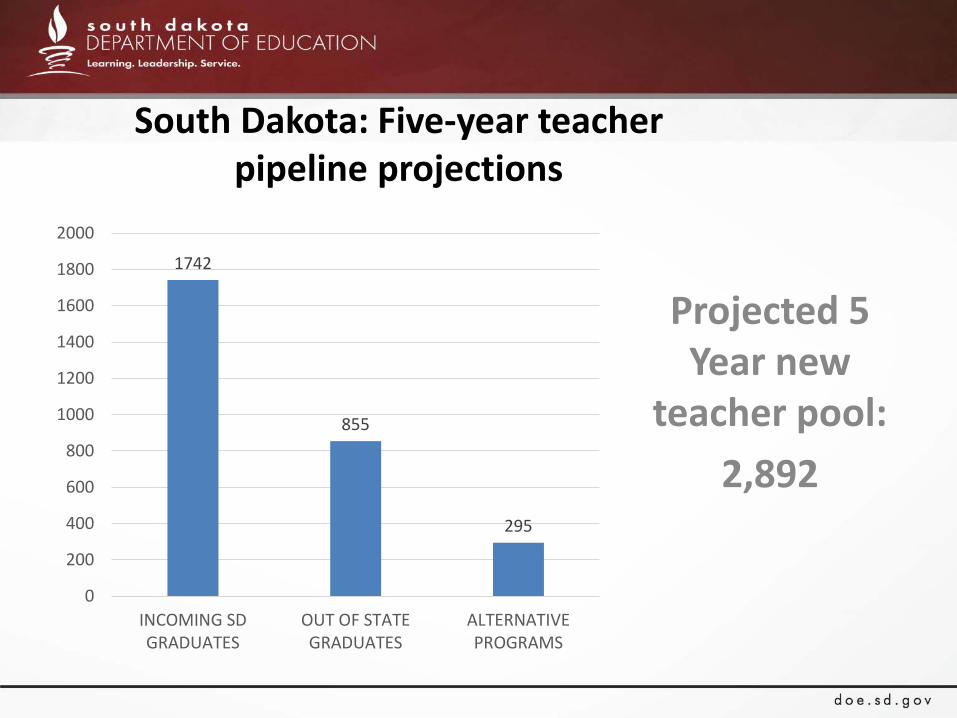

Hard to Fill Positions
2018 Preliminary Plans of IntentEducator Assignment PLANS OF INTENT BY HEAD COUNT Percent on Plan of IntentAdministrators 18 3Career and Technical Education 108 14English Language Learner 13 19Fine Arts 13 5Language Arts 64 4Math 41 3Military 0 0Miscellaneous 4 0Music 14 3Non-Credit 3 0PE-Health 35 6Religion 0 0Science 59 6Elementary 77 2Social Science 63 6Special Education 39 4World Language 16 9
567 3
SOURCE SD DOE Personnel Record Form database
South Dakota Unfilled Vacancies First Day of School 2017-18
bull Includes ALL Public schools
bull Represents teaching positions at 78 schools 39 districts
bull Administrator and School Service Specialists at 11 districts
SOURCE SD DOE Personnel Record Form database
FTE CoursesAdministrators 1Career and Technical Education 348 22Education Specialists 1211 14English Learner ESL 1 1Fine Arts 115 2Language Arts 386 20Math 373 22Miscellaneous 2 8Music 08 1Non-Credit 546 24PE-Health 019 2Science 18 9Elementary 1346 15Social Science 097 4Special Education 1252 13World Language 024 2Total FTE 6377 161
South Dakota High School vacancies by FTE first day of school 2014-2015
bull Represents positions at 24 schools and districts (1194 of HS)
bull Math amp Science 8 high schools with at least 1 unfilled course (40 of HS)
bull English 3 high schools with at least 1 unfilled course (15 of HS)
SOURCE SD DOE Personnel Record Form database
FTEPercent of
ALL FTE vacancies
Administrators 066 6600Career and Technical Education 284 8161Education Specialists 05 413Fine Arts 015 1304Language Arts 244 6321Math 222 5952Miscellaneous 058 2900Non-Credit 442 8095PE-Health 006 3158Science 153 8500Social Science 05 5155Special Education 452 3610World Language 024 10000
TOTAL 2066 3240
Hard to Fill Positions
South Dakota Hard to fill positions Plans of Intent 2017-18 bull Includes all Public Schools
in the state
bull English as a Second Language World Language and CTE teachers were the most likely to be on Plans of Intent
bull Highest numbers of Plans of intent in Elementary CTE Language Arts amp Social Science
PLANS OF INTENT(HEAD COUNT)
OF CATEGORY
Administrators 18 3
CTE 108 14
ESL (Non-Core) 13 19
Fine Arts 13 5
Language Arts 64 4
Math 41 3
Military 0 0
Miscellaneous 4 0
Music 14 3
Non-Credit 3 0
PE-Health 35 6
Science 59 6
Elementary 77 2
Social Science 63 6
Special Ed (Non-Core) 39 4
World Language 16 9
SOURCE SD DOE Personnel Record Form database
South Dakota Plan of Intent Trends
bull One teacher may be on multiple plans of intent to teach multiple courses
bull Both the number of teachers and the number of plans of intent has been growing
bull Plans of Intent are issued for up to 2 years in most casesbull Educators have completed 2449 of Plans of Intent in recent years
on average This is down from pre-2015 percentages
SOURCE SD DOE Personnel Record Form database
2015 2016 2017 Plans of Intent 576 726 676
Not Completed NA 538 520Completed NA 188 156
Headcount 501 596 563
SOURCE SD DOE Personnel Record Form database
South Dakota Hard to fill position resolutionof Unfilled Vacancies 2014-15 (October 15)
bull Most common resolution was to re-assign duties to other staff
bull Vacant courses is down from 2015
SOURCE SD DOE Personnel Record Form database
of Courses of Vacancies
Eliminate CourseProgram 27 1677Additional duties given to other staff 38 2360
Hired certified candidate after school started 8 497
Increased Class size 16 994Position remains vacant 31 1925Use Distance Learning 14 870Other 27 1677
Total (including Administrators and School Service Specialists)
161
Hard to Fill PositionsFlexible Course Offerings
South Dakota Flexible Learning OptionsSouth Dakota Virtual School Courses
SOURCE SD Virtual School annual reports
bull Represents officially reported public school enrollments
bull 1622 increase in student enrollments since 2010-11
Districts CoursesTotal
Student EnrollmentsPublic Other Available Offered
2010-11 118 233 3446
2011-12 127 255 3389
2012-13 133 289 3750
2013-14 135 298 3837
2014-15 133 16 389 3952
2015-16 126 15 209 4078
2016-17 133 13 275 4005
South Dakota Flexible Learning OptionsSouth Dakota Virtual School Courses
SOURCE SD Virtual School annual reports
bull Over time offerings in more subjects have been added
bull Credit Recovery and World Languages have the highest enrollments
2010-2011
2011-2012
2012-2013
2013-2014
2014-2015
2015-2016
2016-2017
CTE 276 283 316 401 400 365 284Credit Recovery 842 942 946 727 627 559 609College Readiness 115 169 128 115 90
Fine Arts 188 114 127 132 132 107 59HealthPE 105 60 43 66 55 151 123ELA 320 299 351 297 255 411 287Math 340 194 246 286 334 653 344Sciences 280 334 396 413 524 403 310Social Sciences 798 137 165 190 285 311 200World Language 1008 1015 1098 1061 808 698Personal FianceEcon 1 7 40 44 66 45
Technology 14 10 9 9 3 7Elementary 84 89 17Other 38 3 13 9 14 37 0
bull Credit Recovery courseshad the lowestcompletion rates acrossthe board and accountfor a significant portionof enrollments
bull Completion rates haveincreased over time
bull Overall completion ratewithout Credit Recoverycourses included jumpsfrom 6424 to 7439
South Dakota Flexible Learning OptionsSouth Dakota Virtual School Courses
SOURCE SD Virtual School annual reports
2014-15 2015-16 2016-17
EnrolledCompletion
Rate EnrolledCompletion
Rate EnrolledCompletion
Rate
CTE 400 688 365 967 284 954
Credit Recovery 627 217 559 243 609 232
College Readiness 128 633 115 461 90 900
Fine Arts 132 705 107 766 59 780
HealthPE 555 618 151 483 123 545
ELA 255 416 411 496 287 530
Math 334 458 653 583 344 552
Sciences 524 523 403 806 310 868
Social Sciences 285 428 311 701 200 710
World Language 1061 523 808 783 698 807
Personal FianceEcon 44 796 66 773 45 778
Technology 9 556 3 1000 7 857
Elementary 84 524 89 472 17 647
Other 14 714 37 784 0
South Dakota Flexible Learning OptionsDual Credit Courses
SOURCE SD DOE dual credit program August 2015 reports
bull Total enrollments increased by 9337 and Credits earned by 9851 between 2014 and 2016
2014-15 (allterms)
2015-16 (allterms)
2016-17 (allterms)
2017-18(Fall only)
Total course enrollment 4227 6951 8174 4392Students taking at least 1
course 2135 2688 2717 1967
Credits earned 1141450 18590 22659 12943
000
500000
1000000
1500000
2000000
2500000
0
1000
2000
3000
4000
5000
6000
7000
8000
9000
South Dakota Flexible Learning OptionsDual Credit Courses by Institution
SOURCE SD DOE dual credit program August 2015 reports
2014-15 (all terms)
2015-16 (all terms)
2016-17 (all terms)
2017-18 (Fall only)
Black Hills State University 50 52 70 45Dakota State University 19 23 24 17Lake Area Technical Institute 51 64 65 60Mitchell Technical Institute 24 58 55 37Northern State University 30 46 43 33South Dakota School of Mines and Technology 23 26 35 15South Dakota State University 52 60 59 47Southeast Technical Institute 51 63 54 42University of South Dakota 37 54 63 39Western Dakota Tech 35 71 84 31
372 517 552 366
Questionsbull Abby Javurekbull SD Dept of Educationbull 6057733426bull AbbyJavurekstatesdusbull SD DOE website httpdoesdgov
Rankings of the States 2017 and
Estimates of School Statistics 2018
NEA RESEARCH April 2018
Reproduction No part of this report may be reproduced in any form without permission from NEA Research except by NEA-affiliated associations Any reproduction of the report materials must include the usual credit line and the copyright notice Address communications to NEA Research 1201 16th Street NW St 610 Washington DC 20036 or by email to RankingsEstimatesneaorg
Copyright copy 2018 by the National Education Association
All Rights Reserved
SALARY ($) RANK SALARY ($) RANK CHANGE () RANKAlabama 48518 38 50391 35 39 3 Alaska 67443 7 68138 8 10 34 Arizona 47218 43 47403 44 04 45 Arkansas 48218 39 48304 42 02 47 California 77179 2 79128 2 25 13 Colorado 51233 30 51808 31 11 32 Connecticut 72013 5 73147 5 16 25 Delaware 59960 14 60214 14 04 41 District of Columbia 73991 4 75692 4 23 18 Florida 46612 46 47267 45 14 26 Georgia 54190 23 55532 23 25 15 Hawaii 56049 20 56651 21 11 33 Idaho 46122 47 47504 43 30 8 Illinois 63475 11 64933 11 23 19 Indiana 53645 26 54308 26 12 30 Iowa 54386 22 55647 22 23 17 Kansas 47755 42 49422 40 35 4 Kentucky 52134 27 52338 29 04 46 Louisiana 49745 34 50000 37 05 40 Maine 50498 33 51077 33 11 31 Maryland 66456 8 68357 7 29 10 Massachusetts 76522 3 78100 3 21 20 Michigan 61875 12 62287 12 07 39 Minnesota 56913 17 57346 20 08 36 Mississippi 42744 50 42925 51 04 42 Missouri 47959 40 48618 41 14 27 Montana 51034 32 51422 32 08 38 Nebraska 51386 29 52338 30 19 21 Nevada 56943 16 57376 18 08 37 New Hampshire 56616 18 57522 17 16 24 New Jersey 69330 6 69623 6 04 44 New Mexico 47163 44 47122 47 -01 50 New York 79152 1 81902 1 35 5 North Carolina 47941 41 49970 39 42 2 North Dakota 51223 31 52968 27 34 6 Ohio 56441 19 58202 15 31 7 Oklahoma 45276 49 45292 50 00 49 Oregon 60395 13 61862 13 24 16 Pennsylvania 65151 10 66265 10 17 22 Rhode Island 66197 9 66477 9 04 43 South Carolina 48769 37 50000 38 25 14 South Dakota 42025 51 46979 48 118 1 Tennessee 48817 36 50099 36 26 12 Texas 51890 28 52575 28 13 29 Utah 46887 45 47244 46 08 35 Vermont 55726 21 57349 19 29 9 Virginia 49690 35 51049 34 27 11 Washington 53701 25 54433 25 14 28 West Virginia 45622 48 45555 49 -01 51 Wisconsin 54115 24 54998 24 16 23 Wyoming 58140 15 58187 16 01 48 United States 58479 - 59660 - 20 -
2016 2017 2016-17
B-6 AVERAGE SALARY OF TEACHERS
26
State RPP NEA Salary Adjusted Salary Rank State RPP NEA Salary Adjusted Salary RankMassachusetts 1078 $78100 $7244898 1 Vermont 1016 $57349 $5644587 27New York 1156 $81902 $7084948 2 Arkansas 869 $48304 $5558573 28California 1144 $79128 $6916783 3 Tennessee 902 $50099 $5554213 29Pennsylvania 984 $66265 $6734248 4 South Carolina 903 $50000 $5537099 30Connecticut 1087 $73147 $6729255 5 Louisiana 904 $50000 $5530973 31Michigan 933 $62287 $6675991 6 North Carolina 909 $49970 $5497250 32Rhode Island 996 $66477 $6674398 7 Montana 941 $51422 $5464612 33Illinois 989 $64933 $6565521 8 Kansas 905 $49422 $5460994 34DC 1159 $75692 $6530802 9 Missouri 895 $48618 $5432179 35Ohio 893 $58202 $6517581 10 New Hampshire 1059 $57522 $5431728 36Alaska 1054 $68138 $6464706 11 Texas 969 $52575 $5425697 37Maryland 1095 $68357 $6242648 12 South Dakota 883 $46979 $5320385 38Oregon 998 $61862 $6198597 13 West Virginia 876 $45555 $5200342 39Iowa 902 $55647 $6169290 14 Maine 984 $51077 $5190752 40New Jersey 1132 $69623 $6150442 15 Washington 1055 $54433 $5159526 41Georgia 921 $55532 $6029533 16 Idaho 930 $47504 $5107957 42Wyoming 967 $58187 $6017270 17 Oklahoma 890 $45292 $5088989 43Indiana 903 $54308 $6014175 18 New Mexico 936 $47122 $5034402 44Delaware 1002 $60214 $6009381 19 Colorado 1030 $51808 $5029903 45Kentucky 878 $52338 $5961048 20 Virginia 1023 $51049 $4990127 46Wisconsin 928 $54998 $5926509 21 Mississippi 864 $42925 $4968171 47Nevada 974 $57376 $5890760 22 Arizona 959 $47403 $4942961 48Minnesota 975 $57346 $5881641 23 Utah 973 $47244 $4855498 49Alabama 866 $50391 $5818822 24 Hawaii 1184 $56651 $4784713 50North Dakota 915 $52968 $5788852 25 Florida 997 $47267 $4740923 51Nebraska 905 $52338 $5783204 26
Sources NEA Ranking of the States 2017 and Estimates of School Statistics 2018 (April 2018)Bureau of Economic Analysis Regional Price Parities in 2016 (May 2018)
NEA 2017 AVERAGE TEACHER SALARIES BY STATEADJUSTED BY 2016 BEA REGIONAL PRICE PARITIES
61418 2)24 PMBEA News Release Real Personal Income for States and Metropolitan Areas 2016
Page 1 of 8httpswwwbeagovnewsreleasesregionalrpprpp_newsreleasehtm
EMBARGOED UNTIL RELEASE AT 830 AM EDT Thursday May 17 2018
BEA 18mdash23
3012789328
rppbeagov (mailtorppbeagov)
3012789003
Home (indexhtm) National (nationalindexhtm) International (internationalindexhtm)
Regional (regionalindexhtm) Industry (industryindexhtm) Interactive Data (itable) About BEA (aboutindexhtm)
FAQs (faqindexcfm)Contact Us (contactssearchhtm)
(indexhtm)
(httpwwwcommercegov)
Real Personal Income for States and MetropolitanAreas 2016
Real state personal income grew on average 11 percent in 2016after increasing 47 percent in 2015 according to estimates releasedtoday by the Bureau of Economic Analysis Real state personalincome is a states current-dollar personal income adjusted by thestates regional price parity and the national personal consumptionexpenditures price index The percent change in real state personalincome ranged from 33 percent in Utah and Georgia to -36 percentin Wyoming (table 1) In the District of Columbia real personalincome grew 45 percent Across metropolitan areas the percentchange ranged from 66 percent in Jacksonville NC to -81 percent inMidland TX and Odessa TX (table 4)
(newsreleasesregionalrpp2018_imagesrpp0518png)
Related Links
Full Release amp Tables (PDF)
(newsreleasesregionalrpp2018pdfrpp0518pdf)
State Tables Only(Excel)
(newsreleasesregionalrpp2018xlsrpp0518xlsx)
Metropolitan Area Tables Only(Excel)
(newsreleasesregionalrpp2018xlsrpp0518msaxlsx)
Highlights - State (PDF)
(newsreleasesregionalrpp2018pdfrpp0518_faxpdf)
Highlights - Metropolitan Area (PDF)
(newsreleasesregionalrpp2018pdfrpp0518b_faxpdf)
Interactive Tables (iTableiTableHtmlcfm
reqid=70ampstep=1ampisuri=1ampacrdn=8)
Contacts
Eric Figueroa (Technical)
Jeannine Aversa (Media)
Go
About Regional (regionalaboutcfm) Methodologies (regionalmethodscfm) Articles (regionalarticlescfm)
Release Schedule (newsreleasesnews_release_sort_regionalhtm) Staff Contacts (contactsemailhtm)
Email Subscriptions (_subscribe)
61418 2)24 PMBEA News Release Real Personal Income for States and Metropolitan Areas 2016
Page 2 of 8httpswwwbeagovnewsreleasesregionalrpprpp_newsreleasehtm
JeannineAversabeagov
(mailtoJeannineAversabeagov)
Real Personal Income in 2016
States with the fastest growth in real personal income wereUtah (33 percent) Georgia (33 percent) and Washington(30 percent) The District of Columbias real personalincome grew 45 percent
Eight states had declining real personal income The largestpercent declines were in Wyoming (-36 percent) Oklahoma(-27 percent) and Louisiana (-19 percent)
Large metropolitan areas ndash those with population greaterthan two million ndash with the fastest growth in real personalincome were Atlanta-Sandy Springs-Roswell GA (34percent) Orlando-Kissimmee-Sanford FL (33 percent) andCharlotte-Concord-Gastonia NC-SC (32 percent)
The three large metropolitan areas with declining realpersonal income were Houston-The Woodlands-Sugar LandTX (-33 percent) Denver-Aurora-Lakewood CO (-07percent) and Pittsburgh PA (-04 percent)
Regional Price Parities in 2016
Regional Price Parities (RPPs) measure the differences in price levelsacross states and metropolitan areas for a given year and areexpressed as a percentage of the overall national price level Allitems RPPs cover all consumption goods and services including rentsAreas with highlow RPPs typically correspond to areas with highlowprice levels for rents
States with the highest RPPs were Hawaii (1184) New York(1156) and California (1144) (table 3) The District ofColumbias RPP was 1159
States with the lowest RPPs were Mississippi (864) Alabama(866) and Arkansas (869)
Across states Hawaii had the highest rents RPP (1574) andAlabama and West Virginia had the lowest (632)
Large metropolitan areas with the highest RPPs were SanFrancisco-Oakland-Hayward CA (1247) New York-Newark-Jersey City NY-NJ-PA (1220) and Washington-Arlington-Alexandria DC-VA-MD-WV (1191) (table 6)
Large metropolitan areas with the lowest RPPs wereCincinnati OH-KY-IN (896) Cleveland-Elyria OH (902) andSt Louis MO-IL (908)
Across large metropolitan areas San Francisco-Oakland-Hayward CA had the highest rents RPP (1909) andCleveland-Elyria OH had the lowest (779)
Across all metropolitan areas San Jose-Sunnyvale-SantaClara CA had the highest rents RPP (2133) and Gadsden AL
Sign up (_subscribe) for e-mail notifications
Download (exit_siteasp
link=httpwwwadobecomproductsacrobatreadstep2html)
the Acrobat Reader
61418 2)24 PMBEA News Release Real Personal Income for States and Metropolitan Areas 2016
Page 3 of 8httpswwwbeagovnewsreleasesregionalrpprpp_newsreleasehtm
had the lowest (515)
Estimates of real personal income and regional priceparities for state metropolitan and nonmetropolitanportions can be found at httpswwwbeagovitable(iTableiTableHtmlcfmreqid=70ampstep=1ampisuri=1ampacrdn=8) Supplementaltables are available upon request
(newsreleasesregionalrpp2018_imagesrpp0518_chart_01png)
Updates to Real Personal Income
Today BEA also released revised real personal incomestatistics for states and metropolitan areas for 2014-2015 and real per capita personal income statistics forstates for 2010-2013 These revisions were made toincorporate newly available source data BEA willupdate real personal income for states on September25 2018 with the release of state personal incomeReal personal income for metropolitan areas will beupdated on November 15 2018 with the release of localarea personal income
Next release May 2019 ndash Real Personal Income for States andMetropolitan Areas 2017
Technical Notes on Regional Price Paritiesand Implicit Regional Price Deflators
61418 2)24 PMBEA News Release Real Personal Income for States and Metropolitan Areas 2016
Page 4 of 8httpswwwbeagovnewsreleasesregionalrpprpp_newsreleasehtm
Price indexes commonly measure price changes over time TheBEAs personal consumption expenditures (PCE) price index andthe Bureau of Labor Statistics consumer price index (CPI) aretwo examples Spatial price indexes measure price leveldifferences across regions for one time period An example ofthese type of indexes are purchasing power parities (PPPs)which measure differences in price levels across countries for agiven period and can be used to convert estimates of percapita GDP into comparable levels in a common currency Theregional price parities (RPPs) that BEA has developed compareregions within the United States but without the need forcurrency conversion An implicit regional price deflator (IRPD)can be derived by combining the RPPs and the US PCE priceindex
Regional Price Parities The RPPs are calculated using pricequotes for a wide array of items from the CPI which areaggregated into broader expenditure categories (such as foodtransportation or education) Data on rents are obtainedseparately from the Census Bureaus American CommunitySurvey (ACS) The expenditure weights for each category areconstructed using CPI expenditure weights BEAs personalconsumption expenditures and ACS rents expenditures
The broader categories and the data on rents are combinedwith the expenditure weights using a multilateral aggregationmethod that expresses a regions price level relative to theUS
For example if the RPP for area A is 120 and for area B is 90then on average prices are 20 percent higher and 10 percentlower than the US average for A and B respectively If thepersonal income for area A is $12000 and for area B is $9000then RPP-adjusted incomes are $10000 (or $12000120) and$10000 (or $9000090) respectively In other words thepurchasing power of the two incomes is equivalent whenadjusted by their respective RPPs
Implicit Regional Price Deflator The IRPD is a regional priceindex derived as the product of two terms the regional priceparity and the US PCE price index
The implicit regional price deflator will equal current dollarpersonal income divided by real personal income in chaineddollars The growth rate or year-to-year change in the IRPDs isa measure of regional inflation
Detailed information on the methodology used to estimate theRPPs may be found on the regional methodology page of theBEA website wwwbeagovregionalmethodscfm(regionalmethodscfm)
1
2
3
4
61418 2)24 PMBEA News Release Real Personal Income for States and Metropolitan Areas 2016
Page 5 of 8httpswwwbeagovnewsreleasesregionalrpprpp_newsreleasehtm
Additional Information
Resources
Stay informed about BEA developments by reading theBEA blog (httpblogbeagov) signing up for BEAsemail subscription service (_subscribe) or followingBEA on Twitter BEA_News(httpwwwtwittercomBEA_News)
Historical time series for these estimates can beaccessed in BEAs Interactive Data Application(itable)
Access BEA data by registering for BEAs DataApplication Programming Interface (APIsignup)(API)
For more on BEAs statistics see our monthly onlinejournal the Survey of Current Business (scb)
BEAs news release schedule(newsreleasesnews_release_schedulehtm)
Definitions
Personal income is the income received by or on behalf of allpersons from all sources from participation as laborers inproduction from owning a home or business from theownership of financial assets and from government andbusiness in the form of transfers It includes income fromdomestic sources as well as the rest of world It does notinclude realized or unrealized capital gains or losses
Per capita personal income is calculated as the total personalincome of the residents of a given area divided by thepopulation of the area In computing per capita personalincome BEA uses Census Bureau mid-year populationestimates
Personal income is measured before the deduction of personalincome taxes and other personal taxes and is reported incurrent dollars (no adjustment is made for price changes)Comparisons for different regions and time periods reflectchanges in both the price and quantity components of regionalpersonal income
The estimate of personal income for the United States is thesum of the state estimates and the estimate for the District ofColumbia it differs slightly from the estimate of personalincome in the national income and product accounts (NIPAs)because of differences in coverage in the methodologies usedto prepare the estimates and in the timing of the availabilityof source data
61418 2)24 PMBEA News Release Real Personal Income for States and Metropolitan Areas 2016
Page 6 of 8httpswwwbeagovnewsreleasesregionalrpprpp_newsreleasehtm
Regional price parities (RPPs) are regional price levelsexpressed as a percentage of the overall national price levelfor a given year The price level is determined by the averageprices paid by consumers for the mix of goods and servicesconsumed in each region
Detailed CPI price data are adjusted to obtain average pricelevels for BLS-defined areas These are allocated to countiesin combination with direct price and expenditure data on rentsfrom the ACS
County data are then aggregated to states and metropolitanareas
Personal income at RPPs is current-dollar personal incomedivided by the price parity for a given year and region Abalancing factor is applied so that the sum of personal incomeat RPPs across regions equals the current dollar sum
Real personal income is personal income at RPPs divided bythe national PCE chain-type price index The result is realpersonal income in chained dollars (using 2009 as the referenceyear) Using Alaska in 2016 as an example
(newsreleasesregionalrpp2018_imagesrpp0518_formula_01png)
Estimates of real personal income in the United States arederived as the sum of the regional estimates divided by theUS PCE Price Index
Implicit Regional Price Deflator (IRPD) is the product of theRPP times the national PCE price index It is equal to personalincome divided by real personal income See also the TechnicalNote
List of News Release Tables
Table 1 Real Personal Income and Implicit Regional PriceDeflators by State 2015-2016
5
6
61418 2)24 PMBEA News Release Real Personal Income for States and Metropolitan Areas 2016
Page 7 of 8httpswwwbeagovnewsreleasesregionalrpprpp_newsreleasehtm
Contact All of Us(contactssearchhtm)
Frequently AskedQuestions(faqindexcfm)
About BEA
News
US Economy ata Glance(newsreleasesglancehtm)
Current Releases(newsreleasesrelshtm)
News Release
InformationFor
Media(newsroomindexhtm)
CongressionalUsers(congressionalindexhtm)
Factsheets
Regional PI ampGDP(regionalbearfacts)
Intl Trade ampInvestment(internationalfactsheet)
Publications
Survey ofCurrent Business(scbindexhtm)
Papers by Topic(researchby_topichtm)
Resources
Interactive Data(itableindexcfm)
Research at BEA(researchindexhtm)
Developers(developers)
Table 2 Real Per Capita Personal Income by State 2015-2016
Table 3 Regional Price Parities by State 2016
Table 4 Real Personal Income and Implicit Regional PriceDeflators by Metropolitan Area 2015-2016
Table 5 Real Per Capita Personal Income by Metropolitan Area2015-2016
Table 6 Regional Price Parities by Metropolitan Area 2016
The BEA Regional Price Parity statistics are based in part onrestricted access Consumer Price Index data from the Bureauof Labor Statistics (BLS) The BEA statistics presented hereinare products of BEA and not BLS
To estimate RPPs CPI price quotes are quality adjusted andpooled over 5 years The ACS rents are also quality adjustedand are either annual for states or pooled over 3 years formetropolitan areas The expenditure weights are specific foreach year
The multilateral system that is used is the Geary additivemethod Any region or combination of regions may be used asthe base or reference region without loss of consistency
The growth rate of the implicit regional price deflators willnot necessarily equal the region or metro area price deflatorspublished by the BLS This is because the CPI deflators arecalculated directly while the IRPDs are indirect estimates andbecause of differences in the source data and methodology
The CPI represents about 93 percent of the total USpopulation including almost all residents of urban ormetropolitan areas In the Northeast region rural area prices(exclusive of rents) are assumed to be the same as those in thesmall metropolitan areas of the CPI in the Midwest South andWest regions they are assumed to be the same as those in thenonmetropolitan urban areas of the CPI
RPP should first be divided by 100
1
2
3
4
5
6
61418 2)24 PMBEA News Release Real Personal Income for States and Metropolitan Areas 2016
Page 8 of 8httpswwwbeagovnewsreleasesregionalrpprpp_newsreleasehtm
(aboutindexhtm)
Policies(aboutpolicieshtm)Privacy Policy(aboutPrivacy_Statementhtm)
FOIA(httpwwwosecdocgovomoFOIAFOIAWebsitehtm)
Accessibility(aboutaccessibilityhtm)
Commitment to ScientificIntegrity(_pdfscientific_integrity_statement_of_the_principal_statistical_agenciespdf)
Information Quality Guidelines(aboutinfoqualhtm)
Data Dissemination Practices(aboutBEAdisseminationhtm)
Open Data (datahtm)
ESR System (statusindexcfm)
USAgov (wwwusagov)
US Department of Commerce(wwwcommercegov)
Archive(newsreleasesrelease_archivehtm)
eFile Users(efile)
BE-13Respondents(surveysrespondent_be13htm)
Private FundReporters(surveysprivatefunds)
Job Seekers(jobsindexhtm)
Industry GDP(industryfactsheet)
Multimedia(videoindexhtm)
FAQs(faqindexcfm)
More
Directors Page(aboutdirectorhtm)
Conferences(agencyexhibit_schedulehtm)
Guidelines forCiting BEAInformation(aboutBEAcitinghtm)
61418 2)24 PMrpp0518_chart_01png 2204times2389 pixels
Page 1 of 1httpswwwbeagovnewsreleasesregionalrpp2018_imagesrpp0518_chart_01png
Purchasing Power
The attached spreadsheets are designed to accurately calculate federal income tax state income tax and FICA tax (Social Security and Medicare tax) on an individualrsquos annual wagesalary Taxes are computed assuming a single filer standard deduction and no additional dependents The accounting firm Eide Bailly prepares the calculations and they should be accurate within $5 annually Once we know how much in taxes are due we can determine after tax wages (gross salary less taxes) This is how much money a worker has left over once the government has taken out the correct amount of payroll taxes We also know that different areasregions have different costs of living For example New York City has a much higher cost of living than Sioux Falls To determine the cost of living in any given city or state the US Bureau of Economic Analysis (BEA) compares millions of price points on goods and services across the nation and produces Regional Price Parities (RPP) The national average of all costs is 100 A state or city with lower average costs will have an RPP of less than 100 (SDrsquoS is 883) and a city or state with a higher cost of living will have an RPP over 100 (for example Hawaiirsquos RPP is 1184) So to determine purchasing power we divide after tax wages by a given city or statersquos RPP This is the only way to have a meaningful comparison of wages in different cities and states The true measure of how well yoursquore paid is not your gross pay rather it is how much you can buy with your wages after the government has taken its share Note The BEA will release the 2017 RPPs in May of 2019
Rank State
Average Teacher Salary
(NEA 2017) Total Federal and State
Adjustments to Pay Take Home Pay RPP Cost of Living Index (BEA 2016)
After Tax Wages Adjusted for Cost
of Living (RPP) 1 Massachusetts 78100 20118 57982 1078 53787 2 Pennsylvania 66265 14983 51282 0984 52116 3 Alaska 68138 13500 54638 1054 51839 4 New York 81902 22018 59884 1156 51803 5 Ohio 58202 11987 46215 0893 51753 6 Rhode Island 66477 15043 51434 0996 51641 7 Michigan 62287 14242 48045 0933 51495 8 California 79128 20967 58161 1144 50840 9 Connecticut 73147 18526 54621 1087 50249
10 Illinois 64933 15284 49649 0989 50201 11 Wyoming 58187 10550 47637 0967 49263 12 Nevada 57376 10311 47065 0974 48321 13 District of Columbia 75692 19942 55750 1159 48102 14 Iowa 55647 12431 43216 0902 47911 15 Indiana 54308 11127 43181 0903 47820 16 North Dakota 52968 9485 43483 0915 47522 17 Maryland 68357 16518 51839 1095 47341 18 New Jersey 69623 16243 53380 1132 47156 19 Georgia 55532 12605 42927 0921 46609 20 Kentucky 52338 11513 40825 0878 46498 21 Tennessee 50099 8211 41889 0902 46440 22 Alabama 50391 10261 40130 0866 46340 23 Delaware 60214 13819 46395 1002 46302 24 Oregon 61862 15991 45871 0998 45963 25 Wisconsin 54998 12348 42650 0928 45959 26 Nebraska 52338 10973 41365 0905 45708 27 Minnesota 57346 13063 44283 0975 45418 28 Texas 52575 8888 43687 0969 45085 29 Louisiana 50000 9683 40318 0904 44599 30 South Dakota 46979 7601 393785 0883 44596 31 New Hampshire 57522 10355 47167 1059 44539 32 Vermont 57349 12149 45200 1016 44488 33 Arkansas 48304 9847 38458 0869 44255 34 South Carolina 50000 10360 39641 0903 43899 35 Missouri 48618 9353 39265 0895 43871 36 Kansas 49422 9988 39434 0905 43573 37 North Carolina 49970 10456 39514 0909 43470 38 Montana 51422 11058 40364 0941 42894 39 Washington 54433 9437 44996 1055 42650 40 West Virginia 45555 9112 36443 0876 41602 41 Maine 51077 10908 40169 0984 40822
42 Oklahoma 45292 8979 36313 0890 40802 43 New Mexico 47122 9071 38051 0936 40653 44 Idaho 47504 9990 37514 0930 40338 45 Arizona 47403 8879 38524 0959 40171 46 Colorado 51808 10509 41299 1030 40096 47 Mississippi 42925 8385 34540 0864 39977 48 Florida 47267 7659 39609 0997 39728 49 Virginia 51049 10882 40167 1023 39264 50 Utah 47244 9543 37701 0973 38747 51 Hawaii 56651 13752 42899 1184 36232
Source SD Governors Office of Economic Development based on 2018 federal tax data and 2017 state tax data
Education Commission of the States
South Dakota Blue Ribbon Task Force on School Funding
Pierre South DakotaJuly 2015
Michael GriffithSchool Finance ConsultantEducation Commission of the States
Education Commission of the States
Education Commission of the States
Created by states for states in 1965 to track state policy trends translate academic research provide unbiased advice and create opportunities for state leaders to learn from one another
53 member states territories and the District of Columbia
Contact wwwecsorg (303) 2993600
2
Education Commission of the States
Per Pupil Expenditures 2006-07 to 2016-17
3
$0
$2000
$4000
$6000
$8000
$10000
$12000
2003-04 2004-05 2005-06 2006-07 2007-08 2008-09 2009-10 2010-11 2011-12 2012-13 2013-14 2014-15 2015-16 2016-17
National Average South Dakota
Source NEA Rankings amp Estimates
Education Commission of the States
Average Per Pupil Expenditures in Bordering States
4
$6500
$7500
$8500
$9500
$10500
$11500
$12500
$13500
Iowa
Minnesota
Montana
Nebraska
North Dakota
South Dakota
Source NEA Rankings amp Estimates
Education Commission of the States
Average Teacher Salaries in Bordering States
5
$35000
$40000
$45000
$50000
$55000
$60000
2006-07 2007-08 2008-09 2009-10 2010-11 2011-12 2012-13 2013-14 2014-15 2015-16
Iowa
Minnesota
Montana
Nebraska
North Dakota
South Dakota
Source NEA Rankings amp Estimates
Education Commission of the States
Teacher Salaries amp Average Per Pupil Expenditures FY 2015-16
6
$6000
$8000
$10000
$12000
$14000
$16000
$18000
$20000
$22000
$40000 $45000 $50000 $55000 $60000 $65000 $70000 $75000 $80000
South Dakota
National Average
Per P
upil
Expe
nditu
res
Teacher Salaries
Education Commission of the States
For More Information
7
Michael GriffithEducation Commission of the States
700 Broadway Suite 810Denver Colorado 80203
(303) 299-3600wwwecsorg
mgriffithecsorg
- Teacher Compensation Review Board Minutes 082918 (002)
- Ingersoll PowerPntSD Talk 62018
-
- Slide Number 1
- The Source of Data
- Schools with Serious Teacher Shortages(Percent Public Secondary Schools with Teaching Vacancies and with Serious Difficulties Filling those Vacancies by Field 2015-16)
- The Surprising Sources of Teacher Supply (Percent of Newly Hired Teachers in the Public School System by Supply Source 2015-16)
- Attrition in Teaching is Higher Than in Many OccupationsProfessions(Among 1993 College Grads Who Entered Selected Occupations by 1997 Percent Gone From Occupation by 2003)
- Slide Number 6
- Beginning Teachers Leave Teaching at Highest Rates (Cumulative Percent Teacher Attrition by Years of Experience 1993-2003
- Job Dissatisfaction a Leading Factor Behind Teacher Turnover (Percent Public School Teachers Reporting that Various Reasons Were Important for their Turnover 2012-13)
- Teachersrsquo Working Conditions are Important for Turnover(Of Those Public School Teachers Who Moved From or Left Their School Because of Dissatisfaction Percent Reporting Particular Sources of Dissatisfaction 2012-13)
- Teacher Recruitment Alone Does Not Work
- Slide Number 11
- Research Shows Positive Effects of Induction amp Support Program for Beginning Teachers
- For Further Information Copies of Articles Reports etc
-
- SD DOE Blue Ribbon Update Final
-
- Trends in Educator Preparation and Employment in South Dakota
- Setting the Stage Purpose amp Source Data
- Slide Number 3
- Slide Number 4
- South Dakota Distribution of Teachers by Grade Span Type 2016-17
- South Dakota Overview of the field2016-17 Year
- South Dakota District normsTeacher average years experience
- Slide Number 8
- South Dakota Age distribution of teachers 2016-17
- South Dakota District normsTeacher average startingbase salary
- South Dakota District normsTeacher average salary (not total compensation)
- South Dakota District normsAdministrator average salary (not total compensation)
- 2017-18 Headcount by Assignment Area
- South Dakota Key pieces of pipeline data
- 5 Year Projections Teacher Need
- Need to meet student growth
- South Dakota District NormsAverage Student to Teacher Ratio
- South Dakota K-12 student enrollments including 5 year projections
- South Dakota Teacher need to meet anticipated student growth
- Slide Number 20
- South Dakota Administrator teacher and education specialist retirements2011-2016
- South Dakota One Five and ten-year retirementseligible versus estimated
- Slide Number 23
- South Dakota Reasons that K-12 teachers do not return to their position (Headcount)
- South Dakota Reasons teachers do not return to prior position (201718 School Year)
- South Dakota Estimated number of teachers leaving the field
- Slide Number 27
- South Dakota 5-year projected teacher need
- Slide Number 29
- South Dakota Total FTE of Certified Teachers and Total Number of New Certificates last 5 years
- Slide Number 31
- South Dakota Teacher preparation graduates2002-03 to 2016-17
- BOR Teacher Graduate PlacementsFY 2002-2016
- South Dakota Trajectories for new teacher graduates next 5 years
- Slide Number 35
- South Dakota Teachers from out-of-state 2010-2014
- Slide Number 37
- South Dakota Alternative certificates
- Slide Number 39
- South Dakota Five-year teacher pipeline projections
- Slide Number 41
- South Dakota Pipeline Overview
- Slide Number 43
- 2018 Preliminary Plans of Intent
- South Dakota Unfilled Vacancies First Day of School 2017-18
- South Dakota High School vacancies by FTE first day of school 2014-2015
- Slide Number 47
- South Dakota Hard to fill positions Plans of Intent 2017-18
- South Dakota Plan of Intent Trends
- South Dakota Hard to fill position resolution of Unfilled Vacancies 2014-15 (October 15)
- Slide Number 51
- South Dakota Flexible Learning OptionsSouth Dakota Virtual School Courses
- South Dakota Flexible Learning OptionsSouth Dakota Virtual School Courses
- South Dakota Flexible Learning OptionsSouth Dakota Virtual School Courses
- South Dakota Flexible Learning OptionsDual Credit Courses
- South Dakota Flexible Learning OptionsDual Credit Courses by Institution
- Slide Number 57
-
- NEA teacher salary ranking
- NEA teacher salary ranking with regional price parities
- BEA 2016 real person income for states and metro areas (1)
- BEA 2016 regional price parities by state
- Purchasing Power
- Teacher Wage Calculator Short
- ECS Spending and Salary Data June 2018
-
- Slide Number 1
- Education Commission of the States
- Per Pupil Expenditures 2006-07 to 2016-17
- Average Per Pupil Expenditures in Bordering States
- Average Teacher Salaries in Bordering States
- Teacher Salaries amp Average Per Pupil Expenditures FY 2015-16
- For More Information
-

South Dakota Flexible Learning OptionsSouth Dakota Virtual School Courses
SOURCE SD Virtual School annual reports
bull Over time offerings in more subjects have been added
bull Credit Recovery and World Languages have the highest enrollments
2010-2011
2011-2012
2012-2013
2013-2014
2014-2015
2015-2016
2016-2017
CTE 276 283 316 401 400 365 284Credit Recovery 842 942 946 727 627 559 609College Readiness 115 169 128 115 90
Fine Arts 188 114 127 132 132 107 59HealthPE 105 60 43 66 55 151 123ELA 320 299 351 297 255 411 287Math 340 194 246 286 334 653 344Sciences 280 334 396 413 524 403 310Social Sciences 798 137 165 190 285 311 200World Language 1008 1015 1098 1061 808 698Personal FianceEcon 1 7 40 44 66 45
Technology 14 10 9 9 3 7Elementary 84 89 17Other 38 3 13 9 14 37 0
bull Credit Recovery courseshad the lowestcompletion rates acrossthe board and accountfor a significant portionof enrollments
bull Completion rates haveincreased over time
bull Overall completion ratewithout Credit Recoverycourses included jumpsfrom 6424 to 7439
South Dakota Flexible Learning OptionsSouth Dakota Virtual School Courses
SOURCE SD Virtual School annual reports
2014-15 2015-16 2016-17
EnrolledCompletion
Rate EnrolledCompletion
Rate EnrolledCompletion
Rate
CTE 400 688 365 967 284 954
Credit Recovery 627 217 559 243 609 232
College Readiness 128 633 115 461 90 900
Fine Arts 132 705 107 766 59 780
HealthPE 555 618 151 483 123 545
ELA 255 416 411 496 287 530
Math 334 458 653 583 344 552
Sciences 524 523 403 806 310 868
Social Sciences 285 428 311 701 200 710
World Language 1061 523 808 783 698 807
Personal FianceEcon 44 796 66 773 45 778
Technology 9 556 3 1000 7 857
Elementary 84 524 89 472 17 647
Other 14 714 37 784 0
South Dakota Flexible Learning OptionsDual Credit Courses
SOURCE SD DOE dual credit program August 2015 reports
bull Total enrollments increased by 9337 and Credits earned by 9851 between 2014 and 2016
2014-15 (allterms)
2015-16 (allterms)
2016-17 (allterms)
2017-18(Fall only)
Total course enrollment 4227 6951 8174 4392Students taking at least 1
course 2135 2688 2717 1967
Credits earned 1141450 18590 22659 12943
000
500000
1000000
1500000
2000000
2500000
0
1000
2000
3000
4000
5000
6000
7000
8000
9000
South Dakota Flexible Learning OptionsDual Credit Courses by Institution
SOURCE SD DOE dual credit program August 2015 reports
2014-15 (all terms)
2015-16 (all terms)
2016-17 (all terms)
2017-18 (Fall only)
Black Hills State University 50 52 70 45Dakota State University 19 23 24 17Lake Area Technical Institute 51 64 65 60Mitchell Technical Institute 24 58 55 37Northern State University 30 46 43 33South Dakota School of Mines and Technology 23 26 35 15South Dakota State University 52 60 59 47Southeast Technical Institute 51 63 54 42University of South Dakota 37 54 63 39Western Dakota Tech 35 71 84 31
372 517 552 366
Questionsbull Abby Javurekbull SD Dept of Educationbull 6057733426bull AbbyJavurekstatesdusbull SD DOE website httpdoesdgov
Rankings of the States 2017 and
Estimates of School Statistics 2018
NEA RESEARCH April 2018
Reproduction No part of this report may be reproduced in any form without permission from NEA Research except by NEA-affiliated associations Any reproduction of the report materials must include the usual credit line and the copyright notice Address communications to NEA Research 1201 16th Street NW St 610 Washington DC 20036 or by email to RankingsEstimatesneaorg
Copyright copy 2018 by the National Education Association
All Rights Reserved
SALARY ($) RANK SALARY ($) RANK CHANGE () RANKAlabama 48518 38 50391 35 39 3 Alaska 67443 7 68138 8 10 34 Arizona 47218 43 47403 44 04 45 Arkansas 48218 39 48304 42 02 47 California 77179 2 79128 2 25 13 Colorado 51233 30 51808 31 11 32 Connecticut 72013 5 73147 5 16 25 Delaware 59960 14 60214 14 04 41 District of Columbia 73991 4 75692 4 23 18 Florida 46612 46 47267 45 14 26 Georgia 54190 23 55532 23 25 15 Hawaii 56049 20 56651 21 11 33 Idaho 46122 47 47504 43 30 8 Illinois 63475 11 64933 11 23 19 Indiana 53645 26 54308 26 12 30 Iowa 54386 22 55647 22 23 17 Kansas 47755 42 49422 40 35 4 Kentucky 52134 27 52338 29 04 46 Louisiana 49745 34 50000 37 05 40 Maine 50498 33 51077 33 11 31 Maryland 66456 8 68357 7 29 10 Massachusetts 76522 3 78100 3 21 20 Michigan 61875 12 62287 12 07 39 Minnesota 56913 17 57346 20 08 36 Mississippi 42744 50 42925 51 04 42 Missouri 47959 40 48618 41 14 27 Montana 51034 32 51422 32 08 38 Nebraska 51386 29 52338 30 19 21 Nevada 56943 16 57376 18 08 37 New Hampshire 56616 18 57522 17 16 24 New Jersey 69330 6 69623 6 04 44 New Mexico 47163 44 47122 47 -01 50 New York 79152 1 81902 1 35 5 North Carolina 47941 41 49970 39 42 2 North Dakota 51223 31 52968 27 34 6 Ohio 56441 19 58202 15 31 7 Oklahoma 45276 49 45292 50 00 49 Oregon 60395 13 61862 13 24 16 Pennsylvania 65151 10 66265 10 17 22 Rhode Island 66197 9 66477 9 04 43 South Carolina 48769 37 50000 38 25 14 South Dakota 42025 51 46979 48 118 1 Tennessee 48817 36 50099 36 26 12 Texas 51890 28 52575 28 13 29 Utah 46887 45 47244 46 08 35 Vermont 55726 21 57349 19 29 9 Virginia 49690 35 51049 34 27 11 Washington 53701 25 54433 25 14 28 West Virginia 45622 48 45555 49 -01 51 Wisconsin 54115 24 54998 24 16 23 Wyoming 58140 15 58187 16 01 48 United States 58479 - 59660 - 20 -
2016 2017 2016-17
B-6 AVERAGE SALARY OF TEACHERS
26
State RPP NEA Salary Adjusted Salary Rank State RPP NEA Salary Adjusted Salary RankMassachusetts 1078 $78100 $7244898 1 Vermont 1016 $57349 $5644587 27New York 1156 $81902 $7084948 2 Arkansas 869 $48304 $5558573 28California 1144 $79128 $6916783 3 Tennessee 902 $50099 $5554213 29Pennsylvania 984 $66265 $6734248 4 South Carolina 903 $50000 $5537099 30Connecticut 1087 $73147 $6729255 5 Louisiana 904 $50000 $5530973 31Michigan 933 $62287 $6675991 6 North Carolina 909 $49970 $5497250 32Rhode Island 996 $66477 $6674398 7 Montana 941 $51422 $5464612 33Illinois 989 $64933 $6565521 8 Kansas 905 $49422 $5460994 34DC 1159 $75692 $6530802 9 Missouri 895 $48618 $5432179 35Ohio 893 $58202 $6517581 10 New Hampshire 1059 $57522 $5431728 36Alaska 1054 $68138 $6464706 11 Texas 969 $52575 $5425697 37Maryland 1095 $68357 $6242648 12 South Dakota 883 $46979 $5320385 38Oregon 998 $61862 $6198597 13 West Virginia 876 $45555 $5200342 39Iowa 902 $55647 $6169290 14 Maine 984 $51077 $5190752 40New Jersey 1132 $69623 $6150442 15 Washington 1055 $54433 $5159526 41Georgia 921 $55532 $6029533 16 Idaho 930 $47504 $5107957 42Wyoming 967 $58187 $6017270 17 Oklahoma 890 $45292 $5088989 43Indiana 903 $54308 $6014175 18 New Mexico 936 $47122 $5034402 44Delaware 1002 $60214 $6009381 19 Colorado 1030 $51808 $5029903 45Kentucky 878 $52338 $5961048 20 Virginia 1023 $51049 $4990127 46Wisconsin 928 $54998 $5926509 21 Mississippi 864 $42925 $4968171 47Nevada 974 $57376 $5890760 22 Arizona 959 $47403 $4942961 48Minnesota 975 $57346 $5881641 23 Utah 973 $47244 $4855498 49Alabama 866 $50391 $5818822 24 Hawaii 1184 $56651 $4784713 50North Dakota 915 $52968 $5788852 25 Florida 997 $47267 $4740923 51Nebraska 905 $52338 $5783204 26
Sources NEA Ranking of the States 2017 and Estimates of School Statistics 2018 (April 2018)Bureau of Economic Analysis Regional Price Parities in 2016 (May 2018)
NEA 2017 AVERAGE TEACHER SALARIES BY STATEADJUSTED BY 2016 BEA REGIONAL PRICE PARITIES
61418 2)24 PMBEA News Release Real Personal Income for States and Metropolitan Areas 2016
Page 1 of 8httpswwwbeagovnewsreleasesregionalrpprpp_newsreleasehtm
EMBARGOED UNTIL RELEASE AT 830 AM EDT Thursday May 17 2018
BEA 18mdash23
3012789328
rppbeagov (mailtorppbeagov)
3012789003
Home (indexhtm) National (nationalindexhtm) International (internationalindexhtm)
Regional (regionalindexhtm) Industry (industryindexhtm) Interactive Data (itable) About BEA (aboutindexhtm)
FAQs (faqindexcfm)Contact Us (contactssearchhtm)
(indexhtm)
(httpwwwcommercegov)
Real Personal Income for States and MetropolitanAreas 2016
Real state personal income grew on average 11 percent in 2016after increasing 47 percent in 2015 according to estimates releasedtoday by the Bureau of Economic Analysis Real state personalincome is a states current-dollar personal income adjusted by thestates regional price parity and the national personal consumptionexpenditures price index The percent change in real state personalincome ranged from 33 percent in Utah and Georgia to -36 percentin Wyoming (table 1) In the District of Columbia real personalincome grew 45 percent Across metropolitan areas the percentchange ranged from 66 percent in Jacksonville NC to -81 percent inMidland TX and Odessa TX (table 4)
(newsreleasesregionalrpp2018_imagesrpp0518png)
Related Links
Full Release amp Tables (PDF)
(newsreleasesregionalrpp2018pdfrpp0518pdf)
State Tables Only(Excel)
(newsreleasesregionalrpp2018xlsrpp0518xlsx)
Metropolitan Area Tables Only(Excel)
(newsreleasesregionalrpp2018xlsrpp0518msaxlsx)
Highlights - State (PDF)
(newsreleasesregionalrpp2018pdfrpp0518_faxpdf)
Highlights - Metropolitan Area (PDF)
(newsreleasesregionalrpp2018pdfrpp0518b_faxpdf)
Interactive Tables (iTableiTableHtmlcfm
reqid=70ampstep=1ampisuri=1ampacrdn=8)
Contacts
Eric Figueroa (Technical)
Jeannine Aversa (Media)
Go
About Regional (regionalaboutcfm) Methodologies (regionalmethodscfm) Articles (regionalarticlescfm)
Release Schedule (newsreleasesnews_release_sort_regionalhtm) Staff Contacts (contactsemailhtm)
Email Subscriptions (_subscribe)
61418 2)24 PMBEA News Release Real Personal Income for States and Metropolitan Areas 2016
Page 2 of 8httpswwwbeagovnewsreleasesregionalrpprpp_newsreleasehtm
JeannineAversabeagov
(mailtoJeannineAversabeagov)
Real Personal Income in 2016
States with the fastest growth in real personal income wereUtah (33 percent) Georgia (33 percent) and Washington(30 percent) The District of Columbias real personalincome grew 45 percent
Eight states had declining real personal income The largestpercent declines were in Wyoming (-36 percent) Oklahoma(-27 percent) and Louisiana (-19 percent)
Large metropolitan areas ndash those with population greaterthan two million ndash with the fastest growth in real personalincome were Atlanta-Sandy Springs-Roswell GA (34percent) Orlando-Kissimmee-Sanford FL (33 percent) andCharlotte-Concord-Gastonia NC-SC (32 percent)
The three large metropolitan areas with declining realpersonal income were Houston-The Woodlands-Sugar LandTX (-33 percent) Denver-Aurora-Lakewood CO (-07percent) and Pittsburgh PA (-04 percent)
Regional Price Parities in 2016
Regional Price Parities (RPPs) measure the differences in price levelsacross states and metropolitan areas for a given year and areexpressed as a percentage of the overall national price level Allitems RPPs cover all consumption goods and services including rentsAreas with highlow RPPs typically correspond to areas with highlowprice levels for rents
States with the highest RPPs were Hawaii (1184) New York(1156) and California (1144) (table 3) The District ofColumbias RPP was 1159
States with the lowest RPPs were Mississippi (864) Alabama(866) and Arkansas (869)
Across states Hawaii had the highest rents RPP (1574) andAlabama and West Virginia had the lowest (632)
Large metropolitan areas with the highest RPPs were SanFrancisco-Oakland-Hayward CA (1247) New York-Newark-Jersey City NY-NJ-PA (1220) and Washington-Arlington-Alexandria DC-VA-MD-WV (1191) (table 6)
Large metropolitan areas with the lowest RPPs wereCincinnati OH-KY-IN (896) Cleveland-Elyria OH (902) andSt Louis MO-IL (908)
Across large metropolitan areas San Francisco-Oakland-Hayward CA had the highest rents RPP (1909) andCleveland-Elyria OH had the lowest (779)
Across all metropolitan areas San Jose-Sunnyvale-SantaClara CA had the highest rents RPP (2133) and Gadsden AL
Sign up (_subscribe) for e-mail notifications
Download (exit_siteasp
link=httpwwwadobecomproductsacrobatreadstep2html)
the Acrobat Reader
61418 2)24 PMBEA News Release Real Personal Income for States and Metropolitan Areas 2016
Page 3 of 8httpswwwbeagovnewsreleasesregionalrpprpp_newsreleasehtm
had the lowest (515)
Estimates of real personal income and regional priceparities for state metropolitan and nonmetropolitanportions can be found at httpswwwbeagovitable(iTableiTableHtmlcfmreqid=70ampstep=1ampisuri=1ampacrdn=8) Supplementaltables are available upon request
(newsreleasesregionalrpp2018_imagesrpp0518_chart_01png)
Updates to Real Personal Income
Today BEA also released revised real personal incomestatistics for states and metropolitan areas for 2014-2015 and real per capita personal income statistics forstates for 2010-2013 These revisions were made toincorporate newly available source data BEA willupdate real personal income for states on September25 2018 with the release of state personal incomeReal personal income for metropolitan areas will beupdated on November 15 2018 with the release of localarea personal income
Next release May 2019 ndash Real Personal Income for States andMetropolitan Areas 2017
Technical Notes on Regional Price Paritiesand Implicit Regional Price Deflators
61418 2)24 PMBEA News Release Real Personal Income for States and Metropolitan Areas 2016
Page 4 of 8httpswwwbeagovnewsreleasesregionalrpprpp_newsreleasehtm
Price indexes commonly measure price changes over time TheBEAs personal consumption expenditures (PCE) price index andthe Bureau of Labor Statistics consumer price index (CPI) aretwo examples Spatial price indexes measure price leveldifferences across regions for one time period An example ofthese type of indexes are purchasing power parities (PPPs)which measure differences in price levels across countries for agiven period and can be used to convert estimates of percapita GDP into comparable levels in a common currency Theregional price parities (RPPs) that BEA has developed compareregions within the United States but without the need forcurrency conversion An implicit regional price deflator (IRPD)can be derived by combining the RPPs and the US PCE priceindex
Regional Price Parities The RPPs are calculated using pricequotes for a wide array of items from the CPI which areaggregated into broader expenditure categories (such as foodtransportation or education) Data on rents are obtainedseparately from the Census Bureaus American CommunitySurvey (ACS) The expenditure weights for each category areconstructed using CPI expenditure weights BEAs personalconsumption expenditures and ACS rents expenditures
The broader categories and the data on rents are combinedwith the expenditure weights using a multilateral aggregationmethod that expresses a regions price level relative to theUS
For example if the RPP for area A is 120 and for area B is 90then on average prices are 20 percent higher and 10 percentlower than the US average for A and B respectively If thepersonal income for area A is $12000 and for area B is $9000then RPP-adjusted incomes are $10000 (or $12000120) and$10000 (or $9000090) respectively In other words thepurchasing power of the two incomes is equivalent whenadjusted by their respective RPPs
Implicit Regional Price Deflator The IRPD is a regional priceindex derived as the product of two terms the regional priceparity and the US PCE price index
The implicit regional price deflator will equal current dollarpersonal income divided by real personal income in chaineddollars The growth rate or year-to-year change in the IRPDs isa measure of regional inflation
Detailed information on the methodology used to estimate theRPPs may be found on the regional methodology page of theBEA website wwwbeagovregionalmethodscfm(regionalmethodscfm)
1
2
3
4
61418 2)24 PMBEA News Release Real Personal Income for States and Metropolitan Areas 2016
Page 5 of 8httpswwwbeagovnewsreleasesregionalrpprpp_newsreleasehtm
Additional Information
Resources
Stay informed about BEA developments by reading theBEA blog (httpblogbeagov) signing up for BEAsemail subscription service (_subscribe) or followingBEA on Twitter BEA_News(httpwwwtwittercomBEA_News)
Historical time series for these estimates can beaccessed in BEAs Interactive Data Application(itable)
Access BEA data by registering for BEAs DataApplication Programming Interface (APIsignup)(API)
For more on BEAs statistics see our monthly onlinejournal the Survey of Current Business (scb)
BEAs news release schedule(newsreleasesnews_release_schedulehtm)
Definitions
Personal income is the income received by or on behalf of allpersons from all sources from participation as laborers inproduction from owning a home or business from theownership of financial assets and from government andbusiness in the form of transfers It includes income fromdomestic sources as well as the rest of world It does notinclude realized or unrealized capital gains or losses
Per capita personal income is calculated as the total personalincome of the residents of a given area divided by thepopulation of the area In computing per capita personalincome BEA uses Census Bureau mid-year populationestimates
Personal income is measured before the deduction of personalincome taxes and other personal taxes and is reported incurrent dollars (no adjustment is made for price changes)Comparisons for different regions and time periods reflectchanges in both the price and quantity components of regionalpersonal income
The estimate of personal income for the United States is thesum of the state estimates and the estimate for the District ofColumbia it differs slightly from the estimate of personalincome in the national income and product accounts (NIPAs)because of differences in coverage in the methodologies usedto prepare the estimates and in the timing of the availabilityof source data
61418 2)24 PMBEA News Release Real Personal Income for States and Metropolitan Areas 2016
Page 6 of 8httpswwwbeagovnewsreleasesregionalrpprpp_newsreleasehtm
Regional price parities (RPPs) are regional price levelsexpressed as a percentage of the overall national price levelfor a given year The price level is determined by the averageprices paid by consumers for the mix of goods and servicesconsumed in each region
Detailed CPI price data are adjusted to obtain average pricelevels for BLS-defined areas These are allocated to countiesin combination with direct price and expenditure data on rentsfrom the ACS
County data are then aggregated to states and metropolitanareas
Personal income at RPPs is current-dollar personal incomedivided by the price parity for a given year and region Abalancing factor is applied so that the sum of personal incomeat RPPs across regions equals the current dollar sum
Real personal income is personal income at RPPs divided bythe national PCE chain-type price index The result is realpersonal income in chained dollars (using 2009 as the referenceyear) Using Alaska in 2016 as an example
(newsreleasesregionalrpp2018_imagesrpp0518_formula_01png)
Estimates of real personal income in the United States arederived as the sum of the regional estimates divided by theUS PCE Price Index
Implicit Regional Price Deflator (IRPD) is the product of theRPP times the national PCE price index It is equal to personalincome divided by real personal income See also the TechnicalNote
List of News Release Tables
Table 1 Real Personal Income and Implicit Regional PriceDeflators by State 2015-2016
5
6
61418 2)24 PMBEA News Release Real Personal Income for States and Metropolitan Areas 2016
Page 7 of 8httpswwwbeagovnewsreleasesregionalrpprpp_newsreleasehtm
Contact All of Us(contactssearchhtm)
Frequently AskedQuestions(faqindexcfm)
About BEA
News
US Economy ata Glance(newsreleasesglancehtm)
Current Releases(newsreleasesrelshtm)
News Release
InformationFor
Media(newsroomindexhtm)
CongressionalUsers(congressionalindexhtm)
Factsheets
Regional PI ampGDP(regionalbearfacts)
Intl Trade ampInvestment(internationalfactsheet)
Publications
Survey ofCurrent Business(scbindexhtm)
Papers by Topic(researchby_topichtm)
Resources
Interactive Data(itableindexcfm)
Research at BEA(researchindexhtm)
Developers(developers)
Table 2 Real Per Capita Personal Income by State 2015-2016
Table 3 Regional Price Parities by State 2016
Table 4 Real Personal Income and Implicit Regional PriceDeflators by Metropolitan Area 2015-2016
Table 5 Real Per Capita Personal Income by Metropolitan Area2015-2016
Table 6 Regional Price Parities by Metropolitan Area 2016
The BEA Regional Price Parity statistics are based in part onrestricted access Consumer Price Index data from the Bureauof Labor Statistics (BLS) The BEA statistics presented hereinare products of BEA and not BLS
To estimate RPPs CPI price quotes are quality adjusted andpooled over 5 years The ACS rents are also quality adjustedand are either annual for states or pooled over 3 years formetropolitan areas The expenditure weights are specific foreach year
The multilateral system that is used is the Geary additivemethod Any region or combination of regions may be used asthe base or reference region without loss of consistency
The growth rate of the implicit regional price deflators willnot necessarily equal the region or metro area price deflatorspublished by the BLS This is because the CPI deflators arecalculated directly while the IRPDs are indirect estimates andbecause of differences in the source data and methodology
The CPI represents about 93 percent of the total USpopulation including almost all residents of urban ormetropolitan areas In the Northeast region rural area prices(exclusive of rents) are assumed to be the same as those in thesmall metropolitan areas of the CPI in the Midwest South andWest regions they are assumed to be the same as those in thenonmetropolitan urban areas of the CPI
RPP should first be divided by 100
1
2
3
4
5
6
61418 2)24 PMBEA News Release Real Personal Income for States and Metropolitan Areas 2016
Page 8 of 8httpswwwbeagovnewsreleasesregionalrpprpp_newsreleasehtm
(aboutindexhtm)
Policies(aboutpolicieshtm)Privacy Policy(aboutPrivacy_Statementhtm)
FOIA(httpwwwosecdocgovomoFOIAFOIAWebsitehtm)
Accessibility(aboutaccessibilityhtm)
Commitment to ScientificIntegrity(_pdfscientific_integrity_statement_of_the_principal_statistical_agenciespdf)
Information Quality Guidelines(aboutinfoqualhtm)
Data Dissemination Practices(aboutBEAdisseminationhtm)
Open Data (datahtm)
ESR System (statusindexcfm)
USAgov (wwwusagov)
US Department of Commerce(wwwcommercegov)
Archive(newsreleasesrelease_archivehtm)
eFile Users(efile)
BE-13Respondents(surveysrespondent_be13htm)
Private FundReporters(surveysprivatefunds)
Job Seekers(jobsindexhtm)
Industry GDP(industryfactsheet)
Multimedia(videoindexhtm)
FAQs(faqindexcfm)
More
Directors Page(aboutdirectorhtm)
Conferences(agencyexhibit_schedulehtm)
Guidelines forCiting BEAInformation(aboutBEAcitinghtm)
61418 2)24 PMrpp0518_chart_01png 2204times2389 pixels
Page 1 of 1httpswwwbeagovnewsreleasesregionalrpp2018_imagesrpp0518_chart_01png
Purchasing Power
The attached spreadsheets are designed to accurately calculate federal income tax state income tax and FICA tax (Social Security and Medicare tax) on an individualrsquos annual wagesalary Taxes are computed assuming a single filer standard deduction and no additional dependents The accounting firm Eide Bailly prepares the calculations and they should be accurate within $5 annually Once we know how much in taxes are due we can determine after tax wages (gross salary less taxes) This is how much money a worker has left over once the government has taken out the correct amount of payroll taxes We also know that different areasregions have different costs of living For example New York City has a much higher cost of living than Sioux Falls To determine the cost of living in any given city or state the US Bureau of Economic Analysis (BEA) compares millions of price points on goods and services across the nation and produces Regional Price Parities (RPP) The national average of all costs is 100 A state or city with lower average costs will have an RPP of less than 100 (SDrsquoS is 883) and a city or state with a higher cost of living will have an RPP over 100 (for example Hawaiirsquos RPP is 1184) So to determine purchasing power we divide after tax wages by a given city or statersquos RPP This is the only way to have a meaningful comparison of wages in different cities and states The true measure of how well yoursquore paid is not your gross pay rather it is how much you can buy with your wages after the government has taken its share Note The BEA will release the 2017 RPPs in May of 2019
Rank State
Average Teacher Salary
(NEA 2017) Total Federal and State
Adjustments to Pay Take Home Pay RPP Cost of Living Index (BEA 2016)
After Tax Wages Adjusted for Cost
of Living (RPP) 1 Massachusetts 78100 20118 57982 1078 53787 2 Pennsylvania 66265 14983 51282 0984 52116 3 Alaska 68138 13500 54638 1054 51839 4 New York 81902 22018 59884 1156 51803 5 Ohio 58202 11987 46215 0893 51753 6 Rhode Island 66477 15043 51434 0996 51641 7 Michigan 62287 14242 48045 0933 51495 8 California 79128 20967 58161 1144 50840 9 Connecticut 73147 18526 54621 1087 50249
10 Illinois 64933 15284 49649 0989 50201 11 Wyoming 58187 10550 47637 0967 49263 12 Nevada 57376 10311 47065 0974 48321 13 District of Columbia 75692 19942 55750 1159 48102 14 Iowa 55647 12431 43216 0902 47911 15 Indiana 54308 11127 43181 0903 47820 16 North Dakota 52968 9485 43483 0915 47522 17 Maryland 68357 16518 51839 1095 47341 18 New Jersey 69623 16243 53380 1132 47156 19 Georgia 55532 12605 42927 0921 46609 20 Kentucky 52338 11513 40825 0878 46498 21 Tennessee 50099 8211 41889 0902 46440 22 Alabama 50391 10261 40130 0866 46340 23 Delaware 60214 13819 46395 1002 46302 24 Oregon 61862 15991 45871 0998 45963 25 Wisconsin 54998 12348 42650 0928 45959 26 Nebraska 52338 10973 41365 0905 45708 27 Minnesota 57346 13063 44283 0975 45418 28 Texas 52575 8888 43687 0969 45085 29 Louisiana 50000 9683 40318 0904 44599 30 South Dakota 46979 7601 393785 0883 44596 31 New Hampshire 57522 10355 47167 1059 44539 32 Vermont 57349 12149 45200 1016 44488 33 Arkansas 48304 9847 38458 0869 44255 34 South Carolina 50000 10360 39641 0903 43899 35 Missouri 48618 9353 39265 0895 43871 36 Kansas 49422 9988 39434 0905 43573 37 North Carolina 49970 10456 39514 0909 43470 38 Montana 51422 11058 40364 0941 42894 39 Washington 54433 9437 44996 1055 42650 40 West Virginia 45555 9112 36443 0876 41602 41 Maine 51077 10908 40169 0984 40822
42 Oklahoma 45292 8979 36313 0890 40802 43 New Mexico 47122 9071 38051 0936 40653 44 Idaho 47504 9990 37514 0930 40338 45 Arizona 47403 8879 38524 0959 40171 46 Colorado 51808 10509 41299 1030 40096 47 Mississippi 42925 8385 34540 0864 39977 48 Florida 47267 7659 39609 0997 39728 49 Virginia 51049 10882 40167 1023 39264 50 Utah 47244 9543 37701 0973 38747 51 Hawaii 56651 13752 42899 1184 36232
Source SD Governors Office of Economic Development based on 2018 federal tax data and 2017 state tax data
Education Commission of the States
South Dakota Blue Ribbon Task Force on School Funding
Pierre South DakotaJuly 2015
Michael GriffithSchool Finance ConsultantEducation Commission of the States
Education Commission of the States
Education Commission of the States
Created by states for states in 1965 to track state policy trends translate academic research provide unbiased advice and create opportunities for state leaders to learn from one another
53 member states territories and the District of Columbia
Contact wwwecsorg (303) 2993600
2
Education Commission of the States
Per Pupil Expenditures 2006-07 to 2016-17
3
$0
$2000
$4000
$6000
$8000
$10000
$12000
2003-04 2004-05 2005-06 2006-07 2007-08 2008-09 2009-10 2010-11 2011-12 2012-13 2013-14 2014-15 2015-16 2016-17
National Average South Dakota
Source NEA Rankings amp Estimates
Education Commission of the States
Average Per Pupil Expenditures in Bordering States
4
$6500
$7500
$8500
$9500
$10500
$11500
$12500
$13500
Iowa
Minnesota
Montana
Nebraska
North Dakota
South Dakota
Source NEA Rankings amp Estimates
Education Commission of the States
Average Teacher Salaries in Bordering States
5
$35000
$40000
$45000
$50000
$55000
$60000
2006-07 2007-08 2008-09 2009-10 2010-11 2011-12 2012-13 2013-14 2014-15 2015-16
Iowa
Minnesota
Montana
Nebraska
North Dakota
South Dakota
Source NEA Rankings amp Estimates
Education Commission of the States
Teacher Salaries amp Average Per Pupil Expenditures FY 2015-16
6
$6000
$8000
$10000
$12000
$14000
$16000
$18000
$20000
$22000
$40000 $45000 $50000 $55000 $60000 $65000 $70000 $75000 $80000
South Dakota
National Average
Per P
upil
Expe
nditu
res
Teacher Salaries
Education Commission of the States
For More Information
7
Michael GriffithEducation Commission of the States
700 Broadway Suite 810Denver Colorado 80203
(303) 299-3600wwwecsorg
mgriffithecsorg
- Teacher Compensation Review Board Minutes 082918 (002)
- Ingersoll PowerPntSD Talk 62018
-
- Slide Number 1
- The Source of Data
- Schools with Serious Teacher Shortages(Percent Public Secondary Schools with Teaching Vacancies and with Serious Difficulties Filling those Vacancies by Field 2015-16)
- The Surprising Sources of Teacher Supply (Percent of Newly Hired Teachers in the Public School System by Supply Source 2015-16)
- Attrition in Teaching is Higher Than in Many OccupationsProfessions(Among 1993 College Grads Who Entered Selected Occupations by 1997 Percent Gone From Occupation by 2003)
- Slide Number 6
- Beginning Teachers Leave Teaching at Highest Rates (Cumulative Percent Teacher Attrition by Years of Experience 1993-2003
- Job Dissatisfaction a Leading Factor Behind Teacher Turnover (Percent Public School Teachers Reporting that Various Reasons Were Important for their Turnover 2012-13)
- Teachersrsquo Working Conditions are Important for Turnover(Of Those Public School Teachers Who Moved From or Left Their School Because of Dissatisfaction Percent Reporting Particular Sources of Dissatisfaction 2012-13)
- Teacher Recruitment Alone Does Not Work
- Slide Number 11
- Research Shows Positive Effects of Induction amp Support Program for Beginning Teachers
- For Further Information Copies of Articles Reports etc
-
- SD DOE Blue Ribbon Update Final
-
- Trends in Educator Preparation and Employment in South Dakota
- Setting the Stage Purpose amp Source Data
- Slide Number 3
- Slide Number 4
- South Dakota Distribution of Teachers by Grade Span Type 2016-17
- South Dakota Overview of the field2016-17 Year
- South Dakota District normsTeacher average years experience
- Slide Number 8
- South Dakota Age distribution of teachers 2016-17
- South Dakota District normsTeacher average startingbase salary
- South Dakota District normsTeacher average salary (not total compensation)
- South Dakota District normsAdministrator average salary (not total compensation)
- 2017-18 Headcount by Assignment Area
- South Dakota Key pieces of pipeline data
- 5 Year Projections Teacher Need
- Need to meet student growth
- South Dakota District NormsAverage Student to Teacher Ratio
- South Dakota K-12 student enrollments including 5 year projections
- South Dakota Teacher need to meet anticipated student growth
- Slide Number 20
- South Dakota Administrator teacher and education specialist retirements2011-2016
- South Dakota One Five and ten-year retirementseligible versus estimated
- Slide Number 23
- South Dakota Reasons that K-12 teachers do not return to their position (Headcount)
- South Dakota Reasons teachers do not return to prior position (201718 School Year)
- South Dakota Estimated number of teachers leaving the field
- Slide Number 27
- South Dakota 5-year projected teacher need
- Slide Number 29
- South Dakota Total FTE of Certified Teachers and Total Number of New Certificates last 5 years
- Slide Number 31
- South Dakota Teacher preparation graduates2002-03 to 2016-17
- BOR Teacher Graduate PlacementsFY 2002-2016
- South Dakota Trajectories for new teacher graduates next 5 years
- Slide Number 35
- South Dakota Teachers from out-of-state 2010-2014
- Slide Number 37
- South Dakota Alternative certificates
- Slide Number 39
- South Dakota Five-year teacher pipeline projections
- Slide Number 41
- South Dakota Pipeline Overview
- Slide Number 43
- 2018 Preliminary Plans of Intent
- South Dakota Unfilled Vacancies First Day of School 2017-18
- South Dakota High School vacancies by FTE first day of school 2014-2015
- Slide Number 47
- South Dakota Hard to fill positions Plans of Intent 2017-18
- South Dakota Plan of Intent Trends
- South Dakota Hard to fill position resolution of Unfilled Vacancies 2014-15 (October 15)
- Slide Number 51
- South Dakota Flexible Learning OptionsSouth Dakota Virtual School Courses
- South Dakota Flexible Learning OptionsSouth Dakota Virtual School Courses
- South Dakota Flexible Learning OptionsSouth Dakota Virtual School Courses
- South Dakota Flexible Learning OptionsDual Credit Courses
- South Dakota Flexible Learning OptionsDual Credit Courses by Institution
- Slide Number 57
-
- NEA teacher salary ranking
- NEA teacher salary ranking with regional price parities
- BEA 2016 real person income for states and metro areas (1)
- BEA 2016 regional price parities by state
- Purchasing Power
- Teacher Wage Calculator Short
- ECS Spending and Salary Data June 2018
-
- Slide Number 1
- Education Commission of the States
- Per Pupil Expenditures 2006-07 to 2016-17
- Average Per Pupil Expenditures in Bordering States
- Average Teacher Salaries in Bordering States
- Teacher Salaries amp Average Per Pupil Expenditures FY 2015-16
- For More Information
-

61418 2)24 PMBEA News Release Real Personal Income for States and Metropolitan Areas 2016
Page 8 of 8httpswwwbeagovnewsreleasesregionalrpprpp_newsreleasehtm
(aboutindexhtm)
Policies(aboutpolicieshtm)Privacy Policy(aboutPrivacy_Statementhtm)
FOIA(httpwwwosecdocgovomoFOIAFOIAWebsitehtm)
Accessibility(aboutaccessibilityhtm)
Commitment to ScientificIntegrity(_pdfscientific_integrity_statement_of_the_principal_statistical_agenciespdf)
Information Quality Guidelines(aboutinfoqualhtm)
Data Dissemination Practices(aboutBEAdisseminationhtm)
Open Data (datahtm)
ESR System (statusindexcfm)
USAgov (wwwusagov)
US Department of Commerce(wwwcommercegov)
Archive(newsreleasesrelease_archivehtm)
eFile Users(efile)
BE-13Respondents(surveysrespondent_be13htm)
Private FundReporters(surveysprivatefunds)
Job Seekers(jobsindexhtm)
Industry GDP(industryfactsheet)
Multimedia(videoindexhtm)
FAQs(faqindexcfm)
More
Directors Page(aboutdirectorhtm)
Conferences(agencyexhibit_schedulehtm)
Guidelines forCiting BEAInformation(aboutBEAcitinghtm)
61418 2)24 PMrpp0518_chart_01png 2204times2389 pixels
Page 1 of 1httpswwwbeagovnewsreleasesregionalrpp2018_imagesrpp0518_chart_01png
Purchasing Power
The attached spreadsheets are designed to accurately calculate federal income tax state income tax and FICA tax (Social Security and Medicare tax) on an individualrsquos annual wagesalary Taxes are computed assuming a single filer standard deduction and no additional dependents The accounting firm Eide Bailly prepares the calculations and they should be accurate within $5 annually Once we know how much in taxes are due we can determine after tax wages (gross salary less taxes) This is how much money a worker has left over once the government has taken out the correct amount of payroll taxes We also know that different areasregions have different costs of living For example New York City has a much higher cost of living than Sioux Falls To determine the cost of living in any given city or state the US Bureau of Economic Analysis (BEA) compares millions of price points on goods and services across the nation and produces Regional Price Parities (RPP) The national average of all costs is 100 A state or city with lower average costs will have an RPP of less than 100 (SDrsquoS is 883) and a city or state with a higher cost of living will have an RPP over 100 (for example Hawaiirsquos RPP is 1184) So to determine purchasing power we divide after tax wages by a given city or statersquos RPP This is the only way to have a meaningful comparison of wages in different cities and states The true measure of how well yoursquore paid is not your gross pay rather it is how much you can buy with your wages after the government has taken its share Note The BEA will release the 2017 RPPs in May of 2019
Rank State
Average Teacher Salary
(NEA 2017) Total Federal and State
Adjustments to Pay Take Home Pay RPP Cost of Living Index (BEA 2016)
After Tax Wages Adjusted for Cost
of Living (RPP) 1 Massachusetts 78100 20118 57982 1078 53787 2 Pennsylvania 66265 14983 51282 0984 52116 3 Alaska 68138 13500 54638 1054 51839 4 New York 81902 22018 59884 1156 51803 5 Ohio 58202 11987 46215 0893 51753 6 Rhode Island 66477 15043 51434 0996 51641 7 Michigan 62287 14242 48045 0933 51495 8 California 79128 20967 58161 1144 50840 9 Connecticut 73147 18526 54621 1087 50249
10 Illinois 64933 15284 49649 0989 50201 11 Wyoming 58187 10550 47637 0967 49263 12 Nevada 57376 10311 47065 0974 48321 13 District of Columbia 75692 19942 55750 1159 48102 14 Iowa 55647 12431 43216 0902 47911 15 Indiana 54308 11127 43181 0903 47820 16 North Dakota 52968 9485 43483 0915 47522 17 Maryland 68357 16518 51839 1095 47341 18 New Jersey 69623 16243 53380 1132 47156 19 Georgia 55532 12605 42927 0921 46609 20 Kentucky 52338 11513 40825 0878 46498 21 Tennessee 50099 8211 41889 0902 46440 22 Alabama 50391 10261 40130 0866 46340 23 Delaware 60214 13819 46395 1002 46302 24 Oregon 61862 15991 45871 0998 45963 25 Wisconsin 54998 12348 42650 0928 45959 26 Nebraska 52338 10973 41365 0905 45708 27 Minnesota 57346 13063 44283 0975 45418 28 Texas 52575 8888 43687 0969 45085 29 Louisiana 50000 9683 40318 0904 44599 30 South Dakota 46979 7601 393785 0883 44596 31 New Hampshire 57522 10355 47167 1059 44539 32 Vermont 57349 12149 45200 1016 44488 33 Arkansas 48304 9847 38458 0869 44255 34 South Carolina 50000 10360 39641 0903 43899 35 Missouri 48618 9353 39265 0895 43871 36 Kansas 49422 9988 39434 0905 43573 37 North Carolina 49970 10456 39514 0909 43470 38 Montana 51422 11058 40364 0941 42894 39 Washington 54433 9437 44996 1055 42650 40 West Virginia 45555 9112 36443 0876 41602 41 Maine 51077 10908 40169 0984 40822
42 Oklahoma 45292 8979 36313 0890 40802 43 New Mexico 47122 9071 38051 0936 40653 44 Idaho 47504 9990 37514 0930 40338 45 Arizona 47403 8879 38524 0959 40171 46 Colorado 51808 10509 41299 1030 40096 47 Mississippi 42925 8385 34540 0864 39977 48 Florida 47267 7659 39609 0997 39728 49 Virginia 51049 10882 40167 1023 39264 50 Utah 47244 9543 37701 0973 38747 51 Hawaii 56651 13752 42899 1184 36232
Source SD Governors Office of Economic Development based on 2018 federal tax data and 2017 state tax data
Education Commission of the States
South Dakota Blue Ribbon Task Force on School Funding
Pierre South DakotaJuly 2015
Michael GriffithSchool Finance ConsultantEducation Commission of the States
Education Commission of the States
Education Commission of the States
Created by states for states in 1965 to track state policy trends translate academic research provide unbiased advice and create opportunities for state leaders to learn from one another
53 member states territories and the District of Columbia
Contact wwwecsorg (303) 2993600
2
Education Commission of the States
Per Pupil Expenditures 2006-07 to 2016-17
3
$0
$2000
$4000
$6000
$8000
$10000
$12000
2003-04 2004-05 2005-06 2006-07 2007-08 2008-09 2009-10 2010-11 2011-12 2012-13 2013-14 2014-15 2015-16 2016-17
National Average South Dakota
Source NEA Rankings amp Estimates
Education Commission of the States
Average Per Pupil Expenditures in Bordering States
4
$6500
$7500
$8500
$9500
$10500
$11500
$12500
$13500
Iowa
Minnesota
Montana
Nebraska
North Dakota
South Dakota
Source NEA Rankings amp Estimates
Education Commission of the States
Average Teacher Salaries in Bordering States
5
$35000
$40000
$45000
$50000
$55000
$60000
2006-07 2007-08 2008-09 2009-10 2010-11 2011-12 2012-13 2013-14 2014-15 2015-16
Iowa
Minnesota
Montana
Nebraska
North Dakota
South Dakota
Source NEA Rankings amp Estimates
Education Commission of the States
Teacher Salaries amp Average Per Pupil Expenditures FY 2015-16
6
$6000
$8000
$10000
$12000
$14000
$16000
$18000
$20000
$22000
$40000 $45000 $50000 $55000 $60000 $65000 $70000 $75000 $80000
South Dakota
National Average
Per P
upil
Expe
nditu
res
Teacher Salaries
Education Commission of the States
For More Information
7
Michael GriffithEducation Commission of the States
700 Broadway Suite 810Denver Colorado 80203
(303) 299-3600wwwecsorg
mgriffithecsorg
- Teacher Compensation Review Board Minutes 082918 (002)
- Ingersoll PowerPntSD Talk 62018
-
- Slide Number 1
- The Source of Data
- Schools with Serious Teacher Shortages(Percent Public Secondary Schools with Teaching Vacancies and with Serious Difficulties Filling those Vacancies by Field 2015-16)
- The Surprising Sources of Teacher Supply (Percent of Newly Hired Teachers in the Public School System by Supply Source 2015-16)
- Attrition in Teaching is Higher Than in Many OccupationsProfessions(Among 1993 College Grads Who Entered Selected Occupations by 1997 Percent Gone From Occupation by 2003)
- Slide Number 6
- Beginning Teachers Leave Teaching at Highest Rates (Cumulative Percent Teacher Attrition by Years of Experience 1993-2003
- Job Dissatisfaction a Leading Factor Behind Teacher Turnover (Percent Public School Teachers Reporting that Various Reasons Were Important for their Turnover 2012-13)
- Teachersrsquo Working Conditions are Important for Turnover(Of Those Public School Teachers Who Moved From or Left Their School Because of Dissatisfaction Percent Reporting Particular Sources of Dissatisfaction 2012-13)
- Teacher Recruitment Alone Does Not Work
- Slide Number 11
- Research Shows Positive Effects of Induction amp Support Program for Beginning Teachers
- For Further Information Copies of Articles Reports etc
-
- SD DOE Blue Ribbon Update Final
-
- Trends in Educator Preparation and Employment in South Dakota
- Setting the Stage Purpose amp Source Data
- Slide Number 3
- Slide Number 4
- South Dakota Distribution of Teachers by Grade Span Type 2016-17
- South Dakota Overview of the field2016-17 Year
- South Dakota District normsTeacher average years experience
- Slide Number 8
- South Dakota Age distribution of teachers 2016-17
- South Dakota District normsTeacher average startingbase salary
- South Dakota District normsTeacher average salary (not total compensation)
- South Dakota District normsAdministrator average salary (not total compensation)
- 2017-18 Headcount by Assignment Area
- South Dakota Key pieces of pipeline data
- 5 Year Projections Teacher Need
- Need to meet student growth
- South Dakota District NormsAverage Student to Teacher Ratio
- South Dakota K-12 student enrollments including 5 year projections
- South Dakota Teacher need to meet anticipated student growth
- Slide Number 20
- South Dakota Administrator teacher and education specialist retirements2011-2016
- South Dakota One Five and ten-year retirementseligible versus estimated
- Slide Number 23
- South Dakota Reasons that K-12 teachers do not return to their position (Headcount)
- South Dakota Reasons teachers do not return to prior position (201718 School Year)
- South Dakota Estimated number of teachers leaving the field
- Slide Number 27
- South Dakota 5-year projected teacher need
- Slide Number 29
- South Dakota Total FTE of Certified Teachers and Total Number of New Certificates last 5 years
- Slide Number 31
- South Dakota Teacher preparation graduates2002-03 to 2016-17
- BOR Teacher Graduate PlacementsFY 2002-2016
- South Dakota Trajectories for new teacher graduates next 5 years
- Slide Number 35
- South Dakota Teachers from out-of-state 2010-2014
- Slide Number 37
- South Dakota Alternative certificates
- Slide Number 39
- South Dakota Five-year teacher pipeline projections
- Slide Number 41
- South Dakota Pipeline Overview
- Slide Number 43
- 2018 Preliminary Plans of Intent
- South Dakota Unfilled Vacancies First Day of School 2017-18
- South Dakota High School vacancies by FTE first day of school 2014-2015
- Slide Number 47
- South Dakota Hard to fill positions Plans of Intent 2017-18
- South Dakota Plan of Intent Trends
- South Dakota Hard to fill position resolution of Unfilled Vacancies 2014-15 (October 15)
- Slide Number 51
- South Dakota Flexible Learning OptionsSouth Dakota Virtual School Courses
- South Dakota Flexible Learning OptionsSouth Dakota Virtual School Courses
- South Dakota Flexible Learning OptionsSouth Dakota Virtual School Courses
- South Dakota Flexible Learning OptionsDual Credit Courses
- South Dakota Flexible Learning OptionsDual Credit Courses by Institution
- Slide Number 57
-
- NEA teacher salary ranking
- NEA teacher salary ranking with regional price parities
- BEA 2016 real person income for states and metro areas (1)
- BEA 2016 regional price parities by state
- Purchasing Power
- Teacher Wage Calculator Short
- ECS Spending and Salary Data June 2018
-
- Slide Number 1
- Education Commission of the States
- Per Pupil Expenditures 2006-07 to 2016-17
- Average Per Pupil Expenditures in Bordering States
- Average Teacher Salaries in Bordering States
- Teacher Salaries amp Average Per Pupil Expenditures FY 2015-16
- For More Information
-

Education Commission of the States
Education Commission of the States
Created by states for states in 1965 to track state policy trends translate academic research provide unbiased advice and create opportunities for state leaders to learn from one another
53 member states territories and the District of Columbia
Contact wwwecsorg (303) 2993600
2
Education Commission of the States
Per Pupil Expenditures 2006-07 to 2016-17
3
$0
$2000
$4000
$6000
$8000
$10000
$12000
2003-04 2004-05 2005-06 2006-07 2007-08 2008-09 2009-10 2010-11 2011-12 2012-13 2013-14 2014-15 2015-16 2016-17
National Average South Dakota
Source NEA Rankings amp Estimates
Education Commission of the States
Average Per Pupil Expenditures in Bordering States
4
$6500
$7500
$8500
$9500
$10500
$11500
$12500
$13500
Iowa
Minnesota
Montana
Nebraska
North Dakota
South Dakota
Source NEA Rankings amp Estimates
Education Commission of the States
Average Teacher Salaries in Bordering States
5
$35000
$40000
$45000
$50000
$55000
$60000
2006-07 2007-08 2008-09 2009-10 2010-11 2011-12 2012-13 2013-14 2014-15 2015-16
Iowa
Minnesota
Montana
Nebraska
North Dakota
South Dakota
Source NEA Rankings amp Estimates
Education Commission of the States
Teacher Salaries amp Average Per Pupil Expenditures FY 2015-16
6
$6000
$8000
$10000
$12000
$14000
$16000
$18000
$20000
$22000
$40000 $45000 $50000 $55000 $60000 $65000 $70000 $75000 $80000
South Dakota
National Average
Per P
upil
Expe
nditu
res
Teacher Salaries
Education Commission of the States
For More Information
7
Michael GriffithEducation Commission of the States
700 Broadway Suite 810Denver Colorado 80203
(303) 299-3600wwwecsorg
mgriffithecsorg
- Teacher Compensation Review Board Minutes 082918 (002)
- Ingersoll PowerPntSD Talk 62018
-
- Slide Number 1
- The Source of Data
- Schools with Serious Teacher Shortages(Percent Public Secondary Schools with Teaching Vacancies and with Serious Difficulties Filling those Vacancies by Field 2015-16)
- The Surprising Sources of Teacher Supply (Percent of Newly Hired Teachers in the Public School System by Supply Source 2015-16)
- Attrition in Teaching is Higher Than in Many OccupationsProfessions(Among 1993 College Grads Who Entered Selected Occupations by 1997 Percent Gone From Occupation by 2003)
- Slide Number 6
- Beginning Teachers Leave Teaching at Highest Rates (Cumulative Percent Teacher Attrition by Years of Experience 1993-2003
- Job Dissatisfaction a Leading Factor Behind Teacher Turnover (Percent Public School Teachers Reporting that Various Reasons Were Important for their Turnover 2012-13)
- Teachersrsquo Working Conditions are Important for Turnover(Of Those Public School Teachers Who Moved From or Left Their School Because of Dissatisfaction Percent Reporting Particular Sources of Dissatisfaction 2012-13)
- Teacher Recruitment Alone Does Not Work
- Slide Number 11
- Research Shows Positive Effects of Induction amp Support Program for Beginning Teachers
- For Further Information Copies of Articles Reports etc
-
- SD DOE Blue Ribbon Update Final
-
- Trends in Educator Preparation and Employment in South Dakota
- Setting the Stage Purpose amp Source Data
- Slide Number 3
- Slide Number 4
- South Dakota Distribution of Teachers by Grade Span Type 2016-17
- South Dakota Overview of the field2016-17 Year
- South Dakota District normsTeacher average years experience
- Slide Number 8
- South Dakota Age distribution of teachers 2016-17
- South Dakota District normsTeacher average startingbase salary
- South Dakota District normsTeacher average salary (not total compensation)
- South Dakota District normsAdministrator average salary (not total compensation)
- 2017-18 Headcount by Assignment Area
- South Dakota Key pieces of pipeline data
- 5 Year Projections Teacher Need
- Need to meet student growth
- South Dakota District NormsAverage Student to Teacher Ratio
- South Dakota K-12 student enrollments including 5 year projections
- South Dakota Teacher need to meet anticipated student growth
- Slide Number 20
- South Dakota Administrator teacher and education specialist retirements2011-2016
- South Dakota One Five and ten-year retirementseligible versus estimated
- Slide Number 23
- South Dakota Reasons that K-12 teachers do not return to their position (Headcount)
- South Dakota Reasons teachers do not return to prior position (201718 School Year)
- South Dakota Estimated number of teachers leaving the field
- Slide Number 27
- South Dakota 5-year projected teacher need
- Slide Number 29
- South Dakota Total FTE of Certified Teachers and Total Number of New Certificates last 5 years
- Slide Number 31
- South Dakota Teacher preparation graduates2002-03 to 2016-17
- BOR Teacher Graduate PlacementsFY 2002-2016
- South Dakota Trajectories for new teacher graduates next 5 years
- Slide Number 35
- South Dakota Teachers from out-of-state 2010-2014
- Slide Number 37
- South Dakota Alternative certificates
- Slide Number 39
- South Dakota Five-year teacher pipeline projections
- Slide Number 41
- South Dakota Pipeline Overview
- Slide Number 43
- 2018 Preliminary Plans of Intent
- South Dakota Unfilled Vacancies First Day of School 2017-18
- South Dakota High School vacancies by FTE first day of school 2014-2015
- Slide Number 47
- South Dakota Hard to fill positions Plans of Intent 2017-18
- South Dakota Plan of Intent Trends
- South Dakota Hard to fill position resolution of Unfilled Vacancies 2014-15 (October 15)
- Slide Number 51
- South Dakota Flexible Learning OptionsSouth Dakota Virtual School Courses
- South Dakota Flexible Learning OptionsSouth Dakota Virtual School Courses
- South Dakota Flexible Learning OptionsSouth Dakota Virtual School Courses
- South Dakota Flexible Learning OptionsDual Credit Courses
- South Dakota Flexible Learning OptionsDual Credit Courses by Institution
- Slide Number 57
-
- NEA teacher salary ranking
- NEA teacher salary ranking with regional price parities
- BEA 2016 real person income for states and metro areas (1)
- BEA 2016 regional price parities by state
- Purchasing Power
- Teacher Wage Calculator Short
- ECS Spending and Salary Data June 2018
-
- Slide Number 1
- Education Commission of the States
- Per Pupil Expenditures 2006-07 to 2016-17
- Average Per Pupil Expenditures in Bordering States
- Average Teacher Salaries in Bordering States
- Teacher Salaries amp Average Per Pupil Expenditures FY 2015-16
- For More Information
-

Education Commission of the States
For More Information
7
Michael GriffithEducation Commission of the States
700 Broadway Suite 810Denver Colorado 80203
(303) 299-3600wwwecsorg
mgriffithecsorg
- Teacher Compensation Review Board Minutes 082918 (002)
- Ingersoll PowerPntSD Talk 62018
-
- Slide Number 1
- The Source of Data
- Schools with Serious Teacher Shortages(Percent Public Secondary Schools with Teaching Vacancies and with Serious Difficulties Filling those Vacancies by Field 2015-16)
- The Surprising Sources of Teacher Supply (Percent of Newly Hired Teachers in the Public School System by Supply Source 2015-16)
- Attrition in Teaching is Higher Than in Many OccupationsProfessions(Among 1993 College Grads Who Entered Selected Occupations by 1997 Percent Gone From Occupation by 2003)
- Slide Number 6
- Beginning Teachers Leave Teaching at Highest Rates (Cumulative Percent Teacher Attrition by Years of Experience 1993-2003
- Job Dissatisfaction a Leading Factor Behind Teacher Turnover (Percent Public School Teachers Reporting that Various Reasons Were Important for their Turnover 2012-13)
- Teachersrsquo Working Conditions are Important for Turnover(Of Those Public School Teachers Who Moved From or Left Their School Because of Dissatisfaction Percent Reporting Particular Sources of Dissatisfaction 2012-13)
- Teacher Recruitment Alone Does Not Work
- Slide Number 11
- Research Shows Positive Effects of Induction amp Support Program for Beginning Teachers
- For Further Information Copies of Articles Reports etc
-
- SD DOE Blue Ribbon Update Final
-
- Trends in Educator Preparation and Employment in South Dakota
- Setting the Stage Purpose amp Source Data
- Slide Number 3
- Slide Number 4
- South Dakota Distribution of Teachers by Grade Span Type 2016-17
- South Dakota Overview of the field2016-17 Year
- South Dakota District normsTeacher average years experience
- Slide Number 8
- South Dakota Age distribution of teachers 2016-17
- South Dakota District normsTeacher average startingbase salary
- South Dakota District normsTeacher average salary (not total compensation)
- South Dakota District normsAdministrator average salary (not total compensation)
- 2017-18 Headcount by Assignment Area
- South Dakota Key pieces of pipeline data
- 5 Year Projections Teacher Need
- Need to meet student growth
- South Dakota District NormsAverage Student to Teacher Ratio
- South Dakota K-12 student enrollments including 5 year projections
- South Dakota Teacher need to meet anticipated student growth
- Slide Number 20
- South Dakota Administrator teacher and education specialist retirements2011-2016
- South Dakota One Five and ten-year retirementseligible versus estimated
- Slide Number 23
- South Dakota Reasons that K-12 teachers do not return to their position (Headcount)
- South Dakota Reasons teachers do not return to prior position (201718 School Year)
- South Dakota Estimated number of teachers leaving the field
- Slide Number 27
- South Dakota 5-year projected teacher need
- Slide Number 29
- South Dakota Total FTE of Certified Teachers and Total Number of New Certificates last 5 years
- Slide Number 31
- South Dakota Teacher preparation graduates2002-03 to 2016-17
- BOR Teacher Graduate PlacementsFY 2002-2016
- South Dakota Trajectories for new teacher graduates next 5 years
- Slide Number 35
- South Dakota Teachers from out-of-state 2010-2014
- Slide Number 37
- South Dakota Alternative certificates
- Slide Number 39
- South Dakota Five-year teacher pipeline projections
- Slide Number 41
- South Dakota Pipeline Overview
- Slide Number 43
- 2018 Preliminary Plans of Intent
- South Dakota Unfilled Vacancies First Day of School 2017-18
- South Dakota High School vacancies by FTE first day of school 2014-2015
- Slide Number 47
- South Dakota Hard to fill positions Plans of Intent 2017-18
- South Dakota Plan of Intent Trends
- South Dakota Hard to fill position resolution of Unfilled Vacancies 2014-15 (October 15)
- Slide Number 51
- South Dakota Flexible Learning OptionsSouth Dakota Virtual School Courses
- South Dakota Flexible Learning OptionsSouth Dakota Virtual School Courses
- South Dakota Flexible Learning OptionsSouth Dakota Virtual School Courses
- South Dakota Flexible Learning OptionsDual Credit Courses
- South Dakota Flexible Learning OptionsDual Credit Courses by Institution
- Slide Number 57
-
- NEA teacher salary ranking
- NEA teacher salary ranking with regional price parities
- BEA 2016 real person income for states and metro areas (1)
- BEA 2016 regional price parities by state
- Purchasing Power
- Teacher Wage Calculator Short
- ECS Spending and Salary Data June 2018
-
- Slide Number 1
- Education Commission of the States
- Per Pupil Expenditures 2006-07 to 2016-17
- Average Per Pupil Expenditures in Bordering States
- Average Teacher Salaries in Bordering States
- Teacher Salaries amp Average Per Pupil Expenditures FY 2015-16
- For More Information
-