Raising teacher expectations, changing beliefs and enhancing student achievement

Old Dominion University Old Dominion University
ODU Digital Commons ODU Digital Commons
Educational Foundations & Leadership Theses & Dissertations Educational Foundations & Leadership
Winter 2013
Teacher Beliefs, Teacher Concerns, and School Leadership Teacher Beliefs, Teacher Concerns, and School Leadership
Support as Influences on School Readiness for Implementing a Support as Influences on School Readiness for Implementing a
Research-Based Reform Model Research-Based Reform Model
Elizabeth Hoag Carhart Old Dominion University
Follow this and additional works at: https://digitalcommons.odu.edu/efl_etds
Part of the Educational Assessment, Evaluation, and Research Commons, and the Educational
Leadership Commons
Recommended Citation Recommended Citation Carhart, Elizabeth H.. "Teacher Beliefs, Teacher Concerns, and School Leadership Support as Influences on School Readiness for Implementing a Research-Based Reform Model" (2013). Doctor of Philosophy (PhD), Dissertation, Educational Foundations & Leadership, Old Dominion University, DOI: 10.25777/vapx-rj32 https://digitalcommons.odu.edu/efl_etds/90
This Dissertation is brought to you for free and open access by the Educational Foundations & Leadership at ODU Digital Commons. It has been accepted for inclusion in Educational Foundations & Leadership Theses & Dissertations by an authorized administrator of ODU Digital Commons. For more information, please contact [email protected].
TEACHER BELIEFS, TEACHER CONCERNS, AND SCHOOL LEADERSHIP
SUPPORT AS INFLUENCES ON SCHOOL READINESS FOR IMPLEMENTING A
RESEARCH-BASED REFORM MODEL
by
Elizabeth Hoag Carhart B.A. May 1990, Bethel College
M.A. August 1998, The State University of Pennsylvania
A Dissertation Submitted to the Faculty of Old Dominion University in Partial Fulfillment of the
Requirements for the Degree of
DOCTOR OF PHILOSOPHY
EDUCATION
OLD DOMINION UNIVERSITY December 2013
Linda Bol (Director)
ojm A. Nunnery (Member)
Steve Myran (Member)

ABSTRACT
TEACHER BELIEFS, TEACHER CONCERNS, AND SCHOOL LEADERSHIP
SUPPORT AS INFLUENCES ON SCHOOL READINESS FOR IMPLEMENTING
A RESEARCH-BASED REFORM MODEL
Elizabeth Hoag Carhart Old Dominion University, 2013
Director: Linda Bol
Federal policy makers and school leaders increasingly recognize middle school
math as a turning point in students’ academic success. An i3 scale-up grant allowed grant
partners to conduct a large-scale implementation of PowerTeaching (PT), a research-
based reform to increase student math achievement. In a mixed-methods study during the
pilot phase of the project, eight schools’ readiness for reform was explored. Teacher
questionnaires; interviews with project managers, school leaders, and teachers; classroom
observations; and school evaluation forms were used to describe school characteristics
that affected variability in initial implementation of the PT model. A cluster analysis
demonstrated the relative importance of multiple factors in defining clusters of schools
with varying levels of implementation. Classroom observations of teachers’ instructional
practices and classroom structure as well as teacher beliefs about team learning were
found to be statistically significant. Fundamental to a reform’s successful
implementation are a stable network of strong players, and an ability by the school leader
to point the organization in one direction.

iv
For Michael
and for my girls,
Anna and Madeleine,
whose smiles
teach me joy.

V
ACKNOWLEDGEMENTS
I am grateful for all the encouragement, guidance, and support that I received throughout
my graduate studies. My advisor and chair of the committee, Dr. Linda Bol, has been a
mentor and friend. Her expertise and wealth of experience were invaluable and were
shared with patience and optimism. Without Dr. John Nunnery’s invitation to join his
team, as well as his financial and moral support, this dissertation would not have been
possible. I appreciate his willingness to help me and the opportunity to benefit from his
experience. I’d also like to thank Dr. Steve Myran whose listening and questioning
inspired me to continue to grow and push myself academically while keeping my feet on
the ground. His wisdom and valuable input were critical throughout my years in the
program and offered sanctuary from the whirlwind that graduate study can become.
Thanks are also due to Paul Miller, Michelle Hartz, Erin Toomey, and others at the
Success for All Foundation, for their cooperation and time spent sharing their many years
of expertise. The researchers at The Center for Educational Partnerships were uplifting
and reassuring throughout the last three years. I greatly appreciate Dr. Joanna Gamer’s
guidance and mentorship in areas academic and not. Within my department, I am
indebted to Dr. Shana Pribesh and Dr. Jason Osbome for guidance in academic life far
beyond the research methods I learned from them. Dr. Karen Sanzo and Dr. Jay
Scribner’s encouragement to seek the Darden College Dissertation Fellowship as well as
Clark Seminar participation were heartening. I am indebted to Ms. Dawn Hall who knew
how to solve any problem I encountered.

I appreciate my family’s willingness to help throughout this project. Michael provided
unflagging support of all kinds and never doubted my pursuit of further education.
Anna’s ability to work on her own was a great encouragement and model for my own
writing and study. Madeleine’s encouragements were delivered with humor and
empathy. My sister’s wisdom and guidance were irreplaceable. I also thank my parents
for encouraging over four decades of my learning. They nurtured my curiosity and have
discussed educational issues at dinner with me for many years.
I’d also like to thank my global circle of friends who cheered me when I began down this
path, and continued even when I grew weary of it. Whether with laughter, kettlebells,
coffee, music, or botanical garden visits, I couldn’t have done this without you! And to
all my friends and family who have been neglected for far too long, I look forward to
spending more time together.
This work was supported as part of the Investing in Innovations program, Office of
Innovation and Improvement, United States Department of Education (USDOE), under
Award Number U411A110004. Any viewpoints or opinions expressed herein are those
of the authors, and do not necessarily represent the policy or position of the USDOE.

TABLE OF CONTENTS
Page
LIST O F T A B L E S ..................................................................................................................................................................................................... Ix
LIST O F F IG U R E S ..................................................................................................................................................................................................... X
C H A P T E R 1 : IN T R O D U C T IO N ...................................................................................................................................................................... 1
Ba c k g r o u n d ..........................................................................................................................................................................................................1
R es e a r c h O b je c t iv e ..........................................................................................................................................................................................7
R es e a r c h Ra t io n a l e ........................................................................................................................................................................................ 8
Lit e r a t u r e r e v i e w .........................................................................................................................................................................................1 0
T h e o r e t ic a l Fr a m e w o r k ...........................................................................................................................................................................2 4
D e s ig n O v e r v ie w ............................................................................................................................................................................................3 1
C H A P T E R 2 : M E T H O D ................................................................................................................................................................................... 3 4
Res e a r c h Q u e s t i o n s ....................................................................................................................................................................................3 4
D e s ig n .................................................................................................................................................................................................................... 3 5
Pa r t ic ip a n t s ...................................................................................................................................................................................................... 3 9
M e a s u r e s ............................................................................................................................................................................................................ 4 0
P r o c e d u r e ...........................................................................................................................................................................................................4 7
T r u s t w o r t h in e s s ............................................................................................................................................................................................4 8
P r o t e c t io n o f r ig h t s .................................................................................................................................................................................. 5 1
C H A P T E R 3 : R E S U L T S ...................................................................................................................................................................................... 5 2
R Q 1: P r o je c t M a n a g e r P e r c e p t io n s o f Va r ia t io n in P T Im p l e m e n t a t i o n .......................................................5 3
R Q 2 : S c h o o l Le a d e r P e r c e p t io n s o f Fa c t o r s Im p o r t a n t t o P T Im p l e m e n t a t io n ....................................... 6 1
viii
R Q 3 : T e a c h e r P e r c e p t io n s o f S c h o o l Le a d e r S u p p o r t a s Fa c t o r in P T Im p l e m e n t a t io n ......................7 0
R Q 4 : Relative im p o r t a n c e o f f a c t o r s in v a r ia t io n o f im p l e m e n t a t io n o f P o w e r T e a c h in g 7 7
S u m m a r y o f F i n d i n g s .................................................................................................................................................................................8 6
CHAPTER 4: DISCUSSION........................................................................................................................................88
P r o je c t M a n a g e r P e r c e p t io n s o f Va r ia t io n in PT Im p l e m e n t a t i o n ...................................................................... 9 0
S c h o o l Le a d e r P e r c e p t io n s o f Fa c t o r s Im p o r t a n t t o PT Im p l e m e n t a t i o n .......................................................9 1
T e a c h e r P e r c e p t io n s o f Sc h o o l Le a d e r s u p p o r t d u r in g PT Im p l e m e n t a t io n ...................................................9 4
Fa c t o r s in v a r ia t io n o f im p l e m e n t a t io n o f P o w e r T e a c h in g a c r o s s m e a s u r e s ..............................................9 5
Lim it a t io n s ......................................................................................................................................................................................................... 9 8
F o r f u t u r e r e s e a r c h .................................................................................................................................................................................1 0 1
C o n c l u s io n s ................................................................................................................................................................................................... 1 0 5
REFERENCES.............................................................................................................................................................. 108
APPENDICES.............................................................................................................................................................. 126
A p p e n d ix A : S p r in g T ea c h e r Q u e s t io n n a ir e ............................................................................................................................ 1 2 7
A p p e n d ix B: P r o je c t M a n a g e r In t e r v ie w P r o t o c o l ......................................................................................................... 1 3 1
A p p e n d ix C : S c h o o l Lea d e r In t e r v ie w P r o t o c o l ................................................................................................................. 1 3 3
A p p e n d ix D : T e a c h e r In t e r v ie w P r o t o c o l ............................................................................................................................... 1 3 5
APPENDIX E: SF A F SCHOOL SNAPSHOT..............................................................................................................................................1 3 7
A p p e n d ix F: O b s e r v a t io n P r o t o c o l ............................................................................................................................................... 1 3 9
A p p e n d ix G : O b s e r v a t io n c o d e s h e e t ............................................................................................................................................1 4 1
A p p e n d ix H : Co d e b o o k ...........................................................................................................................................................................1 4 2
VITA..............................................................................................................................................................................146
LIST OF TABLES
Table Page
1. Levels of Use in the Concems-Based Adoption Model...........................................15
2. Research questions and associated designs.............................................................. 38
3. Blueprint for project manager interview.................................................................. 43
4. Blueprint for school leader interview...................................................................... 44
5. Blueprint for quantifying of SFAF school snapshots............................................. 46
6. Blueprint for quantifying of TCEP school observations......................................... 47
7. Spring Teacher Questionnaire for PowerTeaching implementation...................... 49
8. Stability check and inter-rater reliability for interviews......................................... 50
9. School leadership support scale for spring teacher questionnaire: descriptive statistics...................................................................................................................... 72
10. Teacher questionnaire scales: Descriptive statistics................................................79
11. Teacher questionnaire scales aggregated at school level: descriptive statistics ....80
12. Document analysis scores: aggregated at school level........................................... 81
13. School ranking using various overall school level implementation measures 82
14. ANOVA post-hoc test comparing the relative significance of the factors on the creation of three clusters of schools..........................................................................85
X
LIST OF FIGURES
Figure Page
1. Model o f cooperative learning processes within team learning (Slavin, 1995).................. 4
2. The Cycle o f Effective Instruction..............................................................................................6
3. Factors influencing successful implementation o f PowerTeaching...................................... 9
4. The Stages o f Concern in the Concems-Based Adoption Model......................................... 14
5. Rogers ’ Diffusion of Innovation chart...................................................................................... 25
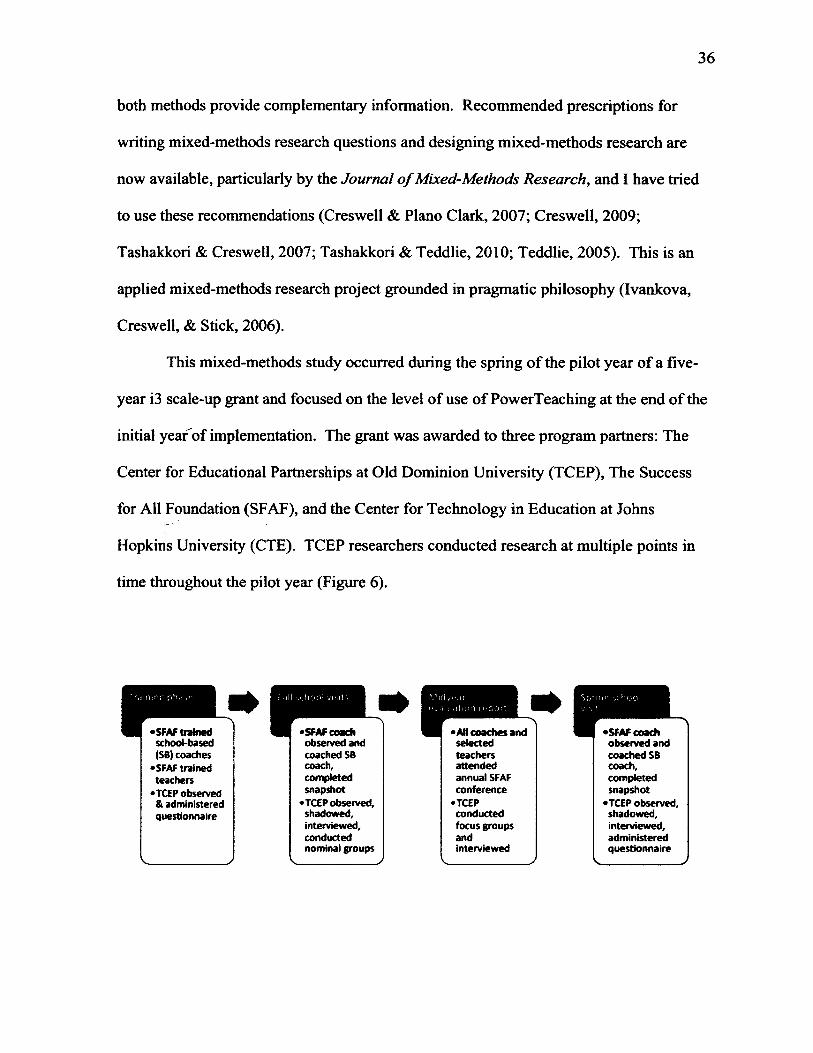
6. Phases of pilot year of TCEP research on PowerTeaching implementation......................36
7. Findings from multiple measures as sources o f information.................................................53
8. Dendrogram o f the cluster analysis o f schools........................................................................83
1
CHAPTER 1: INTRODUCTION
In 2011, only about one out of every three eighth graders across the United States
demonstrated proficiency in mathematics, according to the National Assessment for
Educational Progress (NAEP) assessment. Although this actually represents an
improvement in average scores compared to prior years, the large percentages of students
who are not “proficient” (65%) or who have not achieved even “basic” knowledge of
mathematics (27%) is unsettling (National Center for Education Statistics, 2011). To
make matters worse, math performance has been shown to be an important predictor of
future success whether in college or the workforce. Economically speaking, poor math
skills have significant societal consequences (Bynner & Parsons, 2001; Rivera-Batiz,
1992; Schoon et al., 2002). Strengthening middle-school students’ math skills would
result in a more prepared workforce and ultimately help the economy as a whole.
Background
Policymakers and school leaders both recognize middle school math as a turning point in
students’ academic success, particularly in predicting high school graduation rates. By
the time students reach high school, principals acknowledge that there is little they can do
to alter the students’ course trajectory. Earlier middle school math success leads to later
academic success and is an important contributing factor to future learning (House &
Telese, 2008; Rowan-Kenyon, Swan, & Creager, 2012). Organizations like the National
Center for Dropout Prevention, What Works Clearinghouse, and America’s Promise
2
Alliance unanimously recommend engaging students for success in middle school instead
of waiting until high school to improve math proficiency.
Low middle-school math performance has been problematic for more than a
decade (Beaton et al., 1996). Middle-school years are crucial in determining whether or
not students will graduate from high school, continue post-secondary education or trade
training, and otherwise become productive members of society (Cleary & Chen, 2009;
Ramdass & Zimmerman, 2008; Rowan-Kenyon et al., 2012; Slavin, Lake, & Groff,
2009). Eighth grade NAEP scores in 2011, although showing slight improvement over
2009, show the magnitude of the current problem - that one out of four students lacks
even basic math skills (National Center for Education Statistics, 2012). When students’
math skills and performance improve, the benefits are not only confined to better grades
in math. Affective, social, and self-regulatory skills are shown to progress alongside
middle school math improvements (Ramdass & Zimmerman, 2008; Rowan-Kenyon et
al., 2012; Slavin & Karweit, 1984; Slavin, Madden, & Leavey, 1984). The clear link
between these skills and math achievement is not unique to the U.S. school system
(Siegler et al., 2012). Researchers in other countries have recognized intermediate level
math as an indicator in their countries also (Chiu & Klassen, 2010; Eklof, 2007; House &
Telese, 2008; Perels, Dignath, & Schmitz, 2009).
It is not surprising, therefore, that when policymakers cite statistics indicating that
between a quarter and a third of our nation’s middle-school students lack even basic math
skills (National Center for Education Statistics, 2011), these claims are often
accompanied by calls for school reform. But school reform is much easier called for than
actually accomplished. Institutionally and administratively the task is influenced by
3
countless factors, from national and state policy to local issues affecting communities,
families, as well as individual students. Even reforms that have been proven by research
to be effective have been difficult to implement due to a lack of long-term funding
(Elmore, 2004; Nunnery, 1998; Slavin, 2008).
Recently, however, the U.S. government created a new series of grant
opportunities to encourage school reform efforts at different stages of use. The Investing
in Innovation (i3) grant program awards federal funds to worthwhile projects in
development, validation, or scale-up stages. The i3 scale-up grants fund large-scale
implementation of innovative reforms that are research-proven - ones that have proven
positive effects on student achievement.
One such middle school math reform is PowerTeaching, a technologically
enhanced form of Student Teams-Achievement Divisions (STAD) math (Barbato, 2000;
Slavin et al., 2009), both initially developed at Johns Hopkins University and later
implemented by the Success for All Foundation. A recent meta-analysis showed that
STAD math and its emphasis on student team learning had a positive effect on secondary
students’ math achievement (d= + 0.34; Nunnery & Chappell, 2011).
PowerTeaching (PT) is a new framework for teaching math. During the pilot year
it did not require changing the math content or curriculum. Rather, PowerTeaching
changes the classroom atmosphere and activities. PowerTeaching provides a flexible
framework that allows students to participate actively in their own learning. In a PT
classroom, student teams share a collective goal based on the learning of the lesson
content by each individual group member (Figure 1). Teams are encouraged to celebrate
steps made toward this goal, and such celebrations lead to social cohesion between the
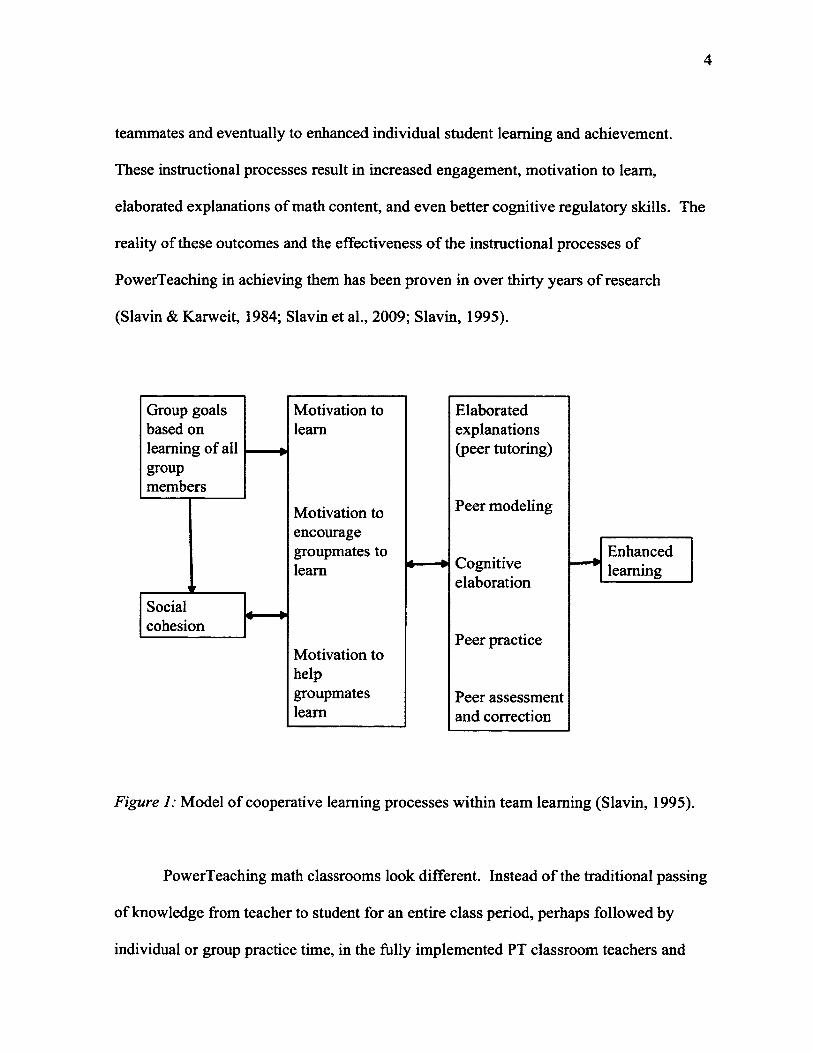
4
teammates and eventually to enhanced individual student learning and achievement.
These instructional processes result in increased engagement, motivation to learn,
elaborated explanations of math content, and even better cognitive regulatory skills. The
reality of these outcomes and the effectiveness of the instructional processes of
PowerTeaching in achieving them has been proven in over thirty years of research
(Slavin & Karweit, 1984; Slavin et al., 2009; Slavin, 1995).
Enhancedlearning
Socialcohesion
Group goals based on learning of all group members
Motivation to learn
Motivation to encourage groupmates to learn
Motivation to helpgroupmateslearn
Peer modeling
Peer practice
Peer assessment and correction
Elaborated explanations (peer tutoring)
Cognitiveelaboration
Figure 1: Model of cooperative learning processes within team learning (Slavin, 1995).
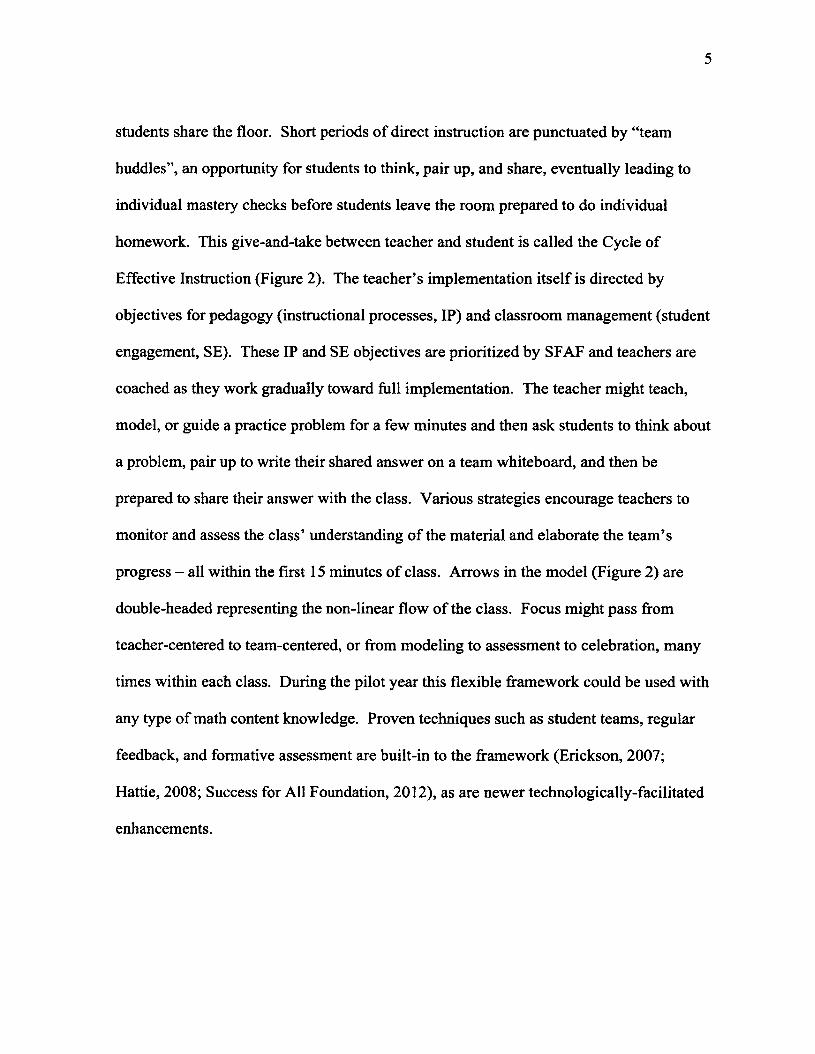
PowerTeaching math classrooms look different. Instead of the traditional passing
of knowledge from teacher to student for an entire class period, perhaps followed by
individual or group practice time, in the fully implemented PT classroom teachers and
5
students share the floor. Short periods of direct instruction are punctuated by “team
huddles”, an opportunity for students to think, pair up, and share, eventually leading to
individual mastery checks before students leave the room prepared to do individual
homework. This give-and-take between teacher and student is called the Cycle of
Effective Instruction (Figure 2). The teacher’s implementation itself is directed by
objectives for pedagogy (instructional processes, IP) and classroom management (student
engagement, SE). These IP and SE objectives are prioritized by SFAF and teachers are
coached as they work gradually toward full implementation. The teacher might teach,
model, or guide a practice problem for a few minutes and then ask students to think about
a problem, pair up to write their shared answer on a team whiteboard, and then be
prepared to share their answer with the class. Various strategies encourage teachers to
monitor and assess the class’ understanding of the material and elaborate the team’s
progress - all within the first 15 minutes of class. Arrows in the model (Figure 2) are
double-headed representing the non-linear flow of the class. Focus might pass from
teacher-centered to team-centered, or from modeling to assessment to celebration, many
times within each class. During the pilot year this flexible framework could be used with
any type of math content knowledge. Proven techniques such as student teams, regular
feedback, and formative assessment are built-in to the framework (Erickson, 2007;
Hattie, 2008; Success for All Foundation, 2012), as are newer technologically-facilitated
enhancements.
6
Active Instruction• Teach• Model• Guide Practice
Celebration• Recognize• Celebrate
The Cycle ofEffective
InstructionTeamwork• Prompt• Reinforce
Assessment• Monitor• Assess
Figure 2: The Cycle of Effective Instruction (Success for All Foundation, 2012).1
In late 2011 an i3 scale-up grant was awarded to The Center for Educational
Partnerships at Old Dominion University (TCEP) in cooperation with the Success for All
Foundation (SFAF) and the Center for Technology in Education at Johns Hopkins
University (CTE) to fund scale-up of SFAF’s PowerTeaching (PT) framework across 185
high-need middle schools nationwide. The first year o f the grant piloted the
implementation of the PT framework in 8 middle schools across the nation. TCEP’s
1 Note: ©2012 Success for All Foundation - A Nonprofit Organization. Reprinted with permission.
7
formative evaluation of the implementation at the pilot schools produced initial findings
on school readiness for reform. The goal of this formative evaluation was not to prove
the effectiveness of the PT framework, but instead to study the complex process of
implementation and bring to light characteristics of the schools’ contexts and conditions
of work that affect implementation. Stakeholders in the program provided unique
perspectives. Numerous studies have shown that early perceptions of teachers predict
successful program implementation (Desimone, 2002; Nunnery et al., 1997; Park &
Datnow, 2008; Smith et al., 1997). To capture these perceptions, TCEP researchers used
a variety of measurement tools, including a teacher questionnaire, classroom
observations, teacher nominal groups, school leader and school-based coach interviews,
and document analysis of SFAF measures. These stakeholder perceptions were then
measured against the relative level of implementation o f the PT framework. The
formative evaluation results were reported to program developers, administrators, and
other stakeholders in a cyclical and transparent manner from the initial stages of the
project (Carhart et al., 2013; Nunnery, Bol, Morrison, Arnold, Chappell, et al., 2013;
Nunnery, Bol, Morrison, Arnold, Perry, et al., 2013).
Research Objective
Operating in the midst of this larger, grant-funded project, I used selected data from
the TCEP formative evaluation process as well as collected additional data to examine
the characteristics of schools and teachers who implemented the program during the pilot
year. My mixed-methods study examined early levels of school-level implementation
and characteristics that led to higher or lower levels of implementation in the initial phase
8
of the grant (Damanpour, 1991; Tomatzky & Klein, 1982). Diagnosing which
characteristics of schools and teachers might lead to successful school change is a vital
question (Demarest, 2010; Nunnery, 1998; Peurach, 2011; Slavin, 1990). Continuing to
research characteristics that support reform implementation with fidelity could lead to
more effective schools, more efficient use of funds for school change, and eventually
provide evidence to make schools more effective. Ultimately it could help many more
children succeed in middle school math classes and in secondary schooling (Demarest,
2010; Elmore, 2004; Fullan, 2007; Hargreaves, 2007; Slavin, 1990). Specifically, I
examined teachers’ beliefs about team learning, teachers’ concerns about the
implementation, and the level of support from school leaders to see how these factors
related to levels of use of the PT framework. I examined other stakeholder’s (school
leaders and project managers) perceptions of the pilot year of implementation as well.
Because this research was limited to the pilot phase of a larger grant-funded
research project, an additional purpose was to inform the stakeholders and grant
participants of important factors that may influence a school’s or a teacher’s readiness for
reform. This knowledge could help the stakeholders recruit future scale-up schools or
amend professional development materials for teachers implementing the reform.
Allocation of limited resources could then be directed toward those areas closely related
to more effective early implementation.
Research Rationale
If teachers implement the research-based program with fidelity, research suggests
that the program will result in increased student performance (Datnow & Castellano,
9
2000; Datnow, 2000; Desimone, 2002; Park & Datnow, 2008). Some researchers have
explored the characteristics of teachers, students, and schools that lead to more rapid
implementation with fidelity (Nunnery et al., 1997; Smith et al., 1997). Three promising
characteristics that are likely to affect successful implementation or replication of a
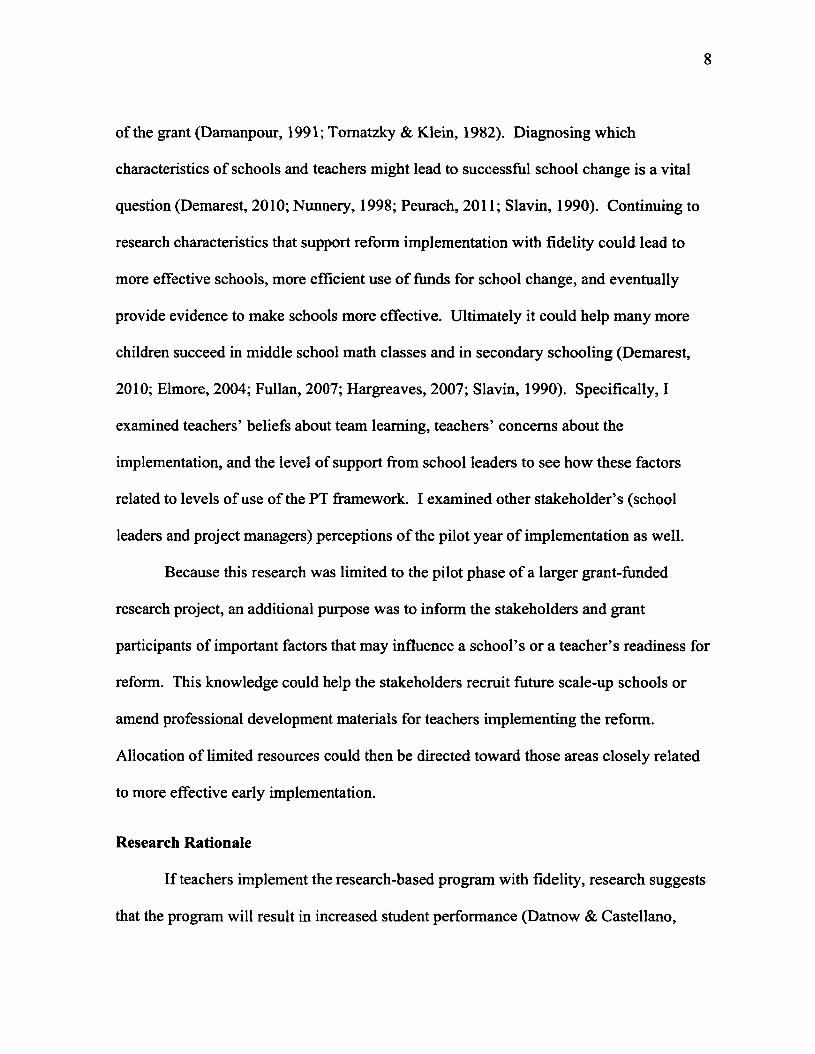
program in school settings are worth further research. Teacher beliefs about the
intervention, teacher levels of concern about the implementation, and the level of support
provided by the school leader may impact the teacher’s level of implementation and
therefore impact student success (Figure 3).
Implementation
PowerTeaching
Teacherconcerns
Teacherbeliefs
Schoolleader
support
Figure 3: Factors influencing successful implementation of PowerTeaching.

10
Literature Review
Prior research on factors affecting implementation of innovations has established
specific factors as important to achieving effective and sustainable school change. The
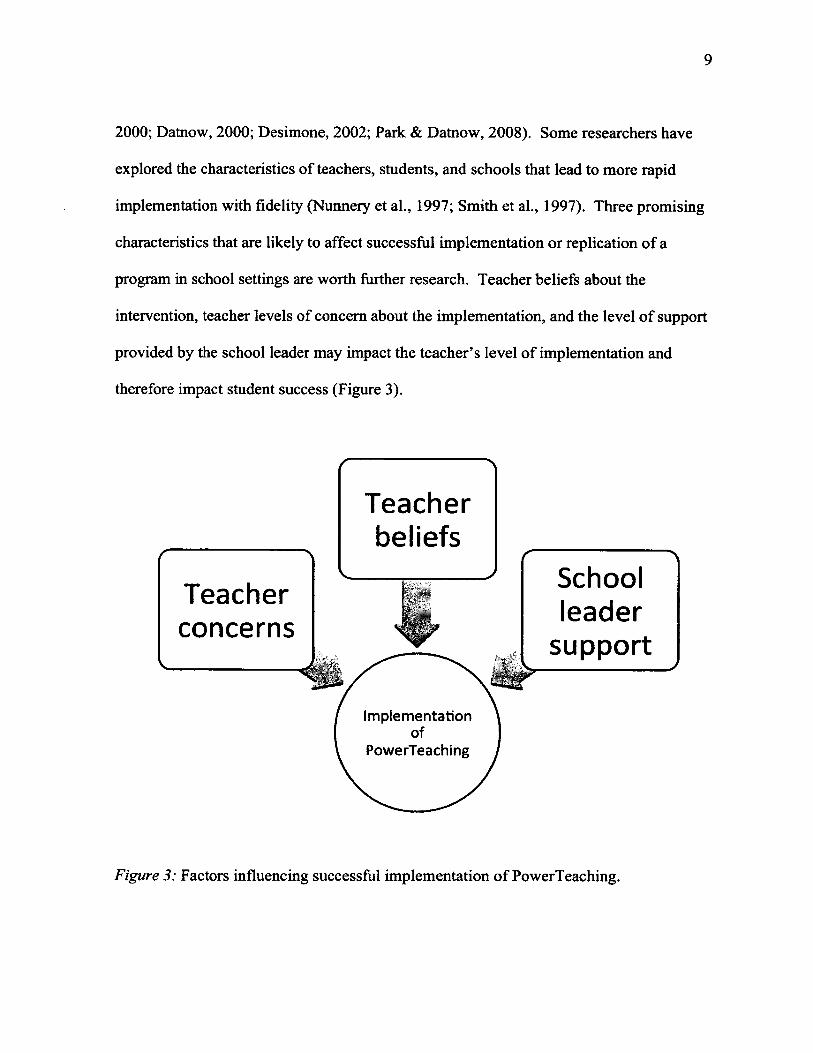
teacher’s beliefs about the innovation, the teacher’s level of concerns about
implementation, and the importance of the school leader’s role as instructional leader in
the school are all examined here in terms of their influence on effective implementation
with fidelity. Additionally, theories of implementation and replication of reforms are
presented.
The Centrality of Teachers in School Reform Efforts
Teachers figure prominently in the success or failure of reform implementations
(Datnow & Castellano, 2000; Datnow & Stringfield, 2000; Louis, 2007). Relatively early
in the Comprehensive School Reform (CSR) movement, teachers and their reactions were
seen to be central to implementation of school reform. Nunnery et al. (1997) studied
reactions of teachers to the initial phase of implementation of a comprehensive school
reform as part of the New American Schools program. The design of the study
emphasized the centrality of the teacher in any school reform. The study consisted of two
questionnaires given to teachers (n = 739) after initial training for the specific reform and
early in the reform’s implementation. The measures included both closed-ended and
open-ended responses and examined the teachers’ perceptions of the quality of their
training, the extent to which they understood the innovation, and their level of enthusiasm
and confidence for the innovation. The results showed that effective training must be
combined with modeling and coaching, preferably in a format and pedagogy similar to
the innovation the teachers are expected to implement in their own classrooms. Although

11
it relied exclusively on self-reported data, it sampled a large number of teachers and was
able to draw conclusions about the importance of teachers in school reforms and give
insight into the teachers’ concerns and understanding of an innovation.
Further research from the comprehensive school reform movement examined the
importance of teacher perceptions of support on resultant levels of implementation. Bol,
Nunnery, and Lowther (1998) completed a large-scale evaluation of the New American
Schools movement in Memphis in the mid-1990s. Teachers’ perceptions of the level of
support (internal and external) were strongly related to actual changes in teaching and
learning - to their actual implementation. Teachers’ opinions were gathered using
questionnaires (« = 980) and a focus group in each school (34 groups of 7-10 teachers
each). The questionnaire yielded both closed and open-ended responses that were
analyzed separately. The teachers’ ratings were shown to have moderately strong
correlation with the focus-group-based ratings of the site evaluators, thus alleviating a
threat to validity due to social desirability. The study concluded chiefly that because
teacher perceptions of support were strongly related to effective implementation, it is
important to provide adequate external professional development and training -
collaboration (internal support) was not adequate even in year 2. Teachers resented
having to create their own materials. Scaffolding, in the form of sample units provided
by the developer, was helpful, as would be additional planning and preparation time
during the school day. The nature of the school sample and its multitude of
characteristics (school level, student SES, leadership quality, district support, etc.)
somewhat confounds results and generalizability of the study, but in my case the study
established the importance of teacher concerns and teacher perceptions of support to the

12
success of the reform effort.
A more recent look at the importance of teachers to the reform process is the
Teacher-Centered Systemic Reform Model (TCSR). A theoretical paper, it draws
increased attention to the teachers as implementers o f reform (Gess-Newsome,
Southerland, Johnston, & Woodbury, 2003; Woodbury & Gess-Newsome, 2002).
Teachers are the main link to students and student learning, and for this reason they
deserve to be central to any reform effort. The TCSR model suggests that their personal
theories and conceptual change can provide a framework for examining school change.
A college level study showed that even eliminating barriers and providing resources and
supports was a less powerful influence on changing instruction in the classroom than
teachers’ personal theories of learning. This being the case, the authors discuss the need
for “pedagogical discontent” and dissatisfaction with school context before teachers will
be receptive to new innovative approaches.
Teacher Concerns about Implementation
Teachers’ concerns about the reform that they are asked to implement are o f great
import. When teachers have strong reservations and concerns about the implementation
it is typically labeled “resistance” (Beatty, 2011; Gitlin & Margonis, 1995; Knight, 2009;
Thomson, 2008) and carries a negative connotation. But resistance can be a positive
force in the school. If an innovation is not coherent or is ill-defined, then teacher
resistance may be beneficial by preventing bad pedagogy from reaching the students.
When teachers’ concerns become very intense without response or alleviation, teachers
rightly become frustrated. When implementing a new reform, balance must be
maintained between the mandate of the reform, teachers’ own self-efficacy, as well as
13
frustration, burnout, and unwillingness to participate fully (Evers, Brouwers, & Tomic,
2002; Geijsel, Sleegers, Van den Berg, & Kelchtermans, 2001; Mazur & Lynch, 1989).
To imagine “teacher concerns” as a single construct risks over-simplifying what is
acutally very complex.
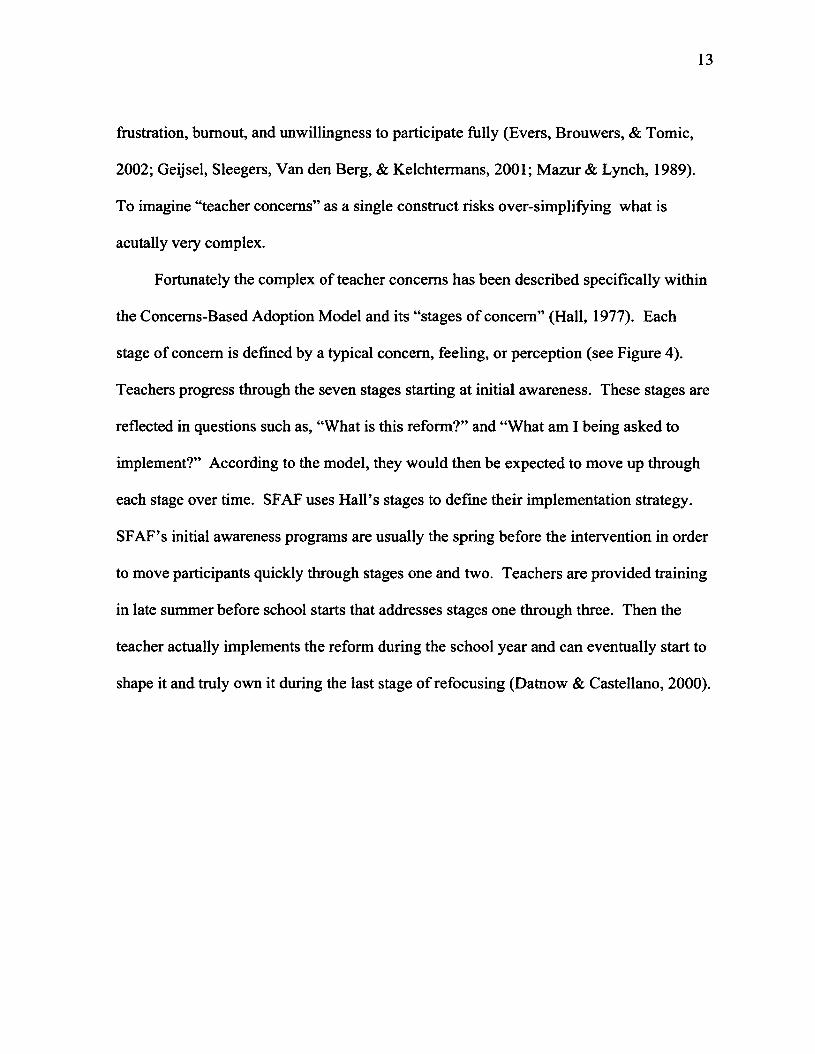
Fortunately the complex of teacher concerns has been described specifically within
the Concems-Based Adoption Model and its “stages of concern” (Hall, 1977). Each
stage of concern is defined by a typical concern, feeling, or perception (see Figure 4).
Teachers progress through the seven stages starting at initial awareness. These stages are
reflected in questions such as, “What is this reform?” and “What am I being asked to
implement?” According to the model, they would then be expected to move up through
each stage over time. SFAF uses Hall’s stages to define their implementation strategy.
SFAF’s initial awareness programs are usually the spring before the intervention in order
to move participants quickly through stages one and two. Teachers are provided training
in late summer before school starts that addresses stages one through three. Then the
teacher actually implements the reform during the school year and can eventually start to
shape it and truly own it during the last stage of refocusing (Datnow & Castellano, 2000).

14
7) Refocusing: Is there a better way?
6) Collaboration: How do others do it?
5) Consequence: Is it worth it?
4) Management: How can I master it?
3) Personal: How does it impact me?
2) Information: How does it work?
1) Awareness: What is it?
Figure 4: The Stages of Concern in the Concems-Based Adoption Model (Hall, 1977).
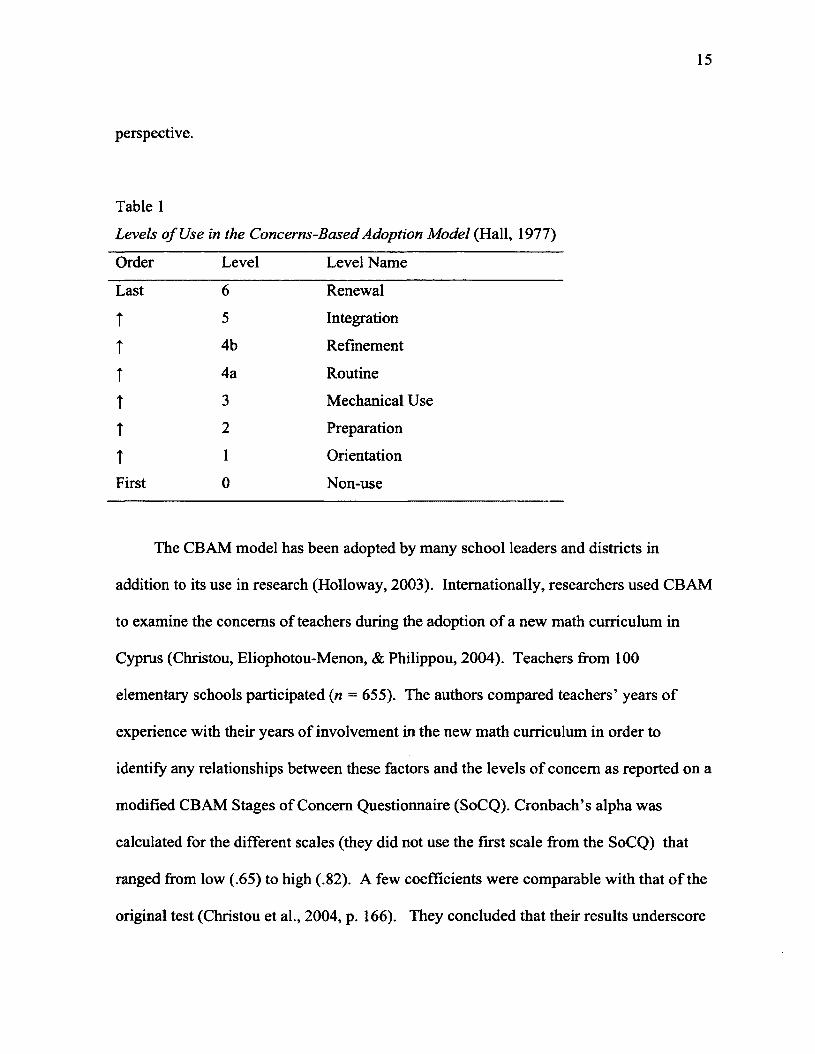
Hall’s model also includes a theory describing the Level o f Use (LoU) of the
innovation (Table 1). Each level of use of the reform includes a different profile of
teacher implementation concerns as they learn the innovation and apply it in their
classrooms. Teachers gradually progress through the stages of the LoU model as they
add to their implementation of the innovation. Initially all start at “non-use” and ideally
all would reach “renewal” at some point although that is unrealistic to expect during a
pilot year (Hall & Hord, 1987; Hall, 1977,2011). Roach, Kratochwill, and Frank (2009)
published an informative overview and description of the CBAM model and its
limitations and implications for further research from a counseling and school-facilitator
15
perspective.
Table 1
Levels o f Use in the Concerns-Based Adoption Model (Hall, 1977)
Order Level Level Name
Last 6 Renewal
T 5 Integration
T 4b Refinement
t 4a Routine
t 3 Mechanical Use
T 2 Preparation
T 1 Orientation
First 0 Non-use
The CB AM model has been adopted by many school leaders and districts in
addition to its use in research (Holloway, 2003). Internationally, researchers used CBAM
to examine the concerns of teachers during the adoption of a new math curriculum in
Cyprus (Christou, Eliophotou-Menon, & Philippou, 2004). Teachers from 100
elementary schools participated (n = 655). The authors compared teachers’ years of
experience with their years of involvement in the new math curriculum in order to
identify any relationships between these factors and the levels of concern as reported on a
modified CBAM Stages of Concern Questionnaire (SoCQ). Cronbach’s alpha was
calculated for the different scales (they did not use the first scale from the SoCQ) that
ranged from low (.65) to high (.82). A few coefficients were comparable with that of the
original test (Christou et al., 2004, p. 166). They concluded that their results underscore
16
the importance of attending to teacher concerns about new math curricula. However, the
lack of information about method and rigor limit the generalizability of these findings.
Hollingshead used CBAM to study implementation of a character education
program district-wide in 12 elementary schools, 2 middle schools, and 2 high schools
(Hollingshead, 2009). The SoCQ questionnaires were analyzed by calculating a mean
score for each stage of concern for each teacher. Grand means were also calculated for
each stage of concern across each school. These mean scores for each level of concern
were then linearly mapped in order to display a profile of the intensity of each individual
teacher’s concerns as well as those of each school (using the grand means). The profiles
were interpreted by evaluating the overall shape of the line and not the level of intensity
of each point on the line. Peaks on the school-wide profile of concerns represent strong
concern in that building at that stage and valleys show lesser concerns, relatively
speaking. Although somewhat simplistic, individual teachers’ concern profiles were
interpreted in a similar manner and categorized into four types: resistors, cooperators,
ideal implementers, and overachievers (Hollingshead, 2009). Hollingshead continued to
address what types of intervention were important for each teacher concern profile.
In a review of implementation models, Straub maintains that a person choosing to
adopt an innovation (technological innovations in particular) is involved in a choice that
includes concerns in three domains: cognitive, emotional, and contextual. Another
important factor he discusses is the perceived usefulness of the innovation. He suggests
that when examining implementation of innovations researchers should examine these
additional domains of individual choice and consider the informal environments of the
organization as well as the prescribed routines of the organization (Straub, 2009). The
17
CBAM framework is situated in the educational environment, and focused almost
entirely on individuals’ concerns.
Concems-Based Adoption Model measures are not necessarily intended for
rigorous empirical use and will be further discussed in the method section. Created for
school leaders with distinct needs, researchers have adopted and used the CBAM model
successfully to describe implementation of educational reforms and innovations. These
studies have repeatedly shown the essential nature of the concerns of the teachers
participating in the implementation. Because the CBAM model is uniquely focused on
the concerns of teachers in schools undergoing change and because it is used heavily
throughout the SFAF materials and routines, teachers’ levels of concern are defined
according to the CBAM model in my research.
Teacher Beliefs About Student Team Learning
Teachers’ beliefs about the reform are a primary force in any school change (Gess-
Newsome et al., 2003; Nunnery et al., 1997; Woodbury & Gess-Newsome, 2002).
Specifically, teachers’ beliefs about student learning affect classroom pedagogy (Bol,
Ross, Nunnery, & Alberg, 2002; Datnow & Castellano, 2000; S. Gibbs & Powell, 2012;
Pajares, 1992; Sinatra & Kardash, 2004; Timperley & Robinson, 2001). Beliefs and
personal epistemology have been well-researched and yet gaps still exist in the literature
(Bendixen & Feucht, 2010; Bendixen & Rule, 2004; Elby, 2009; Hofer & Bendixen,
2012; Niessen, Abma, Widdershoven, van der Vleuten, & Akkerman, 2008; Sandoval,
2009). Some studies compared teacher’s beliefs on student team learning or cooperative
learning with the level of use of cooperative learning in the classroom and change in
beliefs during professional development was also studied (Bredeson, 2003; Brody &
18
Davidson, 1998; Lumpe, Haney, & Czemiak, 1998). However, none of these studies
have sought to examine the relationship between the teachers’ beliefs about learning and
the level of implementation of a new reform. Among the literature on teacher beliefs,
studies on personal epistemology have infrequently identified beliefs with reference to
implementation of reform programs - Abrami (2004) measures the “intention to
implement” and Datnow and Castellano (2000) qualitatively study how beliefs shape
implementation. A few studies measured impacts of teacher beliefs on the
implementation of technology in the classroom although level of implementation was not
addressed (Pedersen & Liu, 2003; Yerrick & Hoving, 1999).
Schommer’s “embedded systemic model of epistemological beliefs” was used for
this research (Schommer-Aikins, 2004). Schommer emphasizes that epistemic beliefs do
not occur in a vacuum but are embedded in a context. The teacher’s belief about the new
implementation depends on the context as is his or her belief about student teams or
about encouraging increased student engagement. Another related model is Bendixen
and Rule’s “integrative approach to personal epistemology” (Bendixen & Rule, 2004;
Rule & Bendixen, 2010). Quantitative measurement of beliefs is very difficult but
multiple inventories are being researched and refined to enhance the psychometric
properties of the instruments(Bendixen & Feucht, 2010; Schommer-Aikins, 2004;
Schraw, Bendixen, & Dunkle, 2012).
Few empirical studies were found that connect teacher beliefs to classroom practice
and pedagogy. Bol and Nunnery researched teacher perceptions of their levels of support
during the NAS implementations in their 1995 large-scale, longitudinal evaluation (Bol et
al., 1998). They found that perceived level o f support was strongly related to a change in

19
teaching and learning in the classroom, that is to say better implementation fidelity.
In a validation study of a self-reported teacher perceptions questionnaire that used
related observations of the teachers, Nunnery, Ross, and Bol found that the questionnaire
results were supported by observation (2008). The teachers’ perceptions of change
within their schools as noted on the questionnaire were borne out by the results of the
observation - the questionnaire predicted the observation rankings. The authors note that
this perception of the importance of change in the school is formed by multiple factors
both internal (i.e. individuals’ beliefs) and external (i.e. influence of leadership and
cooperating organizations). The study is strong and limitations are chiefly that the
population was rural elementary schools that sought out reform, not secondary or urban
environments or schools where reforms were externally mandated.
Sinatra and Kardash studied whether preservice teachers’ beliefs about learning
(knowledge evolves, beliefs can be revised, etc.) were related to the foundational idea for
a new innovation: teaching as persuasion (Sinatra & Kardash, 2004). Contextually part
of the research on conceptual change, they measured the preservice teachers in terms of
their openness or resistance to change. They found initial correlational evidence that
teacher beliefs about learning were related to their opinions about pedagogy, but note that
the measure had low reliability, suggesting further research in these areas.
Although qualitative research and evaluation have shown that teacher beliefs
impact the use of an innovation in the classroom, there is a dearth of empirical evidence
on the relationship between teacher beliefs and level of use of implementation. The two
best examples are difficult to compare as they examined entirely different populations
(in-service and pre-service teachers) and two separate contexts (implementation of

20
whole-school reform vs. the idea of teaching-as-persuasion). Hopefully as measures
continue to be developed the use of teacher beliefs as an independent variable when
studying implementation and replication will be used more often. No studies were found
that addressed the teachers’ beliefs specifically about team learning.
The Importance of School Leader Support in Implementation
The role of the school leader in implementing an innovation is not insignificant
although it is difficult to measure and effects are often indirect (Murphy & Datnow,
2003). Of the many roles of the school leader (managerial, coaching, motivating, and
transforming), the one most directly tied to implementation is leadership for learning or
instructional leadership. The plethora of responsibilities facing school leaders on a
minute-by-minute basis means that choosing where to direct their time and attention is
very difficult. A recent meta-analysis shows that school leaders who can best focus their
energies on the most pressing issues in their schools have a greater positive impact on
their students’ achievement (Robinson, Lloyd, & Rowe, 2008). Murphy and Datnow
(2003) similarly argue that giving attention to instruction and student learning is a strong
single indicator of a supportive school leader. For this reason, the model of “leading for
learning” was chosen to frame the leadership research for this study.
Leading for learning. For decades now, researchers have shown the importance
of instructional leadership on school effectiveness (Hallinger, 2005). According to this
research, successful principals clearly affect student achievement in addition to other
school outcomes (Robinson et al., 2008). Principals have a unique ability to identify and
communicate school-wide goals, hire quality teachers, allocate resources, develop
necessary organizational structures, and knit together communities of learning to support

21
all these ends (Brewer, 1993; Davis, Darling-Hammond, LaPointe, & Meyerson, 2005;
Jacob & Lefgren, 2005; Leithwood & Jantzi, 2005). Another recent review of research,
funded by the Wallace foundation, demonstrates a connection between good leadership
and student learning as well (Leithwood, Louis, Anderson, & Wahlstrom, 2004). There
can no longer be doubt that the school leader influences student learning. To deny this
copious research allows school leaders and policy makers to continue to place managerial
responsibilities above instructional ones to the detriment of the students and the school
community as a whole.
Successful principals influence every aspect of their schools and although the
influence over student achievement may be indirect, it is not unimportant. The
statistically significant relationship between leadership and student achievement
described in one meta-analysis translates into student achievement scores that are 10
percentage points higher after a principal improves his or her leadership abilities.
Significant correlations were found for 21 different leadership responsibilities analyzed
by the researchers. In addition to these general findings, some leaders were found to
influence significantly larger change (up to 20 percentage points of increase in student
achievement) or even have a negative influence. Marginal effects were also present
(Waters, Marzano, & McNulty, 2003).
Waters, Marzano, and McNulty discovered that two leadership factors strongly
influenced student achievement. The first factor is the focus o f change and whether or
not school leaders could direct improvement efforts toward those variables most likely to
positively impact student achievement. Secondly, a school leader’s impact on student
achievement is dependent on whether the leader identifies the magnitude of the change

22
and adjusts school and classroom practices in line with that knowledge. Not all changes
equally affect the school’s stakeholders, and it is important for school leaders to consider
which actors will be affected to what extent before embarking on school change (Waters
et al., 2003). Clearly, both of these areas can be expected to affect the school’s readiness
for reform.
It is important to note that there are few studies that examine the relationship
between school leaders and student outcomes (Robinson et al., 2008). Quasi-
experimental studies on the relationship between professional development for school
leaders and student achievement are even more limited. A few studies use a leadership
construct such as “principal leadership style” in analysis of implementations, teacher
resistance, or burnout (Datnow, Borman, Stringfield, Overman, & Castellano, 2003;
Fernet, Guay, Senecal, & Austin, 2012; Graczewski, Ruffin, Shambaugh, & Therriault,
2007; Leithwood & Montgomery, 1982). Further research in these areas is important to
undertake and would provide justification for both expenditures for professional
development as well as grounds for policy changes in school leadership professional
development requirements and evaluation.
Leadership during implementation of ST AD and PT. In addition to recent
research suggesting that the principal has an important, if indirect role in effecting
positive school change and increased student performance, researchers of the
comprehensive school reform movement (CSR) found that the principal had a crucial role
in implementation. This was found to be the case in schools with SFAF’s school-wide
reforms based on the same ideas as the PT framework. Datnow and Castellano (2001) in
their study of the Success for All schools maintain that the ongoing and active support of
23
the school leader is very important in the successful implementation of school reforms
such as Success for All. Many qualitative studies have shown that the principal can make
a difference, perhaps the difference in high-implementing and low-implementing schools
(Danzig, Chen, & Spencer, 2007; Datnow et al., 2003; Datnow & Castellano, 2000,2001;
Smith et al., 1997)
Indeed principals can be effective “catalysts for change” (Murphy & Datnow,
2003). In his longitudinal study of Success for All Foundation, Peurach (2011) notes the
important role of the school leader and later relates the decision to combat ineffective
reform (replicating the motions without fidelity) by creating a new leadership manual and
set of routines for the foundation to implement with school leaders in particular.
Although the PT reform is still new, the STAD math research and comprehensive school
research on SFA implementation suggests universally that the role of the school leader is
crucial.
Emphatic about the crucial role that principals play in the faithful implementation
of reform in the classrooms under their charge, the Success for All Foundation has
written comprehensive materials including an Administrator’s Quick Reference Guide.
While participating in PT, it is expected that the school leader observe participating
teachers and assess their level of implementation. In awareness of the many pressures
principals face, the guide offers several levels of detail, from a basic checklist, to
prioritized objectives for implementation, keys to correctly observing the levels of
implementation for each objective, and a wealth of hints and tips for assisting teachers in
achieving better instruction and rigorous implementation (Success for All Foundation,
2012).

24
School leaders have a key role in implementating school reform. Although a few
empirical studies are available that examine the direct or indirect role of the school leader
on the instructional processes or student performance at the school (Borman et al., 2005;
Robinson et al., 2008; Smith et al., 1997), these researchers call for further study.
Perhaps pressure to evaluate school leaders based on their students’ performance on high-
stakes tests will draw more attention to this research field (J. H. Berg, Carver, & Mangin,
2013; Leithwood & Jantzi, 2005). Although this research will not likely result in causal
claims, it draws attention to the importance of school leaders directing their focus to
ensure that instruction is effective and student learning is enhanced.
Theoretical Framework
The lens through which I examined the initial implementation of PowerTeaching is
Rogers’s model for dissemination of innovations. Chosen for its widespread use and
relative simplicity, it provided an important picture of the work as a whole. Other
theories were used to enhance the views as through a different lens - in particular, Van de
Ven’s view of “innovation as journey” and emerging theories of replication.
Models of Innovation Dissemination and Replication
Rogers’s model for dissemination of innovation. The stages of institutional
change after adopting an innovation are modeled in Everett Rogers’ theory for diffusion
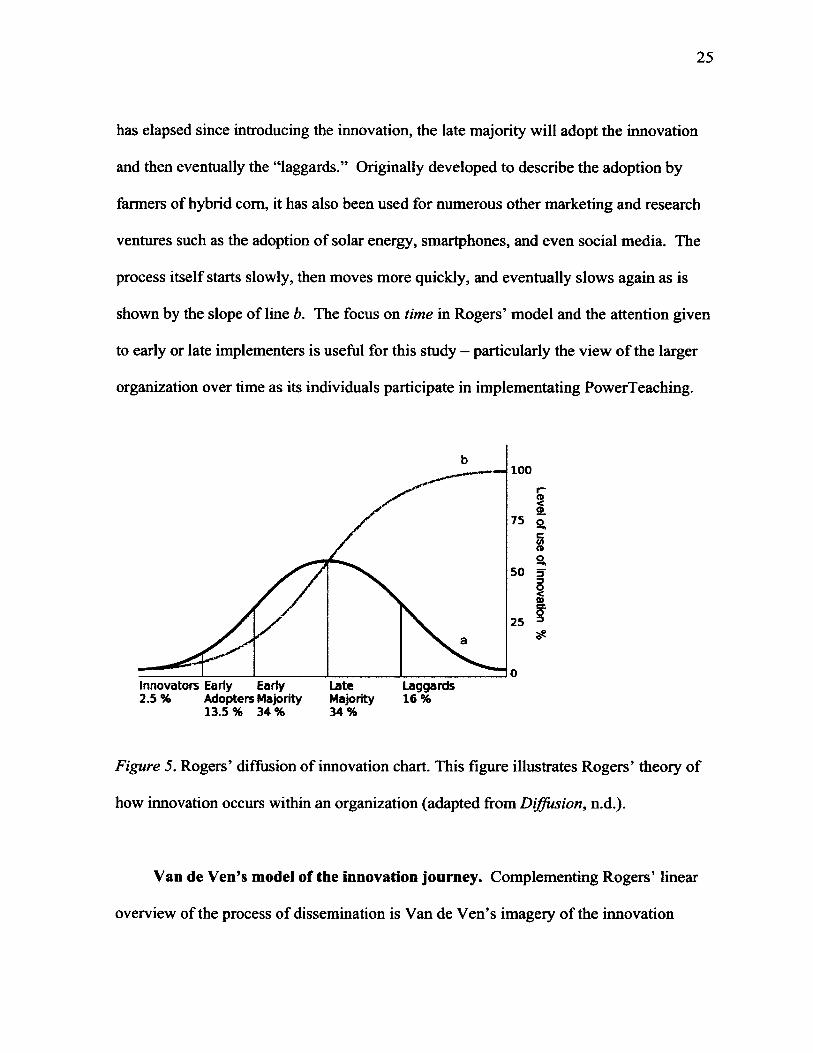
of innovations, originally published in 1962 (Rogers, 1962). Rogers’ model (see Figure
5) suggests that there are a small number of individuals who will immediately adopt an
innovative practice. After a short while, other early adopters will join, eventually leading
to a larger group of adopters he calls the “early majority” (Line a). After significant time
25
has elapsed since introducing the innovation, the late majority will adopt the innovation
and then eventually the “laggards.” Originally developed to describe the adoption by
farmers of hybrid com, it has also been used for numerous other marketing and research
ventures such as the adoption of solar energy, smartphones, and even social media. The
process itself starts slowly, then moves more quickly, and eventually slows again as is
shown by the slope of line b. The focus on time in Rogers’ model and the attention given
to early or late implementers is useful for this study - particularly the view of the larger
organization over time as its individuals participate in implementating PowerTeaching.
Figure 5. Rogers’ diffusion of innovation chart. This figure illustrates Rogers’ theory of
how innovation occurs within an organization (adapted from Diffusion, n.d.).
Van de Ven’s model of the innovation journey. Complementing Rogers’ linear
overview of the process of dissemination is Van de Ven’s imagery of the innovation
b100
I n n o v a to r s E a rly E a rly L a te L a g g a r d s2 .5 % A d o p te r s M a jo rity M a jo rity 1 6 %
1 3 .5 % 3 4 % 3 4 %
26
journey (Ven, Polley, Garud, & Venkataraman, 1999). An organizational behavior
scholar and not an expert in schooling, the best example of his work is the longitudinal
study of innovations at the 3M company (the cochlear implant invention in particular).
The main point of the book, drawn after numerous longitudinal studies of innovations in
varied settings, is that the process of innovation and implementation of the innovation is
not particularly systematic and certainly not linear. The innovation will not succeed if
the journey is random or chaotic. Van de Ven’s journey is a metaphor for dynamic
movement toward a common aim, with give and take between all the participants in the
process. As the participants journey together, the dynamic movement is not
unidirectional and not linear. Van de Ven describes a divergent-convergent cycle where
the different stakeholders are in the midst of a dynamic process, a flowing stream of
activity, that they cannot control but can learn to navigate by nurturing relationships and
cultivating institutional routines that assist in the development and implementation of the
innovation. Flexibility and relationship-building are key, as is the omnipresent view of an
innovation journey that is not linear or predictable (Ven et al., 1999).
Replication theory for educators. Specifically for use with studies of school
change and reform, Peurach and Glazer are developing a “knowledge-based model” of
replication (Peurach & Glazer, 2011). Their model extends Van de Ven’s idea and
applies it to education. They envision a central “hub” organization (in this case the
Success for All Foundation) that replicates a program (the PT framework) in a number of
different “outposts” (middle school math classrooms). In a multifaceted relationship, the
hub and outposts work together to replicate the program and implement it with fidelity in
a way that works within their unique setting. Viewing this process as a give and take
27
relationship in which outposts learn programmatic routines from the hub and the hub
improves and adjusts the program based on the experiences of the outposts is entirely
different than the more traditional and hierarchical model of research and development in
which researchers create an idea which is developed and distributed and then (only when
“ready”) handed down to a separate set of people who implement the program - often
inflexibly and without voice or ownership. If the goal is to replicate effectiveness of a
proven program, then care must be taken to avoid the major pitfalls of “faux replication
strategies” (Winter & Szulanski, 2001). Replication without fidelity has been a common
problem since the early years of the comprehensive school reform (CSR) movement
(Borman, Hewes, Overman, & Brown, 2003; Desimone, 2002). The problem of empty
replication, creating only a pretense of the reform, has been addressed in research by
attempting to measure effectiveness and fidelity when researching implementations of
new programs in schools. Assumptions common under the traditional research and
development model that replication must be sequential and that school reform is effective
when “research-proven programs” are used “right out of the box” are untenable; Peurach
notes that they rest on a further set of questionable assumptions that knowledge of the
reform can be “known perfectly” by the hub prior to scale-up, that a transfer of
knowledge can be “seamless,” that “effective use is transparent,” and that any problems
that occur during implementation can be easily “resolved through iterative
communication” (Peurach & Glazer, 2011, p. 164).
The newer model for research, development, and dissemination of an innovation
uses Van de Ven’s vision of divergent and convergent learning, in this case placing
special emphasis on avoiding mere replication of a technique or practice at a superficial
28
level and instead working to replicate the effectiveness of the practice fully and with
fidelity. This more flexible, “knowledge-based” process includes the actors (hub and
outlets) replicating a practice in a dynamic give and take between each other. Not only
must one have the knowledge of the practice (in this case SFAF’s PT framework), but
also knowledge of how to replicate the practice in different contexts. The continuous and
collaborative learning by all the actors in this model is quite different than a typical
hierarchical transfer of a pre-perfected technique. It does not assume that the PT
framework is known and described perfectly by SFAF prior to distribution and use or that
the transfer of the practice will be seamless and transparent. Instead, the routines are
explored and recreated by individuals in relationships during a journey of implementation
- not techniques that are mechanically replicated but developed by individuals elsewhere
(Peurach & Glazer, 2011).
Theoretical Conclusions: Dissemination of innovations
Rogers’s and Van de Ven’s theories are complementary lenses through which to
narrate and examine the implementation of an innovation. The big picture provided by
Rogers is an important focus when measuring the teacher’s concerns about the
innovation. When teasing out important nuances with regard to the array of
characteristics that affect implementations of innovations, Van de Ven’s innovation
implementation journey and its nonlinearity is a crucial perspective through which to
view the complexity surrounding these experiences.2 Bruce Tuckman described this
•yThe immanence of complexity and the need for researchers to be willing to live with its

29
group dynamic as a trajectory of change, a journey, beginning with storming, norming,
and eventually performing (Bonebright, 2010; Tuckman & Jensen, 1977; Tuckman,
1965). The language proposed by these researchers is useful in navigating this more
complex view of the process of implementation of innovations in school settings.
Theories of Implementation of Innovations in Schools
Schools and other large institutions are difficult to change in a lasting or predictable
manner (Bruner, 1996; Elmore, 2004; Fullan, 2007; Giroux, 1988; Goodlad, 1975;
Hargreaves, 2007; Tyack & Cuban, 1997; Tyack, 1974). Critiques of school change are
almost continuous, whether that externally imposed innovations are hegemonic, or that
change from within rarely is deep, substantive, or sustainable. In his discussion of reform
ideology, Nunnery (1998) maintains that we can overcome this dilemma if we not only
develop well-defined innovations to implement but also provide substantive and lasting
support to those who are implementing. Years before it took place, he said of the demise
of the New American Schools reforms:
“If and when the NAS designs fail, as predicted by Fullan (1993), it may not be
because the external development approach is an Achilles’ heel but because policy
makers, administrators, and design teams failed to provide useful solutions or
adequately help teachers transfer and apply this knowledge.” (Nunnery, 1998, pp.
292-3)
discomfort is described in a longitudinal study of the comprehensive school change
program, Success for All (Peurach, 2011).

30
External reforms can change schools and help students learn as long as reformers take
care to create a well-defined reform and ensure that implemented are not left without
support (Barnes, 2005; Datnow & Castellano, 2000; R. Van den Berg, Sleegers, &
Geysel, 2000; Wayman, 2005).
Desimone’s review of factors that impact the success of comprehensive school
reform models draws similar conclusions (Desimone, 2002). Using policy attributes
theory she examined five attributes of the school reforms in her review. Specificity (clear
definition) of the reform led to higher level of implementation with fidelity. Immediate
effects of implementation on student performance were related to power of the reform.
Consistency, authority, and stability of the reform influenced long-lasting and sustainable
change. Stronger implementation, then, results from more specificity, consistency,
power, authority, and stability.
Borman also studied comprehensive school reform: the Success for All model for
elementary reading reform. After many quasi-experimental studies were completed,
including his own meta-analysis (Borman et al., 2003), he led a national randomized
experiment {n = 41 schools) (Borman et al., 2005) to determine the effect of the model
on student learning. Careful recruitment and assignment of control schools led to using
41 schools with both a treatment and control in each school. This type of design was
pursued in order to provide an incentive for schools to participate, but brought a larger
risk of contamination than if control groups had been in separate contexts entirely. The
results upheld many of the earlier findings and showed that positive effects on student
achievement were limited to one strategy, an early reading skill (therefore the pattern of
effect fits the pattern of instruction). Implementation levels were found generally to be

31
strong, apart from issues that led to rushed implementations allowing “insufficient time
for the program to become established and flourish” (Borman et al., 2005, p. 18).
Organizational change is inherently complex. The literature reviewed above
suggests that externally developed reforms are usually better than internally developed
reforms; that reforms need to be well-developed and well-defined; that leaders and
teachers need to perceive the usefulness of the innovation (whether through pedagogical
discontent or another construct); and that a successful journey is a focused journey of
implementation - a tapestry of individuals working together to shape a reform and mold
it to the context-at-hand (Datnow & Stringfield, 2000; Peurach & Glazer, 2011; Wilson,
1994). Lasting and sustainable change with fidelity to proven pedagogies is possible but
difficult. Borman acknowledges that the challenge is to tie “together two central themes
of educational research and policy today: the scaling up, or replication of school-based
interventions and the development of high-quality evidence of their causal effects”
(Borman et al., 2005, p. 19). The pilot year of the scale-up of PowerTeaching embraced
this challenge.
Design Overview
Research Purpose. The purpose of this study was to explore the complexity o f school
change, specifically implementation of a research-based middle-school math reform.
Teachers, school leaders, and project managers’ perceptions about the initial stage of
implementation were examined. Although during the first year substantive and lasting
change cannot be expected to come to fruition, the relationships, routines, and focus
points built in that first year provide a unique way to study implementation. Finally,

32
teacher beliefs about team learning, teacher levels of concern about PT, and school leader
support for PT were considered as contributors to variation in level of implementation
(level of use) of PowerTeaching.
Research Questions
1. What are the project managers’ perceptions of variation in implementation of
PowerT eaching?
2. What are leaders’ perceptions of factors important to implementation of
PowerT eaching?
3. How did teachers perceive school leader’s support during implementation of
PowerTeaching?
4. To what extent did teacher’s concerns about implementation and perceptions of
leadership support relate to variation in implementation of PowerTeaching?
Overview of Method
The mixed-methods study took place during the pilot year of a five-year i3 scale-
up grant awarded to three program partners (TCEP, SFAF, and CTE). Participants
included a nationwide sample of about 85 middle school math teachers, 8 school-based
PT coaches, 3 Success for All Coaches, 8 school leaders, and a limited number of district
and program personnel. As an exploratory mixed methods study, research included both
quantitative and qualitative measures and methods of analysis. Secondary data analysis
was completed using formative evaluation data from TCEP as well as measurements
from SFAF. Strategic individual interviews of a purposeful sample of program managers
helped provide context for the analysis and create a more complete picture of the results.
33
Measures included a teacher questionnaire, the SFAF School Snapshot, an observation
protocol, and numerous interview protocols.
Summary. The study explores the relationships between characteristics of teachers and
school leaders and variations in implementation of SFA’s PT middle school math reform.
Examining one of the first scale-up grants of its kind, the research here contains
information about the success of federal policy in driving educational research and
change. Ultimately, the main goal of this research was to understand how to help more
students learn math in the middle school years.
The structure of the remainder of the document is as follows: Chapter 2 is a
description of the methodology, Chapter 3 contains the findings of the study, and Chapter
4 is an interpretation of the results, discussion of their significance, and conclusion to the
narrative. Appendices including unpublished measures are provided.

34
CHAPTER 2: METHOD
The purpose of this mixed-methods study was to explore and describe factors that
teachers and school leaders, and project managers perceived to be influential in
implementation of a middle school math reform. A triangulation mixed-methods design
was used, and data from multiple, complementary sources were collected on the topic. A
teacher questionnaire was used to test the theory that teacher beliefs about team learning,
teacher levels of concern about PT, and teacher perceptions of school leader support
relate to variation in fidelity o f implementation (level of use) of the math reform.
Concurrently, qualitative interviews of teachers, school leaders, and project managers
explored the participants’ perceptions of factors influencing variation in implementation
of the program. Qualitative document analysis, interviews, and a scale on the
quantitative questionnaire were all used to measure and describe levels of use of the
middle school math implementation. Collecting both qualitative and quantitative data
combined the strengths of both methods. The in-depth nature of the qualitative
interviews and the ability to reach more individual participants with quantitative
questionnaires enriched the research project and allowed for a more complete portrait.
Research Questions
1. W h a t a r e t h e p r o j e c t m a n a g e r s ’ p e r c e p t i o n s o f v a r i a t i o n in
i m p l e m e n t a t i o n o f P o w e r T e a c h i n g ?
2. W h a t a r e l e a d e r s ’ p e r c e p t i o n s o f f a c t o r s i m p o r t a n t t o i m p l e m e n t a t i o n
o f P o w e r T e a c h i n g ?

35
3. H o w d i d - t e a c h e r s p e r c e i v e s c h o o l l e a d e r ’s s u p p o r t d u r i n g
i m p l e m e n t a t i o n o f P o w e r T e a c h i n g ?
4. T o w h a t e x t e n t d i d t e a c h e r ’s concerns a b o u t i m p l e m e n t a t i o n , b e l i e f s
a b o u t t h e i m p a c t o f t e a m l e a r n i n g o n s t u d e n t s , a n d p e r c e p t i o n s o f
l e a d e r s h i p s u p p o r t r e l a t e t o v a r i a t i o n in i m p l e m e n t a t i o n o f
P o w e r T e a c h i n g ?
Design
Mixed-methods methodology has become increasingly well defined over the
course of the last ten years (Johnson, Onwuegbuzie, & Turner, 2007; Johnson &
Onwuegbuzie, 2004; Onwuegbuzie & Leech, 2006). Earlier, throughout the 1990s, a
struggle between the quantitative and qualitative research paradigms tended to assign
priority to one method or to maintain the strict dichotomy between the two types of
research (Guba, 1990). Emerging as a third way, proponents of mixed-methods research
chose to pursue both intentionally. To understand the world more accurately and to
represent it precisely in research reports, both qualitative and quantitative data sources
are used to great advantage. Qualitative sources provide a richness and depth not usually
available with a quantitative measure, but quantitative measures offer the opportunity to
use wider samples and conduct predictive research or to make causal claims through
carefully constructed designs. Although common for decades in fields like evaluation or
health sciences, specific mixed-methods research methodology and journals are now
becoming more widely recognized in education. Depending on the question one is
addressing, one or the other approach might provide the best means to the end, or perhaps
both methods provide complementary information. Recommended prescriptions for
writing mixed-methods research questions and designing mixed-methods research are
now available, particularly by the Journal o f Mixed-Methods Research, and I have tried
to use these recommendations (Creswell & Plano Clark, 2007; Creswell, 2009;
Tashakkori & Creswell, 2007; Tashakkori & Teddlie, 2010; Teddlie, 2005). This is an
applied mixed-methods research project grounded in pragmatic philosophy (Ivankova,
Creswell, & Stick, 2006).
This mixed-methods study occurred during the spring of the pilot year of a five-
year i3 scale-up grant and focused on the level of use of PowerTeaching at the end of the
initial year of implementation. The grant was awarded to three program partners: The
Center for Educational Partnerships at Old Dominion University (TCEP), The Success
for All Foundation (SFAF), and the Center for Technology in Education at Johns
Hopkins University (CTE). TCEP researchers conducted research at multiple points in
time throughout the pilot year (Figure 6).
•SFAF trainedschool-based (SB)coaches
•SFAF trained teachers
•TCEP observed & administered questionnaire
•SFAFcoach observed and coached SB coach, completed snapshot
•TCEP observed, shadowed, interviewed, conducted nominal groups
•AM coaches andselected teachers attended annual SFAF conference
•TCEP conducted focus groups andinterviewed
• SFAF coachobserved and coached SB coach, completed snapshot
•TCEP observed, shadowed, interviewed, administered questionnaire
37
Figure 6. Phases of pilot year of TCEP research on PowerTeaching implementation.
This exploratory study included only data collected during or after the spring
phase of school visits. I employed a complex, concurrent mixed-methods design.
Initially, a QUANT and QUAL phase took place via data collection in each of the eight
middle schools. Another qualitative interview phase clarified and enhanced data from the
school visits. A final connecting phase allowed for coding and quantifying of data, early
data cleaning, and eventual analysis during which the overall research questions were
answered (Table 2). Because of the complex nature of the phenomena of implementation
and school change, a mixed methods approach was crucial to provide a comprehensive
analysis of the pilot year of study.
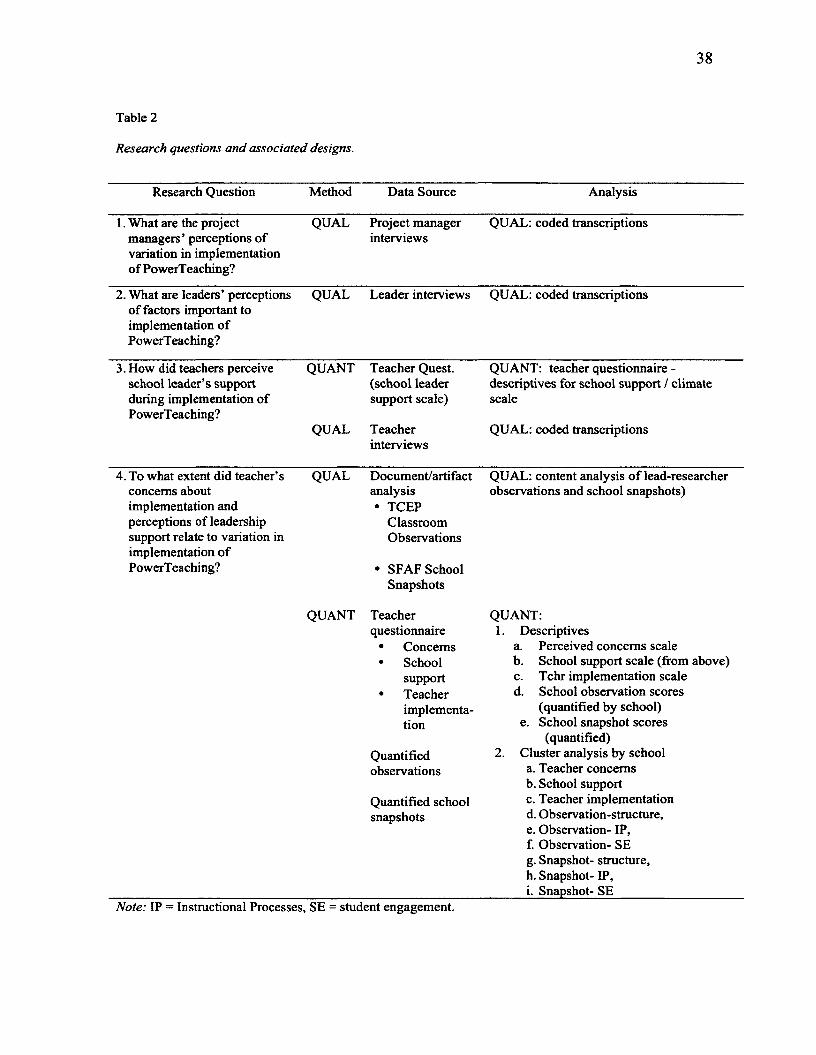
38
Table 2
Research questions and associated designs.
Research Question Method Data Source Analysis
1. What are the project managers’ perceptions of variation in implementation of PowerT eaching?
QUAL Project manager interviews
QUAL: coded transcriptions
2. What are leaders’ perceptions of factors important to implementation of PowerTeaching?
QUAL Leader interviews QUAL: coded transcriptions
3. How did teachers perceive school leader’s support during implementation of PowerTeaching?
QUANT
QUAL
Teacher Quest, (school leader support scale)
Teacherinterviews
QUANT: teacher questionnaire - descriptives for school support / climate scale
QUAL: coded transcriptions
4. To what extent did teacher’s concerns about implementation and perceptions of leadership support relate to variation in implementation of PowerTeaching?
QUAL Document/artifactanalysis• TCEP
Classroom Observations
• SFAF School Snapshots
QUAL: content analysis of lead-researcher observations and school snapshots)
Teacher QUANT:questionnaire 1. Descriptives
• Concerns a. Perceived concerns scale• School b. School support scale (from above)
support c. Tchr implementation scale• Teacher d. School observation scores
implementa (quantified by school)tion e. School snapshot scores
(quantified)Quantified 2. Cluster analysis by schoolobservations a. Teacher concerns
b. School supportQuantified school c. Teacher implementationsnapshots d. Observation-structure,
e. Observation- IP,f. Observation- SEg. Snapshot- structure,h. Snapshot- IP,i. Snapshot- SE
Note: IP = Instructional Processes, SE = student engagement.
39
Participants
During the pilot phase of the scale-up grant eight high-needs middle schools
participated in the PowerTeaching implementation. All math teachers in each school
participated in the PowerTeaching implementation. Participants in the sample of pilot
schools included 91 middle school math and inclusion math teachers, eight school
leaders, and two program personnel. Recruitment for participation in the pilot year of the
grant was completed in early 2012 and was influenced by grant regulations and the
project stakeholders. The entire population of high-needs middle-schools participating in
the pilot year of the grant (n = 8) participated in the initial year o f PowerTeaching scale-
up. Because the population of teachers was small during the pilot year, this
comprehensive sample of all math teachers and school leaders were included in the study
(Hays & Singh, 2011; Patton, 2002).
Teacher questionnaire and observations. The entire population of teachers
participating in all schools (n = 91) were asked to fill out the questionnaire during the
spring 2013 TCEP school visit and were included in TCEP classroom observations
during the visit. Eighty-five teachers completed and returned the questionnaire resulting
in a response rate of 93.4%. All teachers were also included in semi-structured classroom
observations by TCEP researchers. During spring school visits the nine researchers
conducted observations with two researchers observing in each of the eight schools. A
few teachers were excluded due to illness or standardized testing on the day of the school
visit, but 52 classroom observations were conducted.
Interviews. The entire population of school leaders (w = 8) were interviewed by
TCEP researchers using a semi-structured protocol during the spring school visit.
Individual teacher interviews were also conducted during the school visits. Because the
population of teachers was too large to complete interviews for each participant, a
stratified, purposeful sample of three teachers from each school was selected (n = 24)
with the assistance of the school-based PT coach. The coach identified three teachers in
each school who had differing levels of implementation: emergent, routine, and
proficient in a manner similar to Datnow and Castellano’s study (2000). In addition to
these interviews occurring during the spring school visit, both project managers that
participated in the grant process from recruitment through the first year of the grant were
interviewed after the conclusion of all spring school visits.
Measures
Teacher Questionnaire. A 70 item spring questionnaire was administered
during the spring TCEP visit of the school year (Appendix A). Because it was easy to
distribute and collect in during the school visits, anonymous paper-and-pencil surveys
were used. A standardized protocol was followed including distribution of an informed
consent notification and reminding participants that they were not required to complete
the survey. Questionnaire data was entered immediately after collection and digital files
were stored in a secure file on a computer that was only accessible to participating
researchers.
The participating teacher questionnaire was composed primarily of closed-ended
questions with a four-level Likert-style response scale o f agreement and included two
open-ended questions. The program theory guided construction of the questionnaire, as
augmented by requests from the stakeholders, in creating a blueprint used for item
construction. Because of concerns with respect to response burden, the number of items
41
for the questionnaire was limited for each scale. To enhance psychometric properties of
the questionnaire, enough items were written to allow a few items to be cut after pilot
testing in order to retain a minimum of three items per scale.
Most items were piloted in a fall questionnaire before inclusion in the spring
version, the basis of this research. The scales from the fall questionnaire were
reevaluated based upon expert review, psychometric validation, and stakeholder needs
before creating the spring questionnaire. Where reasonable, an attempt was made to keep
scales constant in order to complete longitudinal research, but where warranted, scales
were revised, added, or removed based on the needs of the stakeholders and the reliability
of the initial scale.
Four scales on the spring questionnaire were used for the quantitative sections of
this study. First, a levels of concern scale was used to measure the intensity of teachers’
concerns about the PowerTeaching implementation. It was based on a modified version
of the SoCQ from CB AM and the number of subscales (originally seven) was reduced to
four according to other validation studies (Bailey & Palsha, 1992; Cheung, Hattie, & Ng,
2001). Second, a scale measuring teacher beliefs about the impact of team learning on
students (both socially and academically) was based on a review of the literature. Third,
a scale measuring teachers’ perceptions of school leader support was created based on
literature review and in discussion with stakeholders. Finally, a scale measuring
teachers’ level of implementation of PowerTeaching was based on the school snapshot
objectives and their prioritization for implementation as described in the SFAF teacher
peer-observation form located in the Administrative PowerTeaching handbook (Success
for All Foundation, 2012).
42
Interviews. Standardized semi-structured interviews were conducted with the
project managers (see blueprint, Table 3). Interviews lasted approximately 40 minutes
and used a protocol that allowed for cross-interviewee analysis (see Appendix B). A
principal goal of the interview was to ascertain multiple viewpoints describing
implementation levels for the different schools. A second goal was to discover factors
that might have impacted variability in that implementation. The project managers had a
unique perspective to offer in that they had been involved in each school district since the
award of the grant and participated in the recruitment process. Participants were asked to
describe each school in light of its implementation level - whether proficient, routine, or
emergent adoption of the PowerTeaching program. Proficient schools were described as
having moved beyond “mechanical” stages of implementation at a school-wide level
according to the CBAM levels of use. Emergent schools were those schools who were
still struggling with achieving the “mechanical” level of use in a school-wide manner -
substantive pieces of the program were still missing or substantive portions of the staff
were not yet implementing. Routine schools were those that had perhaps achieved the
“mechanical” level of implementation but had not moved beyond that point.
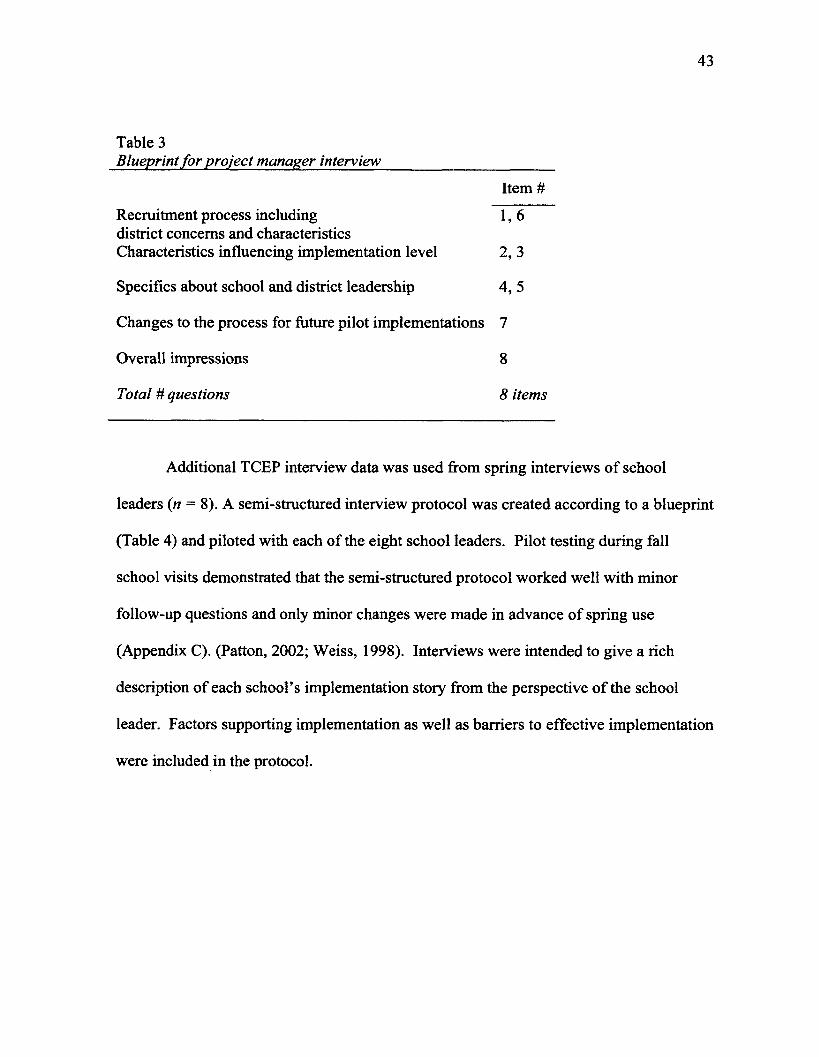
43
Table 3Blueprint for project manager interview
Item #
Recruitment process including 1, 6district concerns and characteristicsCharacteristics influencing implementation level 2, 3
Specifics about school and district leadership 4, 5
Changes to the process for future pilot implementations 7
Overall impressions 8
Total # questions 8 items
Additional TCEP interview data was used from spring interviews of school
leaders (n = 8). A semi-structured interview protocol was created according to a blueprint
(Table 4) and piloted with each of the eight school leaders. Pilot testing during fall
school visits demonstrated that the semi-structured protocol worked well with minor
follow-up questions and only minor changes were made in advance of spring use
(Appendix C). (Patton, 2002; Weiss, 1998). Interviews were intended to give a rich
description of each school’s implementation story from the perspective of the school
leader. Factors supporting implementation as well as barriers to effective implementation
were included in the protocol.
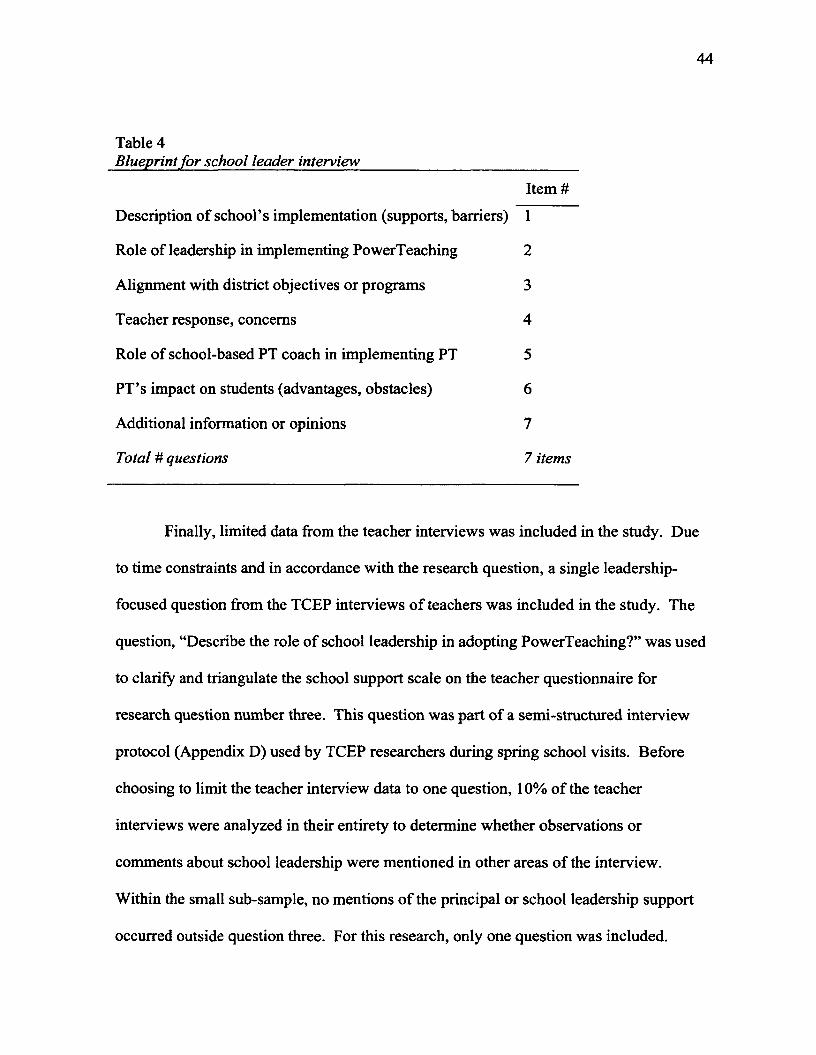
44
Table 4Blueprint for school leader interview________ _________________
Item #
Description of school’s implementation (supports, barriers) 1
Role of leadership in implementing PowerTeaching 2
Alignment with district objectives or programs 3
Teacher response, concerns 4
Role of school-based PT coach in implementing PT 5
PT’s impact on students (advantages, obstacles) 6
Additional information or opinions 7
Total # questions 7 items
Finally, limited data from the teacher interviews was included in the study. Due
to time constraints and in accordance with the research question, a single leadership-
focused question from the TCEP interviews of teachers was included in the study. The
question, “Describe the role of school leadership in adopting PowerTeaching?” was used
to clarify and triangulate the school support scale on the teacher questionnaire for
research question number three. This question was part of a semi-structured interview
protocol (Appendix D) used by TCEP researchers during spring school visits. Before
choosing to limit the teacher interview data to one question, 10% of the teacher
interviews were analyzed in their entirety to determine whether observations or
comments about school leadership were mentioned in other areas of the interview.
Within the small sub-sample, no mentions of the principal or school leadership support
occurred outside question three. For this research, only one question was included.
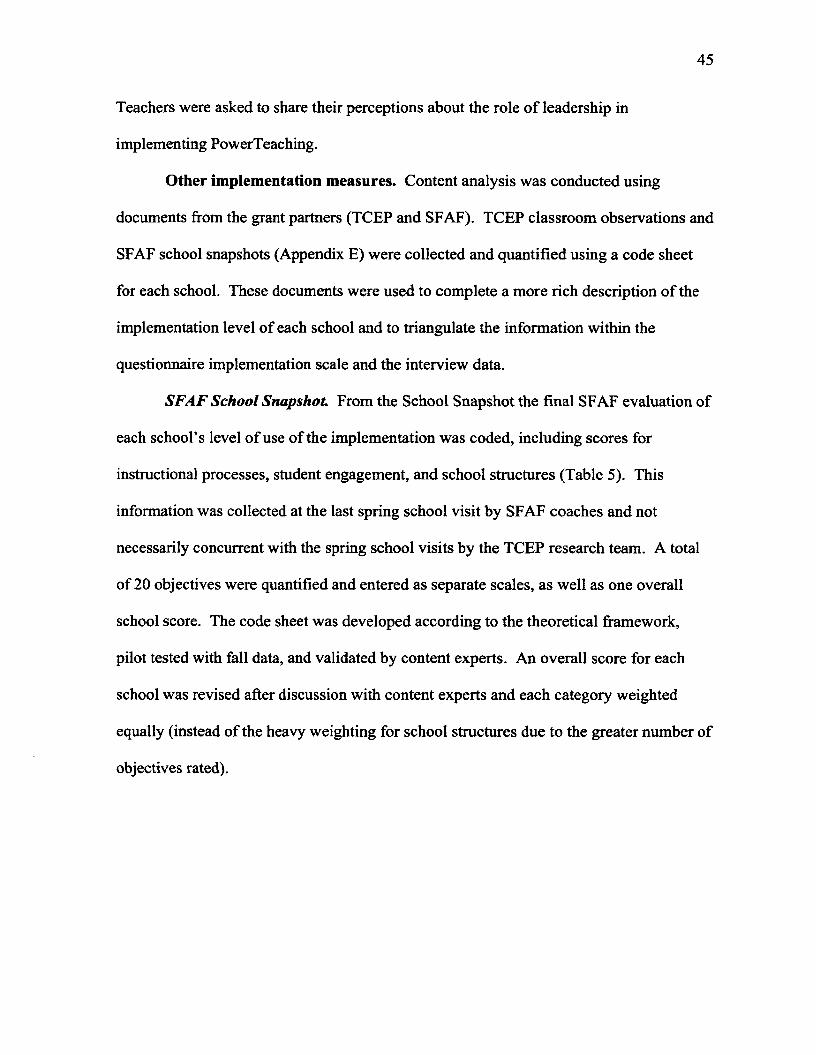
45
Teachers were asked to share their perceptions about the role of leadership in
implementing PowerTeaching.
Other implementation measures. Content analysis was conducted using
documents from the grant partners (TCEP and SFAF). TCEP classroom observations and
SFAF school snapshots (Appendix E) were collected and quantified using a code sheet
for each school. These documents were used to complete a more rich description of the
implementation level of each school and to triangulate the information within the
questionnaire implementation scale and the interview data.
SFAF School Snapshot From the School Snapshot the final SFAF evaluation of
each school’s level of use of the implementation was coded, including scores for
instructional processes, student engagement, and school structures (Table 5). This
information was collected at the last spring school visit by SFAF coaches and not
necessarily concurrent with the spring school visits by the TCEP research team. A total
of 20 objectives were quantified and entered as separate scales, as well as one overall
school score. The code sheet was developed according to the theoretical framework,
pilot tested with fall data, and validated by content experts. An overall score for each
school was revised after discussion with content experts and each category weighted
equally (instead of the heavy weighting for school structures due to the greater number of
objectives rated).
46
Table 5Blueprint: Quantifying o f SFAF school snapshots
# points
School structures (11 objectives) 55
Instructional Processes (5 objectives) 25
Student Engagement (4 objectives) 20
TCEP Classroom Observations. During spring school visits by pairs of TCEP
researchers, classroom observations were conducted using a structured, open-ended
observation protocol (Appendix F). For this study, each classroom observation by that
school’s lead researcher was scored (1 observation per classroom), using a code sheet, in
terms of instructional processes, student engagement, and classroom structures related to
PowerTeaching (Appendix G). Observations included many open-ended field notes that
were included and coded as well. The code sheet was developed using the SFAF levels
of use framework, pilot tested on fall observation data, and then reviewed and validated
by content experts. Points were awarded in coding each category (Table 6); categories
were evenly weighted and percentages used to report classroom scores. Each classroom
score was aggregated together with other classrooms in the school to form a school
observation score for each category. An overall school implementation score was also
calculated by averaging the observation scales at the school-level. All scores were based
on percentages in order to account for the uneven number of classrooms in each school.
Inter-rater reliability of 87% agreement was calculated based on a 10% sampling of
observations across each school.
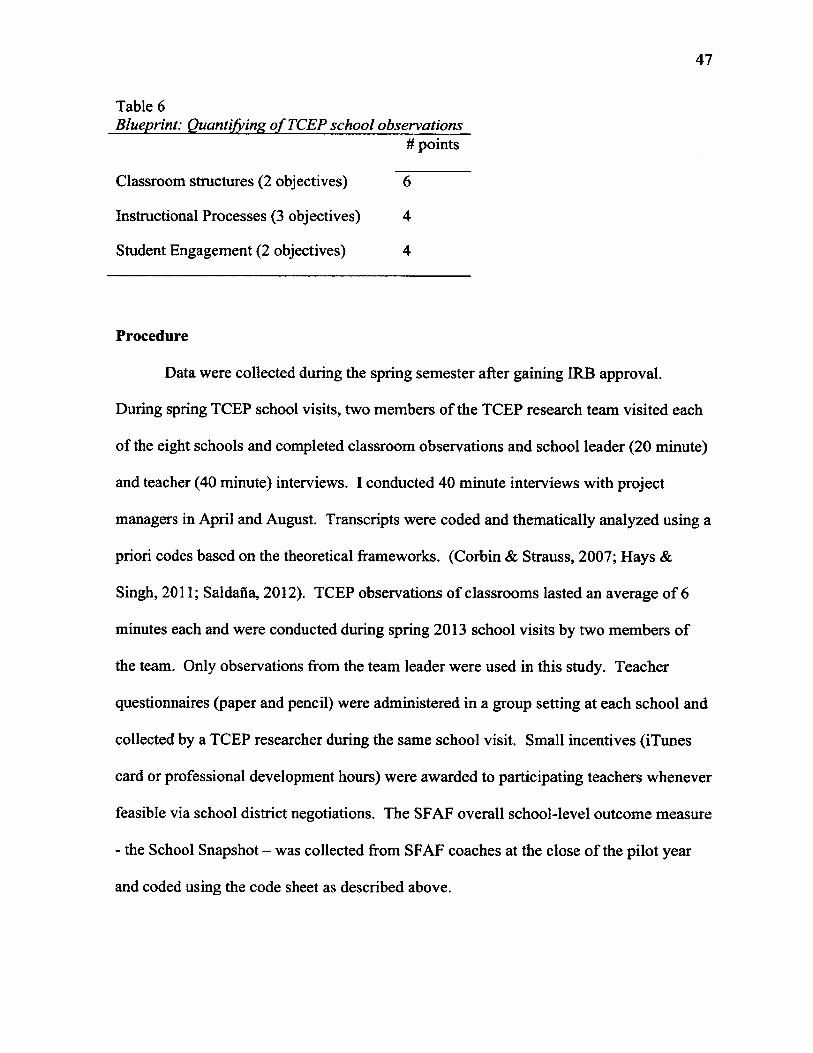
47
Table 6Blueprint: Quantifying o f TCEP school observations
# points
Classroom structures (2 objectives) 6
Instructional Processes (3 objectives) 4
Student Engagement (2 objectives) 4
Procedure
Data were collected during the spring semester after gaining IRB approval.
During spring TCEP school visits, two members of the TCEP research team visited each
of the eight schools and completed classroom observations and school leader (20 minute)
and teacher (40 minute) interviews. I conducted 40 minute interviews with project
managers in April and August. Transcripts were coded and thematically analyzed using a
priori codes based on the theoretical frameworks. (Corbin & Strauss, 2007; Hays &
Singh, 2011; Saldana, 2012). TCEP observations of classrooms lasted an average of 6
minutes each and were conducted during spring 2013 school visits by two members of
the team. Only observations from the team leader were used in this study. Teacher
questionnaires (paper and pencil) were administered in a group setting at each school and
collected by a TCEP researcher during the same school visit. Small incentives (iTunes
card or professional development hours) were awarded to participating teachers whenever
feasible via school district negotiations. The SFAF overall school-level outcome measure
- the School Snapshot - was collected from SFAF coaches at the close of the pilot year
and coded using the code sheet as described above.
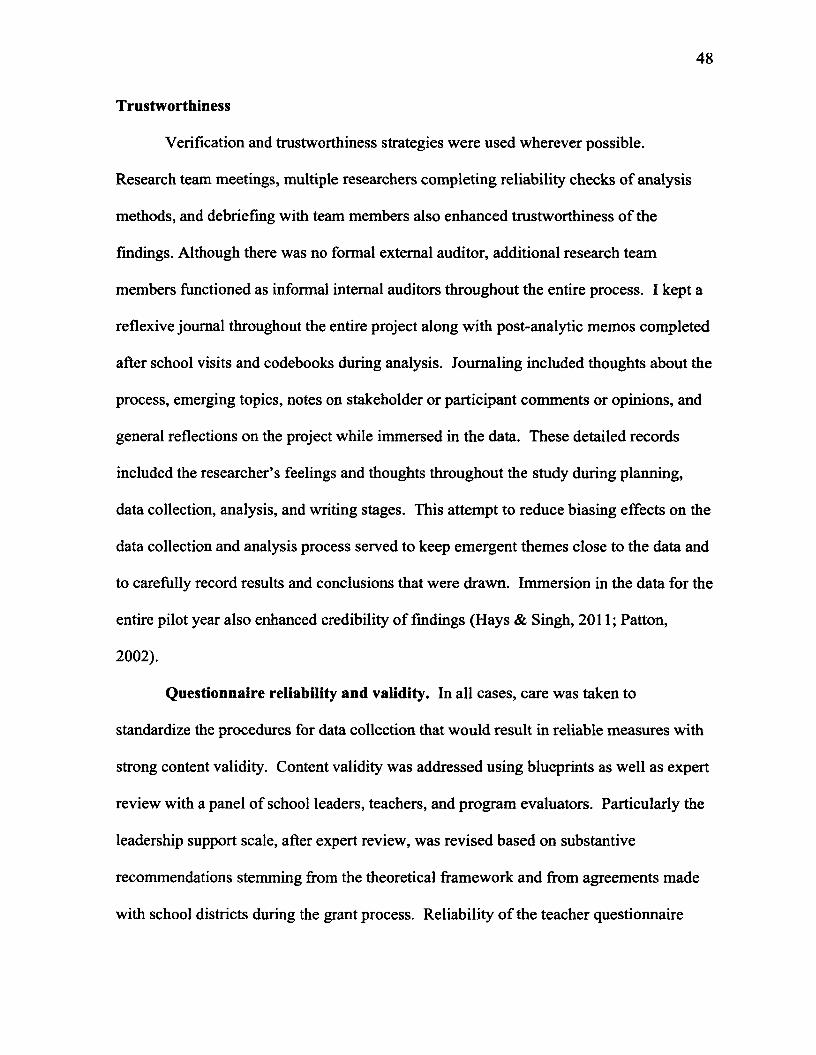
48
T rustworthiness
Verification and trustworthiness strategies were used wherever possible.
Research team meetings, multiple researchers completing reliability checks of analysis
methods, and debriefing with team members also enhanced trustworthiness of the
findings. Although there was no formal external auditor, additional research team
members functioned as informal internal auditors throughout the entire process. I kept a
reflexive journal throughout the entire project along with post-analytic memos completed
after school visits and codebooks during analysis. Journaling included thoughts about the
process, emerging topics, notes on stakeholder or participant comments or opinions, and
general reflections on the project while immersed in the data. These detailed records
included the researcher’s feelings and thoughts throughout the study during planning,
data collection, analysis, and writing stages. This attempt to reduce biasing effects on the
data collection and analysis process served to keep emergent themes close to the data and
to carefully record results and conclusions that were drawn. Immersion in the data for the
entire pilot year also enhanced credibility of findings (Hays & Singh, 2011; Patton,
2002).
Questionnaire reliability and validity. In all cases, care was taken to
standardize the procedures for data collection that would result in reliable measures with
strong content validity. Content validity was addressed using blueprints as well as expert
review with a panel of school leaders, teachers, and program evaluators. Particularly the
leadership support scale, after expert review, was revised based on substantive
recommendations stemming from the theoretical framework and from agreements made
with school districts during the grant process. Reliability o f the teacher questionnaire
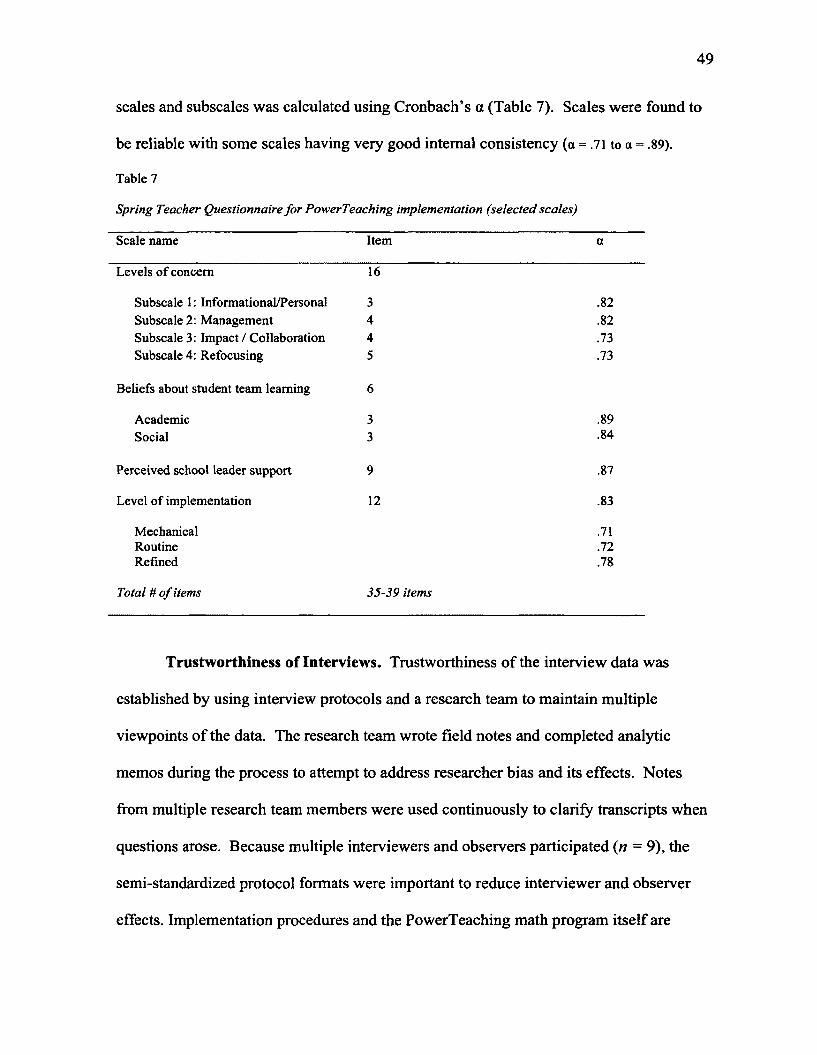
49
scales and subscales was calculated using Cronbach’s a (Table 7). Scales were found to
be reliable with some scales having very good internal consistency (a = .71 to a = .89).
Table 7
Spring Teacher Questionnaire for PowerTeaching implementation (selected scales)
Scale name Item a
Levels of concern 16
Subscale 1: Informational/Personal 3 .82Subscale 2: Management 4 .82Subscale 3: Impact / Collaboration 4 .73Subscale 4: Refocusing 5 .73
Beliefs about student team learning 6
Academic 3 .89Social 3 .84
Perceived school leader support 9 .87
Level of implementation 12 .83
Mechanical .71Routine .72Refined .78
Total # o f items 35-39 items
Trustworthiness of Interviews. Trustworthiness of the interview data was
established by using interview protocols and a research team to maintain multiple
viewpoints of the data. The research team wrote field notes and completed analytic
memos during the process to attempt to address researcher bias and its effects. Notes
from multiple research team members were used continuously to clarify transcripts when
questions arose. Because multiple interviewers and observers participated (n = 9), the
semi-standardized protocol formats were important to reduce interviewer and observer
effects. Implementation procedures and the PowerTeaching math program itself are
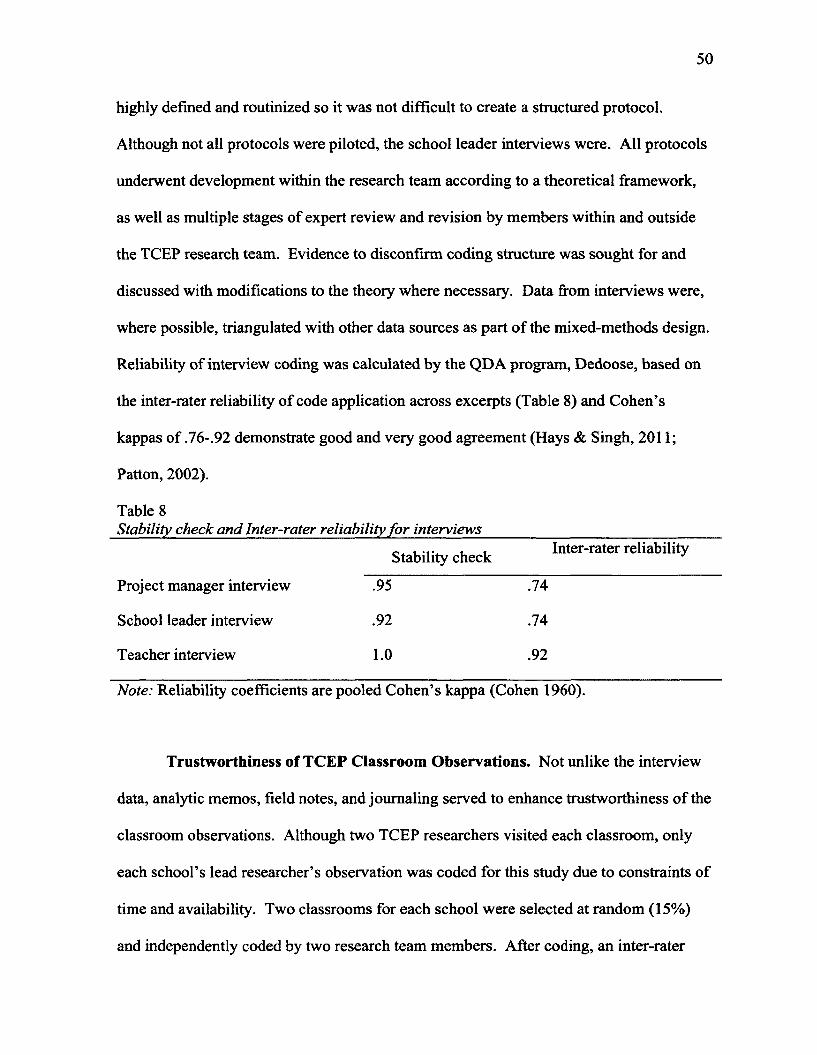
50
highly defined and routinized so it was not difficult to create a structured protocol.
Although not all protocols were piloted, the school leader interviews were. All protocols
underwent development within the research team according to a theoretical framework,
as well as multiple stages of expert review and revision by members within and outside
the TCEP research team. Evidence to disconfirm coding structure was sought for and
discussed with modifications to the theory where necessary. Data from interviews were,
where possible, triangulated with other data sources as part of the mixed-methods design.
Reliability of interview coding was calculated by the QDA program, Dedoose, based on
the inter-rater reliability of code application across excerpts (Table 8) and Cohen’s
kappas of .76-.92 demonstrate good and very good agreement (Hays & Singh, 2011;
Patton, 2002).
Table 8Stability check and Inter-rater reliability for interviews_____________________________
Stability check Inter-rater reliability
Project manager interview .95 .74
School leader interview .92 .74
Teacher interview 1.0 .92
Note: Reliability coefficients are pooled Cohen’s kappa (Cohen 1960).
Trustworthiness of TCEP Classroom Observations. Not unlike the interview
data, analytic memos, field notes, and journaling served to enhance trustworthiness of the
classroom observations. Although two TCEP researchers visited each classroom, only
each school’s lead researcher’s observation was coded for this study due to constraints of
time and availability. Two classrooms for each school were selected at random (15%)
and independently coded by two research team members. After coding, an inter-rater
51
reliability check was performed which showed 87% agreement demonstrating that the
measure was reliable.
Protection of rights
Human subjects approval was obtained from the university institutional review
board in advance of research. Participants were given notifications stating their risks and
benefits before interviews, observations, or questionnaires were administered. Data from
all interviews, observations, and questionnaires were stored electronically on a secure
drive accessible only to grant researchers. SFAF School Snapshots to be used for
secondary data analysis were transferred electronically to the same secure database.
Identifiers were coded or removed. Printed copies of data used for coding and analysis
had identifiers removed and were kept in secure cabinets. Electronic copies of data
within QDA program for coding and analysis had identifiers removed and were
password-protected and stored in encrypted files on a secure drive fully accessible only to
myself and partially accessible to the team of researchers who participated in inter-rater
reliability checks.
52
CHAPTER 3: RESULTS
Results for this mixed-methods exploratory study will be organized here by
research question. To begin each section, analysis methods as well as themes, categories,
and patterns from all data sources will be described (Figure 7). The theoretical
framework around which the categories were developed was based on the literature
discussed in chapter one, particularly the leadership literature that posited three main
roles of the school leader that impact achievement: 1) focus on a unified vision and
commitment to change, 2) the importance of building relationships with actors involved
in the change including a willingness to give and take feedback, and 3) the necessity of
marshaling resources whenever necessary, whether they be needed people, time, or
equipment to facilitate the implementation of the reform (Datnow & Castellano, 2001;
Leithwood et al., 2009; Robinson et al., 2008; Waters et al., 2003). These all can occur at
district, school, and even classroom levels, but for this chapter they have been organized
by factor within each research question, and not by domain. Where appropriate, teacher-
level factors are described, such as beliefs about the impact of team learning on students’
academic achievement and social skills (Rowan-Kenyon et al., 2012; Slavin & Karweit,
1984; Tracey, Madden, & Slavin, 2010), concerns about the implementation and “buy-in”
to the reform, and lastly, teacher perceptions of the level of support provided by the
school leadership (Bol et al., 2002; Datnow & Castellano, 2000; Geijsel et al., 2001;
Nunnery et al., 1997; Pedersen & Liu, 2003). Common themes are certainly present
across individuals, however unique themes also emerged for different individual actors
interviewed.

53
Teacher Questionnaire (n = 85; TCEP)
Teacher Interview (n = 24; TCEP)
Teacherconcerns Project manager
interviews (n = 2; EHCarhart)
School leader interviews (n = 8; TCEP)
Teacherbeliefs
Principalsupport
School snapshot (n = 8; SFAF)Implementation
levelClassroom observations (n =; TCEP)
Figure 7: Findings from multiple measures as sources of information
RQ 1: Project Manager Perceptions of Variation in PT Implementation
The two project managers had a unique vantage point of the pilot year
implementation, having been involved from recruitment through the entirety of the first
year of implementation. Prominent factors that arose from discussion with the project
managers were the importance of a unified vision and commitment to change at all levels
of the school system, a strong relationship between the actors responsible for
implementation, and a detrimental lack of resources, most especially a lack of stable
individual actors in positions of leadership and highly qualified teachers of math.
Two interview transcriptions were analyzed to answer this question. Interviews
were analyzed based on naturalistic inquiry with an emergent design. Descriptive codes
were used during early data analysis within a process of constant comparison to refine
codes and infer conclusions according to grounded theory methods using techniques of
54
progressive coding. Memos and process journals were kept during all stages of analysis
(Corbin & Strauss, 2007; G. R. Gibbs, 2005; Hays & Singh, 2011; Saldafia, 2012). In
■this recursive process, axial codes were crafted a s th ey emerged
from earlier noted p a ttern s in -the da ta with existing a priori
categories from the literature. A codebook was maintained th a t
described the process, noting both codes and emerging patterns,
but also areas of overlap and discrepancy.
More specifically, th e transcribed interview data were divided into units of
analysis (excerpts) based on meaning - each unit contained one main idea. These main
ideas were initially coded with terminology that closely represented the speaker’s words.
Eventually, these initial codes were combined into descriptive categories. Each textual
unit could be coded with one or more categories depending on the ideas within that unit
or excerpt. Ultimately, and with the theoretical framework in mind, a hierarchy of codes
was created. These code categories were organized into a codebook that was used by the
researchers and tested for inter-rater reliability, as well as stability. Due to the nature of
the sample (relatively small, based on access and membership as participant in the
project) it should not be assumed that saturation was reached. Certainly, many themes
were stated in a redundant manner, but the topic is complex and it can be assumed that if
a few more individuals were added new themes might come to light. A fter initial
rounds of analysis had been completed, an online qualitative data
analysis (QDA) package (Pedoose.com) was used. The QDA software was
used only for latter stages of coding, for reliability checks, and to aid in sorting and in
initial analysis.
55
Unified vision and commitment to change
The most prominent factor in these interviews was that the school system needed
to exhibit a clear intent to pull together all the actors and to implement PT with a unified
message and consistent vision.
And for it to be successful, all of those program elements need to be in place, so
it’s the district who knows that, who appreciates that, who is willing to
acknowledge where, within their own system, they need work... and just being
open to trusting a system that has been proven to be effective. If things don’t go
well initially, that’s ok. As long as they maintain the vision and the support and
not join the people who are trying to jump ship then that’s ok. (Project manager
2)
Some schools in the pilot program did not have their leadership network aligned. In these
cases, the project managers saw a clear connection between having multiple weak spots
in the system and a lack of mandate with schools that were at the lowest level of
implementation.
.. .unfortunately when it comes to those types of schools, it was more than just
one system that was pulling them down. From the school-based coach, to the
school leader, to the teachers, I mean there was a whole slew of things, you know
nobody was really committed and keeping the vision of the program. (Project
manager 2)
Resources needed to affect change
Lack of stability in district and school leadership frustrated project managers’
efforts. Turnover was a problem: during the grant process and pilot year, one district had
56
three different superintendents. Drawing attention to the “tremendous turbulence” within
leadership and pointing out the consequences of staff turnover, one project manager
stated:
So that compromised our ability right out of the gate. So there’s really no
reflection, per se, on the principals or teachers, or even district administrators that
are involved - it was just because the head was cut off of the beast tw ice,... so
that context really was not helpful.
Excessive turnover resulted in communications problems, frustrating delays in
procurement of resources, and damaged relationships and lack of trust from the initial
stages of the project. Some teachers did not know about the reform until the week before
school started. One project manager observed that it took the first six months of the
project just to make it past the third stage of concern (regarding personal impact) - when
ideally teachers implementing the reform would begin the school year already at the
fourth stage. Delays, broken relationships, and serious communication issues influenced
fidelity of implementation across schools.
Relationship between actors and feedback about implementation
Not only on the level of school leaders, a lack of stable individuals at any point in
the system resulted in lower levels of implementation. One project manager discussed a
lack of communication between the actors in the schools so profound that the principals
and math coordinators found out about PowerTeaching implementation only in June, two
months before the PowerTeaching reform was to begin and after the teachers were gone
for the summer (Project manager 1). District plans and scope and sequence had already
57
been freshly revised for the following year and professional development plans already
shaped before school leaders knew anything about PT.
In rural schools, unstable relationships were seen to be less of a problem. Rural
districts often only have one middle school and frequently have no other competing grant
programs within the district. In some cases the district leadership knows individual
teachers within the school due to the tight-knit nature of the rural community. In rural
districts, observed one project manager,
.. .the other thing is the communications flow much more quickly and there’s an
awareness at the superintendent level of everything that’s going on in the schools
because they have so few schools to actually worry about. So I think that
visibility, the prestige, the lack of reform burnout, and the ready communications
in the smaller districts made everything go more smoothly. (Project manager 1)
In addition to effective communication from top to bottom, the willingness of the
principal to build relationships with teachers but still hold teachers accountable to
implementation was seen as an important variable in school-level implementation.
I think being willing to constructively confront teachers who were resisting or in a
pro forma adoption, those who were willing to take the time to really learn about
the program, and so I mean we’ve had both sides. We’ve had those that didn’t
understand but were sort of cracking the whip, and maybe not in the most
constructive way because they only had limited understanding, and that was
associated with clusters of teachers doing it and clusters not. Like the teachers
who could sort of figure it out on their own and could sense that the principal

58
thought it was important for them to do but maybe wasn’t giving them the most
constructive feedback... But we also had a principal who was very well familiar
with the program b u t ... probably [had an] overall weaker teaching staff, and also
was maybe less inclined to engage teachers constructively with constructive
criticism... [the principal was] afraid of the teachers. (Project manager 1)
Lastly, with respect to the importance of relationships, project managers insisted
on the importance of the interaction between the school-based coach and the principal.
As part of the grant and to assist in developing strong implementation of such a complex
framework, schools were provided a school-based coach to assist teachers, ease the
transition, and model the new PT strategies. In some cases the coaches taught a math
class, in some cases they were full time employees and in other places only part time.
These factors were mentioned less often than the ability of the coach to carve out a
specific role and build relationships with the school leader and teachers.
Really, the principal and the coach should be good-cop, bad-cop. The coach
should be that good cop and the principal should be the one holding the teachers
accountable... If a teacher says that they have this goal and it’s a realistic goal
that they’ve established with their team or with their school-based coach and
they’re not living up to that goal, then the principal needs to come in and have
that accountability piece in play, because ultimately they are the ones who can do
that. The coach is not there to hold teachers accountable in that perspective.
They can set up systems so that there is peer accountability, but ultimately they do
not evaluate teachers in any kind of way that would give them that influence over

59
their wanting to do this. Principals can make this a requirement. And the coach
can come in and show how these systems can eliminate the stress of this
requirement. (Project manager 2)
In an observation that combines this idea of coach relationship with the importance of
unified vision, one project manager discussed the coach’s ability to help direct the
different actors effectively implement the reform.
I think that [school 7] after they got their coach, became very quickly a routine
school. In fact I could see them becoming very proficient because of their school
coach. That was the missing link in those systems. I mean [the coach] really
came in and was able to really align all of those systems. (Project manager 2)
Teacher concerns and relationships with teachers
One problem noted by the project leaders was that the grant began so quickly that
obtaining buy-in was virtually impossible, particularly at the school or teacher level. The
timing of the grant required schools to commit to participation while the program was
still being developed. In a few schools there were “awareness” sessions for teachers and
school leaders similar to SFAF traditional practices, but these sessions were impossible
for some pilot year schools.
“Because the window of time ... was very, very limited. And so there was not an
opportunity to really get stakeholder buy-in at the school level.” ... “In [some
schools] we were able to arrange awareness sessions ... starting in January right
after the award and ... so the teachers early on had some awareness but in [a large
district] the teachers pretty much didn’t know until it was time for them to show
up. (Project manager 1)

60
Another look at the pilot year and obtaining buy-in also pointed to grant factors as getting
in the way of a carefully structured program:
I think with the pilot year itself, I think if we were ever to do it again, we should
have developed proper relationships with school districts and, you know, looking
at concems-based adoption model, typically we go in at level three which is
mechanical. They’ve already bought into the program, they already knew what
they were getting themselves in for. I think a lot of the initial part of the pilot
year was going through the first phases of the concems-based adoption model and
I don’t think in many places, outside of the proficient schools, I don’t think in
many places we got to mechanical until the second half of the year... until these
people knew that we weren’t going away, you know here we show up once or
twice a month. You know, it’s that relationship building that we had to play
catch-up on because it was never done prior to the awarding of the grant. But like
I said, I think that’s just the nature o f the grant. You sign up and your odds of
getting the grant are a lot less than not getting the grant, so most school districts
are willing just to say, “sure”, but not necessarily realizing what comes along for
the ride if you get the grant. (Project manager 2)
Clearly the grant process made it impossible to gain the teacher buy-in that SFAF’s
implementations usually have before embarking on the implementation journey. Both
project managers discussed this as a negative influence on implementation.
Unique themes from the project manager interviews.
The most prominent factor seen in the project manager interviews was the
importance of a shared vision or clear commitment to change. A willingness to continue
61
working toward an area of focus, to bring other members of the school community along
with them, and a willingness by school leaders to provide resources and build the
relationships necessary for achieving a common goal was seen as an important factor for
successful implementation.
The importance of the school-based coach was a second strong theme across the
project manager interviews. The coach was important not only in assisting teachers,
providing resources, or copying handouts, but also in helping all the actors to see the
common vision and work toward it. Whether with respect to vision, resources, or
relationships, even teacher concerns and beliefs, the coach had the ability to affect
change. The consistent presence of a coach was seen to be a primary factor in successful
implementation.
RQ 2: School Leader Perceptions of Factors Important to PT Implementation
The interviews with principals at each of the 8 schools were rich sources of
information. Interviews were coded a few at a time as they were transcribed. This
provided an opportunity for a coding process similar to the one used in research question
one. Many of the same factors were identified by school principals as by project
managers, but for this research question one additional category was added - that of
standardized accountability testing.
A unified vision and commitment to change
A common theme in school leader interviews was the alignment of school and
district programs. Prompted by the phrasing of one question on the protocol, every leader
discussed the alignment (or lack thereof) with PowerTeaching and the district’s own
programs. Many principals found it frustrating to try to combine the district initiatives
62
with PT goals, and when combined with staff turnover and shortage of time it was
increasingly frustrating.
Well, I tried to be active with it. I will say at the beginning I was very much
involved. This year has been, for us in the district, with new teacher evaluations
and everything and all the new initiatives, I can’t say that once we hit about
March that I had as much hands-on involvement as I did. Just running out of
time. Yeah, it just.. .trying to balance the administration piece. That is just one
subject area for me and trying to hit all the meetings and go to the component
meetings and then still do the other subject pieces. It is a really tough balancing
act. Time and then like I said we had a new Superintendent and a lot of other new
initiatives so it was time constraints were really tough for me this year. (School 6)
Where the principal of school 6 found the introduction of a new superintendent disruptive
to implementing PT, the principal of a different school in the same district appeared to
find the new superintendent supportive and new district initiatives as aligning with theose
of the PowerTeaching reform.
We have a brand new superintendent and his very first power point that he put out
there was about the cycle of results. [The superintendent] talks about teachers
know what to teach, they're implementing best practices to teach them, they're
assessing them, they're analyzing data, and they're reteaching, reassessing, and it's
a cycle. So, when you think about power teaching and you think about assessing,
you think about those checks for understanding all the time. You're talking about
a lot of different strategies that definitely fall in line. (School 8)
63
A third principal proudly noted a diverse group of initiatives within another district that
might help build a stronger school. “I have a lot of initiatives on this campus. STEM
program is starting up. I have a lot of initiatives that are happening right now on this
campus because basically I want this campus to go from good to great.” (School 1)
Clearly among school leaders, there was no consensus about whether multiple district
initiatives were good or bad, nor even consensus about whether or not multiple initiatives
were at play.
At the school level, a clear mandate to implement PT was stated in some schools.
In school 5, the principal consciously chose to present a clear message to the staff from
the beginning.
We talk sometimes that you sometimes have to make the change before you
become a believer. You can preach about it forever and it doesn’t necessarily
change anything so sometimes just saying we are going to do it and then see what
happens. There were a couple of us.. .you bring the data to me to show that what
you were doing was successful and we will sit and talk about it, but otherwise
right now this is what we are going to do. (School 5)
Some principals made a clear commitment to PT only later in the year, for whatever
reason. At school 7, the school-based coach started mid-year and that was perceived to
be a turning point.
Well, when we go and do full observations, we write-up what is going on with
PowerTeaching. Every fall observation that we have written up for our math
teachers, especially after [the school-based coach] has gotten here. The teacher
has been incorporating PowerTeaching and the teacher has a new unit on random

64
reporter. Teacher has been rewarding points. We don’t just talk about it, but we
actually put it in their formal documentation. I think once you put it in the formal
documentation it becomes a binding legal document. The teachers understand
that it is kind of non-negotiable. We are utilizing this so we have got to embrace
it. You know one of the things that we try to emphasize with our teachers is that
we are not incorporating this because it is non-negotiable, but it is here and we are
going to use it and we are going to embrace it and try to do a better job of
facilitating a classroom of collaborative learning. (School 7)
Another school whose principal didn’t believe it was important to have all the teachers
using the same method stated, “I don’t think we have become an i3 school. I’ve been
trying to get everyone to do Kagan for years and I don’t think I’m fully a Kagan
school.... and maybe never will be.” This principal encouraged the teachers to use
PowerTeaching as one strategy among many in the “tool box.” That school showed a
lower level of implementation (school 4). A principal’s choice about how to present the
implementation effort - whether committed to a strong unified vision, open to
PowerTeaching as one reform among many, or critical of the reform effort influenced
implementation levels.
Providing resources to implement PowerTeaching
Factors that related to both district level and school level resources were common.
Concerns about the district scheduled PT training, its proximity to the school year, timely
hiring of school coaches, procurement of the iPads, teacher training, and coach
assignment were the most common factors mentioned at the district level. Responding to
a question about what would facilitate faithful implementation o f the reform, the

65
principal from school 8 noted, “I think having a math coach at the very beginning.
Having the resources. I know we’re supposed to have iPads at the very beginning. We
didn't get those until a couple of months ago basically.” Another principal openly
questioned, “My biggest concern, and I am going to put it out there, is not knowing
whether we are going to have a full-time math coach next year.”
Taken as a whole, resources were understood by school leaders as being an
important factor affecting fidelity of implementation at the school level. School leaders
perceived that highly qualified teachers were an important factor. The two factors most
often mentioned were time (professional development, planning time, class time) and the
availability of coaching. At school 2 the principal brought up their math class time of 47
minutes a day and commented, “Well, I just think the biggest factor there is to find out
what that, what is the right amount of time that is needed. Right now, that is the biggest
obstacle.”
Relationship building during implementation
At the district level discussions of relationships and feedback were less common
than among teachers and PT program managers. Only a few times did principals note a
discontinuity between district actions and their relationship with the staff in their schools
when new initiatives that were implemented by the district caused teachers to “panic,”
and created difficulty for the principal.
I don’t think they restructured the curriculum to meet the timeframe and to look at
what time would be needed to implement. I think those are some things that for
whatever reason and when teachers know there is the new evaluation system and

66
everything was going to be based on scores and goals, I think a panic attack set in.
(School 6)
Principals expressed concern about building relationships with their teachers.
One way they did so was to comment on factors affecting implementation that they saw
from the teachers’ perspective. Supporting and encouraging comments were often stated
like this principal at school 5:
I think that they have done, they being the math teachers, have done admirably
well. I was quite concerned at the beginning. I still have the same concerned at
the end. An awful lot was thrown to them at once. They were having difficulty
mastering, and I use that word exactly as it means, mastering anything. They
were floundering trying to try a lot of things and that would be my suggestion. A
little slower. (School 5)
In school 2, the principal also heard the teachers’ frustrations and commented during the
interview.
The training was right before school started and that doesn’t work well. That just
really got the stress of math teachers. They had the training and the next day they
had kids. That was a challenge. It did not give the math teachers a chance to
process what they learned. Collaborate, etc.. So we hit the ground running and
that was stressful. (School 2)
Beyond these relationships, individual teacher’s concerns are also prominent factors.
Teacher concerns
Clearly, relationships between school leaders and teachers and feedback from
leaders to teachers are impacted by the intensity of concerns the teachers are experiencing
67
in that moment. Teacher concerns were considered to be a factor helping or inhibiting
implementation according to school principals. At school 7, the principal noted initial
teacher concerns that PT was just another fad:
You had teachers saying “Is this something new that is coming in and in a year it
is going to be gone and we are going to be doing something else? Or is it here to
stay?” So you really had to get a lot of buy in by the teachers and it varied.
(School 7)
Another principal offered that teachers were used to being in control and did not
appreciate being told they had to implement PT.
We had a couple of teachers who were very resistant to it and I think it was just so
much happening at one time and they just kind of.. .they are used to being very
much in charge and in control of situations so giving up that power was difficult.
(School 5)
A similar mention of a lone resistor from another school suggested that the resistors were
a barrier to implementation. The school 2 principal stated, “Sometimes, like we say, one
bad apple can spoil it. If you have one that is not implementing, that tends to start to
trickle out to the others at times. That has been a barrier to fight that.” The same
principal continued to describe more about the situation:
I tell you what the scary thing is. The one teacher that was resisting and didn’t
implement had the best test results. So, not sure. My problem is if they find that
out, how is that going to affect implementation? (School 2)
Principals clearly thought that teacher concerns about the implementation were
significant. Whether repeating the concerns during the interview and adopting them as

68
their own (concerns about time, concerns about complexity of the program) or in
describing their own concerns about teachers such as the resistant one above, the
teachers’ concerns about PT were considered to be significant influences on PT
implementation.
An additional factor: standardized accountability testing
In the original set of code categories, school leaders’ concerns about the effect of
the reform on standardized test results was not included. But such concerns did emerge
about test results at a district level, school level, teacher level, and student level. Because
this research used spring interviews (that occurred in some cases within days of the
school accountability test in math), the school leaders clearly viewed test scores as a
factor that impact implementation. Without exception, each school leader referred to
standardized accountability tests multiple times throughout the interview, although there
were no questions on the interview protocol that referred to testing.
PowerTeaching vs. testing. The idea that implementation of PowerTeaching and
test preparation were separate and distinct targets was clearly voiced by more than one
school leader. One school leader described the context around a spring visit from the
SFAF coach to the local school in which implementation had taken a small step back and
teachers were using less PT saying that the school was
... two weeks away from <state testing> and teachers are focused on <state tests>
and they have so much content it is like ‘team huddle or do I teach the concepts?’
That is the big problem that we are having right now. The pressure is coming on
the closer we get to <state> testing. We are two weeks away from beginning our

69
<tests>. I think that is why you saw a difference between this time versus what
they saw last month. (School 7)
The distinctions were overt and clearly stated. This principal perceived the teachers were
choosing between teaching with a team huddle or teaching the concepts.
State accountability testing as measure of PowerTeaching. In another school
the leader was hoping to use the scores on accountability testing to evaluate the first year
of implementation. One principal acknowledged that although researchers consistently
point out that student effects are not demonstrable in the first year of implementation,
Then, on our end, from a statistical standpoint of view, in terms of the data, we
can use those, that same data that is teach and reteach reliability, to confirm the
things that we are looking for gains. ... When I get those scores back, facts don’t
lie and then I am going to disaggregate those scores and drill down. Not only per
teacher, but per student. I am going to show you something. (School 1)
PowerTeaching is a means toward improving student achievement. Another
principal chose to view it differently. Instead of separating the two goals and setting
aside PowerTeaching once state testing arrived, this participant saw PowerTeaching as a
way to achieve better test results.
I think for teachers here, we're data, data, data, ... the way that [this school
district] does data, data, data, and how in May you get the [state] test and
everything falls on that. So, I think we just have to keep developing the
PowerTeaching strategies so that we always know the strategies. PowerTeaching
is a part of us getting to the end result. (School 8)

70
Here testing and implementation might be separate directives, but the principal made a
clear choice to keep PowerTeaching as a consistent strategy that would help achieve
other goals such as state testing for school accountability.
RQ 3: Teacher Perceptions of School Leader Support as Factor in PT
Implementation
Focusing now on one set of factors, those related to leadership support only, I
examined the teacher’s viewpoint. Teacher perceptions of school leader support were
measured using multiple methods - one scale on the teacher questionnaire as well as
individual interviews. Teachers had somewhat unique perceptions of the support or lack
of support by school leadership, defined broadly to include district level personnel as well
as school level principals.
QUANT Teacher Perceptions of School Leader support during PT Implementation
Before analysis of the questionnaire results could take place, initial data
exploration and cleaning were conducted to ensure accurate findings. After cleaning, a
set of 85 teacher questionnaire responses was used for this analysis. Scale scores were
calculated for each scale and subscale. Teachers with missing data were not removed
from the analysis unless more than one item was missing from the scale. If only one item
was missing from the scale, the mean of that teacher’s remaining items was substituted
for the missing score for that scale. Mean scale scores were then generated. Descriptive
statistics were calculated for each scale on the questionnaire. For this research question
only one scale was used. Results for that scale were presented here (Table 9) while the
full display of results is found later (Table 10) in the discussion of the fourth research
question.

71
Teacher perception of school leader support was measured by one scale on the
teacher questionnaire. As noted earlier in chapter 2, this scale was revised before use to
eliminate any reference to the school leader or principal, due to ethical constraints against
the teachers evaluating the principal in any manner. The new revised scale is less
concrete (it excluded reference to principals specifically), but approximates the
perceptions of the teacher with respect to the level of school support generally (Table 9).
The scale had a mean value of 2.36 and median of 2.33, suggesting that on average,
teachers disagreed that their school leadership was supportive with respect to
PowerTeaching implementation.
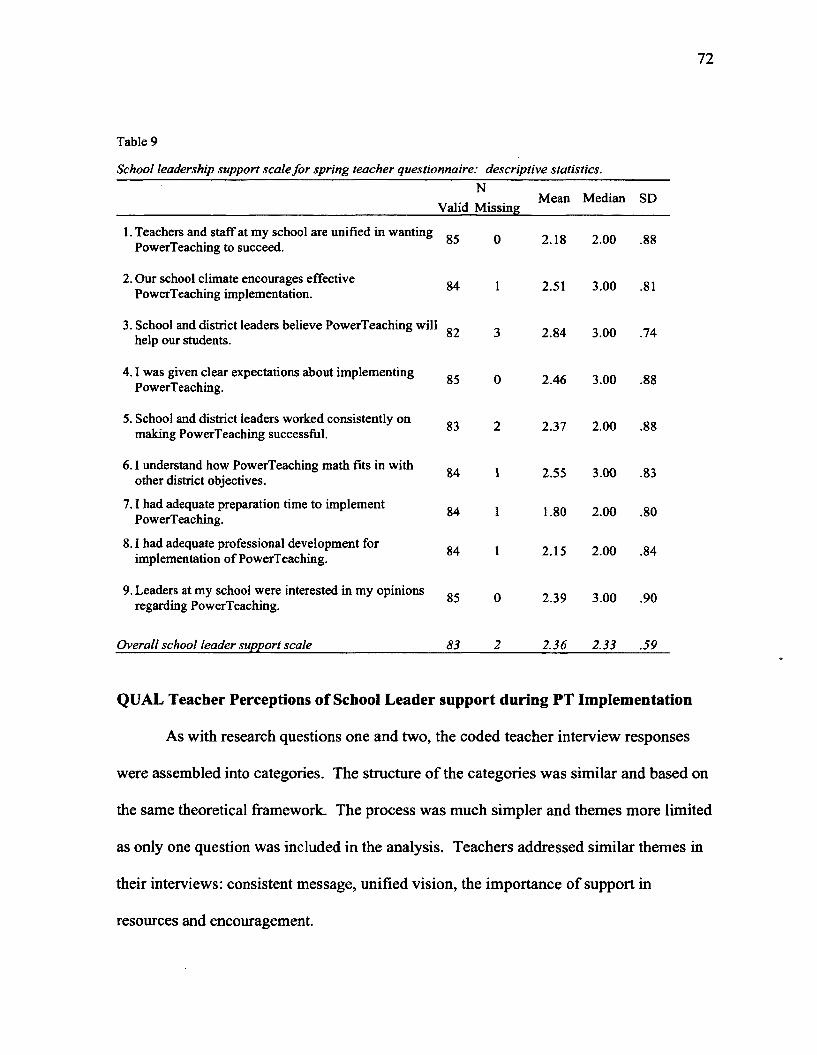
72
Table 9
School leadership support scale fo r spring teacher questionnaire: descriptive statistics.N
Valid MissingMean Median SD
1. Teachers and staff at my school are unified in wanting PowerTeaching to succeed. 85 0 2.18 2 . 0 0 . 8 8
2. Our school climate encourages effective PowerTeaching implementation. 84 1 2.51 3.00 .81
3. School and district leaders believe PowerTeaching will help our students. 82 3 2.84 3.00 .74
4.1 was given clear expectations about implementing PowerT eaching. 85 0 2.46 3.00 . 8 8
5. School and district leaders worked consistently on making PowerTeaching successful. 83 2 2.37 2 . 0 0 . 8 8
6 . 1 understand how PowerTeaching math fits in with other district objectives. 84 1 2.55 3.00 .83
7.1 had adequate preparation time to implement PowerTeaching. 84 1 1.80 2 . 0 0 .80
8 . 1 had adequate professional development for implementation of PowerTeaching. 84 1 2.15 2 . 0 0 .84
9. Leaders at my school were interested in my opinions regarding PowerTeaching. 85 0 2.39 3.00 .90
Overall school leader support scale 83 2 2.36 2.33 .59
QUAL Teacher Perceptions of School Leader support during PT Implementation
As with research questions one and two, the coded teacher interview responses
were assembled into categories. The structure of the categories was similar and based on
the same theoretical framework. The process was much simpler and themes more limited
as only one question was included in the analysis. Teachers addressed similar themes in
their interviews: consistent message, unified vision, the importance of support in
resources and encouragement.

73
Unified vision and commitment to change
Like the program managers, teachers also noticed whether the principal was
committed to implementing PowerTeaching. One teacher from school 5 noted the
importance of the principal supporting PT by maintaining a clear message.
I would say, it’s huge that they’re supportive. I think that’s the main issue is that
they really need to be behind the program. And our principal and assistant
principals really were, or are now. At least they are now, I know. And through the
process they’ve seen the kids in action, they’ve seen them share what they
thought, they’ve seen them respond to the team work, to share out afterwards and
have their thoughts really situated, like they were ready to share out. So I think, as
long as the administration’s really supportive on it then you’re really good to go.
(School 5)
Other teachers noted that their school leaders were not very involved and said, “Now if
you mean like administration and leadership of the school, they haven’t really been too
involved in that process as a whole, so I don’t really know.” (School 1) Some teachers
had different observations about the same principal. One teacher at school 7 negatively
stated, “They basically just said ‘You need to do it.’ There was not a whole lot of
leadership.” while another teacher at the same school said this in support of the same
principal:
My principal just kind of dumped it on me and trusted me to do it. [The principal]
told us it was not negotiable and we had to do it. [The principal] was nice about it
... [and] said to implement small pieces and that they didn’t expect me to
[implement everything]. [The principal] told me [there was no] expectation of
74
coming in and seeing it flowing and expecting an award of the month or
PowerTeacher of the year or whatever. They were very supportive and they were
understanding. The whole chunking thing. Bringing it to pieces. Don’t try and
dive in - it was good. (School 7)
Another teacher also noticed the competing district objectives that made
implementing PT more difficult. One teacher at school 1 discussed district goals that
seemed to conflict with PowerTeaching:
That’s one concern I have with the way it was done here, our principal
understands it well, we met [about it], but we have a curriculum specialist at the
district level who doesn’t know a lot about it, so I wish that would have been
more coordinated. I wish, because we have a lot of district mandates put on us
inside the classroom, and I wish that would have been more communicated so that
way everyone up the chain in our district, like our superintendent all the way up to
assistant principals all know what’s expected o f us. So that was one concern I had
with it. The fact that the expectations of it, what were expected, don’t really
correlate with our district goals sometimes. (School 1)
Competing district goals were seen as a barrier to implementation by some teachers.
Related to the support of the principal was the discussion of resources being provided by
her or him. It was clear that in a few cases the teacher perceived their principal’s
commitment to change as beneficial, but many teachers felt they were implementing
PowerTeaching without support from their school leader.
Resources for PowerTeaching implementation
Teachers had less to say about resource allocation than other themes when asked
about the supportive role of their school leader. Although the question did not name
specific resources, the research team expected that teachers would mention resources like
time and coaching, and perhaps some comments on electronic tablet distribution as well.
Instead, only one teacher brought up their leader’s support in providing time to learn PT
saying, “Just them giving us the time to learn it and it can take a while” (School 2).
Others recognized that the resources were coming from the grant or the district and noted
that in their remarks, saying, “I mean, they have done well with helping us get the stuff. I
think that might come from you guys though, the technology and grant part of it” (School
2). Broadlly speaking, then, teachers did not see PT resources as a way they were
supported by their school leader.
Relationship with principal and feedback from principal
On the contrary, the primary theme noted in the teacher interviews was school
leader support - attending meetings, discussing observations, and encouraging teachers.
Teachers appreciated the principal’s efforts to understand PT, the complexity of the PT
framework, and the difficult nature of their task of implementing it in the classroom.
I think that having [my principal] know what was going on in the classroom
definitely helped because [the principal] could come in and say, ‘I’m not seeing
this, make sure you’re including that...’ When we finally got a coach, our
PowerTeaching coach, like halfway through the year, that was a big help. Because
[the coach] really knew the program [and had] been trained with [the SFAF
coaches] and they knew what to look for, they knew what we were struggling
with, and I definitely think the coaching aspect and having that person always

76
there where [the coach] can always come into the classroom and really help us
out, I think that part was very helpful.
One teacher was glad the school leader understood why it was hard to implement, saying
that it was important to know:
.. .what we are doing. I know they cannot step in and do it their selves as
Administrators, but understanding what we are doing, the steps to it helps a lot.
Especially like I said earlier, when it comes to it.. .1 am implementing 60% of it
right now. I cannot do all of it. I will go nuts if I try to. Them understanding that
and why. (School 2)
Some teachers perceived the same principals as being less present for their teachers
(School 2), “At first it was pretty gung ho. We had an administrator at our component
meetings and then it dropped off. I really didn’t feel much support at all” and “I just feel
like administration-wise there wasn’t a lot there.”
In one case where the school leader was lacking, the teacher mentioned the
school-based coach in answer to the interview question on leadership support.
[Our coach] has done probably the most work for us. I know at the beginning of
the year and we kind of struggled with the supplies and those first couple of days
right before school started. [Our coach] had made copies and got our folders
organized for us for that first introductory unit and tried to make it as user friendly
as possible. All year when we have needed copies or laminated things,.. .[our
coach] is always wanting to help us out and has done a great job. Sometimes that
maintenance stuff that needs done that I put on the back burner. I am not great at

77
going to get things laminated or going to get posters made and <our coach> was
real good at that stuff, at helping us out. (Teacher, school 2)
Although coding only one question on the teacher interview did not allow as much depth
to the answer to this question, it is clear that some teachers perceived a lack of support
from their school leaders and may have begun to view their school-based coach in a
leadership role in light of that vacuum.
RQ 4: Relative importance of factors in variation of implementation of
PowerTeaching
The teacher questionnaire and document analysis were used to answer this
question and to examine the factors that might affect variation in school-level
implementation of PowerTeaching. Quantitative measures from the questionnaire were
aggregated to school-level scores and qualitative document analysis at the school and
classroom level was transformed into school-level quantified scores for each school. The
teacher questionnaire yielded school-level scores for teacher concerns, teacher
perceptions of school leader support, teacher beliefs about academic and social impact of
team learning, and teacher perceptions of the level of use (implementation) of
PowerTeaching at the mechanical, routine, and refined levels. Qualitative classroom
observations yielded school scores on classroom PT structures, instructional processes,
and student engagement. Similar school-level scores for school PT structures,
instructional processes, and student engagement were drawn from qualitative document
analysis of the SFAF school snapshots. A cluster analysis sorted the schools into
categories of schools with similar clusters of scores. Analysis showed that the
observation measures demonstrated statistically significant differences between schools.

78
Questionnaire Findings. For the teacher questionnaire, overall descriptive
statistics were calculated for each scale and subscale and are shown in Table 10. As
described in Chapter 2, all items used a four-point Likert scale o f agreement ranging from
strongly disagree to strongly agree. The results center around the midpoint or the general
“Agree” category with only the perceived school leader support scale falling slightly
below the midpoint. Little variation was evident throughout these scales, but as noted
above it is interesting that a majority of teachers disagreed that they had received
adequate school leader support or that they had worked in a supportive school climate
(Table 10).
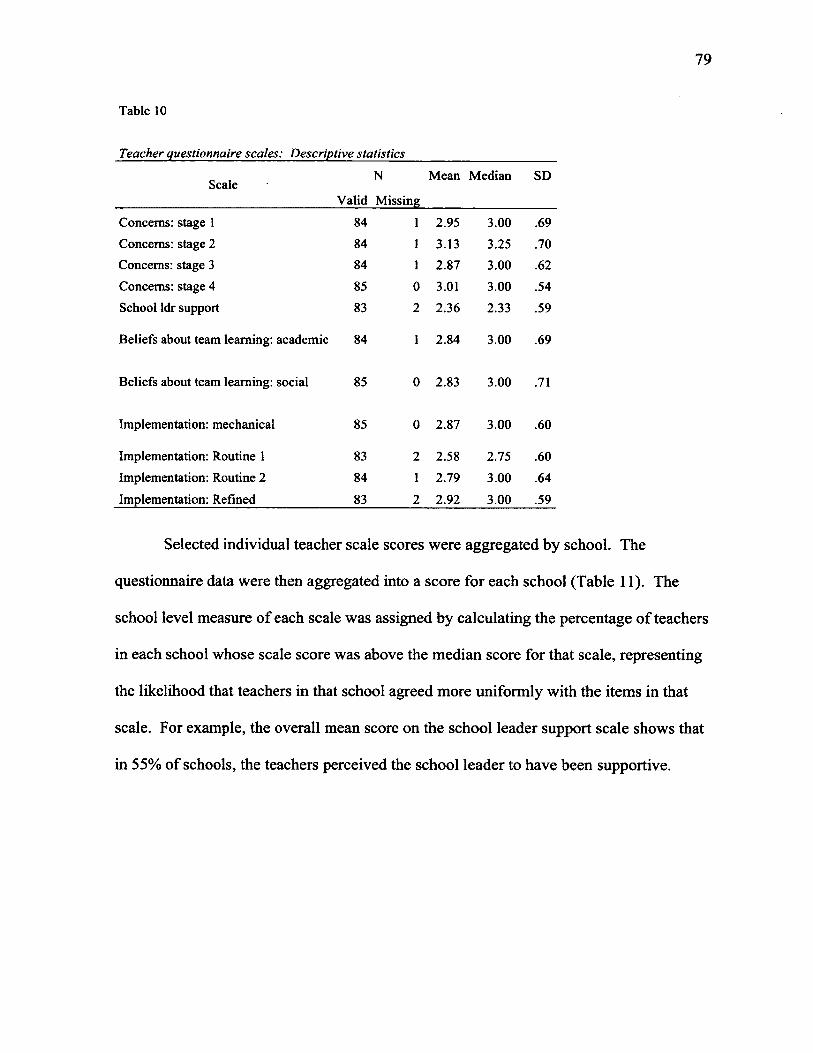
79
Table 10
Teacher questionnaire scales: Descriptive statistics
ScaleN
Valid Missing
Mean Median SD
Concerns: stage 1 84 1 2.95 3.00 .69Concerns: stage 2 84 1 3.13 3.25 .70Concerns: stage 3 84 1 2.87 3.00 .62Concerns: stage 4 85 0 3.01 3.00 .54School ldr support 83 2 2.36 2.33 .59
Beliefs about team learning: academic 84 1 2.84 3.00 .69
Beliefs about team learning: social 85 0 2.83 3.00 .71
Implementation: mechanical 85 0 2.87 3.00 .60
Implementation: Routine 1 83 2 2.58 2.75 .60Implementation: Routine 2 84 1 2.79 3.00 .64Implementation: Refined 83 2 2.92 3.00 .59
Selected individual teacher scale scores were aggregated by school. The
questionnaire data were then aggregated into a score for each school (Table 11). The
school level measure of each scale was assigned by calculating the percentage of teachers
in each school whose scale score was above the median score for that scale, representing
the likelihood that teachers in that school agreed more uniformly with the items in that
scale. For example, the overall mean score on the school leader support scale shows that
in 55% of schools, the teachers perceived the school leader to have been supportive.
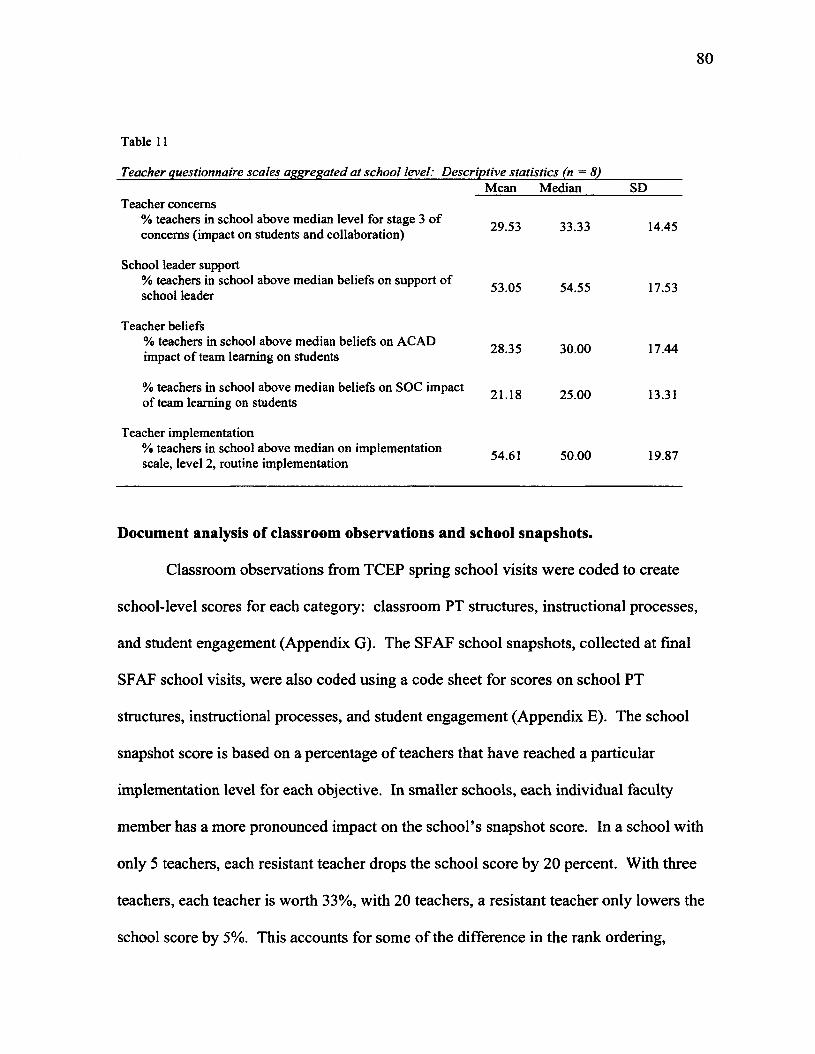
80
Table 11
Teacher questionnaire scales aggregated at school level: Descriptive statistics (n = 8)___________Mean Median_______SD_____
Teacher concerns% teachers in school above median level for stage 3 of 5 3 3 3 3 3 J4 4 5
concerns (impact on students and collaboration)
School leader support% teachers in school above median beliefs on support of , . , , . _, , , , 53.05 54.55 17.53school leader
Teacher beliefs% teachers in school above median beliefs on ACAD , , ,. . . , ̂ 28.35 30.00 17.44impact of team learning on students
% teachers in school above median beliefs on SOC impact - . , „ . .«, , , , ; z l . l o x j .UU 13.31of team learning on students
Teacher implementation% teachers in school above median on implementation , . _ D_. . . . .. . . . .. v 54.61 50.00 19.87scale, level 2, routine implementation
Document analysis of classroom observations and school snapshots.
Classroom observations from TCEP spring school visits were coded to create
school-level scores for each category: classroom PT structures, instructional processes,
and student engagement (Appendix G). The SFAF school snapshots, collected at final
SFAF school visits, were also coded using a code sheet for scores on school PT
structures, instructional processes, and student engagement (Appendix E). The school
snapshot score is based on a percentage of teachers that have reached a particular
implementation level for each objective. In smaller schools, each individual faculty
member has a more pronounced impact on the school’s snapshot score. In a school with
only 5 teachers, each resistant teacher drops the school score by 20 percent. With three
teachers, each teacher is worth 33%, with 20 teachers, a resistant teacher only lowers the
school score by 5%. This accounts for some of the difference in the rank ordering,

81
particularly for school 8, a very small school. Levels of use o f PowerTeaching for the
snapshot are measured with specific ranges of participating teachers: M = 95%, P = 80%,
etc. As measured by the SFAF snapshot, smaller schools have a more difficult time
reaching the higher levels of use with even just one teacher who is resisting the process.
Results of the school-level data (Table 12) were later used for further analysis in
determining clustering of pilot schools.
Table 12
Document analysis scores: aggregated at school level (n = 8)Mean Median Std. Deviation Minimum Maximum
SFAF Snapshot: School Structure 42.05 45.45 12.80 18.18 54.55SFAF Snapshot: Instructional Processes 53.00 52.00 7.33 40.00 64.00SFAF Snapshot: Student Engagement 54.38 55.00 9.43 40.00 65.00Observation: Instructional Processes 35.57 26.74 29.19 . 0 0 75.00Observation: Classroom Structures 53.33 53.13 21.44 20.83 80.00Observation: Student Engagement 35.13 32.29 18.97 . 0 0 65.00
School-level data were also examined by rank ordering the implementation levels
according to the various measures. In Table 13, the school rankings are shown for each
measure of implementation. School 8 is not stable, perhaps due to its small size, but
schools 2,3, and 5 are all in the upper half of implementation rankings and schools 4, 6,
and 7 all have lower levels of implementation. The teacher self-report measure, as
aggregated, does not support the conclusions of the other two measures and could be a
result of the measure or aggregation method.
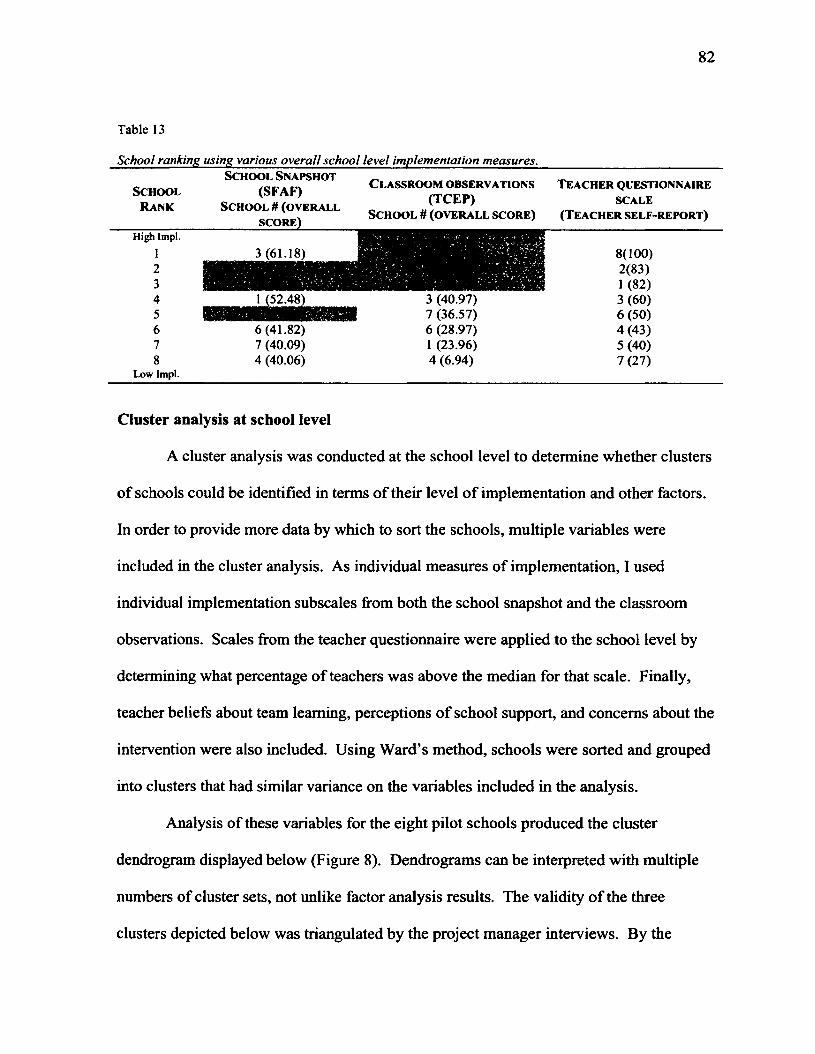
82
Table 13
School ranking using various overall school level implementation measures.S c h o o l S n a p s h o t
(SFAF) S c h o o l # ( o v e r a l l s c o r e ) _______
C l a s s r o o m o b s e r v a t io n s (T C E P )
S c h o o l # (o v e r a l l s c o r e )
Sc h o o l
R a n k
High Impl.
2345678
3(61.18) a m —
1 (52.48) 3 (40.97)
T e a c h e r q u e s t io n n a ir e
SCALE(T e a c h e r s e l f - r e p o r t )
8( 100)2(83)1(82)3(60)6(50)4(43)5(40)7(27)
6(41.82) 7 (40.09) 4 (40.06)
3 (40.97) 7 (36.57) 6 (28.97) 1 (23.96)4 (6.94)
Low Impl.
Cluster analysis at school level
A cluster analysis was conducted at the school level to determine whether clusters
of schools could be identified in terms of their level of implementation and other factors.
In order to provide more data by which to sort the schools, multiple variables were
included in the cluster analysis. As individual measures of implementation, I used
individual implementation subscales from both the school snapshot and the classroom
observations. Scales from the teacher questionnaire were applied to the school level by
determining what percentage of teachers was above the median for that scale. Finally,
teacher beliefs about team learning, perceptions of school support, and concerns about the
intervention were also included. Using Ward’s method, schools were sorted and grouped
into clusters that had similar variance on the variables included in the analysis.
Analysis of these variables for the eight pilot schools produced the cluster
dendrogram displayed below (Figure 8). Dendrograms can be interpreted with multiple
numbers of cluster sets, not unlike factor analysis results. The validity of the three
clusters depicted below was triangulated by the project manager interviews. By the
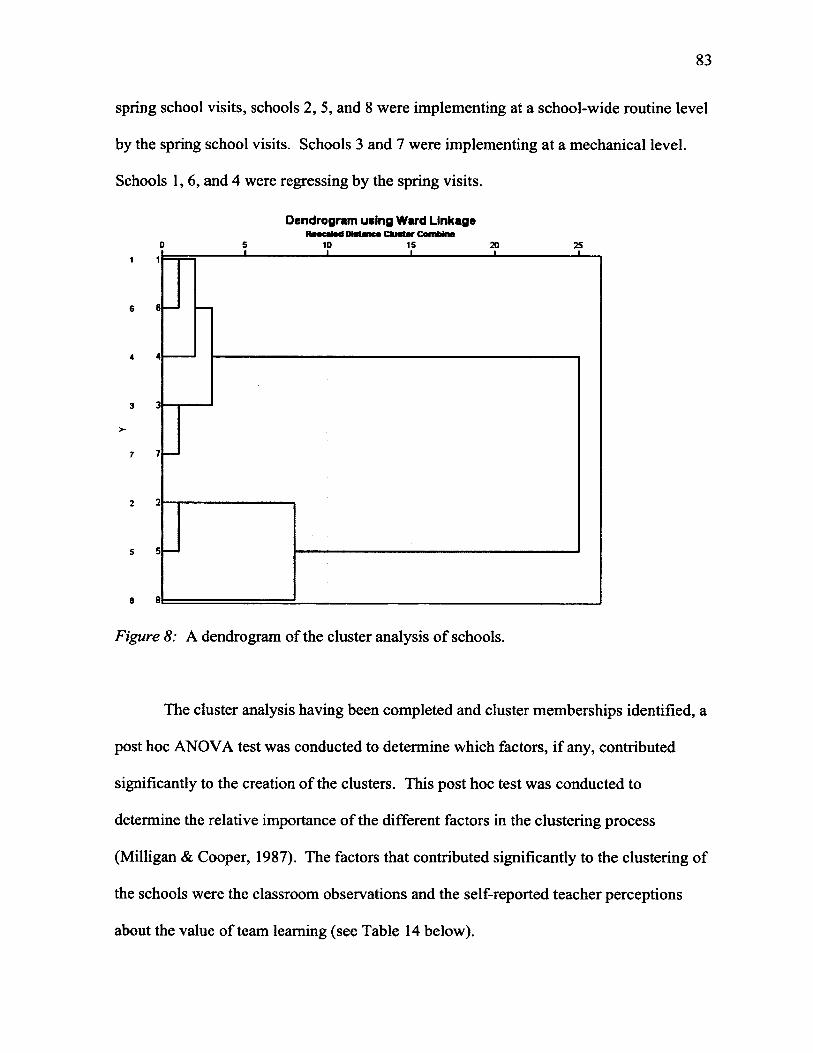
83
spring school visits, schools 2, 5, and 8 were implementing at a school-wide routine level
by the spring school visits. Schools 3 and 7 were implementing at a mechanical level.
Schools 1,6, and 4 were regressing by the spring visits.
Dendrogram using Ward LinkageIteacalMl P i i f n t t Combins
0 5 10 15 20 251 1
6 6
4 4
3 3
>-
7 7
2 2
5 5
8 8
Figure
The cluster analysis having been completed and cluster memberships identified, a
post hoc ANOVA test was conducted to determine which factors, if any, contributed
significantly to the creation of the clusters. This post hoc test was conducted to
determine the relative importance of the different factors in the clustering process
(Milligan & Cooper, 1987). The factors that contributed significantly to the clustering of
the schools were the classroom observations and the self-reported teacher perceptions
about the value of team learning (see Table 14 below).
J------------------------ 1________________ 1________________ I________________ L
8: A dendrogram of the cluster analysis of schools.

84
These significant factors suggest that there are definable clusters of schools and
that the TCEP observations were instrumental in determining the placement of the
schools into the clusters. The cluster definitions are in general agreement with the
descriptions of school implementation levels in the project manager interviews.
Certainly, the cluster of schools with higher implementation levels (schools 2,5, and 8)
was seen to have that characteristic across multiple measures. According to the SFAF
snapshot, all these schools had a supportive principal at the close of the pilot year,
although in at least one case the views expressed in the teacher interviews were in
disagreement, suggesting that the principal had been involved early on, but no longer was
involved. In all cases there was a coach involved in the school; in one of the three
schools the coach was half-time. One characteristic which merits further exploration is
that these schools were able to unify and present a united front in which all actors (with
the exception of one or two teachers in a school) were working toward a clear mandate:
implementation of PowerTeaching. The cluster of schools with low implementation
levels (schools 1,4, and 6) were also seen to have low spring implementation levels
across multiple measures. According to the project manager interviews, the reasons vary
widely: leadership concerns about standardized testing results, lack of leadership buy-in,
or an ineffective coach all may have played a role. In these cases, however, it was clear
that the actors were not aligned and working toward implementation of PowerTeaching
with a clear and focused drive and unified vision across actors in the school and district.
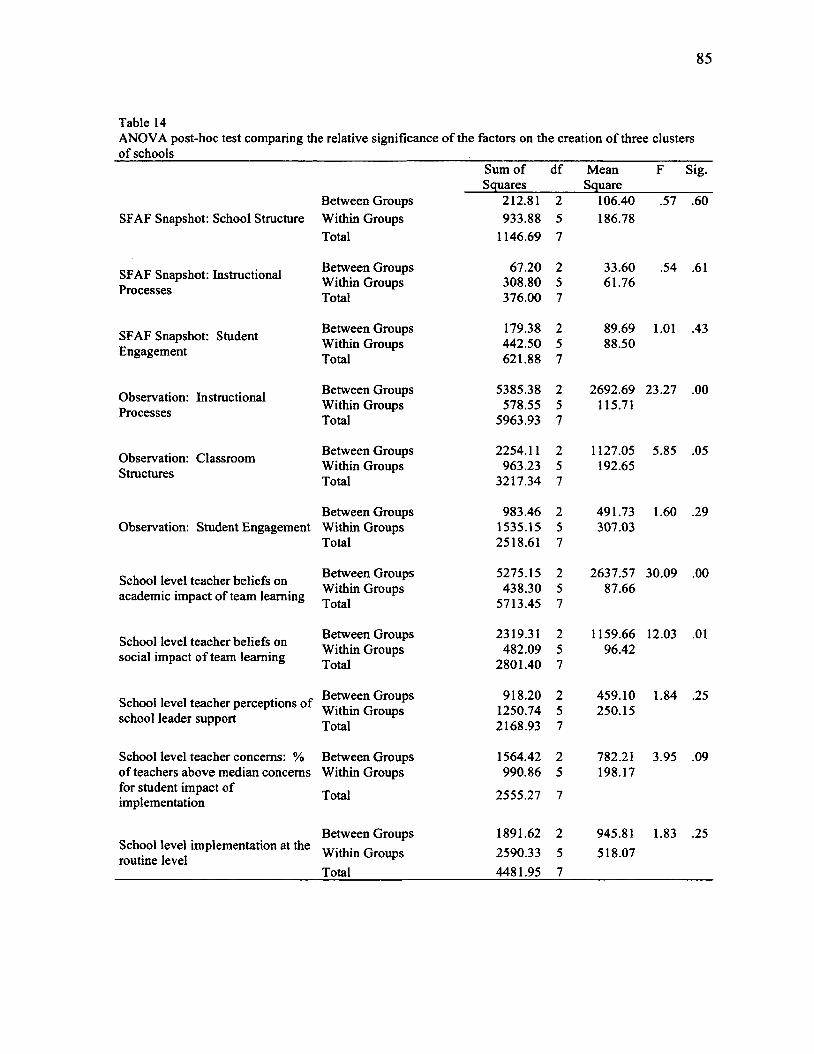
85
Table 14ANOVA post-hoc test comparing the relative significance of the factors on the creation of three clusters of schools
SFAF Snapshot: School Structure
SFAF Snapshot: Instructional Processes
SFAF Snapshot: Student Engagement
Observation: Instructional Processes
Observation: Classroom Structures
School level teacher beliefs on academic impact of team learning
School level teacher beliefs on social impact of team learning
school leader support
School level teacher concerns: % of teachers above median concerns for student impact of implementation
Sum of Squares
df MeanSquare
F Sig.
Between Groups 212.81 2 106.40 .57 .60Within Groups 933.88 5 186.78Total 1146.69 7
Between Groups 67.20 2 33.60 .54 .61Within Groups 308.80 5 61.76Total 376.00 7
Between Groups 179.38 2 89.69 1 . 0 1 .43Within Groups 442.50 5 88.50Total 621.88 7
Between Groups 5385.38 2 2692.69 23.27 . 0 0
Within Groups 578.55 5 115.71Total 5963.93 7
Between Groups 2254.11 2 1127.05 5.85 .05Within Groups 963.23 5 192.65Total 3217.34 7
Between Groups 983.46 2 491.73 1.60 .29Within Groups 1535.15 5 307.03Total 2518.61 7
Between Groups 5275.15 2 2637.57 30.09 . 0 0
Within Groups 438.30 5 87.66Total 5713.45 7
Between Groups 2319.31 2 1159.66 12.03 . 0 1
Within Groups 482.09 5 96.42Total 2801.40 7
Between Groups 918.20 2 459.10 1.84 .25Within Groups 1250.74 5 250.15Total 2168.93 7
Between Groups 1564.42 2 782.21 3.95 .09Within Groups 990.86 5 198.17
Total 2555.27 7
School level implementation at the routine level
Between Groups Within Groups Total
1891.622590.334481.95
257
945.81 1.83 .25518.07

86
Summary of Findings
To answer the first research question, o f the project managers’ perceptions of
variation in implementation, it was clear that project managers believed it was important
for the school and all the actors and systems to be willing and able to work together to
implement PowerTeaching. Like a tug-of-war, everyone must pull together in the same
direction. Minor obstacles, presence or absence of iPads, issues with standardized test
scores, or a lack of buy-in, could all be dealt with from within the implementation
routines as long as the actors were working together. One unique theme in the project
manager interviews was the importance of the school-based PT coach and her or his
ability to forge relationships with school leaders and teachers alike.
The second research question, of school leaders’ perceptions of factors important
to implementation, demonstrates the importance of the principal’s projection of and
commitment to a single unified vision. Unsurprisingly, schools whose principals sent
multiple, competing messages showed lower levels o f PT implementation. Principals
alone strongly asserted the importance of standardized test results, and some principals
directly tied those test results to the fate of the program in their schools. Some overtly
stated that if test scores declined, then they would eliminate the program. Some told
teachers that test scores were more important than PT implementation. A few principals,
however, were persuaded that if PT were fully implemented, then improved scores would
follow. Like the project managers above, the principals expressed the importance of the
school-based coach in helping the teachers to implement the program and helping to
relieve some of the burden of oversight of PT from the school leader.

87
For the third research question (teachers’ perceptions of support from the school
leadership), both in interviews and on the self-reported questionnaire, teachers expressed
frustration with a lack of support from their school leaders. Although a few teachers
stood out in support of their principals and the specific supports they had been offered, it
was clear that the majority of teachers perceived a lack of school support. The main
themes that arose from the teacher interview question were the principal’s providing (or
not) a unified vision and commitment to change, the resources and time teachers required
to implement the program, and feedback and interest in observing and learning about
PowerTeaching.
Lastly, variations in implementation of PowerTeaching were complex in nature.
Although the different measures largely agreed on the relative levels of implementation
of schools, the factors measured in this study were not sufficient to give a clear answer to
this question. It was clear that an articulated commitment to change and a unified vision
across actors in the school system made a difference. The exact process by which a
commitment to PowerTeaching was forged and carried through is unclear from these
data. What is clear is that it was not the work of only one person in any case where it
worked well and, where PowerTeaching was not implemented well, it was not the failure
of only one person. Further research into the interactions between the network of actors
involved in school change processes is warranted.

88
CHAPTER 4: DISCUSSION
The purpose of this study was to describe factors that school leaders, project
managers, and teachers identified as influential in the implementation of a middle school
math reform. The relationship between teacher beliefs about team learning, teacher
levels of concern about PT, and school leader support on level of implementation (level
of use) were examined. Results included common themes across all data sources, such as
the importance of a clear commitment to change and unified vision (or mandate) within
the system. Principals were uniquely concerned with standardized test score results,
although their reasons differed. Project managers viewed school-based math coaches as
key individuals, who were able to unify the actors within a school, including some who
attempted to stand in for school leaders who were not working effectively toward PT
implementation. Across the board, all participants valued the extent to which leadership
(district, school, or school-based coach) sought to build and nurture relationships with
teachers who, in busy classrooms with middle-school kids learning math, valued any
attempts leaders made to understand the intricacies of implementing PT and to offer a
helping hand.
The theories in chapter one describe these experiences o f individuals adopting and
implementing changes. Remembering the adoption curve from Figure 5 in chapter one,
Rogers suggests that early on in the implementation cycle a few early adopters try the
new innovation, or in this case they embraced PowerTeaching. In smaller schools this
might be only one teacher. If implementation occurred according to the model, the coach
and perhaps school leader would mobilize a few more into adoption of PowerTeaching

through encouragement or pressure. Throughout the year a few more were drawn in as
they saw others using it successfully or waited to see whether the innovation would go
away - whether the external SFAF coach was still visiting the school and encouraging the
school-based coach, for example. Another small group served as “resistors” or
“insulators” and tried to prevent the implementation from moving forward - in some
cases attempting to discredit PowerTeaching in audiences within or even outside the
school. Data collected in the pilot year of implementation did not allow for effective
application of this model. Longitudinal study of the implementation at the close of the
grant would provide a clearer description of the trajectory of implementation efforts.
Clearly there are hints of Rogers’ model throughout, both in the school with many
insulators caught at the bottom end of the curve, and the early-adopting school that
effectively focused vision and resources with a powerful coach that reached to the upper
end of the curve within the first semester of implementation. The story, however, is
unfinished and to suggest that either school was at a fixed point on the adoption and
implementation curve would overreach the available data and ignore the ongoing
complexity of the situation in participating schools. The journey is ongoing.
This concept of “the journey” and the importance of flexibility in implementing
innovations while on the journey, Van de Ven’s theory (1999), was certainly borne out in
the predominant themes of these interviews. Whether school district partners changed
due to turnover, resources were unavailable due to red-tape or unavailability, the
implementation moved forward. Absent a school-based coach or iPads for teachers, the
participants still were together on the journey to implement PowerTeaching.
90
Project Manager Perceptions of Variation in PT Implementation
The project managers’ views that implementation did not reach a refined and
“school-wide” level are supported by Rogers’ theory of adoption of innovations over time
(1962). In a few schools the same problems existed during each visit (no school-based
coach, no iPads, lackluster implementation by teachers, and no new progress toward
school targets). Project managers concluded that the external SFAF coach was unable to
problem solve and gamer stakeholder “buy-in” because the school leader and/or district
personnel themselves had not bought in. In these cases, even effective communication
with the district-level leaders was challenging due to excessive turnover or lack of direct
lines of communication. Administrative disorganization frustrated the efforts of coaches,
and consequently these schools generally were less successful at achieving school-wide
implementation. This experience confirms what other researchers have found (Bol et al.,
1998; Datnow & Castellano, 2001; Peurach, 2011; Smith et al., 1997). When school
leaders cannot effectively focus on the pressing issues within a school, change is less
likely to take place (Robinson et al., 2008). An inability to marshal resources and
encourage practices aligned with change has also been shown to negatively impact
implementation (Waters et al., 2003). These problems can all be somewhat alleviated by
negotiating flexible routines to address implementation and the obstacles that inevitably
appear on the journey (Peurach & Glazer, 2011). In this case, successful dialogue about
the routines with all actors in the district united behind the intent to implement PT led to
more successful implementation. The complex nature of school change and the
importance of navigating these situations, including complexity resulting from federal

91
funding issues, is not new and continues to inhibit the effectiveness of school change
efforts (Elmore, 2004; Fullan, 2007; Nunnery, 1998; Peurach, 2011).
School Leader Perceptions of Factors Important to PT Implementation
That the principal could become a catalyst for change was supported by these
results. In some cases, the principal was a clear supporter of the program, presented a
strong unified vision, encouraged teachers and listened to their concerns, and tried to
leam about the program in order to deepen the principal’s relationship with the teachers
(Datnow & Castellano, 2001). In other cases, teacher concerns and even school leader
concerns seemed to make a single, unified vision more difficult to achieve and led to
lower levels of implementation (Evers et al., 2002; Mazur & Lynch, 1989). The
importance of both internal and external supports during school change has been clearly
demonstrated and was borne out by the interviews with school leaders (Bol et al., 1998;
Smith et al., 1997).,
Principals, when interviewed about PowerTeaching, were not apathetic. A few
suggested that their roles had become more difficult or that it was impossible for them to
force teachers to use “one method” of instruction. Not surprisingly, this response was
found in the schools with lower levels o f implementation at the school-wide level. Many
principals saw PowerTeaching as a means by which to gather the entire math staff under
the same umbrella, facilitating team collaboration with peers as well as making
observation and evaluation much simpler. These principals suggested that it made
supporting and encouraging teachers much easier (“it is easier to talk about instruction”
school 2). They also found that it streamlined the observation and evaluation process
when “we are all looking for the same thing” and “We are looking at core specific
strategies, instead of going in and each math teacher teaches differently.” Some
principals were excited to note changes they had observed in student engagement -
particularly that “student-talk” was often exceeding “teacher-talk” and that these student
discussions were about math. They noted that the students were discussing math in more
depth and seeming to come to greater understanding, in some cases suggesting that this
was the first time they had seen students so actively engaged in owning their own
learning. They attributed PT’s emphasis on team learning to the students’ willingness to
work together and techniques like random reporter or team celebrations to encouraging
students to buy in to working together as a team.
Principals’ stark differences in attitude were prominent during the interviews.
These comments were coded as part of the “shared vision” or “consistent commitment to
change” category, but perhaps in future research this particular attitude and behavior
could be further explored, as an important interface between the individual leader and her
or his situation. If a principal is philosophically opposed to one system of instruction
being employed in the school and willing to express that view in an interview, then is he
or she less likely to encourage teachers to implement a particular reform? If the principal
views the PT instructional strategies as “individual tools to pull from a toolbox” then the
driving point of the framework, the implementation of a well-researched cycle of
effective instruction, has been undermined.
Research exploring the identity and attitudes of the school leader (whether the
principal perceives himself or herself as an instructional leader as opposed to a manager
or as a transformative leader) exists, but much of that research focuses only on one
individual (the principal) and excludes much of the complexity of the situation (Harris &

93
Spillane, 2008; Leithwood & Seashore-Louis, 2011; Scheerens, 1990). In watching the
pilot year of implementation, it is evident that the complex network of actors who work
together implementing is a much stronger force than the individual principal can be and
merits study of its own. The attitude or intent of the school leader with respect to the
situation was as important, and perhaps more so than the choice between specific
behaviors (i.e. instructional leading vs. transformational leading). With different attitudes
in response to an externally imposed situation, the leader had a profound effect on
implementation level and, perhaps even on student achievement. Individual school
leader’s responses to high-stakes testing are one example of implementation being
affected by an externally-imposed situation, or not.
Impact of high-stakes testing on implementation. Clearly, school leaders are
concerned about their school’s test results. Also clear is that their focus on high stakes
test scores impacts classroom instructional processes and likely student learning.
Teachers have identified testing pressure as a contributor to student disengagement as
well as a rationale for using specific instructional processes like test review and practice
(Bol et al., 2002). In other studies as well, testing has pressured teachers and school
leaders to change practice and resource allocation, in some cases affecting
implementation of reforms (Bol, 2004; Datnow, 2005; Desimone, 2002; Fischer, Bol, &
Pribesh, 2011). Successful implementation of PowerTeaching, or any change in
instructional processes, requires overt attention to testing pressures, particularly in high-
needs middle schools like those in this study. School leaders can choose explicitly to
direct the school’s focus away from test scores instead focusing on better instructional
processes, ultimately improving student achievement.

Until this takes place, models of school accountability based on AYP and
benchmarks on achievement tests will likely dominate if for no other reason than the
educational-industry complex control the situation (Kohn, 2002; Ravitch, 2010). Until all
members of the educational community express a desire to focus on deeper
understanding, it remains difficult for school leaders to refocus their school’s vision away
from high-stakes testing.
Teacher Perceptions of School Leader support during PT Implementation.
Teacher perceptions of leadership support were primarily focused on the school or
district leader’s understanding of what was being asked of teachers in the implementation
of PowerTeaching, their acknowledgment of the complexities and difficulties with
implementation, and the support and encouragement they provided. Teachers were
frustrated with the absence of leadership support, encouragement, or even interest in PT
implementation. Where present, teachers appreciated leadership acknowledgement o f the
importance of continued professional development and the presence of a school-based
coach to help them. Such teacher concerns are borne out by decades of research into
school reform efforts, and the structure of PT implementation in the pilot year attempted
to ensure adequate support for the teachers both internally (school-based coach) and
externally (SFAF coach, online resource hub) (Bol et al., 1998; Murphy & Datnow,
2003). In this case, the school-based coach emerged as an important supporting actor.
The project managers clearly identified that schools where coaches were present were
more likely to have better implemented PT. Especially in schools with effective coaches,
the school leaders were vocal about their appreciation of the support that the school-
based coach provided to the teachers on a daily basis. Teachers too found their school-
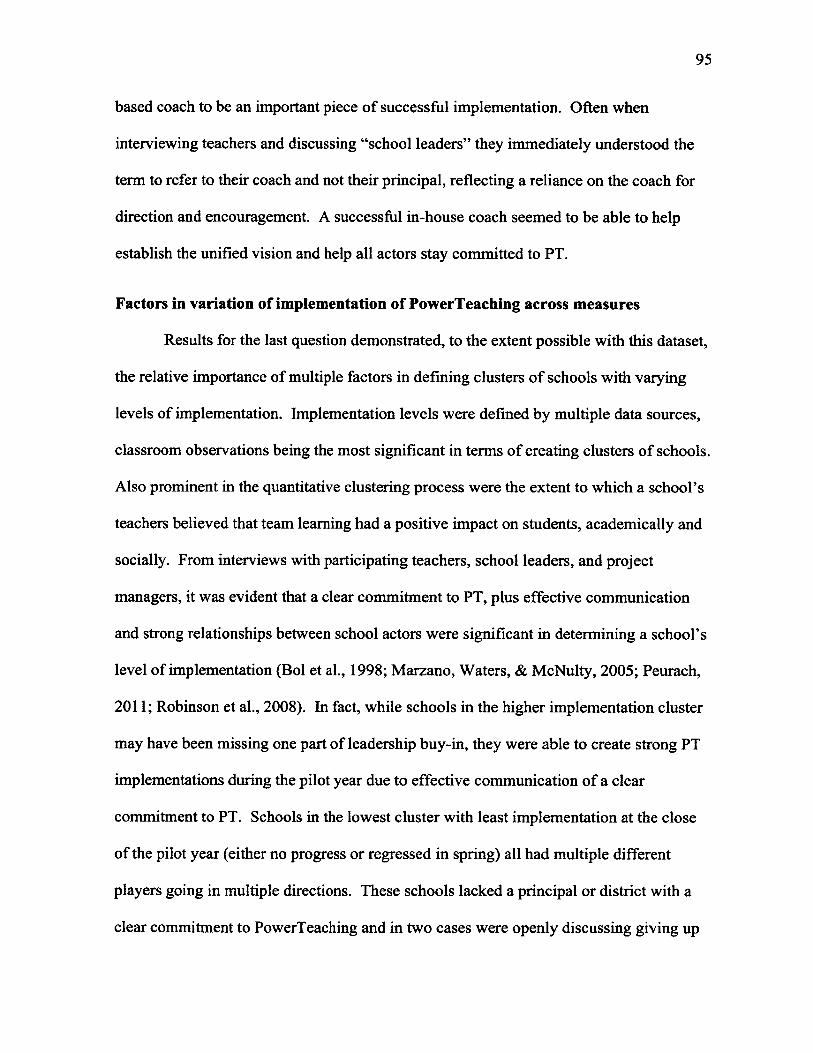
95
based coach to be an important piece of successful implementation. Often when
interviewing teachers and discussing “school leaders” they immediately understood the
term to refer to their coach and not their principal, reflecting a reliance on the coach for
direction and encouragement. A successful in-house coach seemed to be able to help
establish the unified vision and help all actors stay committed to PT.
Factors in variation of implementation of PowerTeaching across measures
Results for the last question demonstrated, to the extent possible with this dataset,
the relative importance of multiple factors in defining clusters of schools with varying
levels of implementation. Implementation levels were defined by multiple data sources,
classroom observations being the most significant in terms of creating clusters of schools.
Also prominent in the quantitative clustering process were the extent to which a school’s
teachers believed that team learning had a positive impact on students, academically and
socially. From interviews with participating teachers, school leaders, and project
managers, it was evident that a clear commitment to PT, plus effective communication
and strong relationships between school actors were significant in determining a school’s
level of implementation (Bol et al., 1998; Marzano, Waters, & McNulty, 2005; Peurach,
2011; Robinson et al., 2008). In fact, while schools in the higher implementation cluster
may have been missing one part of leadership buy-in, they were able to create strong PT
implementations during the pilot year due to effective communication of a clear
commitment to PT. Schools in the lowest cluster with least implementation at the close
of the pilot year (either no progress or regressed in spring) all had multiple different
players going in multiple directions. These schools lacked a principal or district with a
clear commitment to PowerTeaching and in two cases were openly discussing giving up

96
the reform effort in favor of test preparation strategies. A clear commitment to change,
ability to focus on pressing issues, and willingness to marshal resources and practices in
the school toward one goal was again shown to be of utmost importance (Marzano et al.,
2005; Robinson et al., 2008).
Teacher beliefs in the impact of team learning on students were also significant in
the post hoc ANOVA, implying that school implementation of change can be helped by
having a large percentage of teachers in that school believing in the change. Although
only teachers participated in the questionnaire scales measuring beliefs about the impact
of team learning, principals also commented on the impact of their teachers’ use of team
learning in their interviews. Those who discussed seeing increased student engagement
in math classes, increased discussion between students about math, or even just more
student talk and less teacher talk in math classrooms expressed their excitement, and in
some cases surprise, at the positive changes that came with the first months of
implementation. The findings here that teacher beliefs are significant, support other
research in school change, but these findings also confirm that “teacher beliefs” continue
to be a “messy construct” that is difficult to measure and constrain (Datnow &
Castellano, 2000; Isikoglu, Basturk, & Karaca, 2009; Pajares, 1992).
Messy though it is, all three sets of actors (teachers, principals, and project
managers) seem to understand that, in order for the reform to be implemented fully and
with fidelity, a concerted effort with unified intentions must be made by all. Teachers
were generally willing to carry out the reform mandate in their classrooms, and they were
grateful for any resources they were given - practical advice from their school-based
coach, time to learn the PT techniques, acknowledgement from their principals o f the

97
daily battles they face. But gratitude is the least of it. It might be tempting to dismiss
acknowledgement by their administrators as mere hand-holding, but in fact, in schools
where teachers complained that such positive acknowledgement was lacking,
implementation of the reform suffered. The presence of an effective school-based coach
seemed universally to be viewed as an irreplaceable asset toward this end. All sources
agreed that a clearly communicated common vision helped successful implementation.
The usual role of the individual school administrators was most clearly articulated
by the project managers, both of whom are well experienced in observing school change,
and neither of whom was surprised by the personnel dynamic at any of the schools
regardless of the widely-varying levels of implementation. From this study it appeared to
be the case that principals, to a much greater degree than teachers, felt themselves under
tremendous pressure to put up big numbers on standardized tests. This could be due to
the differences in interview protocol, however, and not an accurate representation of
reality.
Due to these differences it is difficult to make fine-grained comparisons across the
measures. Clearly, the interviews showed that the leadership of a school and district
affects variability of implementation and that clear commitment, resource allocation, and
supportive relationships are all important. Because only one question from the teacher
interview was used, it is only possible to discuss the teachers’ perceptions of the role of
leadership in implementation. From the questionnaire, it is evident that they perceived a
lack of leadership support or at least a less supportive school climate, also apparent in
their interviews. Their beliefs about team learning’s impact on student achievement and
social skills were not evident in the teacher interview data, nor were the teacher
98
perceptions of the factors most important for successful implementation. Further study
using additional teacher interview data is ongoing. The classroom observations and
school snapshots were in general agreement at the top and bottom levels of
implementation, but not in total agreement. They generally triangulated the project
managers’ perceptions of each school’s implementation level. An additional difficulty
with measures of implementation is that school implementation is not static or
unidirectional. From all sources, for example, it was clear that implementation was
increasingly challenged with approaching high-stakes tests, with a few schools regressing
in their levels of implementation. Although not problem-free, including multiple
measures in this study was important in order to triangulate implementation levels,
concerns about presence or absence of school and district leadership support, and also the
pressure of high-stakes testing.
Limitations
Of course due to the exploratory nature of this study the present findings are not
generalizable externally. Certainly the number of participants was limited due to the
scope of the study. For interviews it is not obvious that a point of saturation was reached.
Additionally, the work explored only the implementation of PowerTeaching at the middle
school level and findings may not hold true for school change in other settings in
elementary or high school.
The use of a research team was of overall benefit to be sure. Nine researchers
worked together in teams and sub-teams to create measures and gather data. Two
members of the team visited each school during the spring school visits and were able to
provide multiple data sources for observations and even interview notes. However,

99
limitations to the study from use of a team also are present. The reliability of the research
team is a limitation, including its less than extensive training in semi-standardized
protocols, and the individual members of the research team asking different and
sometimes substantively different questions as follow-ups across participants. Nine
observers gathered classroom observation data with one research pair visiting each of the
8 schools. The protocols created by the team sometimes did not align with my research
questions. Differently asked questions across participants resulted in challenges when
determining whether unique responses were based on the unique perceptions of the
individual or merely the way the question was worded. Fortunately, inter-rater reliability,
stability checks, analytic memos and an audit trail all contributed to strengthen the
trustworthiness of this study.
With respect to classroom observations, teachers may have behaved differently
due to our presence in the classroom and, in fact, a few times we heard student comments
to that effect. In order to avoid this response, ideally the TCEP observers would have
been in the classroom often and completed a few observations before the observation
used in this research. However, financial and time constraints of visiting remote schools
as well as issues of access and the level of disruption of the school day precluded such
procedures.
In addition, the threat of reactivity in self-reported measures applies to the teacher
questionnaire and interview responses. Social desirability is likely to have colored
teachers’ questionnaire or interview responses. Participants may have been more
optimistic about their own levels of implementation than the observations show, for
example, or principals more enthusiastic about their support of PowerTeaching and team
100
learning. Due to difficulties with items on the questionnaire scale (and the unique and
unpredictable issues of implementation of the Teacher Cycle Record Form), it is not clear
to determine the extent to which they agree. However, trustworthiness strategies such as
using multiple observers and examining the results across multiple data sources lessened
the nature of these threats. Audit trail and journaling of these issues as they unfolded
helped to guard against bias. Inter-rater reliability and stability checks for qualitative
coding added to trustworthiness as well. A more comprehensive and rich description of
factors explaining variation in implementation resulted from these practices, despite the
inherent limitations.
Individual scale development was also not without limitation. Ideally an existing
and validated measure would have been used to gather data. This being unavailable,
scales were developed in relation to the program theory and with initial creation of a
blueprint, followed by multiple rounds of expert review and revision, and eventual
piloting where possible. Ethical issues with the school leader support scale resulted in
substantial rewriting and weakening, including the removal of the word “principal” from
all items. The resulting scale in school support loosely estimates the perceptions of
teachers on the level of support from school leadership without restricting the responses
to their perceptions of the principal. In light o f the results that revealed the importance of
an overall network of leadership, perhaps this was beneficial in the end.
The questionnaire scale that was based on the CBAM stages of concern was very
limiting. Because the developers of PowerTeaching use the CBAM model as their
theoretical framework it was also used for this study. The scales are intended for use in
longitudinal study and the curve of the line observed to detect changes in the profile of

101
the types of intense concerns that the teachers were feeling. Because only spring data
was used for this work, and there was little variation, the CBAM measure was of limited
value. The school snapshots, completed by the SFAF coaches who have undergone
extensive training and years of practice, were considered to be objective.
For future research
Theoretical models and leadership theory
Literature shows that implementation can start with a few individuals buying in
during the initial stages and gradually moving toward full buy-in over time (Rogers,
1962). This journey requires flexibility and relationship-building throughout the process
(Ven et al., 1999). Routines can be developed as part of this journey to establish
common ground for the actors to share while the discursive process of implementation
moves forward as seen in this years-long ethnography tracing the implementation of a
success for all reform (Peurach & Glazer, 2011; Peurach, 2011). These theories describe
a school change effort, over time, but do not model the way the leadership network
functions, within schools and districts.
Based on the findings in this study, I can envision a future research project that
examined more closely the set of actors and the relationships between those actors as a
school reform effort unfolded. Actors might include traditional members of leadership
hierarchy (superintendent, district-level, principal, department level, teachers) but also
could include other members of the school community (students, parents, community
members, business partners, coaches, etc.). Using a theoretical framework that helped
map out the many relationships between the many actors involved in school reform and
model their significance would be useful in examining the structures that influence
102
reform in any year - the limited view most usually available to researchers (Scheerens,
1990). A model that would allow closer examination of a complex system of people,
continually changing, and working within a flexible set of institutional structures would
have been helpful for organizing this work. Indirect effects models attempt this task.
Scheerens’ concept of the school leader in a position of “meta-control” is based on
control theory (including the importance of flexibility), for example (De Leeuw &
Volberda, 1996; De Leeuw, 1986; Scheerens, 1990). Quinn and Rohrbaugh’s concept of
“competing values” has also been used as a model for leadership interactions in studying
effects of school leadership (Heck & Moriyama, 2010; Quinn & Rohrbaugh, 1983; Ten
Bruggencate, Luyten, & Scheerens, 2010). Distributed leadership theory and its focus on
leadership practice is also such a model (Spillane, 2006). Based on complexity science
and network theory, it is less concerned with certain processes or outcomes, instead
focusing on the “rich networks of relationships” (Harris, 2009; Leithwood et al., 2009).
The distributed leadership and other indirect leadership models are unique in
emphasizing the network of leadership influences within a school or district. Unlike
leadership models that focus on the behaviors of one person and his or her influence as an
instructional leader, transformational leader, or managerial leader, these newer models
use control theory, complexity theory and theories of distributed cognition to view
leadership practice in a wider sense within a specific multi-dimensional context (Harris,
2009; Scheerens, 1990). Vertical and lateral dimensions of leadership (i.e. hierarchical or
peer relationships) are modeled in simultaneous tension with the two realms of formal
and informal leading (structured meetings or informal focus on peer relationships, e.g.)
(Harris, 2009; Spillane, 2006). Such research is beginning to be carried out, but models
103
are not yet agreed upon, though a few examples are present in recent literature
(Leithwood, Mascall, & Strauss, 2008).
School change and implementation of external programs such as PowerTeaching
math must be carefully implemented with the attention of all the actors in the network of
school leadership. To researchers of comprehensive school reform, this is not news (Bol
et al., 2002; Borman et al., 2003; Nunnery et al., 1997; Peurach, 2011). Teacher concerns
and participants’ beliefs about an intervention matter but are perhaps less important than
internal and external supports during the implementation (Bol et al., 1998). Research
shows that throughout the implementation journey the multiple players must be flexible
and be headed in the same direction - a task made more simple through overt routines
(Leithwood & Jantzi, 2000; Peurach & Glazer, 2011; Winter & Szulanski, 2001).
Another related direction of research stems from organizational psychology
research and research on conceptual change and examines the culture for sustainable
change (Schneider, Brief, & Guzzo, 1996). For example, Myran et al. found
relationships between an individual’s commitment to change, implementation
(participation) level, and the behavioral support for the reform, (2013). Although
research investigating the complexity of school organizations and the nature of changing
such complex structures is not a new (Marks & Printy, 2002; Printy, Marks, & Bowers,
2009), the attempts to apply newer organizational psychology and leadership and control
theories to schools are infrequent to date. A gap in research exists, for example, in
examining the impact of school leadership using indirect effects models and these
network or complexity theories applied to educational settings, such as distributed
leadership or integrated leadership. Scheerens suggests that both qualitative and

104
quantitative studies could help describe the pathways of functioning of school networks
(1990). To some extent, the results of this study contribute to that effort.
Quantitative analysis.
In later years of the grant when more schools are participating, it would be fruitful
to carry out a multilevel analysis of the level of implementation using the variables from
this study that look promising, as well as some school demographic variables that
typically have been shown to influence school reform successes. Factors like supportive
school or district leaders, demonstrated teacher beliefs in team learning, and levels of
participant concern could be used. If it were possible to find an applicable network
model for successful functioning of school networks (communication, resource support,
relationships, etc.) that too could be added (Harris, 2009; Myran et al., 2013; Scheerens,
1990).
To examine -the odds -that a school would be more likely -to
achieve successful implementation, it would be useful t o perform an
ordinal logistic regression using a composite, categorical school-
wide implementation level from the cluster analysis a s the
dependent variable and the teacher-level scores from the
questionnaire a s independent variables, along with some school-
level markers. Unfortunately, due to small sample size th is was not
possible for this study.
Measuring concern. To circumvent the issues with the CBAM scale noted
above, it may be beneficial to use a validated burnout inventory (e.g. Maslach’s burnout
inventory) to measure participants’ concerns instead. Over and over again in interviews
105
the teachers state that they don’t have enough time, that they have too many obligations,
that there are conflicting demands placed on them by school and district leaders. Much
of this emotional energy might be measured very effectively with a burnout scale. Unless
for practical reasons it is important to measure the progression of the teachers’ concerns
with respect to the implementation, it might be better for evaluation purposes to be
measuring more accurately the intensity of their frustration and bumout.
Conclusions
The extent to which a multitude of factors is present in any school change effort
was part of my lived experience this year. The complexity of the path toward change and
the actions between the participants while travelling on this journey is worth further
study. The strength of the organization’s network of players, and its ability to point in
one direction, are central to a reform’s success or failure.
In a more practical sense, this research speaks to school principals about the
extent to which they can support change in their schools by keeping a consistent and
focused message that is clearly communicated to the staff. Building a relationship with
the staff around that message and participating in their discussions, hearing their
frustrations, and encouraging their efforts is also important. Finding a way to support the
teachers or coaches by insulating school staff from district-level initiatives that cloud the
reform effort and by ensuring a prompt delivery of needed resources is also important
(Bol et al., 1998; Borman et al., 2003; Nunnery et al., 2008; Robinson et al., 2008).
Politically speaking, the unfolding story sheds light on some frustrations and
shortcomings of the government funding and requirements educational research. The
nature of the pilot year experience, with only 6 months of preparation and recruiting time,

106
certainly affected the level of reform implementation. The requirement that results be
demonstrated in a formal evaluation by the third year of the grant precluded decisions to
take more time in setting up the program, developing materials, gathering resources, and
recruiting schools. The i3 grant system is doubtless an improvement on prior structures
of federally funded educational research in that research-proven programs are eligible for
larger awards that facilitate nationwide broad scale-up of programs (Bol et al., 1998;
Slavin, 2008). However, the term of these scale-up grants might be reexamined, as might
the requirements for the type of evidence needed to demonstrate effective school change.
It is unrealistic to expect to see immediate results in student improvement when given
such a short time span in which matched schools in school districts must also be
recruited.
Given the available data here assembled, the limited data bear out the conclusion
that successful implementation includes multiple factors and multiple actors. No single
set within the school can alone take command and force the implementation of a
curricular reform with much expectation of success. Neither the teachers, individually or
collectively, nor the principal (to say nothing of district administration) nor even the
lynch-pin of PT, the school-based and SFAF coaches, can expect successful
implementation without substantial cooperation from the other constituencies. That is,
these data show that a school-wide programmatic effort, the product of multiple factors,
is necessary to lasting institutional change.
The good news is that neither does any one constituency alone possess the power
to defeat implementation. When I began this research, I greatly suspected that a single
disgruntled teacher, fed up with yet another mandate from on high, might have the
107
persuasive power to sabotage the entire program. But this is not the case, at least in the
limited data assembled here. Instead, in schools that did not successfully implement
PowerTeaching reform, or in the case where the level of implementation regressed after
showing initial promise, in all cases, the failure to implement occurred across the board.
That is, like success, failure was the product of multiple factors. Certainly some factors
carry more weight than others. The school leadership sets the tone, and teachers in high
implementing schools pointed to the active engagement of the principal.
PowerTeaching is not a magical pill that produces instantaneous results.
Although some of the eight schools examined here are off to a good start, the story of PT
implementation is not over for any of them. Despite the pressure placed upon them,
principals cannot realistically expect dramatic increases in measures of student learning
in only one year. But through patient, assertive, programmatic reform addressed across
the board to the multiple factors within the institutional setting and applied consistently,
they can expect positive outcomes in school change that eventually result in measurable
improvements in student learning.
108
REFERENCES
Abrami, P. C., Poulsen, C., & Chambers, B. (2004). Teacher motivation to implement an
educational innovation: factors differentiating users and non-users o f cooperative
learning. Educational Psychology, 24(2), 201-216. doi: 10.1080/0144341032000160146
Bailey, D. B., Jr., & Palsha, S. A. (1992). Qualities o f the stages o f concern questionnaire and
implications for educational innovations. The Journal o f E ducational Research, 85(4),
226-232. doi: 10.1080/00220671.1992.9941120
Barbato, R. A. (2000, January 1). P olicy im plications o f cooperative learning on the achievem ent
and attitudes o f secondary school m athem atics students. Fordham University, New York,
NY. Retrieved from http://fordham.bepress.com/dissertations/AAI9975337
Barnes, R. (2005). Moving towards technology education: Factors that facilitated teachers’
implementation of a technology curriculum. Journal o f Technology Education, 17(1).
Beaton, A. E., Mullis, I. V. S., Martin, M. O., Gonzales, E. J., Kelly, D. L., & Smith, T. A.
(1996). M athematics achievem ent in the m iddle school years: IE A ’s Third International
Mathematics an d Science Study (TIMSS). TIMSS International Study Center, Boston
College Chestnut Hill, MA. Retrieved from
http://timss.bc.edu/timssl995i/TIMSSPDF/BMathAll.pdf
Beatty, B. (2011). The dilemma o f scripted instruction: Comparing teacher autonomy, fidelity,
and resistance in the Froebelian kindergarten, Montessori, Direct Instruction, and Success
for All. Teachers College Record, 113(3), 395—430.
Bendixen, L. D., & Feucht, F. C. (2010). Personal epistemology in the classroom: What does
research and theory tell us and where do we need to go next? In P ersonal epistem ology in
the classroom: Theory, research, an d im plications fo r p ra c tice (pp. 555-586). New York,
NY, US: Cambridge University Press.
Bendixen, L. D., & Rule, D. C. (2004). An integrative approach to personal epistemology: A
guiding model. Educational Psychologist, 39(1), 69-80.
doi: 10.1207/s 15326985ep3901_7
Berg, J. H., Carver, C. L., & Mangin, M. M. (2013). Teacher leader model standards:
Implications for preparation, policy, and practice. Journal o f Research on L eadership
Education, 1942775113507714.
Bol, L. (2004). Teachers’ assessment practices in a high-stakes testing environment. Teacher
Education and Practice, 17(2), 162-181.
Bol, L., Nunnery, J. A., & Lowther, D. L. (1998). Inside-in and outside-in support for
restructuring: the effects of internal and external support on change in the New American
Schools. Education and Urban Society, 30(3), 358-384.
doi: 10.1177/0013124598030003005
Bol, L., Ross, S. M., Nunnery, J. A., & Alberg, M. S. (2002). A comparison of teachers’
assessment practices in school restructuring models by year o f implementation. Journal
o f Education fo r Students P laced a t Risk, 7(4), 407-423.
Bonebright, D. A. (2010). 40 years o f storming: a historical review o f Tuckman’s model o f small
group development. Human Resource D evelopm ent International, 73(1), 111-120.
Borman, G. D., Hewes, G. M., Overman, L. T., & Brown, S. (2003). Comprehensive school
reform and achievement: A meta-analysis. R eview o f E ducational R esearch, 73(2), 125.
doi: 10.3102/00346543073002125
Borman, G. D., Slavin, R. E., Cheung, A., Chamberlain, A. M., Madden, N. A., & Chambers, B.
(2005). Success for All: First-year results from the national randomized field trial.
Educational Evaluation and P olicy Analysis, 27(1), 1-22.
doi: 10.3102/01623 73 7027001001
Bredeson, P. (2003). D esigns fo r learn in g: a new architecture fo r professional developm ent in
schools. Thousand Oaks, CA: Corwin Press.
110
Brewer, D. J. (1993). Principals and student outcomes: Evidence from US high schools.
Economics o f Education Review, 12(4), 281-292.
Brody, C. M., & Davidson, N. (1998). Professional developm ent f o r cooperative learning: Issues
and approaches. SUNY Press.
Bruner, J. (1996). The Culture o f Education. Harvard University Press.
Bynner, J., & Parsons, S. (2001). Qualifications, basic skills and accelerating social exclusion.
Journal o f Education an d Work, 14(3), 279-291. doi: 10.1080/13639080120086102
Carhart, E. H., Nunnery, J. A., Bol, L., Arnold, P., Chappell, S., Grant, M., & Morrison, G.
(2013). Readiness for reform in middle schools adopting PowerTeaching for mathematics
instruction. Presented at the AERA, San Francisco, CA.
Cheung, D., Hattie, J., & Ng, D. (2001). Reexamining the stages o f concern questionnaire: A test
of alternative models. The Journal o f Educational Research, 94(4), 226-236.
doi: 10.1080/00220670109598756
Chiu, M. M., & Klassen, R. M. (2010). Relations o f mathematics self-concept and its calibration
with mathematics achievement: Cultural differences among fifteen-year-olds in 34
countries. Learning an d Instruction, 20(1), 2-17. doi:10.1016/j.leaminstruc.2008.11.002
Christou, C., Eliophotou-Menon, M., & Philippou, G. (2004). Teachers’ concerns regarding the
adoption o f a new mathematics curriculum: An application claim. E ducational S tudies in
M athematics.
Cleary, T. J., & Chen, P. P. (2009). Self-regulation, motivation, and math achievement in middle
school: Variations across grade level and math context. Journal o f School Psychology,
47(5), 291-314. doi:10.1016/j.jsp.2009.04.002
Corbin, J., & Strauss, A. C. (2007). Basics o f Q ualitative Research: Techniques a n d Procedures
fo r D eveloping Grounded Theory (3rd ed.). Sage Publications, Inc.
Creswell, J. W. (2009). Editorial: Mapping the field o f mixed methods research. Journal o f M ixed
M ethods Research, 3(2), 95-108.
I l l
Creswell, J. W,, & Plano Clark, V. L. (2007). D esign ing an d conducting m ixed m ethods research.
Thousand Oaks, Calif.: SAGE Publications.
Damanpour, F. (1991). Organizational innovation: A meta-analysis o f effects o f determinants and
moderators. The Academ y o f M anagem ent Journal, 34(3), 555—590. doi: 10.2307/256406
Danzig, A. B., Chen, R., & Spencer, D. A. (2007). Learner-centered leadership: Learning through
mentoring, coaching, and professional development activities. A dvances in E ducational
Adm inistration, 10, 23-40. doi: 10.1016/S 1479-3660(07)10002-0
Datnow, A. (2000). Power and politics in the adoption o f school reform models. E ducational
Evaluation and P olicy Analysis, 22(4), 357-374. doi: 10.2307/1164430
Datnow, A. (2005). The sustainability of comprehensive school reform models in changing
district and state contexts. Educational Adm inistration Q uarterly, 41(1), 121-153.
doi: 10.1177/0013161X04269578
Datnow, A., Borman, G. D., Stringfield, S., Overman, L. T., & Castellano, M. (2003).
Comprehensive School Reform in culturally and linguistically diverse contexts:
Implementation and outcomes from a four-year study. Educational Evaluation a n d P olicy
Analysis, 25(2), 143-170.
Datnow, A., & Castellano, M. (2000). Teachers’ responses to Success for All: How beliefs,
experiences, and adaptations shape implementation. A m erican E ducational Research
Journal, 37(3), 775-799. doi:10.3102/00028312037003775
Datnow, A., & Castellano, M. E. (2001). Managing and guiding school reform: Leadership in
Success for All schools. Educational Adm inistration Q uarterly, 37(2), 219-49.
doi: 10.1177/00131610121969307
Datnow, A., & Stringfield, S. (2000). Working together for reliable school reform. Journal o f
Education f o r Students P laced a t Risk, 5(1), 183-204.
112
Davis, S., Darling-Hammond, L., LaPointe, M., & Meyerson, D. (2005). School leadership study:
D eveloping successful principals (Review o f Research). Stanford, CA: Stanford
University: Stanford Educational Leadership Institute.
De Leeuw, A. C. J. (1986). Organisaties: management, analyse, ontwerp en verandering: een
systeem visie. Van Gorcum. Retrieved from http://library.wur.nl/WebQuery/clc/1624110
De Leeuw, A. C. J., & Volberda, H. W. (1996). On the concept o f flexibility: a dual control
perspective. Om ega, 24(2), 121-139.
Demarest, E. J. (2010). A learning-centered fram ew ork fo r education reform: What does it mean
fo r national p o licy? New York, NY: Teachers College Press.
Desimone, L. (2002). How can comprehensive school reform models be successfully
implemented? R eview o f Educational Research, 72(3), 433—479.
doi: 10.3102/00346543072003433
Diffusion o f Innovation Chart, (n.d.). Retrieved from
http://en.wikipedia.Org/wiki/File:Diffusion_of_ideas.svg
Eklof, H. (2007). Self-concept and valuing of mathematics in TIMSS 2003: Scale structure and
relation to performance in a Swedish setting. Scandinavian Journal o f E ducational
Research, 5/(3), 297-313. doi:10.1080/00313830701356141
Elby, A. (2009). Defining personal epistemology: A response to Hofer & Pintrich (1997) and
Sandoval (2005). Journal o f the Learning Sciences, 75(1), 138-149.
doi: 10.1080/10508400802581684
Elmore, R. F. (2004). School reform from the inside out: Policy, practice , and perform ance.
Boston, MA: Harvard Education Press.
Erickson, F. (2007). Some thoughts on “proximal” formative assessment of student learning.
Yearbook o f the N ational Society fo r the Study o f Education, 106(1), 186-216.
Evers, W. J. G., Brouwers, A., & Tomic, W. (2002). Burnout and self-efficacy: A study on
teachers’ beliefs when implementing an innovative educational system in the
113
Netherlands. British Journal o f Educational P sychology, 72(2), 227-243.
doi: 10.1348/000709902158865
Fernet, C., Guay, F., Senecal, C., & Austin, S. (2012). Predicting intraindividual changes in
teacher burnout: The role of perceived school environment and motivational factors.
Teaching and Teacher Education, 25(4), 514-525. doi:10.1016/j.tate.2011.11.013
Fischer, C., Bol, L., & Pribesh, S. (2011). An investigation o f higher-order thinking skills in
smaller learning community social studies classrooms. A m erican Secondary Education,
39(2), 5-26.
Fullan, M. (1993). Change forces: Probing the depths o f educational reform (1st ed.). London:
Routledge.
Fullan, M. (2007). The new meaning o f educational change (4th ed.). New York: Teachers
College Press, Teachers College, Columbia University.
Geijsel, F., Sleegers, P., Van den Berg, R., & Kelchtermans, G. (2001). Conditions fostering the
implementation of large-scale innovation programs in schools: Teachers’ perspectives.
Educational Administration Quarterly, 37(1), 130-166.
doi:10.1177/00131610121969262
Gess-Newsome, J., Southerland, S. A., Johnston, A., & Woodbury, S. (2003). Educational
reform, personal practical theories, and dissatisfaction: The anatomy o f change in college
science teaching. American E ducational Research Journal, 40(3), 731-767.
doi: 10.3102/00028312040003731
Gibbs, G. R. (2005, June 30). Online QDA - Writing as Analysis. Retrieved March 30, 2009,
from http://onlineqda.hud.ac.Uk/Intro_QDA/writing_analysis.php#Memos
Gibbs, S., & Powell, B. (2012). Teacher efficacy and pupil behaviour: The structure o f teachers’
individual and collective beliefs and their relationship with numbers o f pupils excluded
from school. British Journal o f Educational Psychology, 52(4), 564-584.
doi: 10.1111/j.2044-8279.2011,02046.x
114
Giroux, H. A. (1988). Teachers as intellectuals: Tow ard a critical p ed a g o g y o f learning. Bergin
& Garvey.
Gitlin, A., & Margonis, F. (1995). The political aspect o f reform: Teacher resistance as good
sense. American Journal o f Education, 103(4), 377-405.
Goodlad, J. I. (1975). The dynamics o f educational change: tow ard responsive schools. New
York: McGraw-Hill.
Graczewski, C., Ruffin, M., Shambaugh, L., & Therriault, S. B. (2007). Selecting and
implementing whole school improvement models: A district and school administrator
perspective. Journal o f Education fo r Students P laced a t Risk, 12 (1), 75-90.
doi: 10.1080/10824660701247283
Guba, E. G. (1990). The Paradigm D ialog. Sage Publications.
Hall, G. (1977). Measuring stages of concern about the innovation: A manual for the use of the
SoC Questionnaire. Retrieved from
http://www.eric.ed.gov/ERICWebPortal/contentdelivery/servlet/ERICServlet?accno=ED
147342
Hall, G. (2011). Implementing ch an ge: patterns, principles, and po tho les (3rd ed.). Boston:
Pearson.
Hall, G., & Hord, S. M. (1987). Change in schools: F acilitating the process. Albany, N.Y.: State
University o f New York Press.
Hallinger, P. (2005). Instructional leadership and the school principal: A passing fancy that
refuses to fade away. Leadership and P olicy in Schools, 4(3), 221-239.
doi: 10.1080/15700760500244793
Hargreaves, A. (2007). Extending educational change: International handbook o f educational
change (1st ed.). Dordrecht, Netherlands: Springer.
115
Harris, A. (Ed.). (2009). D istributed Leadership - D ifferent P erspectives. [Dordrecht]: Springer.
Retrieved from http://www.springer.com/education+%26+language/book/978-1 -4020-
9736-2
Harris, A., & Spillane, J. (2008). Distributed leadership through the looking glass. M anagem ent
in Education, 22( 1), 31.
Hattie, J. (2008). Visible learning: A synthesis o f over 800 m eta-analyses rela ting to achievem ent
(1st ed.). London: Routledge.
Hays, D. G., & Singh, A. A. (2011). Q ualitative Inquiry in C linical an d E ducational Settings (1st
ed.). The Guilford Press.
Heck, R. H., & Moriyama, K. (2010). Examining relationships among elementary schools’
contexts, leadership, instructional practices, and added-year outcomes: a regression
discontinuity approach. School Effectiveness and School Im provem ent, 21(4), 377—408.
Hofer, B. K., & Bendixen, L. D. (2012). Personal epistemology: Theory, research, and future
directions. In K. R. Harris, S. Graham, T. Urdan, C. B. McCormick, G. M. Sinatra, & J.
Sweller (Eds.), APA educational psychology handbook, Vol 1: Theories, constructs, and
critical issues (pp. 227-256). Washington, DC, US: American Psychological
Association.
Hollingshead, B. (2009). The concems-based adoption model: A framework for examining
implementation o f a character education program. NASSP Bulletin, 93(3), 166-183.
doi:l 0.1177/0192636509357932
Holloway, K. (2003, February). A measure o f concern: Research-based program aids innovation
by addressing teacher concerns. Tools f o r Schools, 8.
House, J. D., & Telese, J. A. (2008). Relationships between student and instructional factors and
algebra achievement o f students in the United States and Japan: An analysis o f TIMSS
2003 data. Educational Research & Evaluation, 14(1), 101-112.
doi: 10.1080/13 803610801896679

116
Isikoglu, N., Basturk, R., & Karaca, F. (2009). Assessing in-service teachers’ instructional beliefs
about student-centered education: A Turkish perspective. Teaching an d Teacher
Education, 25(2), 350-356. doi:10.1016/j.tate.2008.08.004
Ivankova, N. V., Creswell, J. W., & Stick, S. L. (2006). Using mixed-methods sequential
explanatory design: From theory to practice. F ield M ethods, 1 8 (\) , 3-20.
Jacob, B. A., & Lefgren, L. (2005). Principals as agents: Subjective performance measurement in
education. N ational Bureau o f Economic Research Working P aper Series, No. 11463.
Retrieved from http://www.nber.org/papers/wl 1463
Johnson, R. B., & Onwuegbuzie, A. J. (2004). Mixed methods research: A research paradigm
whose time has come. Educational Researcher, 33(1), 14-26.
doi: 10.3102/0013189X033007014
Johnson, R. B., Onwuegbuzie, A. J., & Turner, L. A. (2007). Toward a definition o f mixed
methods research. Journal o f M ixed M ethods Research, 1(2), 112-133.
doi:10.1177/1558689806298224
Knight, J. (2009). What can we do about teacher resistance? P hi D elta K appan, 90(1), 508-513.
Kohn, A. (2002). Education, Inc.: Turning learning into a business (Rev. ed.). Portsmouth NH:
Heinemann.
Leithwood, K., & Jantzi, D. (2000). Principal and teacher leadership effects: A replication. School
Leadership & Management, 20(4), 415—434. doi:10.1080/13632430020003210
Leithwood, K,, & Jantzi, D. (2005). A review o f transformational school leadership research
1996-2005. Leadership & P olicy in Schools, 4(3), 177-199.
doi: 10.1080/15700760500244769
Leithwood, K., Louis, K. S., Anderson, S., & Wahlstrom, K. (2004). H ow leadership influences
student learning: A review o f research, (p. 90). Wallace Foundation.
Leithwood, K., Louis, K. S., Wahlstrom, K., Anderson, S., Mascall, B., & Gordon, M. (2009).
How successful leadership influences student learning: The second installment o f a
117
longer story. In Second international handbook o f educational change (pp. 611-629).
Springer. Retrieved from http://link.springer.com/chapter/10.1007/978-90-481-2660-
6 3 5
Leithwood, K., Mascall, B., & Strauss, T. (2008). D istribu ted leadership according to the
evidence. Routledge. Retrieved from
http://books.google.com/books?hl=en&lr=&id=sntSqVUCUNcC&oi=fnd&pg=PPl&dq=
leithwood+2009&ots=rav_ATrRQE&sig=KlxHd_DMuUhksXCsCA5Py2Bygto
Leithwood, K., & Montgomery, D. J. (1982). The role of the elementary school principal in
program improvement. R eview o f E ducational Research, 52(3), 309-339.
doi: 10.2307/1170421
Leithwood, K., & Seashore-Louis, K. (2011). Linking Leadership to Student Learning. John
Wiley & Sons.
Louis, K. (2007). Trust and improvement in schools. Journal o f E ducational Change, 5(1), 1-24.
doi:10.1007/sl0833-006-9015-5
Lumpe, A. T., Haney, J. J., & Czemiak, C. M. (1998). Science teacher beliefs and intentions
regarding the use of cooperative learning. School Science and M athem atics, 95(3), 123-
135. doi:10.1 Ill/j.l949-8594.1998.tbl7405.x
Marks, H. M., & Printy, S. M. (2002). Organizational learning in high-stakes accountability
environments: Lessons from an urban school district. Theory and Research in
Educational Administration, 7(1), 1-3.
Marzano, R. J., Waters, T., & McNulty, B. A. (2005). School Leadership That Works: From
Research to Results. Association for Supervision & Curriculum Development.
Mazur, P. J., & Lynch, M. D. (1989). Differential impact o f administrative, organizational, and
personality factors on teacher burnout. Teaching an d Teacher Education, 5(4), 337-353.
doi: 10.1016/0742-051X(89)90031-0
118
Milligan, G. W., & Cooper, M. C. (1987). Methodology review: Clustering methods. A pplied
Psychological M easurement, / 7(4), 329-354.
Murphy, J., & Datnow, A. (2003). Leadership lessons from C om prehensive School Reforms.
Thousand Oaks, CA: Corwin Press.
Myran, S., Fodchuk, K., Robinson, J., & Baker, P. (2013). M omentum f o r change: Exam ining the
relationships am ong educator participation level, com m itm ent to change, an d behavioral
support fo r change. Manuscript submitted for publication.
National Center for Education Statistics. (2011). The Nation’s Report Card - National Assessment
of Educational Progress - NAEP. Retrieved August 3, 2011, from
http://nces.ed.gov/nationsreportcard/
National Center for Education Statistics. (2012). The condition o f education - Mathematics
Performance Indicator 24 (2012). Retrieved September 26, 2012, from
http://nces.ed.gov/programs/coe/indicator_mat.asp
Niessen, T., Abma, T., Widdershoven, G., Van der Vleuten, C., & Akkerman, S. (2008).
Contemporary epistemological research in education: Reconciliation and
reconceptualization o f the field. Theory Psychology, 18(1), 27-45.
doi: 10.1177/0959354307086921
Nunnery, J. A. (1998). Reform ideology and the locus o f development problem in educational
restructuring: Enduring lessons from studies o f educational innovation. Education and
Urban Society, 30(3), 277-295. doi: 10.1177/0013124598030003002
Nunnery, J. A., Bol, L., Dietrich, A., Rich, L., Kelly, S., Hacker, D., & Sterbin, A. (1997).
Teachers’ initial reactions to their pre-implementation preparation and early restructuring
experiences. School Effectiveness & School Im provem ent, 5(1), 72.
doi: 10.1080/0924345970080104
Nunnery, J. A., Bol, L., Morrison, G., Arnold, P., Chappell, S., Grant, M., ... Zaharieva, J.
(2013). A technologically-facilitated sca le up o f a proven m odel o f m athematics
119
instruction in high need schools: M idterm form ative evaluation report. Norfolk, VA:
The Center for Educational Partnerships at Old Dominion University.
Nunnery, J. A., Bol, L., Morrison, G., Arnold, P., Perry, T., Chappell, S., ... Zaharieva, J. (2013).
A technologically-facilitated sca le up o f a proven m odel o f m athematics instruction in
high need schools: 2013 spring term form ative evaluation report. Norfolk, VA: The
Center for Educational Partnerships at Old Dominion University.
Nunnery, J. A., & Chappell, S. (2011). M eta-analysis o f effect s izes o f STAD-M ath on secondary
students ’ math perform ance. Norfolk, VA: The Center for Educational Partnerships at
Old Dominion University.
Nunnery, J. A., Ross, S. M., & Bol, L. (2008). The construct validity o f teachers’ perceptions of
change in schools implementing comprehensive school reform models. Journal o f
Educational Research & P olicy Studies, 5(1), 67-91.
Onwuegbuzie, A. J., & Leech, N. L. (2006). Linking research questions to mixed methods data
analysis procedures. The Q ualitative R eport, 11(3), 474-498.
Pajares, M. F. (1992). Teachers’ beliefs and educational research: deeming up a messy construct.
R eview o f E ducational Research, 62(3), 307-332. doi: 10.3102/00346543062003307
Park, V., & Datnow, A. (2008). Collaborative assistance in a highly prescribed school reform
model: The case of Success for All. P eabody Journal o f Education (0161956X ), 53(3),
400-422. doi: 10.1080/01619560802222376
Patton, M. Q. (2002). Qualitative research & evaluation m ethods (3rd ed.). Sage Publications,
Inc.
Pedersen, S., & Liu, M. (2003). Teachers’ beliefs about issues in the implementation o f a student-
centered learning environment. E ducational Technology Research and D evelopm ent,
51(2), 57-76. doi: 10.2307/30221162
Perels, F., Dignath, C., & Schmitz, B. (2009). Is it possible to improve mathematical achievement
by means o f self-regulation strategies? Evaluation o f an intervention in regular math
120
classes. European Journal o f Psychology o f Education, 24{ 1), 17-31.
doi: 10.1007/BF03173472
Peurach, D. (2011). Seeing com plexity in pu b lic education: Problem s, possib ilities, an d Success
fo r A ll (1st ed.). New York: Oxford University Press.
Peurach, D., & Glazer, J. L. (2011). Reconsidering replication: New perspectives on large-scale
school improvement. Journal o f E ducational Change. doi:10.1007/sl0833-011-9177-7
Printy, S. M., Marks, H. M., & Bowers, A. J. (2009). Integrated leadership: How principals and
teachers share transformational and instructional influence. Journal o f School
Leadership, 19(5), 504-532.
Quinn, R. E., & Rohrbaugh, J. (1983). A spatial model o f effectiveness criteria: towards a
competing values approach to organizational analysis. M anagem ent science, 29(3), 363-
377.
Ramdass, D., & Zimmerman, B. J. (2008). Effects o f self-correction strategy training on middle
school students’ self-efficacy, self-evaluation, and mathematics division learning.
Journal o fA dvan ced Academ ics, 20( 1), 18—41.
Ravitch, D. (2010). The D eath an d Life o f the G reat Am erican School System : H ow Testing and
Choice A re Undermining Education. Basic Books.
Rivera-Batiz, F. L. (1992). Quantitative literacy and the likelihood o f employment among young
adults in the United States. The Journal o f Human Resources, 27(2), 313-328.
doi: 10.2307/145737
Roach, A. T., Kratochwill, T. R., & Frank, J. L. (2009). School-based consultants as change
facilitators: Adaptation o f the concems-based adoption model (CBAM) to support the
implementation o f research-based practices. Journal o f E ducational and P sychological
Consultation, 79(4), 300-320. doi:10.1080/10474410802463304
121
Robinson, V. M. J., Lloyd, C. A., & Rowe, K. J. (2008). The impact o f leadership on student
outcomes: An analysis o f the differential effects o f leadership types. E ducational
Administration Quarterly, 44(5), 635-674. doi: 10.1177/0013161X08321509
Rogers, E. M. (1962). Diffusion o f innovations. New York: New York, Free Press o f Glencoe.
Rowan-Kenyon, H. T., Swan, A. K., & Creager, M. F. (2012). Social cognitive factors, support,
and engagement: Early adolescents’ math interests as precursors to choice of career.
C areer D evelopm ent Quarterly, 60(1), 2-15. doi:10.1002/j.2161-0045.2012.00001.x
Rule, D. C., & Bendixen, L. D. (2010). The integrative model o f personal epistemology
development: Theoretical underpinnings and implications for education. In L. D.
Bendixen & F. C. Feucht (Eds.), P ersonal epistem ology in the classroom : Theory,
research, and im plications fo r p ra ctice (pp. 94-123). New York, NY, US: Cambridge
University Press.
Saldana, J. (2012). The Coding M anual f o r Q ualitative R esearchers (Second Edition edition.).
SAGE Publications Ltd.
Sandoval, W. A. (2009). In defense o f clarity in the study o f personal epistemology. Journal o f
the Learning Sciences, 75(1), 150-161. doi:10.1080/10508400802581700
Scheerens, J. (1990). School effectiveness research and the development o f process indicators of
school functioning. School effectiveness and school im provem ent, 7(1), 61-80.
Schneider, B., Brief, A. P., & Guzzo, R. A. (1996). Creating a climate and culture for sustainable
organizational change. Organizational Dynam ics, 24(4), 7-19. doi:10.1016/S0090-
2616(96)90010-8
Schommer-Aikins, M. (2004). Explaining the epistemological belief system: Introducing the
Embedded Systemic Model and Coordinated Research Approach. Educational
Psychologist, 39(1), 19-29. doi:10.1207/sl5326985ep3901_3
122
Schoon, I., Bynner, J., Joshi, H., Parsons, S., Wiggins, R. D., & Sacker, A. (2002). The influence
of context, timing, and duration of risk experiences for the passage from childhood to
midadulthood. C hild Developm ent, 75(5), 1486-1504. doi:10.1111/1467-8624.00485
Schraw, G., Bendixen, L. D., & Dunkle, M. E. (2012). Validation o f the Epistemic Belief
Inventory (EBI). P ersonal Epistem ology: The P sychology o f Beliefs A bout K now ledge
and Knowing, 261.
Siegler, R. S., Duncan, G. J., Davis-Kean, P. E., Duckworth, K., Claessens, A., Engel, M., ...
Chen, M. (2012). Early predictors of high school mathematics achievement.
P sychological Science, 25(7), 691-697. doi:10.1177/0956797612440101
Sinatra, G. M., & Kardash, C. M. (2004). Teacher candidates’ epistemological beliefs,
dispositions, and views on teaching as persuasion. Contem porary E ducational
Psychology, 29(4), 483-498. doi:10.1016/j.cedpsych.2004.03.001
Slavin, R. E. (1990). On making a difference. E ducational Researcher, 19(3), 30—44.
doi: 10.2307/1176070
Slavin, R. E. (1995). C ooperative learning: theory, research, an d practice . Boston: Allyn and
Bacon.
Slavin, R. E. (2008). Perspectives on evidence-based research in education—What works? Issues
in synthesizing educational program evaluations. Educational R esearcher, 57(1), 5-14.
doi: 10.3102/0013189X08314117
Slavin, R. E., & Karweit, N. L. (1984). Mastery learning and student teams: A factorial
experiment in urban general mathematics classes. Am erican E ducational Research
Journal, 21(4), 725-736. doi: 10.3102/00028312021004725
Slavin, R. E., Lake, C., & Groff, C. (2009). Effective programs in middle and high school
mathematics: A best-evidence synthesis. R eview o f E ducational Research, 79(2), 839.
doi: 10.3102/0034654308330968
123
Slavin, R. E., Madden, N. A., & Leavey, M. (1984). Effects o f team assisted individualization on
the mathematics achievement of academically handicapped and nonhandicapped
students. Journal o f Educational P sychology , 76(5), 813-819. doi: 10.1037/0022-
0663.76.5.813
Smith, L. J., Maxwell, S., Lowther, D., Hacker, D., Bol, L., & Nunnery, J. (1997). Activities in
schools and programs experiencing the most and least early implementation successes.
School Effectiveness & School Improvement, 5(1), 125. doi: 10.1080/0924345970080106
Spillane, J. P. (2006). D istribu ted leadership. San Francisco: Jossey-Bass.
Straub, E. T. (2009). Understanding technology adoption: Theory and future directions for
informal learning. R eview o f Educational Research, 79(2), 625-649.
doi: 10.3102/0034654308325896
Success for All Foundation. (2012). Administrator’s quick reference guide for PowerTeaching i3.
Success for All Foundation.
Tashakkori, A., & Creswell, J. W. (2007). Editorial: Exploring the nature o f research questions in
mixed methods research. Journal o f M ixed M ethods Research, 1(3), 207-211.
Tashakkori, A., & Teddlie, C. (2010). Putting the human back in "Human Research
methodology” : The researcher in mixed methods research. Journal o f M ixed M ethods
Research, 4(4), 271-277.
Teddlie, C. (2005). Methodological issues related to causal studies o f leadership: A mixed
methods perspective from the USA. E ducational Adm inistration A bstracts, 40(3).
Ten Bruggencate, G., Luyten, H., & Scheerens, J. (2010). Quantitative analysis of international
data, exploring indrect effect models o f school leadership. Enschede: University o f
Twente.
Thomson, P. (2008). Headteacher critique and resistance: a challenge for policy, and for
leadership/management scholars. Journal o f Educational Adm inistration an d H istory,
40(2), 85-100. doi: 10.1080/00220620802210848
Timperley, H. S., & Robinson, V. M. J. (2001). Achieving school improvement through
challenging and changing teachers’ schema. Journal o f E ducational Change, 2(4), 281-
300. doi:10.1023/A:1014646624263
Tomatzky, L. G., & Klein, K. J. (1982). Innovation characteristics and innovation adoption-
implementation: A meta-analysis o f findings. IEEE Transactions on engineering
management, 29(1), 28-45.
Tracey, L., Madden, N. A., & Slavin, R. E. (2010). Effects o f co-operative learning on the
mathematics achievement of Years 4 and 5 pupils in Britain: a randomized control trial.
Effective Education, 2(1), 85-97. doi: 10.1080/19415531003616904
Tuckman, B. W. (1965). Developmental sequence in small groups. P sychological bulletin, 65(6),
384.
Tuckman, B. W., & Jensen, M. A. C. (1977). Stages of small-group development revisited. Group
& Organization M anagement, 2(4), 419-427.
Tyack, D. B. (1974). The one best system : A h istory o f Am erican urban education. Cambridge,
Mass: Harvard University Press.
Tyack, D. B., & Cuban, L. (1997). Tinkering to w a rd utopia: A century o f public sch ool reform.
Cambridge, Mass: Harvard University Press.
Van den Berg, R., Sleegers, P., & Geysel, F. (2000). Implementation of an innovation: Meeting
the concerns o f teachers. Studies in E ducational E valuation, 26, 331-350.
Ven, A. H. V. de, Polley, D. E., Garud, R., & Venkataraman, S. (1999). The innovation journey.
New York: Oxford University Press.
Waters, T., Marzano, R. J., & McNulty, B. (2003). B alanced leadership: What 30 yea rs o f
research tells us about the effect o f leadership on student achievement. A Working
Paper. (Meta-analysis). Denver, CO: McREL. Retrieved from
http://www.mcrel.org/products/144/
Wayman, J. C. (2005). Involving teachers in data-driven decision making: Using computer data
systems to support teacher inquiry and reflection. Journal o f Education fo r Students
P laced a t Risk, 10(3), 295-308.
Weiss, C. H. (1998). Evaluation: methods f o r studying program s and po lic ies . New York:
Prentice Hall.
Wilson, B. D., Bennett Daviss Kenneth. (1994). R edesigning education: A N obel P rize w inner
reveals what must be done to reform Am erican education. New York, NY: Teachers
College Press.
Winter, S. G., & Szulanski, G. (2001). Replication as strategy. Organization Science, 12(6), 730-
743. doi: 10.2307/3086044
Woodbury, S., & Gess-Newsome, J. (2002). Overcoming the paradox o f change without
difference: A model of change in the arena o f fundamental school reform. E ducational
Policy, 16(5), 763-782. doi: 10.1177/089590402237312
Yerrick, R., & Hoving, T. (1999). Obstacles confronting technology initiatives as seen through
the experience of science teachers: A comparative study o f science teachers’ beliefs,
planning, and practice. Journal o f Science Education an d Technology, 5(4), 291-307.

126
APPENDICES

127
Appendix A: Spring Teacher Questionnaire
T ea c h e r Q u e s t io n n a ir e on P o w e r T e a c h in g M a t h
The potential benefit of this questionnaire is to help us improve professional development and project implementation efforts for PowerTeaching. We will also look for changes in responses across schools and years. To explore these changes, we are asking you to provide a unique codename rather than actual names or other identifying information in order to protect your anonymity. Completing the questionnaire should pose no risk to you and is voluntary. It should take you no more than 20 minutes to complete the survey.
Codename: Please fill in the spaces below to create your unique codename. Be sure to use the same code if you completed the fall questionnaire. An example is also provided.
Prompts Your response Example1 .What is the first letter of your birth month?
M
2. Write the first letter of your mother’s name.
E
3. How many brothers and sisters do you have? If none, write 0
3
4. Write the year you graduated from high school using the last 2 digits.
77
5. Write the first letter of the city where you were bom.
W
Write your responses from 1-5: Example: M E 3 77 W
Demographics:
What grade level do you teach? (Check more than one box if necessary.)
□ 6 th □ 7th □ 8 ,h
What math classes do you teach? (Check more than one box if necessary.)
□ General □ Honors □ Algebra I □ Geometry □ Other
What is your role at your school?
□ Math teacher □ Inclusion teacher
Questionnaire Directions: Please indicate the extent to which you agree with the questionnaire statements regarding PowerTeaching. Select one of the four response options.
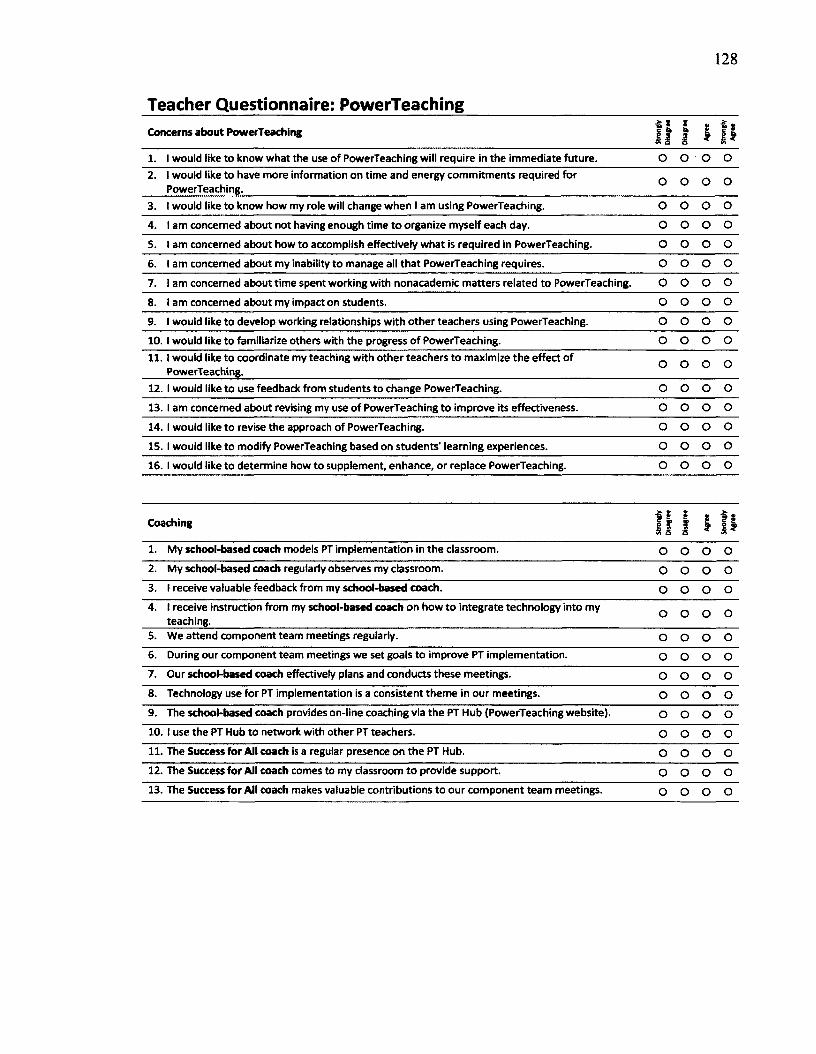
128
Teacher Questionnaire: PowerTeachingConcerns about PowerTeaching
» X
fts1sS I I *
1. 1 would like to know what the use of PowerTeaching will require in the immediate future. O o o o2. 1 would like to have more information on time and energy commitments required for
PowerTeaching.3. 1 would like to know how my role will change when 1 am using PowerTeaching. o o o o4. 1 am concerned about not having enough time to organize myself each day. o o o o5. 1 am concerned about how to accomplish effectively what is required in PowerTeaching. o o o o6. 1 am concerned about my inability to manage all that PowerTeaching requires. o o o o7. 1 am concerned about time spent working with nonacademic matters related to PowerTeaching. o o o o8. 1 am concerned about my impact on students. o o o o9. 1 would like to develop working relationships with other teachers using PowerTeaching. o o o o10. 1 would like to familiarize others with the progress of PowerTeaching. o o o o11. 1 would like to coordinate my teaching with other teachers to maximize the effect of
PowerTeaching. o o o o12. 1 would like to use feedback from students to change PowerTeaching. o o o o13. 1 am concerned about revising my use of PowerTeaching to improve its effectiveness. o o o o14. 1 would like to revise the approach of PowerTeaching. o o o o15. 1 would like to modify PowerTeaching based on students' learning experiences. o o o o16. 1 would like to determine how to supplement, enhance, or replace PowerTeaching. o o o o
Coaching 1 ?I I
Iso § Stro
ngly
Agr
ee
1. My school-based coach models PT implementation in the classroom. o o o o2. My school-based coach regularly observes my classroom. o o o o3. 1 receive valuable feedback from my school-based coach. o o o o4. i receive instruction from my school-based coach on how to integrate technology into my
teaching. o o o o5. We attend component team meetings regularly. o o o o6. During our component team meetings we set goals to improve PT implementation. o o o o7. Our school-based coach effectively plans and conducts these meetings. o o o o8. Technology use for PT implementation is a consistent theme in our meetings. o o o o9. The school-based coach provides on-line coaching via the PT Hub (PowerTeaching website). o o o o10.1 use the PT Hub to network with other PT teachers. o o o o11. The Success for All coach is a regular presence on the PT Hub. o o o o12. The Success for All coach comes to my classroom to provide support. o o o o13. The Success for All coach makes valuable contributions to our component team meetings. o o o o
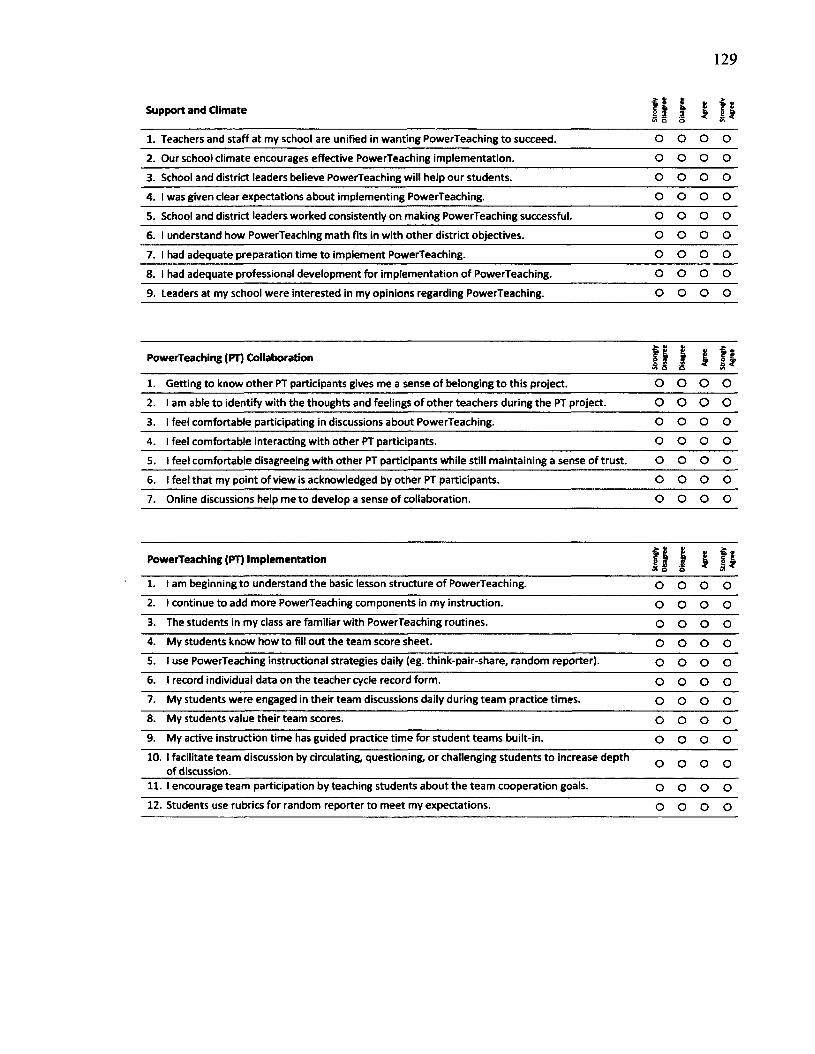
129
Support and Climate I Is sS3 5 Dis
agre
e
t*
I *I *
1. Teachers and staff at my school are unified in wanting PowerTeaching to succeed. o o o o2 . Our school climate encourages effective PowerTeaching implementation. o o o o3. School and district leaders believe PowerTeaching will help our students. o o o o4. 1 was given clear expectations about implementing PowerTeaching. o o o o5. School and district leaders worked consistently on making PowerTeaching successful. o o o o6 . 1 understand how PowerTeaching math fits in with other district objectives. o o o o7. 1 had adequate preparation time to implement PowerTeaching. o o o o8. 1 had adequate professional development for implementation of PowerTeaching. o o o o9. Leaders at my school were interested in my opinions regarding PowerTeaching. o o o o
PowerTeaching (PT) Collaboration>. •» fiK 5 s i I?I*
1. Getting to know other PT participants gives me a sense of belonging to this project. o o o o2. 1 am able to identify with the thoughts and feelings of other teachers during the PT project. o o o o3. 1 feel comfortable participating in discussions about PowerTeaching. o o o o4. 1 feel comfortable interacting with other PT participants. o o o o5. 1 feel comfortable disagreeing with other PT participants while still maintaining a sense of trust. o o o 06. 1 feel that my point of view is acknowledged by other PT participants. o o o 07. Online discussions help me to develop a sense of collaboration. o o o o
PowerTeaching (PT) Implementation f *C M1 3 3 o D
isag
ree
Agr
ee
Stro
ngly
Agr
ee
1. 1 am beginning to understand the basic lesson structure of PowerTeaching. o o o o2. 1 continue to add more PowerTeaching components in my instruction. o o o o3. The students in my class are familiar with PowerTeaching routines. o o o o4. My students know how to fill out the team score sheet. o o o o5. 1 use PowerTeaching instructional strategies daily (eg. think-pair-share, random reporter). o o o o6. 1 record individual data on the teacher cycle record form. o o o o7. My students were engaged in their team discussions daily during team practice times. o o o o8. My students value their team scores. o o o o9. My active instruction time has guided practice time for student teams built-in. o o o o10. 1 facilitate team discussion by circulating, questioning, or challenging students to increase depth
of discussion.o o o o
11. 1 encourage team participation by teaching students about the team cooperation goals. o o o o12. Students use rubrics for random reporter to meet my expectations. o o o o

130
Teamwork Impact
Stro
ngly
Dis
agre
e
Dis
agre
e W0)9 St
rong
lyA
gree
1. Teamwork will promote a sense of belonging among students. o o o o2. Critical thinking is enhanced when students engage in group
discussions.o o o o
3. A sense of trust among students will occur as a result of teamwork.
o o o o4. Teamwork will enhance the achievement of all students. o o o o5. Students are more academically engaged when working together. o o o o6. Students will feel responsible for the success of their teammates. o o o o
For questions about the PowerTeaching Hub, please rate the quality and helpfulness of the materials offered to you on the PowerTeaching website at www.sfapowerteaching.org.__________________________________________________
Quality of PowerTeaching HubPlease rate your satisfaction with the following aspects of the PT Hub. St
rong
lyD
isag
ree
Dis
agre
e
ts9 St
rong
lyA
gree
1. Accessibility o o o o2. Structure o o o o3. Appearance o o o o4. Ease of navigation o o o o5. Content included o o o o
Helpfulness of PowerTeaching HubPlease rate the helpfulness of each PT Hub component in implementing PTM in your classroom. Ha
ve
not
used
Not
help
ful
at al
l
Som
ewha
the
lpfu
l
Ver
yhe
lpfu
l
1. Bulletin Board o o o o2. Calendar o o o o3. Your SFAF Coach o o o o4. Site Map o o o o5. Classroom Resources (eg. Alignment and Scope & Sequence,
Grade/Subject Content)o o o o
6. My Classes/My Work Space o o o o7. Professional Learning Resources (eg. PT component resources) o o o o8. Teacher's Lounge o o o o9. Team Workspace o o o o
What would help you better implement PowerTeaching?

131
Appendix B: Project Manager Interview Protocol
Project Manager Interview Questions—Spring 2013
Instructions: This is a 40-minute interview with 8 questions and a general request for
comment. Please gauge time wisely as interview progresses so that all questions on the protocol
can be addressed. In your answers, please consider schools that have attained em ergent, routine,
or proficient levels of use o f PowerTeaching.
1. How were the 8 pilot schools chosen to participate in the i3 scale-up grant?
For the next few questions, please think about the schools that are implementing PowerTeaching most successfully and with fidelity.These schools have moved beyond "mechanical use ”for at least some objectives and have all the basic school structures in place. They might be schools that have achieved the ‘‘mastery’’ or "power” stages school-wide according to the snapshot. For the duration o f the interview, they’ll be called the "proficient” schools.
The schools that have not yet fully implemented PowerTeaching will be referred to as "emergent” schools. These might be schools that are still in the "learning ” or "significant use ” stages according to the snapshot. They may not have completed or moved beyond "mechanical use ” or do not have basic school structures in place.
"Routine” schools are schools that are not yet "proficient” but are further along the implementation journey than the "emergent ” schools.
2. What distinguishes the proficient schools from the emergent schools?a. Teachers?b. Leadership?c. Coaching?
3. What teacher characteristics do you think were most helpful to achieving successful implementation?
4. What leadership characteristics do you think were most helpful to achieving successful implementation?
5. What did school leaders do to influence successful implementation this year?a. How did district leaders influence successful implementation?
6. When recruiting schools to participate in future years, what school and district characteristics will you look for?
7. If you could begin the pilot year over again and know what you know now, what might you do differently?
8. What else can you tell me about your conclusions at the close of the pilot year?
132
Notification Document for Project Manager Interviews
PROJECT TITLE: Characteristics Influencing Implementation of a Math Reform in 8 high-needs middle schools: A Mixed Methods Study
RESEARCHERSLinda Bol, Ph.D.., Responsible Project Investigator Education Building, Rm 120Old Dominion University, Darden College o f Education Norfolk, Virginia 23529
DESCRIPTION OF RESEARCH STUDYResearchers at Old Dominion University and the Success for All Foundation have contracted with 8
schools to implement a technology-facilitated mathematics instructional model over the next three years. The purpose of this phase of the implementation is to determine the effective and efficient use of resources and methods used during the initial phases of the intervention. This interview will focus on your perceptions of the implementation process to date - particularly the characteristics that influenced implementation during the pilot year of the project. Approximately one other project manager will be participating in this phase of the study. The interview will take about 40 minutes to complete.
RISKS AND BENEFITSRISKS: There is a risk that you may be identified as the sampling process in this study is purposeful sampling. The researcher will reduce the risk that you may be identified by removing all linking identifiers for all participants. And, as with any research, there is some possibility that you may be subject to risks that have not yet been identified.
POTENTIAL BENEFITS: The potential benefit to you for participating in this study is improvement in your guidance and management of the implementation process. Students, teachers, and administrators in the schools may also benefit by these changes, as can the school-based and SFAF coaches.
CONFIDENTIALITYAll information obtained about you in this study is strictly confidential unless disclosure is required by law. The results of this study may be used in reports, presentations and publications, but the researcher will not identify you.
WITHDRAWAL PRIVILEGEIt is OK for you to say NO. Even if you say YES now, you are free to say NO later, and walk away or withdraw from the study -- at any time. Your decision will not affect your relationship with Old Dominion University or otherwise cause a loss of benefits to which you might otherwise be entitled.
CONTACT INFORMATIONThe researchers should have answered any questions you may have had about the research. If you have any questions later on, contact Linda Bol, [email protected], or 757-683-4413.
If at any time you feel pressured to participate, or if you have any questions about your rights, then you should contact the Old Dominion University Office of Research, at 757-683-3460, or George Maihafer, Institutional Review Board Chair, at 757-683- 4520.
INVESTIGATOR'S STATEMENTI certify that I have explained to this subject the nature and purpose of this research, including benefits and risks. I have described the rights and protections afforded to human subjects and have done nothing to pressure, coerce, or falsely entice this subject into participating. I am aware of my obligations under state and federal laws, and promise compliance. I have answered the subject's questions and have encouraged him/her to ask additional questions at any time during the course of this study.
Elizabeth Hoag Carhart, M.A. 616 Rhode Island Avenue Norfolk, VA 23508
Researcher's Signature Date

133
Appendix C: School Leader Interview Protocol
Principal Interview Questions: Spring 2013
Facilitator Guidance:
This is a 40-minute interview with 7 questions. Plan to spend about 5 minutes per
question (including prompts).
Interviewer: We would like to ask some questions about your experiences with
PowerTeaching this year.
1. Now that you have been a PowerTeaching math school for one year, how would
you describe progress in implementation at your school?
a. What kind of support have you received?
b. What barriers have you encountered?
2. What has been your role in implementing PowerTeaching?
a. How has your role changed since implementing PowerTeaching?
b. In what ways do you support PowerTeaching implementation?
3. How does PowerTeaching math align with district initiatives?
4. How have teachers responded to PowerTeaching?
5. How do school-based coaches help to support teachers?
6. How has PowerTeaching affected students?
a. How does teamwork benefit students?
b. What obstacles do students face in PowerTeaching classes?
7. What else can you tell us to help us better understand implementation of
PowerTeaching at your school?
134
Notification: School Principal
PROJECT TITLE: A technology-facilitated scale up of a proven model of mathematics instruction in high need schools
John Nunnery, Ed.D., Responsible Project Investigator Executive Director,The Center for Educational Partnerships Old Dominion University 4111 Monarch Way, Suite 3113 Norfolk, Virginia 23508
As you know, we work at Old Dominion University and are collecting information about the technology-facilitated mathematics instructional model called PowerTeaching (PT). We need your feedback to help to improve it. This interview will focus on your perceptions of PT that include the usability and efficiency of the technology-facilitated resources. If you decide to participate, then you will join a study of principals from participating pilot schools across the United States.Approximately 7 other principals will be participating in this phase of the study. The interview will take about 40 minutes to complete.
The potential benefit of your participation is improvement in your instructors' mathematics and educational technology instructional strategies. Students, other teachers, coaches, and administrators in your school may also benefit by these changes. Risks are minimal, but there is a risk that you may be identified because there is only one principal per school. The researchers will maintain strict confidentiality unless required by law. We will reduce the risk by removing all linking identifiers for all participants. We are audio-taping the interview, but only project researchers at ODU will have access to these tapes. We will remove all identifiers from the transcripts. The results of this study may be used in reports, presentations and publications, but the researcher will not identify you. We will report only summary information about principals in general.
It is OK for you to say NO. Even if you say YES now, you are free to say NO later, and walk away from this interview at any time. Your decision will not affect your relationship with Old Dominion University or your school, or otherwise cause a loss of benefits to which you might otherwise be entitled.
The researchers should have answered any questions you may have had about the research. If you have any questions later on, contact, John Nunnery, the Principal Investigator at 757-683-3596 or [email protected]. If at any time, you have any questions about your rights as a participant, then you should contact the Old Dominion University Office of Research, at 757-683-3460 or George Maihafer, Institutional Review Board Chair, at 757-683-4520. Thank you very much for your consideration.
Co-Investigators at The Center for Educational Partnerships*
Linda Bol, Ph.D. Pamela Arnold, M.A.Terrell Perry, Ed.D.Elizabeth Hoag Carhart, M.A. Julia Zaharieva, M.S.
Gary Morrison, Ph.D. Shanan Chappell Ph.D. Melva Grant, Ph.D.*Address same as RPI

135
Appendix D: Teacher Interview Protocol
Teacher Interview Questions Spring 2013
Facilitator Guidance:
This is a 40-minute interview with 20 questions. Plan to spend about 2 minutes per
question.
Interviewer: We would like to ask some questions about your experiences with
PowerTeaching this year.
1. What are the major benefits of PowerTeaching?2. What helped you the most in getting started with PowerTeaching?3. Describe the role of school leadership in adopting PowerTeaching?4. What were some of the hurdles you faced in adopting PowerTeaching?5. What PowerTeaching resources have you used most frequently?
a. Which have you used least frequently?6. What other resources do you need to be able to implement PowerTeaching
effectively?7. How has the SFAF coach helped you implement PowerTeaching?8. How has the school-based coach supported your implementation of
PowerTeaching this year?Prompts:
a. How did feedback from the school-based coach support your implementation of PowerTeaching?
b. How has being a member of a component team support your implementation of PowerTeaching?
9. Describe how the PT Hub is connected to your PowerTeaching:10. What barriers hindered your use of the PT Hub?11. What would help you increase your usage of the PT Hub?12. What has access to both online and face-to-face support at the same time meant for
your PowerTeaching?13. What skills are most important for math learning?14. How does PowerTeaching influence mathematics learning?15. How has PT influenced the way you teach math?16. If you teach students with IEPs, think about them for a moment. How is
PowerTeaching connected to their learning?17. You may also teach other socio-economically, racially and linguistically diverse
groups of students. How is PowerTeaching connected to the learning of students from any of these groups?
18. In what ways have the cooperative learning aspects of PowerTeaching affected students’ learning?

136
a. How has students’ higher order thinking been influenced by using the cooperative learning strategies of PowerTeaching?
b. How have the cooperative grouping strategies of PowerTeaching affected relationships in the classroom?
19. Describe your experiences in implementing cooperative learning in the classroom.a. What are the benefits?b. What are the challenges?
20. What else can you tell me about PowerTeaching or its implementation that I have not already asked?

137
Appendix E: SFAF School Snapshot
#APowerTeaching i3
School:
District:.
State:__
Principal:.
Math Coach:
Grades Implementing: 0 6 0 7 C 8 □ Other
Math
Attendance
Baseline
1
2
3
4
G ■ Goal BmSM 1 2 3 4R “ Results
G R G R G R G R G RGrade 6
Grade 7
Grade 8
ESISPED
SchoolwideAverage
Snapshot Report
B 1 2 3 4________ IP = in Place; N = Not in Place
Fundamentals
O M la a a tn wid r a f f h n » ncd«ad MMdtW training (l)
0 Material* necessary for progam Implementation are complete. (2)
O School-based Math Coach a a fuS-tim* position. (4)
0 The principal is fuHy involved with PowerTeaching implementation. (7)
0 Instructional component team s meet e t least twice a month to address professions Wevelopment needs and connect teachers to online end print resources for progam support. (8)
Assessment
O Accurate School Summery Form is maintained for every p a d in f period. (19)
0 Formal math-fcenchmerfc assessm ents with consistent m easures are conducted a t the begnnlngof m e year end a t the end of each getting period. (20)
0 Teacher cycle record farms or weekly record forms ere used by aB teachers to record classroom data throughout the f a d in g period. (21)
0 A Classroom Assessment Summary ts submitted quarterly by each teacher. (22)
Leadership Team
0 The Leadership mem meets monthly to review schoolwlds data, and prepare for the quarterly m eetings (31)
0 The leadership team knows the number and percentage of sttidents achieving at grade ievei end meeting quarterly profldency goals. (32)
0 Quarterly meetings are held a t the start of school and quarterly to review schoolwide progress toward achievement gMis. (33)
0 Instructional component teams se t SMARTS targets baaed on program data, chart progress, end work odaborattvehr to m eet their targats. (34)
0 The school-based math coach uses the GREATER coaching process to support continuous improvement of student achievement througi Hgv-quatty implementation. (36)
Priorities for impiemantadon : 0 mechanical 0 routine 0 refined
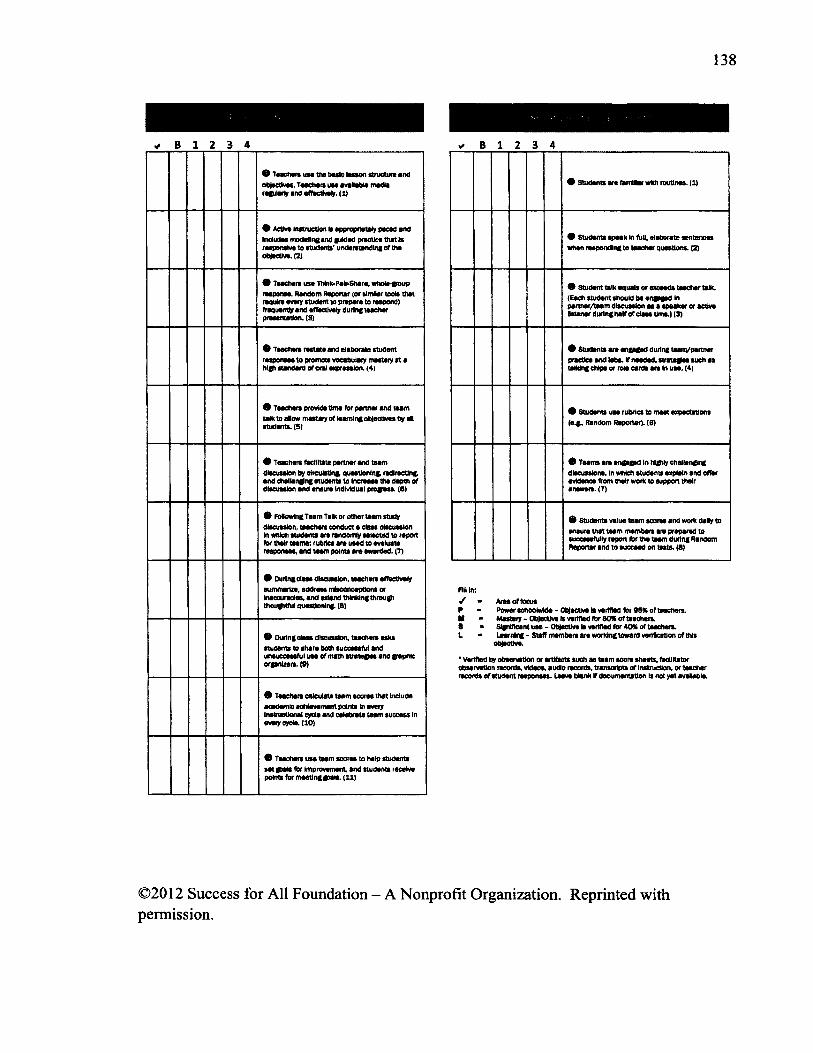
138
0 Teachers use the baste lesson structure and objectives. Teachers use avelew e media ragSariy and effectively, ( i)
0 Active Instruction is appropriately paced and includes modeling and glided practice that is responsive to students' understanding of the objective. (2)
0 Teachers use ThMt*PWr>Share, whotegoup response, Random Reporter (or similar tools that require every student to prepare to respond) frequently and effectively during teacher presentation. (3)
0 Teachers restate and elaborate student responses to promote vocabulary mastery a t a high standard of oral expression. (4)
0 Teachers provide time for partner and team taiK toaiow mastery of teaming objectives by aH students. (5)
0 Teachers facilitate partner and team discussion by circulating, questioning redirecting, and challenging students to Increese the depth of discussion arte ensure individual progese. (6)
0 FoflowkigTeemTafc or other team study discussion, teachers conduct a class discussion In which students are rendofrty selected to report for thefr teams; rubrics are used to evaluate responses, arte team points are awarded. (7)
0 During d e s s discussion, teachers effectively summarize, address misconceptions or tneccuradae, and extend thinMngthrougt thougrtful questioning. (9)
0 During d e s s discussion, teachers asks students to share both successful arte unsuccessful use of math su a teg es and graphic organizers. (9)
0 Teachers calculate team scores that include academic achievement points In every insmretionai eyde end celebrate teem success in every cycle. (ID)
0 Teachers use team scores to help students s e t gates for improvement and students receive points for meetingflpelt. <U )
0 Students are famMer with routines. (1)
0 Students speak In fu i, elaborate sentences when responding to teacher questions. (2)
0 Student talk equals or exceeds teacher talk. {Each student should be e n g ^ sd in partner/team discussion as a speaker or active Sstener during half of d e s s time.) (3)
0 Students are engaged during tearvpertner practice and labs. If needed, stratages such as talking chips or role cards are In use. (4)
0 Students use rubrics to meat expectations (e.g. Random Reporter). (6)
0 Teams w e engaged in hlgdy ehaUengng discussions, in which students explain and offer evidence from their work to support their answers. (7)
0 Students value team scores and work daly to ensure that teem members are prepared to successfully report for the team during Random Reporter arte to succeed on tests. (8)
nit In:/ - Area of focusP - Power schoolwide - Objective is verified for 95% of teachers.M - Mastery-Objective is verified for 80% of teachers.9 * Sfcnlficant use - Objective is verified for 40% of teachers,L * Learning - Staff member* are working toward vertficstion of this
objective.
* Verified by observation or artifacts such a s ta tm scora sheets, factiRstor observation records, video*. audio rscords, transcript* of Instruction, or teacher racords of student responses. Leave War* if documentation Is notyat avalawe.
©2012 Success for All Foundation - A Nonprofit Organization. Reprinted with permission.
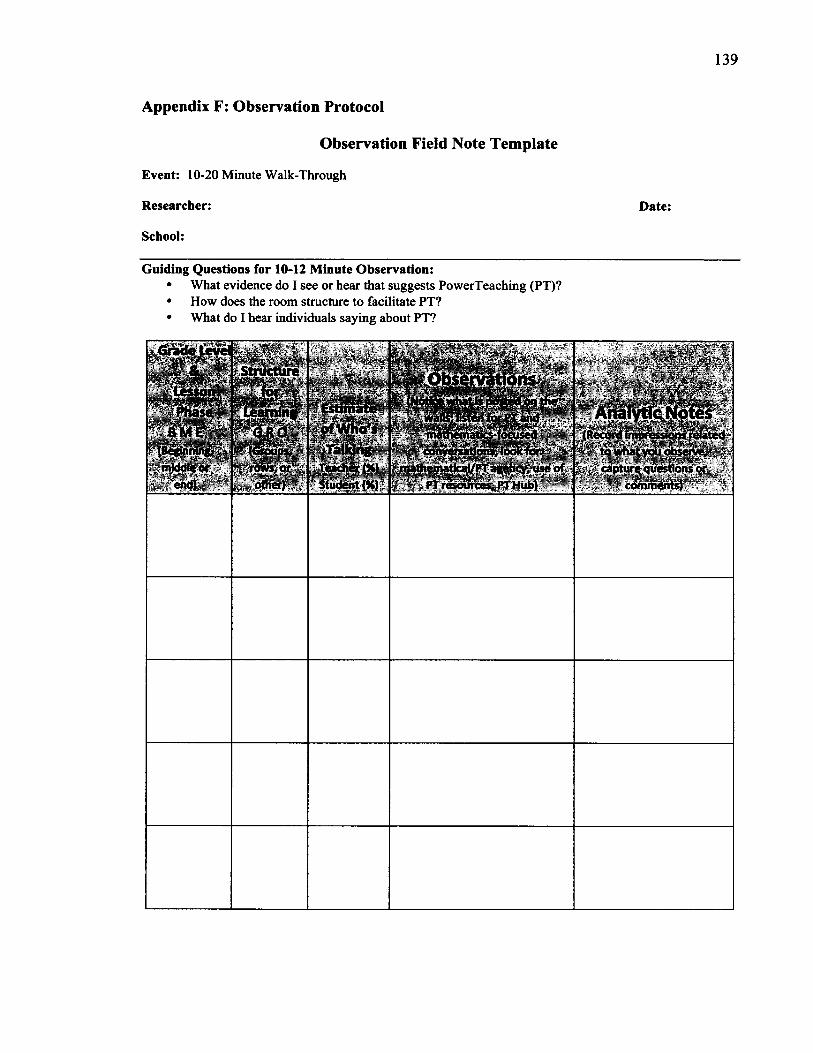
139
Appendix F: Observation Protocol
Observation Field Note Template
Event: 10-20 Minute Walk-Through
Researcher: Date:
School:
Guiding Questions for 10-12 Minute Observation:• What evidence do I see or hear that suggests PowerTeaching (PT)?• How does the room structure to facilitate PT?• What do I hear individuals saying about PT?
m sm m m
-v*. Lesson;?-; '-V.rtiase?'-■'» SmSVv
|| middle or
8 end)
[• (Group*;} ' raws, or *
other)
i?-v-
';ofWta's;
Student (X)
-'v>' *• v
^ y'ft * v’’' - -i«•&<>;■■■•
;S*™ v , * * - - .
mathejrwttcirl/PT agency; use o f k-'y? PT resources, PTHub)
: ’• - ■A >.v *..•■s/5 J *4VJAnalytic Notes> ■ '*v':-'v ■ ■ (Record impressions related
to what you observe,capture questions or
com m ents)
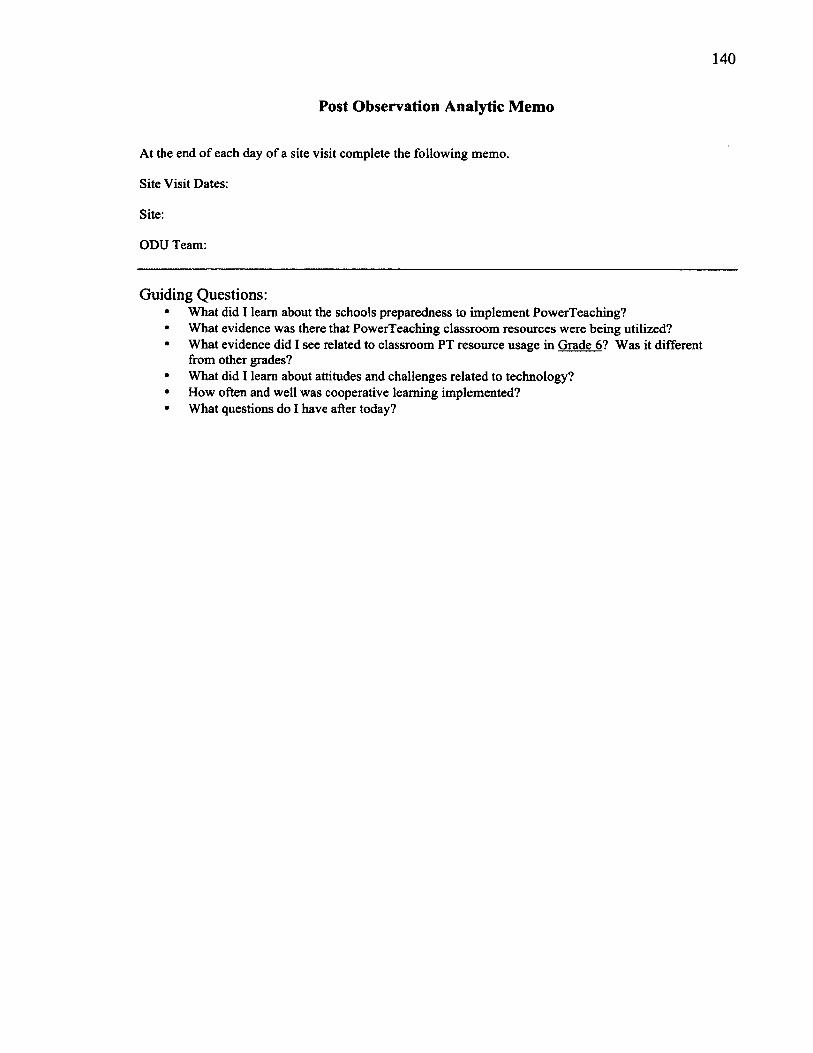
140
Post Observation Analytic Memo
At the end of each day of a site visit complete the following memo.
Site Visit Dates:
Site:
ODU Team:
Guiding Questions:• What did I learn about the schools preparedness to implement PowerTeaching?• What evidence was there that PowerTeaching classroom resources were being utilized?• What evidence did I see related to classroom PT resource usage in Grade 6 ? Was it different
from other grades?• What did I learn about attitudes and challenges related to technology?• How often and well was cooperative learning implemented?• What questions do I have after today?

141
Appendix G: Observation code sheet
P o w e r T e a c h i n g i3 O b s e r v a t i o n s : C o d e S h e e t f o r S P R IN G 2 0 1 3
S c h o o l # C l a s s r o o m #
T h e o r e t ic a lF r a m e w o r k
L e v e l o f U se / L e v e l o f I m p le m e n ta t i o n Sc o r e
No use (#)
M echanical(1)
Routine(2)
1 Instruction (verbal cues)
• Verbal cues according to PT framework
No cues related toPowerTeachingobserved
isolated verbal cues related to PT (zero noise signal, get the Roof)
Use of PowerTeaching framework is evident (multiple verbal cues related to PT)
No reference to student teams
Isolated references to student teams, one mention
Continued reference to student teams, instruction is volleyed back and forth from active instruction to team activities
_ /6
• Evidence of random reporter rubric use
No random reporter used or mentioned
Random reporter in evidence (sticks, number called, etc.) but rubric not used
Random reporter rubric used or verbal reference or prompt given (“you didn’t justify your answer but you gave a complete sentence”)
Classroom PT artifacts• Team celebration pts
poster• Team cooperation goals
poster• Team celebration
certificates• Team folders• Current team score sheet
• No artifacts observed
• Some artifacts present• May not be observed
in use• May not be current
• most artifacts present• most current• Perhaps observed in use
_ / 4
• Desks/table arrangement (student seating)
• rows• horseshoe• circle
• Groups• Pairs • Teams
Student Team Interaction• Active instruction
vs. team interaction
Direct instruction only (ije. continuous lecture by teacher seated at overhead projector)
Both student -student interactions and active / direct instruction
Significant observed student* student interaction about math
_ 7 4
• % Teacher talk vs. % student talk
90-100% Teacher talk0-10% Student talk
50-75% Teacher talk 25-50% Student talk
*Teacher talk higher end beginning o f class—direc
0-40% Teacher talk 60-100% student talk
o f range if observation was at t instruction more likely
TOTAL CLASSROOM SCORE _ /1 0
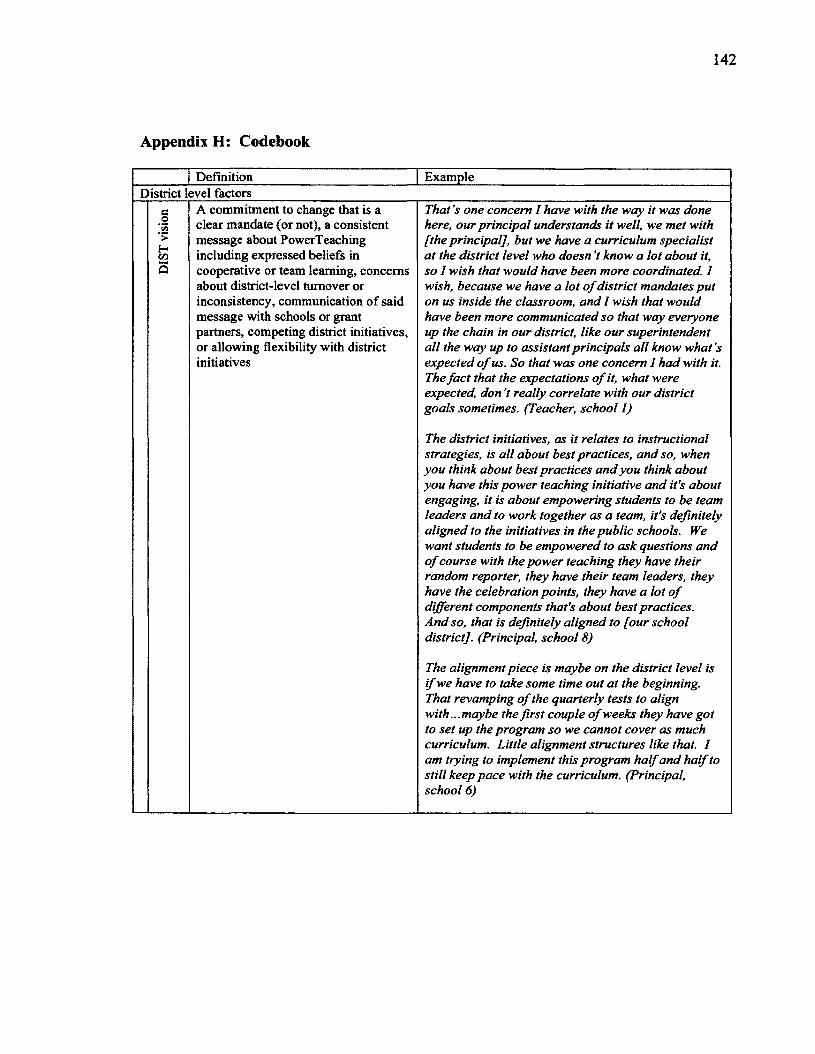
142
Appendix H: Codebook
Definition ExampleDistrict level factors
eo>Hco»—*Q
A commitment to change that is a clear mandate (or not), a consistent message about PowerTeaching including expressed beliefs in cooperative or team learning, concerns about district-level turnover or inconsistency, communication of said message with schools or grant partners, competing district initiatives, or allowing flexibility with district initiatives
That’s one concern I have with the way it was done here, our principal understands it well, we met with [the principal], but we have a curriculum specialist at the district level who doesn’t know a lot about it, so I wish that would have been more coordinated. I wish, because we have a lot o f district mandates put on us inside the classroom, and I wish that would have been more communicated so that way everyone up the chain in our district, like our superintendent all the way up to assistant principals all know what’s expected o f us. So that was one concern I had with it. The fa c t that the expectations o f it, what were expected, don V really correlate with our district goals sometimes. (Teacher, school 1)
The district initiatives, as it relates to instructional strategies, is all about best practices, and so, when you think about best practices and you think about you have this power teaching initiative and it's about engaging, it is about empowering students to be team leaders and to work together as a team, it's definitely aligned to the initiatives in the public schools. We want students to be empowered to ask questions and o f course with the power teaching they have their random reporter, they have their team leaders, they have the celebration points, they have a lot o f different components that's about best practices.And so, that is definitely aligned to [our school district], (Principal, school 8)
The alignment piece is maybe on the district level is i f we have to take some time out at the beginning. That revamping o f the quarterly tests to align with...maybe the first couple o f weeks they have got to set up the program so we cannot cover as much curriculum. Little alignment structures like that. I am trying to implement this program half and half to still keep pace with the curriculum. (Principal, school 6)

143
DIST
Re
sour
ces
Creating conditions for change at a district level, providing necessary resources for schools (coaches, ipads, PD time, initial training)
My biggest concern, and I am going to put it out there, is not knowing whether we are going to have a full-time math coach next year. I have no idea where we stand with that. (Principal, school 7)Our Superintendent gave us some safety net funds that was to provide additional support within the school day. I threw all o f mine into math and the PowerTeaching model lent itself to having extra people come in. (Principal, school 5)
Supporting the schools, principals, or I think it put everybody at the 8 ball starting at theteachers, attendance or interest in beginning because everyone was worried that weprofessional development and PT wouldn't get everything covered in the curriculum.training, attending meetings, etc. Because o f the way it was put in I don't think they
restructured the curriculum to meet the timeframeand to look at what time would be needed toimplement. I think those are some things that fo rwhatever reason and when teachers know there is thenew evaluation system and everything was going tobe based on scores and goals, I think a panic attack
cl£00
set in. (Principal, school 6)e.g I mean at school 2, it happens that the district person
- 2"u was very visual in the school. [The individual] has auH relationship with those teachers, ... never lost that2 2 direct connection to the sch oo l... [and]... wasQ evident in the school. (Project manager)
School level factorsAt the school level, a shared vision (or Now if you mean like administration and leadershipnot), clearly communicated, a o f the school, they haven’t really been too involved incommitment to change (or not), a that process as a whole, so I don’t really know,consistent effort (or not), turnover or (Teacher, school 1)consistency in SCH leader, beliefsabout cooperative learning/team At first when they didn 't have a coach, the mentalitylearning, beliefs about role as was do what you can and don’t stress out about it.instructional leader, etc. Our student’s performance is more important than
worrying about implementing PowerTeachingstrategies, especially since we do not have a coach.... They have been very supportive. There hasn’tbeen any o f the “You will do this. " It is more o f
e “The important thing here is that our students areo"co successful. I f this helps our students to be successful">hr1
all the better, but i f it is hindering our students fromu being successful then we need to go back and thison has to go on the back burner. ” (Teacher, school 7)
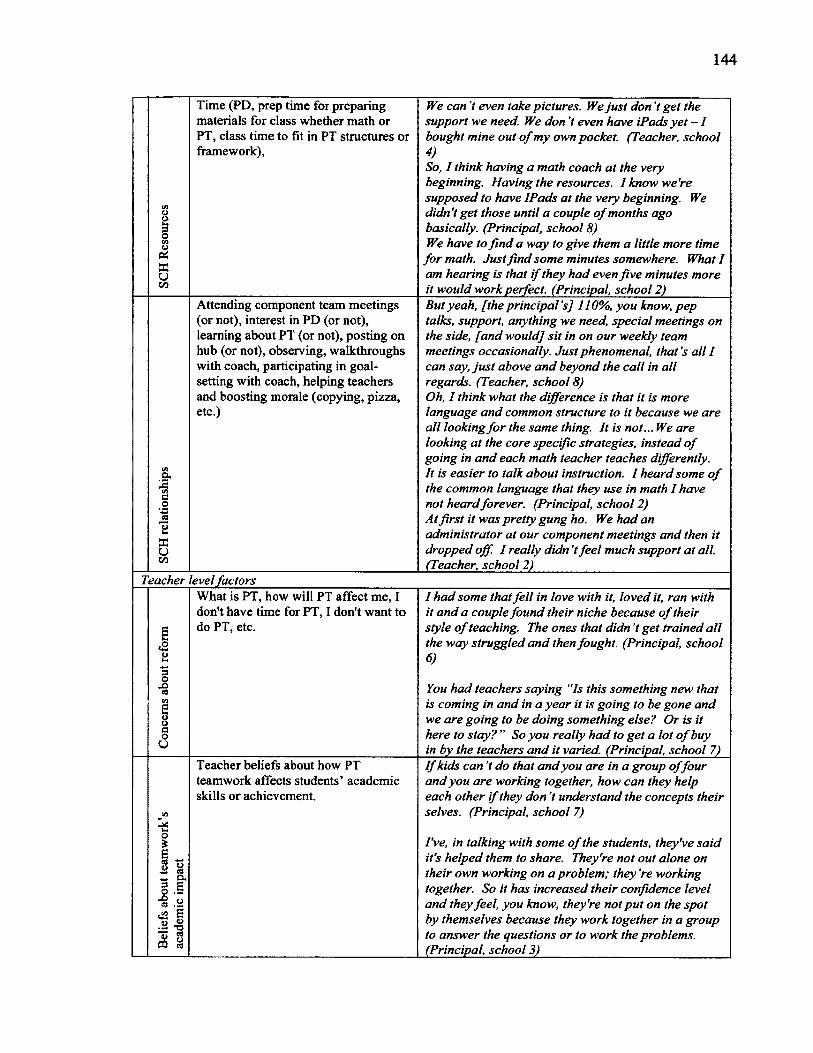
144
Oa3oV3oOtECUoo
Time (PD, prep time for preparing materials for class whether math or PT, class time to fit in PT structures or framework),
We can't even take pictures. We just don’t get the support we need. We don’t even have iPads ye t - 1 bought mine out o f my own pocket. (Teacher, school 4)So, I think having a math coach at the very beginning. Having the resources. I know we're supposed to have IPads at the very beginning. We didn't get those until a couple o f months ago basically. (Principal, school 8)We have to find a way to give them a little more time
fo r math. Just find some minutes somewhere. What I am hearing is that i f they had even five minutes more it would work perfect. (Principal, school 2)
Attending component team meetings (or not), interest in PD (or not), learning about PT (or not), posting on hub (or not), observing, walkthroughs with coach, participating in goal- setting with coach, helping teachers and boosting morale (copying, pizza, etc.)
a.J5tfic.2
8ECOco
But yeah, [the principal’s] 110%, you know, pep talks, support, anything we need, special meetings on the side, [and would] sit in on our weekly team meetings occasionally. Just phenomenal, that's all I can say, ju st above and beyond the call in all regards. (Teacher, school 8)Oh, I think what the difference is that it is more language and common structure to it because we are all looking fo r the same thing. It is not... We are looking at the core specific strategies, instead o f going in and each math teacher teaches differently.It is easier to talk about instruction. I heard some o f the common language that they use in math I have not heard forever. (Principal, school 2)At first it was pretty gung ho. We had an administrator at our component meetings and then it dropped off. I really didn ’t feel much support at all. (Teacher, school 2)___________________________
Teacher level factors
«S83OJ3aooeoo
What is PT, how will PT affect me, I don't have time for PT, I don't want to do PT, etc.
I had some that fe ll in love with it, loved it, ran with it and a couple found their niche because o f their style o f teaching. The ones that didn’t get trained all the way struggled and then fought. (Principal, school 6)
You had teachers saying “Is this something new that is coming in and in a year it is going to be gone and we are going to be doing something else? Or is it here to stay? ” So you really had to get a lot o f buy in by the teachers and it varied. (Principal, school 7)
Teacher beliefs about how PT teamwork affects students’ academic skills or achievement.
o£E _S £2CO
C l
§.§ •8 .a553 i .2 •§is sCQ ^
I f kids can't do that and you are in a group offour and you are working together, how can they help each other if they don't understand the concepts their selves. (Principal, school 7)
I've, in talking with some o f the students, they’ve said it's helped them to share. They're not out alone on their own working on a problem; they 're working together. So it has increased their confidence level and they feel, you know, they're not put on the spot by themselves because they work together in a group to answer the questions or to work the problems. (Principal, school 3)___________________________
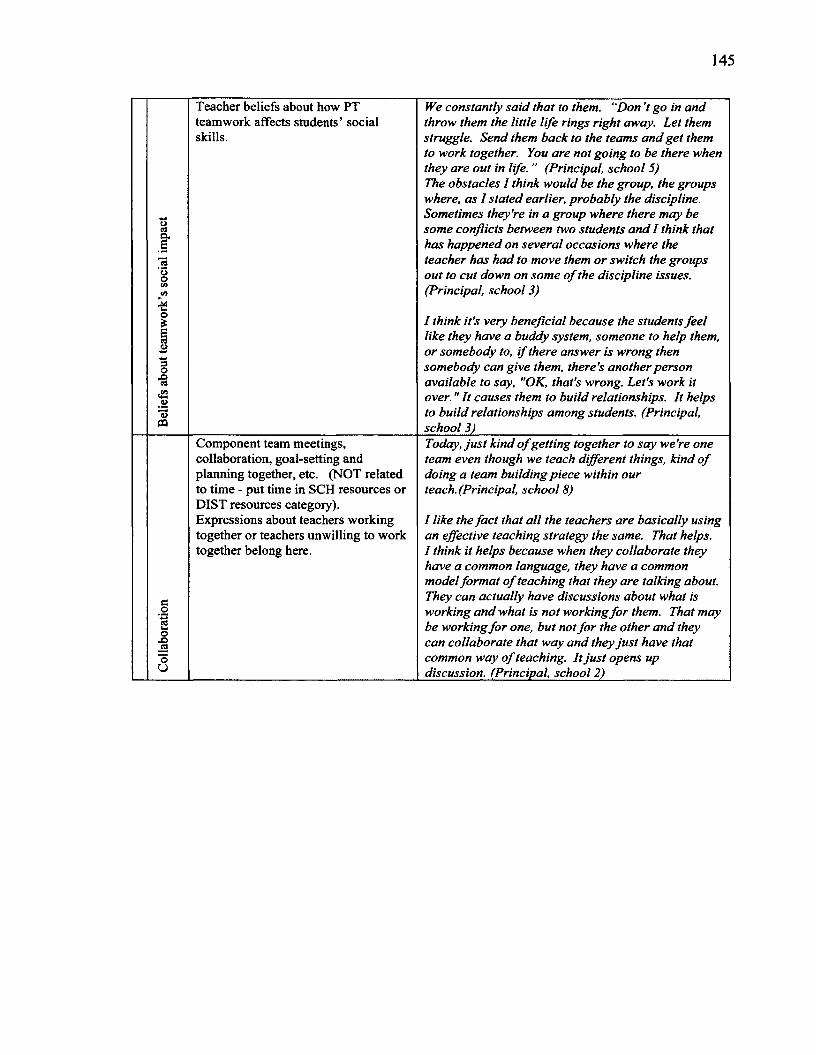
145
Belie
fs ab
out
team
work
’s so
cial
impa
ct
Teacher beliefs about how PT teamwork affects students’ social skills.
We constantly said that to them. “D on’t go in and throw them the little life rings right away. Let them struggle. Send them back to the teams and get them to work together. You are not going to be there when they are out in life. ” (Principal, school 5)The obstacles I think would be the group, the groups where, as I stated earlier, probably the discipline. Sometimes they're in a group where there may be some conflicts between two students and I think that has happened on several occasions where the teacher has had to move them or switch the groups out to cut down on some o f the discipline issues. (Principal, school 3)
I think it's very beneficial because the students feel like they have a buddy system, someone to help them, or somebody to, i f there answer is wrong then somebody can give them, there's another person available to say, "OK, that's wrong. Let's work it over." It causes them to build relationships. It helps to build relationships among students. (Principal, school 3)
Component team meetings, Today, ju st kind o f getting together to say we're onecollaboration, goal-setting and team even though we teach different things, kind o fplanning together, etc. (NOT related doing a team building piece within ourto time - put time in SCH resources or teach. (Principal, school 8)DIST resources category).Expressions about teachers working I like the fact that all the teachers are basically usingtogether or teachers unwilling to work an effective teaching strategy the same. That helps.together belong here. I think it helps because when they collaborate they
have a common language, they have a commonmodel format o f teaching that they are talking about.
J3 They can actually have discussions about what is.2 working and what is not working for them. That mayceImo be working for one, but not fo r the other and theyX5J— can collaborate that way and they just have thato common way o f teaching. It just opens upo discussion. (Principal, school 2)
146
VITA
E l iz a b e t h H o a g C a r h a r t
Department of Educational Foundations and Leadership 120 Education Building; Old Dominion University Norfolk, VA 23529 [email protected]
E d u c a t io n
Ph.D., Old Dominion University, expected December 2013 Educational Foundations and Leadership
M.A., Pennsylvania State University, 1998 Educational Policy
B.A., Bethel College, St. Paul, Minnesota, 1990 History & Secondary Education, Social Studies
H o n o r s a n d A w a r d s
Darden College of Education Dissertation Fellowship, ODU, 2012-2013 David L. Clark National Graduate Student Research Seminar in Educational
Administration and Policy, UCEA/AERA, 2012
P r o f e s s io n a l E x p e r ie n c e
2013-present Graduate Research Assistant, Old Dominion University ResearchFoundation, US Department of Education i3 Grant
2012-2013 Darden College of Education Dissertation Fellowship, Old DominionUniversity
2011-2012 Graduate Research Assistant, Old Dominion University ResearchFoundation, US Department of Education i3 Grant / TCEP
2009 Graduate Research Assistant, Department of Educational Foundationsand Leadership, Old Dominion University
2006-2008 Adjunct Instructor, History Department, Old Dominion University1999-2001 Instructor of Web Design, Internet Technology Institute, Rutgers
University1992-2000 Social Studies Teacher, Hunterdon Central Regional High School,
Flemington, New Jersey
P r e s e n t a t io n s a n d P u b l ic a t io n s
Carhart, E. H., Nunnery, J. A., Bol, L., Arnold, P., Chappell, S., Grant, M., & Morrison, G. (2013). Readiness for Reform in Middle Schools Adopting PowerTeaching for Mathematics Instruction. Presented at the AERA, San Francisco, CA.
Nunnery, J. A., Bol, L., Morrison, G., Arnold, P., Perry, T., Chappell, S., Carhart, E. H., Zaharieva, J. (2013). A Technologically-Facilitated Scale Up o f a Proven Model o f Mathematics Instruction in High Need Schools: 2013 Spring Term Formative Evaluation Report. Norfolk, VA: The Center for Educational Partnerships at Old Dominion University.
147
Nunnery, J. A., Bol, L., Morrison, G., Arnold, P., Chappell, S., Grant, M., Carhart, E. H., Zaharieva, J. (2013). A Technologically-Facilitated Scale Up o f a Proven Model o f Mathematics Instruction in High Need Schools: Midterm Formative Evaluation Report. Norfolk, VA: The Center for Educational Partnerships at Old Dominion University.
Nunnery, J. A., Pribesh, S., Ross, S. M., Yen, C. J., & Carhart, E. H. (2012, April). Effects o f the National Institute fo r School Leadership’s Executive Development Program on School Performance in Massachusetts. Presented at the American Educational Research Association Annual Meeting, Vancouver, British Columbia.
Chappell, S., Gamer, J. K., Nunnery, J. A., & Carhart, E. H. (2012, February).Estimates o f Reliability fo r Student Growth Percentiles. Presented at the Eastern Educational Research Association Annual Meeting, Hilton Head, SC.
Gamer, J. K., Jonas, D. L., Nunnery, J. A., Chappell, S., & Carhart, E. H. (2012). The Virginia Student Growth Measure: professional development webinar modules.
Nunnery, J. A., Ross, S. M., Chappell, S., Pribesh, S., & Carhart, E. H. (2011). The impact o f the NISL executive development program on school performance in Massachusetts: Cohort 2 results (Research Brief) (p. 15). Norfolk, VA: The Center for Educational Partnerships at Old Dominion University. Retrieved from http://nisl.net/NISL201 lMAstudy.pdf
Carhart, E. H. & Osbome, J. W. (2013). Best practices fo r rotation in factor analysis. Manuscript in preparation.
P r o f e s s io n a l T r a in in g
Certified Web Designer, Certified Webmaster, 2000 Rutgers University ITI; New Brunswick, NJ
German languageExchange, Freiburg, Germany, 2009-2010Institute fur Sprachvermittlung, Berlin, Germany, Mittelstufe II, 2002