9/23/13 accustomed eavesdropped e xpressway t emptations facilities s anitation b lubbering
The Measurement and Monitoring of Water Supply, Sanitation and Hygiene (WASH) Affordability May 2021
1 Introduction
The Measurement and Monitoring of Water Supply, Sanitation and Hygiene (WASH) Affordability
A Missing Element of Monitoring of Sustainable Development Goal (SDG) Targets 6.1 and 6.2 A collaboration of the WHO/UNICEF Joint Monitoring Programme (JMP), the UN-Water Global Analysis and Assessment of Sanitation and Drinking-Water (GLAAS) and an Expert Group on WASH Affordability
Summary Report May 2021
Disclaimer
Published by UNICEF and WHOProgramme Division/WASH3 United Nations PlazaNew York, NY 10017 USAwww.unicef.org/wash
© United Nations Children’s Fund (UNICEF) and the World Health Organization (WHO), 2021
Suggested citation: The measurement and monitoring of water supply, sanitation andhygiene (WASH) affordability: a missing element of monitoring of Sustainable Development Goal(SDG) Targets 6.1 and 6.2. New York: United Nations Children’s Fund (UNICEF) and theWorld Health Organization, 2021.UNICEF ISBN: 978-92-806-5218-5WHO ISBN: 978-92-400-2400-7 (electronic version)WHO ISBN: 978-92-400-2401-4 (print version)
Permission is required to reproduce any part of this publication. For more information on usage rights, please contact [email protected]
The designations employed and the presentation of the material in this publication do not imply the expression of any opinion whatsoever on the part of UNICEF or WHO concerning the legal status of any country, territory, city or area or of its authorities, or concerning the delimitation of its frontiers or boundaries. Dotted or dashed lines on maps represent approximate border lines for which there may not yet be full agreement.
All reasonable precautions have been taken by UNICEF and WHO to verify the information contained in this publication. However, the published material is being distributed without warranty of any kind, either expressed or implied. The responsibility for the interpretation and use of the material lies with the reader. In no event shall UNICEF or WHO be liable for damages arising from its use.The statements in this publication are the views of the author(s) and do not necessarily reflect the policies or the views of UNICEF or WHO.
1

The Measurement and Monitoring of Water Supply, Sanitation and Hygiene (WASH) Affordability May 2021
2
Member Title/Institution
Acknowledgements
Barbara Mateo Expert on Human Rights & Implementation, previously served as adviser to the former Special Rapporteur on the Human Rights to Safe Drinking Water and Sanitation
Luis Andres Lead Economist, World Bank
John Garrett Senior Policy Analyst (Development Finance), WaterAid
Manuel Teodoro Associate Professor, LaFollette School of Public Affairs, University of Wisconsin-Madison, USA
Alexander (Sasha) Danilenko
Senior WASH Specialist and Responsible for IB-NET, World Bank
Dale Whittington Professor, Department of Environmental Sciences and Engineering and Professor, Department of City and Regional Planning, University of North Carolina, Chapel Hill, USA
Luke Wilson Deputy Director, Center for Water Security and Cooperation
Peter Mutale Chief Inspector, National Water Supply and Sanitation Council, Zambia
Joseph Cook Former Special Associate Professor, School of Economic Sciences, Washington State University, Pullman, WA
Michael Rouse Distinguished Research Associate at the University of Oxford and formerly Head of the Drinking Water Inspectorate, UK
Xavier LeFlaive Principal Administrator, OECD
Henri Smets Water Academy, Paris
Manuel Alvarinho Former President of Water Regulatory Council, Mozambique
Rob Hope Professor of Water Policy, School of Geography and the Environment and Smith School for Enterprise and the Environment, Oxford University, UK
Leo Heller Special Rapporteur on the Human Rights to Safe Drinking Water and Sanitation, and Researcher, Oswaldo Cruz Foundation, Brazil
Pali Lehohla Member, UN Statistical Commission; and former Statistician-General for Statistics South Africa
Yaw Sarkodie Consultant, Former Team Leader, Water and Sanitation Monitoring Platform, Ghana
This initiative was led by Guy Hutton, Senior Adviser for water, sanitation and hygiene, UNICEF. The initiative has received the valuable inputs of members of the expert consultative group on WASH affordability, the teams of the UNICEF/WHO Joint Monitoring Programme and the UN-Water Global Analysis and Assessment of Sanitation and Drinking-Water (GLAAS) team, consultants, and UNICEF country offices where case studies were conducted.
Members of the expert consultative group were as follows, in alphabetical order:
MEMBERS OF THE EXPERT CONSULTATIVE GROUP
Acknowledgements

The Measurement and Monitoring of Water Supply, Sanitation and Hygiene (WASH) Affordability May 2021
3
Resource Position Role
Guy Hutton Senior Adviser, WASH Section, UNICEF
Technical lead and convener of expert group, and lead author of concept note, methodology guide, Ghana case study and synthesis report
Sofia Murad Contributions on GLAASTechnical Officer, Water, Sanitation and Health Unit, WHO
Marina Takane Contributions on GLAASTechnical Officer, Water, Sanitation and Health Unit, WHO
Rick Johnston Technical Officer (JMP), Water, Sanitation and Health Unit, WHO
Lead of JMP, WHO
Zachary Burt UNICEF Consultant Drafted 5 country case studies, contributed to Ghana case study, and co-author of synthesis report
Tom Slaymaker Senior Statistics and Monitoring Specialist (JMP), Data & Analytics Section, UNICEF
Lead of JMP, UNICEF
Joao Costa UNICEF Consultant Helped initiate affordability country case studies
Fiona Gore Manager of GLAAS, Water, Sanitation and Health Unit, WHO
Lead of UN-Water GLAAS
Simone Klawitter UNICEF Consultant Wrote UNICEF paper and guidelines on WASH affordability response
Rob Bain Statistics and Monitoring Specialist (JMP), Data & Analytics Section, UNICEF
Technical contributions on data sets
Akmal Abdurazarov UNICEF Consultant Extracted data from income and expenditure surveys, wrote protocol for analysis of expenditure surveys (Annex C), and co-author of country case studies
MEMBERS OF THE UNICEF AND WHO TEAMS (IN ALPHABETICAL ORDER)
Acknowledgements
Data Streamers Publication design

TABLE OF CONTENTS
List of Tables 5List of Figures 5Foreword 6
01 Introduction 8
02 Understanding affordability 102.1 Previous approaches 102.2 Developing the concept 122.3 Threshold approach to make judgements on affordability 14
03 Measuring affordability 163.1 Five approaches to measuring affordability 163.2 How people behave (‘revealed preference’) 163.3 What people say (‘stated preference’) 173.4 How expenditure compares to an agreed benchmark (‘expenditure threshold approach’) 183.5 Poverty status 203.6 What measures are in place to protect the poor and vulnerable (‘response measures’) 20
04 Data for monitoring affordability 224.1 Nationally representative surveys 224.2 Non-nationally representative surveys and studies 244.3 Administrative data and policy surveys 27
05 Comparative performance of approaches 305.1 Expenditure threshold approach 305.2 Revealed preferences 375.3 Stated preferences 375.4 Poverty status 385.5 Enabling environment responses to affordability 38
06 Conclusions and recommendations 4007 6.1 Global level monitoring 40
6.1.1 Conclusions 406.1.2 Recommendations 41
6.2 National (and sub-national) level monitoring 456.2.1 Conclusions 456.2.2 Recommendations 45
08 References 46
The Measurement and Monitoring of Water Supply, Sanitation and Hygiene (WASH) Affordability May 2021
5
Degree of vulnerability resulting from three dimensions of WASH affordability
Different types of cost for water, sanitation and hygiene
Summary of expenditure or cost items included in each indicator
Sources of data on WASH expenditure from nationally representative surveys
Populations fall into four affordability quadrants depending on whether they access a targeted minimum level of service and whether the service is affordable or not
Distribution of partial WASH expenditure share as percent of total expenditure across major cut-offs, for Mexico, Cambodia, Ghana, Zambia, Uganda and Pakistan (Indicator 2.1C)
Comparison of actual O&M costs for Mexico, Cambodia, Ghana, Zambia, Uganda and Pakistan (Indicator 2.1C), across deciles of total expenditure
Distribution of partial WASH expenditure share, and required WASH expenditure on O&M for basic WASH service across major cut-offs, for Mexico, Cambodia, Zambia, Uganda and Pakistan (Indicator 2.1C and 3.1C)
Comparison of required O&M costs for Mexico, Cambodia, Ghana, Zambia, Uganda and Pakistan (Indicator 3.1C), across deciles of total expenditure
Comparison of WASH costs as percent of total expenditure under different indicators in Ghana, across deciles of total household expenditure
Distribution of households with basic WASH service level in Ghana, across the spectrum of WASH costs in relation to total expenditure, by indicator, log values
○ Table 1
○ Table 2
○ Table 3
○ Table 4
○ Figure 1
○ Figure 2
○ Figure 3
○ Figure 4
○ Figure 5
○ Figure 6
○ Figure 7
LIST OF TABLES
LIST OF FIGURES
List of tables
The Measurement and Monitoring of Water Supply, Sanitation and Hygiene (WASH) Affordability May 2021
6
Today, many countries are unable to provide safe drinking water and sanitation services to their populations – the challenge and cost of scaling up the infrastructure required, as well as operational and maintenance costs, are too great. Yet despite these challenges, in the past many countries that were not economically developed were able to ensure access to safe drinking water for everyone. How? The strategy was to guarantee, above all, a free, safe, public water supply, close to everyone’s home, in the square of each town and each neighbourhood.
When I say this, questions are often asked about free water at public fountains – won’t people over extract these water resources? My answer is always the same: “don’t worry, no one will take a litre more of the water they need at home from the public fountain; it is too heavy.”
Supposing you were the one who had to fetch water for your family every day. How much water would you carry from a public source? The benchmark for minimum needs is usually 50 litres per person per day. In such a case, if five people live in your household, we would be talking about 250 litres of water. Would you carry more water because the water is free?
Foreword
No one drinks a sip more than they need, just as no one breathes a cubic centimetre more air than they need, even if water and air are free. And as for other uses of water for hygiene or cooking, equally necessary but potentially requiring greater quantities than water for drinking, the tremendous effort of carrying water will prevent any waste. An effort that, by the way, often falls on women and children.
The key to ensuring drinking water for all has always been to guarantee its priority in all senses. Priority in the event of shortages due to drought, priority in terms of quality over any other use, and even budgetary priority for the free public drinking fountain in the square – before paving streets or installing lighting.
Sanitation, on the other hand, has in many countries been left for the household to decide what type of toilet they want, and make the investment themselves. While sanitation is in many senses a very private issue, the consequences of not having safe sanitation are of a highly public nature. Hundreds of millions of people continue to suffer the daily indignity of defecating in the open, a practice which is especially shameful for women. Even when a toilet is used, the vast majority of the waste is not managed safely, thus threatening the health and damaging the environment of much larger populations.
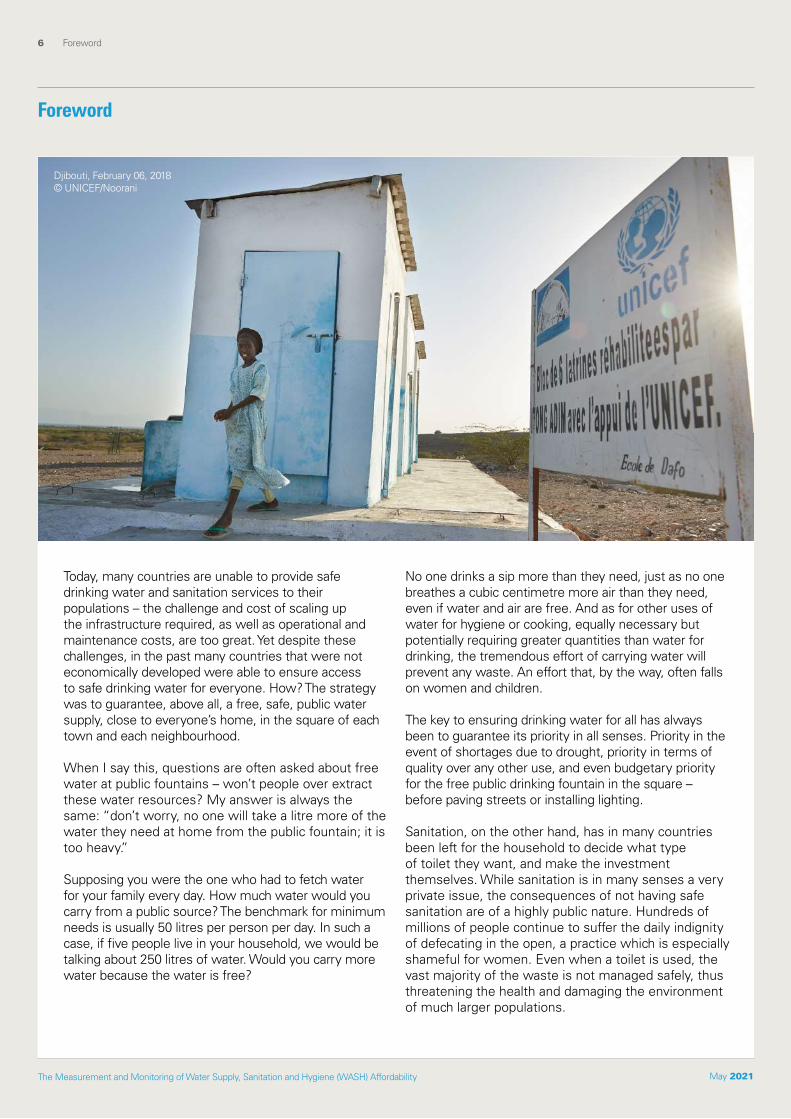
Djibouti, February 06, 2018 © UNICEF/Noorani
Foreword
The Measurement and Monitoring of Water Supply, Sanitation and Hygiene (WASH) Affordability May 2021
7
Today, however, in the 21st century, an estimated 2.2 billion people in the world do not have access to safe drinking water and 4.2 billion people do not have access to safe sanitation. The reasons are diverse and depend on multiple factors and circumstances. In extreme semi-arid territories, subject to climatic changes that threaten their habitability, the problems are most often due to physical water shortages. However, the vast majority of these 2.2 billion people are not thirsty people without water in their living environments, but impoverished people living next to rivers or on polluted aquifers. The shameful global water crisis we face is rooted in the confluence of two major structural flaws:
One, the flaw of inequity and poverty that ºgenerate profoundly unequal and unsupportive socio-economic systems.
Two, the flaw of unsustainability that we have caused in our aquatic ecosystems, transforming water, which has always been the key to life, into the most dangerous vector of disease and death that humanity has ever known.
As the pressure of tariffs to finance the growing costs of water and sanitation services increases, we must reflect on the strategy to guarantee safe drinking water to those 2.2 billion people and safe sanitation to those 4.2 billion people, and sustain services for those already enjoying safe water and sanitation.
Today we have sophisticated technologies, such as reverse osmosis with semi-permeable membranes, which would make it possible to purify water contaminated by all kinds of pollutants. We can also make water transfers from remote places where we still have quality water. But the costs of these options could not be paid by those who live in conditions of extreme vulnerability. Only if we make serious progress in restoring the health of the rivers and aquifers on which these people depend, then we will make definitive progress in achieving effective and universal access to safe water, thus fulfilling not only the human rights to safe drinking water and sanitation, but interrelated human rights as well such as education, health, food and housing.
We cannot stop at strategic reflections, however important they may be. We must promote urgent measures to achieve the progressive fulfilment of the human rights at stake. As water and sanitation services are delivered, we must ensure they are affordable to the individuals, communities and groups in the most vulnerable situations.
This report, released by UNICEF and WHO, with the collaboration of a prestigious team of experts and on the basis of a broad and in-depth study of socio-economic realities, offers ways to assess, evaluate and monitor the affordability of WASH services. It seeks to establish not only conceptual rigour but also flexibility to integrate the diversity of existing contexts and circumstances. It provides concrete guidelines and recommendations to make the obligation of providing affordable access to water and sanitation services a key objective.
Achieving targets 6.1 and 6.2 of SDG 6 will hardly progress if we are not able to identify households and populations with payment difficulties and if we are not able to assess non-compliance with the affordability principle as one of the key causes of failure of the human rights to safe drinking water and sanitation.
With the analysis and recommendations found in this report, countries will have a clearer benchmark and information to promote and guarantee the human rights to water and sanitation, particularly regarding affordable access to drinking water and sanitation services and prohibition of disconnecting those services in case of incapacity to pay. But above all, this report will ultimately be used to empower those who suffer the harshest situations of poverty and vulnerability to meet their rights.
For these reasons, as the UN Special Rapporteur on the human rights to safe drinking water and sanitation, I welcome this report.
Pedro Arrojo Agudo
Special Rapporteur on the human rights to safe drinking water and sanitation
Foreword
The Measurement and Monitoring of Water Supply, Sanitation and Hygiene (WASH) Affordability May 2021
8 Introduction
01Introduction
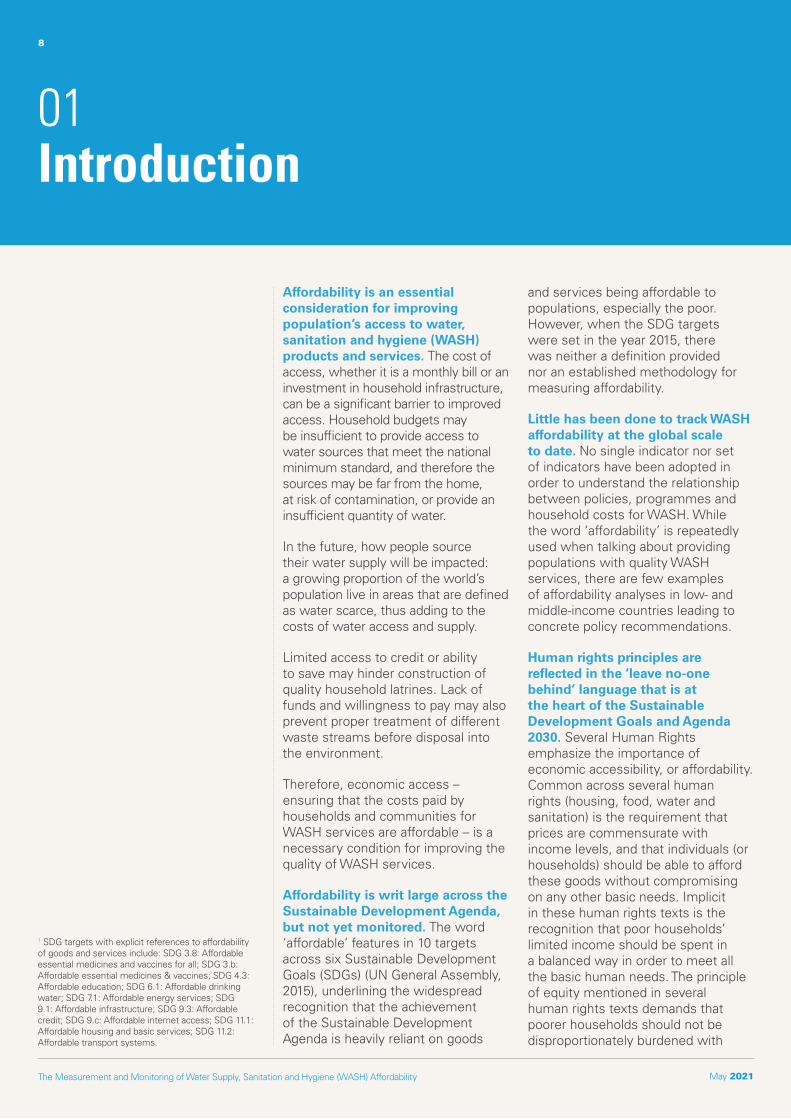
Affordability is an essential consideration for improving population’s access to water, sanitation and hygiene (WASH) products and services. The cost of access, whether it is a monthly bill or an investment in household infrastructure, can be a significant barrier to improved access. Household budgets may be insufficient to provide access to water sources that meet the national minimum standard, and therefore the sources may be far from the home, at risk of contamination, or provide an insufficient quantity of water.
In the future, how people source their water supply will be impacted: a growing proportion of the world’s population live in areas that are defined as water scarce, thus adding to the costs of water access and supply.
Limited access to credit or ability to save may hinder construction of quality household latrines. Lack of funds and willingness to pay may also prevent proper treatment of different waste streams before disposal into the environment.
Therefore, economic access – ensuring that the costs paid by households and communities for WASH services are affordable – is a necessary condition for improving the quality of WASH services.
Affordability is writ large across the Sustainable Development Agenda, but not yet monitored. The word ‘affordable’ features in 10 targets across six Sustainable Development Goals (SDGs) (UN General Assembly, 2015), underlining the widespread recognition that the achievement of the Sustainable Development Agenda is heavily reliant on goods
and services being affordable to populations, especially the poor. However, when the SDG targets were set in the year 2015, there was neither a definition provided nor an established methodology for measuring affordability.
Little has been done to track WASH affordability at the global scale to date. No single indicator nor set of indicators have been adopted in order to understand the relationship between policies, programmes and household costs for WASH. While the word ‘affordability’ is repeatedly used when talking about providing populations with quality WASH services, there are few examples of affordability analyses in low- and middle-income countries leading to concrete policy recommendations.
Human rights principles are reflected in the ‘leave no-one behind’ language that is at the heart of the Sustainable Development Goals and Agenda 2030. Several Human Rights emphasize the importance of economic accessibility, or affordability. Common across several human rights (housing, food, water and sanitation) is the requirement that prices are commensurate with income levels, and that individuals (or households) should be able to afford these goods without compromising on any other basic needs. Implicit in these human rights texts is the recognition that poor households’ limited income should be spent in a balanced way in order to meet all the basic human needs. The principle of equity mentioned in several human rights texts demands that poorer households should not be disproportionately burdened with
1 SDG targets with explicit references to affordability of goods and services include: SDG 3.8: Affordable essential medicines and vaccines for all; SDG 3.b: Affordable essential medicines & vaccines; SDG 4.3: Affordable education; SDG 6.1: Affordable drinking water; SDG 7.1: Affordable energy services; SDG 9.1: Affordable infrastructure; SDG 9.3: Affordable credit; SDG 9.c: Affordable internet access; SDG 11.1: Affordable housing and basic services; SDG 11.2: Affordable transport systems.
8
The Measurement and Monitoring of Water Supply, Sanitation and Hygiene (WASH) Affordability May 2021
9 Introduction
the costs of meeting basic needs as compared to richer households.
Human Rights put the onus on States as duty bearers in resolving affordability issues. The resolution 18/1 on the Human Rights to Safe Drinking Water and Sanitation (HRWS) calls upon States to “continuously monitor and regularly analyse the status of the realization of the right to safe drinking water and sanitation on the basis of the criteria of availability, quality, acceptability, accessibility and affordability” and it refers to States’ responsibility to establish mechanisms to provide protection for poor and vulnerable populations when costs of meeting human rights are high. To ensure that water is affordable, General Comment 15 expands: “State parties must adopt the necessary measures that may include, inter alia: (a) use of a range of appropriate low-cost techniques and technologies; (b) appropriate pricing policies such as free or low-cost water; and (c) income supplements.’
Guiding texts in the human rights literature fails to define how economic accessibility can be measured or monitored. While different Human Rights refer to economic accessibility, there is no clear benchmark or methodology provided for defining what expenditure should be made on achieving each human right.
In a 2014 report by the Special Rapporteur on the Human Rights to Drinking-Water and Sanitation2, some indicators were proposed, but no methodology, data sources or threshold values for interpreting affordability were provided. These indicators were:
- Date and entry into force and coverage of national action plan on affordability of water and sanitation services
- Proportion of households disconnected from the water supply due to bills not met within X working days
- Proportion of households’ requests for financial support to pay their water bill or sanitation costs met during the period
- Proportion of households spending more than X % of expenditure or income on water and sanitation
Planning to meet human rights – and leave no-one behind – therefore requires a concrete assessment of what service is needed, what is the cost and what is the appropriate financing mix. When planning how to provide each basic good or service, the cost needs to be known for achieving (at least the) the minimum standard. Once this is known, a financing assessment is needed using the 3 ‘T’s (taxes, transfers and tariffs) to assess what minimum cost could be covered by the individual or household, and how that can be supplemented by public funds or other sources. In determining what tariff can be paid by poor households for WASH products and services, it requires clarity on what proportion of household income should be reserved for other human and child rights, such as health, education, social protection and food. This point defines the very heart of the affordability issue within the Sustainable Development Agenda, as different goods and services
should not be dealt with in isolation.
In a world heavily impacted by the COVID-19 pandemic, the affordability and accessibility of all basic services comes to the fore as a priority issue, with implications for government budgets and official development assistance to subsidise WASH services as a response to the consequences of the lockdown measures on household incomes, especially the poor and vulnerable.
A multi-stakeholder group of experts and organizations has been convened to address WASH affordability, convened by WHO and UNICEF. The initiative was driven by four main questions, the first three of which are addressed in this report:
3
1
2
How can affordability be concretely defined so that a judgement can be made on whether the price paid by a household on WASH services is ‘affordable’ or ‘not affordable’?
Based on the definitions, how can WASH affordability be measured using available data?
How can WASH affordability be monitored globally and nationally, using existing or future data sets?
What are the options for different stakeholders to respond when it is found that WASH is not affordable to (certain) households? And how do these options perform in relation to making WASH services more affordable to the target households?
4
2 Human Rights Council. Report of the Special Rapporteur on the human right to safe drinking water and sanitation, Catarina de Albuquerque. Common violations of the human rights to water and sanitation. A/HRC/27/55.

10 Understanding affordability
The Measurement and Monitoring of Water Supply, Sanitation and Hygiene (WASH) Affordability May 2021
02Understanding affordability
10
Prior to measuring and monitoring WASH affordability, it is critical to have a clear understanding of what affordability is, and what it is not. Past studies that have assessed affordability of water services have had many weaknesses, which has made it difficult to pass valid judgements about which populations are deserving of public subsidies due to lack of affordability (covered in more detail in Chapter 3). Despite growing attention to the affordability of WASH services, the understanding of what it is and how it can be measured has varied. Hence, this chapter explores the various dimensions of affordability.
2.1 Previous approaches
Drawing on ways in which WASH affordability has been understood in the past, there are two main sources: (a) the Human Rights literature and (b) the common practices of countries, service providers and international agencies.
Earlier human rights literature focused on the principle of Equity. Neither the General Comment 15 nor the Resolution 18/1 provide any quantitative metric in determining what is affordable. The General Comment did, however, state in 2003 that:
“Any payment for water services has to be based on the principle of equity, ensuring that these services, whether privately or publicly provided, are affordable for all, including socially disadvantaged groups. Equity demands that poorer households should not be disproportionately burdened with water expenses as compared to richer households.” (para 27, United Nations).
India, October 28, 2018 © UNICEF/UN0267929/Akhbar Latif

11 Understanding affordability
The Measurement and Monitoring of Water Supply, Sanitation and Hygiene (WASH) Affordability May 2021
In preparing for the 65th Session of the UNGA in 2010, the Independent Expert on the Human Right to Safe Drinking Water and Sanitation underlined the importance of making progress on affordability:
“Services must be affordable. Access to water and sanitation must not compromise the ability to pay for other essential needs guaranteed by human rights such as food, housing and health care” 3
The language ‘not compromising other human rights’ is echoed in other, earlier, human rights such as housing and food. However, no human rights resolutions or international treaties define clear methodologies, indicators and data sources for how to measure the affordability of meeting human rights, including the human rights to drinking-water and sanitation.
Until now, the main way to measure affordability has been estimating a ratio of household expenditure on water and wastewater as a proportion of annual income, and comparing it with an ‘affordability threshold’. Expenditure above the threshold would therefore render a service ‘unaffordable’. Henri Smets reports significant inter-country differences in affordability thresholds (Smets, 2012). For example, for water supply the threshold varies between 2% in the USA and 4% in Indonesia and Mongolia. For both water and sanitation, the threshold varies between 2% in Lithuania and 6% in Mongolia. Likewise, multilateral development banks and the OECD have defined thresholds of between 3% and 5%.
However, defining a single threshold value nationally or even globally has severe limitations in pronouncing services as affordable or unaffordable. As stated by Andres et al (2020)
“Thus, threshold values are often selected in a short-sighted manner, without a significant investigation of the income required to afford all essential expenditures. In light of this, it may not be surprising that there is no consensus on how the threshold value should be determined.” (page 8).
As stated by Heller (2015), thresholds should be set nationally and/or locally, based on a participatory process, involving in particular people living in poverty and other marginalized and disadvantaged individuals and groups, that consider all costs associated with water, sanitation and hygiene.
3 Human rights obligations related to access to safe drinking water and sanitation.
Mali, July 09, 2012© UNICEF/UNI134610/Dicko

12 Understanding affordability
The Measurement and Monitoring of Water Supply, Sanitation and Hygiene (WASH) Affordability May 2021
While equity and fairness arguments are important in the debate on affordability, they are relative and do not give absolute judgements on what is affordable and what is not. Hence, in order to formulate a metric for affordability, the key building blocks of affordability need to be understood.
In the proposal put forward by the Expert Group (see Acknowledgements), WASH affordability depends on the interrelation between three key variables, or dimensions:
1. The price of the WASH services (paid by the household), including the time cost of accessing WASH services,
2. The overall spending power and time budget of the household, and
3. The competing nature of different needs4, and the spending required to meet those needs.
What the absolute level of these are, and how households behave in relation to these, will lead to decisions on what level and type of WASH service or behaviour they will adopt. Who within the household has access to the household budget and what has been agreed to use it for, will also be important determining factors for household and individual decisions
4 The latter point does not necessarily cover those needs that are considered ‘essential’, as the latter is very hard to define precisely, and it is ultimately the household’s choice as to how spending is balanced between the ‘more essential’ and the ‘less essential’ needs.
on WASH. The type and intensity of need – such as the sickness, age or disability of household members – will also be determining factors.The price or cost related to WASH services at the household level will vary depending on geographical and climatic context, the nature of the service provider (public or private), service provider efficiency, market competition, and levels of corruption or leakage. The ownership of assets, the public-private mix and the regulatory context will all play a role in determining the extent to which production costs differ from the prices charged. If there are public subsidies or cross-subsidies between consumers, the price will be below the total cost of the product or service. If the regulatory context allows for private ownership and profit-making, or else some other type of margin (e.g. surplus in a public provider), then prices to the consumer will be above the total cost of the product or service.
As well as the above considerations, an understanding of affordability requires a distinction between financial costs (cash outlay for the service itself) and economic costs (financial outlay, other non-financial costs to obtain a service, plus non-financial and financial consequences of consuming a less-than-ideal level of service, such as the health consequences).
1 2.2 Developing the concept
The spending power of the household is derived from the resources at hand, including asset ownership, property, wealth, income and savings. The monthly cash income, after taxes, is typically the most important consideration when paying for a regular service. Government resources paid directly to households, such as a government pension system, welfare payments or in-kind donations, will also affect a household’s cash situation.
2

13 Understanding affordability
The Measurement and Monitoring of Water Supply, Sanitation and Hygiene (WASH) Affordability May 2021
The price or cost of meeting other household needs must be weighed against the costs of WASH. Property might reduce rental costs, thus freeing up budget for other expenditure. Likewise, when public transportation, health care or education are (partially) subsidized by the welfare state, it means a lower burden on a household’s limited cash income. However, the reach of the welfare state varies significantly by country and by rural/urban location.
The interplay between the three dimensions is depicted at a very simple level in Table 1. For example, the most vulnerable household where WASH services are least affordable is one which is poor, and/or faces high WASH prices and/or does not have state support for other social services. Naturally there will be ranges in income, price levels and spending required on other essential services which gives rise to a 3-dimensional space where cut-offs will be needed in order to categorise households. In addition, a time dimension may be needed in contexts where there is seasonality in water availability, seasonality in income, or irregular work patterns, which means some populations may move between these categories several times in one year. Furthermore, while a welfare state may exist, many of the most
3
excluded may have little or no access to it – such as unregistered citizens, migrants, those living in temporary accommodation, those with no legal land tenure or no registered address, and ethnic groups.
The triple consequences of highly priced WASH services that might lead to a judgement of them being ‘unaffordable’ is that households might:
a. go into debt by consuming a WASH service level above what they can pay from their cash resources, and/or
b. reduce expenditure on other essential items, and/or
c. cut back on WASH consumption, thereby resulting in other negative consequences for themselves as well as for others (e.g. adverse health outcomes).
Table 1. Degree of vulnerability resulting from three dimensions of WASH affordability
Matrix Welfare state or other source covers health, education, housing & pension
Welfare state or other source do not cover health, education, housing & pension
WASH prices low WASH prices high WASH prices low WASH prices high
Low income
Less vulnerable
More vulnerable
More vulnerable
Most vulnerable
Median income
Less vulnerable
Less vulnerable
Less vulnerable
More vulnerable

14 Understanding affordability
The Measurement and Monitoring of Water Supply, Sanitation and Hygiene (WASH) Affordability May 2021
Figure 1 Source: Hutton and Andres (2018)
One issue with the current approach to measuring the actual household spending on WASH is that it does not typically allow explicit assessment of the costs against a specified level of service. Such an assessment works well when it is known that all households consume at least the national minimum level of WASH services in a specified service area. However, in the developing world the majority of households still do not consume safely managed water and sanitation services, and still many live without a basic level of WASH service. Hence, a distinction of WASH expenditure by service level
is important. The key question then becomes: “what would a household have to spend in order to reach (at least) the national minimum standard of WASH?”
To help answer this, Hutton and Andres (2018) define four potential outcomes for a household according to whether they are connected to a (minimum) service or not, and whether the service is affordable or not, shown in Figure 1. As noted above, with seasonal or other variations, households might move in and out of different vulnerability categories (Table 1) and quadrants (Figure 1) over time.
Figure 1. Populations fall into four affordability quadrants depending on whether they access a targeted minimum level of service and whether the service is affordable or not
With minimum level of service
Without minimum level of service
UnaffordableAffordable
(able to pay)
QUADRANT #1 QUADRANT #4
QUADRANT #2 QUADRANT #3
2.3 Threshold approach to make judgements on affordability
This framework leads to potentially three ‘unaffordability’ situations, as follows:
QUADRANT #1: Households consume the minimum service level but pay too much. Although these households are served, the level of water service is judged to be unaffordable.
QUADRANT #2: Households do not consume the minimum service level, but still pay too much. This outcome is quite common in urban areas, where households do not have access to utility services and pay considerable sums for water supply, or where they have access to poor quality utility services and pay high tariffs for it, without any kind of subsidy or social protection.

15 Understanding affordability
The Measurement and Monitoring of Water Supply, Sanitation and Hygiene (WASH) Affordability May 2021
5 Not all of these thresholds by international organizations are official releases, or do they apply organization-wide.
QUADRANT #3: Households do not consume the minimum service level, and they incur low or zero expenditure. This situation is very common, especially for poor and vulnerable households and remote communities. While their current expenditure indicates they have affordable WASH, their lower service level may suggest that they would face affordability constraints in paying for a higher service level. Furthermore, there are considerable hidden costs associated with their low level of service, such as (a) the amount of time taken to collect water or travel to a place of open defecation, and (b) the health and other consequences of lower service levels.
In both Quadrants #2 and #3, it is important to assess what a minimum service level would cost and assess the consequences of households paying this cost on their spending on other essential items, or their debt levels.
The key question remains: what are the quantitative cut-offs between these four quadrants? As stated earlier, there is no international consensus around what level of expenditure on WASH services is affordable or unaffordable, and the threshold that defines these. The United Nations Development Programme (UNDP), the World Bank, the Organization for Economic Cooperation and Development (OECD), the European Commission and the African Development Bank have all defined a threshold of expenditure as a proportion of income (or expenditure) for water to be affordable, all lying between 3% and 5%5. However, in most cases it is not clear how this threshold was reached. Even if some empirically based threshold was proposed, it would be questionable whether such a threshold can apply across different countries or across households with very different capacities and needs. Therefore, such an exercise is both ethically and empirically very challenging.
Kiribati, January 28, 2016© UNICEF/UN0202171/Sokhin

16 Measuring affordability
The Measurement and Monitoring of Water Supply, Sanitation and Hygiene (WASH) Affordability May 2021
03Measuring affordability
3.1 Five approaches to measuring affordability
4
1
3
2
How people behave with respect to WASH expenditure and service levels;
What people say about their preferences on WASH expenditure and service levels;
How WASH expenditures compare to an agreed benchmark on WASH spending as a percent of overall household income or expenditure;
What is a household’s poverty status, based on either national or community assessments, which indicates deservingness for supportive measures to be provided with affordable WASH services; and
What measures already are in place to ensure the poor and vulnerable have economic access to WASH services.
5
These approaches require specific methodologies and indicators for empirical analysis, which enables a distinction between those for whom WASH services are ‘affordable’, ‘less affordable’ or ‘unaffordable’. Note that these five types of analysis are not mutually exclusive – and that implementing these approaches together can shine a light on affordability from different angles and thus enhance understanding.
The concepts described in the previous chapter have provided signposts as to how affordability might be measured, but they have not provided actual methods or measurable indicators that allow a concrete judgement about the extent of affordability or unaffordability of a WASH service.
Following the work of the JMP/GLAAS Expert Group on WASH Affordability, five distinct approaches were agreed that provide insights into WASH affordability:
16
3.2 How people behave (‘revealed preference’)
What WASH services people consume depends on a variety of factors, including availability, physical accessibility, acceptability, quality and economic accessibility, which mirror the normative criteria of the human rights to safe drinking water and sanitation. Economic accessibility includes the three dimensions of affordability covered in chapter 2 and could also incorporate the capacity to take on debt. In making the decision on service level they consume, households will compare the different options available, often trading off the normative criteria against each other, especially when their willingness or ability to pay for these services is low.
One approach that can shed some light on WASH affordability is how households respond to the prices of WASH services, termed in economics the ‘revealed preference’ approach. It either compares different populations that face different prices at one point in time, or it compares the same populations that face changes in prices over time. These comparisons can help reveal, among other things, the sensitivity of poorer households to WASH prices. If some population groups are seen to be consuming below the minimum service level, and appear to be sensitive to price, then this implicit choice of households highlights a potential affordability problem.

17 Measuring affordability
The Measurement and Monitoring of Water Supply, Sanitation and Hygiene (WASH) Affordability May 2021
3.3 What people say (‘stated preference’)
A second approach asks populations directly what they would be willing to pay for an improved service, or willing to accept for a reduced service. It can also reveal if, and why, they are consuming below a given service level. Because these answers are obtained from an interview with users of services, the approach is termed in economics ‘stated preference’.
There are two main indicators or measurements in this category. The first of these is the willingness to pay (WTP) of households for a given service or product using the ‘contingent valuation’ method, which asks consumers directly what they are willing to pay for a service, or changes in a service. A WTP survey is often conducted for a product, service type or service level that is not yet available in the market. The main purpose is to provide information from potential consumers on what their demand will be and it helps set a market entry price. The WTP estimates obtained from the user survey can be compared with income levels to enable conclusions about whether households might be able to pay these amounts. Comparing willingness to pay with the actual price of the service also indicates financial viability of the service, and whether a subsidy might be needed to make it financially viable.
The second indicator is obtained by asking households directly about their perceptions of WASH affordability. Such questions examine why households do not use minimum service levels, and whether higher prices explain their
decisions. For example, an analysis by JMP of 20 recent Multiple Indicator Cluster Surveys (MICS)6 asked households the question “In the last month, has there been any time when your household did not have sufficient quantities of drinking water?” and for those answering ‘yes’ in 16 countries they were asked the main reason for drinking water being unavailable. Among the reasons were ‘Water not available from source’, ‘Water too expensive’, ‘Source not accessible’, and ‘Other’.
One weakness of asking households to state their preferences through question and answer is that it is subjective. Respondents will consider many different aspects in their reply, and they may omit others; and this will vary from one respondent to another. Also, the individual respondent might not be reflecting all the views and preferences in a household. For example, access time for a distant water source or place of open defecation might not be explicitly considered if the respondent is not the one who spends their time in that activity.
Nigeria, April 21, 2013© UNICEF/UNI145739/Esiebo
6 Unpublished
18 Measuring affordability
The Measurement and Monitoring of Water Supply, Sanitation and Hygiene (WASH) Affordability May 2021
3.4 How expenditure compares to an agreed benchmark (‘expenditure threshold approach’)Given the lack of clarity on how to directly measure household welfare and how households make consumption decisions, alternative measures have been popular with international and national WASH agencies and WASH service providers to make conclusions about affordability (see Chapter 2.1). Over recent decades, the popularity of a proxy indicator for affordability has emerged that seeks to answer: “what percentage of income would it be reasonable to expect a (poor) household to pay?” Most applications of this indicator use actual (measured) WASH expenditure in the indicator. It is commonplace for only water expenditure to be included. In some instances, the required cost for a household to reach a given WASH
consumption level is used instead of the actual consumption levels and expenditures. The World Bank’s International Benchmarking Network (IBNET), for example, requires utilities to estimate the cost of consuming 6m3 of (piped) water, and this allows easy comparison with the poverty income or median income.
This approach requires three pieces of information:
1. WASH expenditure – either by household or average for specific population groups;
2. Total expenditure or total income – either by household or average for specific population groups;
3. Threshold level for WASH expenditure as a percentage of total expenditure (or income), above which WASH expenditure would be deemed ‘unaffordable’.
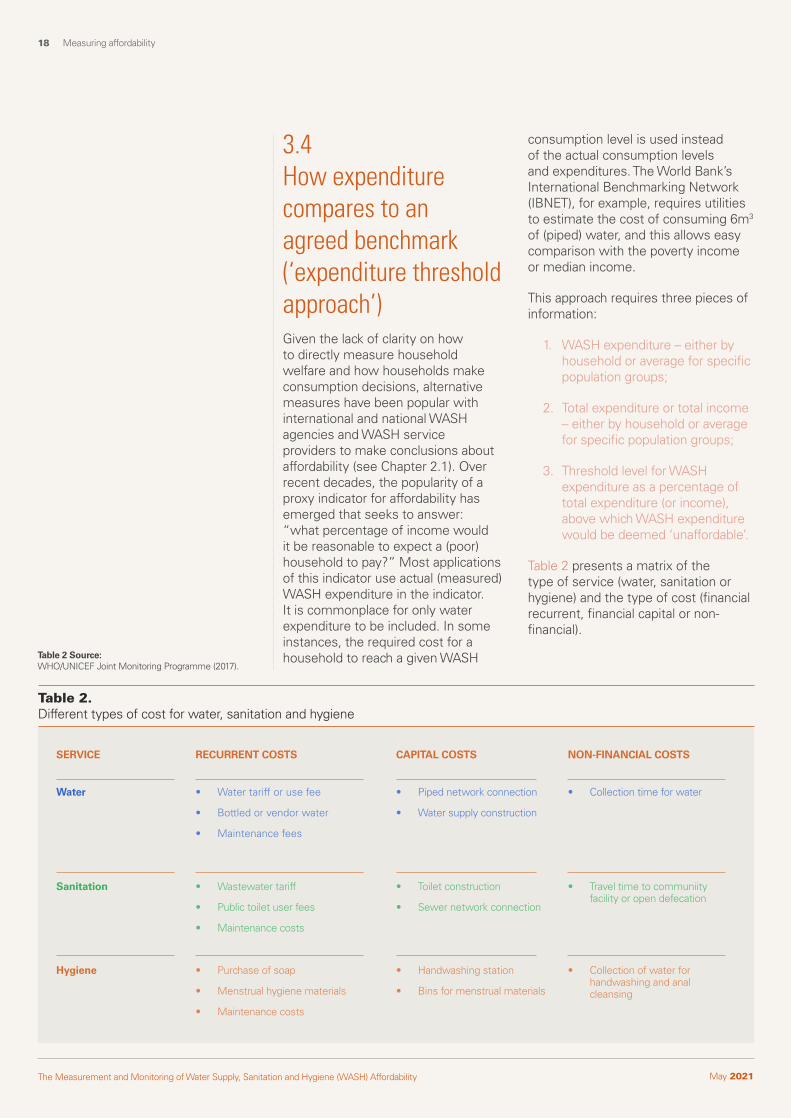
Table 2 presents a matrix of the type of service (water, sanitation or hygiene) and the type of cost (financial recurrent, financial capital or non-financial).
Table 2 Source: WHO/UNICEF Joint Monitoring Programme (2017).
Table 2.Different types of cost for water, sanitation and hygiene
SERVICE RECURRENT COSTS CAPITAL COSTS NON-FINANCIAL COSTS
• Water tariff or use fee
• Bottled or vendor water
• Maintenance fees
• Piped network connection
• Water supply construction
• Collection time for waterWater
• Wastewater tariff
• Public toilet user fees
• Maintenance costs
• Toilet construction
• Sewer network connection
• Travel time to communiity facility or open defecation
Sanitation
• Purchase of soap
• Menstrual hygiene materials
• Maintenance costs
• Handwashing station
• Bins for menstrual materials
• Collection of water for handwashing and anal cleansing
Hygiene

19 Measuring affordability
The Measurement and Monitoring of Water Supply, Sanitation and Hygiene (WASH) Affordability May 2021
Different costs are distinguished based on data available. First, there are the most visible costs that are collected by national surveys that capture WASH expenditure, or utility financial data. Second are the ‘hidden’ costs, items that are not explicitly captured in expenditure surveys as they are typically included in broader categories such as bottled water, sanitary cleaning materials, personal hygiene such as soap and menstrual hygiene pads and maintenance of infrastructure. The third level are capital and maintenance costs which might not occur every year, and hence not picked up in surveys that focus on the expenditure in a one-year period. The fourth level are costs that are not actually paid but
would be incurred in order to close the service gap to meet (at least) the national minimum standard. The fifth level is non-financial costs such as access time. This categorisation leads to different indicators which capture different cost elements, as shown in Table 3.
Table 3.Summary of expenditure or cost items included in each indicator
INDICATOR OPTIONS
ACTUAL EXPENDITURE ON WASH REQUIRED EXPENDITURE ON WASH
Option 1: full actual expenditure
OPTION 1.1
OPTION 2.1
OPTION 3.1
OPTION 1.2
OPTION 2.2
OPTION 3.2
OPTION 1.4
OPTION 2.4
OPTION 3.4
OPTION 1.3
OPTION 2.3
OPTION 3.3
OPTION 1.5
OPTION 2.5
OPTION 3.5
Option 2: partial actual expenditure
Option 3:full required expenditure
ALL O&M
ALL CAPITAL
O&MANNUAL CAPITAL
ANNUAL CAPITAL
PARTIALO&M
PARTIAL CAPITAL
CAPITALTIME COSTS
TIME COSTS

20 Measuring affordability
The Measurement and Monitoring of Water Supply, Sanitation and Hygiene (WASH) Affordability May 2021
3.5 Poverty statusPoverty is a state or condition in which a person, household or community lacks the financial resources and essentials for a minimum standard of living. It implicitly requires a threshold for defining those living above or below the poverty line. Some countries and agencies use two lines for categorizing the poor and the extremely poor. The term ‘near poor’ is also being increasingly used to identify households at risk of slipping into poverty if an economic shock were to occur such as a sudden price rise or loss of income. While literature on the poverty line commonly refers to the ability to pay for a defined ‘basket of goods’, data deficiencies in this approach means that countries and international agencies more commonly use benchmarks of income to estimate the poverty line, or multiples of food expenditure requirements to sustain an adult.
The implication of defining a poverty line is that anyone living in a household with an income less than the defined poverty line (on a per capita basis for the entire household) means that their ability to cover the costs of meeting essential needs has been compromised. While the essential needs related to water and sanitation are implied in the poverty line, they are not explicitly included. This makes it difficult to quantify what WASH costs are reasonable for poor households to pay, whether they are living on or below the poverty line. Policies based on the poverty line will help push public funds in the right direction, but it will not guarantee that subsidies reach all those and only those that are actually poor or vulnerable.
3.6 What measures are in place to protect the poor and vulnerable (‘response measures’)A final approach examines what measures are being taken to make service more affordable. The ‘enabling environment’ is used as a broad, catch-all phrase that can include legal instruments, citizen voice, policies and programmatic measures. Essentially, these measures protect the poor from the high cost of WASH services either directly or indirectly. The impact of these measures is to either lower the costs faced by households for essential goods and services, or to increase household income to pay for WASH and other essential services.
In analyzing data from household expenditure surveys, it is important to know to what extent WASH services are currently being subsidized. This will require matching of different data sets (e.g. utility data, government data and household survey data) to understand which households have benefited from these measures, and by how much.
A range of different indicators have already been formulated by the biannual UN-Water Global Analysis and Assessment of Sanitation and Drinking-Water (GLAAS) survey for different aspects of the enabling environment. As no single indicator can predict whether a WASH service is affordable or not, these indicators should be looked at in combination and triangulated with indicators covered earlier in this chapter. Indicators included in the GLAAS survey are listed in Chapter 4.3.

21 Measuring affordability
The Measurement and Monitoring of Water Supply, Sanitation and Hygiene (WASH) Affordability May 2021
21 Measuring affordability
The Measurement and Monitoring of Water Supply, Sanitation and Hygiene (WASH) Affordability May 2021
Madagascar, March 11, 2014© UNICEF/Rindra Ramasomanana

22 Data for monitoring affordability
The Measurement and Monitoring of Water Supply, Sanitation and Hygiene (WASH) Affordability May 2021
04Data for monitoring affordability
22
Ultimately, the ability to monitor the indicators covered in Section 3 will depend on the availability of data. In the short-term, global monitoring will rely heavily on data that are already collected, while in the longer term there will be additional sources of data. The findings and recommendations from this current initiative should be used to influence existing surveys and promote new data sources on WASH expenditure and affordability indicators.
This chapter examines briefly each of these data sources in terms of: their content and degree of standardization; representation, quality and disaggregation; frequency and global coverage; access to data (public or limited availability; procedure and cost to extract data); implications for national monitoring; implications for global monitoring; and potential future data sources.
1
3
2
Survey data from nationally representative household surveys;
Surveys and assessments conducted as part of research studies that are not representative of the national level; and
Administrative data or policy surveys that are compiled from local and national governments, utilities, providers and regulators. When aggregated, and if at large enough scale, these data can be nationally representative.
4.1 Nationally representative surveys
Nationally representative surveys are the most important data source for global monitoring during the SDG period in low- and middle-income countries. These surveys tend to be largely standardized across countries and their sampling methodology ensures national representation. International agencies produce modules with core questions for different topics, which national statistical agencies draw on and adapt for their own purposes.
As shown in a previous report on WASH affordability (Hutton, 2012), there are many types of household survey. These surveys are catalogued for non-OECD countries by the International Household Survey Network7 (after 1981) and classified under 18 different categories of survey. For the purposes of this study, nine relevant survey categories are assessed.87 http://www.internationalsurveynetwork.org/
8 Other surveys deemed to be non-relevant are: 1-2-3 surveys, agricultural surveys, labour surveys, the World Health Survey and the World Fertility Survey.
To monitor WASH affordability, data sources fall into one of three main categories, covered in the following sections:

23 Data for monitoring affordability
The Measurement and Monitoring of Water Supply, Sanitation and Hygiene (WASH) Affordability May 2021
- Core Welfare Indicators Questionnaire (CWIQ)
- Demographic and Health Survey (DHS)
- Income and Expenditure Surveys (IES)
- Integrated Surveys (non-LSMS)
- Living Standards Measurement Survey (LSMS)
- Multiple Indicator Cluster Survey (MICS)
- Population and Housing Census (PHC)
- Priority Surveys (World Bank)
- Socio-Economic Monitoring Survey (SEMS)
The most complete and robust data source on WASH expenditure, total expenditure and total income is the income and expenditure survey (IES) (see Table 4). It should be noted, however, that there is some country variation in the questions included. In the European Union, the household budget survey captures water supply, refuse collection and sewerage costs (in the standard forms, section
HE04.4). Surveys which capture water and wastewater costs alone are the LSMS, SEMS and Integrated Surveys (non-LSMS). The CWIQ only captures major categories of household spending, hence it is not possible to extract water and sanitation costs from these. The DHS, MICS, Census and Priority Surveys do not collect WASH expenditure data.
Across all surveys that capture WASH expenditures, there is very limited expenditure data on (1) capital items (which is usually mixed with housing expenditure, if collected at all); and (2) maintenance of infrastructure (which is usually mixed with general maintenance, if included at all).
The surveys best capturing variables to estimate the costs of water treatment or water collection, including the identity of the water hauler, are the MICS, DHS (earlier surveys), LSMS. The identity of the water hauler is sometimes collected in Integrated Surveys, Priority Surveys and SEMS. Water access to off-plot sources is identified by most surveys, but they vary whether the distance is expressed in metres (IES, Integrated Survey, LSMS, SEMS) or time per journey (CWIQ, DHS, MICS). The total access time per day is collected in some but not all Integrated Surveys and SEMS. The CWIQ survey only asks the time to water source and does not identify the water hauler.
Time to access off-plot sanitation facilities (or place of defecation) is
not captured by any national surveys. Some research studies have included a question on time to place of defecation for valuation of access time (Hutton et al 2014).
For generating a ratio of WASH expenditure as a proportion of total income, the reliability of income data needs to be examined. Given the variability in incomes and the reliability of responses in household surveys, it is recommended to use total expenditure as a proxy of total income. The most detailed and robust data on total expenditure are collected by IES, followed by LSMS. The level of detail for Integrated Surveys and SEMS varies between different types of survey. The CWIQ and priority surveys mainly collect major expenditure items. The DHS, MICS and Censuses do not collect total expenditure data.
The nine survey categories covered above are all nationally representative, and moreover data can be disaggregated and compared across a number of different population sub-groups – such as rural-urban, by ethnic group, by head of household gender, by education level, by income level or income/wealth quintile. For most countries, disaggregation is also possible at first sub-national administrative level. Data sets with these disaggregations will be very useful in comparing WASH expenditures among population groups that are more likely to face affordability constraints.
Madagascar, November 11, 2018 © UNICEF/UN0267003/Raoelison
24 Data for monitoring affordability
The Measurement and Monitoring of Water Supply, Sanitation and Hygiene (WASH) Affordability May 2021
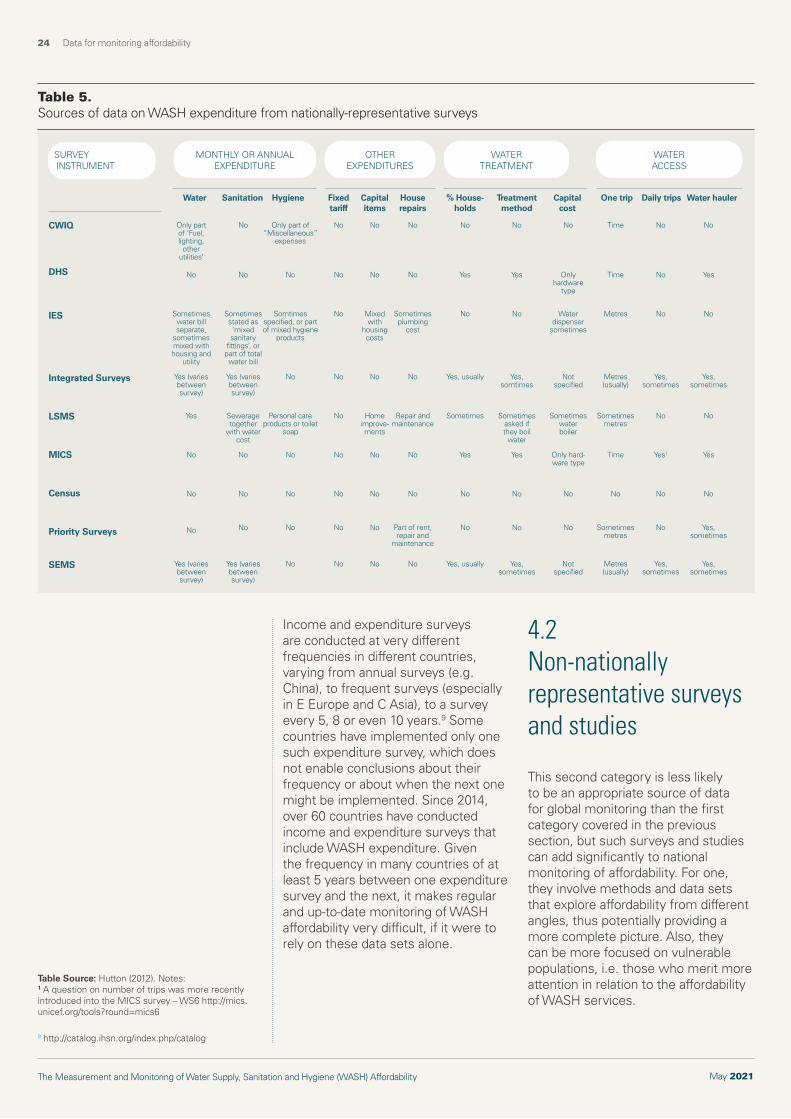
Income and expenditure surveys are conducted at very different frequencies in different countries, varying from annual surveys (e.g. China), to frequent surveys (especially in E Europe and C Asia), to a survey every 5, 8 or even 10 years.9 Some countries have implemented only one such expenditure survey, which does not enable conclusions about their frequency or about when the next one might be implemented. Since 2014, over 60 countries have conducted income and expenditure surveys that include WASH expenditure. Given the frequency in many countries of at least 5 years between one expenditure survey and the next, it makes regular and up-to-date monitoring of WASH affordability very difficult, if it were to rely on these data sets alone.
4.2 Non-nationally representative surveys and studies
This second category is less likely to be an appropriate source of data for global monitoring than the first category covered in the previous section, but such surveys and studies can add significantly to national monitoring of affordability. For one, they involve methods and data sets that explore affordability from different angles, thus potentially providing a more complete picture. Also, they can be more focused on vulnerable populations, i.e. those who merit more attention in relation to the affordability of WASH services.
Table Source: Hutton (2012). Notes: 1 A question on number of trips was more recently introduced into the MICS survey – WS6 http://mics.unicef.org/tools?round=mics6
9 http://catalog.ihsn.org/index.php/catalog
Table 5. Sources of data on WASH expenditure from nationally-representative surveys
SURVEY INSTRUMENT
MONTHLY OR ANNUAL EXPENDITURE
OTHER EXPENDITURES
WATER TREATMENT
WATER ACCESS
One trip Daily trips Water haulerWater Sanitation Hygiene
Only part of ‘Fuel, lighting,
other utilities’
No
Sometimes water bill separate,
sometimes mixed with housing and
utility
Yes (varies between survey)
Yes
No
No
No
Yes (varies between survey)
No
No
No
No
No
No
No
No
No
No
Yes
No
Yes, usually
Sometimes
Yes
No
No
Yes, usually
Time
Time
Metres
Metres (usually)
Sometimes metres
Time
No
Sometimes metres
Metres (usually)
No
No
Sometimes stated as ‘mixed sanitary
fittings’, or part of total water bill
Yes (varies between survey)
Sewerage together
with water cost
No
No
No
Yes (varies between survey)
No
No
Mixed with
housing costs
No
Home improve- ments
No
No
No
No
No
Yes
No
Yes, somtimes
Sometimes asked if they boil
water
Yes
No
No
Yes, sometimes
No
No
No
Yes, sometimes
No
Yes1
No
No
Yes, sometimes
Only part of “Miscellaneous”
expenses
No
Somtimes specified, or part of mixed hygiene
products
No
Personal care products or toilet
soap
No
No
No
No
No
No
Sometimes plumbing
cost
No
Repair and maintenance
No
No
Part of rent, repair and
maintenance
No
No
Only hardware
type
Water dispenser
sometimes
Not specified
Sometimes water boiler
Only hard-ware type
No
No
Not specified
No
Yes
No
Yes, sometimes
No
Yes
No
Yes, sometimes
Yes, sometimes
Fixed tariff
% House-holds
House repairs
Capital cost
Capital items
Treatment method
CWIQ
DHS
IES
Integrated Surveys
LSMS
MICS
Census
Priority Surveys
SEMS

25 Data for monitoring affordability
The Measurement and Monitoring of Water Supply, Sanitation and Hygiene (WASH) Affordability May 2021
Localized WASH surveys and studies are commonly implemented by development partners and less often by local governments. For many implementing agencies, ‘before and after’ surveys are often a pre-condition of receiving funds in order to show how a population has been impacted by a programme. Some are used for programme design purposes prior to intervention, while others are mid-line during an intervention period or end-line after completion of an intervention.
There are some examples of surveys that have included WASH expenditure or other economic variables, covered below. While they are insufficient for global monitoring at present, they do indicate some potential for future monitoring of WASH affordability. Several categories of economic analysis have been conducted widely in low- and middle-income countries (cost assessment, benefit assessment, cost-benefit analysis, willingness to pay assessment and market assessment) and these utilise a range of survey types, as described below.
The first type of survey is a tailored survey to collect data on economic variables. One example of this was a multi-country study conducted by the World Bank’s Water and Sanitation Program (WSP) under the Economics of Sanitation Initiative (ESI). This initiative implemented a customised economic survey across thousands of households in six Southeast Asian countries between 2008 and 2010 (World Bank, 2015; Hutton et al 2014) for the purposes of a cost-benefit study. UNICEF implemented a similar survey in India in 2017 to assess the costs and impacts of Swachh Bharat Mission (UNICEF, 2019). These economic surveys included detailed questions on costs and benefits, including time use for sanitation.
A second type of tailored survey for assessing WASH practices and costs is the water diary method (Hoque and Hope, 2018, 2019). In this survey, households are asked to record each day their sources of water, volumes of water, water uses, and what they paid for them, as well as other variables. This method responds to the weaknesses of other types of household survey, such as those types of household survey covered in the previous section which provide ‘snapshots’ of WASH behaviours and expenditures at a particular time point and suffer from recall bias. Hence, the water diary method better captures the temporal variations such as seasonality in supply and coping responses. Water diaries suffer their own challenges, such as diarist fatigue, which may lead to short-cuts in recording information and eventually drop-out, as described in Hoque and Hope (2018).
A third type of study using survey methodology is a willingness to pay (WTP) study. These studies can be conducted by a range of sector stakeholders, mainly with the aim of determining a price for WASH services to ensure financial viability of the service, or to determine what subsidy is needed to make the service affordable. Currently there are no routine sources for obtaining willingness to pay data. A systematic review of WTP studies for water in
Myanmar, May 16, 2019 © UNICEF/UN0337676/Htet

26 Data for monitoring affordability
The Measurement and Monitoring of Water Supply, Sanitation and Hygiene (WASH) Affordability May 2021
2012 found a large number of studies; but when sorting for quality, only 5 experimental studies were found that met the inclusion criteria (Null et al 2012). Some years later, Van Houtven et al (2018) conducted a meta-analysis and found 60 WTP studies on water which could be used for their analysis. However, overall, WTP studies are conducted according to the needs of research or implementing organisations acting in isolation, and hence countries cannot rely on them being available for WASH affordability assessments.
A fourth type of study is an assessment of WASH costs and financing using research methods. The IRC’s WASHCost project was one such study which conducted detailed research in selected communities to understand the full range of costs and financing sources to meet the communities’ WASH needs. Similarly, the ESI study mentioned above collected field data on costs for sanitation and hygiene infrastructure. Also, the World Bank’s Country Status Overview (in Africa) or Service Delivery Assessment (in Asia) estimated national cost benchmarks for WASH services for estimating the cost of meeting national targets.
A fifth type of study is a financial analysis at the service provider level, covering either a single provider or conducting a comparative analysis across service providers. An example of the latter s the World Bank’s IBNET which collects data on utility prices and costs. Where these utilities consistently report their data, it enables a time series analysis. A Safe Water Network (SWN) study in 2017 also looked at price and demand changes over time for a small number of rural water service providers in Ghana, thus enabling conclusions about determinants of household demand.
A sixth type of study is a market assessment. These can be aggregated at different levels, from a single seller to a national market; hence they can be nationally representative if data are collected at a large scale. Some market data are collected routinely both by major suppliers on their own products and by market research agencies who may have major suppliers as clients. Government agencies, either directly or indirectly via a regulator, may also collect data on markets that touch on public policy such as toilet supplies, hygiene products, water treatment chemicals or fecal sludge management.
These six different types of survey or study can be very informative on the full range of WASH expenditures, household WASH behaviours and service or product markets in specific locations, and they can provide a snapshot in the countries where they are conducted. However, few if any of these types of survey are conducted continuously or in a large number of countries. In general, they are conducted to answer immediate time-bound questions rather than providing routine data over time. Data sets are typically owned by the financing and/or implementing partner and may not be made publicly available. Results are typically published in a report (grey literature) and sometimes in a peer-reviewed journal. Companies who conduct market assessments generally do not make their results publicly available.
Therefore, these types of survey or study cannot be relied upon for global monitoring. On the other hand, given their in-depth and unique nature, they can provide a useful snapshot of affordability in some locations, which might or might not be representative of the country at large.

27 Data for monitoring affordability
The Measurement and Monitoring of Water Supply, Sanitation and Hygiene (WASH) Affordability May 2021
4.3 Administrative data and policy surveys
The third category of data source is information that is routinely collected by utilities, other service providers, regulators and local authorities. These data are likely to provide information on some key variables related to affordability such as service access (of customers), service compliance (of providers), prices of goods and services, and expenditures. These data sources include provider databases, policy surveys, and expenditure tracking.
Provider databases are available either through regulatory agencies or self-reporting such as national, regional or global industry associations. Regulatory data has a high likelihood of being accurate, and is likely to improve over time, assuming the regulator has both the resources and the authority (e.g. to impose punitive measures). Self-reported data to industry associations are less likely to be accurate because data are not reported as part of a regulatory requirement, and there is limited validation of the data quality. The commitment of service providers to submit regular, quality data to industry associations will vary over time. Presently, the only initiative that provides some potential for global monitoring of affordability is the IBNET, managed by the World Bank. In the benchmarking initiative, IBNET encourages submission of a wide range of key performance indicators on water and wastewater. These include tariffs, average prices, average costs, and monthly cost of a given quantity of water for a single household (lifeline amount of 6m3). The reporting utilities are mainly from urban areas.10 The tariff database, on the other hand, claims 2,567 utilities are reporting from 211 countries and territories. The database contains tariff structure and rates.
Information on other types of tariff, such as tariffs paid to informal WASH service providers or investments made by households in their own installations (such as latrines) are not monitored by any regulators or industry associations. Some studies have sought to estimate the value of these flows, but only at single points in time. Available evidence shows that these flows are likely to be substantial, particularly for sanitation (Tremolet et al 2010). Indeed, Danert and Hutton (2020) argue that the “3 T” financing sources (taxes, tariffs and transfers) should be supplemented with HI (as household self-investment), which is commonly omitted from financing tracking initiatives and financial assessments.
Policy surveys provide information about the different measures to make WASH services more affordable to users. The main global sector resource providing such information is UN-Water’s biannual Global Analysis and Assessment of Sanitation and Drinking-Water (GLAAS). The survey consists of a questionnaire to Ministries and global sector donors every 2 years. In the latest 2018/19 round, the GLAAS survey covered 106 countries and 23 donors. For countries, the survey covered legal, regulatory, policy, programming, participation, monitoring and financing aspects. The following are the main relevant questions, although the survey contains many other questions that explore WASH sector performance related to efficiency, equity, collaboration and sustainability, and which will affect WASH affordability:
10 https://database.ib-net.org/DefaultNew.aspx accessed on 5th June 2020.

28 Data for monitoring affordability
The Measurement and Monitoring of Water Supply, Sanitation and Hygiene (WASH) Affordability May 2021
1
3
4
5
6
7
8
9
10
2
Legal: Does the constitution or other legislation recognize water and sanitation as human rights?
Regulatory: To what extent do regulations, standards and regulatory instruments exist for drinking-water and wastewater?
Policy: Are policy and planning development processes effective?
Policy: What is the national coverage target in each sub-sector?
Policy: Is there an affordability target for drinking-water (rural, urban)?
Programming: To what extent are there measures to extend services to vulnerable populations in national policies and plans? (9 categories given in form)
Participation: Are there clearly defined procedures in laws or policies for participation by service users (e.g. households) and communities and what is the level of participation?
Monitoring: Are there clearly defined performance indicators used for equitable coverage?
Monitoring: What is the progress towards affordability target for drinking-water (rural, urban)?
Monitoring: Is progress in extending and sustaining service provision specifically to the following populations tracked and reported? (9 categories given in form)
11
13
14
15
16
17
12
Financing: If a sector / sub-sector plan exists, has the plan been supported with adequate financing to implement the plan? Are there sufficient human resources to implement the plan?
Financing: Are operations and basic maintenance (O&M) covered by tariffs or household contributions?
Financing: Are there specific measures in the financing plan to target resources to reduce inequities in access and levels of service and are they being applied for vulnerable groups? (9 categories given in form)
Financing: Are there financial schemes to make access to WASH more affordable for vulnerable groups?
Financing: Is affordability of WASH services defined in policies or plans (e.g. no more than 2% of median household income)?
Financing: Please provide examples of affordability schemes in use and the scope of coverage, including how specific groups are targeted for these schemes.
Financing: Going forward, do you estimate that financing from all sources allocated to water/sanitation/hygiene is sufficient to reach national targets?
Indicators contained in the UN-Water GLAAS survey with direct or indirect relevance to WASH affordability

29 Data for monitoring affordability
The Measurement and Monitoring of Water Supply, Sanitation and Hygiene (WASH) Affordability May 2021
Affordability and other analyses can usefully draw on GLAAS monitoring data. For example, GLAAS data were used in a recent analysis in Bangladesh which explained how the country had met the national MDG target through household investments in unregulated shallow tubewells (Fischer et al 2020).
Expenditure tracking shows the public funds and ODA allocated to and spent on water and sanitation, and sometimes includes investments made by service providers and contribution of water users. The data for these surveys are typically extracted from administrative systems. Public expenditure reviews (PERs) are an instrument promulgated by the World Bank and used extensively in different sectors of the economy. PERs are a snapshot in time that typically cover the previous 2-3 years. PERs specific to water and sanitation have been conducted in many countries as one-off exercises. Between 2003 and 2009, the World Bank funded 40 PERs in which the water sector featured. A review by van Ginneken et al (2011) covers 15 PERs in water and sanitation for sub-Saharan Africa. PERs present data on where public funding is spent,
but they do not indicate accurately which households benefit from subsidies nor the expenditures they make on WASH services.
Since 2012, the UN-Water TrackFin initiative has been implemented by WHO11 in more than 10 countries, focusing on the WASH sector. The methodology is based on the National Health Accounts and is implemented using a detailed software and data collection instruments. In some countries, household surveys are conducted to capture user contributions. WHO encourages responsible ministries to set up TrackFin units and provide capacity building in order to enable sustained and regular assessments, rather than one-off exercises. Similarly to the PER instrument, TrackFin does not identify which households benefit from subsidies; however, because it can compare public and private spending, it does estimate the proportion of the WASH sector that is subsidized by public spending.
11 https://www.who.int/water_sanitation_health/monitoring/investments/trackfin/en/
Ghana, July 22, 2020 © UNICEF/UNI357812/Buta

30 Comparative performance of approaches
The Measurement and Monitoring of Water Supply, Sanitation and Hygiene (WASH) Affordability May 2021
05Comparative performance of approaches
30
1. Validity: the degree to which the definition of an indicator has encompassed the three dimensions of affordability, which are (a) the price or cost of WASH services at the household level; (b) the spending power of the household; and (c) the price or cost households incur in meeting other essential needs.
2. Accuracy: the degree to which the data used capture the definition in 1.
3. Relevance and uptake: whether an indicator or methodology makes sense or is it acceptable and useful to the stakeholders who are going to use it.
4. Feasibility: the ease of estimating an indicator and applying a methodology, including the required disaggregation.
5.1 Expenditure threshold approach
The threshold approach provides a crude assessment of WASH expenditure relative to total expenditure, and has been popular with policy makers and service providers. Figure 2 shows the partial costs of monthly WASH expenditure as a proportion of total expenditure for six countries (Mexico, Cambodia, Ghana, Zambia, Uganda and Pakistan), reflecting indicator 2.1C (see Table 3). There is a large range in the percentage of households which reported paying no money for O&M WASH expenses: 72% in Pakistan, 59% in Zambia to 30% in Mexico. The proportion of households that pay less than 1% of total expenditures was 16% in Uganda, 48% in Ghana and above 50% in all other countries. Only 2% of households in Cambodia paid more than 5% of their total expenditures on WASH O&M; this goes up to 5% of households in Mexico and Zambia, 12% in Pakistan, 19% in Ghana and 22% in Uganda. As a proportion of total expenditure, household expenditure on WASH was, on average, 1.5% in Mexico, 2.1% in Zambia, 2.4% in Uganda, in 3.0% in Ghana and 4.1% in Pakistan. These numbers hide rural urban differences. For example, in Ghana rural households spent 1.7% of their total expenditure on WASH, compared to 5.5% for urban households.
Before making recommendations for monitoring of WASH affordability in Chapter 6, this chapters provides a summary assessment of the different approaches to measuring and monitoring affordability. A more detailed comparison is provided in the full report. Approaches are assessed against the following criteria:

31 Comparative performance of approaches
The Measurement and Monitoring of Water Supply, Sanitation and Hygiene (WASH) Affordability May 2021
Figure 3 shows Indicator 2.1C, across deciles of total household expenditure for the same six countries – including all households. Mexico, Zambia and Uganda appear to have a trend: higher income households seem to spend
a lower percentage of expenditures on WASH. In Cambodia, Ghana and Pakistan, the proportion of total expenditures does not seem to be correlated with income levels.
Figure 2. Distribution of partial WASH expenditure share as percent of total expenditure across major cut-offs, for Mexico, Cambodia, Ghana, Zambia, Uganda and Pakistan (Indicator 2.1C)
Figure 3. Comparison of actual O&M costs for Mexico, Cambodia, Ghana, Zambia, Uganda and Pakistan (Indicator 2.1C) and actual O&M + time expenditure for Ghana (Indicator 2.2C), across deciles of total expenditure

32 Comparative performance of approaches
The Measurement and Monitoring of Water Supply, Sanitation and Hygiene (WASH) Affordability May 2021
Affordability indicators 2.1C and 2.2C incorporate data collected directly from households, which is a reasonably good method for gathering accurate data, despite some cost category omissions. However, as household costs sometimes refer to unimproved water sources and unimproved sanitation access, the costs of achieving national minimum standards are not reflected. Therefore,
Figure 4. Distribution of partial WASH expenditure share, and required WASH expenditure on O&M for basic WASH service across major cut-offs, for Mexico, Cambodia, Zambia, Uganda and Pakistan (Indicator 2.1C and 3.1C)
in order to design an affordability indicator that does not implicitly encourage lower levels of access, capital and operational costs were estimated to meet basic WASH service levels in each country, to estimate indicator 3.1C.
Figure 4 provides a comparison of the distribution of partial costs (indicator 2.1C) versus required costs (indicator
3.1C) across the same six countries. It can be clearly seen that achieving basic access is less affordable in Ghana, Zambia and Pakistan, where WASH expenditure exceeds 5% of total expenditure for the majority of households. in Cambodia, Uganda and Mexico, the majority of households would spend less than 3% of their expenditure to access basic WASH.

33 Comparative performance of approaches
The Measurement and Monitoring of Water Supply, Sanitation and Hygiene (WASH) Affordability May 2021
Figure 5 shows the results of Indicator 3.1C across wealth deciles for the six countries. The results shown in Figure 5 indicate a more pronounced relationship between household income levels and affordability, as
Figure 5. Comparison of required O&M costs for Mexico, Cambodia, Ghana, Zambia, Uganda and Pakistan (Indicator 3.1C) and required O&M + time expenditure for Ghana (Indicator 3.2C), across deciles of total expenditure
compared to Indicator 2.1C. While the relationship is most pronounced for Zambia at lower expenditure deciles, strong relationships are shown for Uganda and Pakistan.
When the results for the selected indicators are compiled, it shows an interesting picture. Figure 6 shows a summary of different indicators by income decile for Ghana. The indicator using partial costs for O&M (indicator 2.1C) shows little variation across total expenditure deciles, indicating lower WASH costs for poorer households. This is likely because poorer households have lower levels of WASH access; comparing indicator 2.1C with other indicators that incorporate either time costs (indicator 2.2C) or access level (indicator 3.1C) show this to be the case. The real costs of accessing WASH services, which include time
costs, vastly exceed the financial costs currently paid by households, with a greater impact for the poorest households. When time costs are taken into account (Indicators 2.2C and 3.2C), poorer households end up spending more on WASH access. The analysis values time at the minimum wage; but even if it was half this, the effect would still be strong. Although some households may not have a lot of choice about the WASH service level they consume, these results indicate that many households might choose WASH access options that have lower monetary costs but higher time costs.
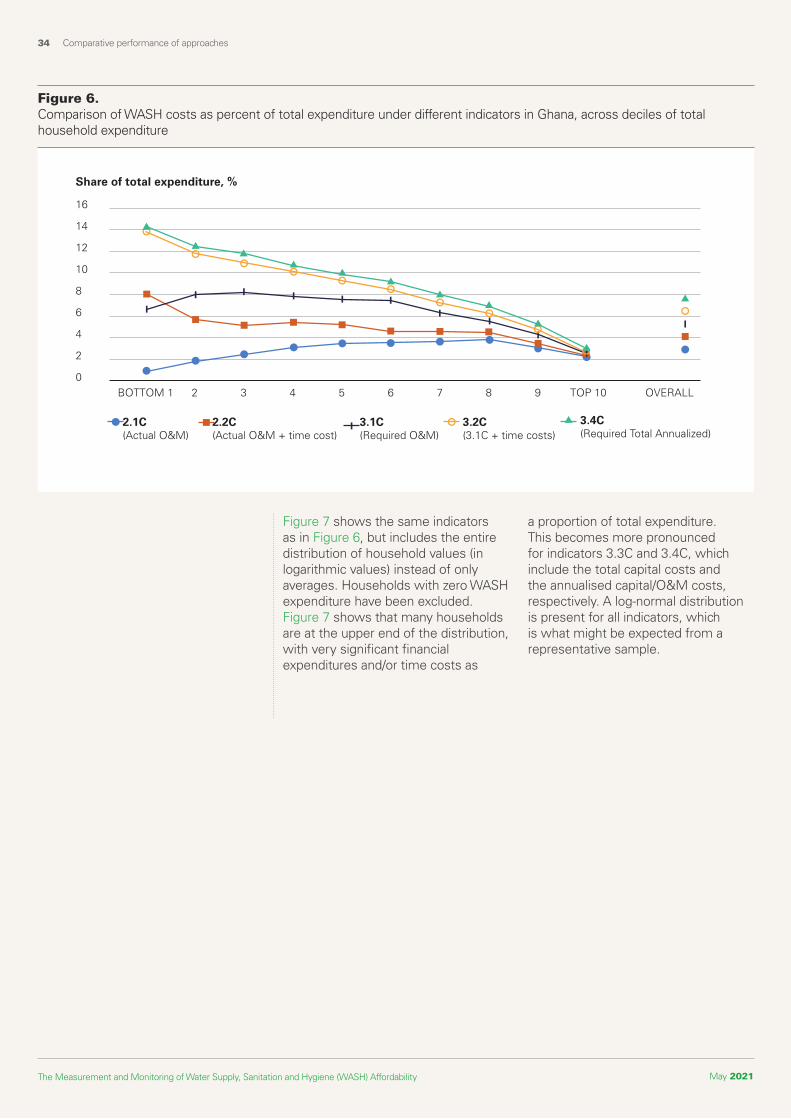
34 Comparative performance of approaches
The Measurement and Monitoring of Water Supply, Sanitation and Hygiene (WASH) Affordability May 2021
Figure 6. Comparison of WASH costs as percent of total expenditure under different indicators in Ghana, across deciles of total household expenditure
Figure 7 shows the same indicators as in Figure 6, but includes the entire distribution of household values (in logarithmic values) instead of only averages. Households with zero WASH expenditure have been excluded. Figure 7 shows that many households are at the upper end of the distribution, with very significant financial expenditures and/or time costs as
a proportion of total expenditure. This becomes more pronounced for indicators 3.3C and 3.4C, which include the total capital costs and the annualised capital/O&M costs, respectively. A log-normal distribution is present for all indicators, which is what might be expected from a representative sample.
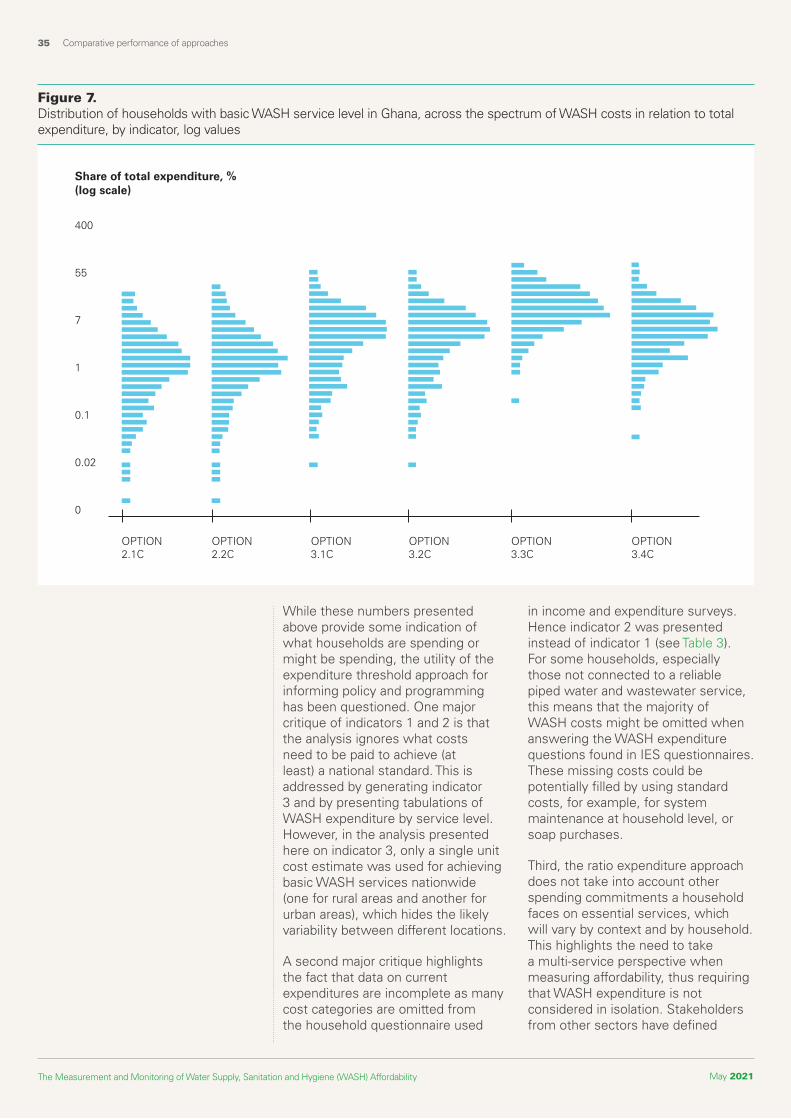
35 Comparative performance of approaches
The Measurement and Monitoring of Water Supply, Sanitation and Hygiene (WASH) Affordability May 2021
Figure 7. Distribution of households with basic WASH service level in Ghana, across the spectrum of WASH costs in relation to total expenditure, by indicator, log values
While these numbers presented above provide some indication of what households are spending or might be spending, the utility of the expenditure threshold approach for informing policy and programming has been questioned. One major critique of indicators 1 and 2 is that the analysis ignores what costs need to be paid to achieve (at least) a national standard. This is addressed by generating indicator 3 and by presenting tabulations of WASH expenditure by service level. However, in the analysis presented here on indicator 3, only a single unit cost estimate was used for achieving basic WASH services nationwide (one for rural areas and another for urban areas), which hides the likely variability between different locations.
A second major critique highlights the fact that data on current expenditures are incomplete as many cost categories are omitted from the household questionnaire used
in income and expenditure surveys. Hence indicator 2 was presented instead of indicator 1 (see Table 3). For some households, especially those not connected to a reliable piped water and wastewater service, this means that the majority of WASH costs might be omitted when answering the WASH expenditure questions found in IES questionnaires. These missing costs could be potentially filled by using standard costs, for example, for system maintenance at household level, or soap purchases.
Third, the ratio expenditure approach does not take into account other spending commitments a household faces on essential services, which will vary by context and by household. This highlights the need to take a multi-service perspective when measuring affordability, thus requiring that WASH expenditure is not considered in isolation. Stakeholders from other sectors have defined

36 Comparative performance of approaches
The Measurement and Monitoring of Water Supply, Sanitation and Hygiene (WASH) Affordability May 2021
their own frameworks on assessing affordability, such as nutrition (based on adequate nutritional intake and the food poverty line) and health (adopting the term ‘catastrophic’ health spending, i.e. spending that propels a vulnerable household into poverty). However, to date there has been no integrated assessment across different sectors using affordability benchmarks.
Fourth, when time costs are added into the numerator of the expenditure ratio, it can significantly increase the ratio, as shown in the case studies (see Annex B of the full report). The expenditure ratio increases most for those households with the least financial costs, as they are more likely to be accessing free or low-cost service or have no service at all. Hence, including access time costs will need international consensus around the valuation methodology to be more widely applicable.
Fifth, the ratio expenditure approach ignores the financial and economic benefits that flow from higher WASH service levels. There are reports that the ‘poor’ are willing to pay for 24/7 services as it transforms their lives and provides the time and improved health necessary for children to go to school, and for families to improve their economic situations. Hence households might see the high cost of water as having a high return, which means they are willing to pay the higher cost. Also, improved piped supply might lead to lower expenditure on vendor-supplied water, leading to net cost savings for poor households.
Sixth, the threshold approach focusing on household spending ignores broader aspects of affordability such as whether existing financing from governments or donors is sustainable. For example, can the public sector continue to subsidise services at the same levels? If not, additional costs will eventually need to be passed to the household.
Lebanon, 2020 © UNICEF/UNI317998/Choufany
37 Comparative performance of approaches
The Measurement and Monitoring of Water Supply, Sanitation and Hygiene (WASH) Affordability May 2021
5.2 Revealed preferences
Under some circumstances, revealed preferences can expose affordability issued faced by households, especially when high prices or price increase over time leads to household demand falling below the minimum service standard. Both static and dynamic data analyses can enable useful interpretations on affordability. For water, quantity versus price changes can be recorded over time for individual households (if their consumption is metered). Alternatively, absolute water demand levels can be compared across households in different income groups to assess the extent to which poorer households have suppressed demand. For sanitation, preferences can be revealed through market behaviour of households in one-off purchase decisions of toilets, periodic decisions on pit emptying, or demand for toilet cleaning products or soap.
However, the reasons explaining individual household choices can be hard to assess at the aggregate level, as there are many drivers of household spending decisions. These decisions are made based on an implicit hierarchy of needs and preferences which vary from one household to the next, thus making it hard to conclude whether WASH is truly affordable or unaffordable for a specific household. Where demand is particularly low for a WASH service, real-life experiments can be conducted to observe whether price reductions lead to significant increases in demand. However, the interpretation of the results would need to take into account the many factors explaining household consumption choices.
5.3 Stated preferences
There are both strengths and weaknesses of stated preference measures. The stated preference approach potentially covers all three dimensions of affordability – as household opinions expressed in interviews will take into account WASH prices, their income level and other needs. The main advantage of the contingent valuation approach to measuring willingness to pay (WTP) is that it considers household priorities and eventual choices based on their own situation, reflected by specific constraints, opportunities and preferences. For example, a household might be willing to pay well above a defined affordability ‘threshold’ because of the social and economic benefits they recognize as resulting from using a better WASH service. Also, the stated preference methodology allows demand for a service to be voiced in cases where households are currently
excluded, for example due to non-tenure of land or lack of legal status, and where unserviced households might show a high willingness to pay for a service that is provided to other households nearby.
On the other hand, the contingent valuation methodology suffers various problems. Results of studies that have been used for policy making or price-setting have sometimes been shown to be inaccurate or incorrect after more data have been collected on actual market behaviour. Weaknesses can be addressed through implementing larger samples, using better formulated questions and more tailored analyses for the results to be valid.
Direct household responses to questions on WASH affordability have some similarities to the contingent valuation methodology, in that it relies on household subjective assessments. However, it is a simpler, more direct way to assess whether there are affordability constraints. If households are not accessing a WASH service, they can be given a range of reasons why not, among them “we cannot afford to pay for it” or “we do not want to pay for it”. Given the limited experience with questions that directly ask households about WASH affordability, it is difficult to conclude how valid they might be. In designing such questions, it would be important to have a broader set of questions to contextualise their responses on WASH demand and affordability, such as their perceptions of a desirable service level, their history of WASH services or their perceptions of what the government should do for them. In some countries, citizen committees act on behalf of the regulator to provide potential solutions to citizen complaints. Such platforms could be used to explore these issues.

38 Comparative performance of approaches
The Measurement and Monitoring of Water Supply, Sanitation and Hygiene (WASH) Affordability May 2021
5.4 Poverty status
The use of poverty lines to define population groups that are least likely to afford WASH is potentially a very neat and simple approach. If a household is poor, they are likely to be the most deserving of assistance to help them achieve or sustain a minimal level of WASH service. The advantage of the poverty line is that it considers other essential needs, and therefore might be seen as most within the spirit of the human rights to safe drinking water and sanitation. However, the weaknesses of poverty classification systems might lead to mis-categorization of households as poor that are non-poor, or of non-poor households that are poor (see Chapter 3.5). One problem of defining households by their poverty status is that poverty lines are typically set at national level and are thus a blunt instrument for deciding if a specific household in a specific neighbourhood should pay the full price of a WASH service.
Furthermore, the response to unaffordable WASH prices should be coordinated with the multi-sectoral response to addressing poverty. It is also unclear how households would be dealt with that are ‘near poor’ or at risk of falling into poverty. Indeed, making such households pay for costlier WASH services might risk putting them into poverty.
5.5 Enabling environment responses to affordability
Overall, enabling environment indicators are predictive of whether services are likely to be affordable, being based on the underlying policy frameworks, programming approaches, market attributes, sector intelligence and financing mechanisms and flows, as well as indicators such as the rates of water disconnection and bill collection. However, these indicators say little about the prices paid and their actual affordability. For this reason, they will not themselves be sufficient to assess affordability, but rather they will provide important additional data for a fuller interpretation of other affordability indicators. They will also help guide the appropriate responses based on what is already being done to improve affordability.
The picture of WASH affordability is therefore not complete without inclusion of indicators of what measures are being taken – or could be taken – to make WASH more affordable. Indeed, some of these indicators will help explain the contents of the expenditure ratio (both the numerator and the denominator), which are affected by different forms of subsidy and household income supplementation. Therefore, there will be an interplay between the enabling environment indicators and the expenditure-based affordability indicators. For example, poor households might find a basic WASH service affordable exactly because there is a policy that ensures WASH subsidies are received by poor households.
Given the large number of indicators, it is necessary to place them together and view them from different angles to enable a correct and overall interpretation. Brief assessments were conducted in the country case studies, synthesised in Annex B of the full report and available as separate country reports. The most complete country case study was reported for Ghana (Hutton et al 2019).
In addition to household affordability, policy analyses cannot ignore that WASH costs must be paid from one or more of the 3 Ts (tariffs, transfers and taxes). Hence, an exploration is needed of how to link household affordability with broader issues of societal affordability, taking into account the full production costs and sustainability considerations.
39 Comparative performance of approaches
The Measurement and Monitoring of Water Supply, Sanitation and Hygiene (WASH) Affordability May 2021
39
The Measurement and Monitoring of Water Supply, Sanitation and Hygiene (WASH) Affordability May 2021
Mali, 2020 © UNICEF/UNI332257/Keïta
Comparative performance of approaches
40 Conclusions and recommendations
The Measurement and Monitoring of Water Supply, Sanitation and Hygiene (WASH) Affordability May 2021
06Conclusions and recommendations
40
This report has shown the many opportunities as well as constraints to measuring and monitoring the affordability of water, sanitation and hygiene. Given the current data sets, it will be challenging to monitor affordability at the global level in any broad sense, using all the identified approaches and methodologies. That said, there are several avenues to pursue in analysing existing data sets which can uncover issues of affordability in a significant number of countries globally, covering both high-, middle- and low-income countries. The six country case studies, summarised in Annex B of the full report, indicate some of the affordability issues that can be identified with current evidence. If similar studies were conducted in a sufficient number of countries from different world regions, a global picture would emerge. As with all endeavours, the funding available for affordability monitoring will determine the scope and precision of the findings. This chapter provides overall conclusions and recommendations for monitoring of affordability at global and at national levels.
6.1 Global level monitoring6.1.1 Conclusions
Several alternative angles have been explored in this report for understanding whether households are able to afford WASH – though most of these examine relative affordability (on a sliding scale) as opposed to absolute affordability (affordable versus not affordable). The latter can only be determined using the expenditure threshold approach when affordability thresholds are introduced, which until now have been arbitrary values between around 3% and 6% of household income. Alternatively, application of the poverty line can identify households likely to find higher levels of WASH services unaffordable; and also subjective assessments of affordability can be made when households are asked directly whether they can afford WASH services or not.
Returning to the three dimensions of affordability introduced in section 2.2, the first two are the most critical to capture:
1. What people are either (a) currently paying, or (b) would pay for (at least) the minimum service level.
2. How this compares to either (a) their total income or expenditure, or (b) their disposable income.
Data on these variables are available from nationally representative income and expenditure surveys which are conducted every 3 to 5 years in a significant number of countries globally, although cost data rarely cover all components of WASH covered in Chapter 3.2.1 (see Table 2 and Figure 2).
Cost data are also available from the World Bank’s IBNET utility database, which gives a snapshot of utility performance indicators and tariffs in selected countries and jurisdictions whose utilities (or regulators) have submitted data. However, the benchmarking and tariff databases are currently far from complete for global monitoring purposes, and they cover mainly urban areas.
The third dimension of affordability – what households have to pay for other essential services – is important to understand what resources households have remaining for WASH expenditure. In a multi-country assessment of affordability, it would be difficult to use a single threshold value to accurately assess affordability in a range of different contexts, given the differences in other essential services provided or supported by welfare states.
As proposed in Chapter 3.2.1, it might be possible to account for this third dimension in the disposable income calculation, by subtracting benchmark values for other essential costs such as food, housing, education and medical costs. However, any estimates of these costs would need to be aligned with affordability initiatives from those sectors, giving a cost estimation for an

41 Conclusions and recommendations
The Measurement and Monitoring of Water Supply, Sanitation and Hygiene (WASH) Affordability May 2021
essential basket of goods. Given the considerable inter-household variability in household composition (total members, their age and their health status), as well as property ownership, it becomes a very complicated exercise. Hence, for now, it is easier to make an affordability judgement based on total expenditure as the denominator.
6.1.2 Recommendations
Recommendation 1. Strengthen data sets and data analyses of income and expenditure surveys
1.
Existing income and expenditure surveys that are nationally representative provide the richest and most expansive data sets available on WASH as well as total expenditures. Cost estimates can also be made for
meeting service gaps and bringing all households to (at least) a minimum WASH service level defined either by national standards or the SDG targets 6.1 and 6.2 indicators. In the future, these data sets can be supplemented by (a) more questions in national income and expenditure surveys to enable better capture of a wider range of WASH expenditures; and (b) tailored WASH expenditure surveys conducted in localities where WASH services are likely to be challenging for populations to afford.
2.
Using nationally representative income and expenditure surveys, the monthly/annual costs of water and wastewater services should be extracted and tabulated:
a. By rural-urban area,
b. By decile and other socio-economic markers, and
c. By service level (piped, non-piped basic, below basic, no service; and degree of seasonality in service).
Sudan, February 16, 2014 © UNICEF/UNI165897/Noorani
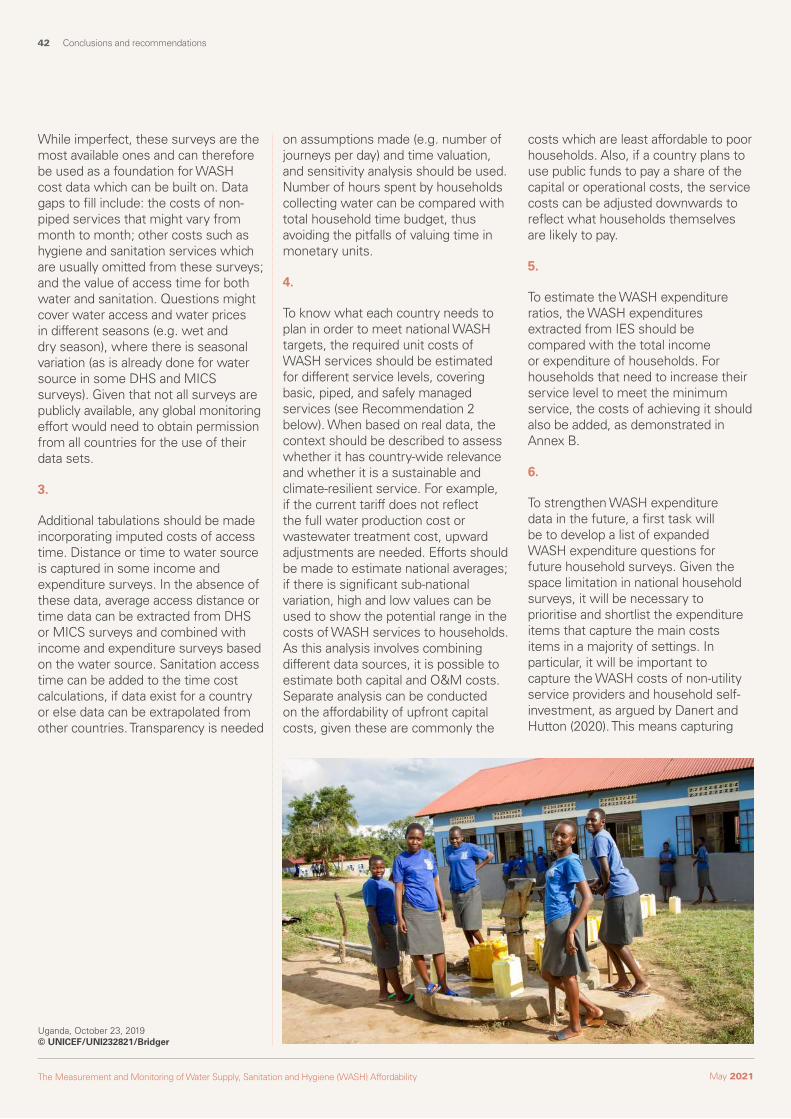
42 Conclusions and recommendations
The Measurement and Monitoring of Water Supply, Sanitation and Hygiene (WASH) Affordability May 2021
While imperfect, these surveys are the most available ones and can therefore be used as a foundation for WASH cost data which can be built on. Data gaps to fill include: the costs of non-piped services that might vary from month to month; other costs such as hygiene and sanitation services which are usually omitted from these surveys; and the value of access time for both water and sanitation. Questions might cover water access and water prices in different seasons (e.g. wet and dry season), where there is seasonal variation (as is already done for water source in some DHS and MICS surveys). Given that not all surveys are publicly available, any global monitoring effort would need to obtain permission from all countries for the use of their data sets.
3.
Additional tabulations should be made incorporating imputed costs of access time. Distance or time to water source is captured in some income and expenditure surveys. In the absence of these data, average access distance or time data can be extracted from DHS or MICS surveys and combined with income and expenditure surveys based on the water source. Sanitation access time can be added to the time cost calculations, if data exist for a country or else data can be extrapolated from other countries. Transparency is needed
on assumptions made (e.g. number of journeys per day) and time valuation, and sensitivity analysis should be used. Number of hours spent by households collecting water can be compared with total household time budget, thus avoiding the pitfalls of valuing time in monetary units.
4.
To know what each country needs to plan in order to meet national WASH targets, the required unit costs of WASH services should be estimated for different service levels, covering basic, piped, and safely managed services (see Recommendation 2 below). When based on real data, the context should be described to assess whether it has country-wide relevance and whether it is a sustainable and climate-resilient service. For example, if the current tariff does not reflect the full water production cost or wastewater treatment cost, upward adjustments are needed. Efforts should be made to estimate national averages; if there is significant sub-national variation, high and low values can be used to show the potential range in the costs of WASH services to households. As this analysis involves combining different data sources, it is possible to estimate both capital and O&M costs. Separate analysis can be conducted on the affordability of upfront capital costs, given these are commonly the
costs which are least affordable to poor households. Also, if a country plans to use public funds to pay a share of the capital or operational costs, the service costs can be adjusted downwards to reflect what households themselves are likely to pay.
5.
To estimate the WASH expenditure ratios, the WASH expenditures extracted from IES should be compared with the total income or expenditure of households. For households that need to increase their service level to meet the minimum service, the costs of achieving it should also be added, as demonstrated in Annex B.
6.
To strengthen WASH expenditure data in the future, a first task will be to develop a list of expanded WASH expenditure questions for future household surveys. Given the space limitation in national household surveys, it will be necessary to prioritise and shortlist the expenditure items that capture the main costs items in a majority of settings. In particular, it will be important to capture the WASH costs of non-utility service providers and household self-investment, as argued by Danert and Hutton (2020). This means capturing
Uganda, October 23, 2019 © UNICEF/UNI232821/Bridger

43 Conclusions and recommendations
The Measurement and Monitoring of Water Supply, Sanitation and Hygiene (WASH) Affordability May 2021
sources in a standard format, which can be used to assess the cost and affordability of service expansion and improvement in many countries simultaneously.
8.
From the IBNET global utility data base, it is recommended to extract and tabulate selected performance indicators. These can be averaged across all participating utilities for each country for data submitted in the previous 3 years. Variables of particular interest are (a) cost per cubic metre of water and wastewater, (b) cost per month per household for a lifeline amount of water (6 m3), and (c) monthly cost as percentage of median wage. It is also interesting to assess the financial viability of a utility, such as a comparison of average costs with average revenues. However, the number of utilities submitting data to the IBNET benchmarking platform is currently in decline, and many utilities who submit data do not submit for every year. The gap is even greater for utilities in low-income countries. IBNET therefore does not – at present – provide a reliable option for global monitoring of affordability focused on urban areas. Case studies can be made for selected utilities that have submitted their data, as illustrative of the prices faced by their customers. Hence, any future affordability initiative might promote the submission of complete data regularly to the IBNET platform, as it provides a standard and credible platform for monitoring prices and affordability in a substantial number of utilities. The data submitted can also be used by national governments, local governments and regulators alike.
Recommendation 3. Strengthen the use of the UN-Water GLAAS survey to collect and analyse policy indicators relevant for affordability assessment
9.
The GLAAS survey has considerable value as a tool for global monitoring on the status of the enabling environment across more than 100 countries. Many of the indicators collected by the survey are of relevance to affordability, and when triangulated with WASH expenditure data it is possible to develop a fuller understanding of whether policy responses are improving affordability and/or which new policy measures might improve future affordability.
10.
Some indicators collected by GLAAS have direct relevance, such as the setting of an affordability target for drinking-water, or whether affordability schemes exist for vulnerable groups. Others have indirect relevance, such as the availability of public funds and the degree to which the sector finances are likely to meet the national coverage targets. These are vital indicators to compile and report globally.
11.
Further assessment will be possible on how indicators perform in terms of validity and country response rate, in order to make recommendations for improved indicators in future cycles of the GLAAS survey. The reporting of some indicators needs to be improved, such as whether the affordability of WASH services has been defined in policies or plans (e.g. no more than 2% of median household income), or whether progress towards affordability target for drinking-water is monitored. In addition, deeper insights are needed into how national policies are implemented at sub-national level, as it will vary at different administrative levels and by different service providers. Additional questions
lumpy expenditures over 12 months prior to the survey (which is often the maximum recall time in an expenditure survey), taking into account that prices, quantities and sources might vary over a single year period. In addition, capital items need to be better captured in terms of their value, their expected duration and how often they are renovated or replaced. When reviewing the core and expanded questions to measure WASH affordability, there is an opportunity to better capture water needs and expenditures for non-domestic uses, given their importance in the economy of households, especially in rural areas. Published studies on the costs of coping with WASH expenditure (e.g. Gurung et al 2017; Cook et al 2016) can be used to further explore different aspects of WASH affordability.
Recommendation 2. Build and strengthen global databases of WASH tariffs and costs
7.
Aside from income and expenditure surveys to collect cost data, there already exists a range of data sources on the costs of providing WASH services. These include the World Bank’s IBNET global utility data base with data on performance and tariffs, academic papers, data sets and reports from development agencies and academic institutions, and engineering departments of relevant ministries in countries. However, these studies and data sets are found in many different places and there is no platform consolidating them. Also, studies and data sets reference different service levels or are provided in different units of measurement (e.g. cost per infrastructure, cost per household, cost per capita). Furthermore, cost data quickly become outdated given the high rates of inflation and technology change in many countries. It is therefore recommended to create a common database which collects and compiles cost data from all these

44 Conclusions and recommendations
The Measurement and Monitoring of Water Supply, Sanitation and Hygiene (WASH) Affordability May 2021
could be added to the GLAAS survey on water disconnection rates, market attributes for poor people such as competitiveness and access, and availability of affordable loans.
Recommendation 4. Reach a broad consensus on the setting of a threshold or range for an affordable WASH service, preferably with reference to broader poverty assessments and affordability of other essential goods and services
12.
Given different international agencies, governments and utilities are using different thresholds, it is important to try and reach a consensus on how to set and use affordability thresholds in the future. First, it is recommended to review the issues and determinants of an affordability threshold while enabling national and local authorities to adapt the thresholds to their context. International agencies might use affordability ‘bands’ rather than point estimates. Different thresholds should be explored for water alone, water and sanitation together, and WASH as a whole.
13.
A threshold value that only considers the costs of WASH services risks leading to overly simplistic proposals which might be poorly applied in country settings – for example, concluding that WASH services are affordable when they are not. It will be necessary to engage in the discusion a range of players from other sectors or fields who have different perspectives and interests.
14.
It is therefore recommended to constitute a cross-sectoral panel to discuss the threshold value and find consensus on questions such as whether affordability thresholds should be used in different sectors, and how to interpret the expenditure data and affordability indicators. It may indeed not be desirable to set a single global affordability threshold, given the contextual factors and variability in cost components captured by different data sets.
Guinea-Bissau, January 16, 2020 © UNICEF/UNI284675/Prinsloo

45 Conclusions and recommendations
The Measurement and Monitoring of Water Supply, Sanitation and Hygiene (WASH) Affordability May 2021
6.2.1 Conclusions
The six national studies conducted and summarized in Annex B have demonstrated what standard analyses might be possible for a larger number of countries. These analyses can be extended by drawing on additional studies and data sets to enable a better interpretation of the findings. Indeed, one of the main purposes of the global analyses is to highlight potential affordability issues that need further analyses to explore and propose solutions. A country-level assessment of affordability has the flexibility to draw on a variety of available data sets and partner experiences. It can also collect other relevant data from service providers or populations through additional surveys. The presentation of findings to sector partners and experts can lead to a rich discussion on the validity of the results and the missing pieces, and to inform the policy and programmatic responses. Any such deeper or enhanced assessment of affordability can, in turn, be used to inform the global assessment.
6.2.2 Recommendations
At national and sub-national level, considerably more options are available for assessing affordability, and for combining such analyses with well formulated responses where lack of affordability is identified.
Recommendation 5. Conduct more in-depth country case studies to explore how WASH affordability can be better understood using available data sets, contributing to the implementation of enhanced national policies
15.
The 6 country case studies in Annex B and their individual reports can be used to further the policy dialogue in these and other countries, leading to better understanding of affordability issues among government stakeholders and in-country partners. Further quantitative and qualitative analyses can be conducted where data permit, and different surveys may be triangulated (e.g. IES, DHS, MICS) and gaps filled. More fine-tuned local interpretations are possible, based on locally defined poverty lines, location-specific average incomes and existing levels of subsidy. This requires a mapping of these variables on the expenditure data and other data tabulation provided by the various affordability analyses. This level of analysis could be called a country assessment type 1.
6.2 National (and sub-national) level monitoring
16.
Other case studies can be sought based on the availability of sub-national or small area data sets that have significant potential to make conclusions about WASH affordability. This may include slum or district surveys conducted by government or partners, or expenditure data from specific utilities or groups of utilities (e.g. as available from IBNET). For example, initial case studies on WASH affordability for utilities that have submitted data to IBNET could generate interest among stakeholders and become the foundation for broader analyses encompassing more utilities. This level of analysis could be called a country assessment type 2.
17.
When there is local interest in exploring WASH affordability further, additional surveys may be implemented that contain a fuller set of questions that cover a broader range of affordability dimensions or indicators. It is important to define a minimum and extended set of questions to capture WASH costs more fully and other essential needs and their costs, and (socio-economic) disaggregations, which allow more precise conclusions. This might include implementing a cost benchmark initiative at sub-national level, to account for within-country variations in both capital and O&M costs
18.
The lessons learned from these national assessments should be fed back into the global dialogue on WASH affordability and lead to fine-tuned recommendations for global monitoring.

46 References
The Measurement and Monitoring of Water Supply, Sanitation and Hygiene (WASH) Affordability May 2021
07References
46
ǒ Andres L, Brocklehurst C, Grabinsky J, Joseph G, Thibert M (2020). Measuring the affordability of water supply, sanitation, and hygiene services: a new approach. Water Economics and Policy.
ǒ Cook J, Kimuyu P, Whittington D (2016). The costs of coping with poor water supply in rural Kenya. Water Resources Research 52: 841–859.
ǒ Danert K, Hutton G (2020). Editorial: Shining the spotlight on household investments for water, sanitation and hygiene (WASH): let us talk about HI and the three ‘T’s. Jounal of WASH for Development 10(1).
ǒ Fischer A, Hope R, Manandhar A, Hoque S, Foster T, Hakim A, Sirajul Islam M, Bradley D (2020). Risky responsibilities for rural drinking water institutions: The case of unregulated self-supply in Bangladesh. Global Environmental Change 65: 102152.
ǒ Gurung Y, Zhao J, Kumar Bal KC, Wu X, Suwal B, Whittington D (2017). The costs of delay in infrastructure investments: A comparison of 2001 and 2014 household water supply coping costs in the Kathmandu Valley, Nepal. Water Resources Research 53(8): 7078–7102. doi: 10.1002/2016WR019529.
ǒ Heller L (2015. Affordability and the human rights to water and sanitation. A report by the Special Rapporteur on the human rights to water and sanitation. Human Rights Council. A/HRC/30/39.
ǒ Hoque SF and Hope R (2018). The water diary method – proof-of-concept and policy implications for monitoring water use behaviour in rural Kenya. Water Policy 20 (4): 725–743.
ǒ Hoque SF and Hope R (2019). Examining the economics of affordability through water diaries in coastal Bangladesh. Water Economics and Policy 6(3). 1950011.
ǒ Hutton G (2012). Monitoring “Affordability” of water and sanitation services after 2015: Review of global indicator options. United Nations Office of the High Commissioner for Human Rights, Geneva.
ǒ Hutton G and Andres L (2018). Counting the costs and benefits of equitable WASH service provision’, in “Achieving Equality in Water and Sanitation. Eds Cummings O and Slaymaker T. Routledge, UK.
ǒ Hutton G, Abdurazakov A, Burt Z, Costa, J, with the JMP/GLAAS Expert Consultative Group on WASH Affordability (2019). Assessing the Affordability of Water, Sanitation and Hygiene: Ghana Country Case Study. WHO/UNICEF Joint Monitoring Programme and UN-Water GLAAS.
47 References
The Measurement and Monitoring of Water Supply, Sanitation and Hygiene (WASH) Affordability May 2021
ǒ Hutton G, Rodriguez U-P, Winara A, Nguyen VA, Kov P, Chuan L, Blackett I, Weitz A (2014). Economic efficiency of sanitation interventions in Southeast Asia. Journal of Water, Sanitation and Hygiene in Development 4(1): 23-36.
ǒ McNicholl D, Hope R, Money A (2019). Performance-based funding for reliable rural water services in Africa. Uptime Working Paper.
ǒ Nauges C, Whittington D (2010). Estimation of water demand in developing countries: an overview. World Bank Research Observer Vol. 25, Issue 2: 263–294.
ǒ Null C, Hombrados JG, Kremer M, Meeks R, Miguel E and Zwane AP (2012). Willingness to pay for cleaner water in less developed countries: systematic review of experimental evidence. 3ie Systematic Review 06
ǒ Smets H (2012). Quantifying the affordability standard, in The Human Right to Water: Theory, Practice and Prospects. Cambridge University Press.
ǒ Trémolet, S., P. Koslky, and E. Perez. Financing On-Site Sanitation for the Poor. A Global Six Country Comparative Review and Analysis. 2010. Water and Sanitation Programme, World Bank.
ǒ UNICEF (2019). National Economic Impact Evaluation of Swachh Bharat Mission (Clean India Mission). UNICEF: New Delhi, India.
ǒ UN General Assembly (2015). Transforming our world: the 2030 Agenda for Sustainable Development. Resolution adopted by the General Assembly on 25 September 2015. A/RES/70/1.
ǒ UN General Assembly (2019). Global indicator framework for the Sustainable Development Goals and targets of the 2030 Agenda for Sustainable Development. The official indicator list includes the global indicator framework as contained in A/RES/71/313 including refinements agreed by the Statistical Commission at its 49th session in March 2018 (E/CN.3/2018/2, Annex II) and at its 50th session in March 2019 (E/CN.3/2019/2, Annex II).
ǒ United Nations Economic and Social Council. General Comment 15: The right to water (Twenty-ninth session, 2002), U.N. Doc. E/C.12/2002/11 (2003).
ǒ Van Ginneken M, Netterstrom U, Bennett A (2011). More, better, or different spending? Trends in public expenditure on water and sanitation in sub-Saharan Africa. White Papers 67321-AFR. World Bank.
ǒ Van Houtven GL, Pattanayak SK, Usmani Faraz, Yang J-C (2017). What are Households Willing to Pay for Improved Water Access? Results from a Meta-Analysis. Ecological Economics 136(C): 126-135.
ǒ Whittington, D. and Cook, J. (2019) ‘Valuing Changes in Time Use in Low- and Middle-Income Countries’, Journal of Benefit-Cost Analysis, 10, pp. 51–72. doi: 10.1017/bca.2018.21.
ǒ World Bank (2015). Economic assessment of sanitation interventions in Southeast Asia. Water and Sanitation Program. World Bank, Washington DC.

48 References
The Measurement and Monitoring of Water Supply, Sanitation and Hygiene (WASH) Affordability December 2020
Front cover :Guinea-Bissau, January 18, 2020 © UNICEF/UNI284645/Prinsloo
Back cover :Congo, 17 September 2019© UNICEF/UNI213409/ VincentTremeau