| Free TDS Software | TDS Software | TDS Return | TDS Computation | TDS Return Form 24q | Form 24q
Upload
telephonedatasystemsCategory
view
2.561download
2
May 6, 2016
First Quarter 2016 Results
Safe Harbor Statement Under the Private Securities Litigation Reform Act of 1995
All information set forth in this presentation, except historical and factual information, represents forward-looking statements. This includes all statements about the company’s plans, beliefs, estimates, and expectations. These statements are based on current estimates, projections, and assumptions, which involve certain risks and uncertainties that could cause actual results to differ materially from those in the forward-looking statements. Important factors that may affect these forward-looking statements include, but are not limited to: intense competition; the ability to execute TDS’ business strategy; uncertainties in TDS’ future cash flows and liquidity and access to the capital markets; the ability to make payments on TDS and U.S. Cellular indebtedness or comply with the terms of debt covenants; impacts of any pending acquisitions/divestures/exchanges of properties and/or licenses, including, but not limited to, the ability to obtain regulatory approvals, successfully complete the transactions and the financial impacts of such transactions; the ability of the company to successfully manage and grow its markets; the overall economy; the access to and pricing of unbundled network elements; the ability to obtain or maintain roaming arrangements with other carriers on acceptable terms; the state and federal telecommunications regulatory environment; the value of assets and investments; adverse changes in the ratings afforded TDS and U.S. Cellular debt securities by accredited ratings organizations; industry consolidation; advances in telecommunications technology; pending and future litigation; changes in income tax rates, laws, regulations or rulings; changes in customer growth rates, average monthly revenue per user, churn rates, roaming revenue and terms, the availability of wireless devices, or the mix of products and services offered by U.S. Cellular and TDS Telecom. Investors are encouraged to consider these and other risks and uncertainties that are discussed in documents furnished to the Securities and Exchange Commission.
2

3
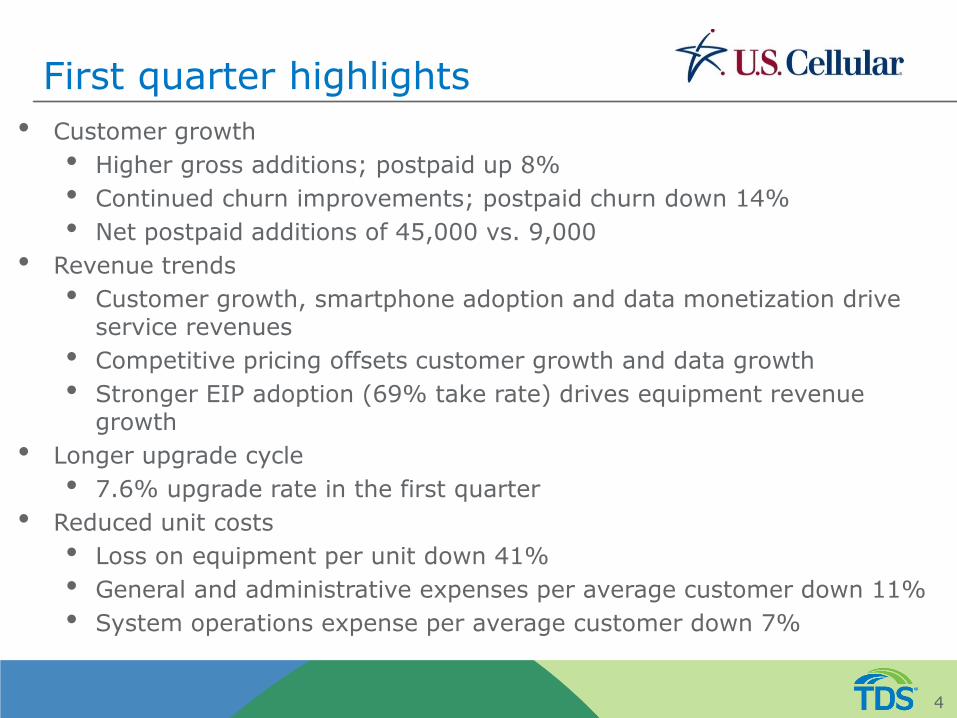
First quarter highlights
• Customer growth
• Higher gross additions; postpaid up 8%
• Continued churn improvements; postpaid churn down 14%
• Net postpaid additions of 45,000 vs. 9,000
• Revenue trends
• Customer growth, smartphone adoption and data monetization drive service revenues
• Competitive pricing offsets customer growth and data growth
• Stronger EIP adoption (69% take rate) drives equipment revenue growth
• Longer upgrade cycle
• 7.6% upgrade rate in the first quarter
• Reduced unit costs
• Loss on equipment per unit down 41%
• General and administrative expenses per average customer down 11%
• System operations expense per average customer down 7%
4

Customer results
Q1 ’16 Q1 ’15
Postpaid gross additions 215,000 200,000
Postpaid churn 1.28% 1.48%
Postpaid net additions 45,000 9,000
Prepaid net additions 12,000 12,000
Retail net additions 57,000 21,000
Total retail customers 4,853,000 4,667,000
5
Smartphones Feature Phones
Connected Devices
Postpaid gross additions 124,000 9,000 82,000
Postpaid net additions 20,000 (25,000) 50,000

Smartphone sales and penetration
6
67%
69%
72%
74%
75%
60%
62%
64%
66%
68%
70%
72%
74%
76%
Q1'15 Q2'15 Q3'15 Q4'15 Q1'16
86% 87% 87% 91%
92%
0%
10%
20%
30%
40%
50%
60%
70%
80%
90%
100%
Q1'15 Q2'15 Q3'15 Q4'15 Q1'16
Smartphone Sales (% of handset sales)
Smartphone Penetration (% of postpaid handsets)
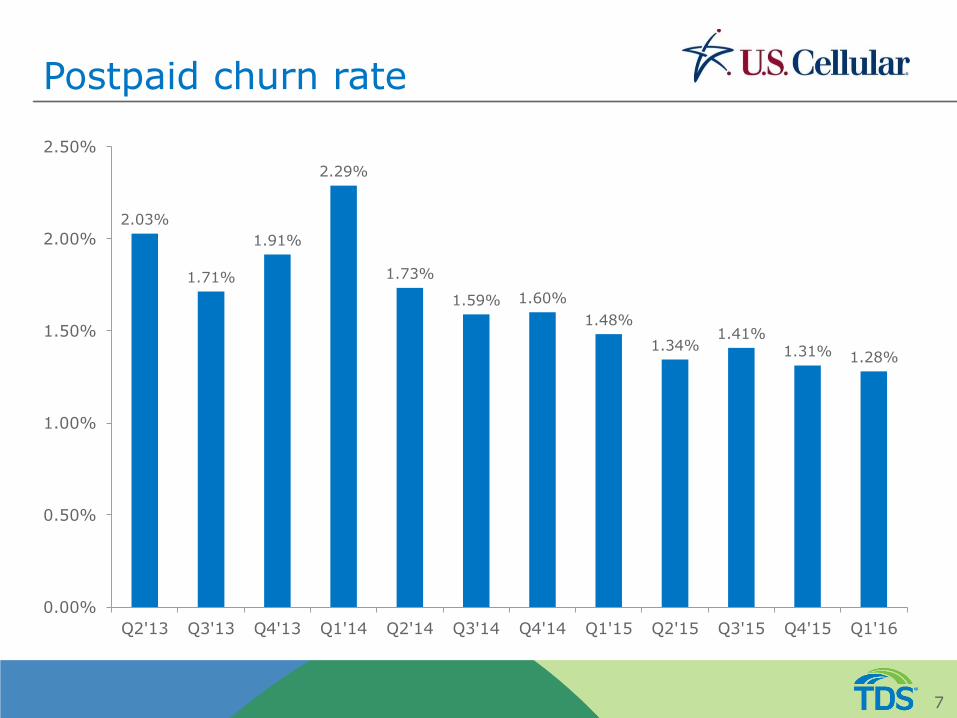
Postpaid churn rate
7
2.03%
1.71%
1.91%
2.29%
1.73%
1.59% 1.60%
1.48%
1.34% 1.41%
1.31% 1.28%
0.00%
0.50%
1.00%
1.50%
2.00%
2.50%
Q2'13 Q3'13 Q4'13 Q1'14 Q2'14 Q3'14 Q4'14 Q1'15 Q2'15 Q3'15 Q4'15 Q1'16

Total operating revenues
($ in millions)
Q1’16 Q1’15 %
Change
Service revenues $760 $828 (8%)
Retail service 682 747 (9%)
Roaming 36 40 (11%)
Tower rentals (1) 14 14 --
Other 28 27 1%
Equipment sales revenues 198 137 45%
Total operating revenues $958 $965 (1%)
8
(1) On a comparable basis excluding divested towers in Q1’15, tower rentals increased 11%
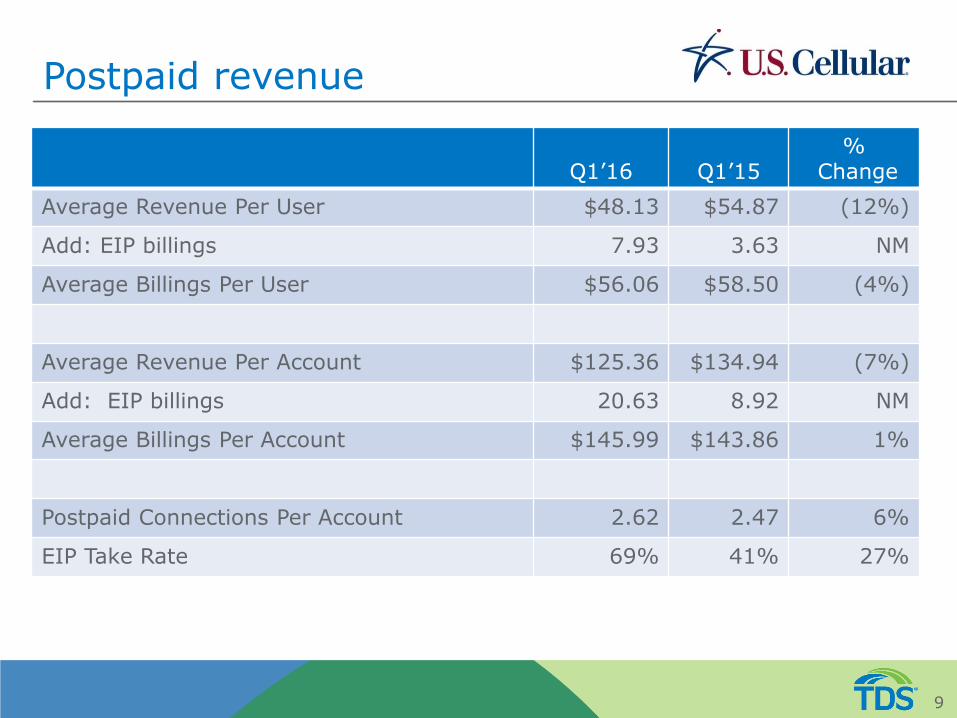
Postpaid revenue
Q1’16 Q1’15 %
Change
Average Revenue Per User $48.13 $54.87 (12%)
Add: EIP billings 7.93 3.63 NM
Average Billings Per User $56.06 $58.50 (4%)
Average Revenue Per Account $125.36 $134.94 (7%)
Add: EIP billings 20.63 8.92 NM
Average Billings Per Account $145.99 $143.86 1%
Postpaid Connections Per Account 2.62 2.47 6%
EIP Take Rate 69% 41% 27%
9
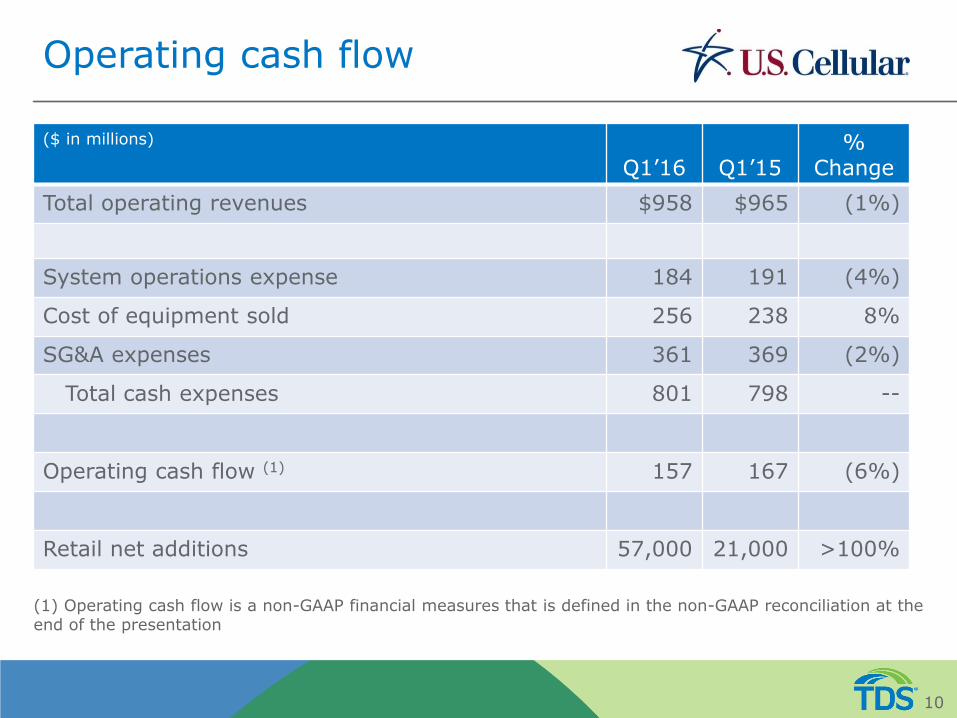
($ in millions)
Q1’16 Q1’15 %
Change
Total operating revenues $958 $965 (1%)
System operations expense 184 191 (4%)
Cost of equipment sold 256 238 8%
SG&A expenses 361 369 (2%)
Total cash expenses 801 798 --
Operating cash flow (1) 157 167 (6%)
Retail net additions 57,000 21,000 >100%
Operating cash flow
10
(1) Operating cash flow is a non-GAAP financial measures that is defined in the non-GAAP reconciliation at the end of the presentation
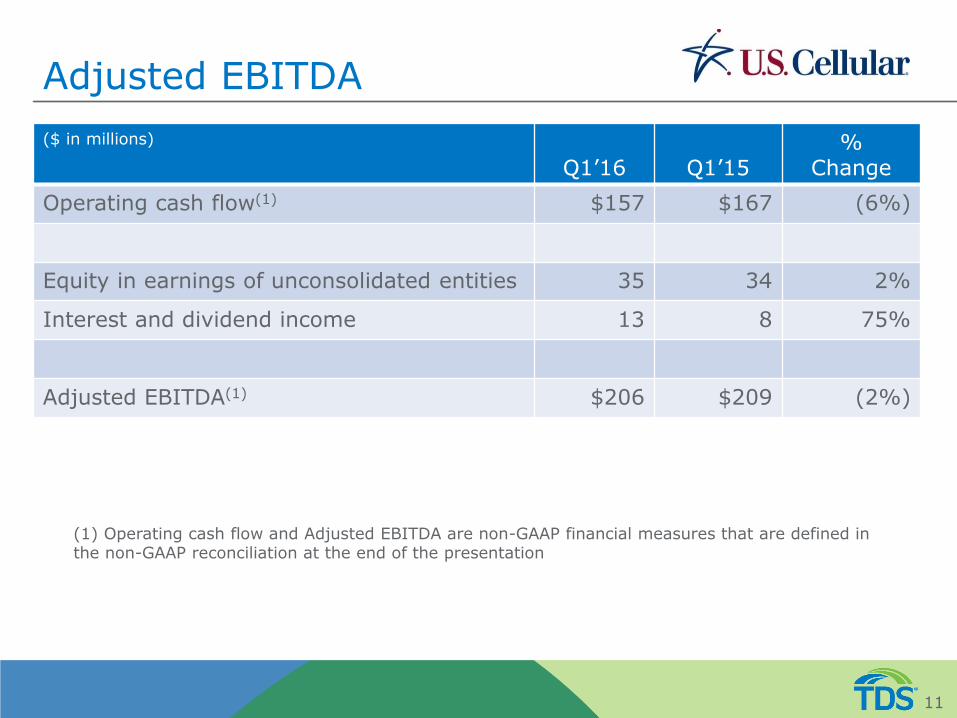
Adjusted EBITDA
($ in millions)
Q1’16 Q1’15 %
Change
Operating cash flow(1) $157 $167 (6%)
Equity in earnings of unconsolidated entities 35 34 2%
Interest and dividend income 13 8 75%
Adjusted EBITDA(1) $206 $209 (2%)
11
(1) Operating cash flow and Adjusted EBITDA are non-GAAP financial measures that are defined in the non-GAAP reconciliation at the end of the presentation
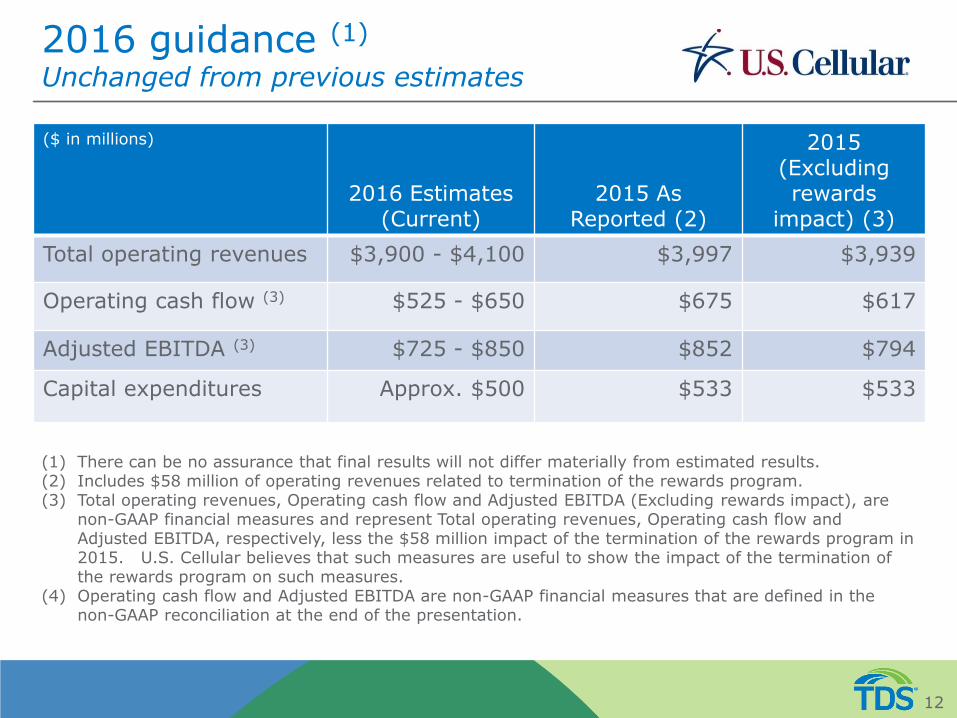
2016 guidance (1)
Unchanged from previous estimates
($ in millions)
2016 Estimates (Current)
2015 As Reported (2)
2015 (Excluding rewards
impact) (3)
Total operating revenues $3,900 - $4,100 $3,997 $3,939
Operating cash flow (3) $525 - $650 $675 $617
Adjusted EBITDA (3) $725 - $850 $852 $794
Capital expenditures Approx. $500 $533 $533
12
(1) There can be no assurance that final results will not differ materially from estimated results. (2) Includes $58 million of operating revenues related to termination of the rewards program. (3) Total operating revenues, Operating cash flow and Adjusted EBITDA (Excluding rewards impact), are
non-GAAP financial measures and represent Total operating revenues, Operating cash flow and Adjusted EBITDA, respectively, less the $58 million impact of the termination of the rewards program in 2015. U.S. Cellular believes that such measures are useful to show the impact of the termination of the rewards program on such measures.
(4) Operating cash flow and Adjusted EBITDA are non-GAAP financial measures that are defined in the non-GAAP reconciliation at the end of the presentation.

Regulatory update
• Special Access pricing
• Privacy rules for data services
• Lifeline program to support broadband services
• Universal Service Fund support for wireless broadband deployment
13

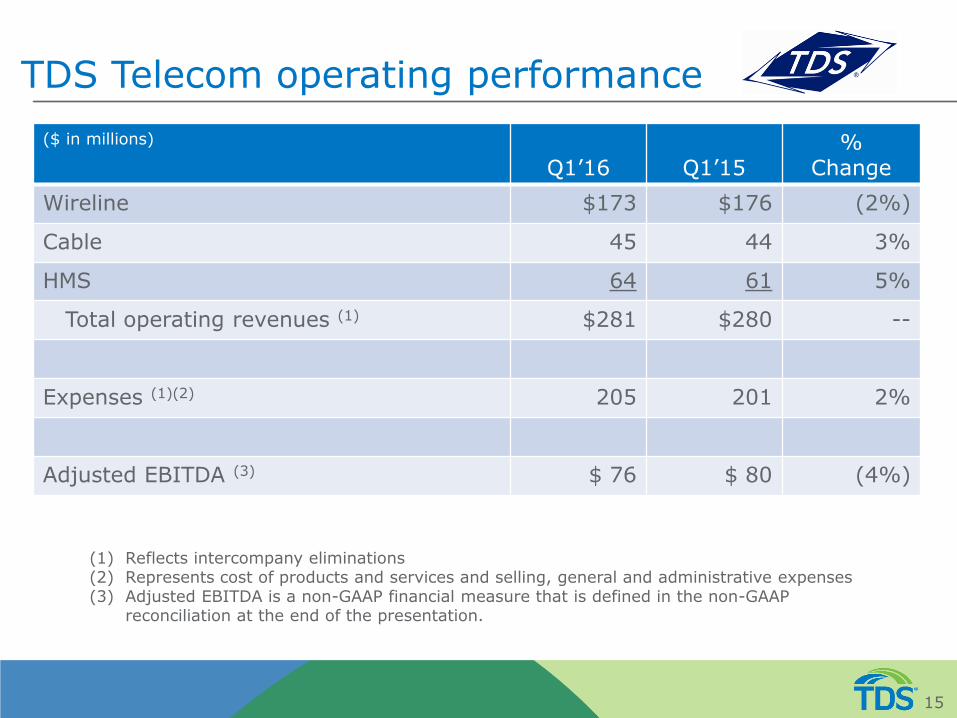
TDS Telecom operating performance
($ in millions)
Q1’16 Q1’15 %
Change
Wireline $173 $176 (2%)
Cable 45 44 3%
HMS 64 61 5%
Total operating revenues (1) $281 $280 --
Expenses (1)(2) 205 201 2%
Adjusted EBITDA (3) $ 76 $ 80 (4%)
15
(1) Reflects intercompany eliminations (2) Represents cost of products and services and selling, general and administrative expenses (3) Adjusted EBITDA is a non-GAAP financial measure that is defined in the non-GAAP
reconciliation at the end of the presentation.
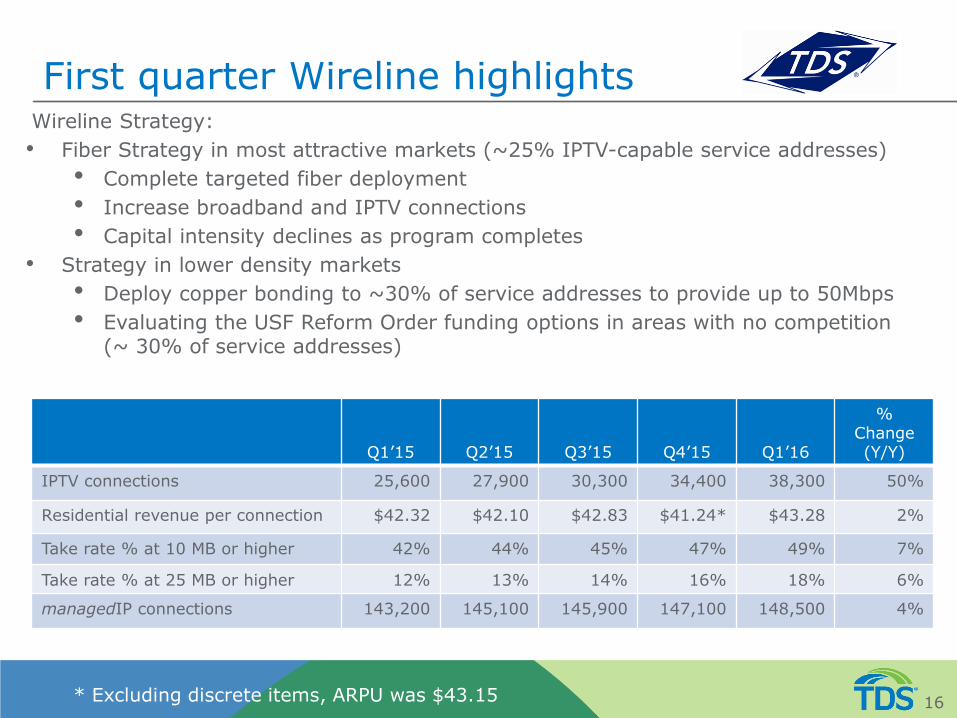
First quarter Wireline highlights
Wireline Strategy:
• Fiber Strategy in most attractive markets (~25% IPTV-capable service addresses)
• Complete targeted fiber deployment
• Increase broadband and IPTV connections
• Capital intensity declines as program completes
• Strategy in lower density markets
• Deploy copper bonding to ~30% of service addresses to provide up to 50Mbps
• Evaluating the USF Reform Order funding options in areas with no competition (~ 30% of service addresses)
16
Q1’15 Q2’15 Q3’15 Q4’15 Q1’16
% Change (Y/Y)
IPTV connections 25,600 27,900 30,300 34,400 38,300 50%
Residential revenue per connection $42.32 $42.10 $42.83 $41.24* $43.28 2%
Take rate % at 10 MB or higher 42% 44% 45% 47% 49% 7%
Take rate % at 25 MB or higher 12% 13% 14% 16% 18% 6%
managedIP connections 143,200 145,100 145,900 147,100 148,500 4%
* Excluding discrete items, ARPU was $43.15
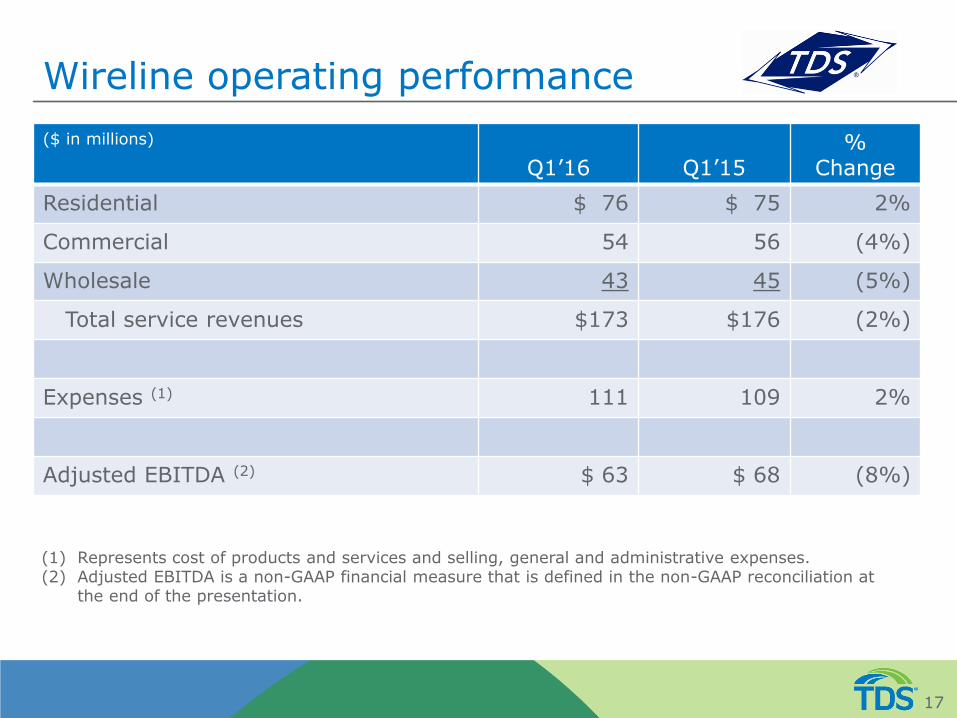
Wireline operating performance
($ in millions)
Q1’16 Q1’15 %
Change
Residential $ 76 $ 75 2%
Commercial 54 56 (4%)
Wholesale 43 45 (5%)
Total service revenues $173 $176 (2%)
Expenses (1) 111 109 2%
Adjusted EBITDA (2) $ 63 $ 68 (8%)
17
(1) Represents cost of products and services and selling, general and administrative expenses. (2) Adjusted EBITDA is a non-GAAP financial measure that is defined in the non-GAAP reconciliation at
the end of the presentation.

First quarter Cable highlights
• Cable Strategy
• Increase residential and commercial broadband customer connections
• Leverage Wireline capabilities to create additional synergies
• Internet connectivity, voice service and support systems connected to wireline’s multi-gig network which enhances reliability and redundancy
• Cable selling managedIP product
• Leveraging finance, HR, legal, procurement
• Continue to evaluate potential acquisitions
18
0
50,000
100,000
150,000
200,000
250,000
300,000
Q1'15 Q2'15 Q3'15 Q4'15 Q1'16
Video Voice Broadband
Connections
Broadband connections (Y/Y growth)
8%
5% Total connections (Y/Y growth)
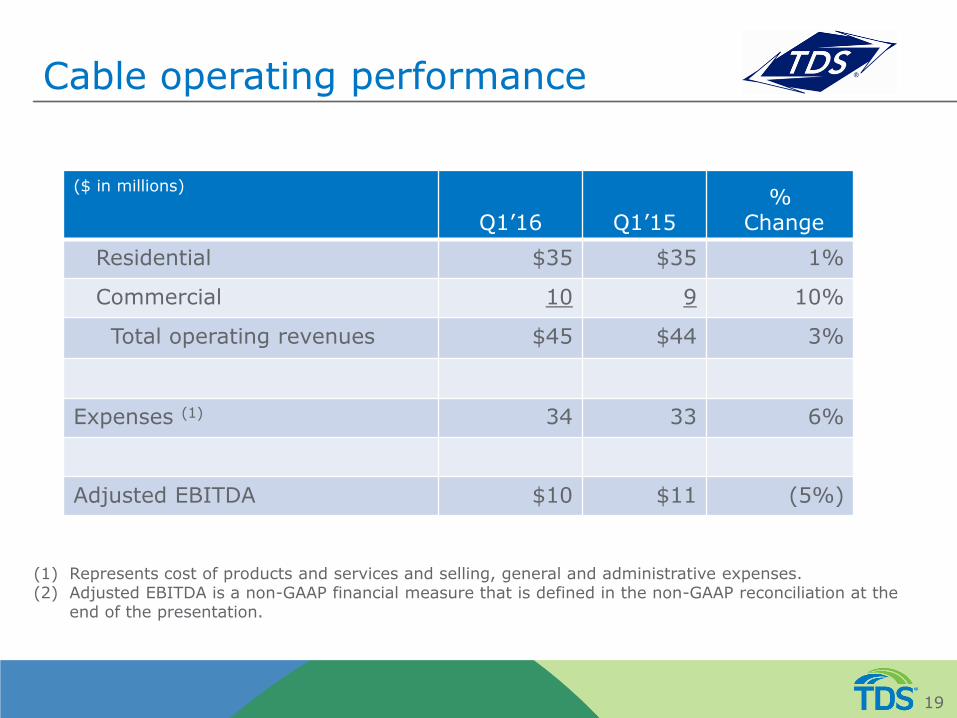
Cable operating performance
($ in millions)
Q1’16 Q1’15 %
Change
Residential $35 $35 1%
Commercial 10 9 10%
Total operating revenues $45 $44 3%
Expenses (1) 34 33 6%
Adjusted EBITDA $10 $11 (5%)
19
(1) Represents cost of products and services and selling, general and administrative expenses. (2) Adjusted EBITDA is a non-GAAP financial measure that is defined in the non-GAAP reconciliation at the
end of the presentation.

First quarter HMS highlights
• HMS Strategy
• Focus on growth of recurring service revenues
• Sell across entire portfolio
• Utilize new data center capacity
20
0
10
20
30
40
50
60
70
80
90
Q1'15 Q2'15 Q3'15 Q4'15 Q1'16
Service revenues Equipment revenues
Operating Revenues ($ in millions)
57%
43%
Filled Available
Rentable space
2%
Hosting revenues (Y/Y growth)
Total revenues
(Y/Y growth)
5%
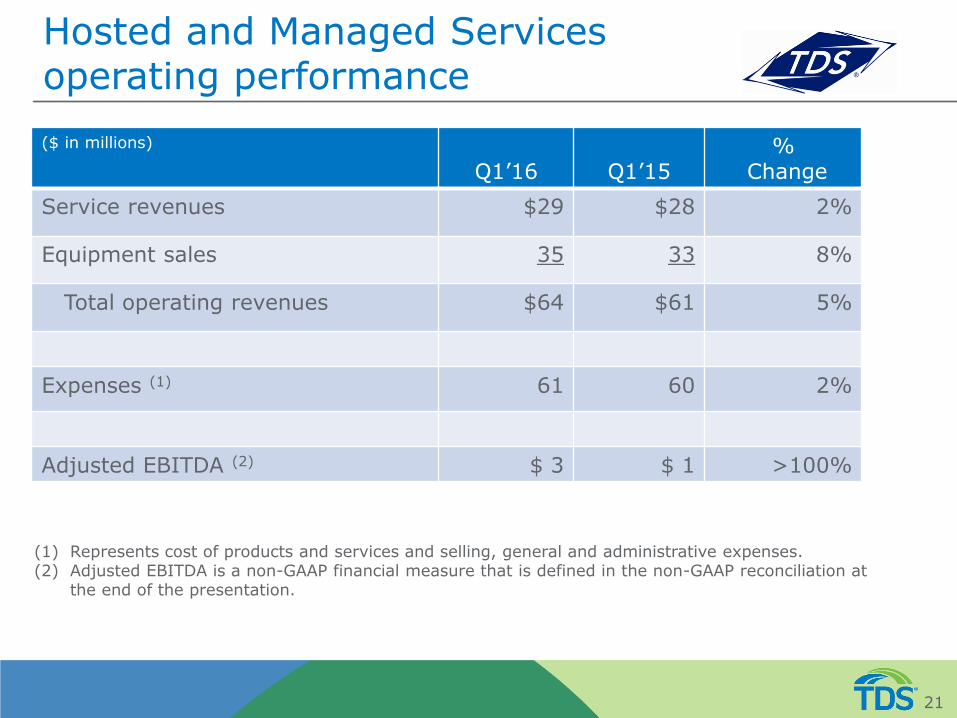
Hosted and Managed Services operating performance
($ in millions)
Q1’16 Q1’15 %
Change
Service revenues $29 $28 2%
Equipment sales 35 33 8%
Total operating revenues $64 $61 5%
Expenses (1) 61 60 2%
Adjusted EBITDA (2) $ 3 $ 1 >100%
Footer - Place document title and date here.
21
(1) Represents cost of products and services and selling, general and administrative expenses. (2) Adjusted EBITDA is a non-GAAP financial measure that is defined in the non-GAAP reconciliation at
the end of the presentation.
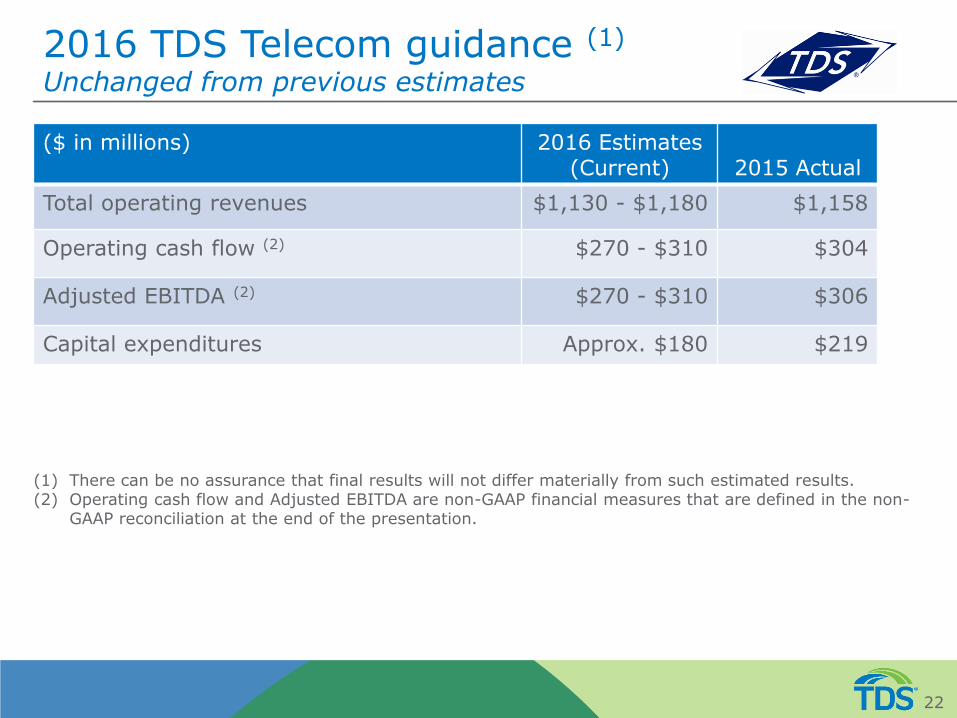
2016 TDS Telecom guidance (1)
Unchanged from previous estimates
($ in millions)
2016 Estimates (Current) 2015 Actual
Total operating revenues $1,130 - $1,180 $1,158
Operating cash flow (2) $270 - $310 $304
Adjusted EBITDA (2) $270 - $310 $306
Capital expenditures Approx. $180 $219
22
(1) There can be no assurance that final results will not differ materially from such estimated results. (2) Operating cash flow and Adjusted EBITDA are non-GAAP financial measures that are defined in the non-
GAAP reconciliation at the end of the presentation.

Appendix
23

24
Operating Cash Flow and Adjusted EBITDA Reconciliation – Q1 2016 and Q1 2015
($ in millions)
U.S. Cellular Wireline Cable HMS
Total TDS
Telecom TDS (2) U.S.
Cellular Wireline Cable HMS
Total TDS
Telecom TDS (2)
Net income (loss) GAAP) 9 N/A N/A N/A 10 10 165 N/A N/A N/A 13 176
Add back:
Income tax expense (benefit) 11 N/A N/A N/A 7 13 107 N/A N/A N/A 9 116
Income (loss) before income taxes (GAAP) 20 22 -- (5) 17 23 272 27 1 (6) 22 292
Add back:
Interest expense 28 (1) -- 1 --
41 20 (1) -- 1 -- 34
Depreciation, amortization and accretion expense 153 42 9 7 58 212 147 42 9 6 57 207
EBITDA 201 63 9 3 75 276 439 68 10 1 79 533
Add back:
(Gain) loss on assets disposals, net 5 -- 1 -- 1 6 4 -- 1 -- 1 5
(Gain) loss on sale of business and other exit costs, net -- -- -- -- -- -- (111) -- -- -- -- (124)
(Gain) loss on license sales and exchanges, net -- -- -- -- -- -- (123) -- -- -- -- (123)
Adjusted EBITDA (3) 206 63 10 3 76 282 209 68 11 1 80 291
Deduct:
Equity in earnings of unconsolidated entities 35 -- -- -- -- 35 34 -- -- -- -- 35
Interest and dividend income 13 1 -- -- 1 14 8 -- -- -- -- 8
Other, net 1 -- (1) -- (1) -- -- 1 -- -- 1 --
Operating cash flow (3) (4) 157 62 11 3 76 233 167 67 11 1 79 248
Three months ended March 31, 2016 Three months ended March 31, 2015
25
Operating Cash Flow and Adjusted EBITDA Reconciliation – 2016 Estimated
2016 Estimated Results (1) Actual Results Year ended December 31, 2015
(Dollars in millions) U.S. Cellular TDS Telecom TDS(2) U.S. Cellular TDS Telecom TDS (2)
Net income (loss) (GAAP) N/A N/A N/A $247 $46 $263
Add back:
Income tax expense (benefit) N/A N/A N/A $156 $35 $172
Income (loss) before income taxes (GAAP) $0-$125 $40-$80 $(20) -$145 $404 $81 $435
Add back:
Interest expense $105 ― $160 $86 $1 $142
Depreciation, amortication and accretion $600 $230 $840 $606 $228 $844
EBITDA $705-$830 $270-$310 $980-$1,145 $1,096 $310 $1,421
Add back:
(Gain) loss on sale of business and other exit costs, net ― ― ― ($114) ($10) ($136)
(Gain) loss on license sales and exchanges (5) ― ― ― ($147) — ($147)
(Gain) loss on assets disposals, net $20 ― $20 $16 $6 $22
Adjusted EBITDA (3) $725-$850 $270-$310 $1,000-$1,165 $852 $306 $1,160
Deduct:
Equity in earnings of unconsolidated entities $140 ― $140 $140 — $140
Interest and dividend income $60 ― $60 $37 $2 $39
Operating cash flow (3)(4) $525-$650 $270-$310 $800-$965 $675 $304 $981
(1) In providing 2016 and 2015 Estimated Results, TDS has not completed the above reconciliation to net income because it does not provide guidance for income taxes. TDS believes that the impact of income taxes cannot be reasonably predicted; therefore, the company is unable to provide such guidance.
(2) The TDS column includes U.S. Cellular, TDS Telecom and also the impacts of consolidating eliminations, corporate operations and non-reportable segments, all of which are not presented above.
(3) Operating cash flow is defined as net income, adjusted for the items set forth in the reconciliation above. Adjusted EBITDA (earnings before interest, taxes, depreciation, amortization and accretion), is defined as net income, adjusted for the items set forth in the reconciliation above. Operating income (loss) (excluding gains and losses), is defined as net income, adjusted for the items set forth in the reconciliation above. Operating cash flow, Adjusted EBITDA and Operating income (loss) (excluding gains and losses) exclude these items in order to show operating results on a more comparable basis from period to period. From time to time, TDS may exclude other items from Operating cash flow and/or Adjusted EBITDA and/or Operating income (loss) (excluding gains and losses) if such items help reflect operating results on a more comparable basis. TDS does not intend to imply that any such items that are excluded are non-recurring, infrequent or unusual; such items may occur in the future. Operating cash flow, Adjusted EBITDA and Operating income (loss) (excluding gains and losses) are not measures of financial performance under Generally Accepted Accounting Principles in the United States (“GAAP”) and should not be considered as alternatives to net income as indicators of the company’s operating performance or as alternatives to cash flows from operating activities, determined in accordance with GAAP, as indicators of cash flows or as measures of liquidity. TDS believes Operating cash flow, Adjusted EBITDA and Operating income (loss) (excluding gains and losses) are useful measures of TDS’ operating results before significant recurring non-cash charges, gains and losses, and other items as indicated above.
(4) A reconciliation of Operating cash flow (Non-GAAP) and Operating income (excluding gains and losses) (Non-GAAP) to operating income (GAAP) for March 31, 2016 actual results can be found on the company's website at investors.tdsinc.com.
(5) In February 2016, U.S. Cellular entered into multiple agreements to exchange licenses. Agreements are subject to regulatory approval and other customary closing conditions, and are expected to close in 2016. Upon closing of the transactions, U.S. Cellular expects to record a gain. A reasonable estimate of the gains is unavailable at the time of this filing.
26