TDS, Specific Conductivity, and Gasses in Water Stream Ecology January 29, 2009.
59
TDS, Specific Conductivity, and Gasses in Water Stream Ecology January 29, 2009
-
date post
19-Dec-2015 -
Category
Documents
-
view
215 -
download
1
Transcript of TDS, Specific Conductivity, and Gasses in Water Stream Ecology January 29, 2009.

TDS, Specific Conductivity, and Gasses in Water
TDS, Specific Conductivity, and Gasses in Water
Stream EcologyJanuary 29, 2009

Primarily, Total Dissolved Solids (TDS) is made up of the following ions:– Ca2+, Mg2+, Na+, K+, Cl-,
SO42-, HCO3
-, SiO2
TDS is not synonymous with specific conductivity.

Conductivity is a measure of the ability of an aqueous solution to carry an electric current.
This ability depends on the concentration of ions and temperature of the water (the warmer the water, the higher the conductivity).
Organic compounds like oil, phenol, alcohol, and sugar do not conduct electrical current well.

Conductance, G, is defined as the reciprocal of resistance, R:
G = 1/R Where the unit of R is ohm and the unit of G is ohm-1 or mho.
G can also be reported as a siemen (1 siemen = 1 mho)

Conductivity is usually reported in microsiemens (μS/cm) or micromhos (μmho/cm) which is 1/1,000,000 of a siemen or mho.
Conductance is measured using two electrodes 1 cm apart.

Since the charge on ions in solution facilitates the conductance of electrical current, the conductivity of a solution is proportional to its ion concentration.

TDS and ConductivityTDS and Conductivity The method most commonly used to
estimate TDS levels relies on its’ relationship with conductivity.
In most waters, the correlation between TDS and conductivity is; – TDS/conductivity = 0.55 – 0.7
A TDS meter does not directly measure dissolved solids but rather, it directly measures conductivity and has a built-in calibration curve that estimates TDS levels.

Weigh an empty beaker (tare weight). Filter a known volume of sample water
into the beaker (using a 0.2 micron filter).
Allow the water in the beaker to evaporate.
Re-weigh the beaker. The increase in weight is proportionate
to the amount of total dissolved solids in the sample.
Measuring TDS

Fresh waters - sufficiently dilute to be potable (TDS < 1,000 mg L-1).
Brackish waters - too saline to be potable, but significantly less saline than seawater (TDS = 1,000 - 20,000 mg L-1).
Saline waters - similar to or more saline than seawater (TDS ~ 35,000 mg L-1).
Brines - significantly more saline than seawater.

Graphical Displays of Water CompositionGraphical Displays of Water Composition
Usually reported in milliequivalents (one-thousandths of an equivalent).
An equivalent is the amount of a substance (mg or mM) that can enter into a reaction, or replace, one mole of H+ .

Stiff DiagramsStiff Diagrams Ion concentrations in
meq L-1 are plotted on the horizontal axis.
Cations are plotted to the left, anions to the right, of a vertical axis.
The data are plotted in four rows and the points are connected to form a polygon.
Pine Creek, CDA Valley, IdahoMine Waters
Cations meq/l Anions
15 10 5 5 10 15
Cl
HCO3+CO3
SO4Mg
Ca
Na+K
AD002
Cl
HCO3+CO3
SO4Mg
Ca
Na+K
AD004
Cl
HCO3+CO3
SO4Mg
Ca
Na+K
AD005
Cl
HCO3+CO3
SO4Mg
Ca
Na+K
AD007
Cl
HCO3+CO3
SO4Mg
Ca
Na+K
S97-3
Cl
HCO3+CO3
SO4Mg
Ca
Na+K
SP002
Cl
HCO3+CO3
SO4Mg
Ca
Na+K
SPNEW

Piper DiagramsPiper Diagrams
Cations are plotted on the Ca-Mg-(Na + K) triangle as percentages.
Anions are plotted on the HCO3
--SO42--
Cl- triangle as percentages.


Pine Creek, CDA Valley, Idaho
Mine Waters
C A T I O N S A N I O N S%meq/l
Na+K HCO +CO3 3 Cl
Mg SO4
CaCalcium (Ca) Chloride (Cl)
Sul
fate
(SO
4)+C
hlor
ide(
Cl)
Calcium
(Ca)+M
agnesium(M
g)
Car
bona
te(C
O3)
+Bic
arbo
nate
(HC
O3)S
odium(N
a)+Potassium
(K)
Sulfate(S
O4)
Mag
nesi
um(M
g)
80 60 40 20 20 40 60 80
80
60
40
20
20
40
60
80
20
40
60
80
80
60
40
20
20
40
60
80
20
40
60
80
80
60
40
20
80
60
40
20
AD002AD004AD005AD007S97-3SP002SPNEW

Displaying general water chemistry results graphically is a quick method of categorizing waters based on major ionic form.
They are not very detailed and can not easily be accommodated for waters where other cations/anions may significantly contribute to solute load.

Alkalinity and Bicarbonate BufferingAlkalinity and Bicarbonate Buffering
Alkalinity is a measure of the buffering capacity of a solution to resist a change in pH.
Because pH is a measure of the number of hydrogen ions in a solution, alkalinity represents the ability of a solution to absorb or take up hydrogen ions.

Alkalinity results from the dissolution of calcium carbonate (CaCO3) from limestone bedrock which is eroded during the natural processes of weathering.
The carbon dioxide (CO2) released from the calcium carbonate into the streamwater undergoes several equilibrium reactions.

If hydrogen ions are added to the solution, they combine with available bicarbonate or carbonate ions causing the reactions to shift to the left and eventually liberate carbon dioxide and water molecules.
Addition of carbonate (or bicarbonate) to the solution causes the hydrogen ions to be occupied and shifts the reaction back to the right.

Total alkalinity in streams is reported as mg/L AS CaCO3.
Alkalinity is measured by titrating the amount of sulfuric acid needed to bring the water sample to a pH of 4.2.

The dominant form of inorganic carbon in water is pH dependent

Diel Fluctuations in pHDiel Fluctuations in pH
Photosynthesis of aquatic plants (primarily benthic algae in streams) causes pH levels to rise during the day due to incorporation of CO2 into cells.
6CO2 + 6H2O + Light Energy = C6H12O6 + 6O2
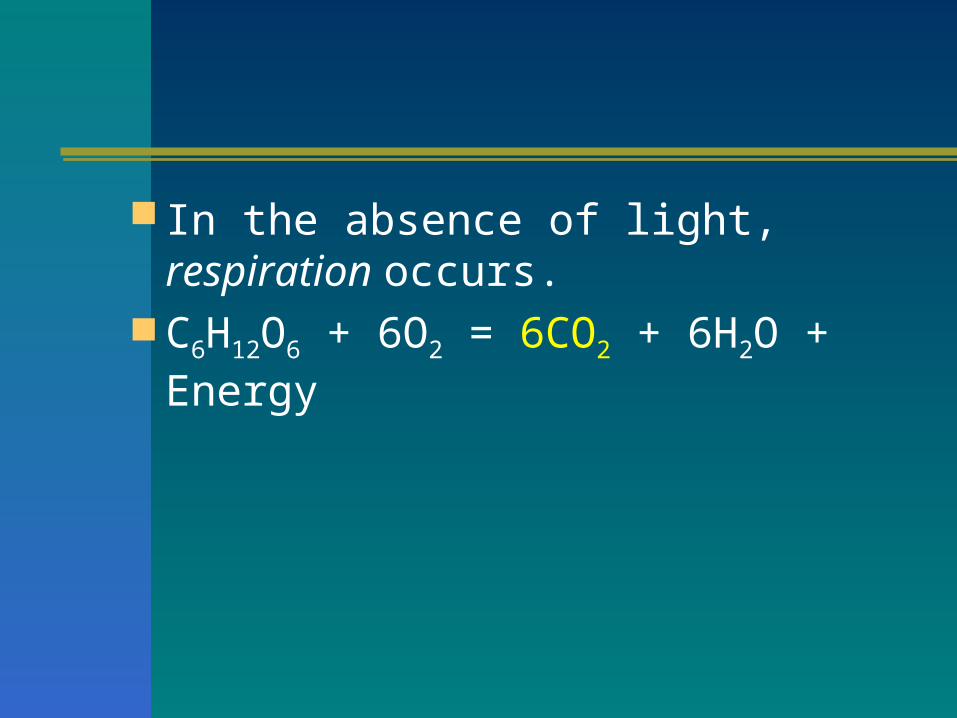
In the absence of light, respiration occurs.
C6H12O6 + 6O2 = 6CO2 + 6H2O + Energy


7.00
7.25
7.50
7.75
8.00
8.25
8.50
pH
1230
0013
0000
1330
0014
0000
1430
0015
0000
1530
0016
0000
1630
0017
0000
1730
0018
0000
1830
0019
0000
1930
0020
0000
2030
0021
0000
2130
0022
0000
2230
0023
0000
2330
000
3000
1000
013
000
2000
023
000
3000
033
000
4000
043
000
5000
053
000
6000
063
000
7000
073
000
8000
083
000
9000
093
000
1000
0010
3000
1100
0011
3000
1200
00
Time
Chart

Dissolved Oxygen and Gasses in Water
Dissolved Oxygen and Gasses in Water

Of all physico-chemical properties of water, none are more important for biota than dissolved oxygen dynamics.
DO influences nearly all chemical and biological processes within water bodies.

Solubility/Temperature RulesSolubility/Temperature Rules
If the dissolution process absorbs energy, then solubility will be increased with increasing temperature.
If the dissolution process releases energy, then solubility will decreasewith increasing temperature.

Dissolving gasses in water releases heat.
Solubility of oxygen (or any gas) is decreased at higher temperatures.
How does this effect stream organisms in Arizona differently than it might those in, for example, Minnesota?

The DO concentration at any given time reflects a balance between various sources and sinks

At a temperature of 0o C and normal atmospheric pressure at sea level (760 mmHg) and in “pure” water, the solubility of oxygen in water is 14.6 mg/L.

Henry’s LawHenry’s Law
The concentration of dissolved gas in solution depends on the partial pressure.
The partial pressure determines the number of “collisions” of gas moleculeswith the surface of the water.
An increase in partial pressure results in more collisions and therefore, more gasgoes into solution (oxygen).


ρ = Kc c ρ = partial pressure of the gas in
mmHg c concentration of gas in mmoles,
mL, or mg/L at a constant temp. Kc the solubility factor, different
for each gas

There is a direct, linear relationship between the partial pressure and the concentration of gas in solution.
For example, if the partial pressure is increased by 1/4, the concentration of gas in solution is increased by 1/4 and so on.
This is because the number of collisions of gas molecules on the surface of the water is directly proportional to increases or decreases in partial pressure.

What affects atmospheric pressure and therefore, the solubility of oxygen in water?


In most situations, knowing % saturation of dissolved oxygen is more important, biologically, than knowing mg/L or ppm.
% Saturation = (DO mg per L/ Saturation Level) x 100


Factors Affecting Dissolved OxygenFactors Affecting Dissolved Oxygen
Sources– Turbulence, atmospheric,
photosynthesis
Sinks– Suspended sediment, increased
heat, respiration (algae and bacteria), excess nutrients, organic waste.

Stream Impairment due to Excessive Organic LoadingStream Impairment due to Excessive Organic Loading
Domestic sewage contains about 300 to 400 mg/L of organic compounds, 60% of which is readily degradable by bacteria commonly found in nature.
Readily degradable implies that most of the material will be decomposed within about a week in a stream.

As population centers grow, effluent dependence and dominance of streams will increase

Roger Road WWTP
Tucson
Santa Cruz River


Linear profile at the Santa Cruz River below RRWWTP, 06/2003
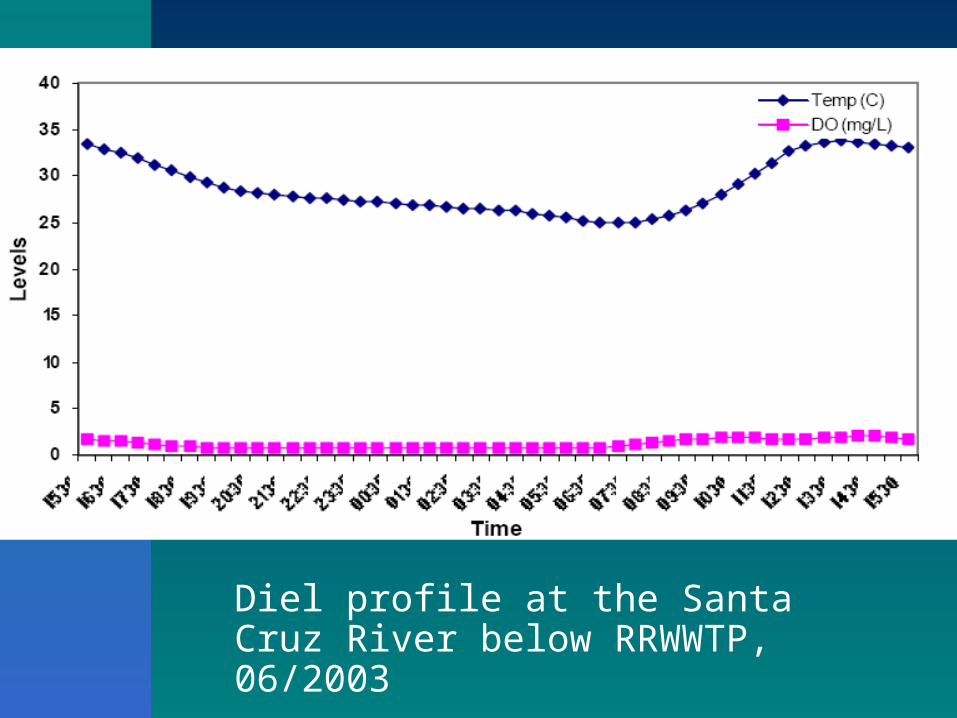
Diel profile at the Santa Cruz River below RRWWTP, 06/2003

Linear Profile from Jacks Canyon, 06/2003

Jacks Canyon diel profile, 06/2003


Measuring Oxygen DemandMeasuring Oxygen Demand
The biochemical oxygen demand (BOD) is the most commonly used parameter in the analysis of oxygen resources in water.
The BOD is the amount of oxygen consumed over time, usually 5 to 20 days, as the organic matter is oxidized both microbially and chemically.


Chemical Oxygen DemandChemical Oxygen Demand
COD is used as a measure of the oxygen equivalent of the organic matter content susceptible to oxidation by a strong chemical oxidant.

Although COD is comparable to BOD, it actually measures chemically oxidizable matter.
The COD test is not a direct substitute for the BOD test; however, a ratio usually can be correlated between the two tests.
This requires COD versus BOD testing over a specified period of time.

Measuring Dissolved OxygenMeasuring Dissolved Oxygen

Dissolved Oxygen MetersDissolved Oxygen Meters

The material of the membrane is specially selected to permit oxygen to pass through.
Oxygen is consumed by the cathode which will create a partial pressure across the membrane causing oxygen to diffuse into the electrolyte solution.
Thus, a DO meter actually measures the pressure of oxygen in water.