TD Securities Mining Conferences1.q4cdn.com/766430901/files/doc_presentations/2015/TD...TD...
28
TSX: IMG NYSE: IAG TD Securities Mining Conference January 27-28, 2015 Carol Banducci EVP & CFO .
Transcript of TD Securities Mining Conferences1.q4cdn.com/766430901/files/doc_presentations/2015/TD...TD...
TSX: IMG NYSE: IAG
TD Securities Mining Conference January 27-28, 2015
Carol Banducci EVP & CFO .
Cautionary Statement on Forward-Looking Information
All information included in this presentation, including any information as to the Company’s future financial or operating performance, and other statements that express management’s
expectations or estimates of future performance, other than statements of historical fact, constitute forward looking information or forward-looking statements and are based on
expectations, estimates and projections as of the date of this presentation. Forward-looking statements contained in this presentation include, without limitation, statements with respect to:
the Company’s guidance for production, cash costs, all-in sustaining costs, depreciation expense, effective tax rate, and operating margin, capital expenditures, operations outlook, cost
management initiatives, development and expansion projects, exploration, the future price of gold, the estimation of mineral reserves and mineral resources, the realization of mineral
reserve and mineral resource estimates, the timing and amount of estimated future production, costs of production, permitting timelines, currency fluctuations, requirements for additional
capital, government regulation of mining operations, environmental risks, unanticipated reclamation expenses, title disputes or claims and limitations on insurance coverage. Forward-
looking statements are provided for the purpose of providing information about management’s current expectations and plans relating to the future. Forward-looking statements are
generally identifiable by, but are not limited to the, use of the words “may”, “will”, “should”, “continue”, “expect”, “antic ipate”, “estimate”, “believe”, “intend”, “plan”, “suggest”, “guidance”,
“outlook”, “potential”, “prospects”, “seek”, “targets”, “strategy” or “project” or the negative of these words or other variations on these words or comparable terminology. Forward-looking
statements are necessarily based upon a number of estimates and assumptions that, while considered reasonable by management, are inherently subject to significant business,
economic and competitive uncertainties and contingencies. The Company cautions the reader that reliance on such forward-looking statements involve risks, uncertainties and other
factors that may cause the actual financial results, performance or achievements of IAMGOLD to be materially different from the Company’s estimated future results, performance or
achievements expressed or implied by those forward-looking statements, and the forward-looking statements are not guarantees of future performance. These risks, uncertainties and
other factors include, but are not limited to, changes in the global prices for gold, copper, silver or certain other commodities (such as diesel and electricity); changes in U.S. dollar and
other currency exchange rates, interest rates or gold lease rates; risks arising from holding derivative instruments; the level of liquidity and capital resources; access to capital markets,
and financing; mining tax regimes; ability to successfully integrate acquired assets; legislative, political or economic developments in the jurisdictions in which the Company carries on
business; operating or technical difficulties in connection with mining or development activities; laws and regulations governing the protection of the environment; employee relations;
availability and increasing costs associated with mining inputs and labour; the speculative nature of exploration and development, including the risks of diminishing quantities or grades of
reserves; adverse changes in the Company’s credit rating; contests over title to properties, particularly title to undeveloped properties; and the risks involved in the exploration,
development and mining business. With respect to development projects, IAMGOLD’s ability to sustain or increase its present levels of gold production is dependent in part on the success
of its projects. Risks and unknowns inherent in all projects include the inaccuracy of estimated reserves and resources, metallurgical recoveries, capital and operating costs of such
projects, and the future prices for the relevant minerals. Development projects have no operating history upon which to base estimates of future cash flows. The capital expenditures and
time required to develop new mines or other projects are considerable, and changes in costs or construction schedules can affect project economics. Actual costs and economic returns
may differ materially from IAMGOLD’s estimates or IAMGOLD could fail to obtain the governmental approvals necessary for the operation of a project; in either case, the project may not
proceed, either on its original timing or at all.
For a more comprehensive discussion of the risks faced by the Company, and which may cause the actual financial results, performance or achievements of IAMGOLD to be materially
different from the company’s estimated future results, performance or achievements expressed or implied by forward-looking information or forward-looking statements, please refer to the
Company’s latest Annual Information Form, filed with Canadian securities regulatory authorities at www.sedar.com, and filed under Form 40-F with the United States Securities Exchange
Commission at www.sec.gov/edgar.html. The risks described in the Annual Information Form (filed and viewable on www.sedar.com and www.sec.gov/edgar.html, and available upon
request from the Company) are hereby incorporated by reference into this presentation.
The Company disclaims any intention or obligation to update or revise any forward-looking statements whether as a result of new information, future events or otherwise except as
required by applicable law.
2
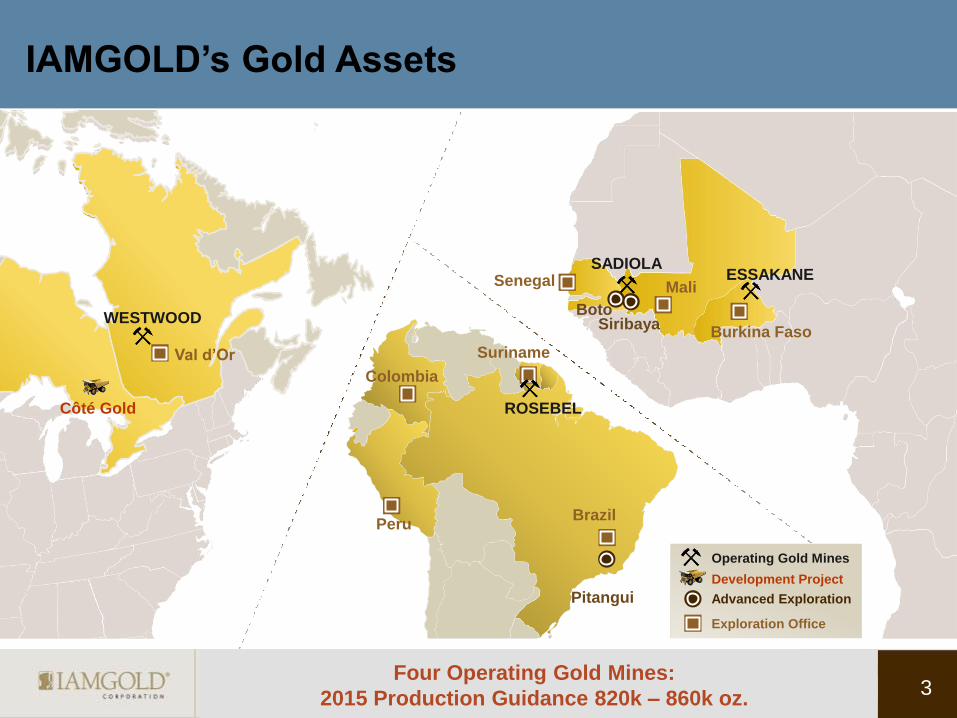
IAMGOLD’s Gold Assets
Four Operating Gold Mines:
2015 Production Guidance 820k – 860k oz.
SADIOLA
Boto Siribaya
Operating Gold Mines
Development Project
Advanced Exploration
Exploration Office
ESSAKANE Senegal
Burkina Faso
Mali
WESTWOOD
Val d’Or
Côté Gold ROSEBEL
Brazil
Suriname
Colombia
Peru
Pitangui
3
Staying Focused on Strategic Priorities
Cost Reduction
Cash Preservation
Capital Discipline
4 Focused on Economic Returns
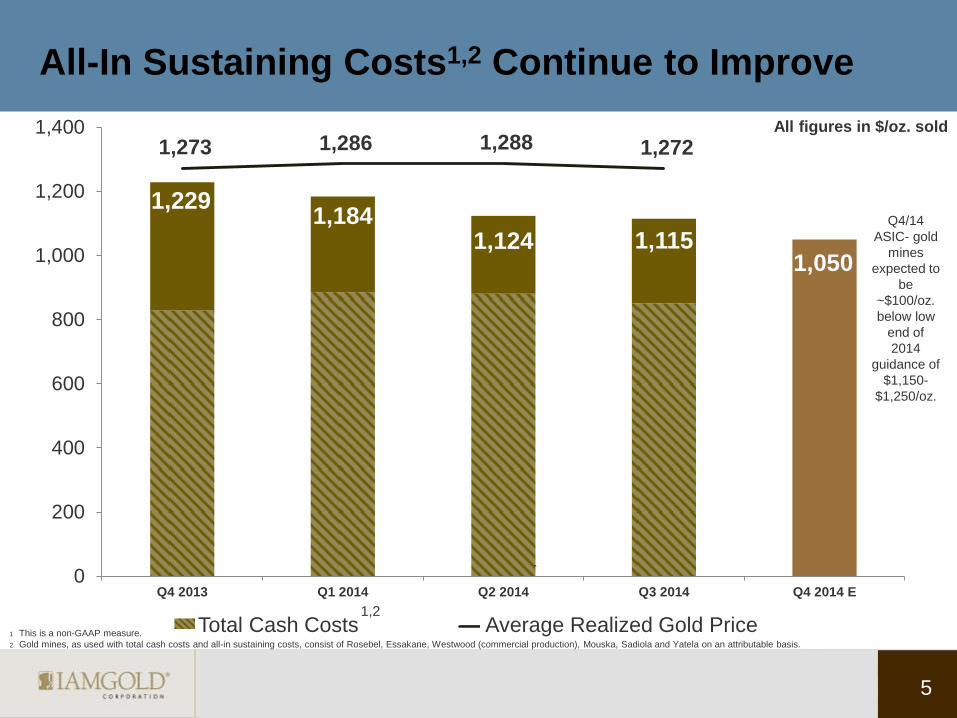
All-In Sustaining Costs1,2 Continue to Improve
1,229 1,184
1,124 1,115 1,050
1,273 1,286 1,288 1,272
0
200
400
600
800
1,000
1,200
1,400
Q4 2013 Q1 2014 Q2 2014 Q3 2014 Q4 2014 E
`
All figures in $/oz. sold
Total Cash Costs Average Realized Gold Price 1,2
5
Q4/14
ASIC- gold
mines
expected to
be
~$100/oz.
below low
end of
2014
guidance of
$1,150-
$1,250/oz.
1 This is a non-GAAP measure.
2 Gold mines, as used with total cash costs and all-in sustaining costs, consist of Rosebel, Essakane, Westwood (commercial production), Mouska, Sadiola and Yatela on an attributable basis.
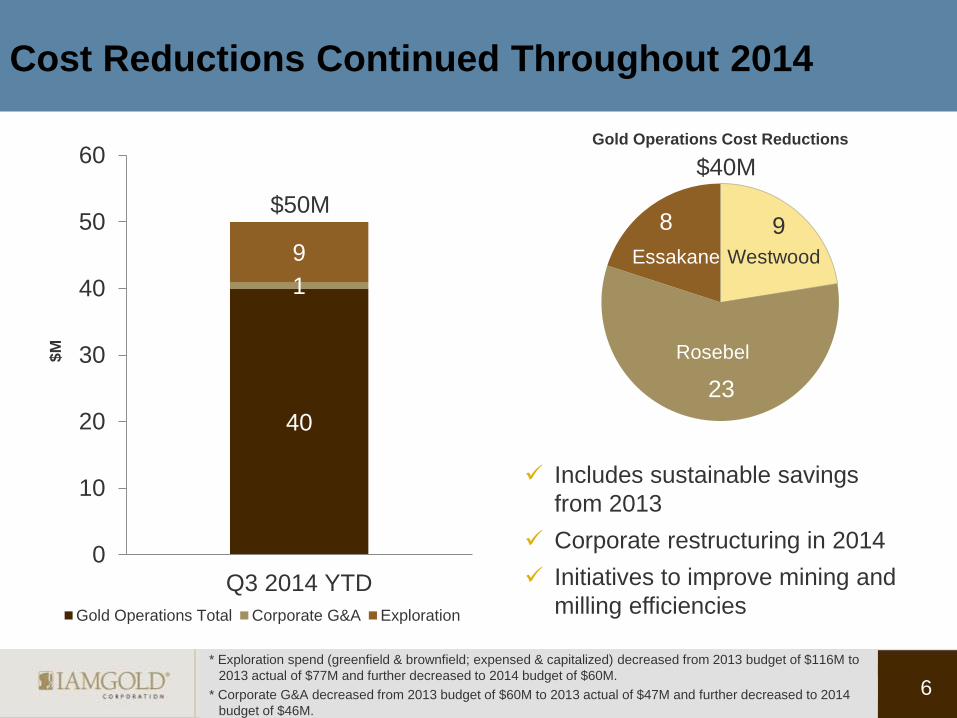
Cost Reductions Continued Throughout 2014
40
1
9
0
10
20
30
40
50
60
Q3 2014 YTD
$M
Gold Operations Total Corporate G&A Exploration
$50M
* Exploration spend (greenfield & brownfield; expensed & capitalized) decreased from 2013 budget of $116M to
2013 actual of $77M and further decreased to 2014 budget of $60M.
* Corporate G&A decreased from 2013 budget of $60M to 2013 actual of $47M and further decreased to 2014
budget of $46M.
$62M
6
Includes sustainable savings
from 2013
Corporate restructuring in 2014
Initiatives to improve mining and
milling efficiencies
9
23
8
Gold Operations Cost Reductions
Rosebel
Westwood Essakane
$40M
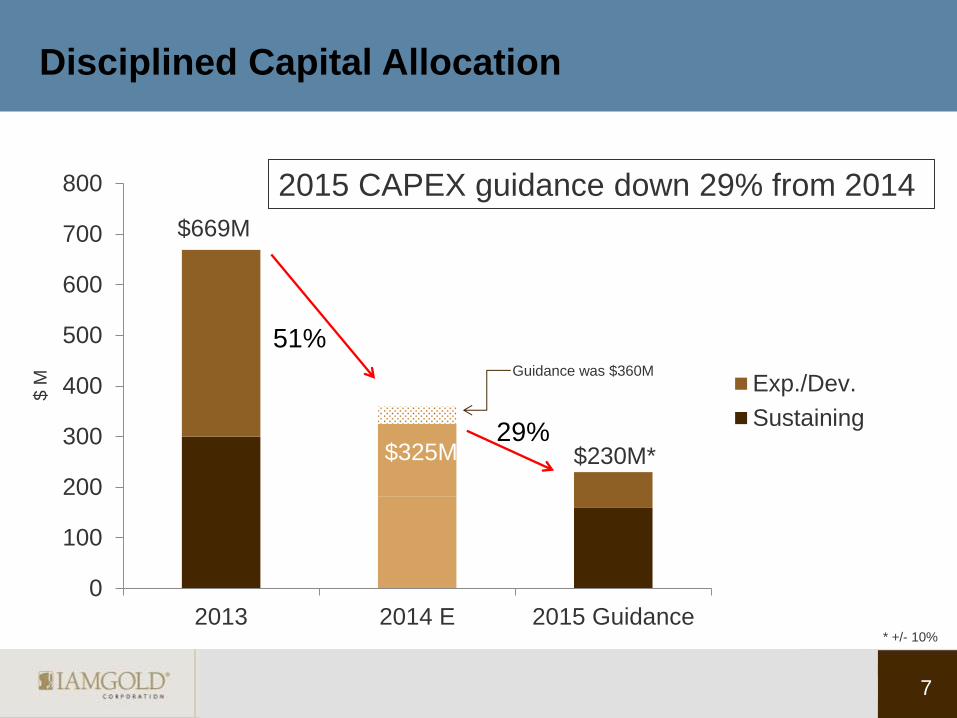
Disciplined Capital Allocation
$230M*
0
100
200
300
400
500
600
700
800
2013 2014 E 2015 Guidance
Exp./Dev.
Sustaining
$325M
51%
29%
$ M
$669M
2015 CAPEX guidance down 29% from 2014
Guidance was $360M
7
* +/- 10%
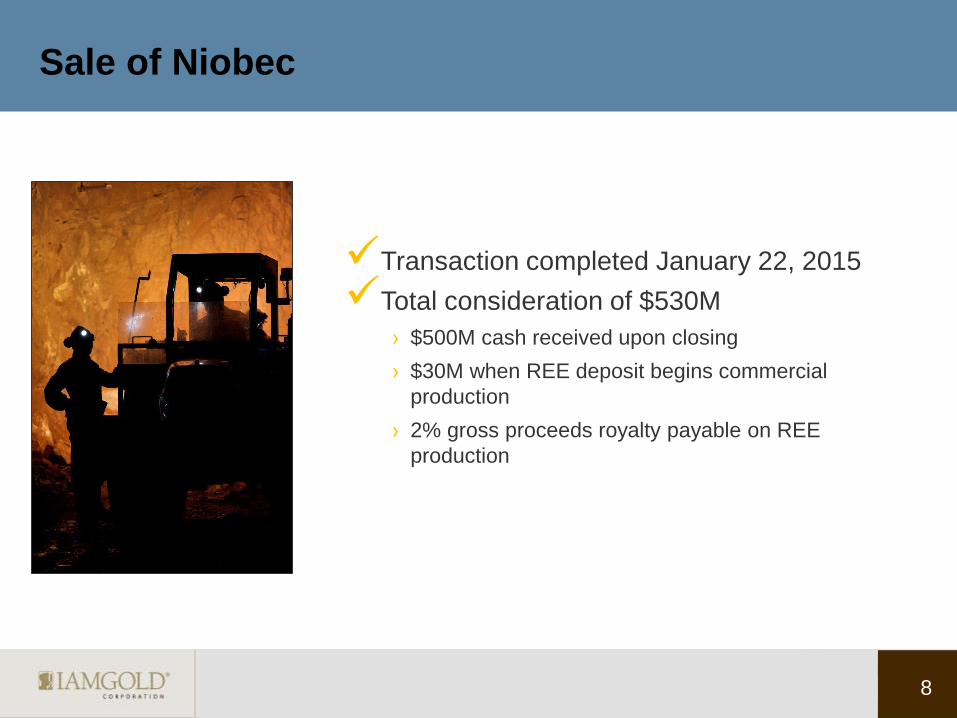
Transaction completed January 22, 2015
Total consideration of $530M
› $500M cash received upon closing
› $30M when REE deposit begins commercial
production
› 2% gross proceeds royalty payable on REE
production
Sale of Niobec
8
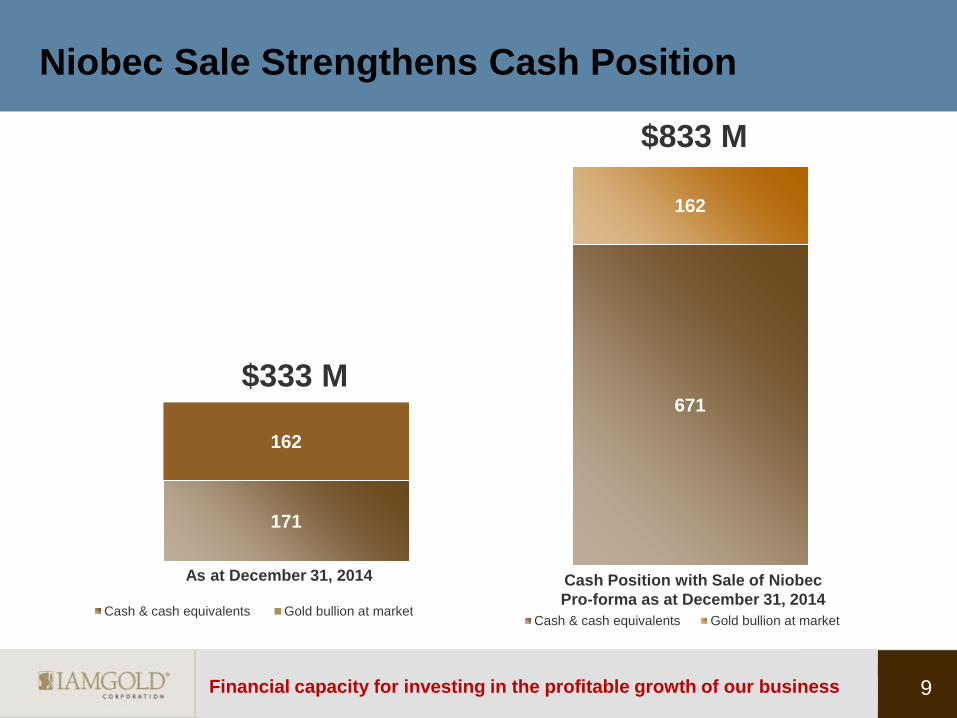
171
162
Cash & cash equivalents Gold bullion at market
671
162
Cash & cash equivalents Gold bullion at market
$333 M
$833 M
Niobec Sale Strengthens Cash Position
Cash Position with Sale of Niobec
Pro-forma as at December 31, 2014
As at December 31, 2014
9 Financial capacity for investing in the profitable growth of our business
Priorities for Use of Proceeds from Sale of Niobec
Optimize returns from existing assets
Strategic acquisitions with near-term capability
to generate positive cash flow
10
Acquisition Criteria
11
Predominantly gold
Producing or near-producing mine
Potential to produce 100k oz./year
Higher grades
Lower costs
Good mining jurisdiction

Operations Overview
12
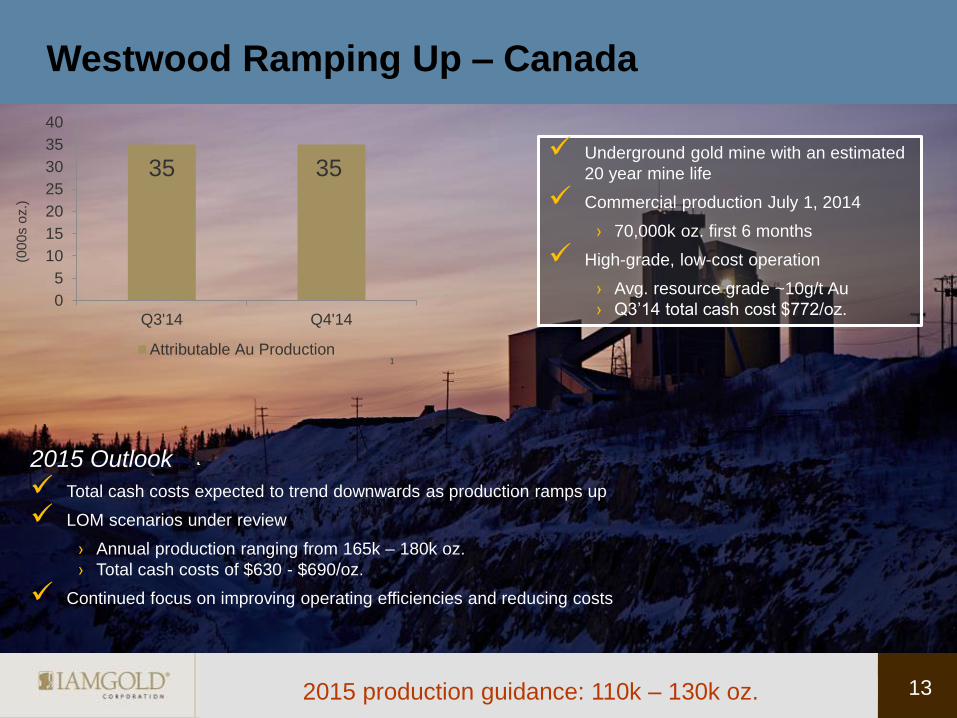
2015 Outlook
Total cash costs expected to trend downwards as production ramps up
LOM scenarios under review
› Annual production ranging from 165k – 180k oz.
› Total cash costs of $630 - $690/oz.
Continued focus on improving operating efficiencies and reducing costs
Westwood Ramping Up – Canada
13 2015 production guidance: 110k – 130k oz.
Underground gold mine with an estimated
20 year mine life
Commercial production July 1, 2014
› 70,000k oz. first 6 months
High-grade, low-cost operation
› Avg. resource grade ~10g/t Au
› Q3’14 total cash cost $772/oz.
1
(00
0s o
z.)
35 35
0
5
10
15
20
25
30
35
40
Q3'14 Q4'14
Attributable Au Production
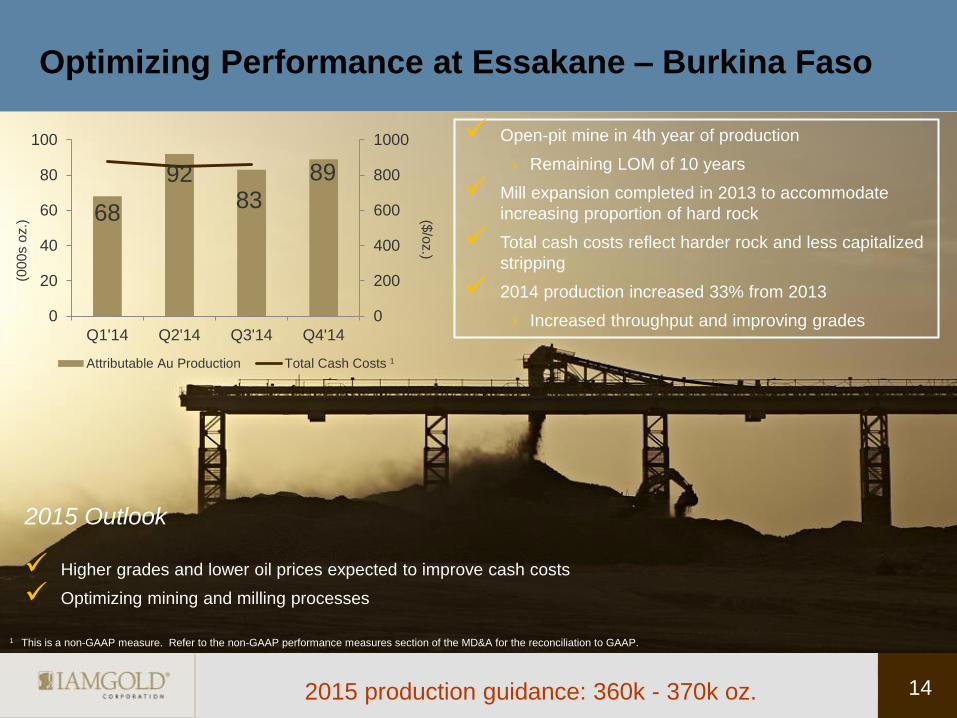
Optimizing Performance at Essakane – Burkina Faso
2015 Outlook
Higher grades and lower oil prices expected to improve cash costs
Optimizing mining and milling processes
($/o
z.)
(00
0s o
z.)
1 This is a non-GAAP measure. Refer to the non-GAAP performance measures section of the MD&A for the reconciliation to GAAP.
2015 production guidance: 360k - 370k oz. 14
68
92 83
89
0
200
400
600
800
1000
0
20
40
60
80
100
Q1'14 Q2'14 Q3'14 Q4'14
Attributable Au Production Total Cash Costs
Open-pit mine in 4th year of production
› Remaining LOM of 10 years
Mill expansion completed in 2013 to accommodate
increasing proportion of hard rock
Total cash costs reflect harder rock and less capitalized
stripping
2014 production increased 33% from 2013
› Increased throughput and improving grades
1
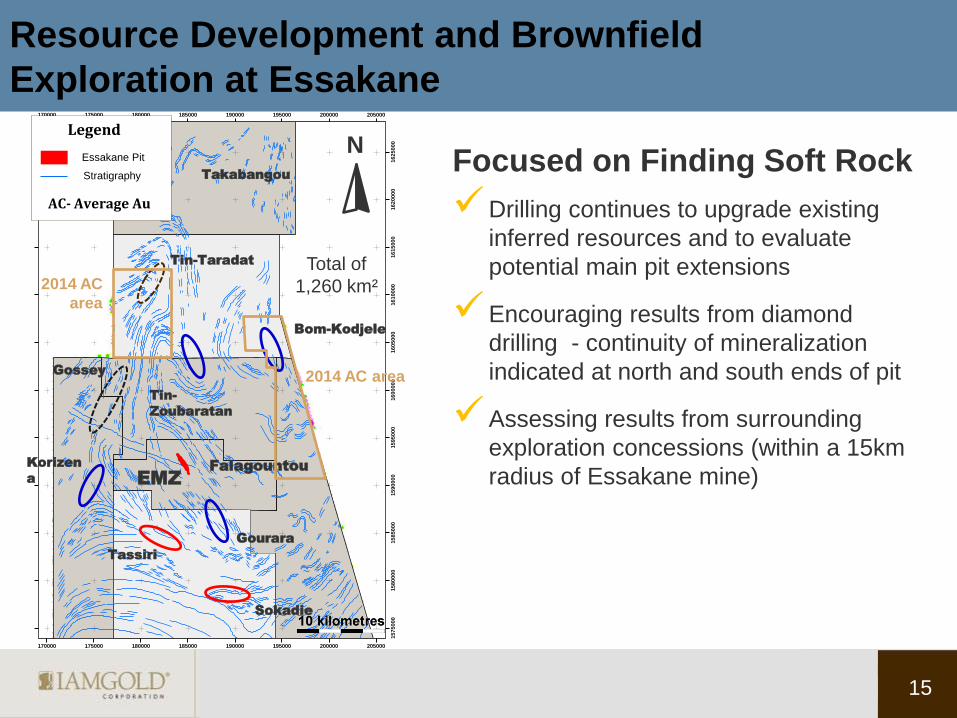
Drilling continues to upgrade existing
inferred resources and to evaluate
potential main pit extensions
Encouraging results from diamond
drilling - continuity of mineralization
indicated at north and south ends of pit
Assessing results from surrounding
exploration concessions (within a 15km
radius of Essakane mine)
Resource Development and Brownfield
Exploration at Essakane 170000
170000
175000
175000
180000
180000
185000
185000
190000
190000
195000
195000
200000
200000
205000
205000
15
75
00
0
15
80
00
0
15
80
00
0
15
85
00
0
15
85
00
0
15
90
00
0
15
90
00
0
15
95
00
0
15
95
00
0
16
00
00
0
16
00
00
0
16
05
00
0
16
05
00
0
16
10
00
0
16
10
00
0
16
15
00
0
16
15
00
0
16
20
00
0
16
20
00
0
16
25
00
0
16
25
00
0
Legend
Stratigraphy
Essakane Pit
AC- Average Au
Tassiri
Tin-
Zoubaratan
Bom-Kodjele
EMZ
Korizen
a
Sokadie
Tin-Taradat
Takabangou
Gossey
Falagountou
Gourara
N
Total of
1,260 km²
2014 AC area
2014 AC
area
15
Focused on Finding Soft Rock
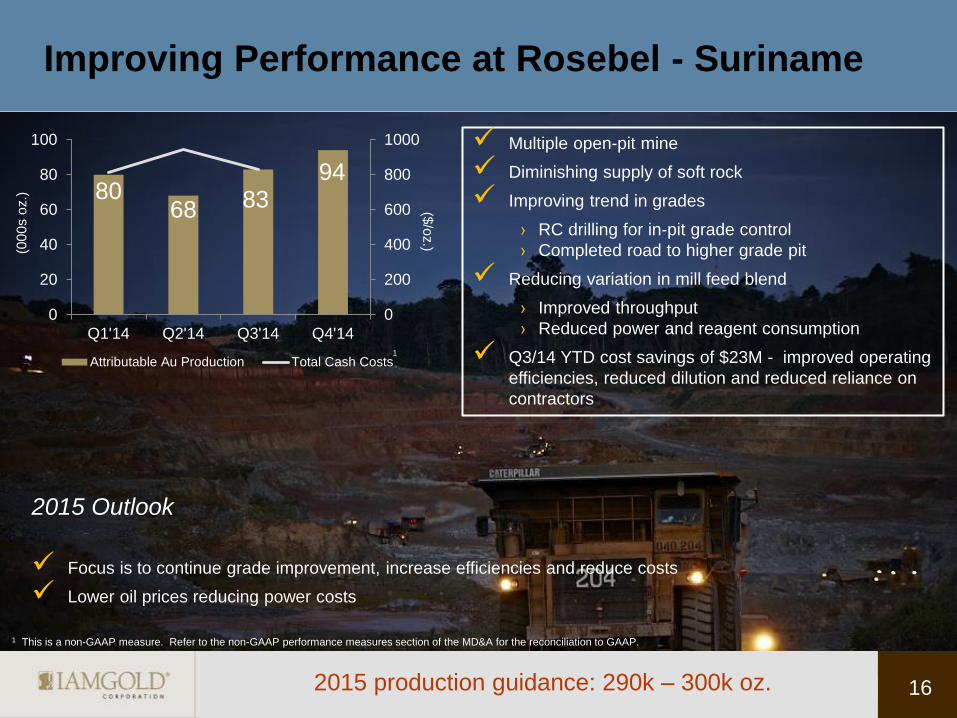
Improving Performance at Rosebel - Suriname
1 This is a non-GAAP measure. Refer to the non-GAAP performance measures section of the MD&A for the reconciliation to GAAP.
($/o
z.) (0
00
s o
z.)
2015 production guidance: 290k – 300k oz.
Multiple open-pit mine
Diminishing supply of soft rock
Improving trend in grades
› RC drilling for in-pit grade control
› Completed road to higher grade pit
Reducing variation in mill feed blend
› Improved throughput
› Reduced power and reagent consumption
Q3/14 YTD cost savings of $23M - improved operating
efficiencies, reduced dilution and reduced reliance on
contractors
16
2015 Outlook
Focus is to continue grade improvement, increase efficiencies and reduce costs
Lower oil prices reducing power costs
80 68 83
94
0
200
400
600
800
1000
0
20
40
60
80
100
Q1'14 Q2'14 Q3'14 Q4'14
Attributable Au Production Total Cash Costs1
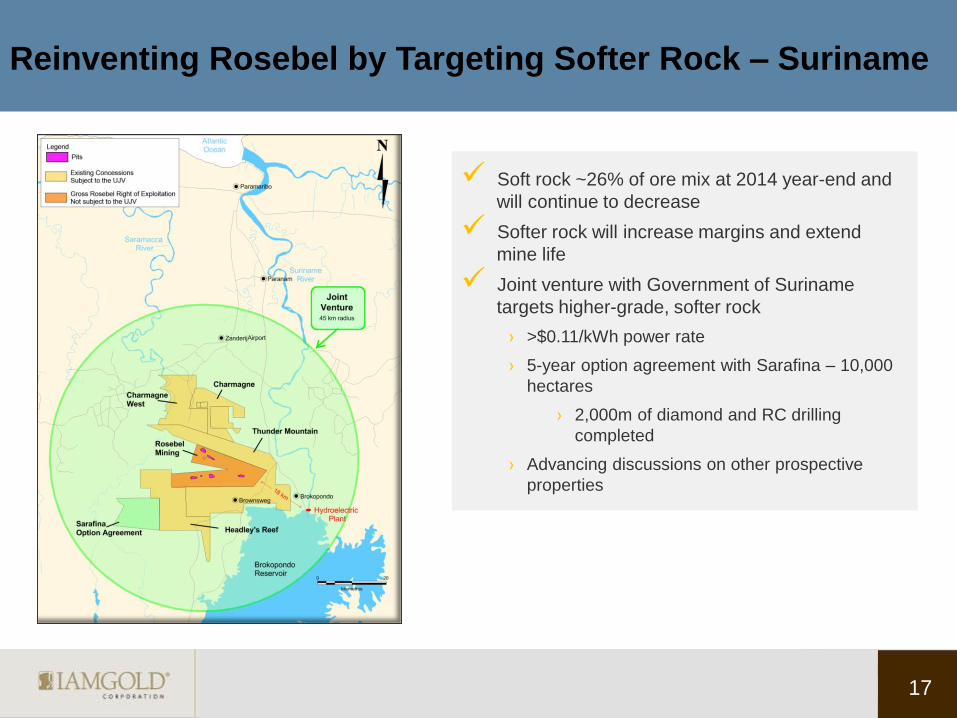
Reinventing Rosebel by Targeting Softer Rock – Suriname
17
Soft rock ~26% of ore mix at 2014 year-end and
will continue to decrease
Softer rock will increase margins and extend
mine life
Joint venture with Government of Suriname
targets higher-grade, softer rock
› >$0.11/kWh power rate
› 5-year option agreement with Sarafina – 10,000
hectares
› 2,000m of diamond and RC drilling
completed
› Advancing discussions on other prospective
properties
17
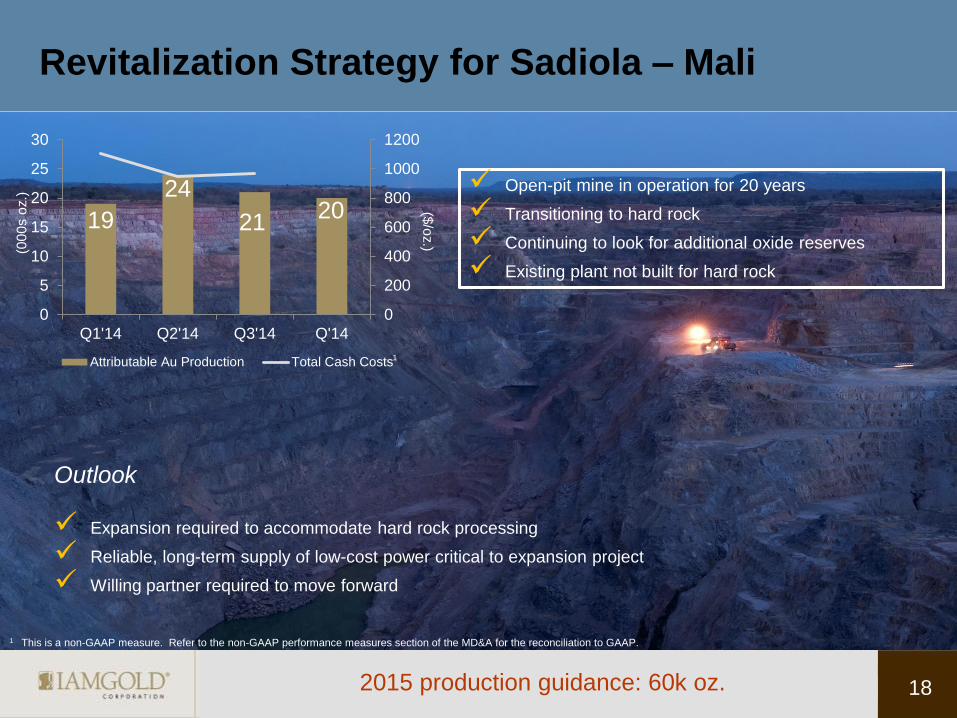
Revitalization Strategy for Sadiola – Mali
18
Open-pit mine in operation for 20 years
Transitioning to hard rock
Continuing to look for additional oxide reserves
Existing plant not built for hard rock
($/o
z.) (0
00
s o
z.)
19
24
21 20
0
200
400
600
800
1000
1200
0
5
10
15
20
25
30
Q1'14 Q2'14 Q3'14 Q'14
Attributable Au Production Total Cash Costs
Outlook
Expansion required to accommodate hard rock processing
Reliable, long-term supply of low-cost power critical to expansion project
Willing partner required to move forward
1
1 This is a non-GAAP measure. Refer to the non-GAAP performance measures section of the MD&A for the reconciliation to GAAP.
2015 production guidance: 60k oz.
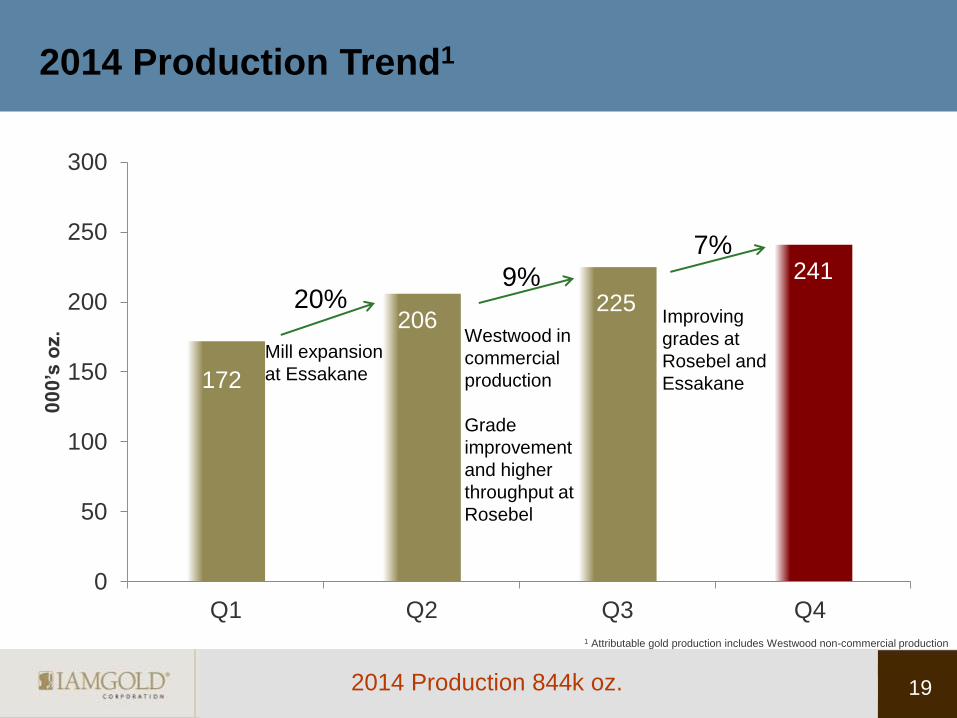
2014 Production Trend1
172
206 225
241
0
50
100
150
200
250
300
Q1 Q2 Q3 Q4
00
0’s
oz.
20%
Mill expansion
at Essakane
Westwood in
commercial
production
Grade
improvement
and higher
throughput at
Rosebel
9%
7%
Improving
grades at
Rosebel and
Essakane
1 Attributable gold production includes Westwood non-commercial production
19 2014 Production 844k oz.
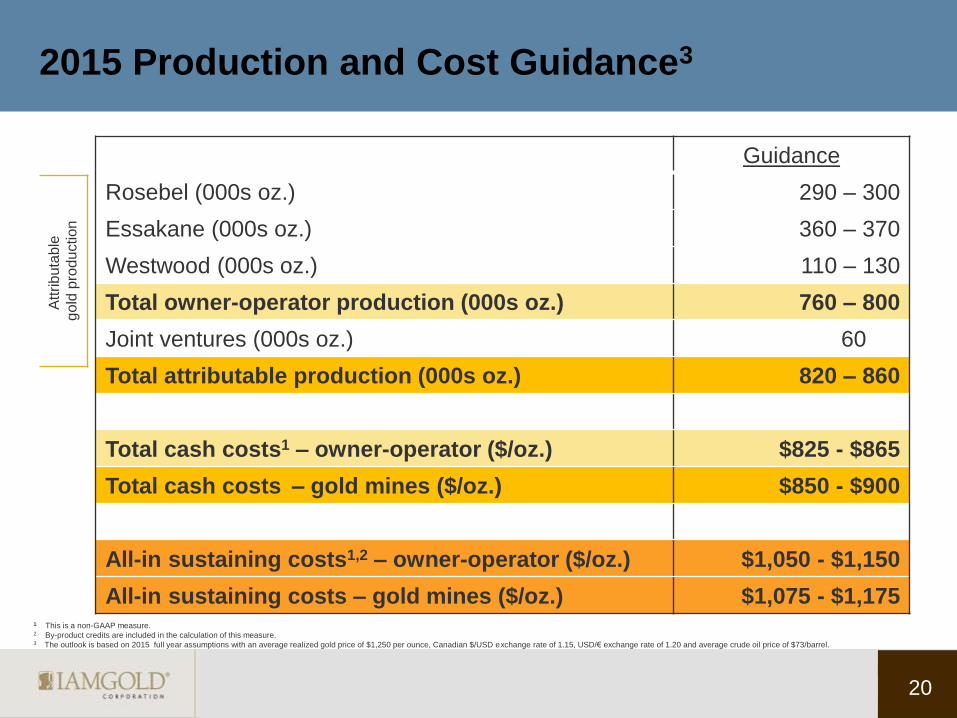
2015 Production and Cost Guidance3 A
ttrib
uta
ble
go
ld p
rod
uction
Guidance
Rosebel (000s oz.) 290 – 300
Essakane (000s oz.) 360 – 370
Westwood (000s oz.) 110 – 130
Total owner-operator production (000s oz.) 760 – 800
Joint ventures (000s oz.) 60
Total attributable production (000s oz.) 820 – 860
Total cash costs1 – owner-operator ($/oz.) $825 - $865
Total cash costs – gold mines ($/oz.) $850 - $900
All-in sustaining costs1,2 – owner-operator ($/oz.) $1,050 - $1,150
All-in sustaining costs – gold mines ($/oz.) $1,075 - $1,175 1 This is a non-GAAP measure. 2 By-product credits are included in the calculation of this measure. 3 The outlook is based on 2015 full year assumptions with an average realized gold price of $1,250 per ounce, Canadian $/USD exchange rate of 1.15, USD/€ exchange rate of 1.20 and average crude oil price of $73/barrel.
20
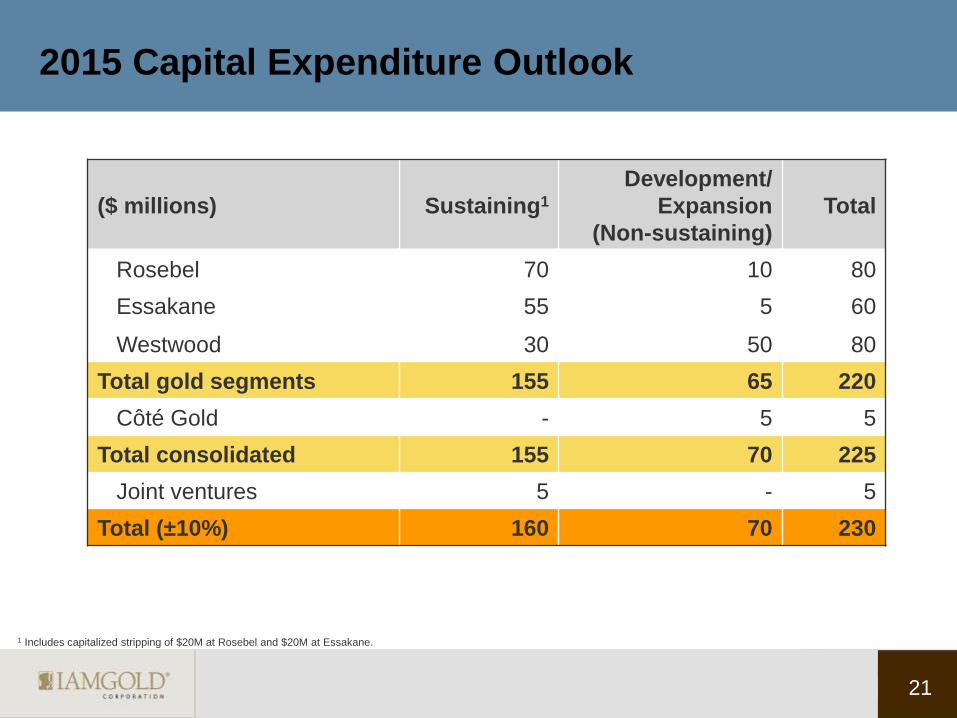
2015 Capital Expenditure Outlook
1 Includes capitalized stripping of $20M at Rosebel and $20M at Essakane.
($ millions) Sustaining1
Development/
Expansion
(Non-sustaining)
Total
Rosebel 70 10 80
Essakane 55 5 60
Westwood 30 50 80
Total gold segments 155 65 220
Côté Gold - 5 5
Total consolidated 155 70 225
Joint ventures 5 - 5
Total (±10%) 160 70 230
21
Exploration - Greenfield
22
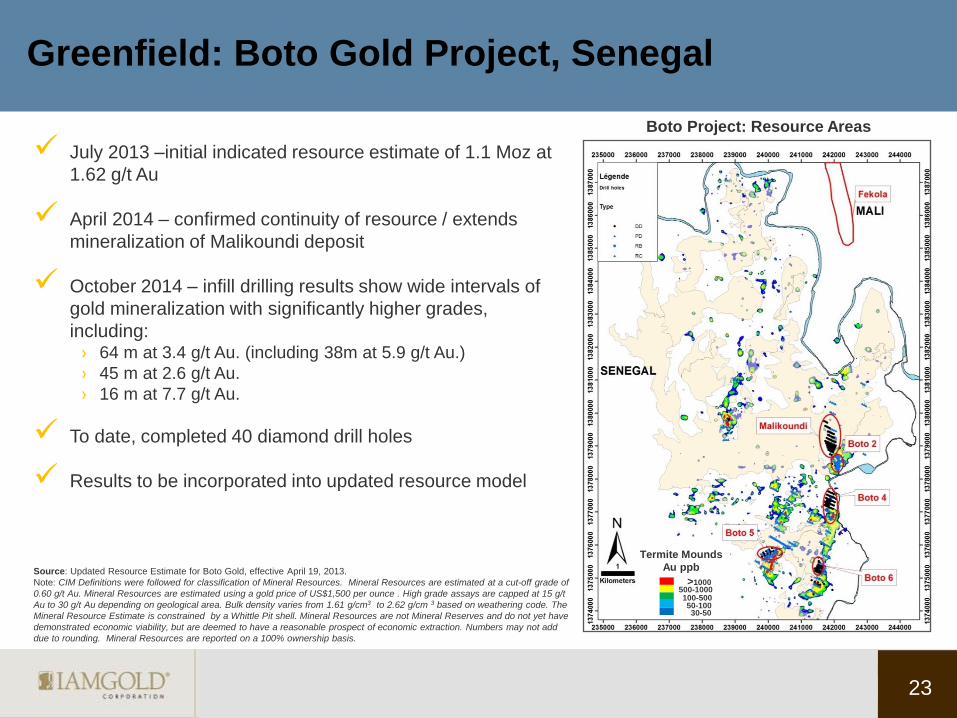
July 2013 –initial indicated resource estimate of 1.1 Moz at
1.62 g/t Au
April 2014 – confirmed continuity of resource / extends
mineralization of Malikoundi deposit
October 2014 – infill drilling results show wide intervals of
gold mineralization with significantly higher grades,
including: › 64 m at 3.4 g/t Au. (including 38m at 5.9 g/t Au.)
› 45 m at 2.6 g/t Au.
› 16 m at 7.7 g/t Au.
To date, completed 40 diamond drill holes
Results to be incorporated into updated resource model
Source: Updated Resource Estimate for Boto Gold, effective April 19, 2013.
Note: CIM Definitions were followed for classification of Mineral Resources. Mineral Resources are estimated at a cut-off grade of
0.60 g/t Au. Mineral Resources are estimated using a gold price of US$1,500 per ounce . High grade assays are capped at 15 g/t
Au to 30 g/t Au depending on geological area. Bulk density varies from 1.61 g/cm3 to 2.62 g/cm 3 based on weathering code. The
Mineral Resource Estimate is constrained by a Whittle Pit shell. Mineral Resources are not Mineral Reserves and do not yet have
demonstrated economic viability, but are deemed to have a reasonable prospect of economic extraction. Numbers may not add
due to rounding. Mineral Resources are reported on a 100% ownership basis.
Greenfield: Boto Gold Project, Senegal
30-50 50-100
100-500 500-1000
>1000
Termite Mounds
Au ppb
Boto Project: Resource Areas
23
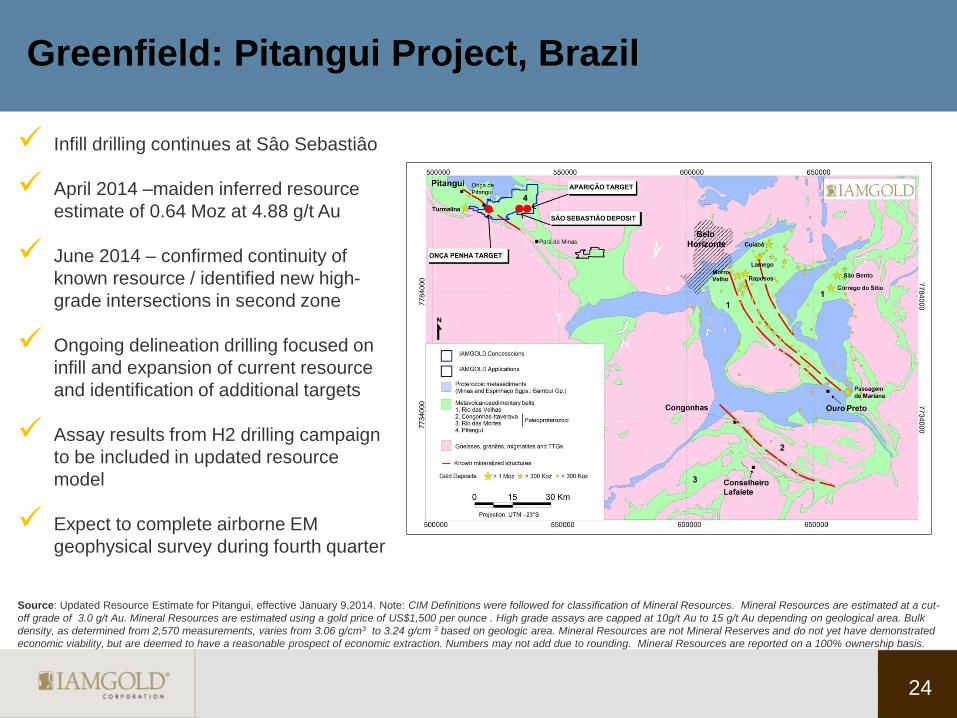
Infill drilling continues at Sâo Sebastiâo
April 2014 –maiden inferred resource
estimate of 0.64 Moz at 4.88 g/t Au
June 2014 – confirmed continuity of
known resource / identified new high-
grade intersections in second zone
Ongoing delineation drilling focused on
infill and expansion of current resource
and identification of additional targets
Assay results from H2 drilling campaign
to be included in updated resource
model
Expect to complete airborne EM
geophysical survey during fourth quarter
Source: Updated Resource Estimate for Pitangui, effective January 9,2014. Note: CIM Definitions were followed for classification of Mineral Resources. Mineral Resources are estimated at a cut-
off grade of 3.0 g/t Au. Mineral Resources are estimated using a gold price of US$1,500 per ounce . High grade assays are capped at 10g/t Au to 15 g/t Au depending on geological area. Bulk
density, as determined from 2,570 measurements, varies from 3.06 g/cm3 to 3.24 g/cm 3 based on geologic area. Mineral Resources are not Mineral Reserves and do not yet have demonstrated
economic viability, but are deemed to have a reasonable prospect of economic extraction. Numbers may not add due to rounding. Mineral Resources are reported on a 100% ownership basis.
24
Greenfield: Pitangui Project, Brazil
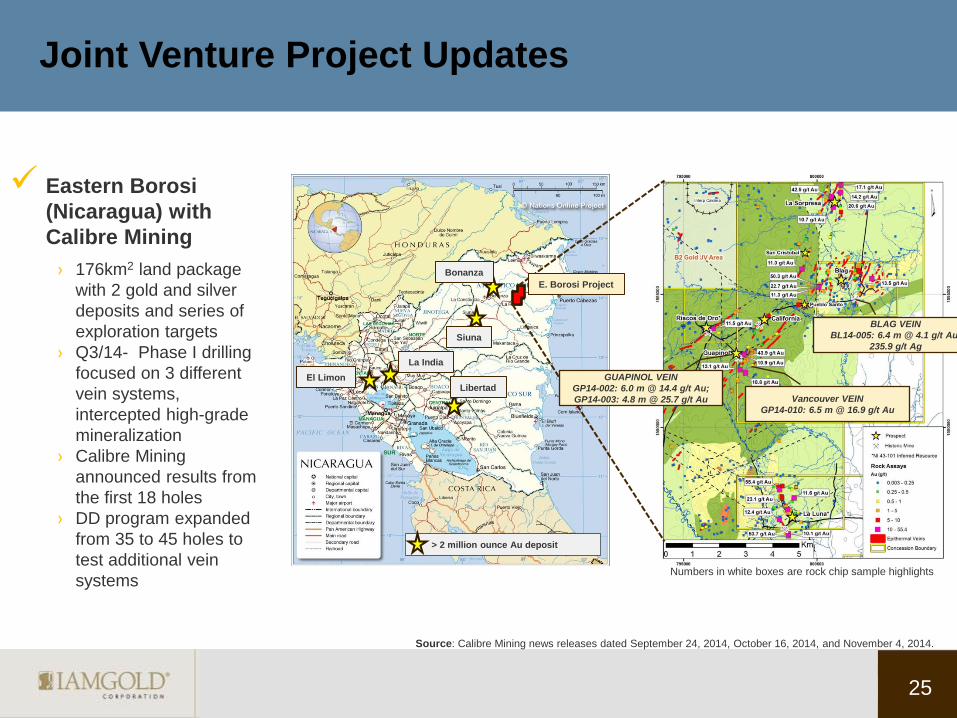
Joint Venture Project Updates
Eastern Borosi
(Nicaragua) with
Calibre Mining
› 176km2 land package
with 2 gold and silver
deposits and series of
exploration targets
› Q3/14- Phase I drilling
focused on 3 different
vein systems,
intercepted high-grade
mineralization
› Calibre Mining
announced results from
the first 18 holes
› DD program expanded
from 35 to 45 holes to
test additional vein
systems
> 2 million ounce Au deposit
Bonanza
El Limon
Siuna
Libertad
La India
E. Borosi Project
GUAPINOL VEIN
GP14-002: 6.0 m @ 14.4 g/t Au;
GP14-003: 4.8 m @ 25.7 g/t Au Vancouver VEIN
GP14-010: 6.5 m @ 16.9 g/t Au
BLAG VEIN
BL14-005: 6.4 m @ 4.1 g/t Au;
235.9 g/t Ag
25
Numbers in white boxes are rock chip sample highlights
Source: Calibre Mining news releases dated September 24, 2014, October 16, 2014, and November 4, 2014.
Joint Venture Project Updates
Monster Lake (Quebec) with Tomagold Corporation
› High grades and excellent location in Abitibi Greenstone belt
› High-grade intervals from previous exploration (25 to +30 g/t Au)
› Q3’14- reported remaining results from Phase I DD program (> 4,500m)
› Positive results confirm presence of high-grade mineralization
› Phase II DD program ongoing – testing targets along 4km mineralized
corridor (5,600m)
Siribaya (Mali) with Merrex Gold Inc.
› Focus on Diakha prospect - extension of trend hosting Boto Gold deposit
and B2Gold’s Fekola deposit
› Phase I RC drilling program intersected multiple zones of gold
mineralization with similar characteristics to Boto
› Phase II DD and RC program included infill and expansion drilling
› Assay results confirm significant gold mineralization, good grades,
and mineralized zones remain open in all directions
› Targeting maiden resource for 2015
Caramanta Project (Colombia) with Solvista Gold
Corp.
› Q3/14 - completed 1,800m of a 4,000m DD program testing targets on a
number of gold/copper/silver porphyry targets
26
Why invest in IAMGOLD?
Diversified portfolio of operating gold mines in friendly mining jurisdictions
Owned and operated mines generating positive free cash flow
AISC improving - focused on optimizing economic returns from existing
assets
Demonstrated ability to adapt in a volatile gold market
Significant financial flexibility from sale of Niobec
Promising exploration pipeline
Excellent CSR reputation
27
TSX: IMG NYSE: IAG
Investor Relations [email protected]
Laura Young
Director, Investor Relations
T: 416-933-4952
Penelope Talbot-Kelly
Analyst, Investor Relations
T: 416-933-4738
Bob Tait
VP, Investor Relations
T: 416-360-4743