TCS Group IFRS results - static.tinkoff.ru · March 2018 TCS Group 2017 FY IFRS results 3 2017FY...
28
TCS Group IFRS results 2017 FY
Transcript of TCS Group IFRS results - static.tinkoff.ru · March 2018 TCS Group 2017 FY IFRS results 3 2017FY...

TCS Group IFRS results2017 FY

Disclaimer
March 2018 TCS Group 2017 FY IFRS results 2
Certain statements and/or other information included in this document may not be historical facts and may
constitute “forward looking statements” within the meaning of Section 27A of the U.S. Securities Act and
Section 2(1)(e) of the U.S. Securities Exchange Act of 1934, as amended. The words “believe”, “expect”,
“anticipate”, “intend”, “estimate”, “plans”, “forecast”, “project”, “will”, “may”, “should” and similar expressions
may identify forward looking statements but are not the exclusive means of identifying such statements.
Forward looking statements include statements concerning our plans, expectations, projections, objectives,
targets, goals, strategies, future events, future revenues, operations or performance, capital expenditures,
financing needs, our plans or intentions relating to the expansion or contraction of our business as well as
specific acquisitions and dispositions, our competitive strengths and weaknesses, our plans or goals relating to
forecasted production, reserves, financial position and future operations and development, our business
strategy and the trends we anticipate in the industry and the political, economic, social and legal environment
in which we operate, and other information that is not historical information, together with the assumptions
underlying these forward looking statements. By their very nature, forward looking statements involve inherent
risks, uncertainties and other important factors that could cause our actual results, performance or
achievements to be materially different from results, performance or achievements expressed or implied by
such forward-looking statements. Such forward-looking statements are based on numerous assumptions
regarding our present and future business strategies and the political, economic, social and legal environment
in which we will operate in the future. We do not make any representation, warranty or prediction that the
results anticipated by such forward-looking statements will be achieved, and such forward-looking statements
represent, in each case, only one of many possible scenarios and should not be viewed as the most likely or
standard scenario. We expressly disclaim any obligation or undertaking to update any forward-looking
statements to reflect actual results, changes in assumptions or in any other factors affecting such statements.
Summary of 2017 performance
March 2018 TCS Group 2017 FY IFRS results 3
2017FYGuidance Result
Dynamic growth of credit business
• 1.8m new credit card customers acquired in 2017
• Net loans grew by 36.3% in 2017 35% 36.3%
Robust credit portfolio performance
• Annualized cost of risk at 5.5% in 2017 and 2.7% in 4Q’17
• NPLs (90d+) at 8.8% vs 10.2% at 2016YE with coverage at 1.3x 7-8% 5.5%
Transactional & Servicing business lines
• F&C business lines contribute 23% to 2017 total revenue
• Current account customers now at 2.8 million
• In 2017 number of SME customers grew 5x to 240K
• SME and Mortgage business lines broke even in 2017
Strong positiveCoB and CAR trends
• Cost of borrowing is at 7.6% in 2017 and 6.9% in 4Q’17
• Solid capital base: statutory N1.0 at 16.3%, N1.1 at 10.2% and N1.2 at 14.8% as at the end of 2017
Below 8%
7.6%
Superior profitability• Net profit of RUB 6.4bn in 4Q’17 and RUB 19.0bn in 2017FY, up 73% y-o-y
• ROAE at 63.1% in 4Q’17 and 52.8% for 2017FY
RUB 17bn+
RUB 19bn
Strong new business development momentum
• Acquisition of a 55% stake in CloudPayments
• Roll-out of c200 ATM’s across Russia
• The launch of Tinkoff Mobile

Continued asset growth dynamics
March 2018 TCS Group 2017 FY IFRS results 4
23.0 19.9 21.2 25.0 32.3
102.9 111.5 121.2134.1
140.2
33.3 32.546.0
57.972.5
16.2 13.0
27.0
19.0
23.9
175.4 176.8
215.3236.0
268.8
4Q'16 1Q'17 2Q'17 3Q'17 4Q'17
Cash and cash equivalents Investment securities and REPO Net loans Other
13% 11% 10% 11% 12%
59% 63%56% 57% 52%
19% 18%21% 25% 27%
9% 7% 13% 8% 9%
4Q'16 1Q'17 2Q'17 3Q'17 4Q'17
Cash and cash equivalents Investment securities and REPO Net loans Other
A 36%+ y-o-y growth of net loans was supplemented by doubling of
the investment securities portfolio on the back of retail and SME
current accounts growth
All currency data are in RUB bn unless otherwise stated
ASSETS ASSETS STRUCTURE
53.3%13.9%

Quality growth of credit card portfolio, ahead of the market
March 2018 TCS Group 2017 FY IFRS results 5
102.9 111.5 121.2134.1 140.2
17.517.9
18.319.3 17.5
120.4129.4
139.5153.4 157.8
4Q'16 1Q'17 2Q'17 3Q'17 4Q'17
Net loans LLP
2.0% 1.9% 1.9% 1.7% 1.7%
3.3%2.4%
1.9% 1.8% 2.1%
5.0% 5.3% 5.5% 5.9%5.0%
142% 144% 140%134%
126%
155% 158% 158%
4Q'16 1Q'17 2Q'17 3Q'17 4Q'17
90-180 dpd 180+ dpd Courts
LLP/NPL, IAS 39 LLP/NPL, IFRS 9
All currency data are in RUB bn unless otherwise stated
31.0%2.9%
GROSS LOANS NPL (AS % OF GROSS LOANS)
A solid 31% y-o-y growth of gross loans
is attributed to the average 200K credit
cards issuance per month, as well
as to the development of cash and POS
loans business lines
The share of non-performing
loans (NPLs) fell to 8.8%
in 2017
Loan loss provision coverage
notched down to 1.26x under
IAS 39

Funding: customer inflows remain strong
March 2018 TCS Group 2017 FY IFRS results 6
72.0 66.9 71.7 74.9 77.4
5.8 8.212.6
18.2
25.4
11.5 11.1
23.222.4
22.0
139.5 137.7
172.0186.3
212.5
8.08.3
10.8
46.7 48.155.9 62.6
76.3
4Q'16 1Q'17 2Q'17 3Q'17 4Q'17
Individuals term Individuals current Legal entities
Subordinated debt Debt securities in issue Due to banks
107.2 105.8 121.7 136.4 158.3
17.3 17.418.5
19.320.8
83% 85% 86% 87% 87%
4Q'16 1Q'17 2Q'17 3Q'17 4Q'17
RUB
FX
% of retailaccounts coveredby DIA*
4.8* 5.2* 5.017.3
2Q'18 … 4Q'18 … 2Q'19 … 3Q'22
Local bonds
Subordinated bond
ECP
Put option
*management estimates, unaudited
Put option Call option
* volume outstanding as of Mar 13, 2018
FUNDING CUSTOMER ACCOUNTS
WHOLESALE DEBT MATURITY PROFILE
52.3%14.0%
All currency data are in RUB bn unless otherwise stated
Customer accounts remain our primary
source of funding:
• A 29% growth of individual accounts
balances is attributed to the acquisition
of debit card customers
• A 4.4x growth of corporate accounts balances
is due to SME business line development
We leveraged strong appetite for Tinkoff risk in the wholesale debt
market to boost our capital position, diversify our funding mix and
to balance our liabilities duration position. In 2017, we
successfully completed 3 new bond transaction:
• $300m perpetual subordinated debt placement in Jun’17
• Local RUB 5bn bond placement in Apr’17
• Issuance of $48m ECP in Dec’17
We hedge our open
FX position with
long-dated Swaps

Equity – solid capital position and robust ROE underpin a new dividend policy
March 2018 TCS Group 2017 FY IFRS results 7
29.533.5
35.939.1
41.9
14.8%16.8%
24.7% 23.6%21.0%
16.3%18.0%
25.1% 23.9%21.1%
4Q'16 1Q'17 2Q'17 3Q'17 4Q'17
Equity Basel III Tier 1 CARBasel III Total CAR
All currency data are in RUB bn unless otherwise stated
42.1%7.2% 11.1% 12.7% 12.0%
16.0% 16.3%
4Q'16 1Q'17 2Q'17 3Q'17 4Q'17
8.6% 9.4% 9.8% 9.8% 10.2%
14.4% 14.8%
4Q'16 1Q'17 2Q'17 3Q'17 4Q'17
N1.1 N1.2
SHAREHOLDERS’ EQUITY N1.0 CAPITAL RATIO (STATUTORY)
N1.1, N1.2 CAPITAL RATIOS (STATUTORY)
Our equity showed a strong 42.1% y-o-y growth which ensures
healthy margins above regulatory capital requirements
N1.2 was boosted by the USD 300mn perpetual
bond placed in June
Solid capital position and strong capital generation momentum
enable out new dividend policy: up to 50% of our quarterly net
income is paid in dividends
A total $1.08/per GDR declared in dividends based on 2017 earnings
N1.0 min 9.25%
N1.2 min 7.25%
N1.1 min 5.75%

Revenue
All currency data are in RUB bn unless otherwise stated
REVENUE REVENUE STRUCTURE
84% 84% 81% 76% 71%
9% 10% 12%14% 19%
5% 4% 5% 6% 6%2% 2% 3% 4% 4%
0%
10%
20%
30%
40%
50%
60%
70%
80%
90%
100%
4Q'16 1Q'17 2Q'17 3Q'17 4Q'17
Credit F&C business Treasury Insurance premiums
85%77%
8%14%
5% 5%2% 3%
2016 2017
13.4 13.5 14.8 16.0 16.8
1.4 1.62.3
3.04.4
0.8 0.7
0.8
1.2
1.3
16.0 16.1
18.4
21.0
23.6
0.40.4
0.5
0.8
1.0
4Q'16 1Q'17 2Q'17 3Q'17 4Q'17
Credit F&C business Treasury Insurance premiums
49.1
61.0
58.1
79.0
4.6
11.2
3.0
4.1
1.3
2.7
2016 2017
36.1% 47.3%
Group’s revenue showed a 36.1% increase
y-o-y driven by growth of core credit
business as well as development of
transactional & servicing businesses
The share of non-credit related
revenue increased from 15% in
2016 to 23% in 2017
March 2018 TCS Group 2017 FY IFRS results 8

Credit business: Interest income and expense
March 2018 TCS Group 2017 FY IFRS results 9
40.8% 39.0% 39.7% 40.0% 39.3%
8.4% 8.0% 7.3% 7.3% 7.2%
4Q'16 1Q'17 2Q'17 3Q'17 4Q'17
Credit portfolio Investment portfolio
40.3% 39.6%
8.8% 7.2%
2016 2017
10.0%8.5% 7.7% 7.7% 6.9%
4Q'16 1Q'17 2Q'17 3Q'17 4Q'17
11.0%
7.6%
2016 2017
INTEREST INCOME YIELD
INTEREST EXPENSE COST OF BORROWING
2.7 2.5 2.4 2.6 2.6
0.60.5 0.6
0.8 0.8
3.4 3.0 3.0 3.5 3.4
4Q'16 1Q'17 2Q'17 3Q'17 4Q'17
Customer accounts Wholesale / due to banks
10.9 10.1
2.7 2.7
13.6 12.8
2016 2017
12.1 12.2 13.4 14.7 15.3
0.8 0.70.8
1.2 1.312.9 12.914.2
15.8 16.6
4Q'16 1Q'17 2Q'17 3Q'17 4Q'17
Credit portfolio Treasury
44.655.5
3.04.147.6
59.5
2016 2017
In 2017 interest income grew by 25%
y-o-y with gross interest yield of credit portfolio
showing a decline from 40.3% to 39.6%
Interest expense decreased by 6% y-o-y while the aggregate cost of borrowing dropped
by 340bps y-o-y as a result of declining retail deposit rates and gradual growth of the
weight of the individual and SME current accounts in the liability structure
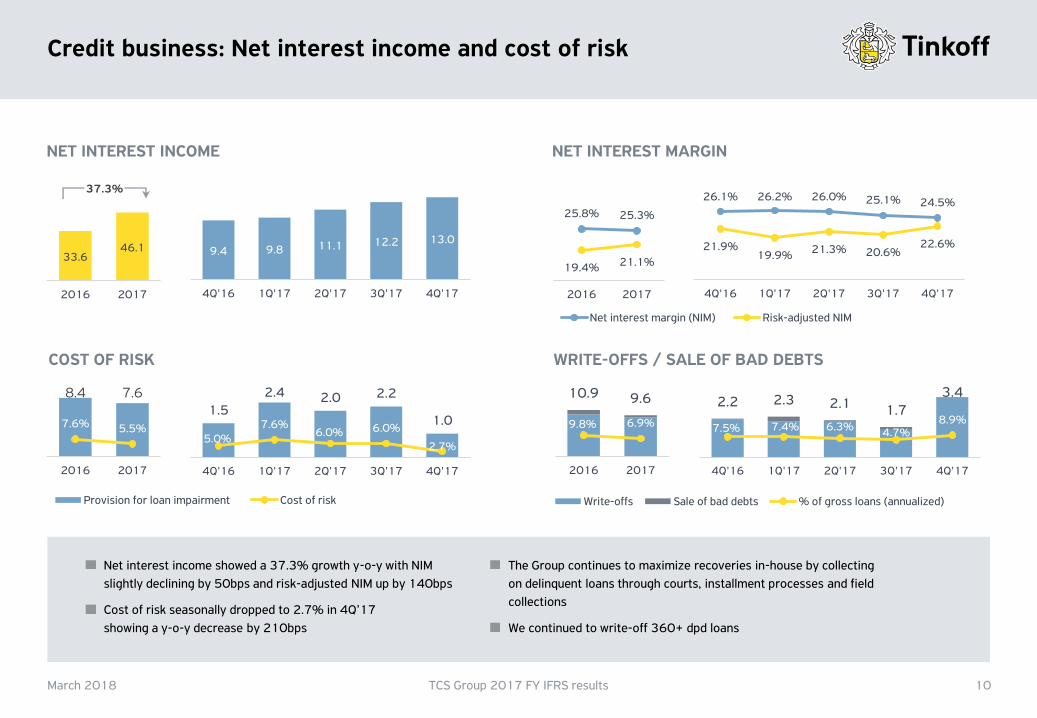
Credit business: Net interest income and cost of risk
March 2018 TCS Group 2017 FY IFRS results 10
9.4 9.8 11.1 12.2 13.0
4Q'16 1Q'17 2Q'17 3Q'17 4Q'17
33.646.1
2016 2017
NET INTEREST INCOME NET INTEREST MARGIN
26.1% 26.2% 26.0% 25.1% 24.5%
21.9%19.9%
21.3% 20.6%22.6%
4Q'16 1Q'17 2Q'17 3Q'17 4Q'17
Net interest margin (NIM) Risk-adjusted NIM
25.8% 25.3%
19.4% 21.1%
2016 2017
2.2 2.3 2.1 1.73.4
7.5% 7.4% 6.3% 4.7%8.9%
4Q'16 1Q'17 2Q'17 3Q'17 4Q'17
Write-offs Sale of bad debts % of gross loans (annualized)
1.5
2.4 2.0 2.2
1.0
5.0%7.6%
6.0% 6.0%
2.7%
4Q'16 1Q'17 2Q'17 3Q'17 4Q'17
Provision for loan impairment Cost of risk
8.4 7.6
7.6% 5.5%
2016 2017
10.9 9.6
9.8% 6.9%
2016 2017
COST OF RISK WRITE-OFFS / SALE OF BAD DEBTS
37.3%
Net interest income showed a 37.3% growth y-o-y with NIM
slightly declining by 50bps and risk-adjusted NIM up by 140bps
Cost of risk seasonally dropped to 2.7% in 4Q’17
showing a y-o-y decrease by 210bps
The Group continues to maximize recoveries in-house by collecting
on delinquent loans through courts, installment processes and field
collections
We continued to write-off 360+ dpd loans

Transition to IFRS 9
41.9
32.2
-9.7
IAS 39 Transitioneffect
IFRS 9
All currency data are in RUB bn unless otherwise stated
EQUITY
8.8%
11.9%
IAS 39 IFRS 9
NPL
126.0%
157.6%
IAS 39 IFRS 9
NPL COVERAGE
Introduction of unused limits provisioning
All installment loans will be recognized as a stage 3 loans
Immediate 12-month ECL recognition
Effect on gross interest yield and cost of risk is estimated at 1-2 pp
KEY CHANGES
March 2018 TCS Group 2017 FY IFRS results 11

0.1 0.1 0.2 0.30.4
0.2 0.30.3
0.6
0.7
0.4 0.40.5
0.8
1.0
4Q'16 1Q'17 2Q'17 3Q'17 4Q'17
Auto Other
0.4
0.9
1.0
1.8
1.3
2.7
2016 2017
1.4 1.3 1.4 1.3 1.5
0.6 0.60.8 1.0
1.30.3 0.40.5 0.6
0.90.5
1.0
1.4
0,3 0.0
0.1
0.2
0.4
2.6 2.7
3.4
4.0
5.4
4Q'16 1Q'17 2Q'17 3Q'17 4Q'17
Credit-related Debit cards Merchant acquiring SME Other
4.55.5
1.8
3.61.3
2.4
3.2
0.7
0.7
8.4
15.5
2016 2017
Transactional & Servicing business:Continued growth momentum in fee and commission income
March 2018 TCS Group 2017 FY IFRS results 12
FEE AND COMMISSION INCOME INSURANCE PREMIUMS EARNED
All currency data are in RUB bn unless otherwise stated
84.9% 2.1x 2x
Non-credit revenue
(including F&C income + insurance premiums)
steady growth continues: 23% in total revenue
Rapid growth in F&C income is due to the
development of non-credit business lines, primarily
debit cards, online acquiring and SME services
We continue to view a more
aggressive growth in the
insurance business as premature

0.3 0.3 0.4 0.40.5
0.1 0.10.1
0.2
0.2
0.1 0.1
0.10.2
0.2
0.1 0.1
0.1
0.1
0.1
0.0 0.0
0.0
0.0
0.0
0.1
0.1
0.2
0.6 0.6
0.8
1.0
1.3
4Q'16 1Q'17 2Q'17 3Q'17 4Q'17
Interchange FX Cash withdrawal SMS Placement Other
Transactional business: Current accounts
March 2018 TCS Group 2017 FY IFRS results 13
0.0
0.4
0.8
1.2
1.6
2.0
2.4
2.8
3.2
0.0
10.0
20.0
30.0
40.0
50.0
60.0
70.0
80.0
90.0
4Q'16 1Q'17 2Q'17 3Q'17 4Q'17M
illio
ns
RU
B b
n
Current accounts balance (LHS) Saving accounts balance (LHS)
Customers (RHS)
BALANCES AND CUSTOMERS* FEE AND COMMISSION INCOME
All currency data are in RUB bn unless otherwise stated
2.1x
* Management estimates, unaudited
63.3%
We see our current accounts business
as the cornerstone of our customer relationship
Our award-winning mobile and internet bank applications
ensure best-in-class customer experience
* Management estimates, unaudited
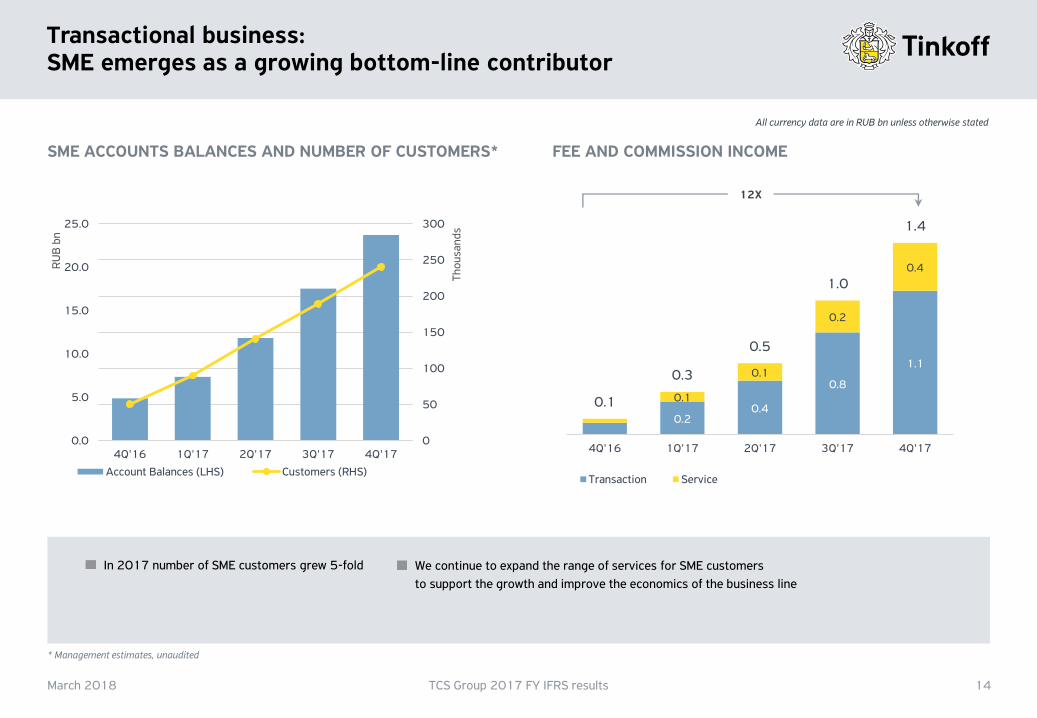
Transactional business: SME emerges as a growing bottom-line contributor
March 2018 TCS Group 2017 FY IFRS results 14
0
50
100
150
200
250
300
0.0
5.0
10.0
15.0
20.0
25.0
4Q'16 1Q'17 2Q'17 3Q'17 4Q'17T
ho
usa
nd
s
RU
B b
n
Account Balances (LHS) Customers (RHS)
SME ACCOUNTS BALANCES AND NUMBER OF CUSTOMERS* FEE AND COMMISSION INCOME
0.20.4
0.8
1.1
0.1
0.1
0.2
0.4
0.1
0.3
0.5
1.0
1.4
4Q'16 1Q'17 2Q'17 3Q'17 4Q'17
Transaction Service
All currency data are in RUB bn unless otherwise stated
12X
In 2017 number of SME customers grew 5-fold We continue to expand the range of services for SME customers
to support the growth and improve the economics of the business line

Transaction business: Mortgage broker scaling up
March 2018 TCS Group 2017 FY IFRS results 15
0
200
400
600
800
1,000
1,200
1,400
1,600
1,800
0
500
1,000
1,500
2,000
2,500
3,000
3,500
4,000
4,500
5,000
4Q'16 1Q'17 2Q'17 3Q'17 4Q'17
RU
B m
n
Volume (LHS) Number of mortgage loans (RHS)
MORTGAGE VOLUME ORIGINATED THROUGH TINKOFF.RU* PARTNERS
All currency data are in RUB bn unless otherwise stated
* Management estimates, unaudited
More than RUB 10bn mortgage loans were originated through
Tinkoff platform in 2017
The mortgage broker business is looking to scale up without
excessive pressure on the operating profit
Two new banks — UniCredit and Gazprombank —
joined our partners’ group
DOM.RF became our strategic partner
DeltaCredit Bank Gazprombank
Absolut Bank UniCredit Bank
URALSIB Bank AK BARS Bank
SMP Bank Metallinvestbank
Housing Finance Bank Orient Express Bank
DOM.RF

Transaction business: Tinkoff investments shows steady growth
March 2018 TCS Group 2017 FY IFRS results 16
1,123
3,424
6,099
10,057
12,441
0
10
20
30
40
50
60
70
4Q'16 1Q'17 2Q'17 3Q'17 4Q'17
RU
B'0
00
Total (RUB mn) Average (RHS)
15
13
1716
15
0%
5%
10%
15%
20%
25%
30%
35%
4Q'16 1Q'17 2Q'17 3Q'17 4Q'17
Accounts opened (in period) Share in new MOEX accounts (RHS)
ACCOUNTS OPENED (IN THE PERIOD) TURNOVER
All currency data are in RUB bn unless otherwise stated
We capitalize on a buoyant
growth of the Russian retail
investor market
More than 60k accounts were
opened in 2017
Tinkoff Investments is a retail securities trading platform
we launched in 3Q’16 in partnership with BCS, Russia’s
leading retail brokerage

Operating expenses
March 2018 TCS Group 2017 FY IFRS results 17
2.4 2.5 2.6 2.93.5
0.7 0.8 0.91.0
1.21.0 0.9
1.11.2
1.6
1.3 1.01.3
1.6
1.9
5.55.2
5.9
6.7
8.2
4Q'16 1Q'17 2Q'17 3Q'17 4Q'17
Administrative staff Acquisition staff Other administrative Other acquisition
7.511.4
2.6
4.03.8
4.84.0
5.8
18.0
25.9
2016 2017
All currency data are in RUB bn unless otherwise stated
STRUCTURE OF OPERATING EXPENSES* OPERATING EFFICIENCY**
47.4%
42.7% 41.9% 42.3%
45.5%
29.4%
27.7%25.9%
25.9%
28.0%30.0%
25.8% 25.5%
29.2%
27.8%
4Q'16 1Q'17 2Q'17 3Q'17 4Q'17
C/I (incl. acquisition) C/I (excl. acquisition) C/I (core business)
43.9% 43.2%
27.5% 26.9%
29.1%27.1%
2016 2017
* Administrative and other operating expenses + customer acquisition expenses.** Income is stated as operating income that includes net interest income, net fee and commission income, insurance premiums earned and other operating income. Cost is stated as client acquisition expenses plus administrative and other operating expenses.
44.2%
Operating expenses were up
by 44.2% y-o-y in 2017
At the same time, cost-to-
income ratio decreased from
43.9% to 43.2%
A seasonal growth in 4Q’17 is attributed to
salary indexation and advertising expenses

51.4%42.8%
48.6% 53.7%63.1%
4Q'16 1Q'17 2Q'17 3Q'17 4Q'17
8.7%7.7% 8.6% 8.9%
10.1%
4Q'16 1Q'17 2Q'17 3Q'17 4Q'17
7.1%8.9%
2016 2017
42.5%52.8%
2016 2017
Net income – a set of record-high quarterly result
March 2018 TCS Group 2017 FY IFRS results 18
3.73.4
4.2
5.0
6.4
4Q'16 1Q'17 2Q'17 3Q'17 4Q'17
11.0
19.0
2016 2017
All currency data are in RUB bn unless otherwise stated
NET INCOME RETURN ON ASSETS
RETURN ON EQUITY
72.8%
A net income of RUB 19.0bn
for 2017 with ROAE of 52.8%
Our 4Q’17 net income of RUB
6.4bn is a new quarterly record
0.17
0.20
0.22+
0.18
0.31DIVIDEND PER GDR$
$
$
$

FY2018 guidance
March 2018 TCS Group 2017 FY IFRS results 19
2017 2018F
Net loan portfolio growth 36.3% 25%+
Cost of risk (IAS 39) 5.5% Below 7%
Cost of borrowing 7.6% 6-7%
Net income RUB 19bn RUB 24bn+

Appendix

Customer profile
March 2018 TCS Group 2017 FY IFRS results 21
Platinum Credit Card
All AirlinesCredit cobrands
Tinkoff BlackDebit cobrands
TinkoffInvestments
Gender (M/F) 47/53 64/36 60/40 63/37 56/44 88/12
Average age 41 37 34 35 37 33
Monthly income (kRUB) 47 113 68 80 65 90
Geography
Moscow and Moscow Region
19% 47% 24% 39% 25% 41%
Saint-Petersburg and Leningradskaya oblast’
8% 12% 9% 13% 12% 12%
Every other region < 5% < 3% < 9% < 3% < 3% < 3%
Credit Transactional & Servicing

17.1%22.2%
25.5%
33.2% 39.4% 42.8%45.5%
0.4% 2.2% 2.5% 4.2%
5.8%
7.2%
7.5%
6.7%8.3%
10.3%
11.6%
4.6%
5.7%
7.1%7.0%
7.3%
8.3%
5.8% 10.0%10.9%
9.4%
7.2%
6.4%
6.6%7.8%
8.1%
6.9%
69.1% 55.7% 48.5%40.9%
39.6%
36.8%
35.9%
29.5%23.4% 18.9%
16.2%
25.2%31.1% 30.3%
28.1%
24.4%
22.0%
19.0%
17.0%
14.1%12.6%
11.4%
177 206 193
228
368
671
990
1,156
1,032 999
1,122
2007 2008 2009 2010 2011 2012 2013 2014 2015 2016 2017
Other consumer banks*
58% 63% 69% 72%
Credit card market: resumed growth while consolidating
March 2018 TCS Group 2017 FY IFRS results 22
* Other consumer banks include OTP Bank, Binbank credit cards, HCF Bank, Orient Express Bank, Credit Europe Bank, MTS Bank, Trust, Renaissance Credit, Sovcombank and Russian Standard BankSource: Bank’s analytics based on CBR 101 form
2017 consumer credit portfolio dynamics
• Credit cards: 12.3%
• Mortgage: 15.0%
• Other: 10.7%
Top 4 players:
RUSSIAN CREDIT CARD MARKET
All currency data are in RUB bn unless otherwise stated

Tinkoff financial supermarket: Ecosystem built around the customer
March 2018 TCS Group 2017 FY IFRS results 23
* “Under Construction”
SM
E
Cre
dit
car
ds
Insu
ran
ce
Mo
bile
an
d p
aym
ents
Broker platform Proprietary products
Car
loan
s*
Cas
h lo
ans*
Insu
ran
ce
Tra
vel
Acq
uiri
ng
Ret
ail s
ecur
itie
s
Mo
rtg
ages
MV
NO
Tinkoff ID: customer’s key for Tinkoff.ru
Cu
rren
t ac
cou
nts
Customer lands on potal

Long-term perspective – profitability
March 2018 TCS Group 2017 FY IFRS results 24
0%
10%
20%
30%
40%
50%
60%
70%
80%
90%
0.0
0.8
1.6
2.4
3.2
4.0
4.8
5.6
6.4
7.2
Q1 Q2 Q3 Q4 Q1 Q2 Q3 Q4 Q1 Q2 Q3 Q4 Q1 Q2 Q3 Q4 Q1 Q2 Q3 Q4 Q1 Q2 Q3 Q4 Q1 Q2 Q3 Q4 Q1 Q2 Q3 Q4
2010 2011 2012 2013 2014 2015 2016 2017
RU
B b
n
Profit (quarterly) ROE (YTD), rs
• Russian consumer finance crisis
• Macro weakness
• Low oil prices
• Geopolitics

Long-term perspective – growth
March 2018 TCS Group 2017 FY IFRS results 25
-50%
-25%
0%
25%
50%
75%
100%
125%
150%
0
20
40
60
80
100
120
140
160
Q1 Q2 Q3 Q4 Q1 Q2 Q3 Q4 Q1 Q2 Q3 Q4 Q1 Q2 Q3 Q4 Q1 Q2 Q3 Q4 Q1 Q2 Q3 Q4 Q1 Q2 Q3 Q4 Q1 Q2 Q3 Q4
2010 2011 2012 2013 2014 2015 2016 2017
RU
B b
n
Loans and advances to retail customers LTM Tinkoff portfolio growth, rs LTM market growth, rs
• Russian consumer finance crisis
• Macro weakness
• Low oil prices
• Geopolitics

Issue in lombard
74%
Issue not in lombard26% Financial
33%
Communications
4%
Industrial10%Utilities
5%
Government20%
Energy19%
Basic Materials
8%
Consumer, Non-cyclical
2%
RUB65%
FX35%
0-113%
1-327%
3-542%
5+18%
>=BBB-44%
BB+21%
BB7%
BB-7%
B+ 21%
Structure of the treasury portfolio
March 2018 TCS Group 2017 FY IFRS results 26
Note: management estimates, unaudited
BY RATING BY DURATION BY CURRENCY
IN CBR LOMBARD BY SECTOR
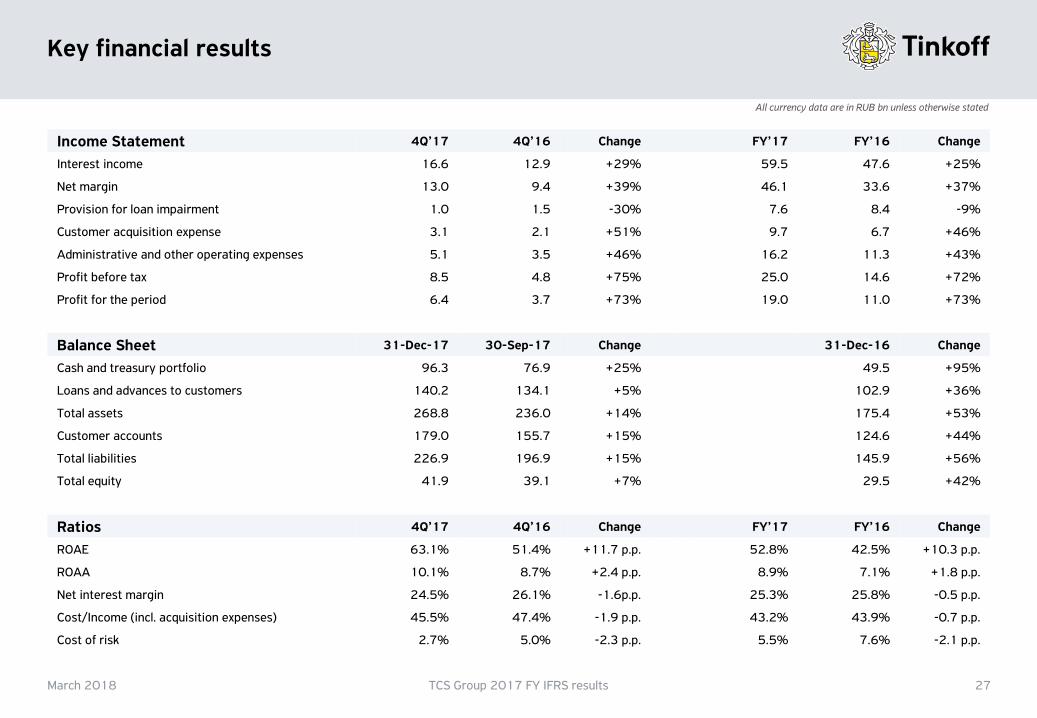
Key financial results
March 2018 TCS Group 2017 FY IFRS results 27
Income Statement 4Q’17 4Q’16 Change FY’17 FY’16 Change
Interest income 16.6 12.9 +29% 59.5 47.6 +25%
Net margin 13.0 9.4 +39% 46.1 33.6 +37%
Provision for loan impairment 1.0 1.5 -30% 7.6 8.4 -9%
Customer acquisition expense 3.1 2.1 +51% 9.7 6.7 +46%
Administrative and other operating expenses 5.1 3.5 +46% 16.2 11.3 +43%
Profit before tax 8.5 4.8 +75% 25.0 14.6 +72%
Profit for the period 6.4 3.7 +73% 19.0 11.0 +73%
Balance Sheet 31-Dec-17 30-Sep-17 Change 31-Dec-16 Change
Cash and treasury portfolio 96.3 76.9 +25% 49.5 +95%
Loans and advances to customers 140.2 134.1 +5% 102.9 +36%
Total assets 268.8 236.0 +14% 175.4 +53%
Customer accounts 179.0 155.7 +15% 124.6 +44%
Total liabilities 226.9 196.9 +15% 145.9 +56%
Total equity 41.9 39.1 +7% 29.5 +42%
Ratios 4Q’17 4Q’16 Change FY’17 FY’16 Change
ROAE 63.1% 51.4% +11.7 p.p. 52.8% 42.5% +10.3 p.p.
ROAA 10.1% 8.7% +2.4 p.p. 8.9% 7.1% +1.8 p.p.
Net interest margin 24.5% 26.1% -1.6p.p. 25.3% 25.8% -0.5 p.p.
Cost/Income (incl. acquisition expenses) 45.5% 47.4% -1.9 p.p. 43.2% 43.9% -0.7 p.p.
Cost of risk 2.7% 5.0% -2.3 p.p. 5.5% 7.6% -2.1 p.p.
All currency data are in RUB bn unless otherwise stated