TCS Digital Software & Solutions Group · and performance of TCS and TCS Entities’ products and...
86
TCS Digital Software & Solutions Group Retail Recipe Development using CIDL and QuickSight Release 1.0 Use Case Document TCS House, Raveline Street, Fort, Mumbai - 400 001, India Phone: +91-22-6778 9999, Fax: +91-22-6778 9000, E-mail: tcs.[email protected] Oct 2019
Transcript of TCS Digital Software & Solutions Group · and performance of TCS and TCS Entities’ products and...
TCS Digital Software & Solutions Group
Retail Recipe Development using CIDL and QuickSight
Release 1.0
Use Case Document
TCS House, Raveline Street, Fort, Mumbai - 400 001, India
Phone: +91-22-6778 9999, Fax: +91-22-6778 9000, E-mail: [email protected]
Oct 2019
Tata Consultancy Services Use Case Document
TCS Confidential 2
Copyright Notice
This publication is Copyright © 2019 Tata Consultancy Services Limited and its licensors. All rights reserved.
Refer to the “Trademark Notices” section at the end of this publication for specific information about trademarks used in this publication.
Tata Consultancy Services Use Case Document
TCS Confidential 3
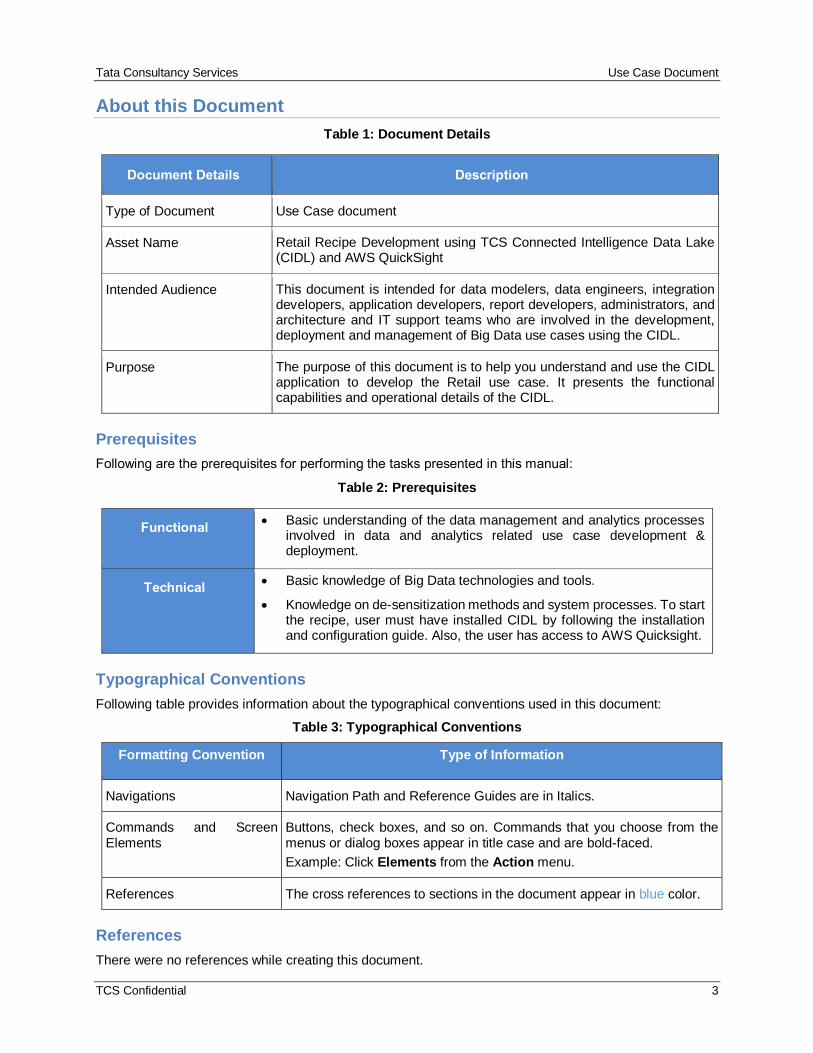
About this Document
Table 1: Document Details
Document Details Description
Type of Document Use Case document
Asset Name Retail Recipe Development using TCS Connected Intelligence Data Lake (CIDL) and AWS QuickSight
Intended Audience This document is intended for data modelers, data engineers, integration developers, application developers, report developers, administrators, and architecture and IT support teams who are involved in the development, deployment and management of Big Data use cases using the CIDL.
Purpose The purpose of this document is to help you understand and use the CIDL application to develop the Retail use case. It presents the functional capabilities and operational details of the CIDL.
Prerequisites
Following are the prerequisites for performing the tasks presented in this manual:
Table 2: Prerequisites
Functional • Basic understanding of the data management and analytics processes
involved in data and analytics related use case development & deployment.
Technical • Basic knowledge of Big Data technologies and tools.
• Knowledge on de-sensitization methods and system processes. To start the recipe, user must have installed CIDL by following the installation and configuration guide. Also, the user has access to AWS Quicksight.
Typographical Conventions
Following table provides information about the typographical conventions used in this document:
Table 3: Typographical Conventions
Formatting Convention Type of Information
Navigations Navigation Path and Reference Guides are in Italics.
Commands and Screen Elements
Buttons, check boxes, and so on. Commands that you choose from the menus or dialog boxes appear in title case and are bold-faced.
Example: Click Elements from the Action menu.
References The cross references to sections in the document appear in blue color.
References
There were no references while creating this document.
Tata Consultancy Services Use Case Document
TCS Confidential 4
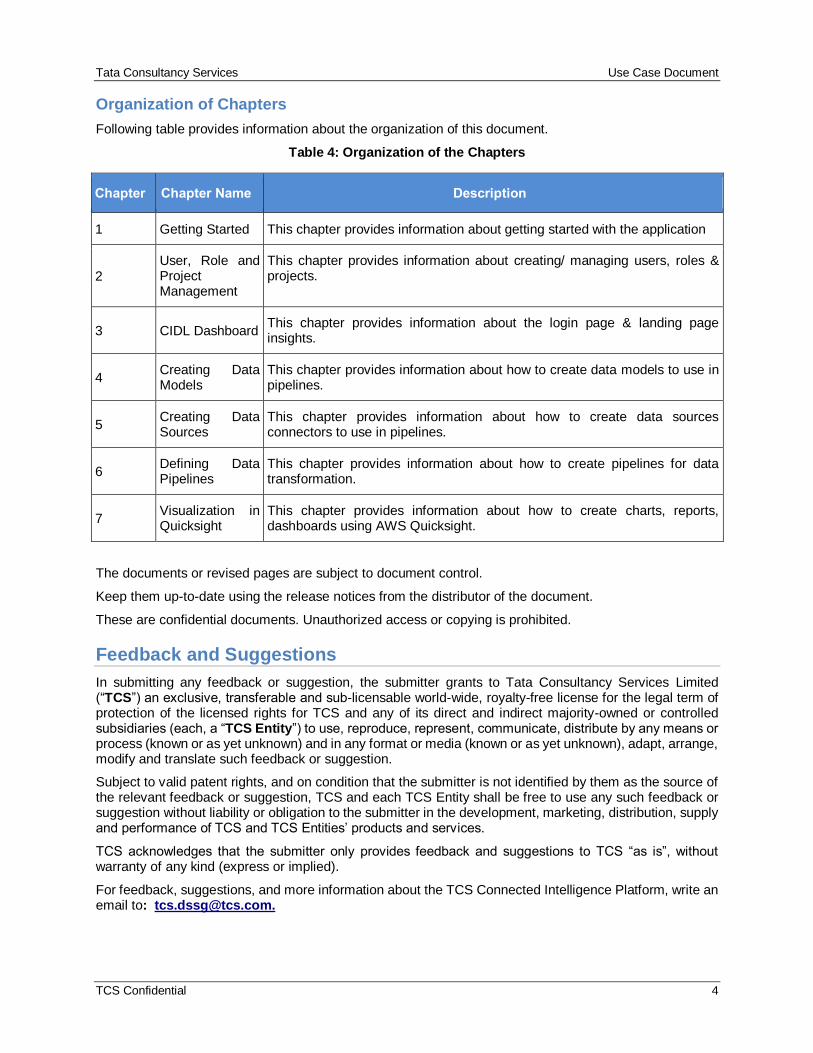
Organization of Chapters
Following table provides information about the organization of this document.
Table 4: Organization of the Chapters
Chapter Chapter Name Description
1 Getting Started This chapter provides information about getting started with the application
2 User, Role and Project Management
This chapter provides information about creating/ managing users, roles & projects.
3 CIDL Dashboard This chapter provides information about the login page & landing page insights.
4 Creating Data Models
This chapter provides information about how to create data models to use in pipelines.
5 Creating Data Sources
This chapter provides information about how to create data sources connectors to use in pipelines.
6 Defining Data Pipelines
This chapter provides information about how to create pipelines for data transformation.
7 Visualization in Quicksight
This chapter provides information about how to create charts, reports, dashboards using AWS Quicksight.
The documents or revised pages are subject to document control.
Keep them up-to-date using the release notices from the distributor of the document.
These are confidential documents. Unauthorized access or copying is prohibited.
Feedback and Suggestions
In submitting any feedback or suggestion, the submitter grants to Tata Consultancy Services Limited (“TCS”) an exclusive, transferable and sub-licensable world-wide, royalty-free license for the legal term of protection of the licensed rights for TCS and any of its direct and indirect majority-owned or controlled subsidiaries (each, a “TCS Entity”) to use, reproduce, represent, communicate, distribute by any means or process (known or as yet unknown) and in any format or media (known or as yet unknown), adapt, arrange, modify and translate such feedback or suggestion.
Subject to valid patent rights, and on condition that the submitter is not identified by them as the source of the relevant feedback or suggestion, TCS and each TCS Entity shall be free to use any such feedback or suggestion without liability or obligation to the submitter in the development, marketing, distribution, supply and performance of TCS and TCS Entities’ products and services.
TCS acknowledges that the submitter only provides feedback and suggestions to TCS “as is”, without warranty of any kind (express or implied).
For feedback, suggestions, and more information about the TCS Connected Intelligence Platform, write an email to: [email protected].
Tata Consultancy Services Use Case Document
TCS Confidential 5
What’s New?
Table 5: What’s New?
Sl. No. Feature/Enhancement Summary Page
Number
1 Retail Recipe development using TCS CIDL & AWS Quicksight
New document Page 1
Tata Consultancy Services Use Case Document
TCS Confidential 6
Contents
1. Getting Started .............................................................................................................................. 12 2. User, Role and Project Management .............................................................................................. 13
2.1. Create User ............................................................................................................................ 14 2.2. Create Project ......................................................................................................................... 14 2.3. Create Role ............................................................................................................................ 18
3. CIDL Dashboard ............................................................................................................................ 20 4. Creating Data Models .................................................................................................................... 22 5. Creating Data Source .................................................................................................................... 27
5.1 Add Data Source .................................................................................................................... 28 5.1.1. Create Data Source for Retail_Transaction_Header ...................................................... 28 5.1.2. Create Data Source for Retail_Transaction_Line_Item .................................................. 32 5.1.3. Create Data Source for Item_Master ............................................................................. 36
6. Defining Data Pipelines .................................................................................................................. 40 6.1. How to create new Pipeline ..................................................................................................... 40 6.2. Retail Recipe Specific Pipelines .............................................................................................. 40
7. Visualization in AWS QuickSight .................................................................................................... 53
Total number of pages in this document (including cover page) is 86.
Tata Consultancy Services Use Case Document
TCS Confidential 7
List of Figures
Figure 1: Login Screen ...................................................................................................................................... 13 Figure 2: Admin Dashboard .............................................................................................................................. 13 Figure 3: Create User Dashboard .................................................................................................................... 14 Figure 4: Project Management – Create Project Menu .................................................................................. 15 Figure 5: Project Management – Create Project Screen ................................................................................ 15 Figure 6: AWS internal IP.................................................................................................................................. 16 Figure 7: Adding HDFS location ....................................................................................................................... 16 Figure 8: AWS internal IP.................................................................................................................................. 17 Figure 9: Adding SFTP storage ........................................................................................................................ 17 Figure 10: Create Project .................................................................................................................................. 17 Figure 11: Create Role ...................................................................................................................................... 18 Figure 12: Add Role........................................................................................................................................... 18 Figure 13: Select User ....................................................................................................................................... 19 Figure 14: Add privileges .................................................................................................................................. 19 Figure 15: Login Page ....................................................................................................................................... 20 Figure 16: CIDL Dashboard Screen ................................................................................................................. 20 Figure 17: DataModel Dashboard .................................................................................................................... 22 Figure 18: Add data model menu ..................................................................................................................... 23 Figure 19: DataModel Creation ........................................................................................................................ 23 Figure 20: Save Data Model Dialog ................................................................................................................. 24 Figure 21: Create Data Model Successful ....................................................................................................... 25 Figure 22: Data Modelling ................................................................................................................................. 25 Figure 23: Data Model template import ............................................................................................................ 26 Figure 24: Data Model Template upload.......................................................................................................... 26 Figure 25: Data Sources Summary Screen ..................................................................................................... 27 Figure 26: Data Source Type Configuration .................................................................................................... 28 Figure 27: Data Source Configuration for Transaction Header – SFTP Server ............................................ 29 Figure 28: Data Source Save Configuration .................................................................................................... 29 Figure 29: Metadata Configuration for Data Source Type – File ................................................................... 30 Figure 30: Import Criteria .................................................................................................................................. 31 Figure 31: Drag & drop / Browse template ...................................................................................................... 31 Figure 32: Attribute properties .......................................................................................................................... 32 Figure 33: Data Source Type Configuration .................................................................................................... 32 Figure 34: Data Source Configuration – SFTP Server ................................................................................... 33 Figure 35: Data Source Save Configuration .................................................................................................... 33 Figure 36: Metadata Configuration for Data Source Type – File ................................................................... 34 Figure 37: Import Criteria .................................................................................................................................. 35 Figure 38: Drag & drop / Browse template ...................................................................................................... 35 Figure 39: Attribute properties .......................................................................................................................... 36 Figure 40: Data Source Type Configuration .................................................................................................... 36 Figure 41: Data Source Configuration for Item Master – SFTP Server ......................................................... 37 Figure 42: Data Source Save Configuration .................................................................................................... 37 Figure 43: Metadata Configuration for Data Source Type – File ................................................................... 38 Figure 44: Import Criteria .................................................................................................................................. 38 Figure 45: Drag & drop / Browse template ...................................................................................................... 39 Figure 46: Attribute properties .......................................................................................................................... 39 Figure 47: Data Source homepage .................................................................................................................. 40 Figure 48: Pipeline Menu .................................................................................................................................. 40 Figure 49: Data Pipeline home page ................................................................................................................ 41
Tata Consultancy Services Use Case Document
TCS Confidential 8
Figure 50: Pipeline – Transaction Header ....................................................................................................... 41 Figure 51: Source File setup – Transaction Header ....................................................................................... 42 Figure 52: Source File properties – Transaction Header ................................................................................ 42 Figure 53: Transformation page – Transaction Header .................................................................................. 43 Figure 54: Mapping page – Transaction Header ............................................................................................. 43 Figure 55: Pipeline – Transaction Line Item .................................................................................................... 44 Figure 56: Source File setup – Transaction Line Item .................................................................................... 44 Figure 57: Source File properties – Transaction Line Item ............................................................................ 45 Figure 58: Transformation Page – Transaction Line Item .............................................................................. 45 Figure 59: Mapping page – Transaction Line Item.......................................................................................... 45 Figure 60: Pipeline – Item Master .................................................................................................................... 46 Figure 61: Source File setup – Item Master .................................................................................................... 46 Figure 62: Source File properties – Item Master ............................................................................................. 47 Figure 63: Transformation page – Item Master ............................................................................................... 47 Figure 64: Mapping page – Item Master .......................................................................................................... 48 Figure 65: Pipeline to join & transform all input files ....................................................................................... 48 Figure 66: Source file setup for three input tables .......................................................................................... 49 Figure 67: Source file properties – Transaction header table ........................................................................ 49 Figure 68: Source file properties – Transaction Line Item table .................................................................... 49 Figure 69: Source file properties – Item Master table ..................................................................................... 50 Figure 70: Join of all 3 tables ............................................................................................................................ 50 Figure 71: Transformation of selected attributes of all 3 tables ..................................................................... 51 Figure 72: Mapping of selected attributes to target table ............................................................................... 51 Figure 73: Source table setup........................................................................................................................... 51 Figure 74: Source table properties ................................................................................................................... 52 Figure 75: Mapping of attributes to PostgreSql table ...................................................................................... 52 Figure 76: Mapping of attributes to PostgreSql table ...................................................................................... 53 Figure 77: QuickSight Landing Page ............................................................................................................... 54 Figure 78: QuickSight Landing Page ............................................................................................................... 54 Figure 79: QuickSight Dataset selection Page ................................................................................................ 55 Figure 80: QuickSight PostgreSQL Data Set .................................................................................................. 55 Figure 81: QuickSight PostgreSQL Data Source Configuration..................................................................... 56 Figure 82: QuickSight PostgreSQL Select Schema ........................................................................................ 57 Figure 83: Selecting Desired Table .................................................................................................................. 57 Figure 84: Data Set Creation in Quicksight ..................................................................................................... 58 Figure 85: Add Visual screen ............................................................................................................................ 58 Figure 86: Data Set Creation ............................................................................................................................ 59 Figure 87: Visual Types .................................................................................................................................... 59 Figure 88: Visual Types .................................................................................................................................... 59 Figure 89: Output ............................................................................................................................................... 60 Figure 90: Create Data source in QuickSight .................................................................................................. 61 Figure 91: QuickSight PostgreSQL Select Schema ........................................................................................ 62 Figure 92: Selecting Desired Table .................................................................................................................. 62 Figure 93: Data Set Creation ............................................................................................................................ 62 Figure 94: Custom Query Screen ..................................................................................................................... 63 Figure 95: Dashboard ........................................................................................................................................ 64 Figure 96: Total Sales ....................................................................................................................................... 65 Figure 97: Select KPI ........................................................................................................................................ 65 Figure 98: Formatting the chart ........................................................................................................................ 66 Figure 99: Average Item Price .......................................................................................................................... 67 Figure 100: Select KPI ...................................................................................................................................... 67 Figure 101: Formatting ...................................................................................................................................... 68 Figure 102: Unit Sold ......................................................................................................................................... 69
Tata Consultancy Services Use Case Document
TCS Confidential 9
Figure 103: Unit Sold KPI.................................................................................................................................. 69 Figure 104: Unit Sold Chart .............................................................................................................................. 70 Figure 105: Average Items per Transaction .................................................................................................... 70 Figure 106: Query Screen ................................................................................................................................. 71 Figure 107: Select KPI ...................................................................................................................................... 71 Figure 108: Formatting ...................................................................................................................................... 72 Figure 109: Sales Comparison by Store ......................................................................................................... 72 Figure 110: Select chart type ........................................................................................................................... 73 Figure 111: Sales Comparison by Store ......................................................................................................... 73 Figure 112: Sales Comparison by Store – total_ln_item_amt formatting ..................................................... 74 Figure 113: Sales Comparison by Store– item_qty formatting...................................................................... 74 Figure 114: Items Returned by Store .............................................................................................................. 75 Figure 115: Items Returned by Store – Select chart type.............................................................................. 75 Figure 116: Items Returned by Store – item_qty formatting.......................................................................... 76 Figure 117: Items Returned by Store .............................................................................................................. 76 Figure 118: Sales by Product Category .......................................................................................................... 77 Figure 119: Sales by Product Category – All Sections .................................................................................. 78 Figure 120: Sales by Product Category ........................................................................................................... 78 Figure 121: Units Sold by Product Category ................................................................................................... 79 Figure 122: Units Sold by Product Category ................................................................................................... 79 Figure 123: Unit Sold By Product Category ..................................................................................................... 80 Figure 124: Unit Sold by Product Category – item_qty formatting ................................................................. 80 Figure 125: Sales Trend Analysis .................................................................................................................... 81 Figure 126: Sales Trend Analysis – Formatting .............................................................................................. 82 Figure 127: Sales Trend Analysis – Formatting .............................................................................................. 82 Figure 128: Sales Trend Analysis – Formatting .............................................................................................. 83 Figure 129: Sales Trend Analysis - Output ..................................................................................................... 83
Tata Consultancy Services Use Case Document
TCS Confidential 10
List of Tables
Table 1: Document Details .................................................................................................................................. 3 Table 2: Prerequisites ......................................................................................................................................... 3 Table 3: Typographical Conventions .................................................................................................................. 3 Table 4: Organization of the Chapters ............................................................................................................... 4 Table 5: What’s New? ......................................................................................................................................... 5 Table 6: Abbreviation & Expanded Form ......................................................................................................... 11 Table 7: Configure Data model ......................................................................................................................... 23 Table 8: Appendix – Data model & metadata templates ................................................................................ 84
Tata Consultancy Services Use Case Document
TCS Confidential 11
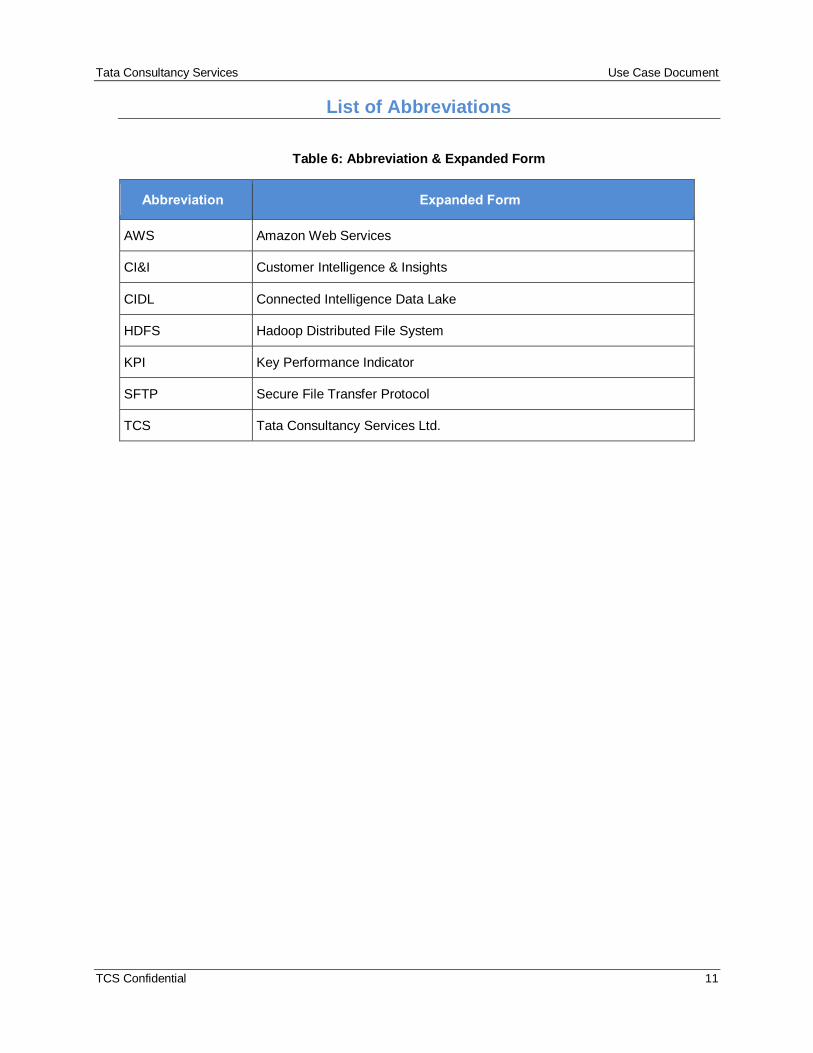
List of Abbreviations
Table 6: Abbreviation & Expanded Form
Abbreviation Expanded Form
AWS Amazon Web Services
CI&I Customer Intelligence & Insights
CIDL Connected Intelligence Data Lake
HDFS Hadoop Distributed File System
KPI Key Performance Indicator
SFTP Secure File Transfer Protocol
TCS Tata Consultancy Services Ltd.
Tata Consultancy Services Use Case Document
TCS Confidential 12
1. Getting Started
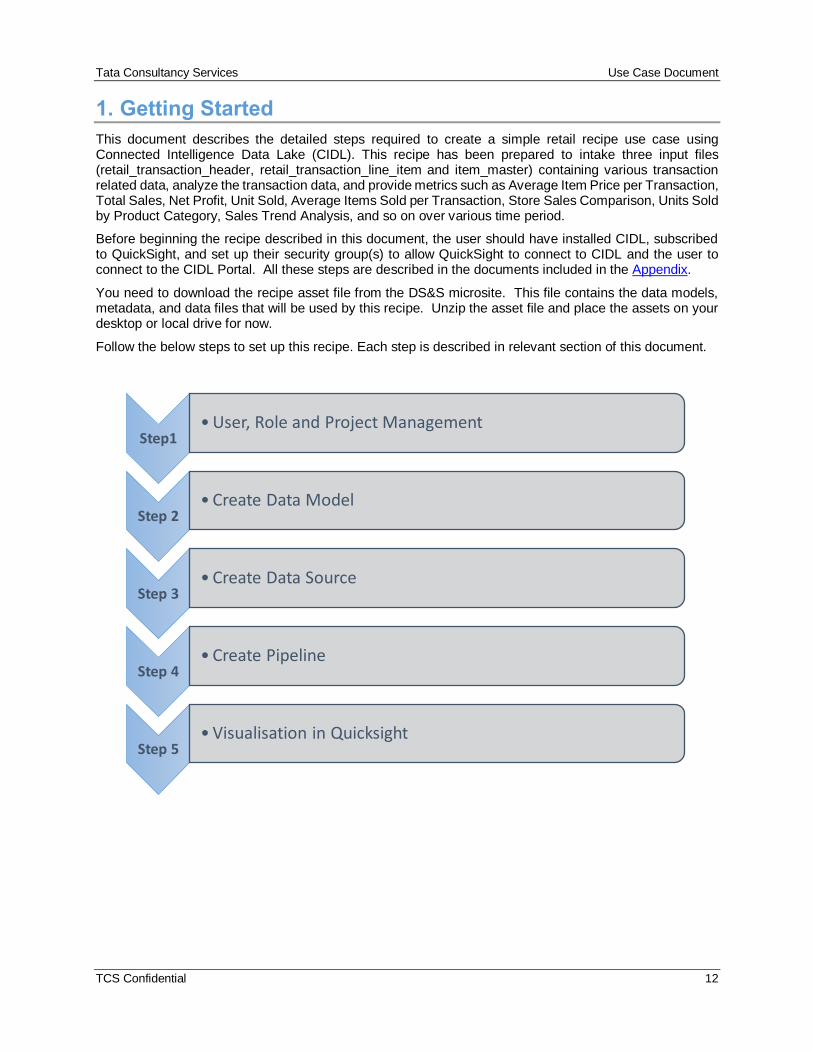
This document describes the detailed steps required to create a simple retail recipe use case using Connected Intelligence Data Lake (CIDL). This recipe has been prepared to intake three input files (retail_transaction_header, retail_transaction_line_item and item_master) containing various transaction related data, analyze the transaction data, and provide metrics such as Average Item Price per Transaction, Total Sales, Net Profit, Unit Sold, Average Items Sold per Transaction, Store Sales Comparison, Units Sold by Product Category, Sales Trend Analysis, and so on over various time period.
Before beginning the recipe described in this document, the user should have installed CIDL, subscribed to QuickSight, and set up their security group(s) to allow QuickSight to connect to CIDL and the user to connect to the CIDL Portal. All these steps are described in the documents included in the Appendix.
You need to download the recipe asset file from the DS&S microsite. This file contains the data models, metadata, and data files that will be used by this recipe. Unzip the asset file and place the assets on your desktop or local drive for now.
Follow the below steps to set up this recipe. Each step is described in relevant section of this document.
Step1•User, Role and Project Management
Step 2•Create Data Model
Step 3•Create Data Source
Step 4•Create Pipeline
Step 5•Visualisation in Quicksight
Tata Consultancy Services Use Case Document
TCS Confidential 13
2. User, Role and Project Management
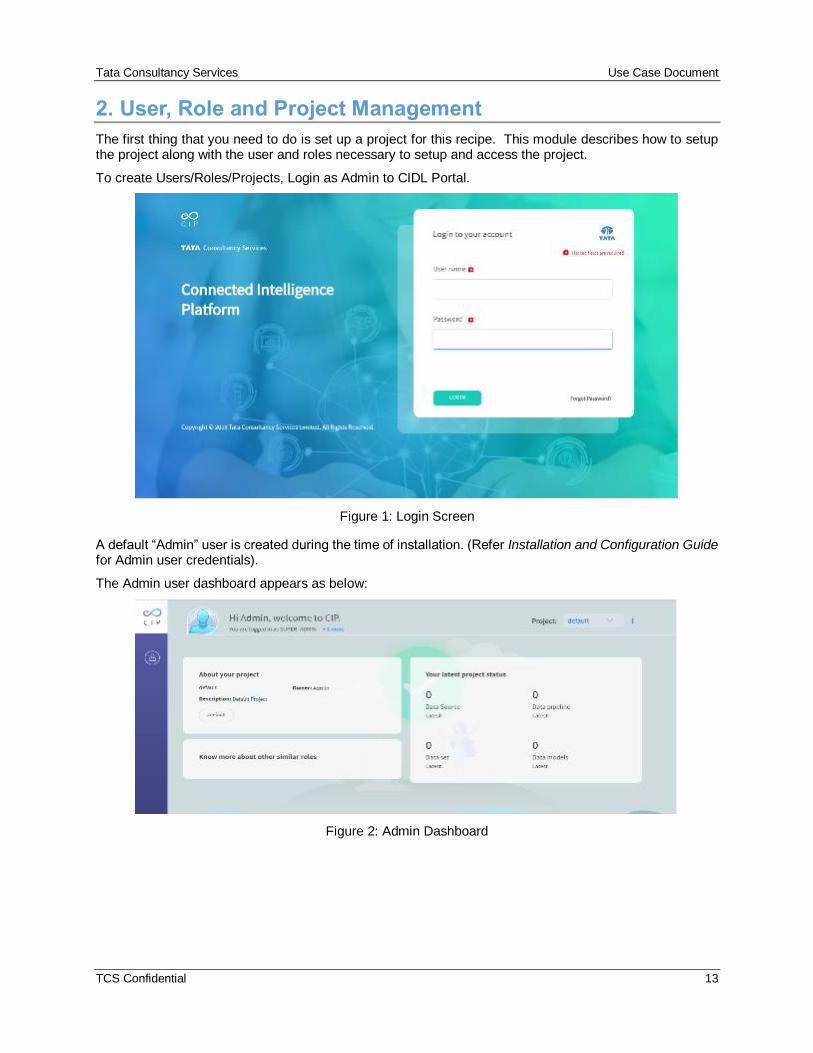
The first thing that you need to do is set up a project for this recipe. This module describes how to setup the project along with the user and roles necessary to setup and access the project.
To create Users/Roles/Projects, Login as Admin to CIDL Portal.
Figure 1: Login Screen
A default “Admin” user is created during the time of installation. (Refer Installation and Configuration Guide for Admin user credentials).
The Admin user dashboard appears as below:
Figure 2: Admin Dashboard
Tata Consultancy Services Use Case Document
TCS Confidential 14
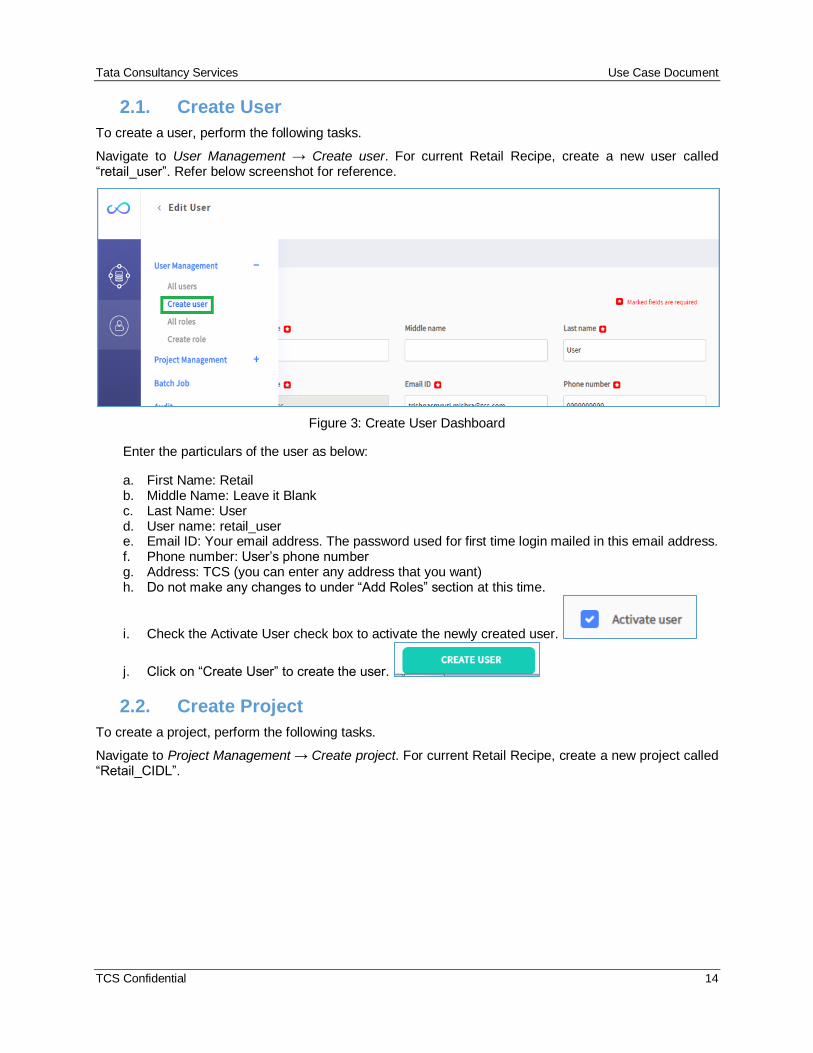
2.1. Create User
To create a user, perform the following tasks.
Navigate to User Management → Create user. For current Retail Recipe, create a new user called “retail_user”. Refer below screenshot for reference.
Figure 3: Create User Dashboard
Enter the particulars of the user as below:
a. First Name: Retail b. Middle Name: Leave it Blank c. Last Name: User d. User name: retail_user e. Email ID: Your email address. The password used for first time login mailed in this email address. f. Phone number: User’s phone number g. Address: TCS (you can enter any address that you want) h. Do not make any changes to under “Add Roles” section at this time.
i. Check the Activate User check box to activate the newly created user.
j. Click on “Create User” to create the user.
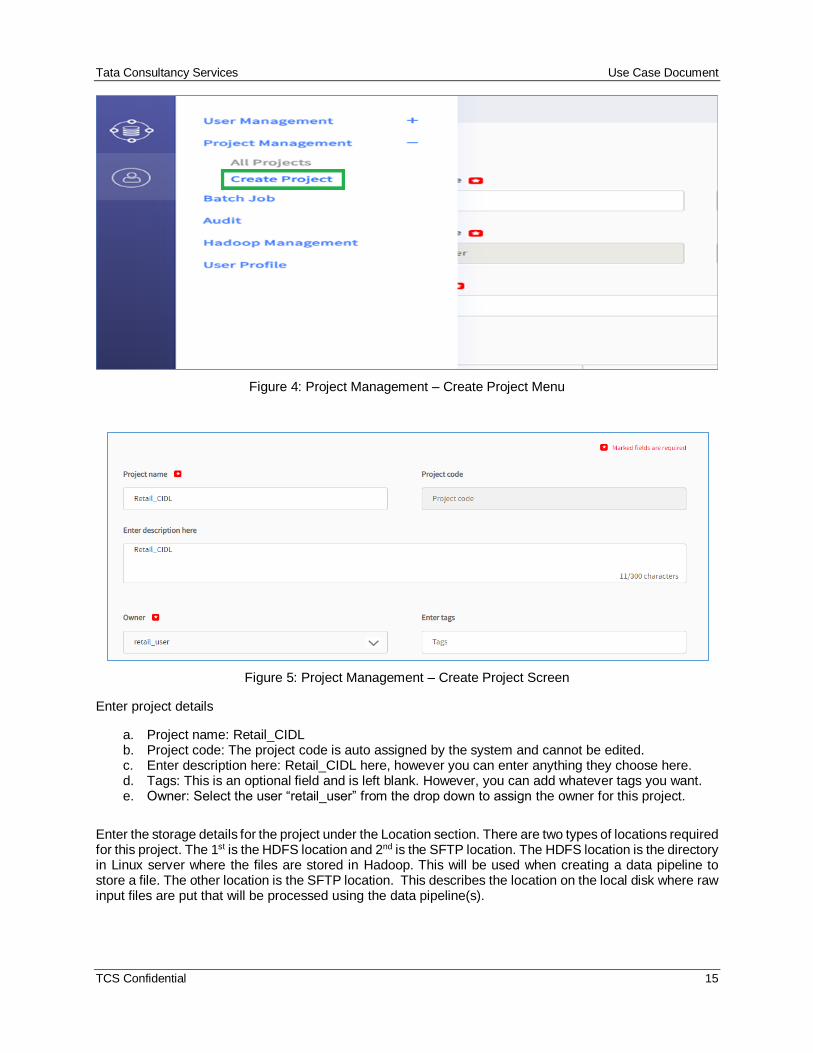
2.2. Create Project
To create a project, perform the following tasks.
Navigate to Project Management → Create project. For current Retail Recipe, create a new project called “Retail_CIDL”.
Tata Consultancy Services Use Case Document
TCS Confidential 15
Figure 4: Project Management – Create Project Menu
Figure 5: Project Management – Create Project Screen
Enter project details
a. Project name: Retail_CIDL b. Project code: The project code is auto assigned by the system and cannot be edited. c. Enter description here: Retail_CIDL here, however you can enter anything they choose here. d. Tags: This is an optional field and is left blank. However, you can add whatever tags you want. e. Owner: Select the user “retail_user” from the drop down to assign the owner for this project.
Enter the storage details for the project under the Location section. There are two types of locations required for this project. The 1st is the HDFS location and 2nd is the SFTP location. The HDFS location is the directory in Linux server where the files are stored in Hadoop. This will be used when creating a data pipeline to store a file. The other location is the SFTP location. This describes the location on the local disk where raw input files are put that will be processed using the data pipeline(s).
Tata Consultancy Services Use Case Document
TCS Confidential 16
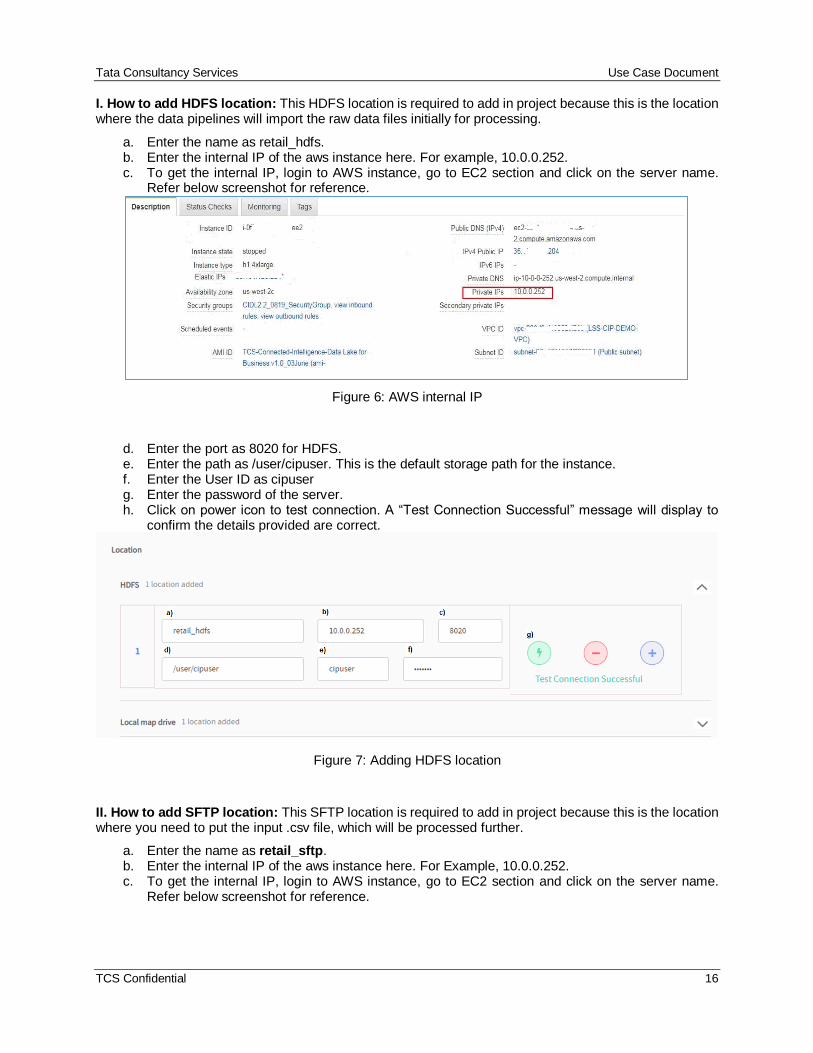
I. How to add HDFS location: This HDFS location is required to add in project because this is the location where the data pipelines will import the raw data files initially for processing.
a. Enter the name as retail_hdfs. b. Enter the internal IP of the aws instance here. For example, 10.0.0.252. c. To get the internal IP, login to AWS instance, go to EC2 section and click on the server name.
Refer below screenshot for reference.
Figure 6: AWS internal IP
d. Enter the port as 8020 for HDFS. e. Enter the path as /user/cipuser. This is the default storage path for the instance. f. Enter the User ID as cipuser g. Enter the password of the server. h. Click on power icon to test connection. A “Test Connection Successful” message will display to
confirm the details provided are correct.
Figure 7: Adding HDFS location
II. How to add SFTP location: This SFTP location is required to add in project because this is the location where you need to put the input .csv file, which will be processed further.
a. Enter the name as retail_sftp. b. Enter the internal IP of the aws instance here. For Example, 10.0.0.252. c. To get the internal IP, login to AWS instance, go to EC2 section and click on the server name.
Refer below screenshot for reference.
Tata Consultancy Services Use Case Document
TCS Confidential 17
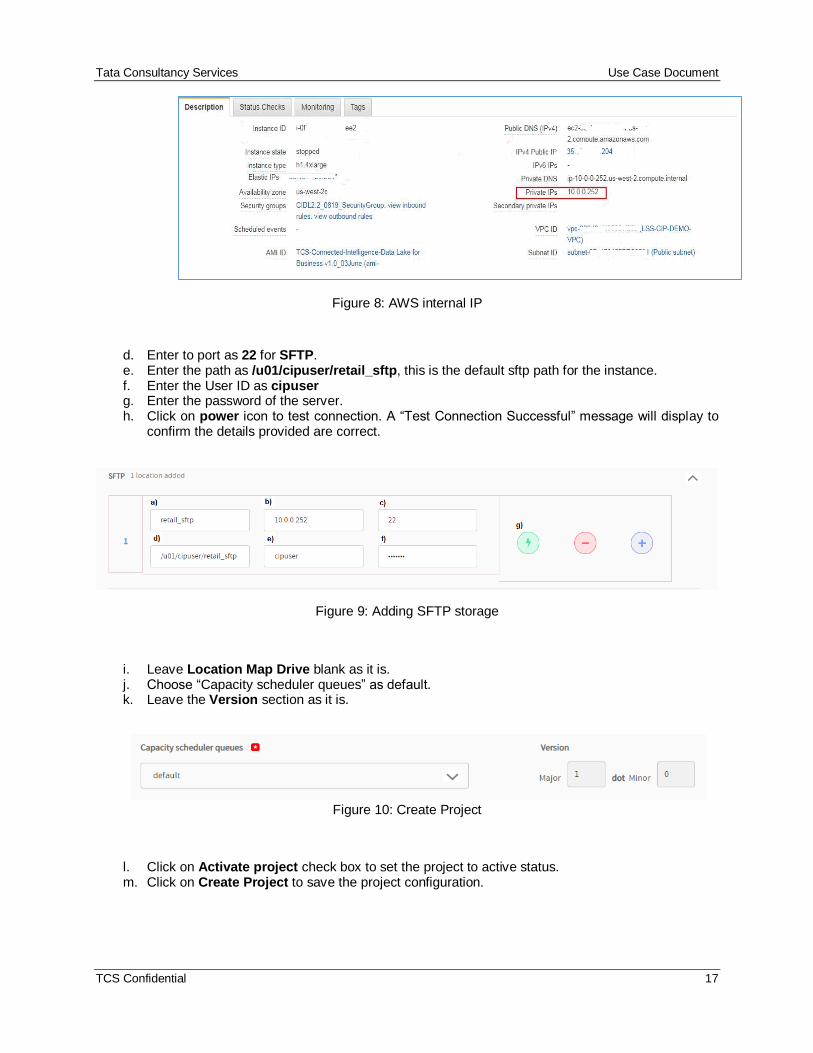
Figure 8: AWS internal IP
d. Enter to port as 22 for SFTP. e. Enter the path as /u01/cipuser/retail_sftp, this is the default sftp path for the instance. f. Enter the User ID as cipuser g. Enter the password of the server. h. Click on power icon to test connection. A “Test Connection Successful” message will display to
confirm the details provided are correct.
Figure 9: Adding SFTP storage
i. Leave Location Map Drive blank as it is. j. Choose “Capacity scheduler queues” as default. k. Leave the Version section as it is.
Figure 10: Create Project
l. Click on Activate project check box to set the project to active status. m. Click on Create Project to save the project configuration.
Tata Consultancy Services Use Case Document
TCS Confidential 18
Once the project is created successfully, you will be redirected to All Projects page with a message informing you that the project was created successfully, and the newly created project will be displayed on the dashboard.
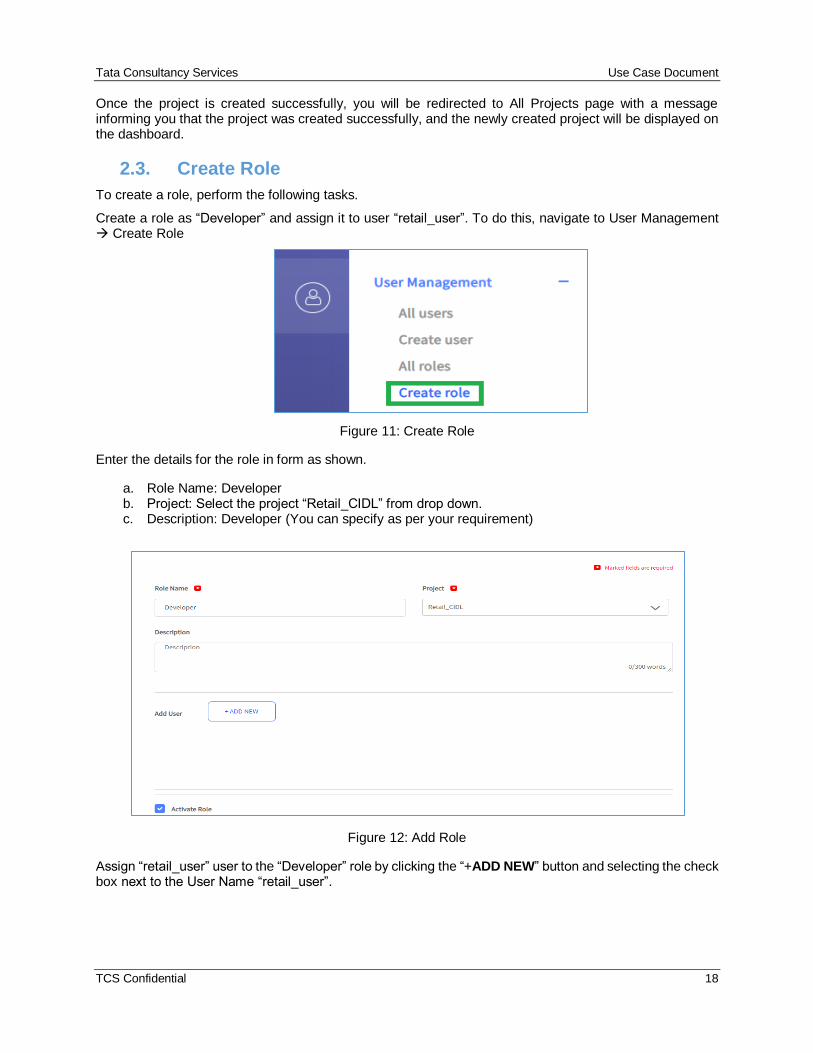
2.3. Create Role
To create a role, perform the following tasks.
Create a role as “Developer” and assign it to user “retail_user”. To do this, navigate to User Management → Create Role
Figure 11: Create Role
Enter the details for the role in form as shown.
a. Role Name: Developer b. Project: Select the project “Retail_CIDL” from drop down. c. Description: Developer (You can specify as per your requirement)
Figure 12: Add Role
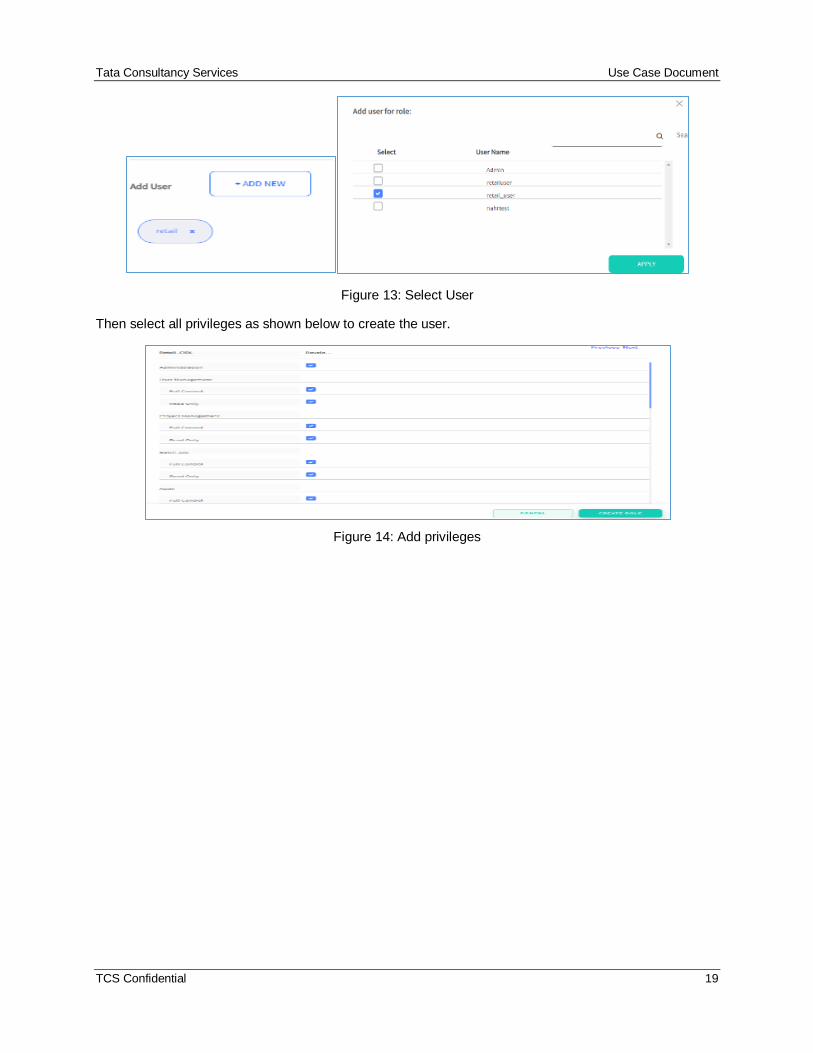
Assign “retail_user” user to the “Developer” role by clicking the “+ADD NEW” button and selecting the check box next to the User Name “retail_user”.
Tata Consultancy Services Use Case Document
TCS Confidential 19
Figure 13: Select User
Then select all privileges as shown below to create the user.
Figure 14: Add privileges
Tata Consultancy Services Use Case Document
TCS Confidential 20
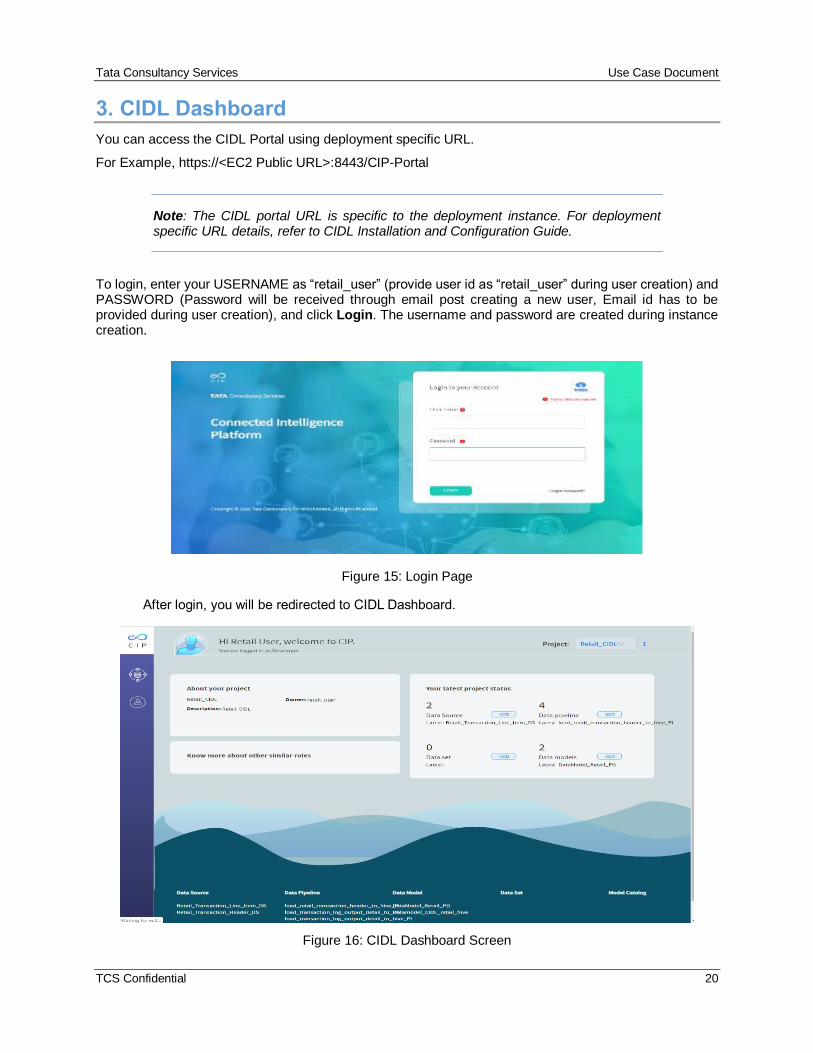
3. CIDL Dashboard
You can access the CIDL Portal using deployment specific URL.
For Example, https://<EC2 Public URL>:8443/CIP-Portal
Note: The CIDL portal URL is specific to the deployment instance. For deployment specific URL details, refer to CIDL Installation and Configuration Guide.
To login, enter your USERNAME as “retail_user” (provide user id as “retail_user” during user creation) and PASSWORD (Password will be received through email post creating a new user, Email id has to be provided during user creation), and click Login. The username and password are created during instance creation.
Figure 15: Login Page
After login, you will be redirected to CIDL Dashboard.
Figure 16: CIDL Dashboard Screen
Tata Consultancy Services Use Case Document
TCS Confidential 21
The Dashboard screen gives a quick view of the items in various modules in the system.
User Name and Role: The current logged in user and role in the project is displayed.
Project: The current project being worked on. You can select the project to work on from the drop-down list
(list depends on role access permissions).
Data Sources: The list of latest created data sources in the system.
Data Pipeline: The list of latest created data pipelines in the system.
Data Model: The list of latest data models imported or instantiated in the system.
Tata Consultancy Services Use Case Document
TCS Confidential 22
4. Creating Data Models
The Data Models module provides you with the capability to define the structure (metadata) of the various data stores in the system. Data Models are used to define the schema, entities and attributes in databases like Hive and PostgreSQL.
Data model templates are designed to create the schema, entities and attributes in the database. As a part of this process, you need to provide parameters such as server IP, listening Port, database schema name and credentials to connect to the database server. For this recipe, we will create two data models, one for Hive and one for PostgreSQL.
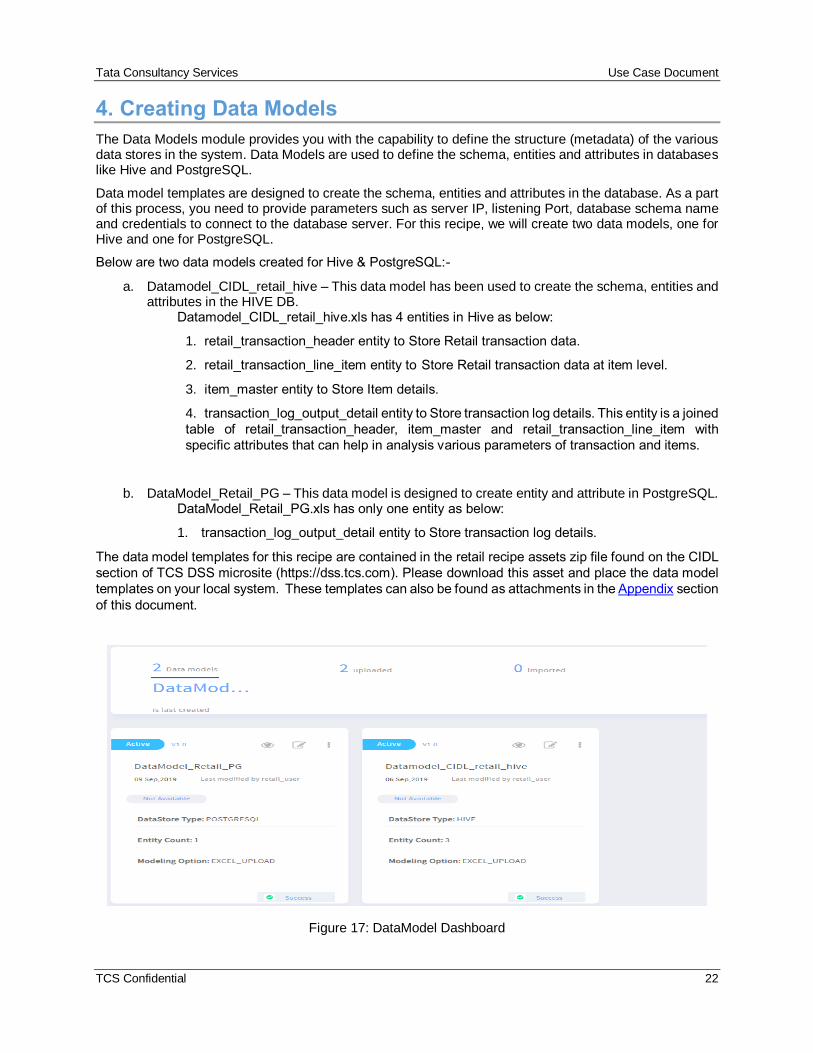
Below are two data models created for Hive & PostgreSQL:-
a. Datamodel_CIDL_retail_hive – This data model has been used to create the schema, entities and attributes in the HIVE DB.
Datamodel_CIDL_retail_hive.xls has 4 entities in Hive as below:
1. retail_transaction_header entity to Store Retail transaction data.
2. retail_transaction_line_item entity to Store Retail transaction data at item level.
3. item_master entity to Store Item details.
4. transaction_log_output_detail entity to Store transaction log details. This entity is a joined
table of retail_transaction_header, item_master and retail_transaction_line_item with
specific attributes that can help in analysis various parameters of transaction and items.
b. DataModel_Retail_PG – This data model is designed to create entity and attribute in PostgreSQL. DataModel_Retail_PG.xls has only one entity as below:
1. transaction_log_output_detail entity to Store transaction log details.
The data model templates for this recipe are contained in the retail recipe assets zip file found on the CIDL
section of TCS DSS microsite (https://dss.tcs.com). Please download this asset and place the data model
templates on your local system. These templates can also be found as attachments in the Appendix section
of this document.
Figure 17: DataModel Dashboard
Tata Consultancy Services Use Case Document
TCS Confidential 23
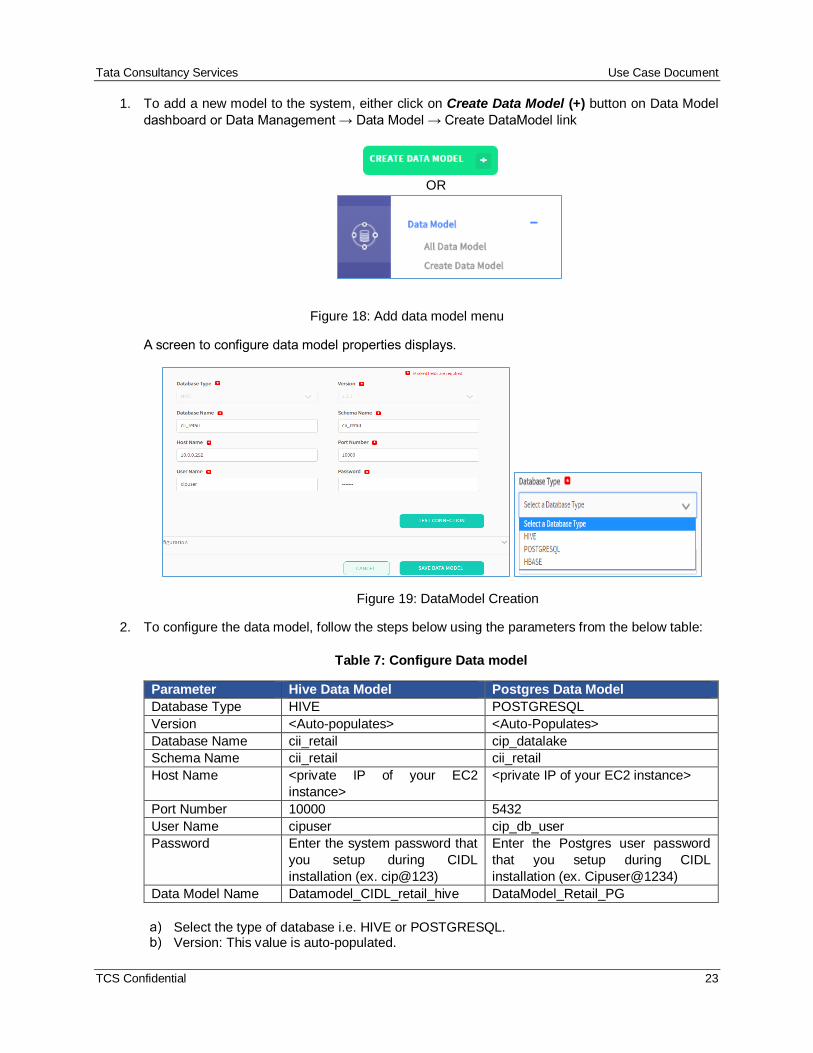
1. To add a new model to the system, either click on Create Data Model (+) button on Data Model
dashboard or Data Management → Data Model → Create DataModel link
OR
Figure 18: Add data model menu
A screen to configure data model properties displays.
Figure 19: DataModel Creation
2. To configure the data model, follow the steps below using the parameters from the below table:
Table 7: Configure Data model
Parameter Hive Data Model Postgres Data Model
Database Type HIVE POSTGRESQL
Version <Auto-populates> <Auto-Populates>
Database Name cii_retail cip_datalake
Schema Name cii_retail cii_retail
Host Name <private IP of your EC2
instance>
<private IP of your EC2 instance>
Port Number 10000 5432
User Name cipuser cip_db_user
Password Enter the system password that
you setup during CIDL
installation (ex. cip@123)
Enter the Postgres user password
that you setup during CIDL
installation (ex. Cipuser@1234)
Data Model Name Datamodel_CIDL_retail_hive DataModel_Retail_PG
Select the type of database i.e. HIVE or POSTGRESQL. Version: This value is auto-populated.
Tata Consultancy Services Use Case Document
TCS Confidential 24
Database Name: Enter the Database Name. Schema Name: Enter the Schema Name (the schema name will auto-populate for Hive). Host Name: Enter the private IP of the EC2 instance.
Port No: Enter the appropriate Port Number. User Name: Enter the User Name. Password: Enter the Password.
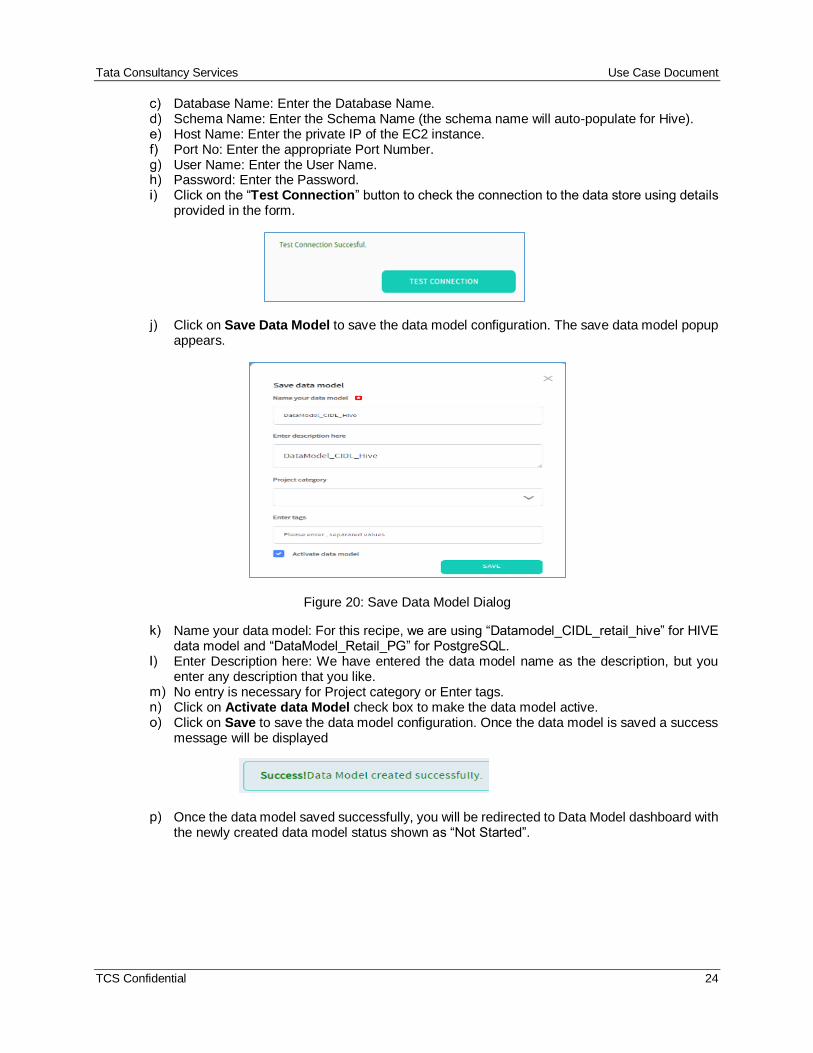
Click on the “Test Connection” button to check the connection to the data store using details provided in the form.
Click on Save Data Model to save the data model configuration. The save data model popup appears.
Figure 20: Save Data Model Dialog
Name your data model: For this recipe, we are using “Datamodel_CIDL_retail_hive” for HIVE data model and “DataModel_Retail_PG” for PostgreSQL.
Enter Description here: We have entered the data model name as the description, but you enter any description that you like.
No entry is necessary for Project category or Enter tags. Click on Activate data Model check box to make the data model active. Click on Save to save the data model configuration. Once the data model is saved a success
message will be displayed
Once the data model saved successfully, you will be redirected to Data Model dashboard with the newly created data model status shown as “Not Started”.
Tata Consultancy Services Use Case Document
TCS Confidential 25
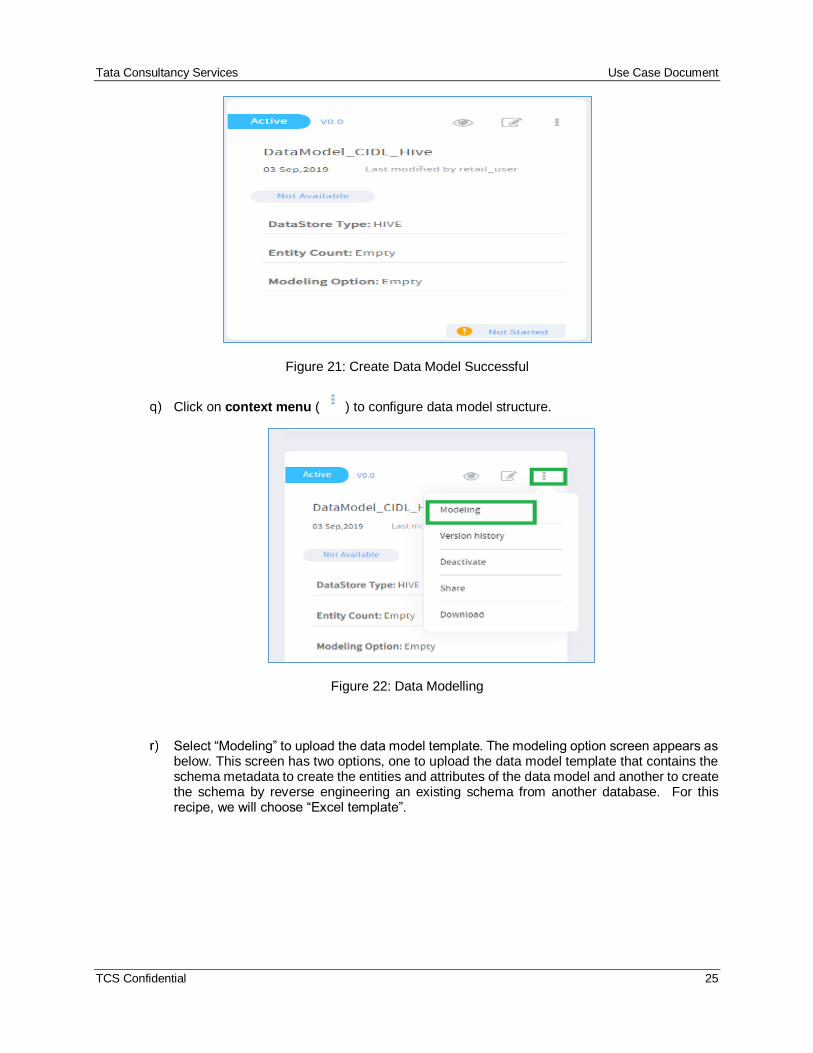
Figure 21: Create Data Model Successful
Click on context menu ( ) to configure data model structure.
Figure 22: Data Modelling
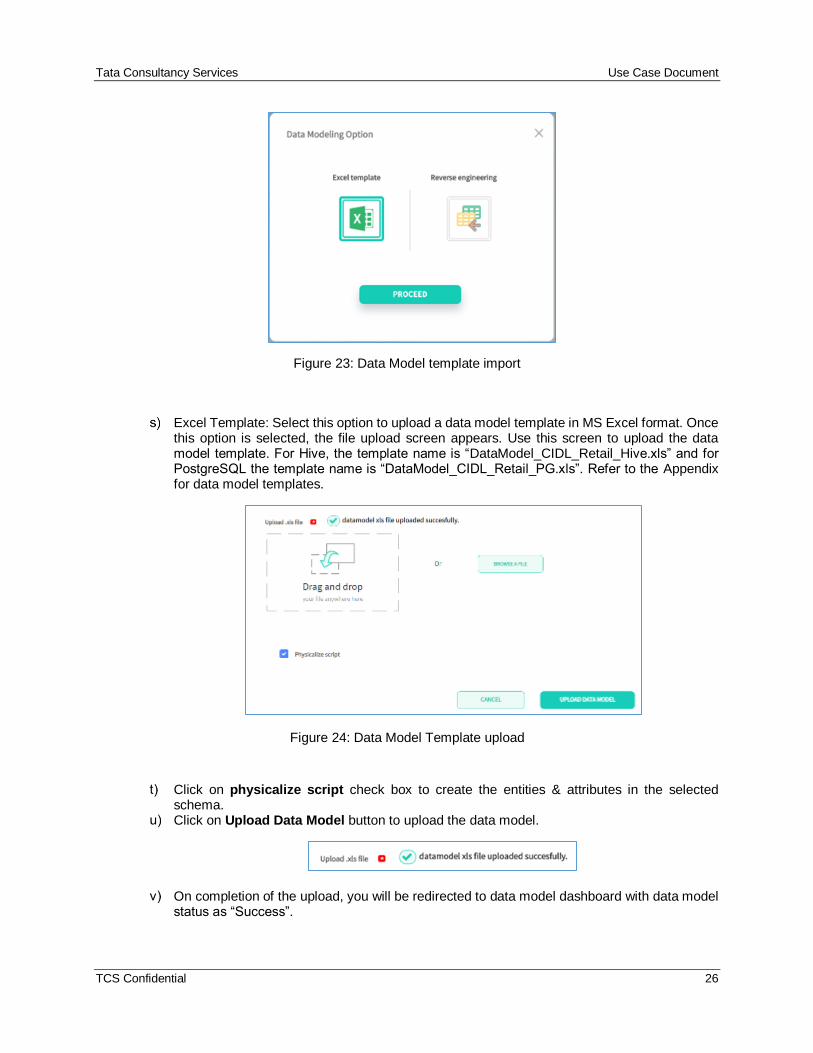
Select “Modeling” to upload the data model template. The modeling option screen appears as below. This screen has two options, one to upload the data model template that contains the schema metadata to create the entities and attributes of the data model and another to create the schema by reverse engineering an existing schema from another database. For this recipe, we will choose “Excel template”.
Tata Consultancy Services Use Case Document
TCS Confidential 26
Figure 23: Data Model template import
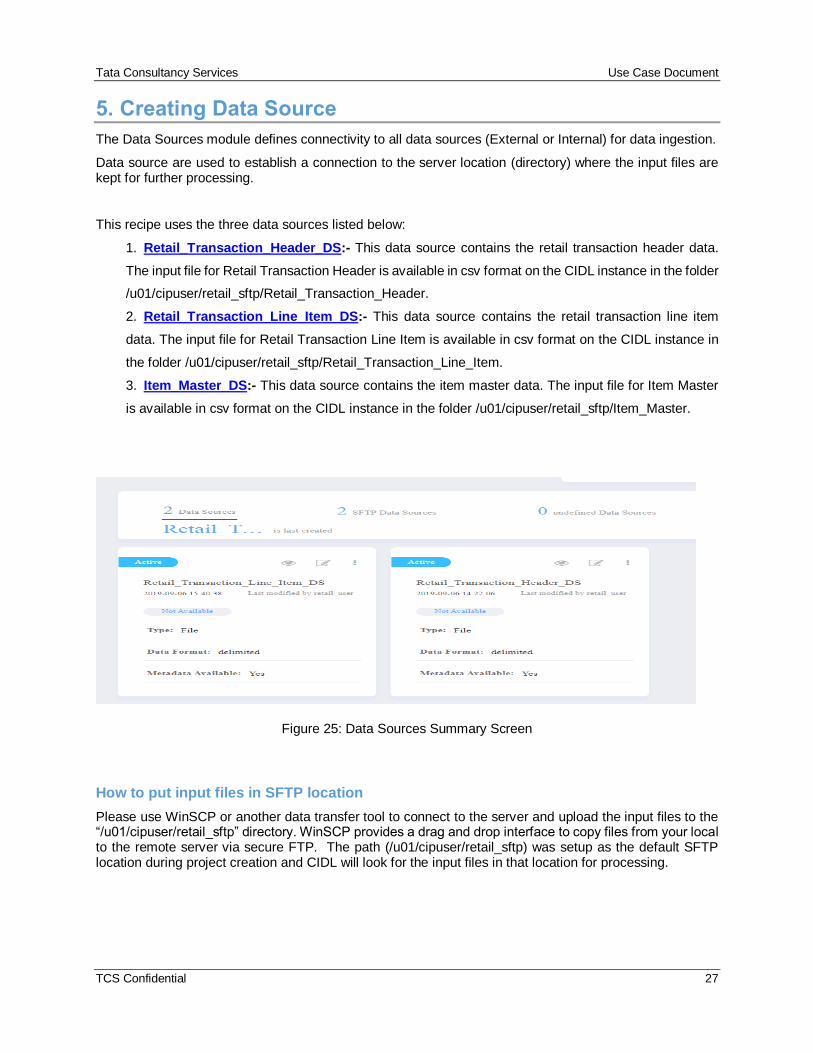
Excel Template: Select this option to upload a data model template in MS Excel format. Once this option is selected, the file upload screen appears. Use this screen to upload the data model template. For Hive, the template name is “DataModel_CIDL_Retail_Hive.xls” and for PostgreSQL the template name is “DataModel_CIDL_Retail_PG.xls”. Refer to the Appendix for data model templates.
Figure 24: Data Model Template upload
Click on physicalize script check box to create the entities & attributes in the selected schema.
Click on Upload Data Model button to upload the data model.
On completion of the upload, you will be redirected to data model dashboard with data model status as “Success”.
Tata Consultancy Services Use Case Document
TCS Confidential 27
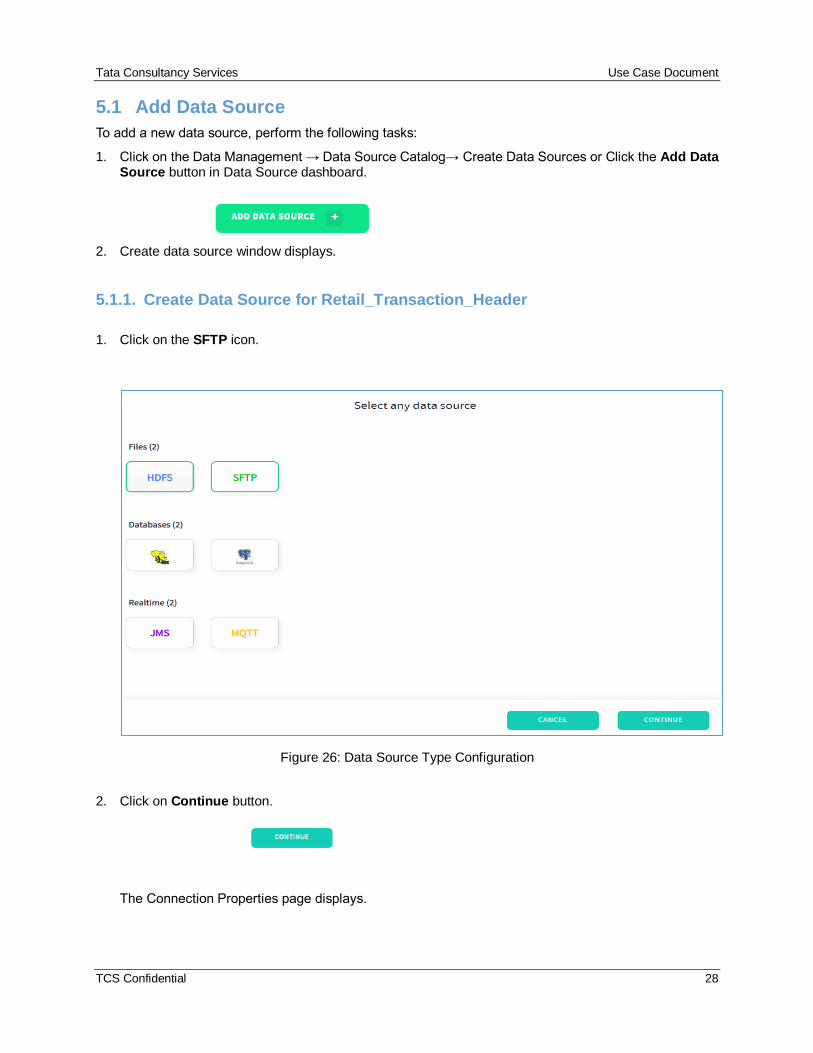
5. Creating Data Source
The Data Sources module defines connectivity to all data sources (External or Internal) for data ingestion.
Data source are used to establish a connection to the server location (directory) where the input files are kept for further processing.
This recipe uses the three data sources listed below:
1. Retail_Transaction_Header_DS:- This data source contains the retail transaction header data.
The input file for Retail Transaction Header is available in csv format on the CIDL instance in the folder
/u01/cipuser/retail_sftp/Retail_Transaction_Header.
2. Retail_Transaction_Line_Item_DS:- This data source contains the retail transaction line item
data. The input file for Retail Transaction Line Item is available in csv format on the CIDL instance in
the folder /u01/cipuser/retail_sftp/Retail_Transaction_Line_Item.
3. Item_Master_DS:- This data source contains the item master data. The input file for Item Master
is available in csv format on the CIDL instance in the folder /u01/cipuser/retail_sftp/Item_Master.
Figure 25: Data Sources Summary Screen
How to put input files in SFTP location
Please use WinSCP or another data transfer tool to connect to the server and upload the input files to the “/u01/cipuser/retail_sftp” directory. WinSCP provides a drag and drop interface to copy files from your local to the remote server via secure FTP. The path (/u01/cipuser/retail_sftp) was setup as the default SFTP location during project creation and CIDL will look for the input files in that location for processing.
Tata Consultancy Services Use Case Document
TCS Confidential 28
5.1 Add Data Source
To add a new data source, perform the following tasks:
1. Click on the Data Management → Data Source Catalog→ Create Data Sources or Click the Add Data Source button in Data Source dashboard.
2. Create data source window displays.
5.1.1. Create Data Source for Retail_Transaction_Header
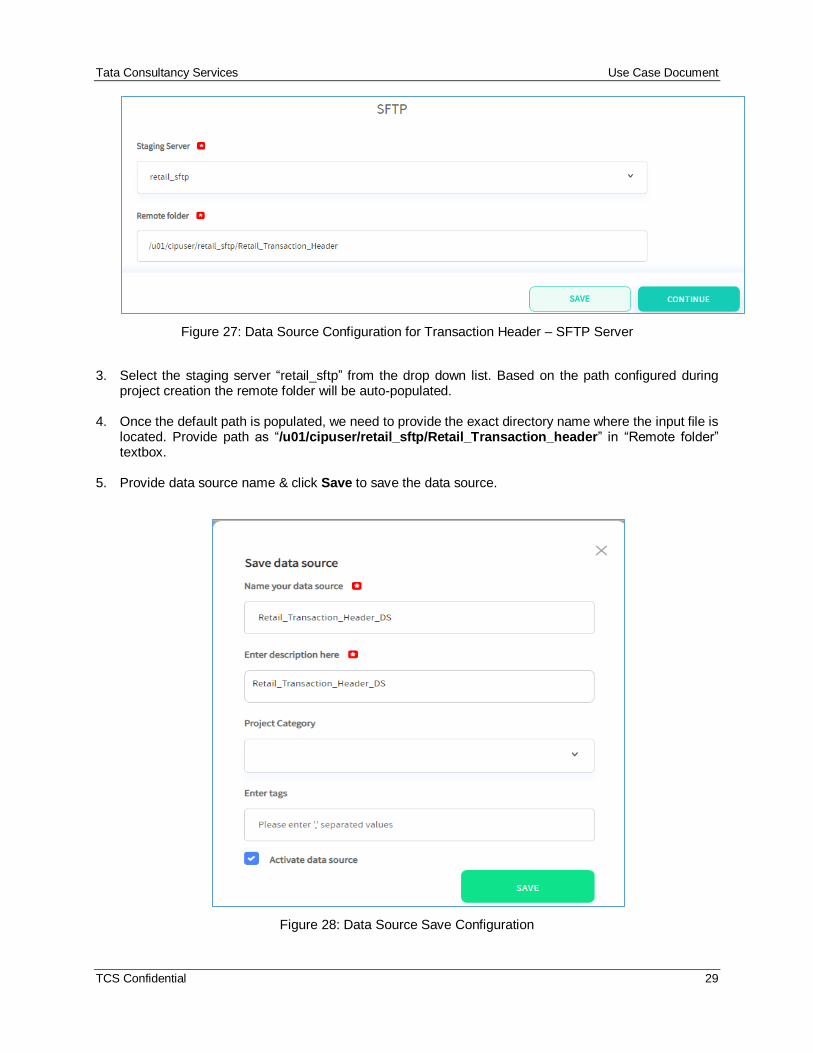
1. Click on the SFTP icon.
Figure 26: Data Source Type Configuration
2. Click on Continue button.
The Connection Properties page displays.
Tata Consultancy Services Use Case Document
TCS Confidential 29
Figure 27: Data Source Configuration for Transaction Header – SFTP Server
3. Select the staging server “retail_sftp” from the drop down list. Based on the path configured during
project creation the remote folder will be auto-populated.
4. Once the default path is populated, we need to provide the exact directory name where the input file is located. Provide path as “/u01/cipuser/retail_sftp/Retail_Transaction_header” in “Remote folder” textbox.
5. Provide data source name & click Save to save the data source.
Figure 28: Data Source Save Configuration
Tata Consultancy Services Use Case Document
TCS Confidential 30
a) Enter the name as “Retail_Transaction_Header_DS” for this data source.
b) Enter description here: Enter data source name as description for the data source.
c) Project category and Tags: You may leave them blank.
d) Click on Activate data source check box to make the data source Active.
e) Click on Save to save the data source configuration.
Import Metadata for Data Source Retail_Transaction_Header
To import metadata for data source, perform the following tasks.
1. Create the metadata file from the input data files and save it in csv format. The metadata file will contain only the attributes name or header separated by comma.
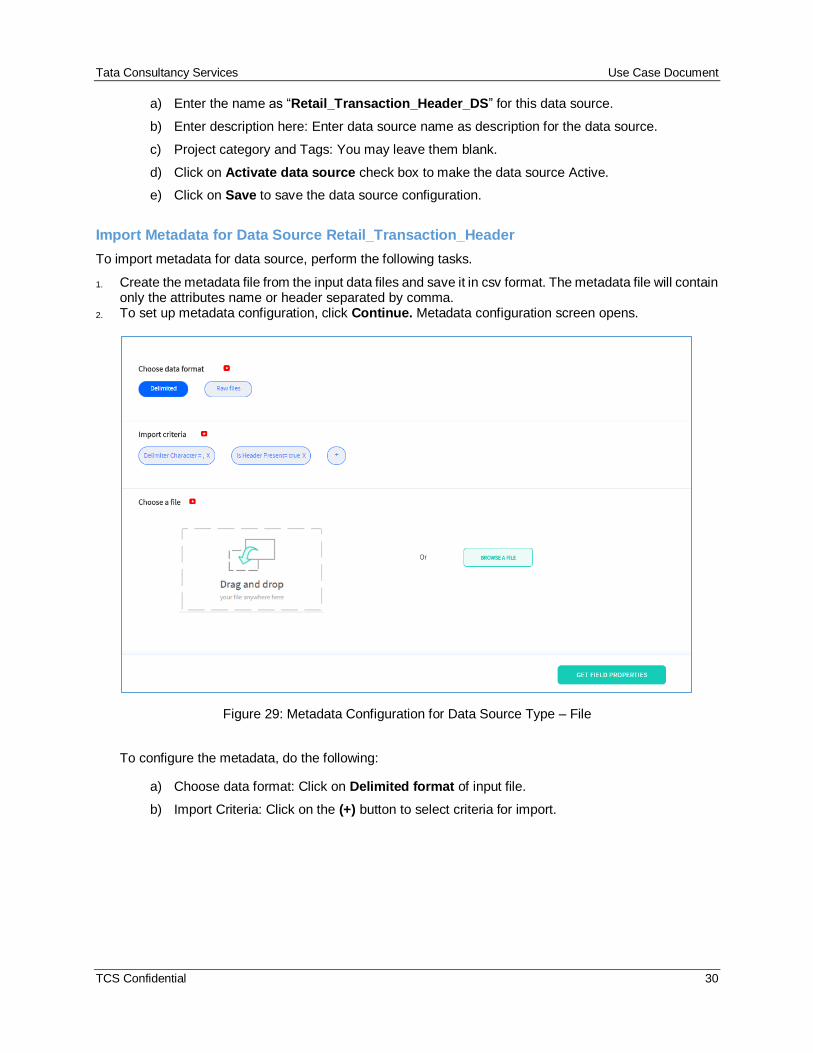
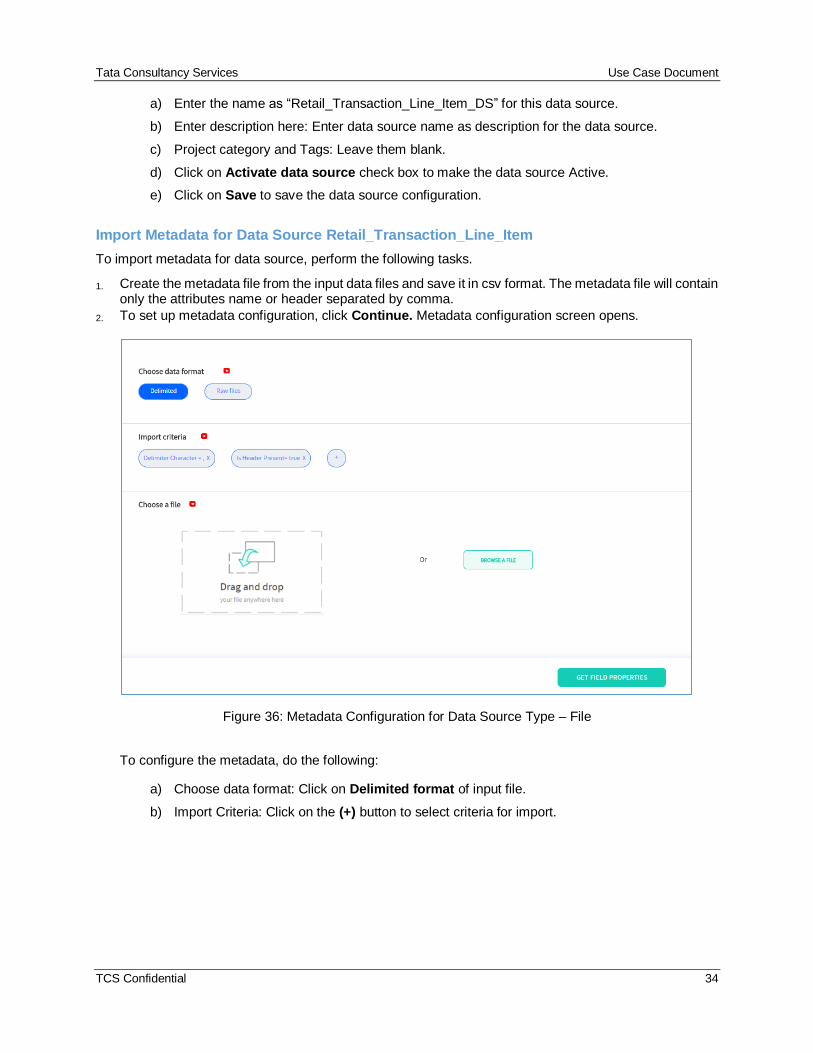
2. To set up metadata configuration, click Continue. Metadata configuration screen opens.
Figure 29: Metadata Configuration for Data Source Type – File
To configure the metadata, do the following:
a) Choose data format: Click on Delimited format of input file.
b) Import Criteria: Click on the (+) button to select criteria for import.
Tata Consultancy Services Use Case Document
TCS Confidential 31
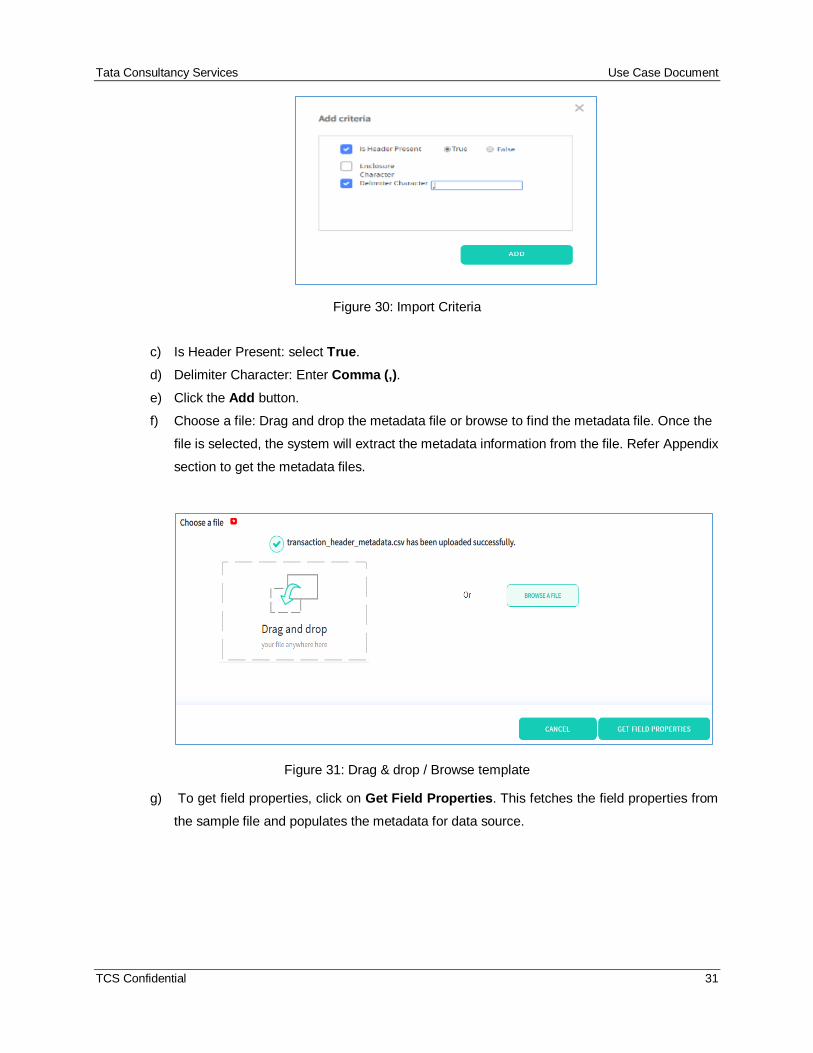
Figure 30: Import Criteria
c) Is Header Present: select True.
d) Delimiter Character: Enter Comma (,).
e) Click the Add button.
f) Choose a file: Drag and drop the metadata file or browse to find the metadata file. Once the
file is selected, the system will extract the metadata information from the file. Refer Appendix
section to get the metadata files.
Figure 31: Drag & drop / Browse template
g) To get field properties, click on Get Field Properties. This fetches the field properties from
the sample file and populates the metadata for data source.
Tata Consultancy Services Use Case Document
TCS Confidential 32
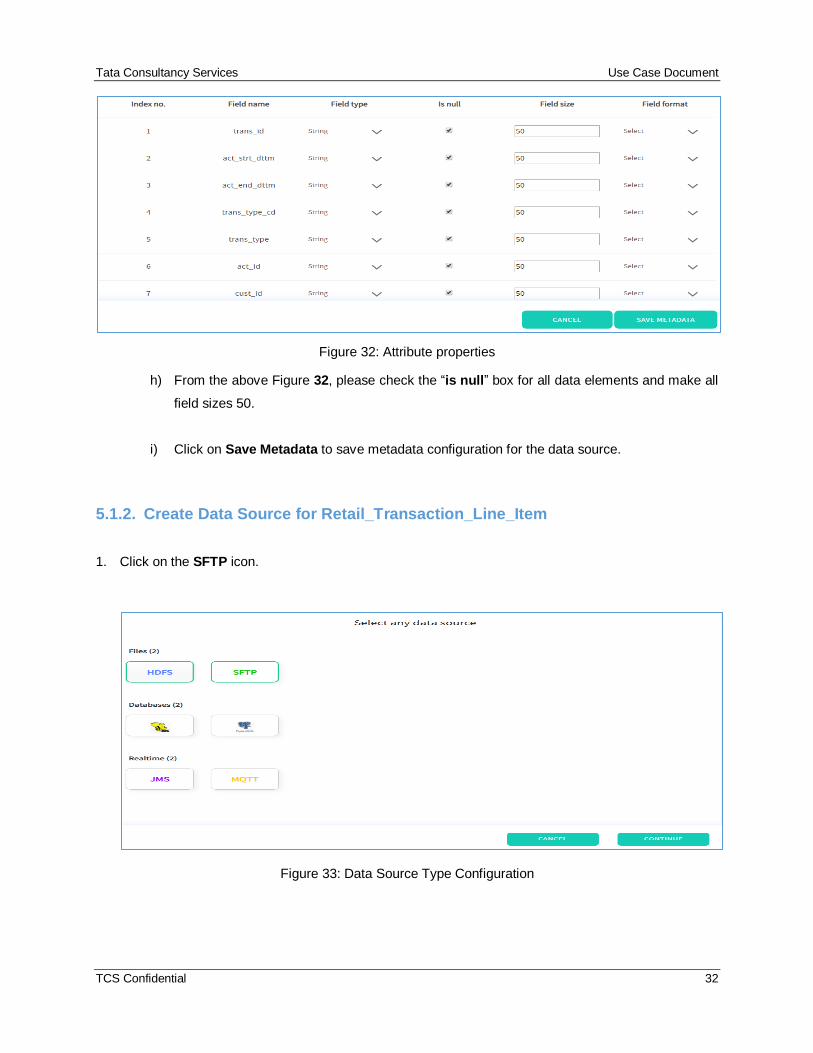
Figure 32: Attribute properties
h) From the above Figure 32, please check the “is null” box for all data elements and make all
field sizes 50.
i) Click on Save Metadata to save metadata configuration for the data source.
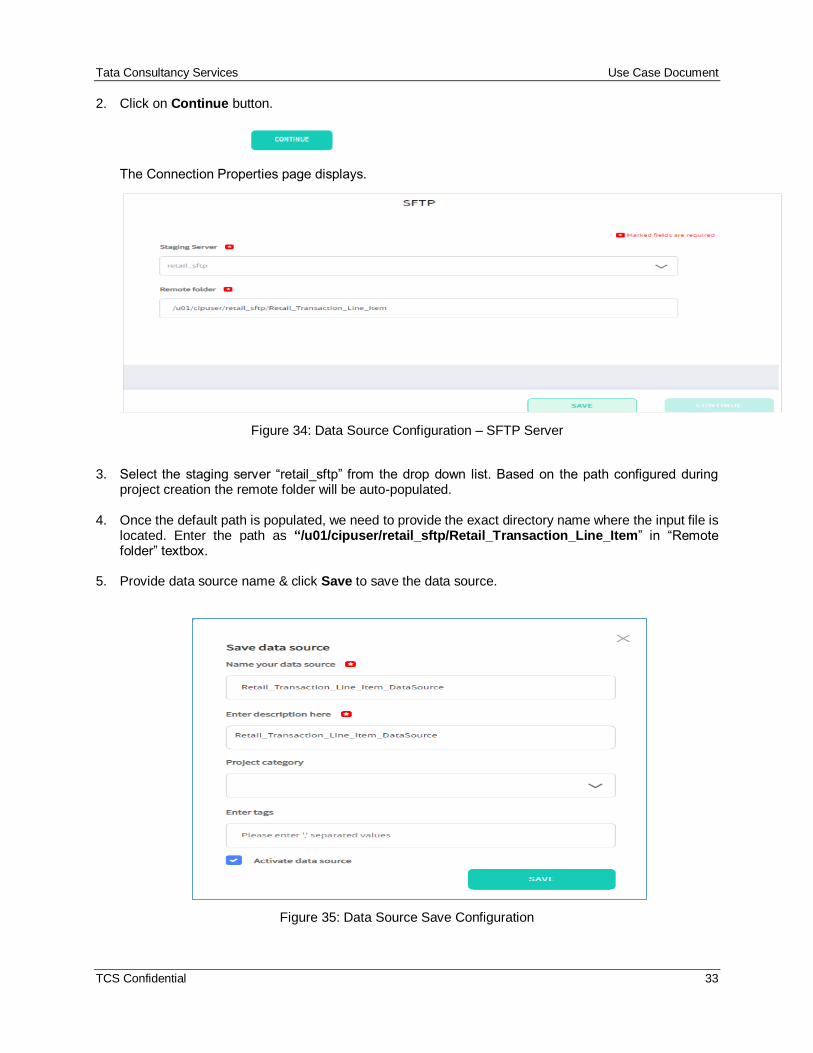
5.1.2. Create Data Source for Retail_Transaction_Line_Item
1. Click on the SFTP icon.
Figure 33: Data Source Type Configuration
Tata Consultancy Services Use Case Document
TCS Confidential 33
2. Click on Continue button.
The Connection Properties page displays.
Figure 34: Data Source Configuration – SFTP Server
3. Select the staging server “retail_sftp” from the drop down list. Based on the path configured during
project creation the remote folder will be auto-populated.
4. Once the default path is populated, we need to provide the exact directory name where the input file is located. Enter the path as “/u01/cipuser/retail_sftp/Retail_Transaction_Line_Item” in “Remote folder” textbox.
5. Provide data source name & click Save to save the data source.
Figure 35: Data Source Save Configuration
Tata Consultancy Services Use Case Document
TCS Confidential 34
a) Enter the name as “Retail_Transaction_Line_Item_DS” for this data source.
b) Enter description here: Enter data source name as description for the data source.
c) Project category and Tags: Leave them blank.
d) Click on Activate data source check box to make the data source Active.
e) Click on Save to save the data source configuration.
Import Metadata for Data Source Retail_Transaction_Line_Item
To import metadata for data source, perform the following tasks.
1. Create the metadata file from the input data files and save it in csv format. The metadata file will contain only the attributes name or header separated by comma.
2. To set up metadata configuration, click Continue. Metadata configuration screen opens.
Figure 36: Metadata Configuration for Data Source Type – File
To configure the metadata, do the following:
a) Choose data format: Click on Delimited format of input file.
b) Import Criteria: Click on the (+) button to select criteria for import.
Tata Consultancy Services Use Case Document
TCS Confidential 35
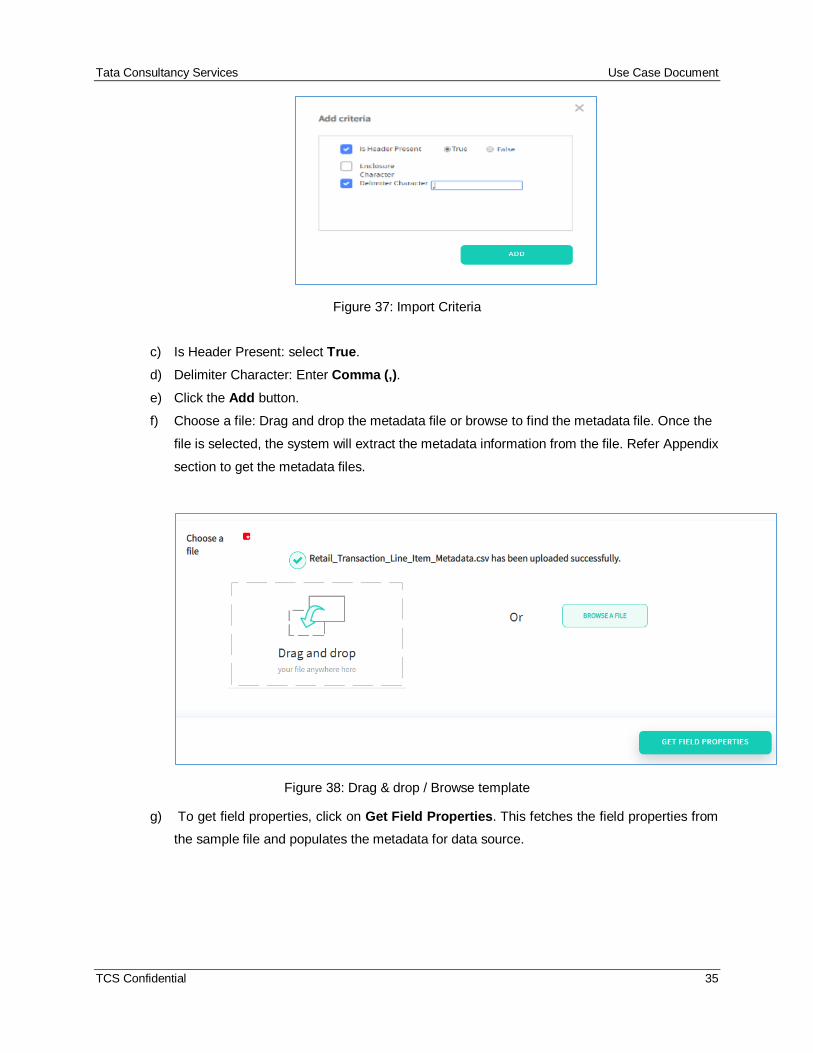
Figure 37: Import Criteria
c) Is Header Present: select True.
d) Delimiter Character: Enter Comma (,).
e) Click the Add button.
f) Choose a file: Drag and drop the metadata file or browse to find the metadata file. Once the
file is selected, the system will extract the metadata information from the file. Refer Appendix
section to get the metadata files.
Figure 38: Drag & drop / Browse template
g) To get field properties, click on Get Field Properties. This fetches the field properties from
the sample file and populates the metadata for data source.
Tata Consultancy Services Use Case Document
TCS Confidential 36
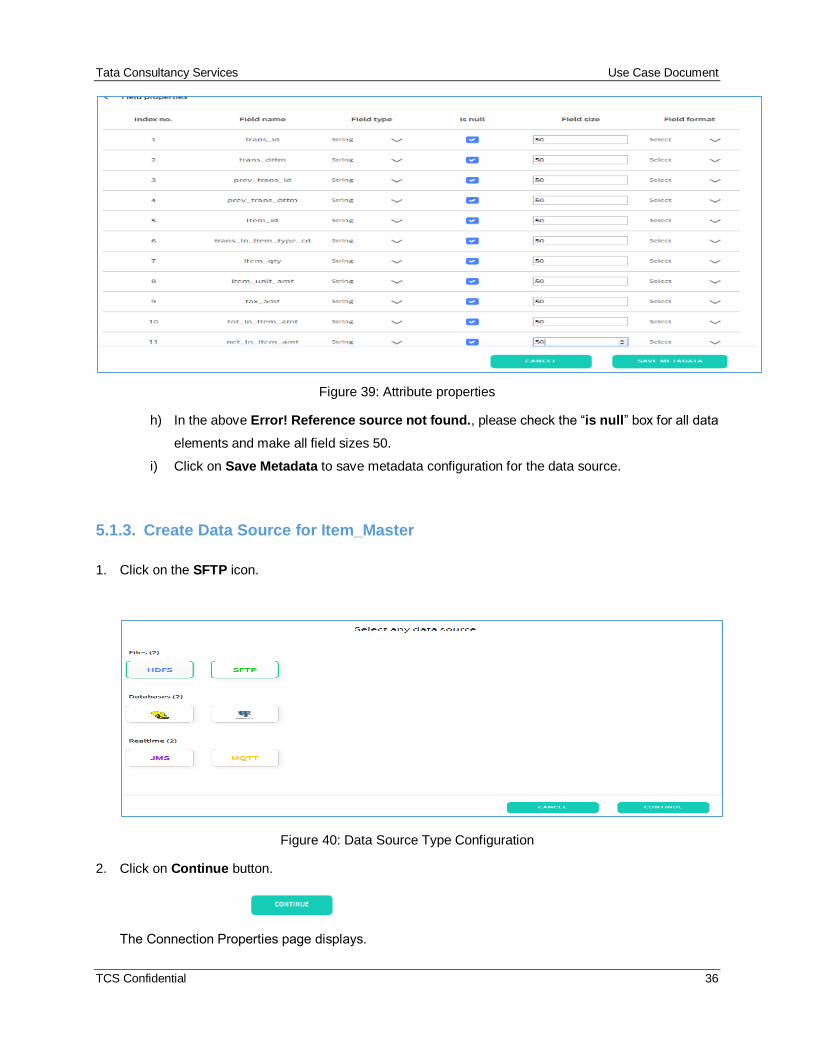
Figure 39: Attribute properties
h) In the above Error! Reference source not found., please check the “is null” box for all data
elements and make all field sizes 50.
i) Click on Save Metadata to save metadata configuration for the data source.
5.1.3. Create Data Source for Item_Master
1. Click on the SFTP icon.
Figure 40: Data Source Type Configuration
2. Click on Continue button.
The Connection Properties page displays.
Tata Consultancy Services Use Case Document
TCS Confidential 37
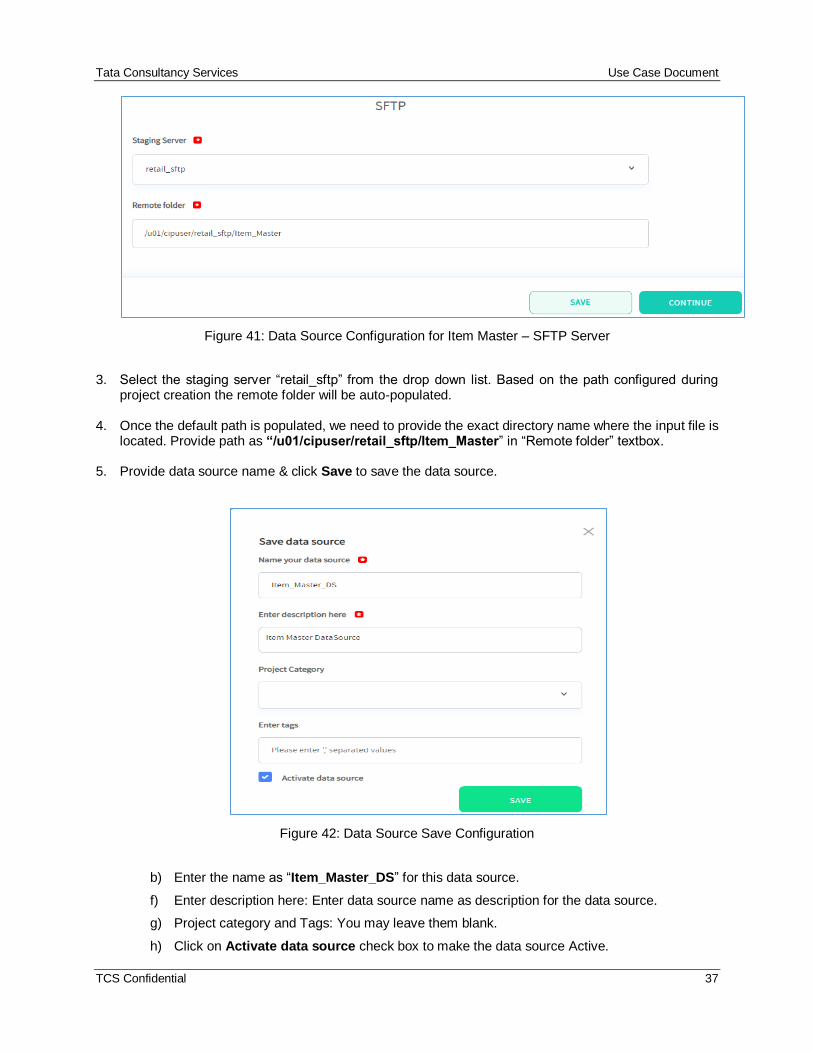
Figure 41: Data Source Configuration for Item Master – SFTP Server
3. Select the staging server “retail_sftp” from the drop down list. Based on the path configured during
project creation the remote folder will be auto-populated.
4. Once the default path is populated, we need to provide the exact directory name where the input file is located. Provide path as “/u01/cipuser/retail_sftp/Item_Master” in “Remote folder” textbox.
5. Provide data source name & click Save to save the data source.
Figure 42: Data Source Save Configuration
b) Enter the name as “Item_Master_DS” for this data source.
f) Enter description here: Enter data source name as description for the data source.
g) Project category and Tags: You may leave them blank.
h) Click on Activate data source check box to make the data source Active.
Tata Consultancy Services Use Case Document
TCS Confidential 38
i) Click on Save to save the data source configuration.
Import Metadata for Data Source Retail_Item_Master
To import metadata for data source, perform the following tasks.
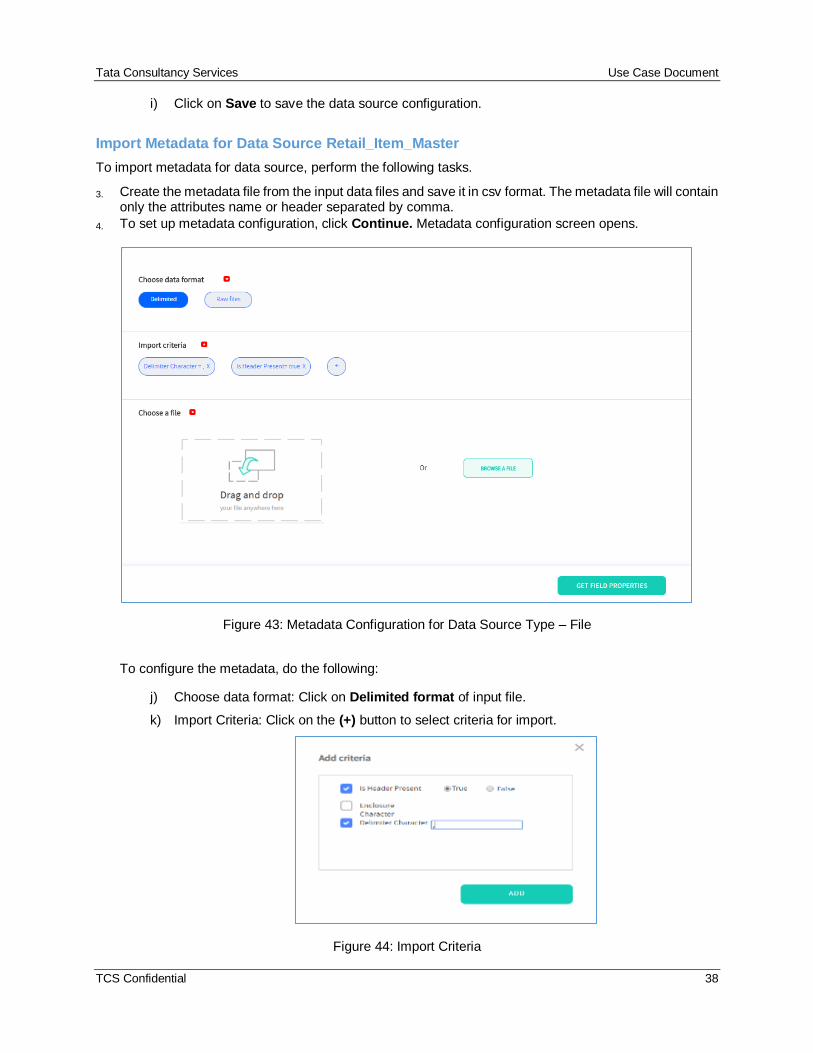
3. Create the metadata file from the input data files and save it in csv format. The metadata file will contain only the attributes name or header separated by comma.
4. To set up metadata configuration, click Continue. Metadata configuration screen opens.
Figure 43: Metadata Configuration for Data Source Type – File
To configure the metadata, do the following:
j) Choose data format: Click on Delimited format of input file.
k) Import Criteria: Click on the (+) button to select criteria for import.
Figure 44: Import Criteria
Tata Consultancy Services Use Case Document
TCS Confidential 39
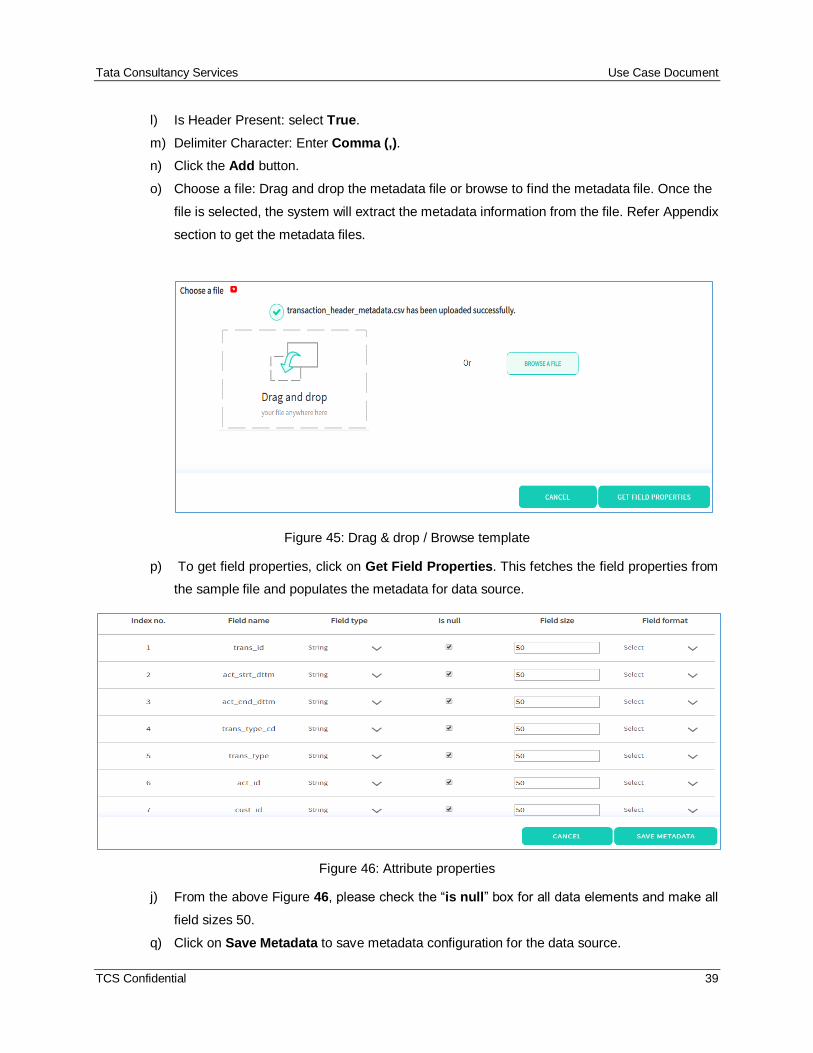
l) Is Header Present: select True.
m) Delimiter Character: Enter Comma (,).
n) Click the Add button.
o) Choose a file: Drag and drop the metadata file or browse to find the metadata file. Once the
file is selected, the system will extract the metadata information from the file. Refer Appendix
section to get the metadata files.
Figure 45: Drag & drop / Browse template
p) To get field properties, click on Get Field Properties. This fetches the field properties from
the sample file and populates the metadata for data source.
Figure 46: Attribute properties
j) From the above Figure 46, please check the “is null” box for all data elements and make all
field sizes 50.
q) Click on Save Metadata to save metadata configuration for the data source.
Tata Consultancy Services Use Case Document
TCS Confidential 40
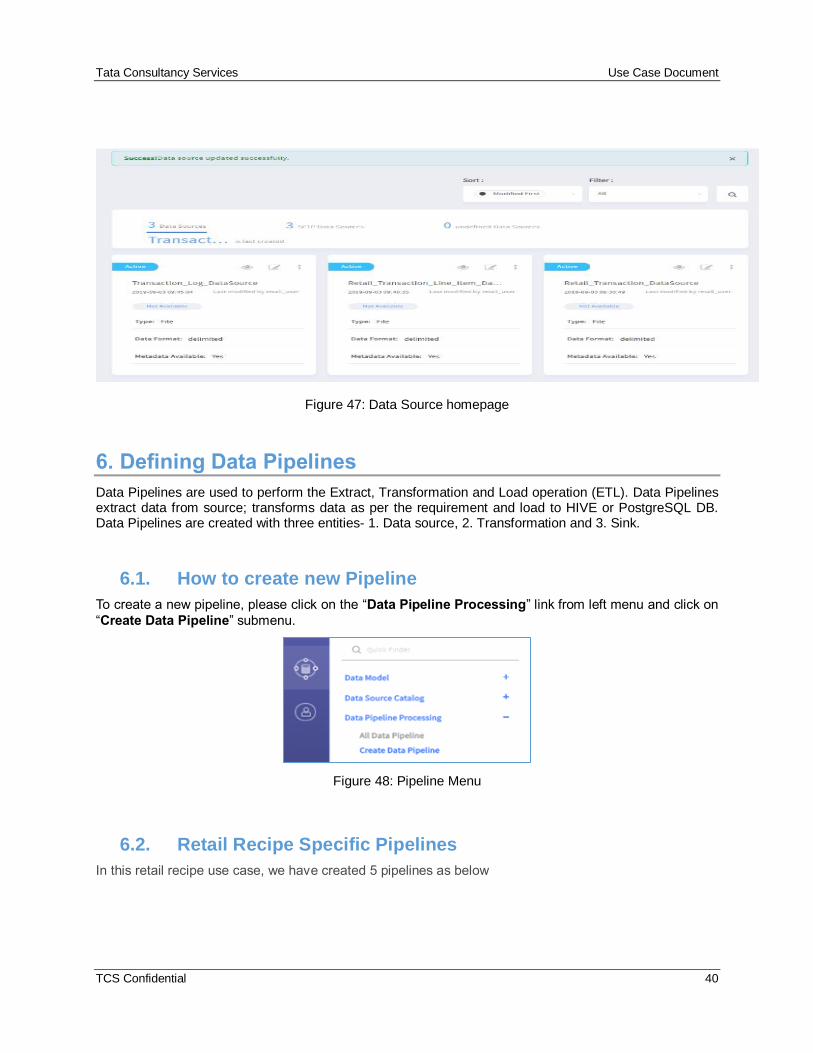
Figure 47: Data Source homepage
6. Defining Data Pipelines
Data Pipelines are used to perform the Extract, Transformation and Load operation (ETL). Data Pipelines extract data from source; transforms data as per the requirement and load to HIVE or PostgreSQL DB. Data Pipelines are created with three entities- 1. Data source, 2. Transformation and 3. Sink.
6.1. How to create new Pipeline
To create a new pipeline, please click on the “Data Pipeline Processing” link from left menu and click on
“Create Data Pipeline” submenu.
Figure 48: Pipeline Menu
6.2. Retail Recipe Specific Pipelines
In this retail recipe use case, we have created 5 pipelines as below
Tata Consultancy Services Use Case Document
TCS Confidential 41
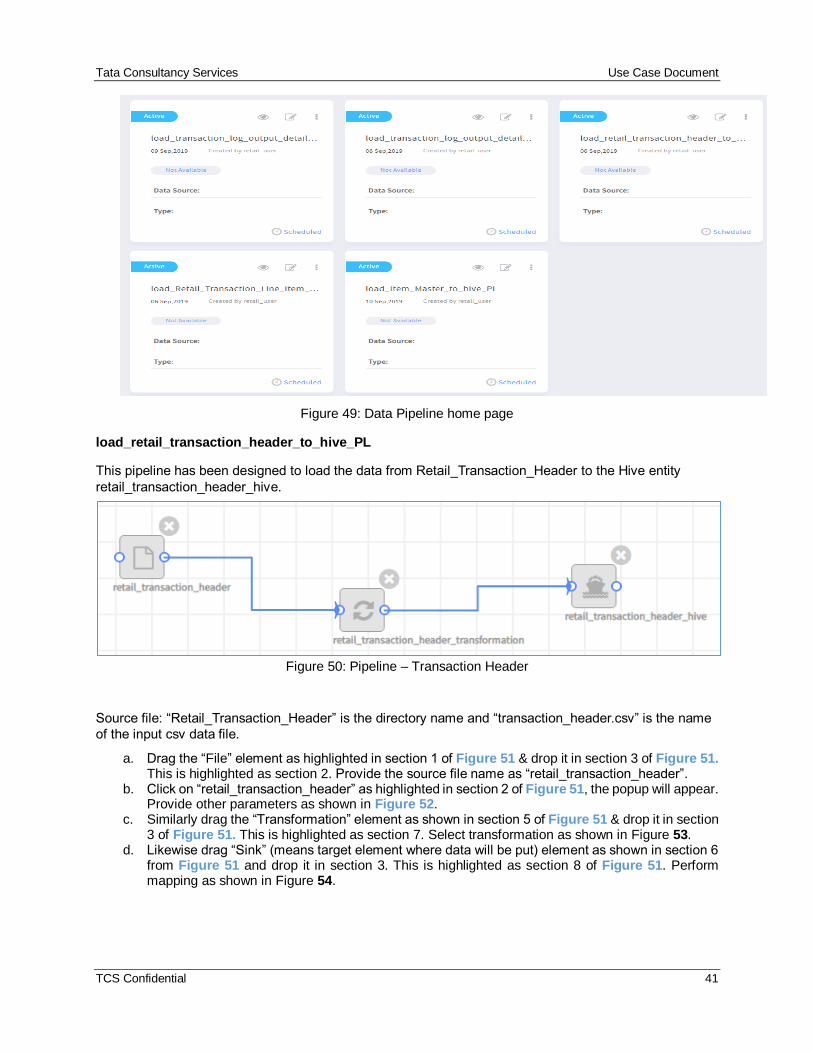
Figure 49: Data Pipeline home page
load_retail_transaction_header_to_hive_PL
This pipeline has been designed to load the data from Retail_Transaction_Header to the Hive entity
retail_transaction_header_hive.
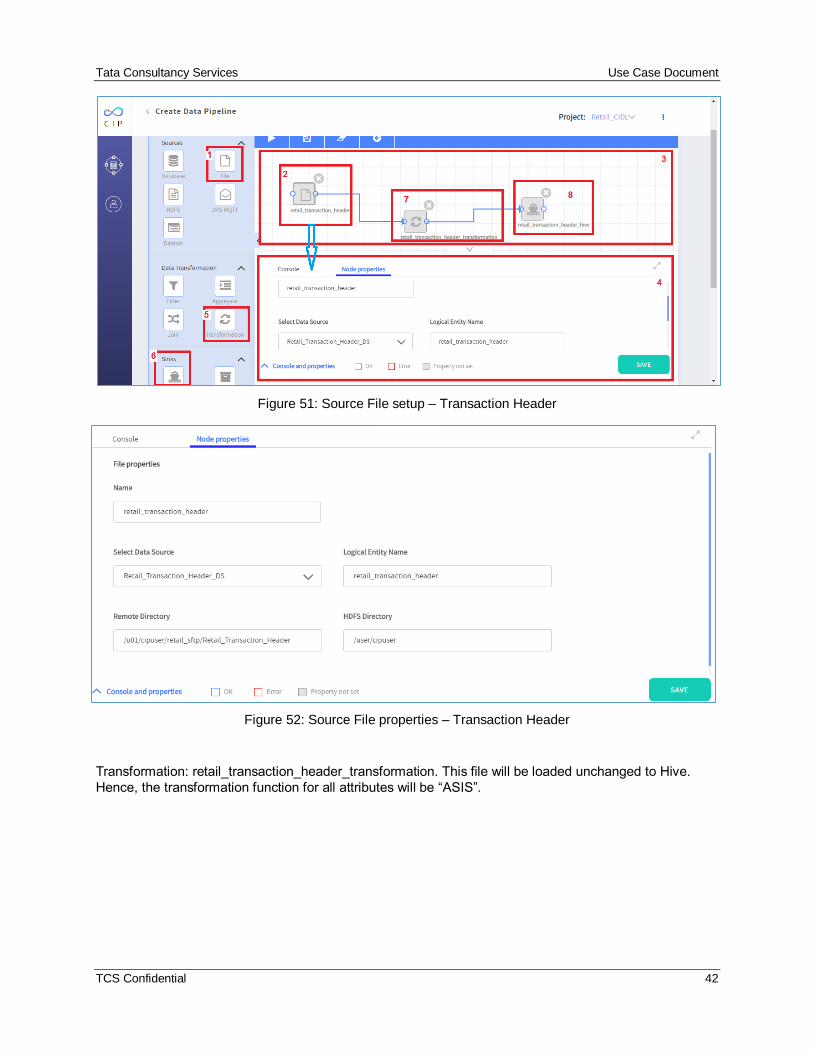
Figure 50: Pipeline – Transaction Header
Source file: “Retail_Transaction_Header” is the directory name and “transaction_header.csv” is the name
of the input csv data file.
a. Drag the “File” element as highlighted in section 1 of Figure 51 & drop it in section 3 of Figure 51. This is highlighted as section 2. Provide the source file name as “retail_transaction_header”.
b. Click on “retail_transaction_header” as highlighted in section 2 of Figure 51, the popup will appear. Provide other parameters as shown in Figure 52.
c. Similarly drag the “Transformation” element as shown in section 5 of Figure 51 & drop it in section 3 of Figure 51. This is highlighted as section 7. Select transformation as shown in Figure 53.
d. Likewise drag “Sink” (means target element where data will be put) element as shown in section 6 from Figure 51 and drop it in section 3. This is highlighted as section 8 of Figure 51. Perform mapping as shown in Figure 54.
Tata Consultancy Services Use Case Document
TCS Confidential 42
Figure 51: Source File setup – Transaction Header
Figure 52: Source File properties – Transaction Header
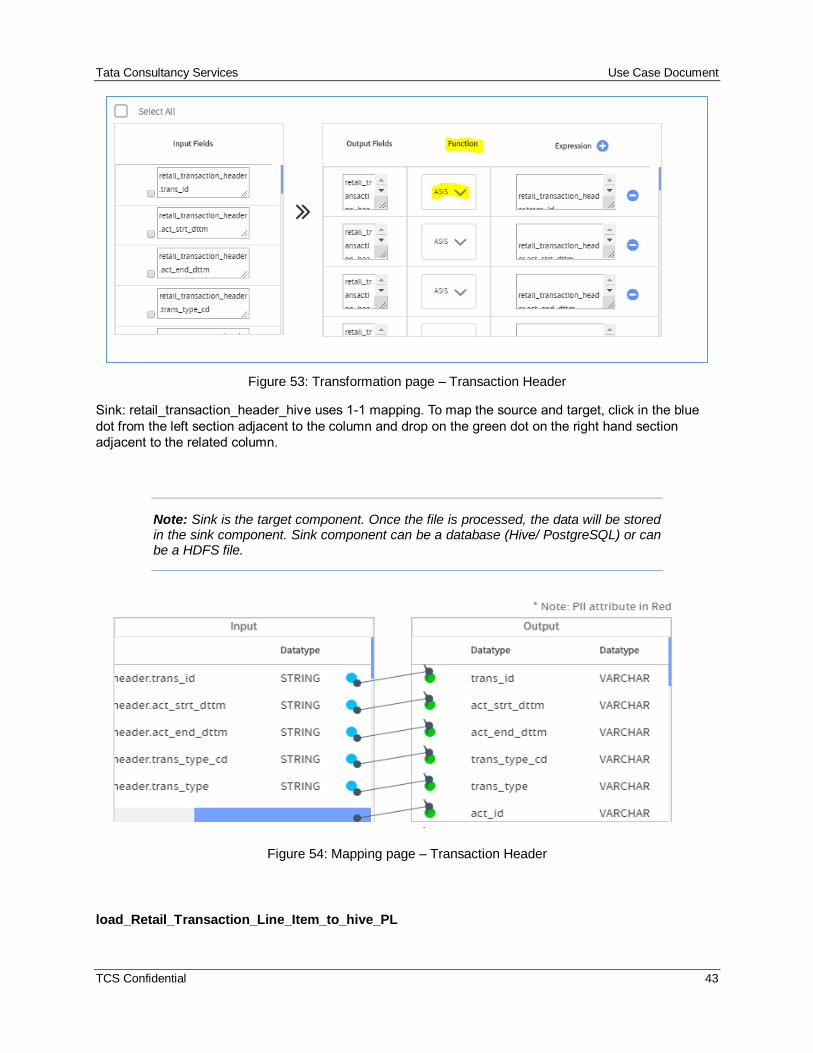
Transformation: retail_transaction_header_transformation. This file will be loaded unchanged to Hive.
Hence, the transformation function for all attributes will be “ASIS”.
Tata Consultancy Services Use Case Document
TCS Confidential 43
Figure 53: Transformation page – Transaction Header
Sink: retail_transaction_header_hive uses 1-1 mapping. To map the source and target, click in the blue
dot from the left section adjacent to the column and drop on the green dot on the right hand section
adjacent to the related column.
Note: Sink is the target component. Once the file is processed, the data will be stored in the sink component. Sink component can be a database (Hive/ PostgreSQL) or can be a HDFS file.
Figure 54: Mapping page – Transaction Header
load_Retail_Transaction_Line_Item_to_hive_PL
Tata Consultancy Services Use Case Document
TCS Confidential 44
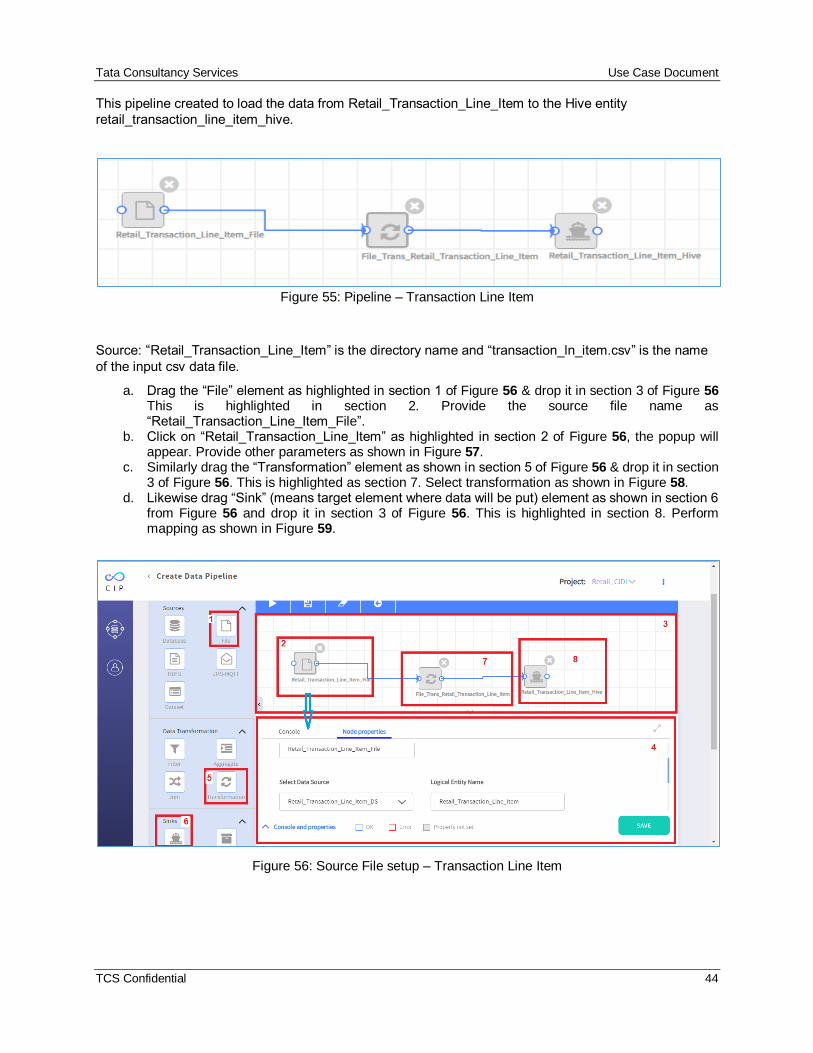
This pipeline created to load the data from Retail_Transaction_Line_Item to the Hive entity
retail_transaction_line_item_hive.
Figure 55: Pipeline – Transaction Line Item
Source: “Retail_Transaction_Line_Item” is the directory name and “transaction_ln_item.csv” is the name
of the input csv data file.
a. Drag the “File” element as highlighted in section 1 of Figure 56 & drop it in section 3 of Figure 56 This is highlighted in section 2. Provide the source file name as “Retail_Transaction_Line_Item_File”.
b. Click on “Retail_Transaction_Line_Item” as highlighted in section 2 of Figure 56, the popup will appear. Provide other parameters as shown in Figure 57.
c. Similarly drag the “Transformation” element as shown in section 5 of Figure 56 & drop it in section 3 of Figure 56. This is highlighted as section 7. Select transformation as shown in Figure 58.
d. Likewise drag “Sink” (means target element where data will be put) element as shown in section 6 from Figure 56 and drop it in section 3 of Figure 56. This is highlighted in section 8. Perform mapping as shown in Figure 59.
Figure 56: Source File setup – Transaction Line Item
Tata Consultancy Services Use Case Document
TCS Confidential 45
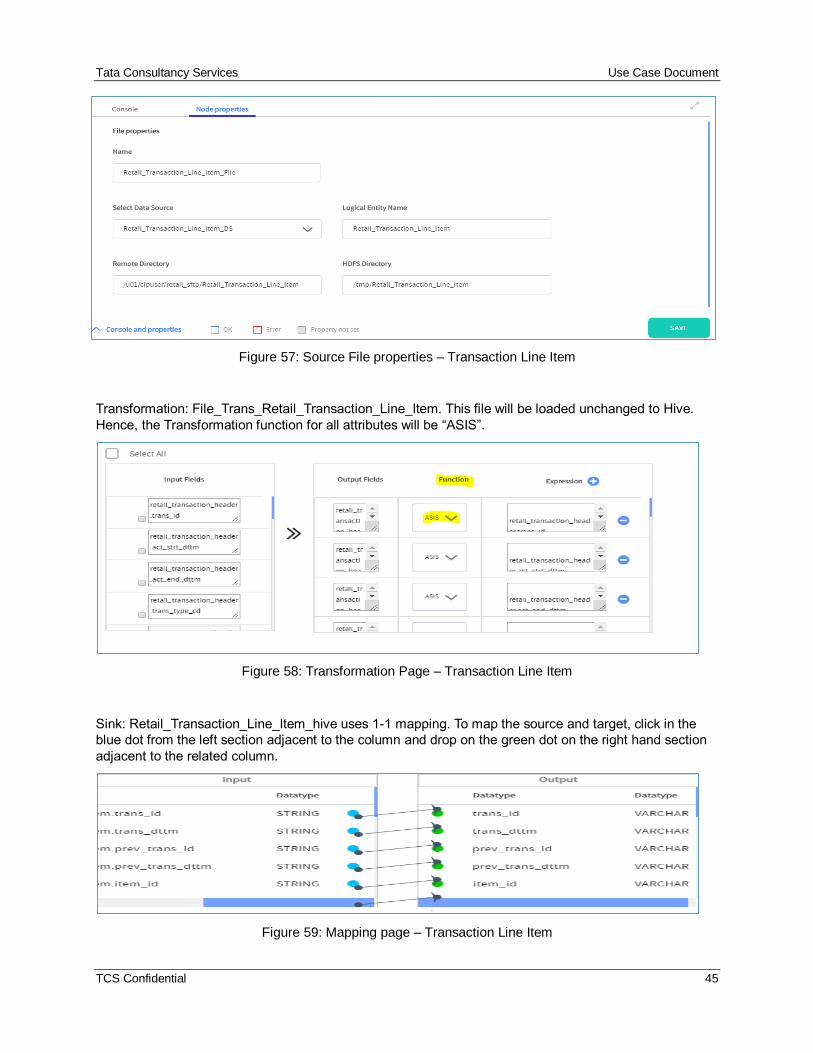
Figure 57: Source File properties – Transaction Line Item
Transformation: File_Trans_Retail_Transaction_Line_Item. This file will be loaded unchanged to Hive.
Hence, the Transformation function for all attributes will be “ASIS”.
Figure 58: Transformation Page – Transaction Line Item
Sink: Retail_Transaction_Line_Item_hive uses 1-1 mapping. To map the source and target, click in the
blue dot from the left section adjacent to the column and drop on the green dot on the right hand section
adjacent to the related column.
Figure 59: Mapping page – Transaction Line Item
Tata Consultancy Services Use Case Document
TCS Confidential 46
load_Item_Master_to_hive_PL
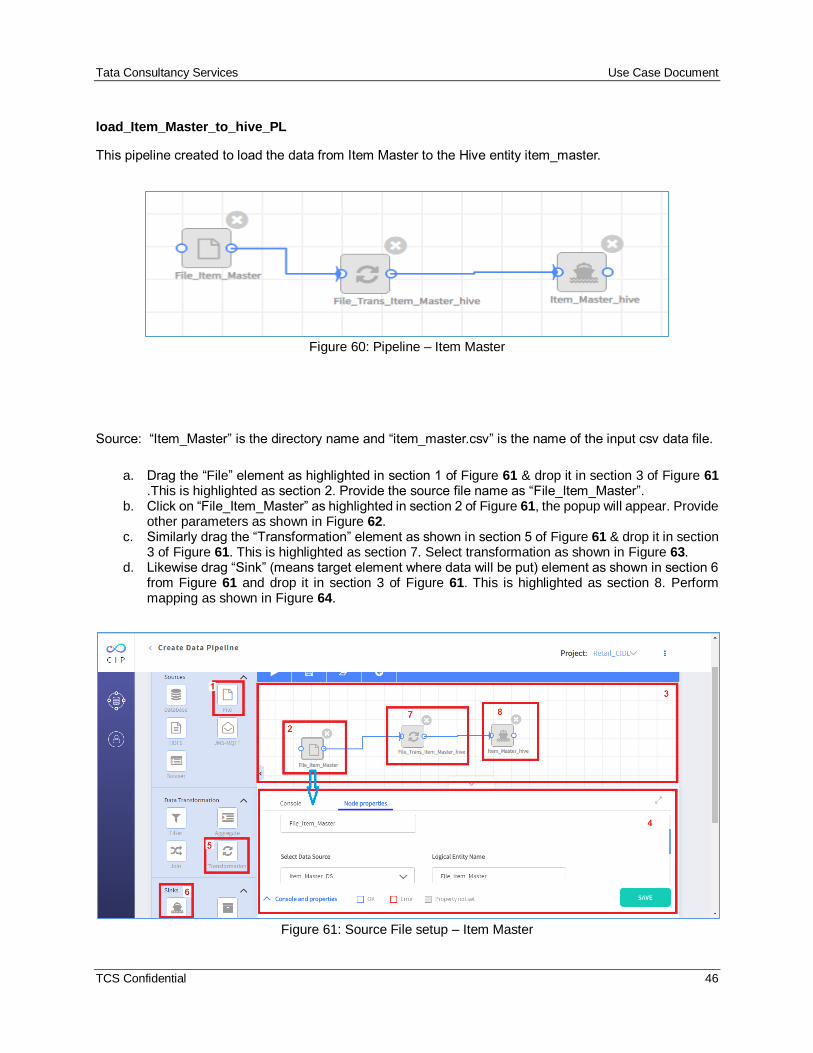
This pipeline created to load the data from Item Master to the Hive entity item_master.
Figure 60: Pipeline – Item Master
Source: “Item_Master” is the directory name and “item_master.csv” is the name of the input csv data file.
a. Drag the “File” element as highlighted in section 1 of Figure 61 & drop it in section 3 of Figure 61 .This is highlighted as section 2. Provide the source file name as “File_Item_Master”.
b. Click on “File_Item_Master” as highlighted in section 2 of Figure 61, the popup will appear. Provide other parameters as shown in Figure 62.
c. Similarly drag the “Transformation” element as shown in section 5 of Figure 61 & drop it in section 3 of Figure 61. This is highlighted as section 7. Select transformation as shown in Figure 63.
d. Likewise drag “Sink” (means target element where data will be put) element as shown in section 6 from Figure 61 and drop it in section 3 of Figure 61. This is highlighted as section 8. Perform mapping as shown in Figure 64.
Figure 61: Source File setup – Item Master
Tata Consultancy Services Use Case Document
TCS Confidential 47
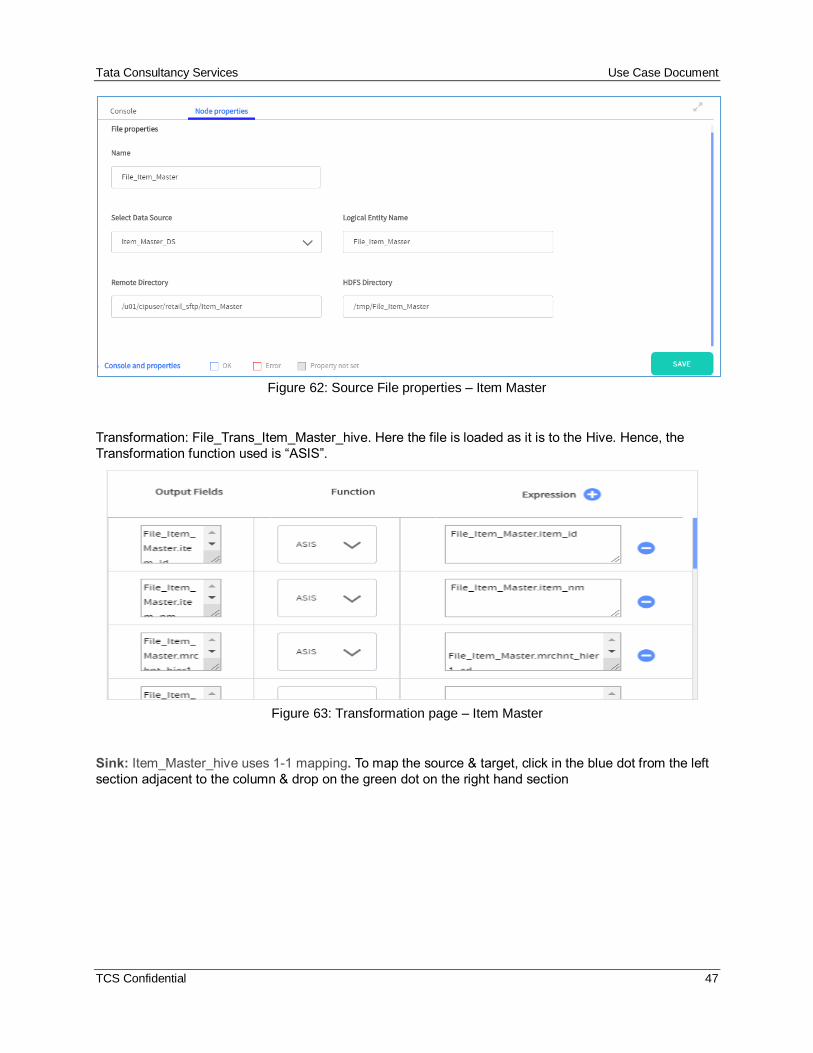
Figure 62: Source File properties – Item Master
Transformation: File_Trans_Item_Master_hive. Here the file is loaded as it is to the Hive. Hence, the
Transformation function used is “ASIS”.
Figure 63: Transformation page – Item Master
Sink: Item_Master_hive uses 1-1 mapping. To map the source & target, click in the blue dot from the left
section adjacent to the column & drop on the green dot on the right hand section
Tata Consultancy Services Use Case Document
TCS Confidential 48
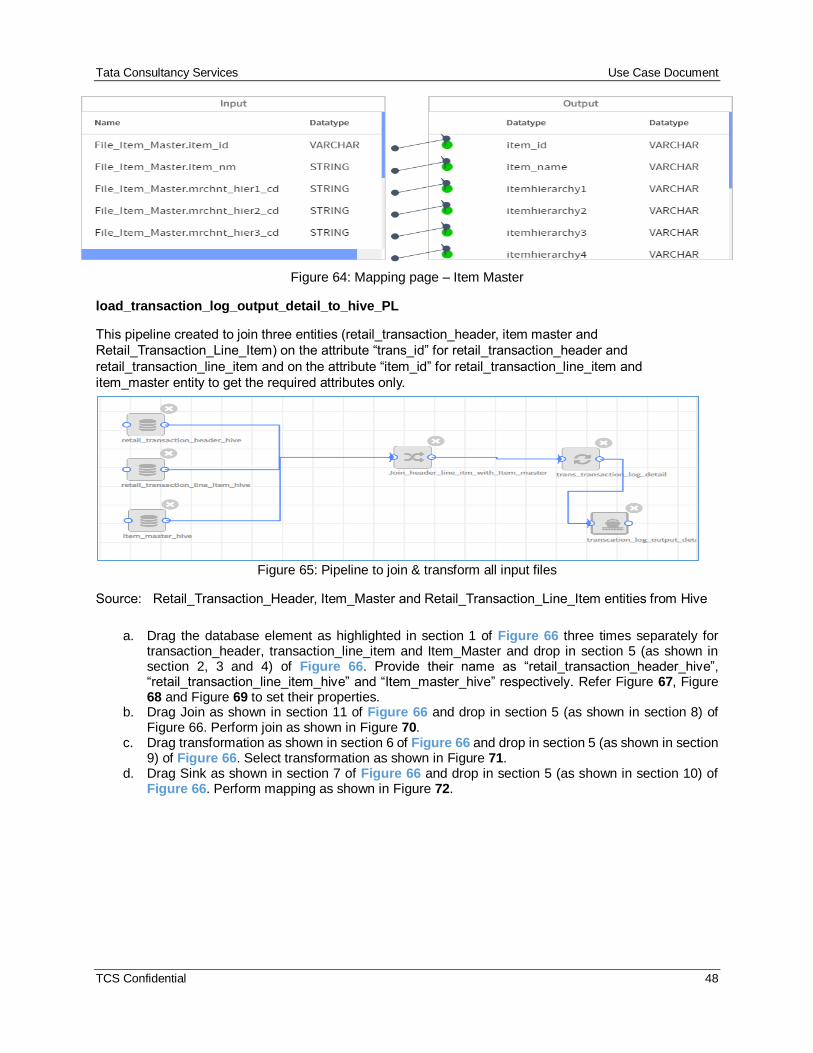
Figure 64: Mapping page – Item Master
load_transaction_log_output_detail_to_hive_PL
This pipeline created to join three entities (retail_transaction_header, item master and
Retail_Transaction_Line_Item) on the attribute “trans_id” for retail_transaction_header and
retail_transaction_line_item and on the attribute “item_id” for retail_transaction_line_item and
item_master entity to get the required attributes only.
Figure 65: Pipeline to join & transform all input files
Source: Retail_Transaction_Header, Item_Master and Retail_Transaction_Line_Item entities from Hive
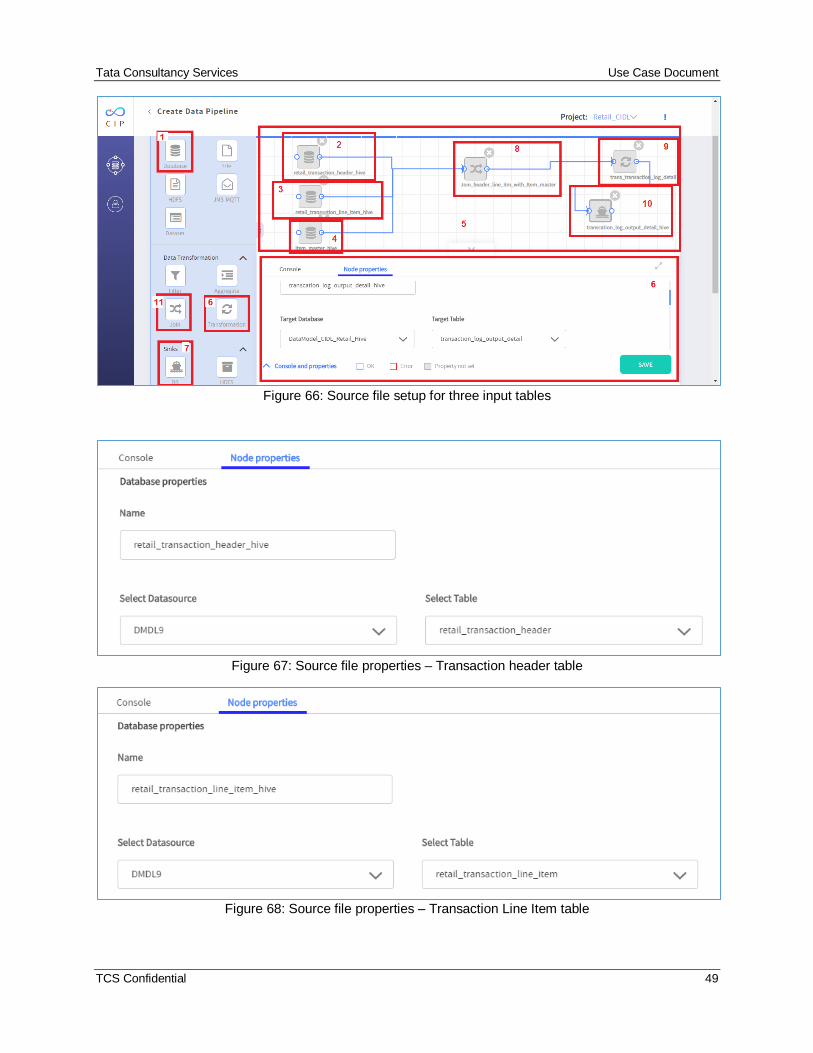
a. Drag the database element as highlighted in section 1 of Figure 66 three times separately for transaction_header, transaction_line_item and Item_Master and drop in section 5 (as shown in section 2, 3 and 4) of Figure 66. Provide their name as “retail_transaction_header_hive”, “retail_transaction_line_item_hive” and “Item_master_hive” respectively. Refer Figure 67, Figure 68 and Figure 69 to set their properties.
b. Drag Join as shown in section 11 of Figure 66 and drop in section 5 (as shown in section 8) of Figure 66. Perform join as shown in Figure 70.
c. Drag transformation as shown in section 6 of Figure 66 and drop in section 5 (as shown in section 9) of Figure 66. Select transformation as shown in Figure 71.
d. Drag Sink as shown in section 7 of Figure 66 and drop in section 5 (as shown in section 10) of Figure 66. Perform mapping as shown in Figure 72.
Tata Consultancy Services Use Case Document
TCS Confidential 49
Figure 66: Source file setup for three input tables
Figure 67: Source file properties – Transaction header table
Figure 68: Source file properties – Transaction Line Item table
Tata Consultancy Services Use Case Document
TCS Confidential 50
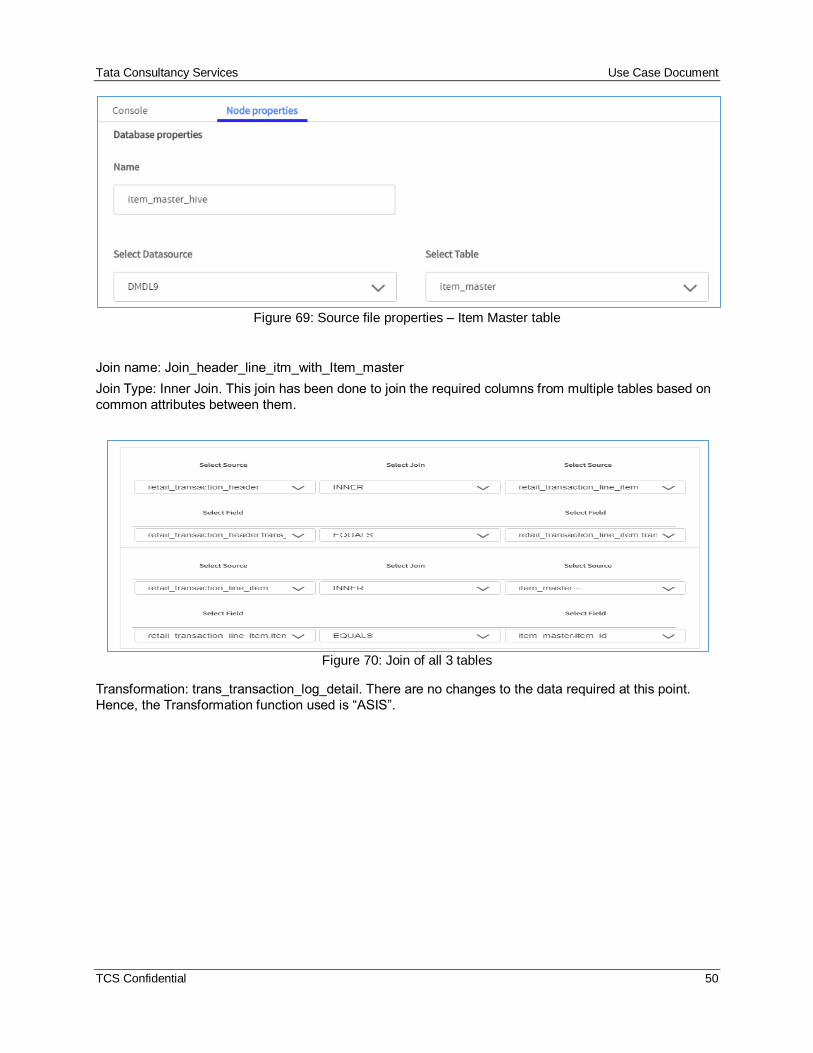
Figure 69: Source file properties – Item Master table
Join name: Join_header_line_itm_with_Item_master
Join Type: Inner Join. This join has been done to join the required columns from multiple tables based on
common attributes between them.
Figure 70: Join of all 3 tables
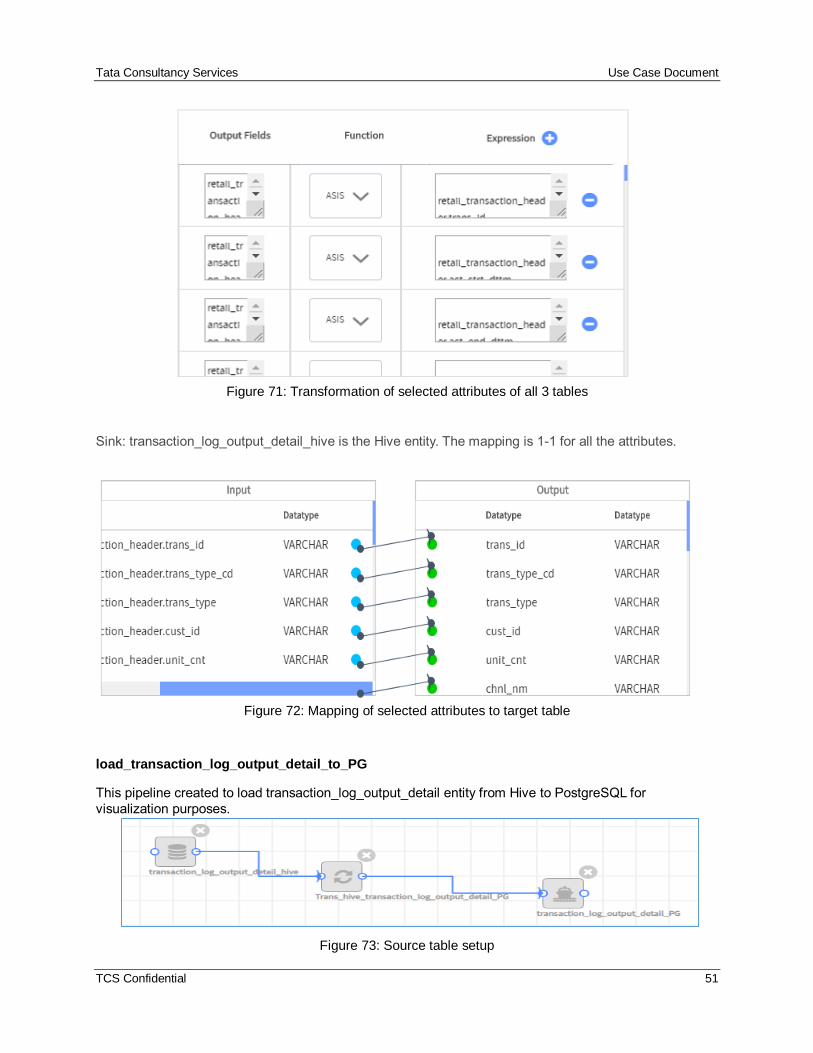
Transformation: trans_transaction_log_detail. There are no changes to the data required at this point.
Hence, the Transformation function used is “ASIS”.
Tata Consultancy Services Use Case Document
TCS Confidential 51
Figure 71: Transformation of selected attributes of all 3 tables
Sink: transaction_log_output_detail_hive is the Hive entity. The mapping is 1-1 for all the attributes.
Figure 72: Mapping of selected attributes to target table
load_transaction_log_output_detail_to_PG
This pipeline created to load transaction_log_output_detail entity from Hive to PostgreSQL for
visualization purposes.
Figure 73: Source table setup
Tata Consultancy Services Use Case Document
TCS Confidential 52
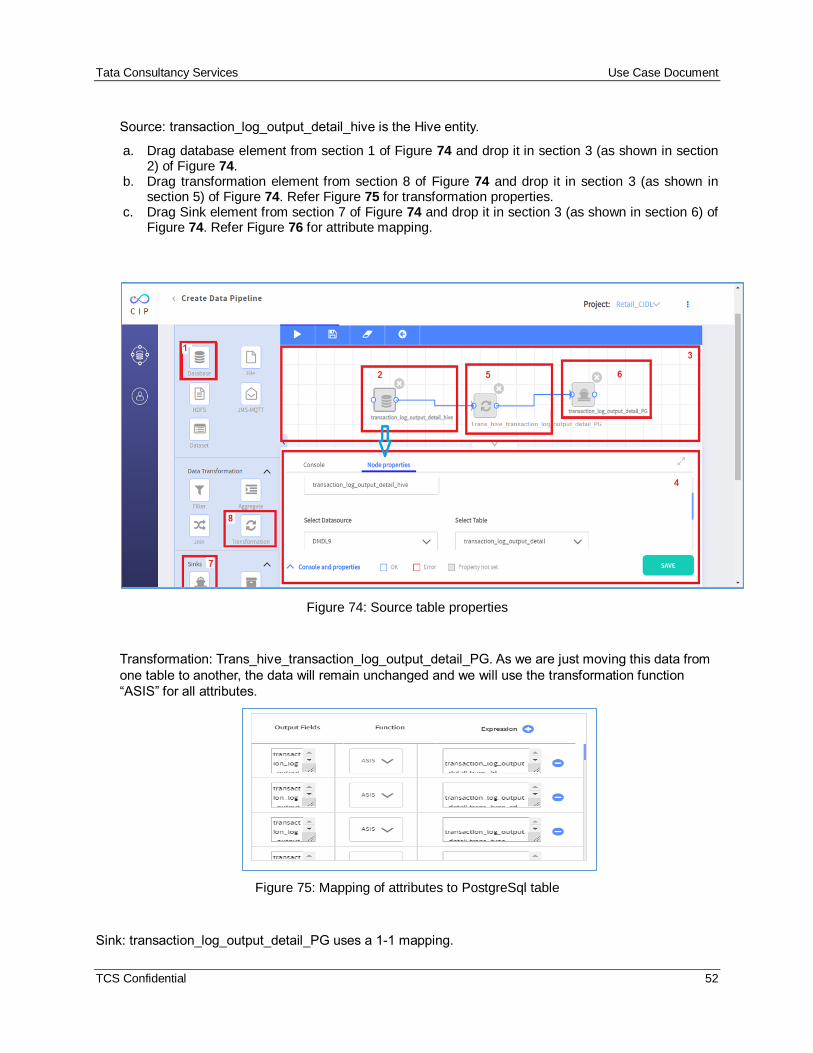
Source: transaction_log_output_detail_hive is the Hive entity.
a. Drag database element from section 1 of Figure 74 and drop it in section 3 (as shown in section 2) of Figure 74.
b. Drag transformation element from section 8 of Figure 74 and drop it in section 3 (as shown in section 5) of Figure 74. Refer Figure 75 for transformation properties.
c. Drag Sink element from section 7 of Figure 74 and drop it in section 3 (as shown in section 6) of Figure 74. Refer Figure 76 for attribute mapping.
Figure 74: Source table properties
Transformation: Trans_hive_transaction_log_output_detail_PG. As we are just moving this data from
one table to another, the data will remain unchanged and we will use the transformation function
“ASIS” for all attributes.
Figure 75: Mapping of attributes to PostgreSql table
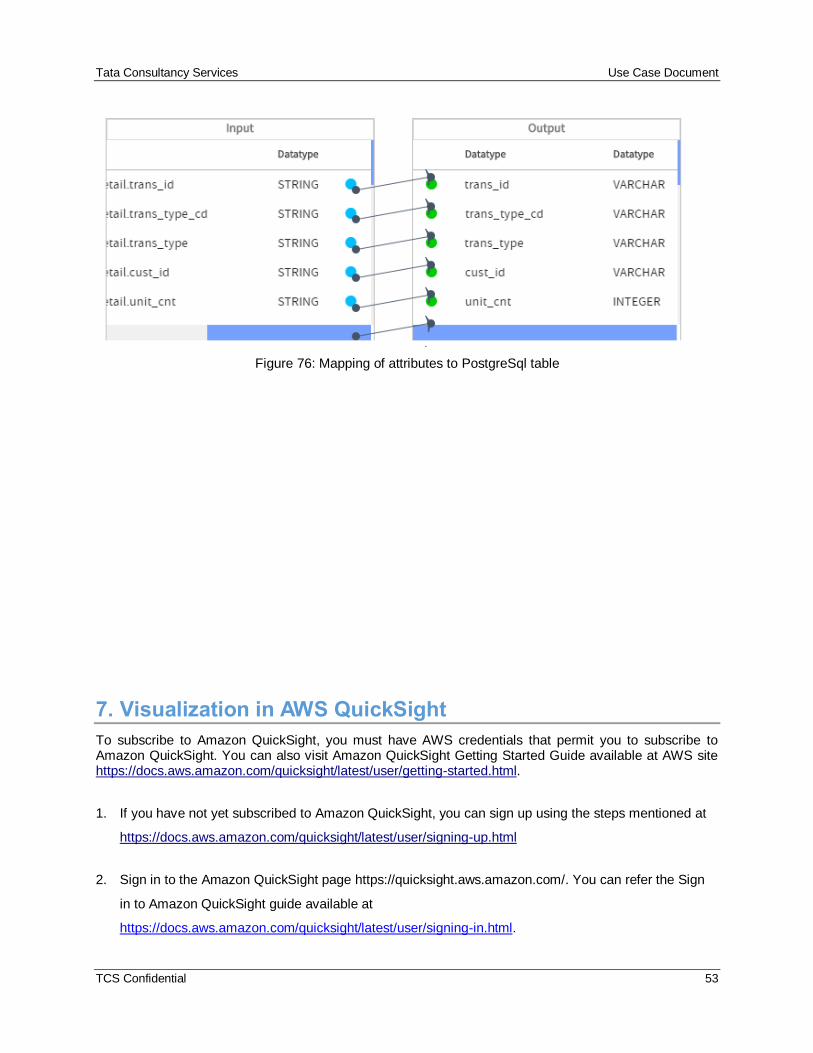
Sink: transaction_log_output_detail_PG uses a 1-1 mapping.
Tata Consultancy Services Use Case Document
TCS Confidential 53
Figure 76: Mapping of attributes to PostgreSql table
7. Visualization in AWS QuickSight
To subscribe to Amazon QuickSight, you must have AWS credentials that permit you to subscribe to Amazon QuickSight. You can also visit Amazon QuickSight Getting Started Guide available at AWS site https://docs.aws.amazon.com/quicksight/latest/user/getting-started.html.
1. If you have not yet subscribed to Amazon QuickSight, you can sign up using the steps mentioned at
https://docs.aws.amazon.com/quicksight/latest/user/signing-up.html
2. Sign in to the Amazon QuickSight page https://quicksight.aws.amazon.com/. You can refer the Sign
in to Amazon QuickSight guide available at
https://docs.aws.amazon.com/quicksight/latest/user/signing-in.html.
Tata Consultancy Services Use Case Document
TCS Confidential 54
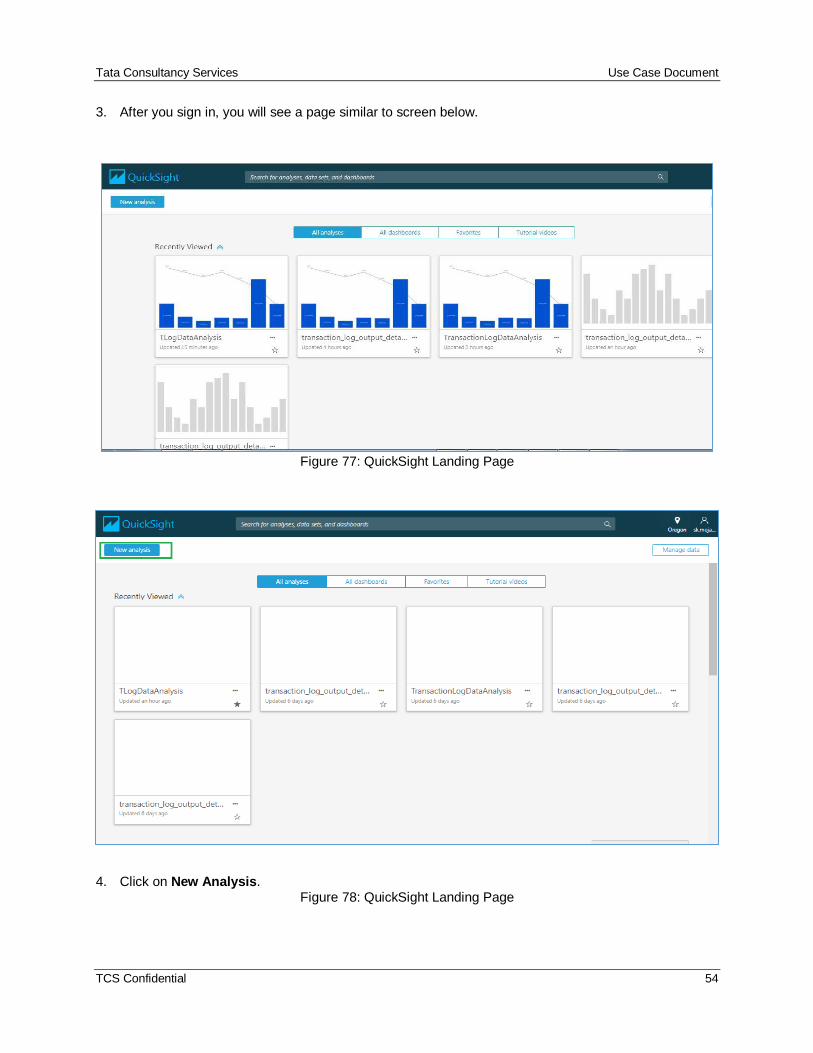
3. After you sign in, you will see a page similar to screen below.
Figure 77: QuickSight Landing Page
4. Click on New Analysis. Figure 78: QuickSight Landing Page
Tata Consultancy Services Use Case Document
TCS Confidential 55
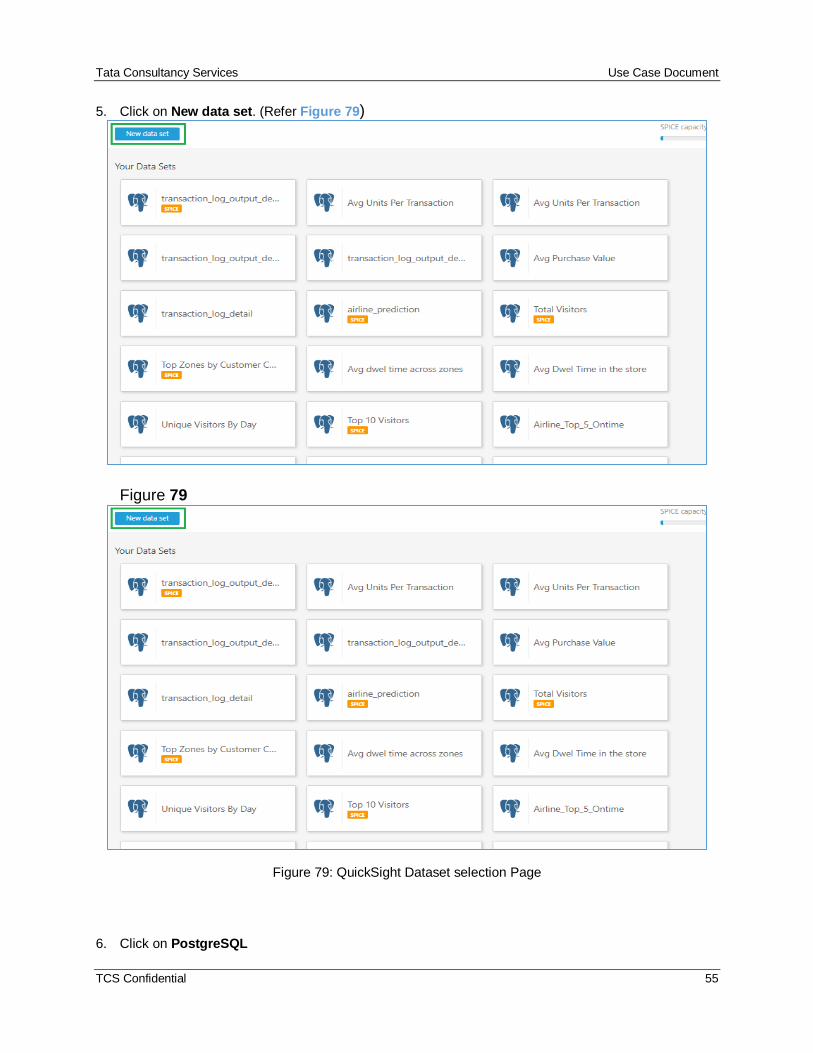
5. Click on New data set. (Refer Figure 79)
Figure 79
Figure 79: QuickSight Dataset selection Page
6. Click on PostgreSQL
Tata Consultancy Services Use Case Document
TCS Confidential 56
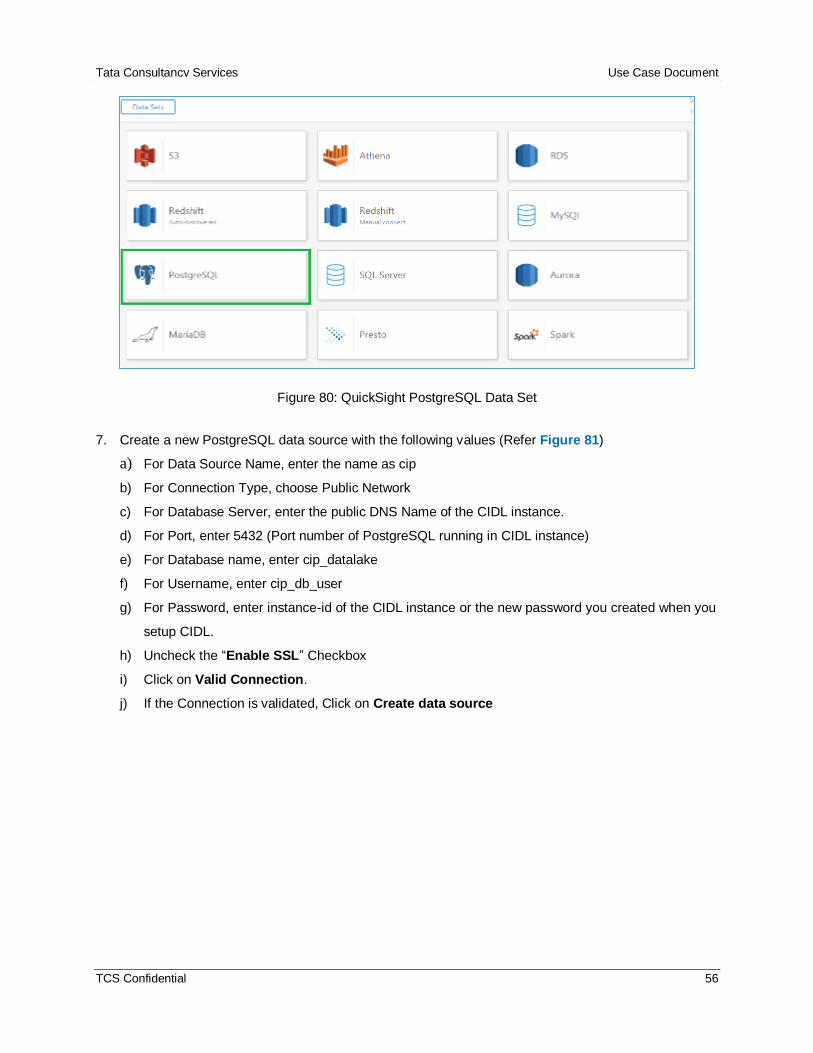
Figure 80: QuickSight PostgreSQL Data Set
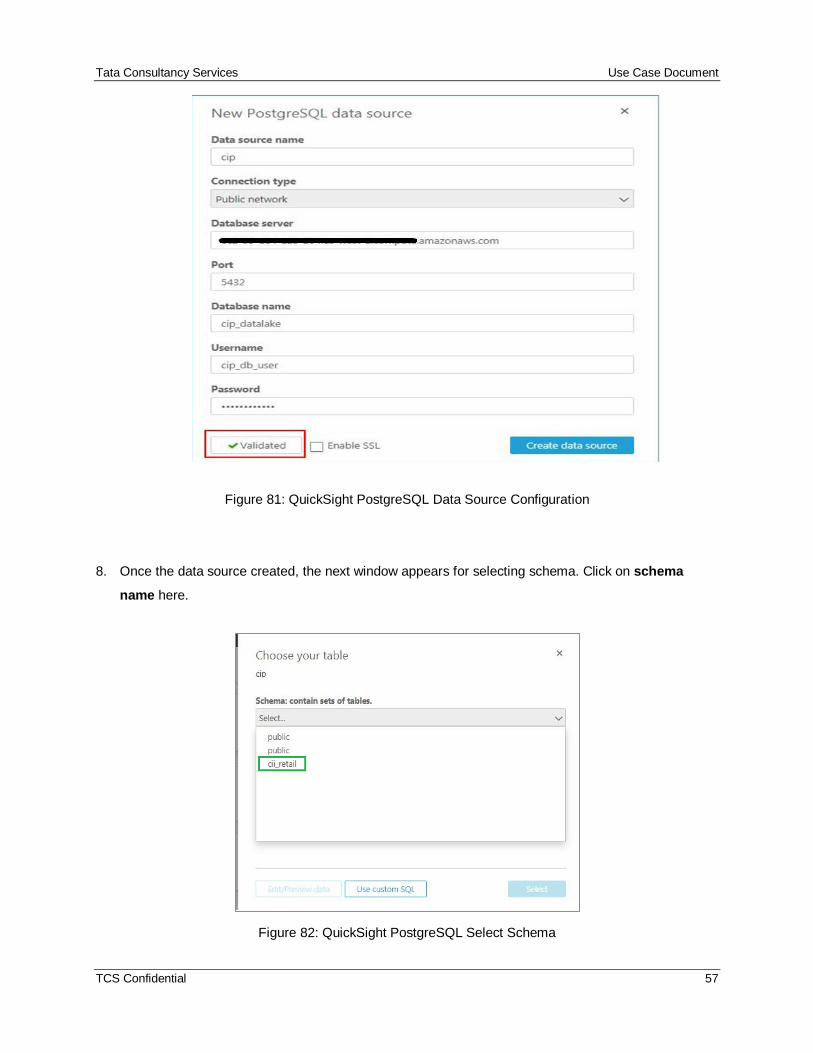
7. Create a new PostgreSQL data source with the following values (Refer Figure 81)
a) For Data Source Name, enter the name as cip
b) For Connection Type, choose Public Network
c) For Database Server, enter the public DNS Name of the CIDL instance.
d) For Port, enter 5432 (Port number of PostgreSQL running in CIDL instance)
e) For Database name, enter cip_datalake
f) For Username, enter cip_db_user
g) For Password, enter instance-id of the CIDL instance or the new password you created when you
setup CIDL.
h) Uncheck the “Enable SSL” Checkbox
i) Click on Valid Connection.
j) If the Connection is validated, Click on Create data source
Tata Consultancy Services Use Case Document
TCS Confidential 57
Figure 81: QuickSight PostgreSQL Data Source Configuration
8. Once the data source created, the next window appears for selecting schema. Click on schema
name here.
Figure 82: QuickSight PostgreSQL Select Schema
Tata Consultancy Services Use Case Document
TCS Confidential 58
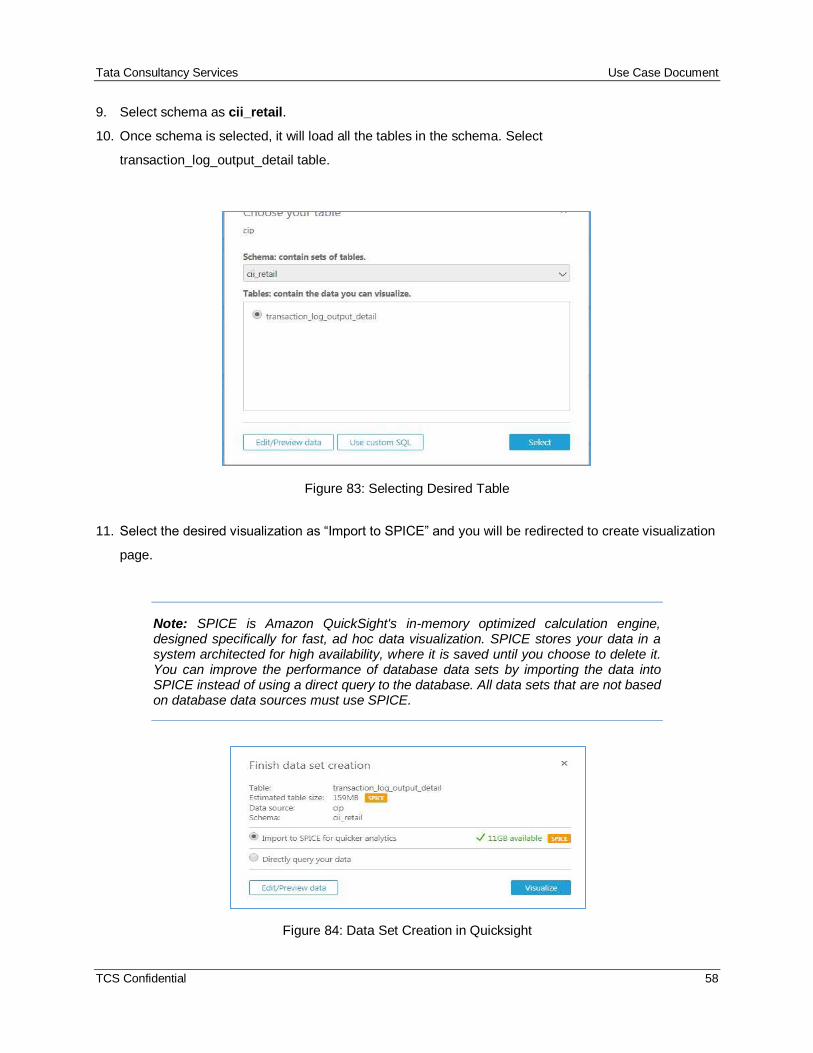
9. Select schema as cii_retail.
10. Once schema is selected, it will load all the tables in the schema. Select
transaction_log_output_detail table.
Figure 83: Selecting Desired Table
11. Select the desired visualization as “Import to SPICE” and you will be redirected to create visualization
page.
Note: SPICE is Amazon QuickSight's in-memory optimized calculation engine, designed specifically for fast, ad hoc data visualization. SPICE stores your data in a system architected for high availability, where it is saved until you choose to delete it. You can improve the performance of database data sets by importing the data into SPICE instead of using a direct query to the database. All data sets that are not based on database data sources must use SPICE.
Figure 84: Data Set Creation in Quicksight
Tata Consultancy Services Use Case Document
TCS Confidential 59
Creating Dashboard
This section explains the procedure on how to create dashboard using multiple charts.
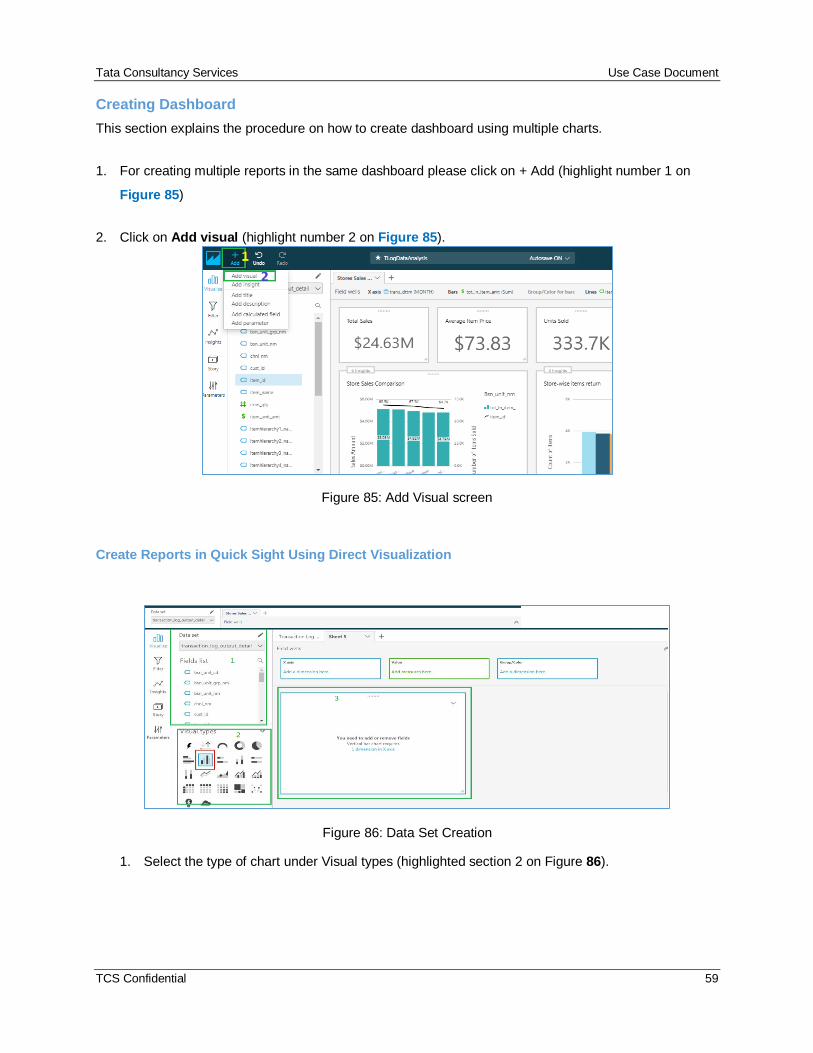
1. For creating multiple reports in the same dashboard please click on + Add (highlight number 1 on
Figure 85)
2. Click on Add visual (highlight number 2 on Figure 85).
Figure 85: Add Visual screen
Create Reports in Quick Sight Using Direct Visualization
Figure 86: Data Set Creation
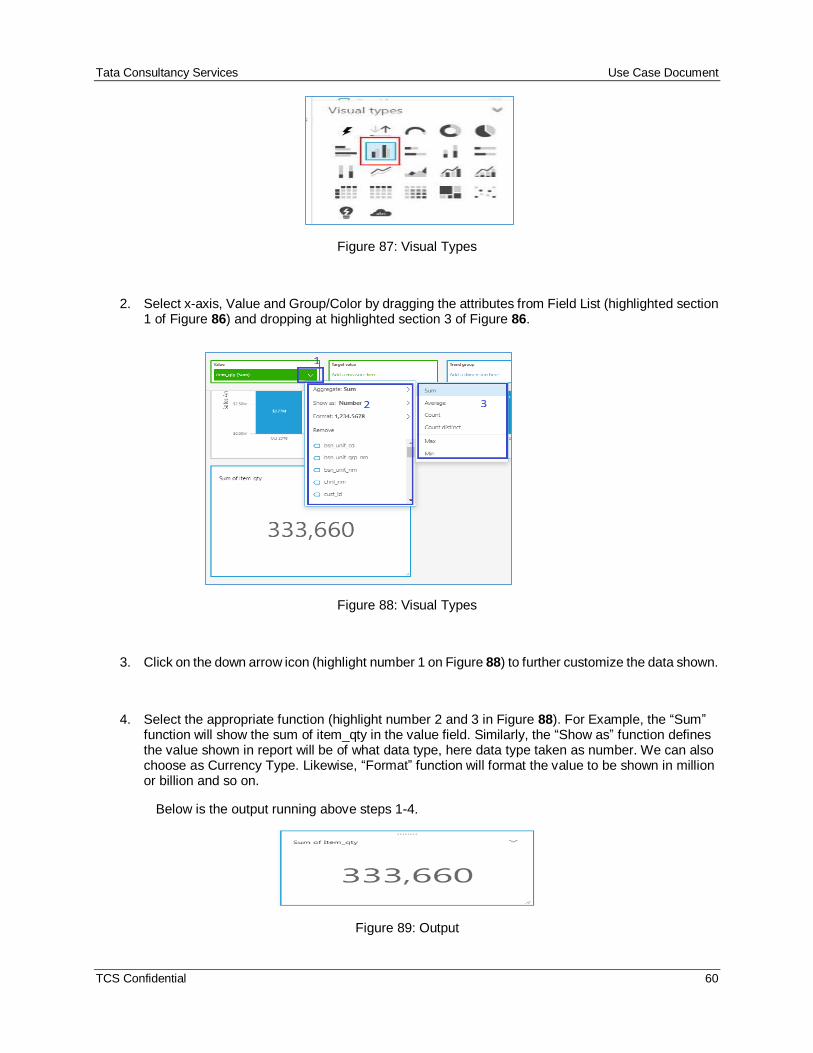
1. Select the type of chart under Visual types (highlighted section 2 on Figure 86).
Tata Consultancy Services Use Case Document
TCS Confidential 60
Figure 87: Visual Types
2. Select x-axis, Value and Group/Color by dragging the attributes from Field List (highlighted section 1 of Figure 86) and dropping at highlighted section 3 of Figure 86.
Figure 88: Visual Types
3. Click on the down arrow icon (highlight number 1 on Figure 88) to further customize the data shown.
4. Select the appropriate function (highlight number 2 and 3 in Figure 88). For Example, the “Sum” function will show the sum of item_qty in the value field. Similarly, the “Show as” function defines the value shown in report will be of what data type, here data type taken as number. We can also choose as Currency Type. Likewise, “Format” function will format the value to be shown in million or billion and so on.
Below is the output running above steps 1-4.
Figure 89: Output
Tata Consultancy Services Use Case Document
TCS Confidential 61
Create Reports in Quick Sight Using Custom SQL
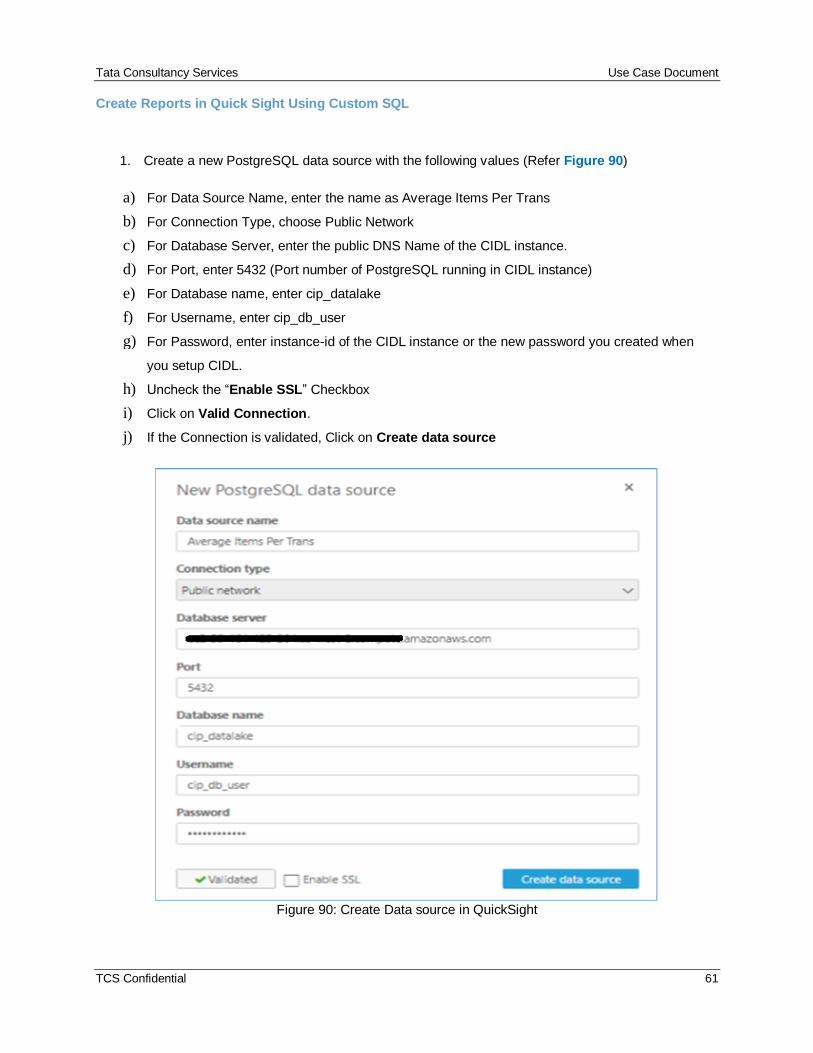
1. Create a new PostgreSQL data source with the following values (Refer Figure 90)
a) For Data Source Name, enter the name as Average Items Per Trans
b) For Connection Type, choose Public Network
c) For Database Server, enter the public DNS Name of the CIDL instance.
d) For Port, enter 5432 (Port number of PostgreSQL running in CIDL instance)
e) For Database name, enter cip_datalake
f) For Username, enter cip_db_user
g) For Password, enter instance-id of the CIDL instance or the new password you created when
you setup CIDL.
h) Uncheck the “Enable SSL” Checkbox
i) Click on Valid Connection.
j) If the Connection is validated, Click on Create data source
Figure 90: Create Data source in QuickSight
Tata Consultancy Services Use Case Document
TCS Confidential 62
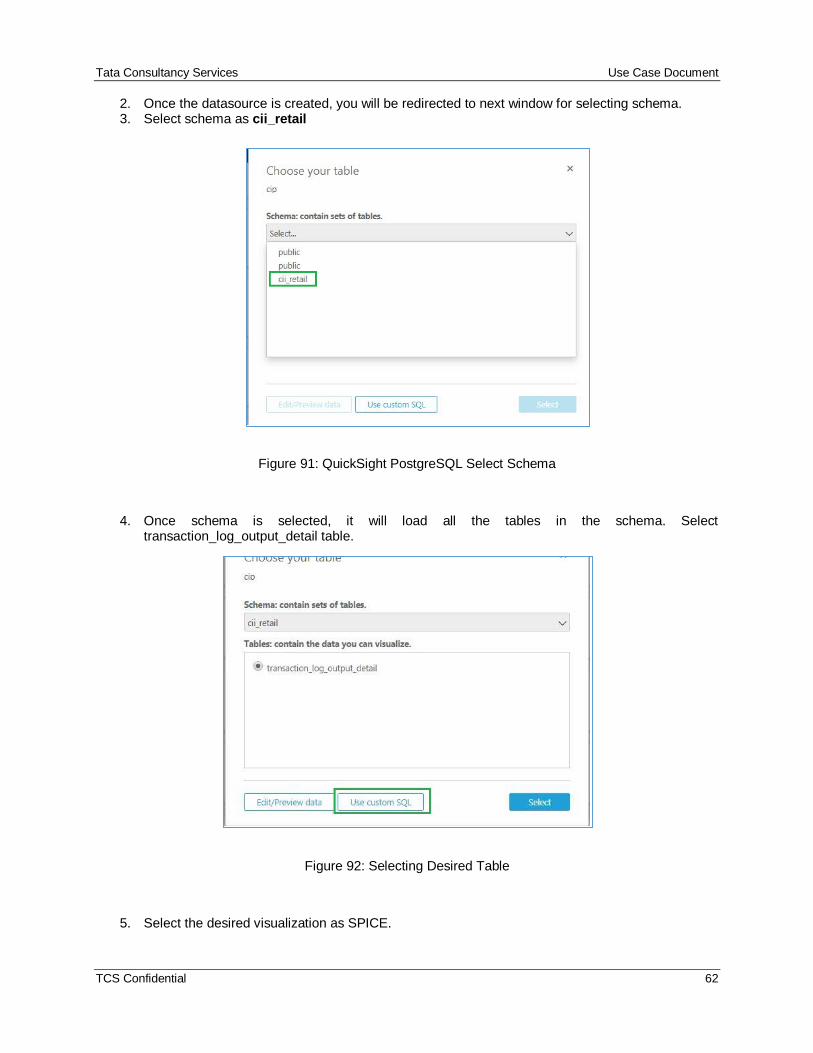
2. Once the datasource is created, you will be redirected to next window for selecting schema. 3. Select schema as cii_retail
Figure 91: QuickSight PostgreSQL Select Schema
4. Once schema is selected, it will load all the tables in the schema. Select transaction_log_output_detail table.
Figure 92: Selecting Desired Table
5. Select the desired visualization as SPICE.
Tata Consultancy Services Use Case Document
TCS Confidential 63
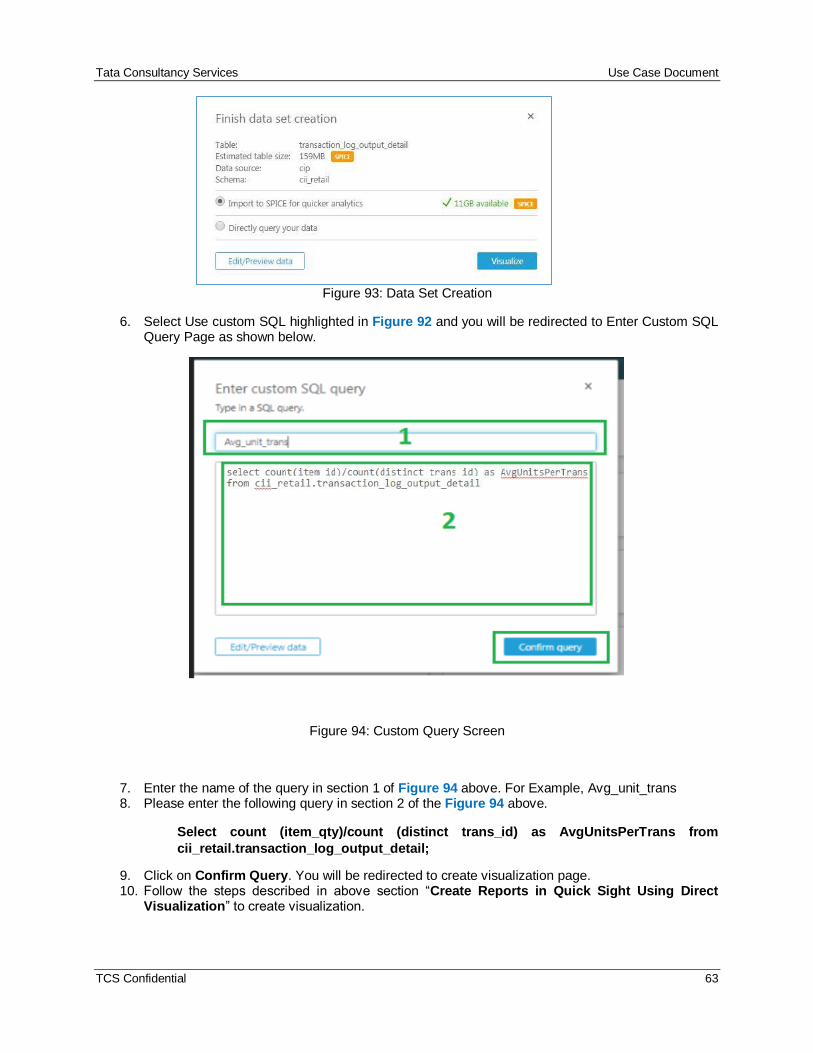
Figure 93: Data Set Creation
6. Select Use custom SQL highlighted in Figure 92 and you will be redirected to Enter Custom SQL Query Page as shown below.
Figure 94: Custom Query Screen
7. Enter the name of the query in section 1 of Figure 94 above. For Example, Avg_unit_trans 8. Please enter the following query in section 2 of the Figure 94 above.
Select count (item_qty)/count (distinct trans_id) as AvgUnitsPerTrans from
cii_retail.transaction_log_output_detail;
9. Click on Confirm Query. You will be redirected to create visualization page. 10. Follow the steps described in above section “Create Reports in Quick Sight Using Direct
Visualization” to create visualization.
Tata Consultancy Services Use Case Document
TCS Confidential 64
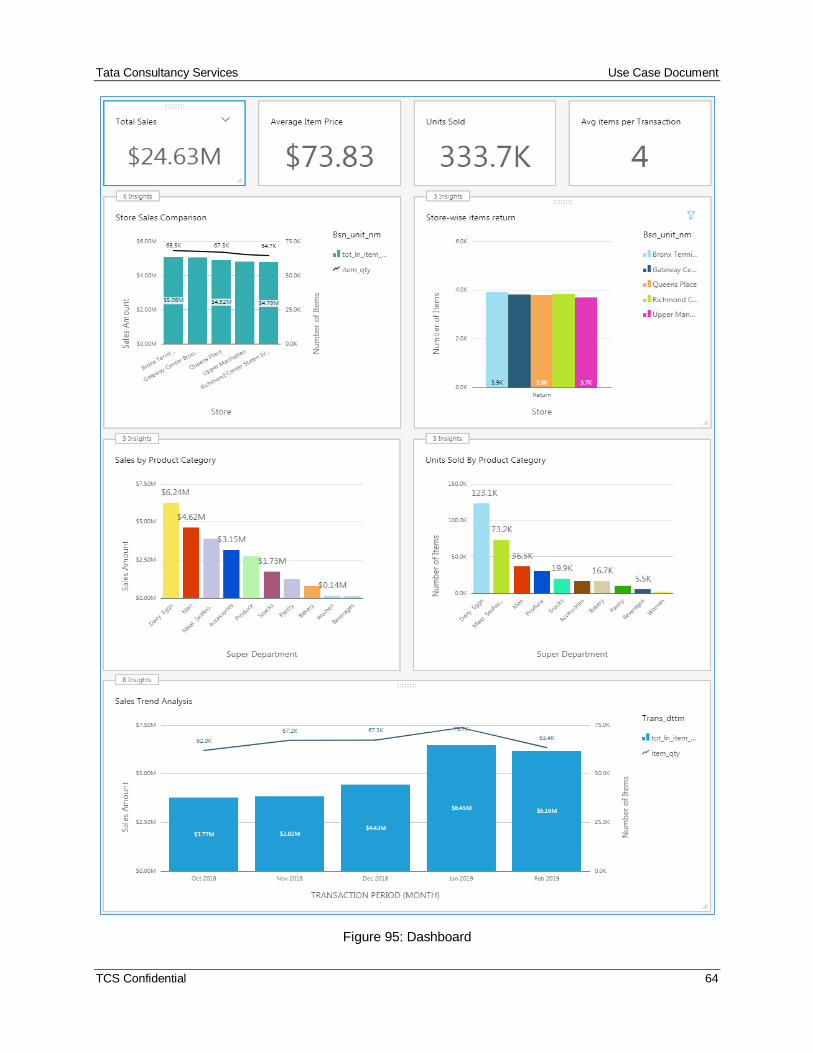
Figure 95: Dashboard
Tata Consultancy Services Use Case Document
TCS Confidential 65
The above dashboard has multiple charts. Each chart is numbered to explain how it is created.
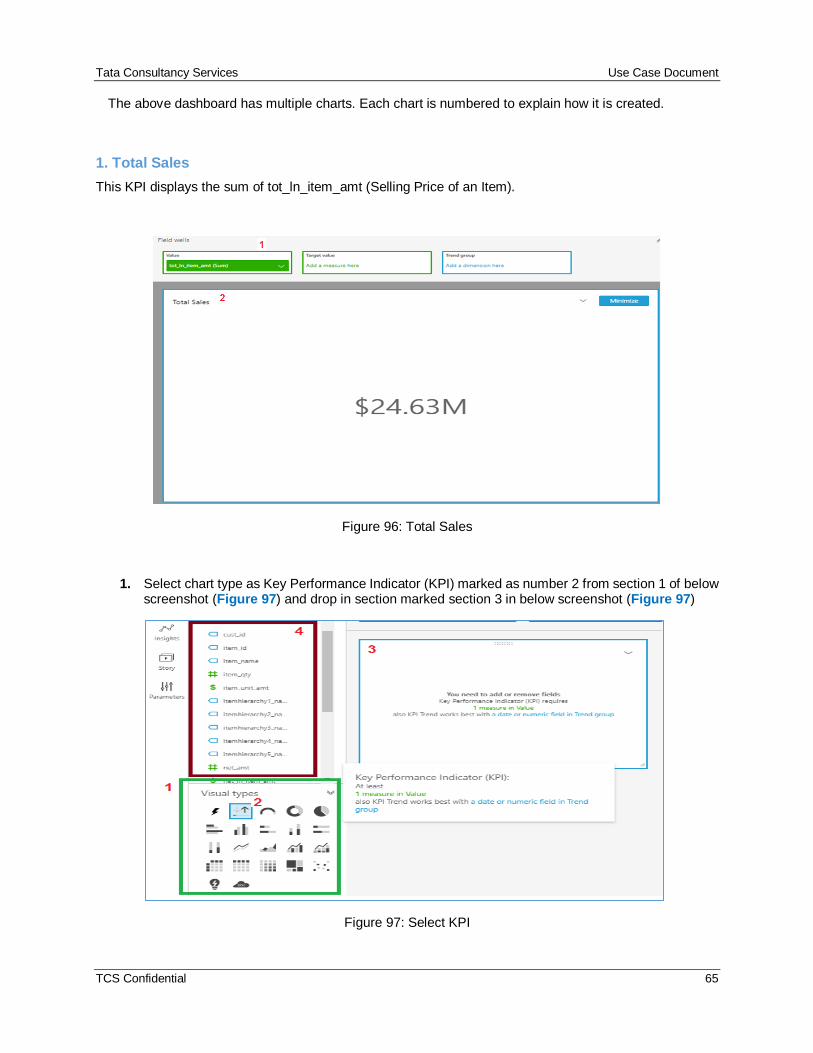
1. Total Sales
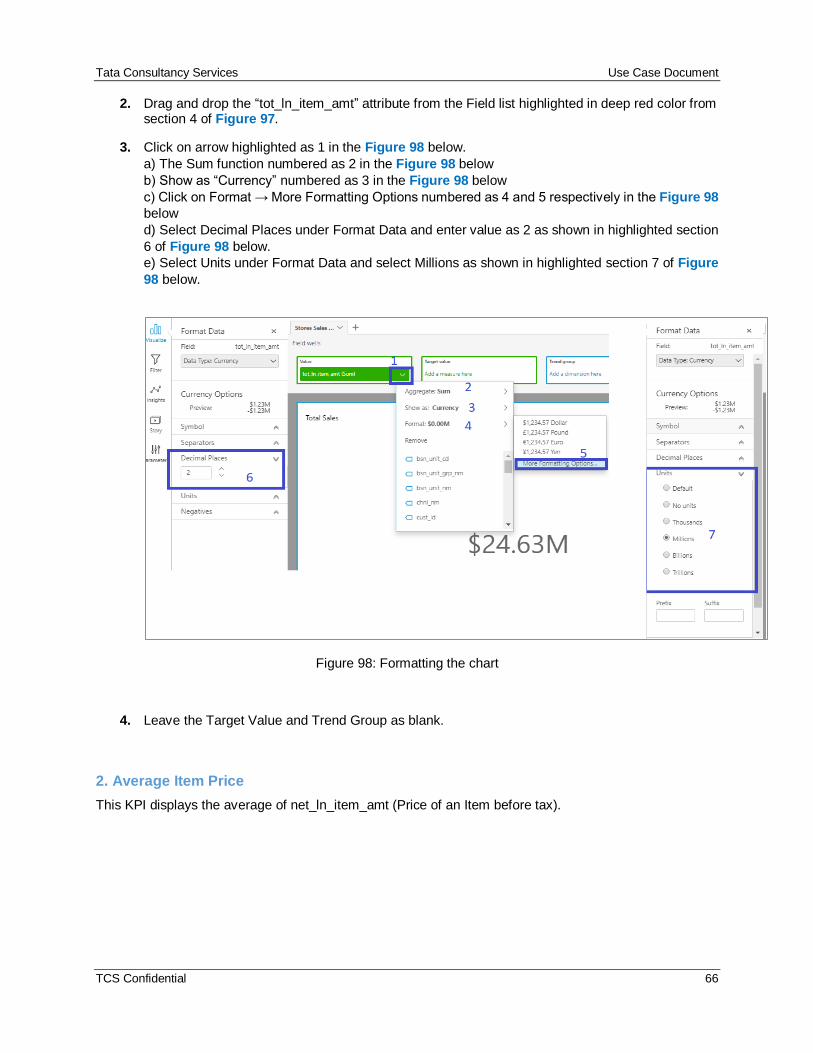
This KPI displays the sum of tot_ln_item_amt (Selling Price of an Item).
Figure 96: Total Sales
1. Select chart type as Key Performance Indicator (KPI) marked as number 2 from section 1 of below screenshot (Figure 97) and drop in section marked section 3 in below screenshot (Figure 97)
Figure 97: Select KPI
Tata Consultancy Services Use Case Document
TCS Confidential 66
2. Drag and drop the “tot_ln_item_amt” attribute from the Field list highlighted in deep red color from section 4 of Figure 97.
3. Click on arrow highlighted as 1 in the Figure 98 below.
a) The Sum function numbered as 2 in the Figure 98 below
b) Show as “Currency” numbered as 3 in the Figure 98 below
c) Click on Format → More Formatting Options numbered as 4 and 5 respectively in the Figure 98
below
d) Select Decimal Places under Format Data and enter value as 2 as shown in highlighted section
6 of Figure 98 below.
e) Select Units under Format Data and select Millions as shown in highlighted section 7 of Figure
98 below.
Figure 98: Formatting the chart
4. Leave the Target Value and Trend Group as blank.
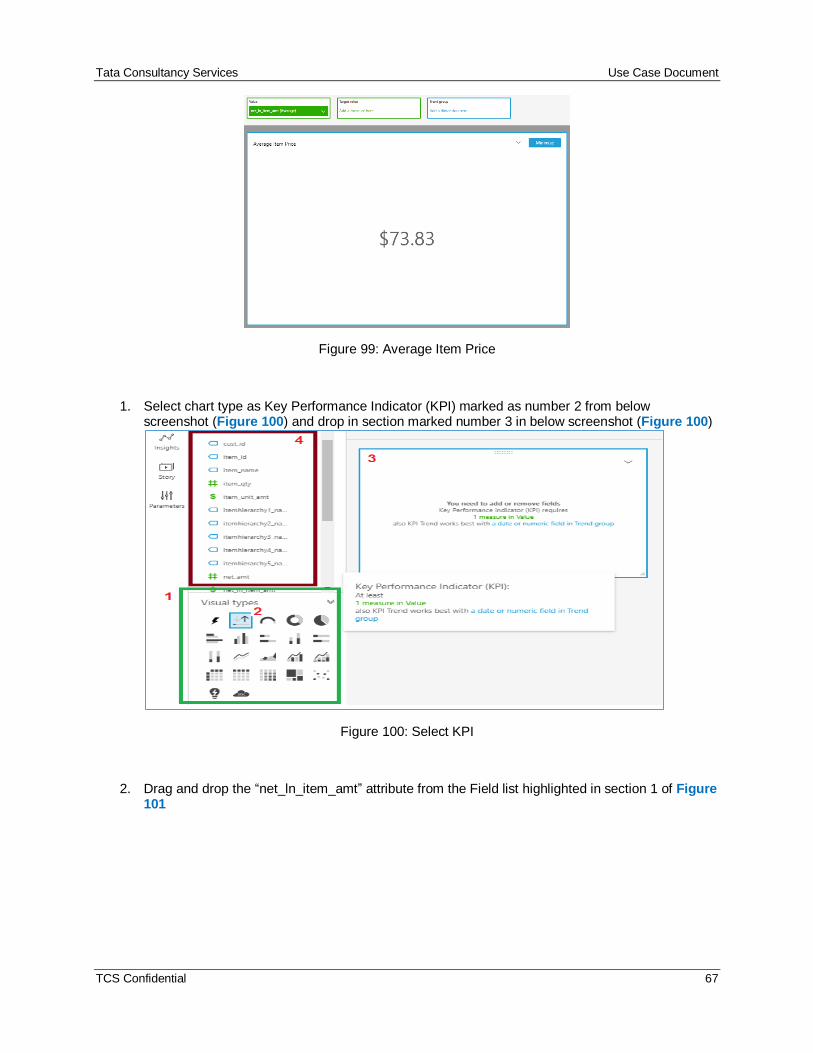
2. Average Item Price
This KPI displays the average of net_ln_item_amt (Price of an Item before tax).
Tata Consultancy Services Use Case Document
TCS Confidential 67
Figure 99: Average Item Price
1. Select chart type as Key Performance Indicator (KPI) marked as number 2 from below screenshot (Figure 100) and drop in section marked number 3 in below screenshot (Figure 100)
Figure 100: Select KPI
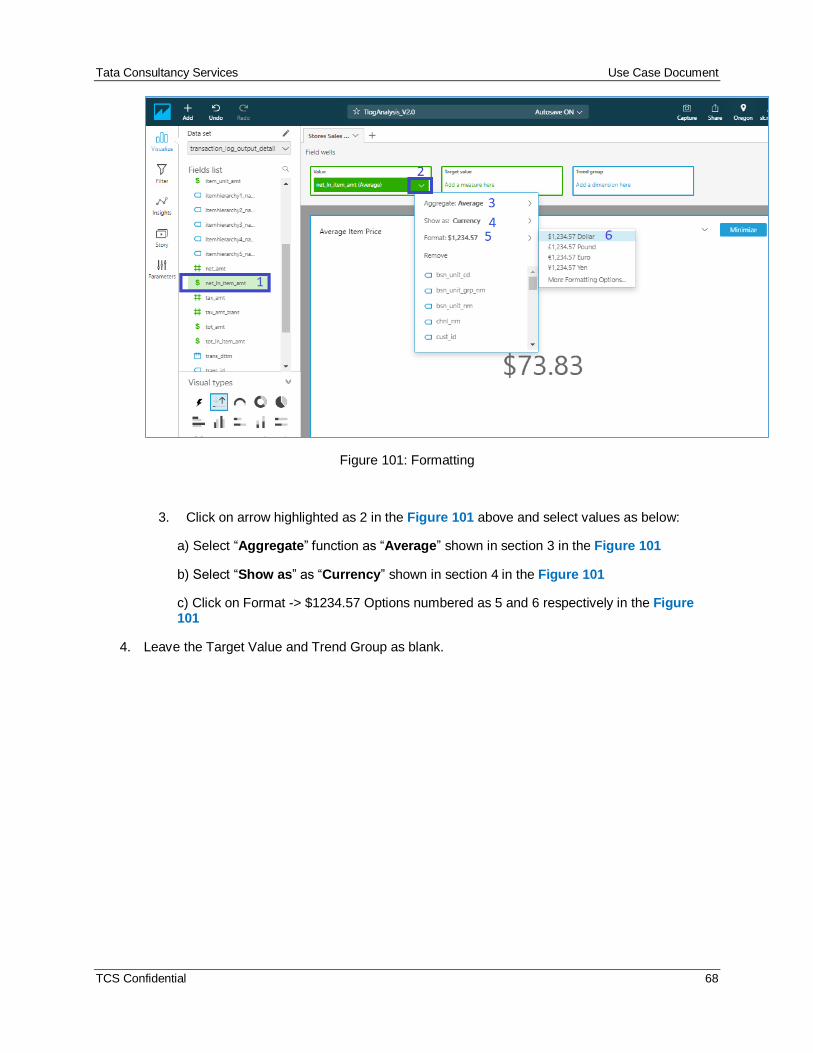
2. Drag and drop the “net_ln_item_amt” attribute from the Field list highlighted in section 1 of Figure 101
Tata Consultancy Services Use Case Document
TCS Confidential 68
Figure 101: Formatting
3. Click on arrow highlighted as 2 in the Figure 101 above and select values as below:
a) Select “Aggregate” function as “Average” shown in section 3 in the Figure 101
b) Select “Show as” as “Currency” shown in section 4 in the Figure 101
c) Click on Format -> $1234.57 Options numbered as 5 and 6 respectively in the Figure 101
4. Leave the Target Value and Trend Group as blank.
Tata Consultancy Services Use Case Document
TCS Confidential 69
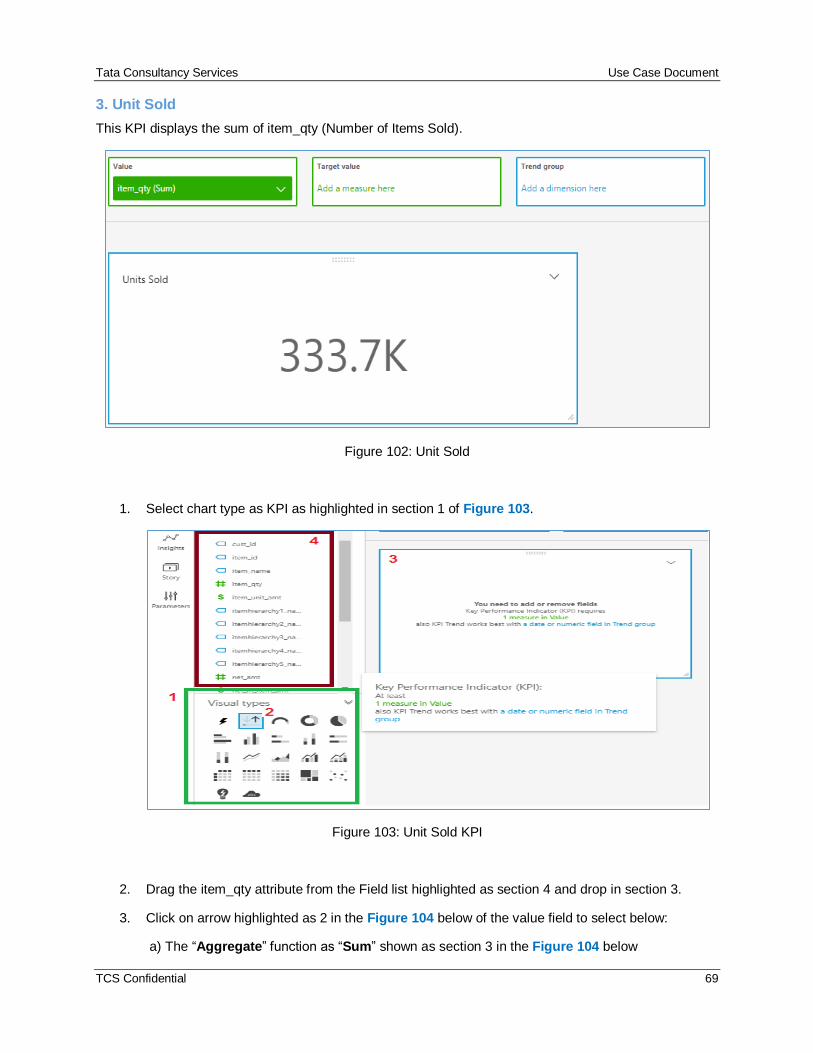
3. Unit Sold
This KPI displays the sum of item_qty (Number of Items Sold).
Figure 102: Unit Sold
1. Select chart type as KPI as highlighted in section 1 of Figure 103.
Figure 103: Unit Sold KPI
2. Drag the item_qty attribute from the Field list highlighted as section 4 and drop in section 3.
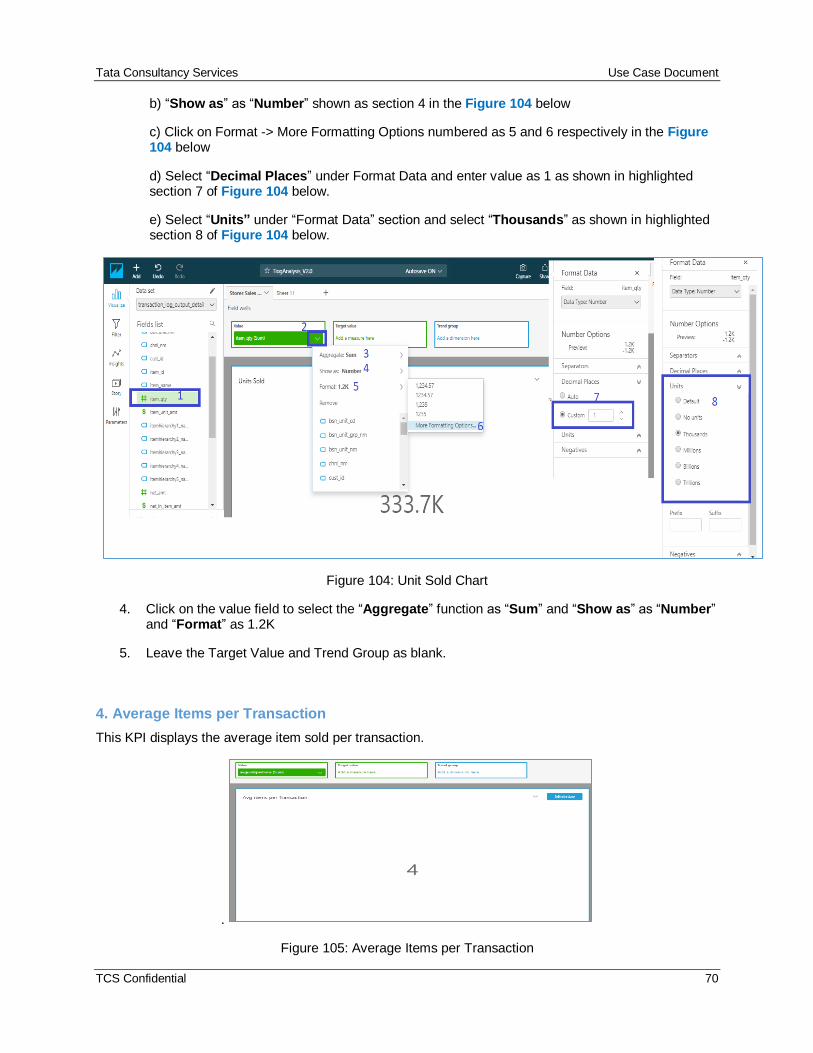
3. Click on arrow highlighted as 2 in the Figure 104 below of the value field to select below:
a) The “Aggregate” function as “Sum” shown as section 3 in the Figure 104 below
Tata Consultancy Services Use Case Document
TCS Confidential 70
b) “Show as” as “Number” shown as section 4 in the Figure 104 below
c) Click on Format -> More Formatting Options numbered as 5 and 6 respectively in the Figure 104 below
d) Select “Decimal Places” under Format Data and enter value as 1 as shown in highlighted section 7 of Figure 104 below.
e) Select “Units” under “Format Data” section and select “Thousands” as shown in highlighted section 8 of Figure 104 below.
Figure 104: Unit Sold Chart
4. Click on the value field to select the “Aggregate” function as “Sum” and “Show as” as “Number” and “Format” as 1.2K
5. Leave the Target Value and Trend Group as blank.
4. Average Items per Transaction
This KPI displays the average item sold per transaction.
.
Figure 105: Average Items per Transaction
Tata Consultancy Services Use Case Document
TCS Confidential 71
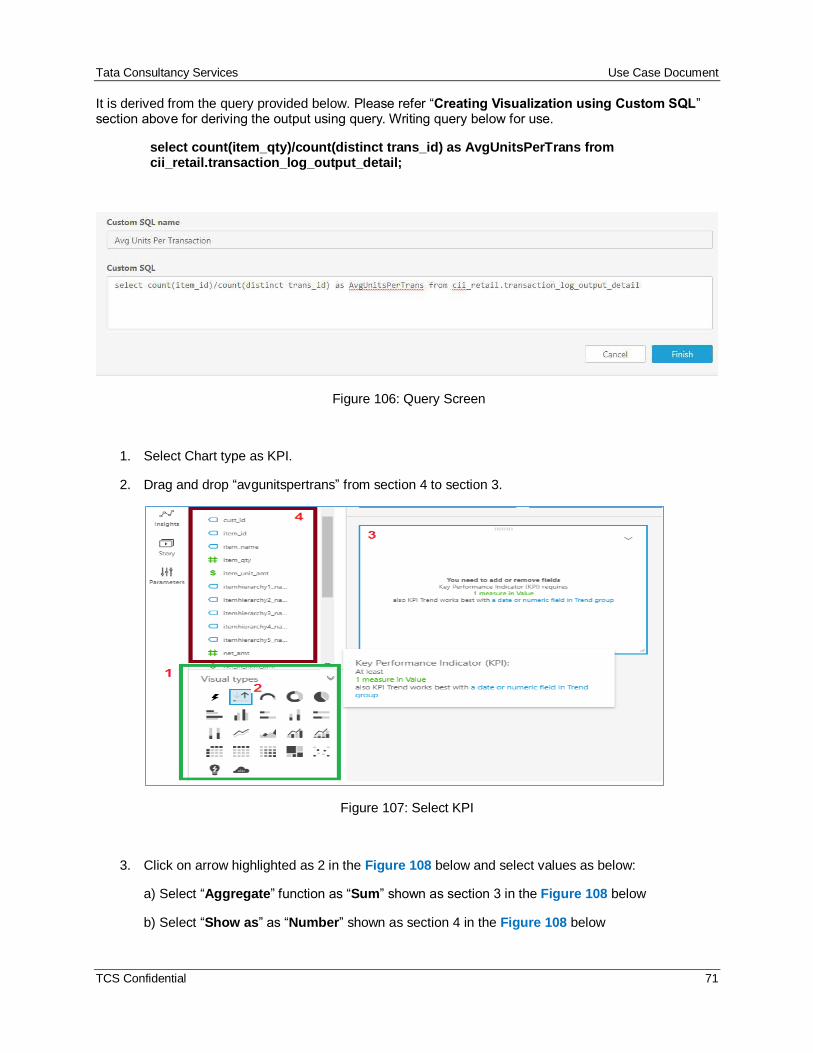
It is derived from the query provided below. Please refer “Creating Visualization using Custom SQL” section above for deriving the output using query. Writing query below for use.
select count(item_qty)/count(distinct trans_id) as AvgUnitsPerTrans from cii_retail.transaction_log_output_detail;
Figure 106: Query Screen
1. Select Chart type as KPI.
2. Drag and drop “avgunitspertrans” from section 4 to section 3.
Figure 107: Select KPI
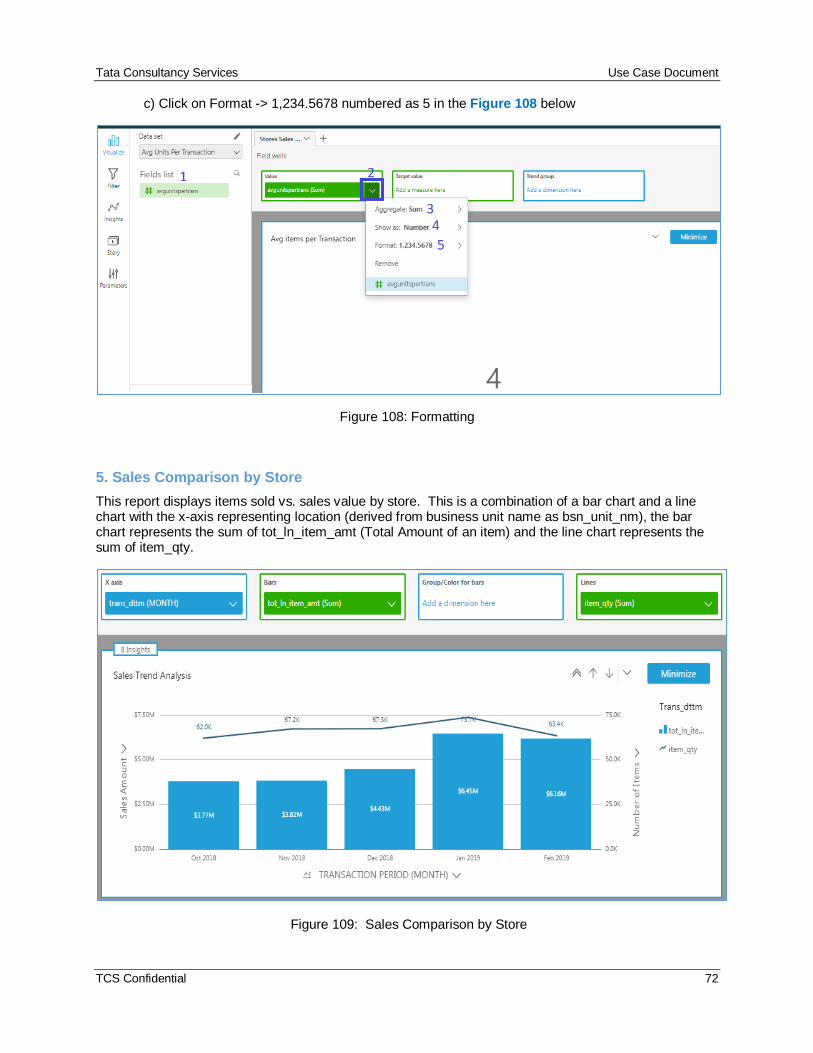
3. Click on arrow highlighted as 2 in the Figure 108 below and select values as below:
a) Select “Aggregate” function as “Sum” shown as section 3 in the Figure 108 below
b) Select “Show as” as “Number” shown as section 4 in the Figure 108 below
Tata Consultancy Services Use Case Document
TCS Confidential 72
c) Click on Format -> 1,234.5678 numbered as 5 in the Figure 108 below
Figure 108: Formatting
5. Sales Comparison by Store
This report displays items sold vs. sales value by store. This is a combination of a bar chart and a line chart with the x-axis representing location (derived from business unit name as bsn_unit_nm), the bar chart represents the sum of tot_ln_item_amt (Total Amount of an item) and the line chart represents the sum of item_qty.
Figure 109: Sales Comparison by Store
Tata Consultancy Services Use Case Document
TCS Confidential 73
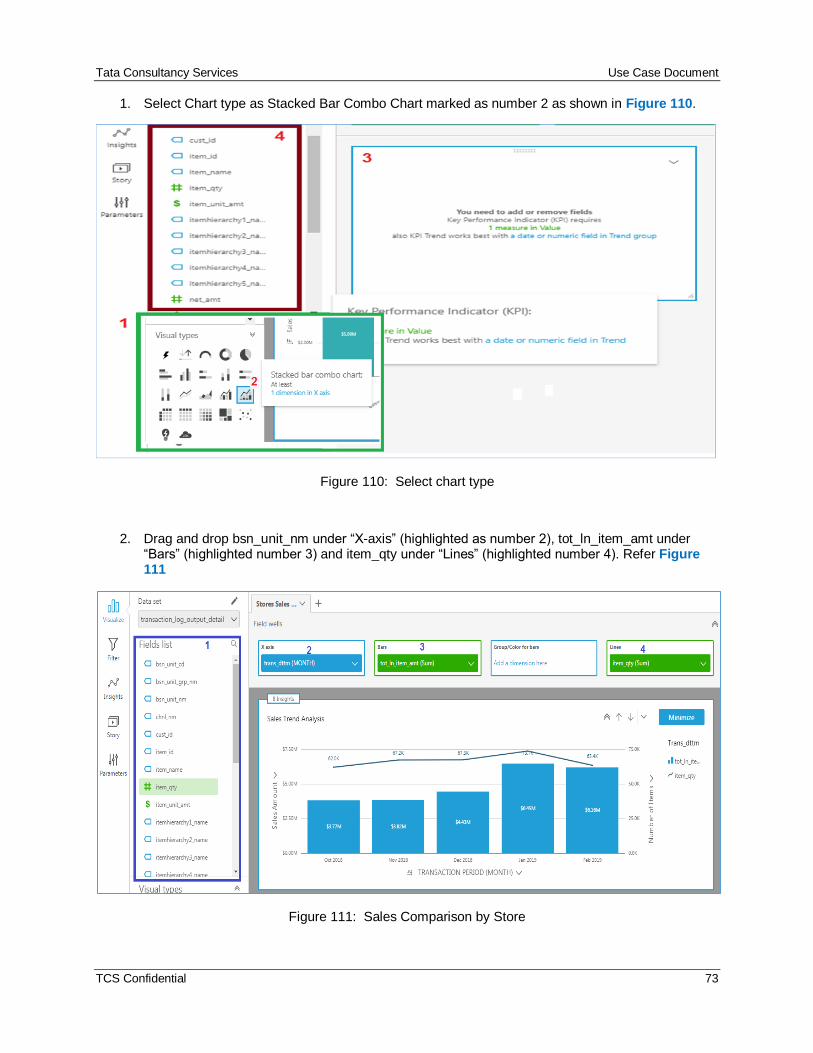
1. Select Chart type as Stacked Bar Combo Chart marked as number 2 as shown in Figure 110.
Figure 110: Select chart type
2. Drag and drop bsn_unit_nm under “X-axis” (highlighted as number 2), tot_ln_item_amt under “Bars” (highlighted number 3) and item_qty under “Lines” (highlighted number 4). Refer Figure 111
Figure 111: Sales Comparison by Store
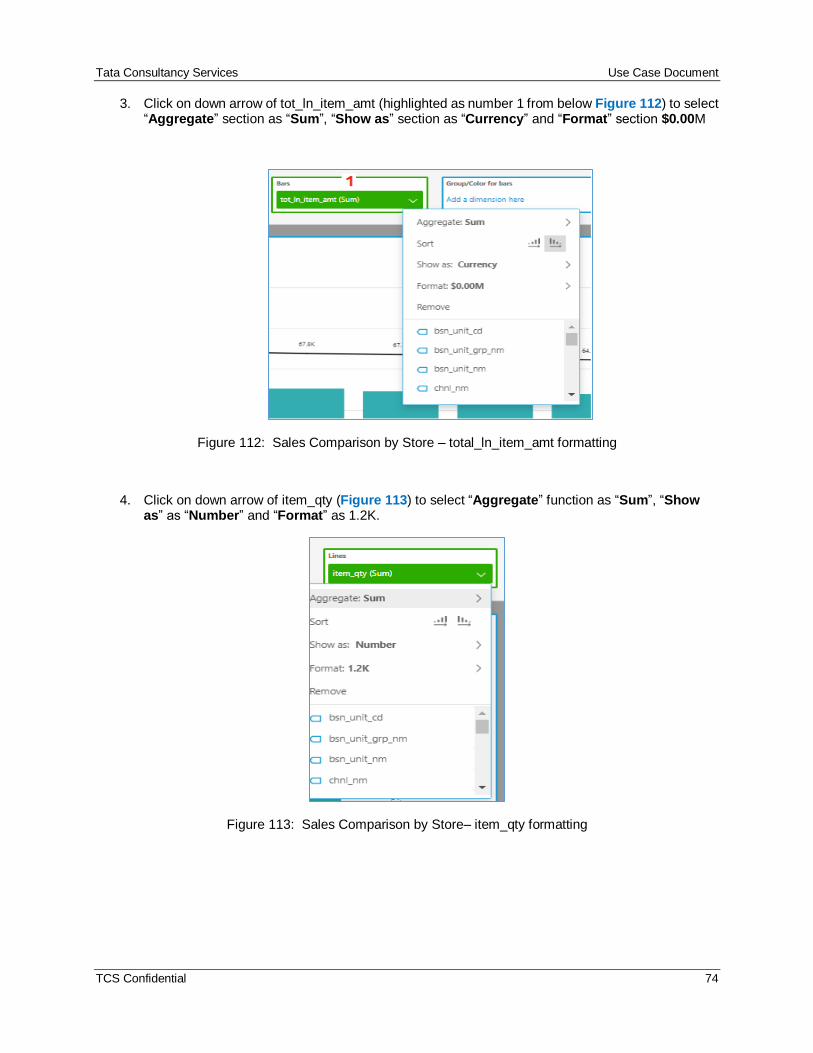
Tata Consultancy Services Use Case Document
TCS Confidential 74
3. Click on down arrow of tot_ln_item_amt (highlighted as number 1 from below Figure 112) to select “Aggregate” section as “Sum”, “Show as” section as “Currency” and “Format” section $0.00M
Figure 112: Sales Comparison by Store – total_ln_item_amt formatting
4. Click on down arrow of item_qty (Figure 113) to select “Aggregate” function as “Sum”, “Show as” as “Number” and “Format” as 1.2K.
Figure 113: Sales Comparison by Store– item_qty formatting
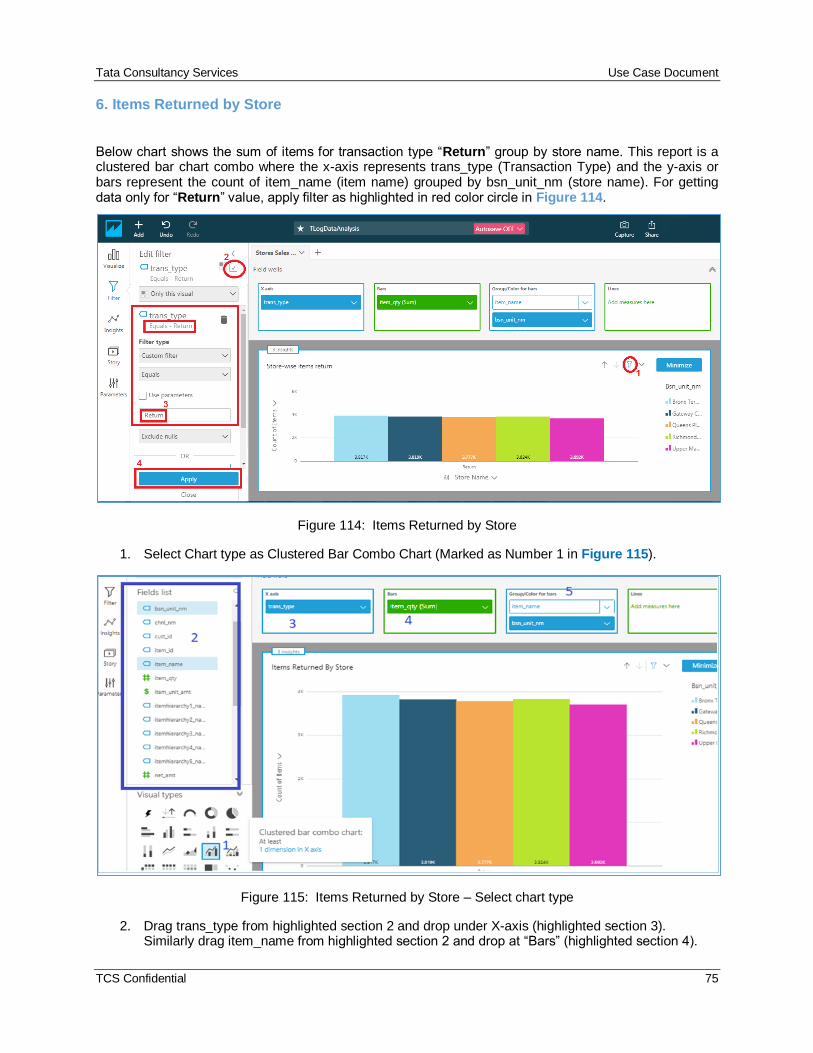
Tata Consultancy Services Use Case Document
TCS Confidential 75
6. Items Returned by Store
Below chart shows the sum of items for transaction type “Return” group by store name. This report is a clustered bar chart combo where the x-axis represents trans_type (Transaction Type) and the y-axis or bars represent the count of item_name (item name) grouped by bsn_unit_nm (store name). For getting data only for “Return” value, apply filter as highlighted in red color circle in Figure 114.
Figure 114: Items Returned by Store
1. Select Chart type as Clustered Bar Combo Chart (Marked as Number 1 in Figure 115).
Figure 115: Items Returned by Store – Select chart type
2. Drag trans_type from highlighted section 2 and drop under X-axis (highlighted section 3). Similarly drag item_name from highlighted section 2 and drop at “Bars” (highlighted section 4).
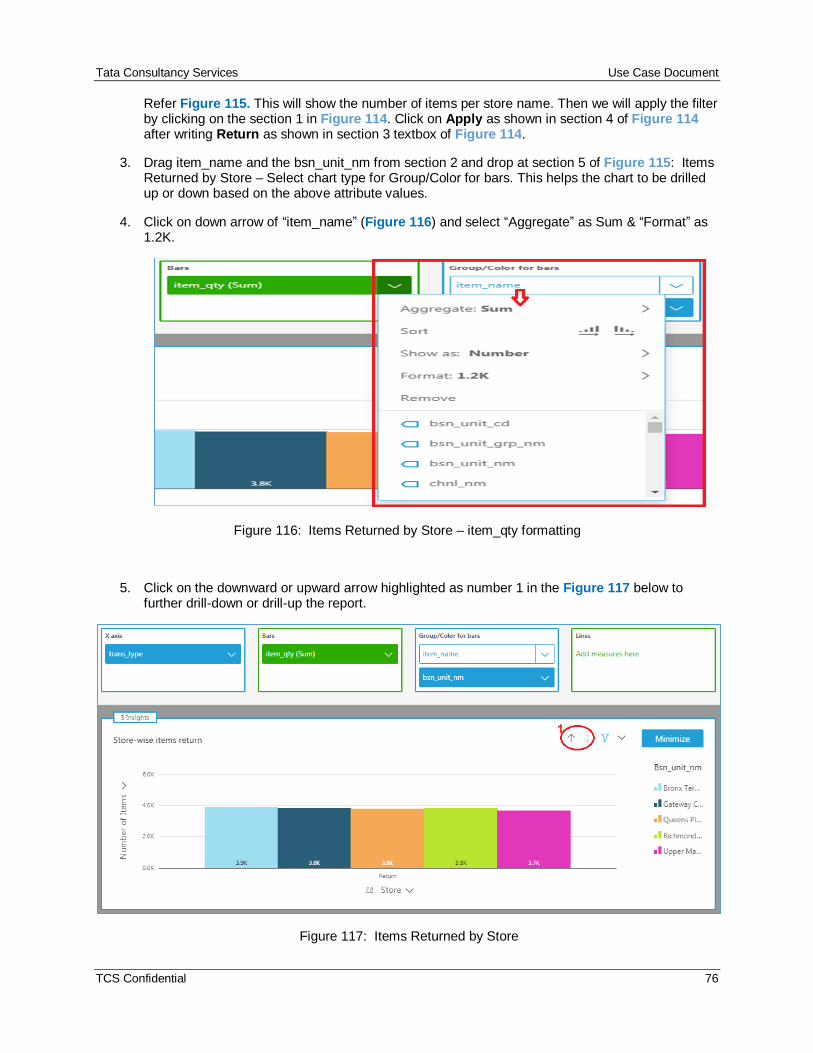
Tata Consultancy Services Use Case Document
TCS Confidential 76
Refer Figure 115. This will show the number of items per store name. Then we will apply the filter by clicking on the section 1 in Figure 114. Click on Apply as shown in section 4 of Figure 114 after writing Return as shown in section 3 textbox of Figure 114.
3. Drag item_name and the bsn_unit_nm from section 2 and drop at section 5 of Figure 115: Items Returned by Store – Select chart type for Group/Color for bars. This helps the chart to be drilled up or down based on the above attribute values.
4. Click on down arrow of “item_name” (Figure 116) and select “Aggregate” as Sum & “Format” as 1.2K.
Figure 116: Items Returned by Store – item_qty formatting
5. Click on the downward or upward arrow highlighted as number 1 in the Figure 117 below to further drill-down or drill-up the report.
Figure 117: Items Returned by Store
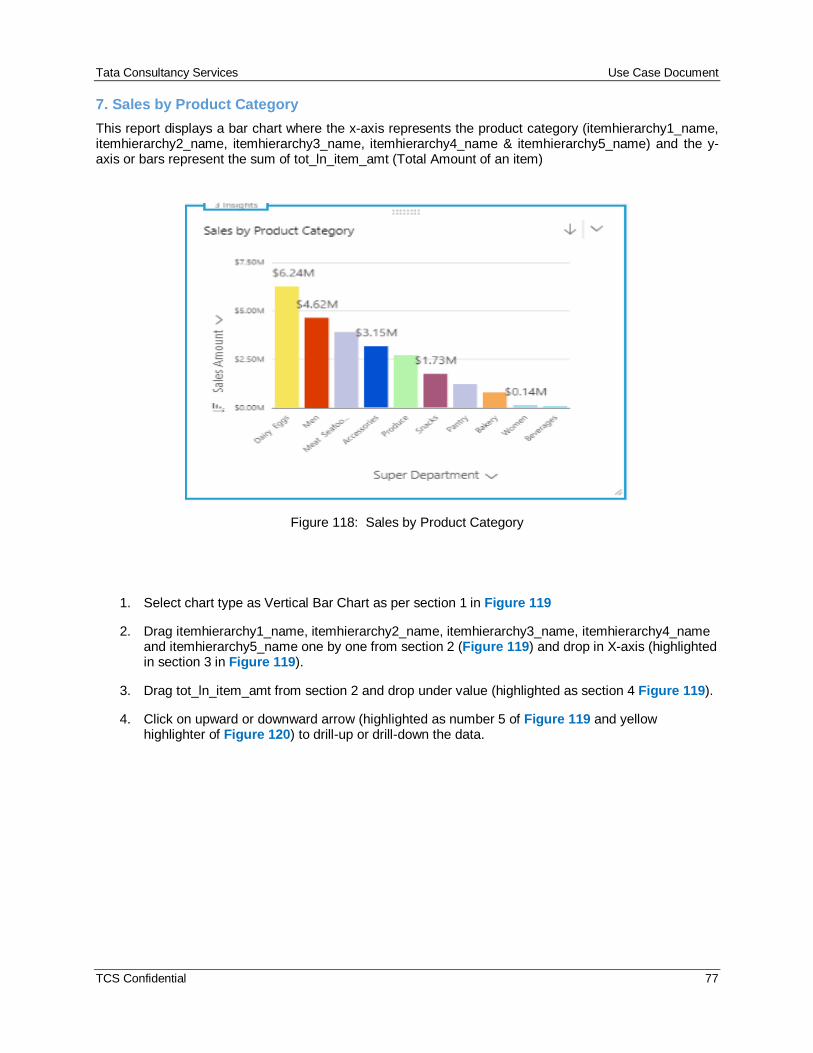
Tata Consultancy Services Use Case Document
TCS Confidential 77
7. Sales by Product Category
This report displays a bar chart where the x-axis represents the product category (itemhierarchy1_name, itemhierarchy2_name, itemhierarchy3_name, itemhierarchy4_name & itemhierarchy5_name) and the y-axis or bars represent the sum of tot_ln_item_amt (Total Amount of an item)
Figure 118: Sales by Product Category
1. Select chart type as Vertical Bar Chart as per section 1 in Figure 119
2. Drag itemhierarchy1_name, itemhierarchy2_name, itemhierarchy3_name, itemhierarchy4_name and itemhierarchy5_name one by one from section 2 (Figure 119) and drop in X-axis (highlighted in section 3 in Figure 119).
3. Drag tot_ln_item_amt from section 2 and drop under value (highlighted as section 4 Figure 119).
4. Click on upward or downward arrow (highlighted as number 5 of Figure 119 and yellow highlighter of Figure 120) to drill-up or drill-down the data.
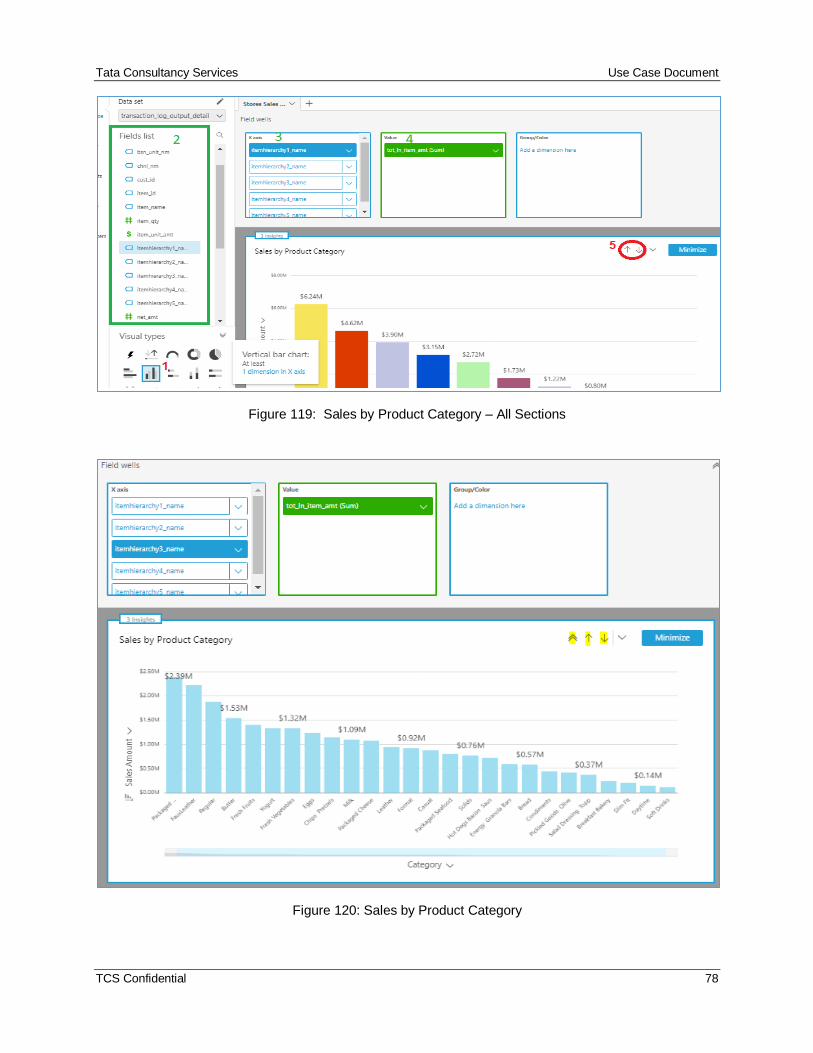
Tata Consultancy Services Use Case Document
TCS Confidential 78
Figure 119: Sales by Product Category – All Sections
Figure 120: Sales by Product Category
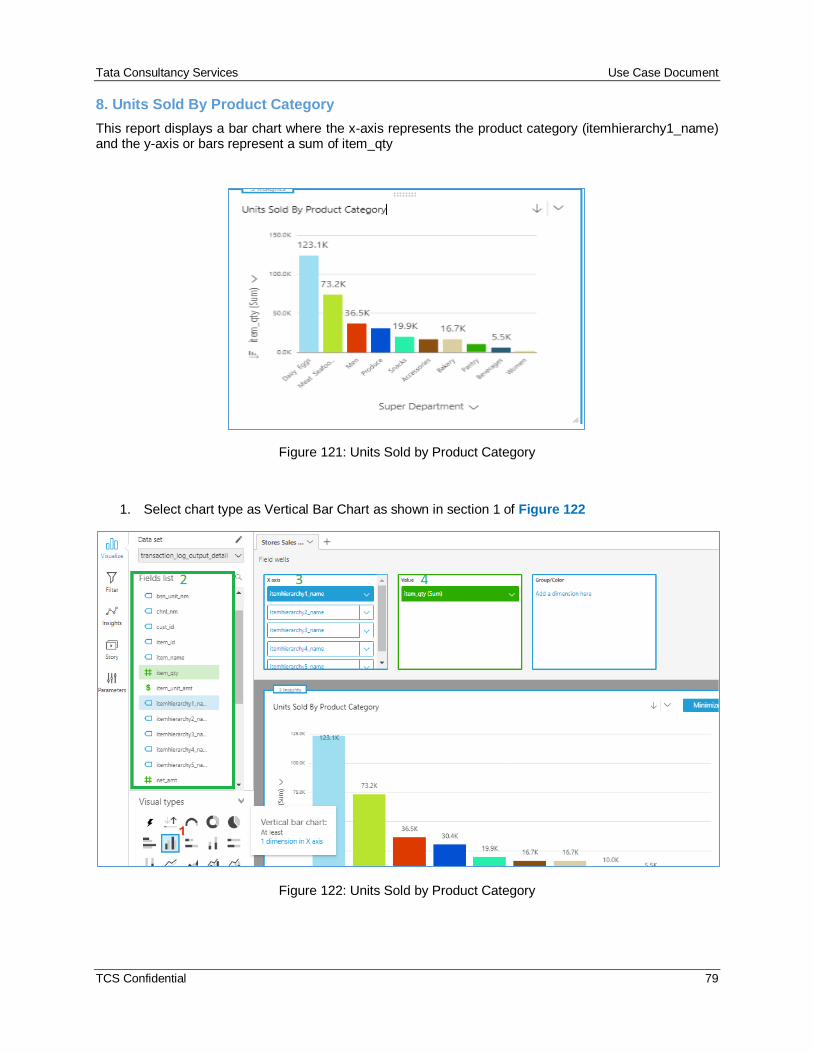
Tata Consultancy Services Use Case Document
TCS Confidential 79
8. Units Sold By Product Category
This report displays a bar chart where the x-axis represents the product category (itemhierarchy1_name) and the y-axis or bars represent a sum of item_qty
Figure 121: Units Sold by Product Category
1. Select chart type as Vertical Bar Chart as shown in section 1 of Figure 122
Figure 122: Units Sold by Product Category
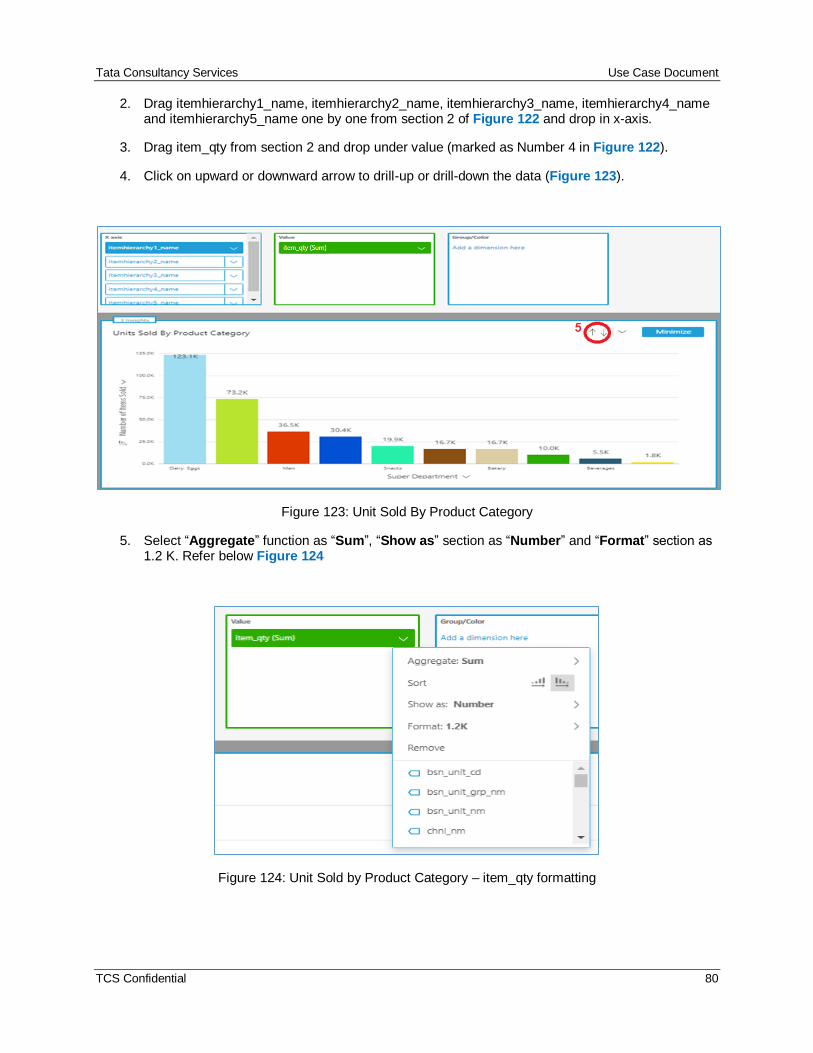
Tata Consultancy Services Use Case Document
TCS Confidential 80
2. Drag itemhierarchy1_name, itemhierarchy2_name, itemhierarchy3_name, itemhierarchy4_name and itemhierarchy5_name one by one from section 2 of Figure 122 and drop in x-axis.
3. Drag item_qty from section 2 and drop under value (marked as Number 4 in Figure 122).
4. Click on upward or downward arrow to drill-up or drill-down the data (Figure 123).
Figure 123: Unit Sold By Product Category
5. Select “Aggregate” function as “Sum”, “Show as” section as “Number” and “Format” section as 1.2 K. Refer below Figure 124
Figure 124: Unit Sold by Product Category – item_qty formatting
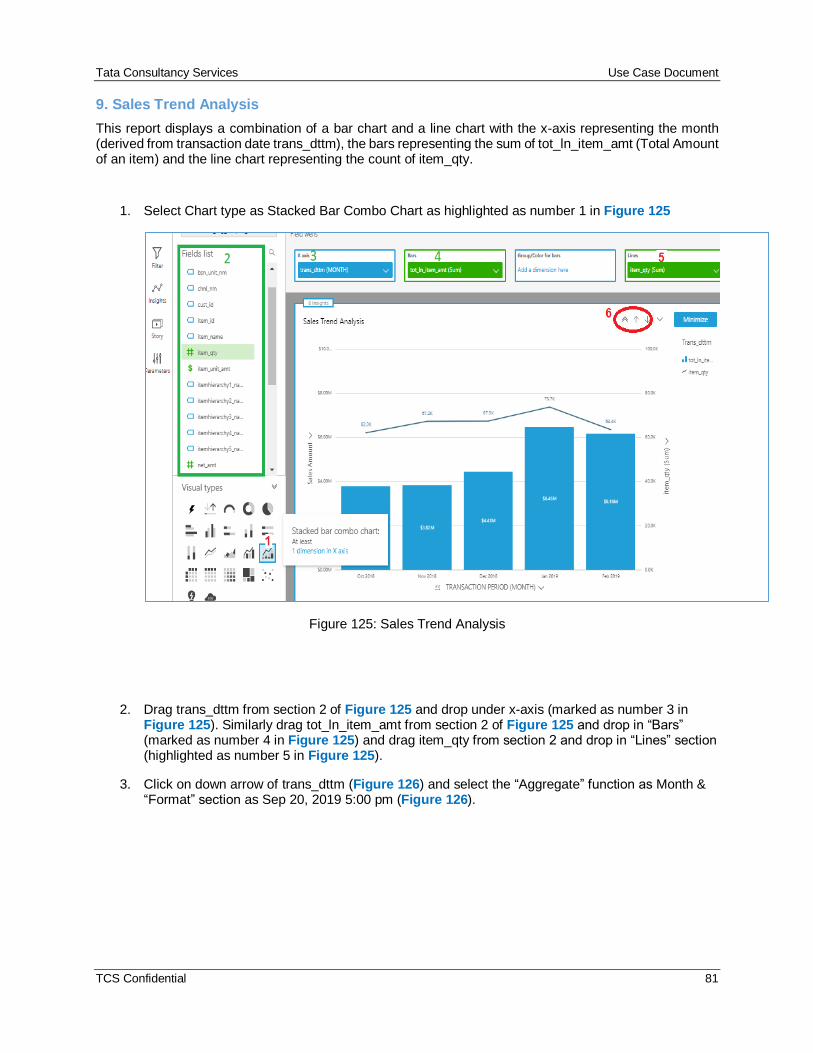
Tata Consultancy Services Use Case Document
TCS Confidential 81
9. Sales Trend Analysis
This report displays a combination of a bar chart and a line chart with the x-axis representing the month (derived from transaction date trans_dttm), the bars representing the sum of tot_ln_item_amt (Total Amount of an item) and the line chart representing the count of item_qty.
1. Select Chart type as Stacked Bar Combo Chart as highlighted as number 1 in Figure 125
Figure 125: Sales Trend Analysis
2. Drag trans_dttm from section 2 of Figure 125 and drop under x-axis (marked as number 3 in Figure 125). Similarly drag tot_ln_item_amt from section 2 of Figure 125 and drop in “Bars” (marked as number 4 in Figure 125) and drag item_qty from section 2 and drop in “Lines” section (highlighted as number 5 in Figure 125).
3. Click on down arrow of trans_dttm (Figure 126) and select the “Aggregate” function as Month & “Format” section as Sep 20, 2019 5:00 pm (Figure 126).
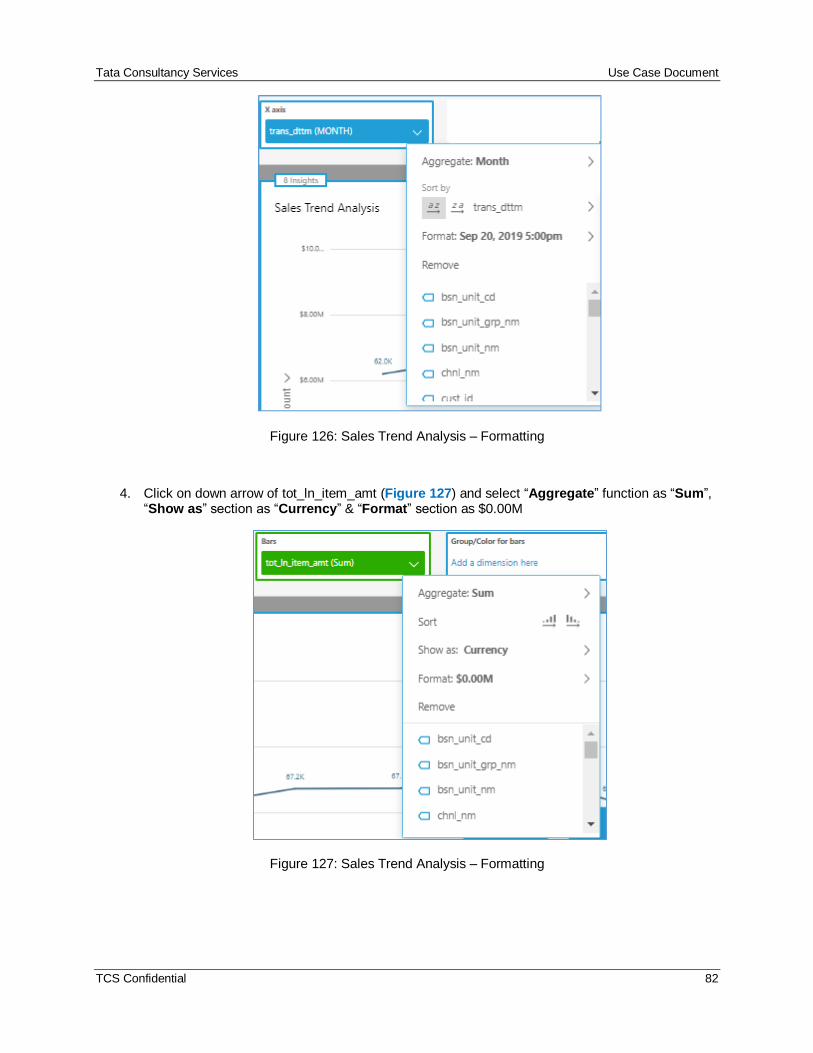
Tata Consultancy Services Use Case Document
TCS Confidential 82
Figure 126: Sales Trend Analysis – Formatting
4. Click on down arrow of tot_ln_item_amt (Figure 127) and select “Aggregate” function as “Sum”, “Show as” section as “Currency” & “Format” section as $0.00M
Figure 127: Sales Trend Analysis – Formatting
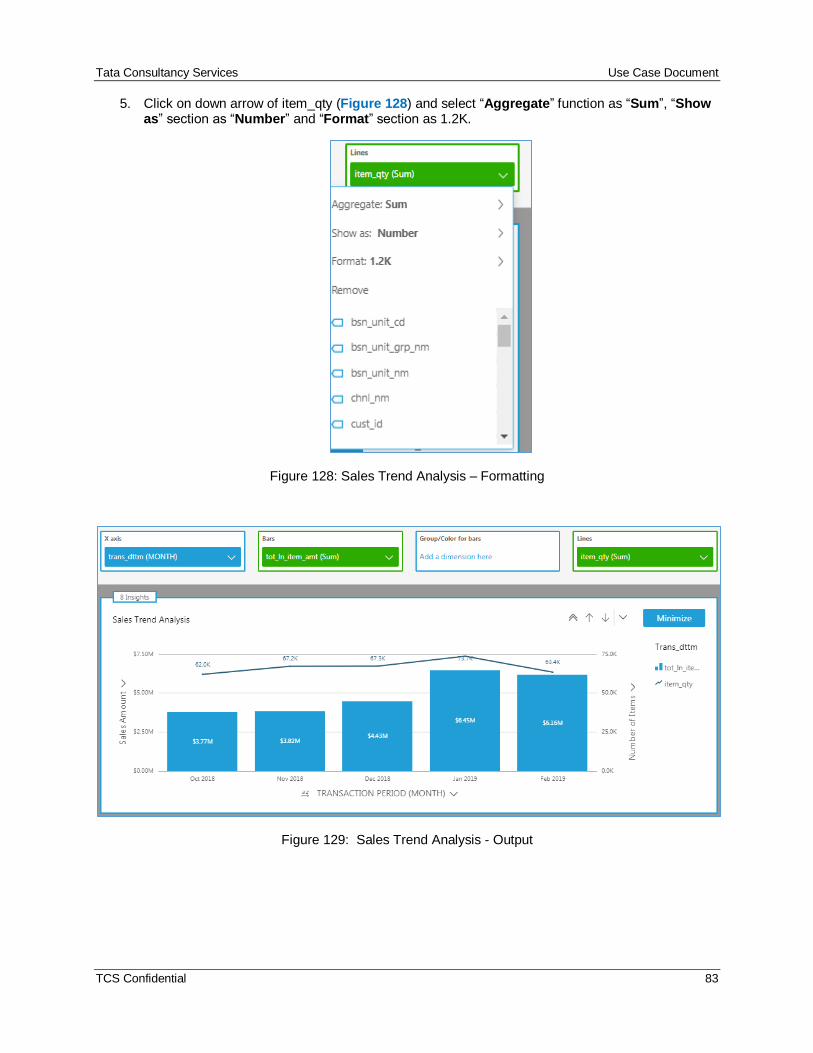
Tata Consultancy Services Use Case Document
TCS Confidential 83
5. Click on down arrow of item_qty (Figure 128) and select “Aggregate” function as “Sum”, “Show as” section as “Number” and “Format” section as 1.2K.
Figure 128: Sales Trend Analysis – Formatting
Figure 129: Sales Trend Analysis - Output
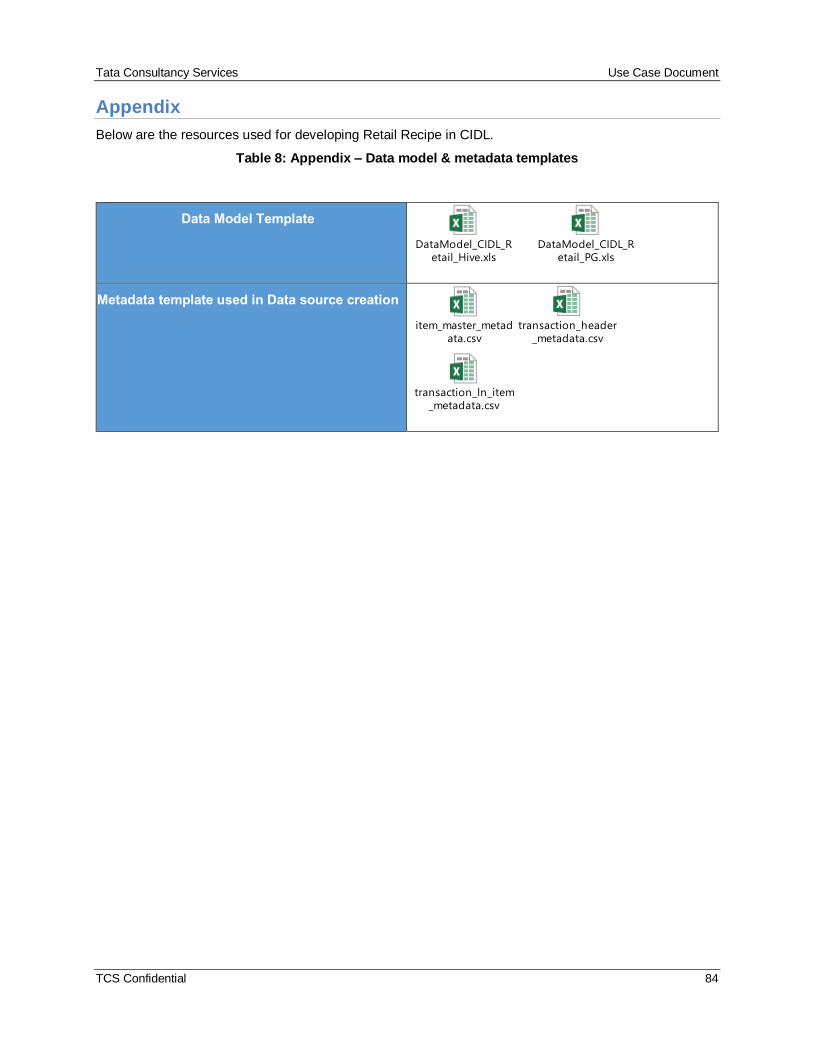
Tata Consultancy Services Use Case Document
TCS Confidential 84
Appendix
Below are the resources used for developing Retail Recipe in CIDL.
Table 8: Appendix – Data model & metadata templates
Data Model Template
DataModel_CIDL_R
etail_Hive.xls
DataModel_CIDL_R
etail_PG.xls
Metadata template used in Data source creation
item_master_metad
ata.csv
transaction_header
_metadata.csv
transaction_ln_item
_metadata.csv
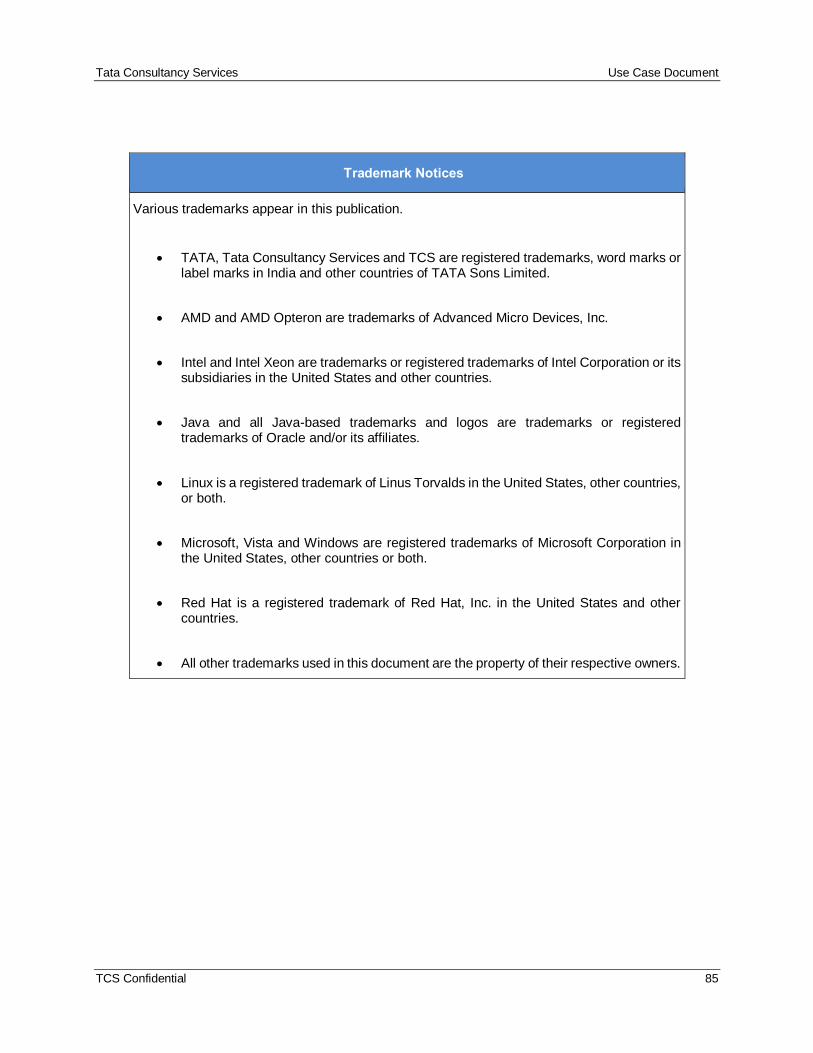
Tata Consultancy Services Use Case Document
TCS Confidential 85
Trademark Notices
Various trademarks appear in this publication.
• TATA, Tata Consultancy Services and TCS are registered trademarks, word marks or label marks in India and other countries of TATA Sons Limited.
• AMD and AMD Opteron are trademarks of Advanced Micro Devices, Inc.
• Intel and Intel Xeon are trademarks or registered trademarks of Intel Corporation or its subsidiaries in the United States and other countries.
• Java and all Java-based trademarks and logos are trademarks or registered trademarks of Oracle and/or its affiliates.
• Linux is a registered trademark of Linus Torvalds in the United States, other countries, or both.
• Microsoft, Vista and Windows are registered trademarks of Microsoft Corporation in the United States, other countries or both.
• Red Hat is a registered trademark of Red Hat, Inc. in the United States and other countries.
• All other trademarks used in this document are the property of their respective owners.
About TCS' Digital Software & Solutions Group
With the rapidly growing influence of new digital technologies, embedding digital transformation in the company strategy has arisen as a key objective across industries. Recognizing this, TCS offers a comprehensive portfolio of software and solutions that help enterprises leverage these emerging digital technologies to their fullest competitive advantage.
Developed by industry experts, our fully integrated licensed software and solutions are configured to address our clients' specific business pain points within their industry context.
Our modular solutions help organizations more effectively respond to the rate of technology change and extend the influence of digital technologies to transform the business landscape. As a result, our clients can attract and build lifelong relationships with their customers, even as they reduce operational costs across the customer experience and digital commerce cycle. With TCS as a strategic partner, enterprises are empowered to respond with agility to the changing digital environment, achieving certainty in an increasingly uncertain digital world.
About Tata Consultancy Services Ltd (TCS)
Tata Consultancy Services is an IT services, consulting and business solutions organization that delivers real results to global business, ensuring a level of certainty no other firm can match. TCS offers a consulting-led, integrated portfolio of IT and IT-enabled infrastructure, engineering and assurance services. This is delivered through its unique Global Network Delivery Model™, recognized as the benchmark of excellence in software development. A part of the Tata Group, India’s largest industrial conglomerate, TCS has a global footprint and is listed on the National
Stock Exchange and Bombay Stock Exchange in India.
For more information, visit us at www.tcs.com
IT Services Business Solutions Consulting
Contact us:[email protected]


![DEFINED CONTRIBUTION VOLUME SUBMITTER PLAN AND … · defined contribution volume submitter plan and trust basic plan document [dc-bpd #04]](https://static.fdocuments.in/doc/165x107/5b1609387f8b9a00708c8279/defined-contribution-volume-submitter-plan-and-defined-contribution-volume-submitter.jpg)