TCR Route 237
62
California Department of Transportation, District 4 – Page i STATE ROUTE 237 TRANSPORTATION CONCEPT REPORT This Transportation Concept Report (TCR) is a Caltrans long-range planning document that informs the regional transportation planning process. The TCR provides information regarding route segments, including high priority projects for the highway through 2035, and existing and forecasted traffic data. Projects identified in the TCR will require environmental and engineering studies before final approval and are subject to change. Approvals:
Transcript of TCR Route 237
California Department of Transportation, District 4 – Page i
STATE ROUTE 237 TRANSPORTATION CONCEPT REPORT
This Transportation Concept Report (TCR) is a Caltrans long-range planning document that informs
the regional transportation planning process. The TCR provides information regarding route segments,
including high priority projects for the highway through 2035, and existing and forecasted traffic data.
Projects identified in the TCR will require environmental and engineering studies before final approval
and are subject to change.
Approvals:
California Department of Transportation, District 4 – Page ii
Stakeholder Acknowledgement
District 4 is pleased to acknowledge the time and contribution of stakeholders and partner
agencies to this Transportation Concept Report (TCR). Development of System Planning
documents is dependent upon the participation and cooperation of key stakeholders. This TCR
represents a cooperative planning effort for SR 237. Representatives of the Santa Clara Valley
Transportation Authority and Santa Clara County as well as Milpitas, San Jose, Santa Clara,
Sunnyvale, and Mountain View provided essential information, advice and feedback for the
preparation of this document.
This TCR will be posted on the Caltrans District 4 System Planning website at:
http://www.dot.ca.gov/dist4/systemplanning/
Document Preparation
This SR 237 TCR was prepared by:
FREDRICK SCHERMER
Associate Transportation Planner
Office of System and Regional Planning
System Planning East Bay / Santa Clara Branch
CAMERON OAKES
District Branch Chief
Office of System and Regional Planning
System Planning East Bay / Santa Clara Branch
Please contact us for any questions about this TCR:
Caltrans District 4 Division of Transportation Planning and Local Assistance
P.O. Box 23660, Oakland, CA 94623-0660 http://www.dot.ca.gov/dist4/systemplanning

California Department of Transportation, District 4 – Page iii
Table of Contents
I.
Stakeholder Acknowledgement
Executive Summary
Corridor Planning Process
Purpose and Need
Methodology
State‘s Interregional Responsibility
Corridor‘s Plan Consistency
ii
v
1
1
1
1
2
II. Corridor Overview
Corridor Description
Alignment and Geometrics
Demographics
Land Use
Environmental Constraints
Route Designations
Trip Information
Complete Streets
Maintenance
System Management
3
3
4
4
5
8
10
10
12
18
18
III. Corridor Performance
Existing Conditions
Future Conditions
VTA 2010 Monitoring Report
State of the System
Express Lanes
Freeway Performance
21
21
21
21
22
22
23
IV.
Key Corridor Issues
HOV and Express Lanes
Cross-connectivity: Managed Lanes
Sea Level Rise
Salt Ponds/Wetland Restoration Project
Dumbarton Rail Proposal
Bicycle Network: Across Barrier Connections
Moffett Field
Wildlife Crossing
Great America and Stadium Development
26
26
27
29
31
31
32
32
33
33

California Department of Transportation, District 4 – Page iv
V. Corridor Concept
Concept Rationale
SR 237 Corridor Concept Summary
Corridor Project Lists
Bicycle Strategies
Pedestrian Strategies
Additional Projects Recommended for Further Study
35
35
36
37
39
40
41
Appendices
A. Corridor Segment Data / Additional Corridor Data
- Additional Corridor Data for SR 237
B. Pertinent Federal, State, and Regional Transportation Plans, Programs,
and Directives.
- Federal
- State
- Region
- County
C. Freeway Agreements
D. Pavement Condition Map
E. SR 237 Origin-Destination Diagrams
42
42
47
48
48
48
50
50
52
53
54
California Department of Transportation, District 4 – Page v
Executive Summary
Purpose
The purpose of a Transportation Concept Report (TCR) is to communicate the Department‘s long range
(25-year) vision for a State Route. The concept is based on current and projected operating conditions
and acknowledges both programmed and planned transportation improvement projects along a route.
A TCR may also recommend basic mobility strategies and conceptual projects which warrant further
analysis. The TCR, completed in partnership with local jurisdictions and Congestion Management
Agencies (CMA), serves as one source of guidance for future development of a route. The concept aids
Caltrans engagement in the regional transportation planning process, early communication with local
agencies and CMAs concerning specific issues and route significance, and supports the early stages of
the project development process.
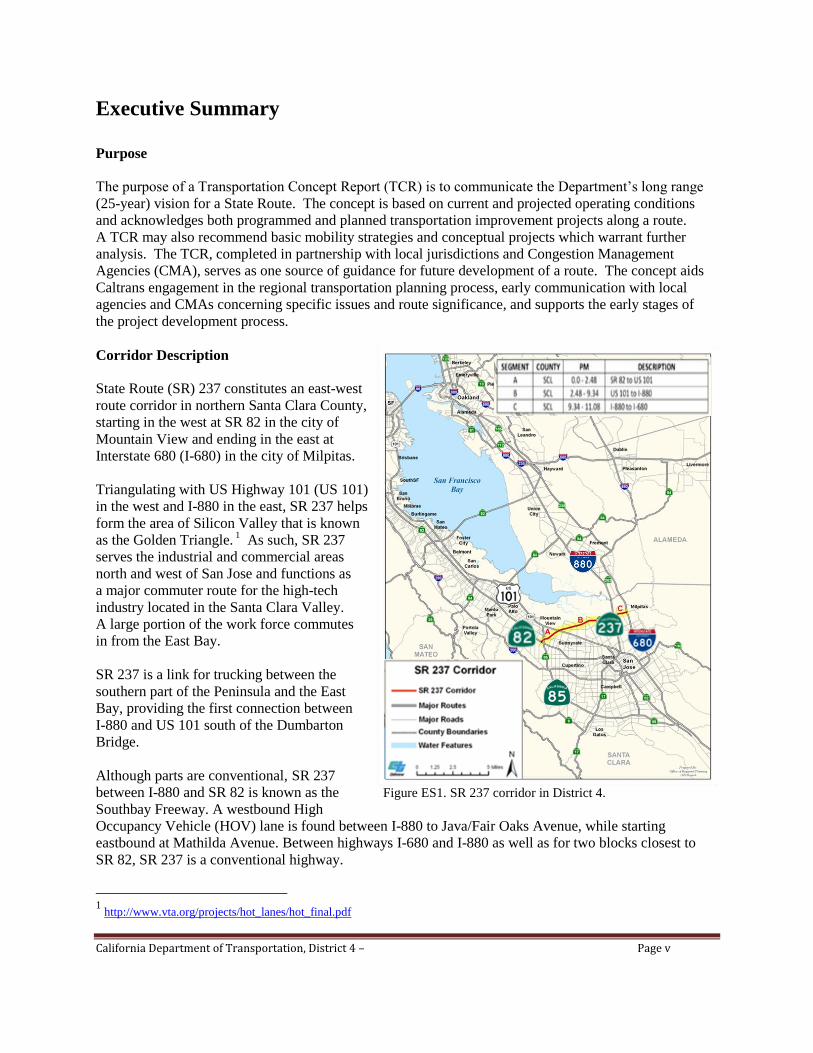
Corridor Description
State Route (SR) 237 constitutes an east-west
route corridor in northern Santa Clara County,
starting in the west at SR 82 in the city of
Mountain View and ending in the east at
Interstate 680 (I-680) in the city of Milpitas.
Triangulating with US Highway 101 (US 101)
in the west and I-880 in the east, SR 237 helps
form the area of Silicon Valley that is known
as the Golden Triangle. 1 As such, SR 237
serves the industrial and commercial areas
north and west of San Jose and functions as
a major commuter route for the high-tech
industry located in the Santa Clara Valley.
A large portion of the work force commutes
in from the East Bay.
SR 237 is a link for trucking between the
southern part of the Peninsula and the East
Bay, providing the first connection between
I-880 and US 101 south of the Dumbarton
Bridge.
Although parts are conventional, SR 237
between I-880 and SR 82 is known as the Figure ES1. SR 237 corridor in District 4.
Southbay Freeway. A westbound High
Occupancy Vehicle (HOV) lane is found between I-880 to Java/Fair Oaks Avenue, while starting
eastbound at Mathilda Avenue. Between highways I-680 and I-880 as well as for two blocks closest to
SR 82, SR 237 is a conventional highway.
1 http://www.vta.org/projects/hot_lanes/hot_final.pdf
California Department of Transportation, District 4 – Page vi
Average daily traffic ranged from 68,000 to 123,000 in 2009, with congestion present during peak periods
in both directions. During the AM peak hours, westbound congestion occurred immediately west of I-880
and in the eastbound direction at US 101. During the PM peak hours, both directions experienced
congestion between US 101 and I-880. Various intersections on Calaveras Boulevard (SR 237) in
Milpitas functioned at an LOS of E or F in 2010.
Priority Development Areas (PDAs) are found along SR 237 in San Jose, Sunnyvale and Mountain
View, while other PDAs are found nearby. PDAs are infill development opportunities within existing
communities. Meanwhile, SR 237 traverses environmentally sensitive areas, and its low-lying character
makes it a route that would be subject to inundation by rising sea levels if no measures are taken to
prevent future flooding.
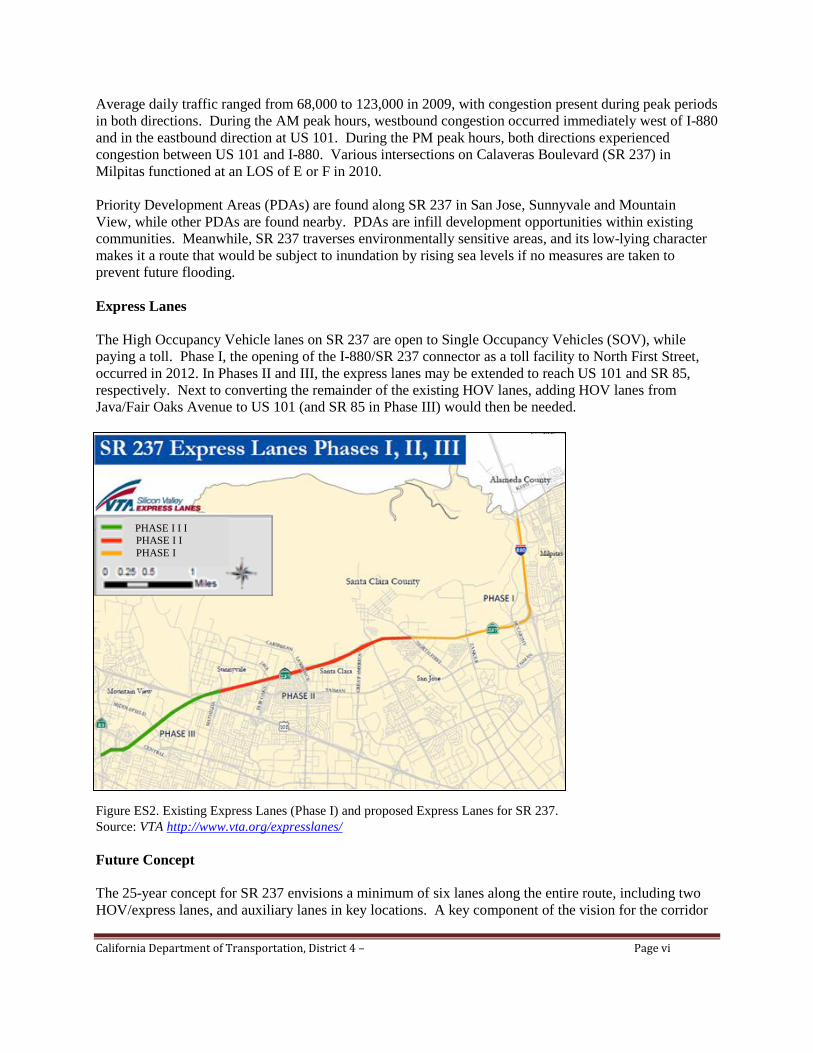
Express Lanes
The High Occupancy Vehicle lanes on SR 237 are open to Single Occupancy Vehicles (SOV), while
paying a toll. Phase I, the opening of the I-880/SR 237 connector as a toll facility to North First Street,
occurred in 2012. In Phases II and III, the express lanes may be extended to reach US 101 and SR 85,
respectively. Next to converting the remainder of the existing HOV lanes, adding HOV lanes from
Java/Fair Oaks Avenue to US 101 (and SR 85 in Phase III) would then be needed.
Figure ES2. Existing Express Lanes (Phase I) and proposed Express Lanes for SR 237.
Source: VTA http://www.vta.org/expresslanes/
Future Concept
The 25-year concept for SR 237 envisions a minimum of six lanes along the entire route, including two
HOV/express lanes, and auxiliary lanes in key locations. A key component of the vision for the corridor
PHASE I I I
PHASE I I
PHASE I
California Department of Transportation, District 4 – Page vii
is to maximize the use of the existing roadway footprint to keep pace with the mobility needs for the
corridor. In addition, increasing and/or establishing new bus and rail services would complement the
entire transportation system. Increasing Transit Oriented Developments (TODs) in key locations would
further support a stronger connection of land use to transportation. The BART extension to San Jose
creates BART stations in Milpitas and at Berryessa in San Jose. An existing light-rail line is found near
the planned Milpitas BART Station and plans exist to expand bus facilities here as well.
Maintaining and enhancing the bicycle and pedestrian networks in the corridor is important. Caltrans
is in general responsible for maintaining bicycle facilities on its routes, though maintenance agreements
with local agencies may exist.
This TCR incorporates the recommendations found in the Santa Clara Countywide Bicycle Plan.
Across Barrier Connections (ABCs) for bicyclists are created by VTA and Member agencies in the past
and currently one is envisioned at McCarthy Boulevard. Potential other ABCs are located in Milpitas at
McCarthy Boulevard and Abbott Avenue, North First Street and Zanker Road, and Zanker Road and
McCarthy Boulevard.
High auto traffic volumes between I-680 and I-880 may not be adequately addressed. Currently, only
conventional facilities (SR 237, SR 262, Auto Mall Parkway and Montague Expressway) bridge the gap
between the two interstate facilities, and there are no plans to connect the express lanes of I-680 and
SR 237. To improve the future LOS on Calaveras Boulevard of E, two Managed Lanes are part of the
25-year concept. One approach for incorporating Managed Lanes involves creating an HOV lane similar
to the ones in place on expressways. Another approach to address current and future congestion is
establishing a hybrid facility on Calaveras Boulevard, connecting I-680 and SR 237 with separate express
lanes, while leaving the remaining lanes to operate as conventional lanes (4C). Both options are captured
with the term Managed Lane in this 25-year concept. With lane conversions having occurred on
conventional routes in District 4, precedents exist for a conceptual conversion of a travel lane on
Calaveras Boulevard.
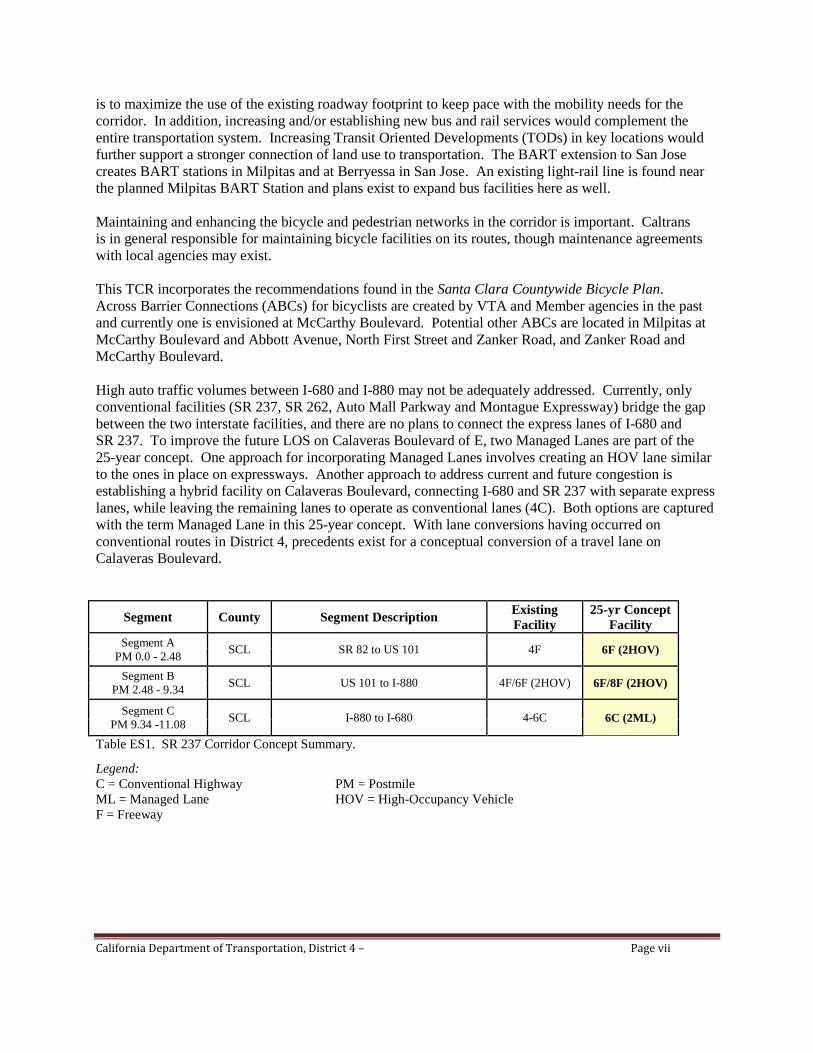
Segment County Segment Description Existing
Facility
25-yr Concept
Facility
Segment A
PM 0.0 - 2.48 SCL SR 82 to US 101 4F 6F (2HOV)
Segment B
PM 2.48 - 9.34 SCL US 101 to I-880 4F/6F (2HOV) 6F/8F (2HOV)
Segment C
PM 9.34 -11.08 SCL I-880 to I-680 4-6C 6C (2ML)
Table ES1. SR 237 Corridor Concept Summary.
Legend:
C = Conventional Highway PM = Postmile
ML = Managed Lane HOV = High-Occupancy Vehicle
F = Freeway
California Department of Transportation, District 4 – Page 1
I. Corridor Planning Process
Purpose and Need Government Code 65086 states that ―the Department of Transportation as owner-operator of the State
Highway System (SHS) shall carry out long-term State highway system planning to identify future
highway improvement.‖ Transportation Concept Reports (TCRs) fulfill this by defining the ―concept‖
or planned configuration of a State owned/operated facility, projecting to a 25-year planning horizon.
The TCR describes corridor characteristics such as the existing transportation network and land use, and
projects the long-range corridor travel needs across all modes. A TCR is not meant to be an encyclopedia
of corridor information, but rather a statement by the California Department of Transportation
(Department) on what the future facility should be to better manage projected travel demand and other
considerations such as interregional needs, Goods Movement, and local concerns. Guided by regional,
State, and federal policies and guidelines, this TCR is focused on anticipating improvements needed to
address a 25-year horizon of growth in travel demand.
Corridor Plans and Transportation Concept Reports are being developed for all 56 statutorily identified
State Routes in District 4. This TCR provides a concept for State Route 237 within Santa Clara County.
Methodology
In order to recommend specific corridor improvements, a corridor assessment is performed based on
current and forecast travel demand and growth in the corridor population. This assessment considers
current and planned land uses, existing operating conditions, and planned and programmed
improvements. Long-range performance expectations and potential deficiencies are also identified.
Conclusions are reached in conjunction with internal and external partners.
While considering the transportation network of the corridor as a whole, including alternative modes,
the Department recognizes that its authority generally lies within the State Highway System. This report
emphasizes State highway facilities.
State’s Interregional Responsibility The SHS serves primarily interregional and regional travel demand. This does not preclude SHS access
to specific destinations such as public facilities or major tourist attractions, and development and
modification of the SHS is conducted in the context of the mobility of regional and statewide to-and-
through movement of people and goods.
California Senate Bill 45 (SB 45) of 1997 stipulates that the State will nominate transportation
improvements that facilitate the movement of people and goods between the State‘s 43 regional
transportation planning agency regions2 as well as to and through the State. To this end, the State
is responsible for developing highway system performance standards pertinent to accommodating
interregional travel demand, and specifying corridor facility concepts that improve interregional travel
through the SHS. The corridor concepts indicated in TCRs reflect the State‘s determination regarding
the system accommodation of interregional, regional, and local travel needs.
2 Map: http://www.dot.ca.gov/hq/tpp/offices/orip/index_files/Updated%20Files/MPO-RTPA_1-10.pdf
California Department of Transportation, District 4 – Page 2
Corridor Plan Consistency Corridor Plan preparation is guided by several levels of government policy and direction. Applicable
Federal and State guidelines, such as the Moving Ahead for Progress in the 21th Century Act (MAP-21),
the California Interregional Blueprint (CIB), the California Transportation Plan 2035 (CTP 2035),
MTC‘s Regional Transportation Plan (RTP), the Santa Clara Valley Transportation Plan (VTP2040),
and Caltrans‘ Interregional Transportation Strategic Plan (ITSP) provide the policy foundation for this
TCR. The current State Highway Operation and Protection Program (SHOPP), a program of roadway
maintenance, safety, and rehabilitation improvements, and the State Transportation Improvement
Program (STIP) are also critical in the development of this TCR.
A full discussion of federal, State, and regional transportation planning efforts and policies related
to Corridor Plans are included as Appendix B.
California Department of Transportation, District 4 – Page 3
II. Corridor Overview
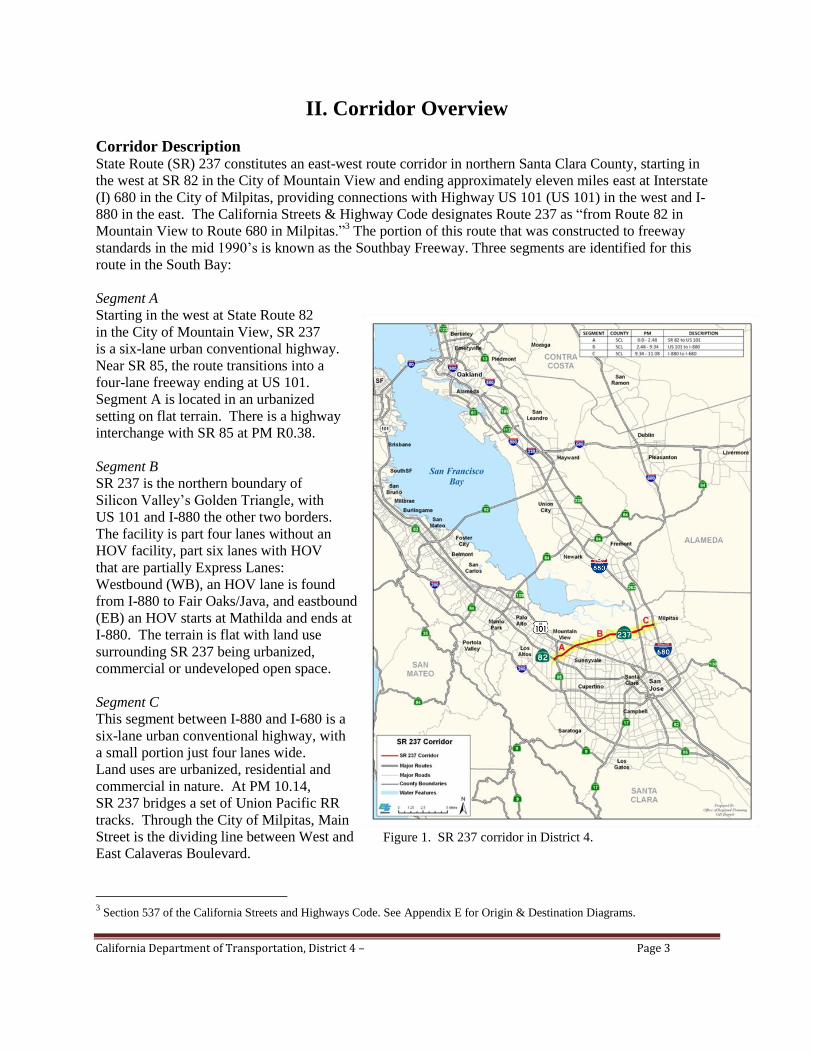
Corridor Description State Route (SR) 237 constitutes an east-west route corridor in northern Santa Clara County, starting in
the west at SR 82 in the City of Mountain View and ending approximately eleven miles east at Interstate
(I) 680 in the City of Milpitas, providing connections with Highway US 101 (US 101) in the west and I-
880 in the east. The California Streets & Highway Code designates Route 237 as ―from Route 82 in
Mountain View to Route 680 in Milpitas.‖3 The portion of this route that was constructed to freeway
standards in the mid 1990‘s is known as the Southbay Freeway. Three segments are identified for this
route in the South Bay:
Segment A
Starting in the west at State Route 82
in the City of Mountain View, SR 237
is a six-lane urban conventional highway.
Near SR 85, the route transitions into a
four-lane freeway ending at US 101.
Segment A is located in an urbanized
setting on flat terrain. There is a highway
interchange with SR 85 at PM R0.38.
Segment B
SR 237 is the northern boundary of
Silicon Valley‘s Golden Triangle, with
US 101 and I-880 the other two borders.
The facility is part four lanes without an
HOV facility, part six lanes with HOV
that are partially Express Lanes:
Westbound (WB), an HOV lane is found
from I-880 to Fair Oaks/Java, and eastbound
(EB) an HOV starts at Mathilda and ends at
I-880. The terrain is flat with land use
surrounding SR 237 being urbanized,
commercial or undeveloped open space.
Segment C
This segment between I-880 and I-680 is a
six-lane urban conventional highway, with
a small portion just four lanes wide.
Land uses are urbanized, residential and
commercial in nature. At PM 10.14,
SR 237 bridges a set of Union Pacific RR
tracks. Through the City of Milpitas, Main
Street is the dividing line between West and Figure 1. SR 237 corridor in District 4.
East Calaveras Boulevard.
3 Section 537 of the California Streets and Highways Code. See Appendix E for Origin & Destination Diagrams.
California Department of Transportation, District 4 – Page 4
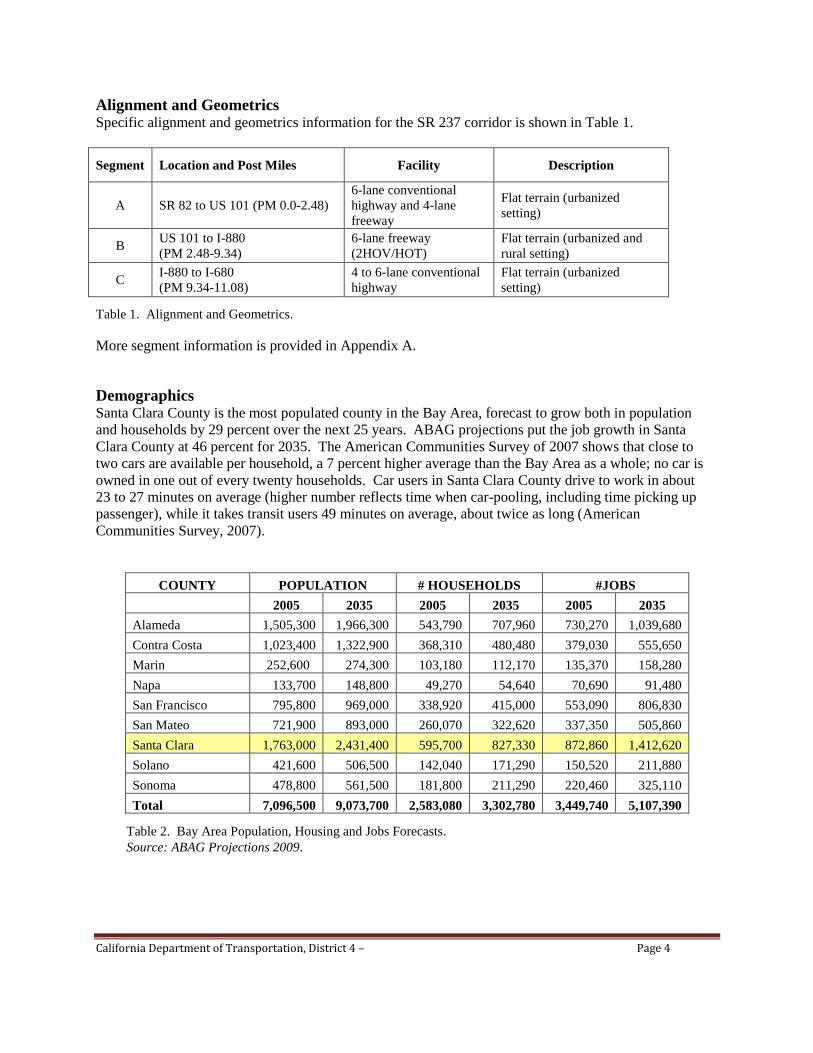
Alignment and Geometrics Specific alignment and geometrics information for the SR 237 corridor is shown in Table 1.
Segment Location and Post Miles Facility Description
A SR 82 to US 101 (PM 0.0-2.48)
6-lane conventional
highway and 4-lane
freeway
Flat terrain (urbanized
setting)
B US 101 to I-880
(PM 2.48-9.34)
6-lane freeway
(2HOV/HOT)
Flat terrain (urbanized and
rural setting)
C I-880 to I-680
(PM 9.34-11.08)
4 to 6-lane conventional
highway
Flat terrain (urbanized
setting)
Table 1. Alignment and Geometrics.
More segment information is provided in Appendix A.
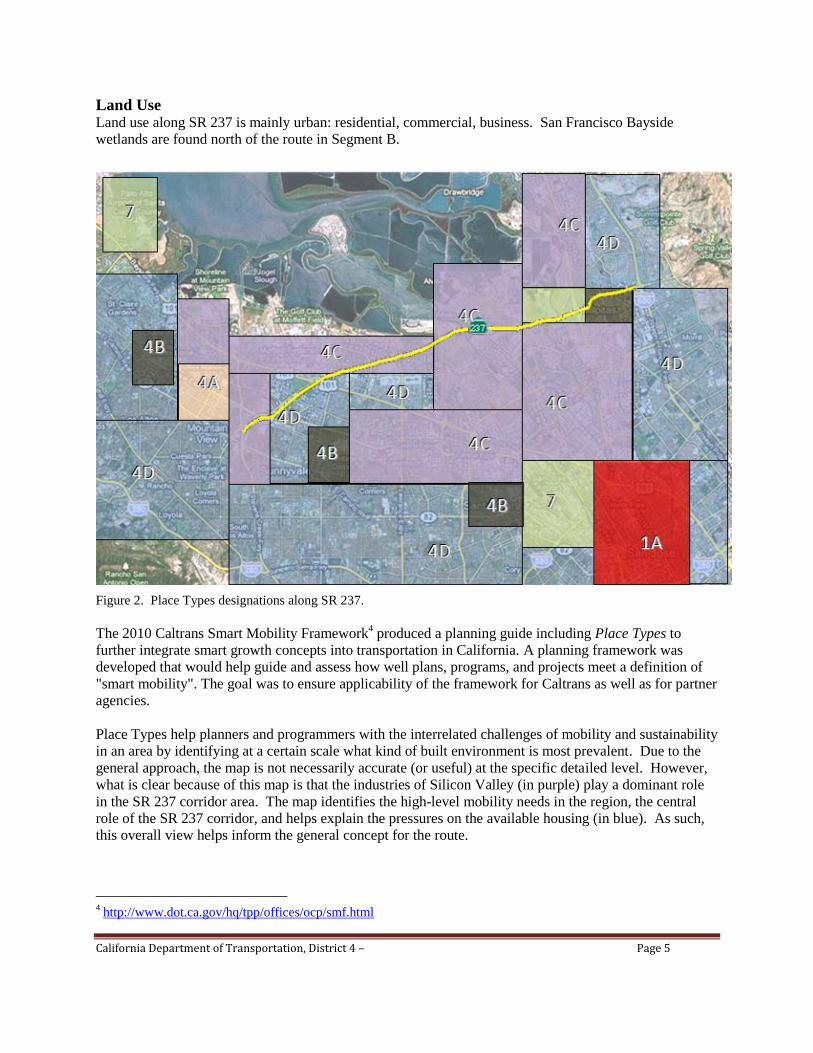
Demographics Santa Clara County is the most populated county in the Bay Area, forecast to grow both in population
and households by 29 percent over the next 25 years. ABAG projections put the job growth in Santa
Clara County at 46 percent for 2035. The American Communities Survey of 2007 shows that close to
two cars are available per household, a 7 percent higher average than the Bay Area as a whole; no car is
owned in one out of every twenty households. Car users in Santa Clara County drive to work in about
23 to 27 minutes on average (higher number reflects time when car-pooling, including time picking up
passenger), while it takes transit users 49 minutes on average, about twice as long (American
Communities Survey, 2007).
COUNTY POPULATION # HOUSEHOLDS #JOBS
2005 2035 2005 2035 2005 2035
Alameda 1,505,300 1,966,300 543,790 707,960 730,270 1,039,680
Contra Costa 1,023,400 1,322,900 368,310 480,480 379,030 555,650
Marin 252,600 274,300 103,180 112,170 135,370 158,280
Napa 133,700 148,800 49,270 54,640 70,690 91,480
San Francisco 795,800 969,000 338,920 415,000 553,090 806,830
San Mateo 721,900 893,000 260,070 322,620 337,350 505,860
Santa Clara 1,763,000 2,431,400 595,700 827,330 872,860 1,412,620
Solano 421,600 506,500 142,040 171,290 150,520 211,880
Sonoma 478,800 561,500 181,800 211,290 220,460 325,110
Total 7,096,500 9,073,700 2,583,080 3,302,780 3,449,740 5,107,390
Table 2. Bay Area Population, Housing and Jobs Forecasts.
Source: ABAG Projections 2009.
California Department of Transportation, District 4 – Page 5
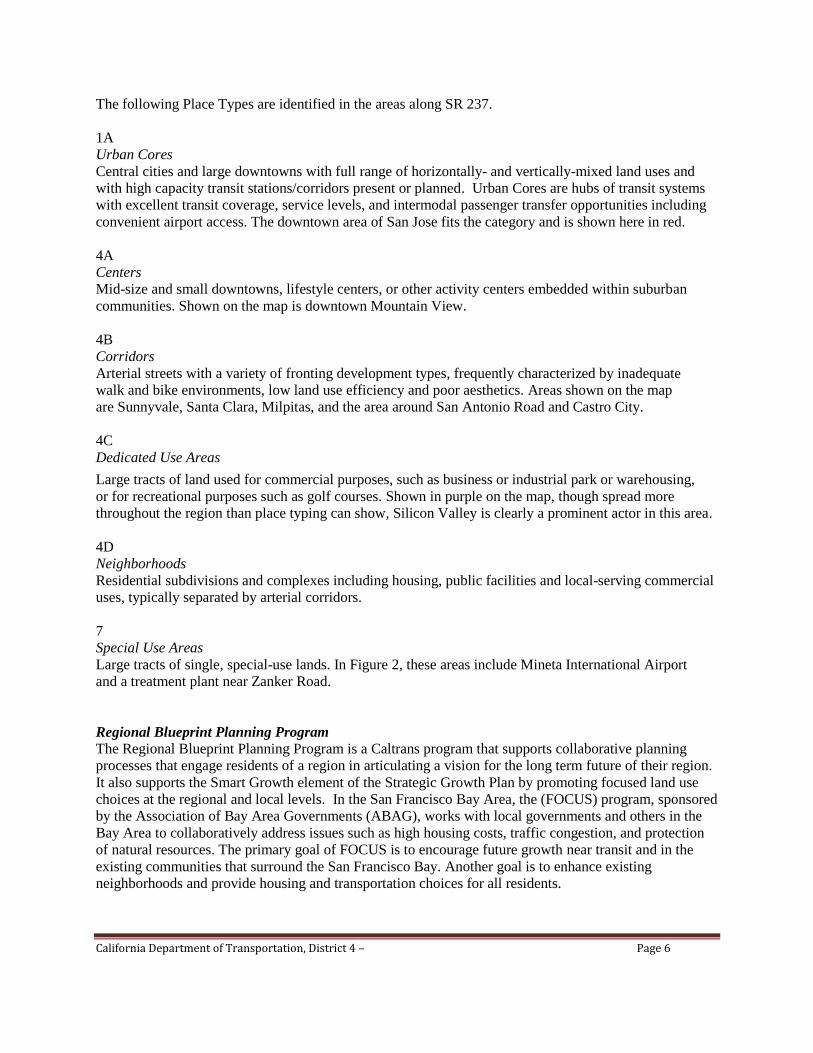
Land Use Land use along SR 237 is mainly urban: residential, commercial, business. San Francisco Bayside
wetlands are found north of the route in Segment B.
Figure 2. Place Types designations along SR 237.
The 2010 Caltrans Smart Mobility Framework4 produced a planning guide including Place Types to
further integrate smart growth concepts into transportation in California. A planning framework was
developed that would help guide and assess how well plans, programs, and projects meet a definition of
"smart mobility". The goal was to ensure applicability of the framework for Caltrans as well as for partner
agencies.
Place Types help planners and programmers with the interrelated challenges of mobility and sustainability
in an area by identifying at a certain scale what kind of built environment is most prevalent. Due to the
general approach, the map is not necessarily accurate (or useful) at the specific detailed level. However,
what is clear because of this map is that the industries of Silicon Valley (in purple) play a dominant role
in the SR 237 corridor area. The map identifies the high-level mobility needs in the region, the central
role of the SR 237 corridor, and helps explain the pressures on the available housing (in blue). As such,
this overall view helps inform the general concept for the route.
4 http://www.dot.ca.gov/hq/tpp/offices/ocp/smf.html
California Department of Transportation, District 4 – Page 6
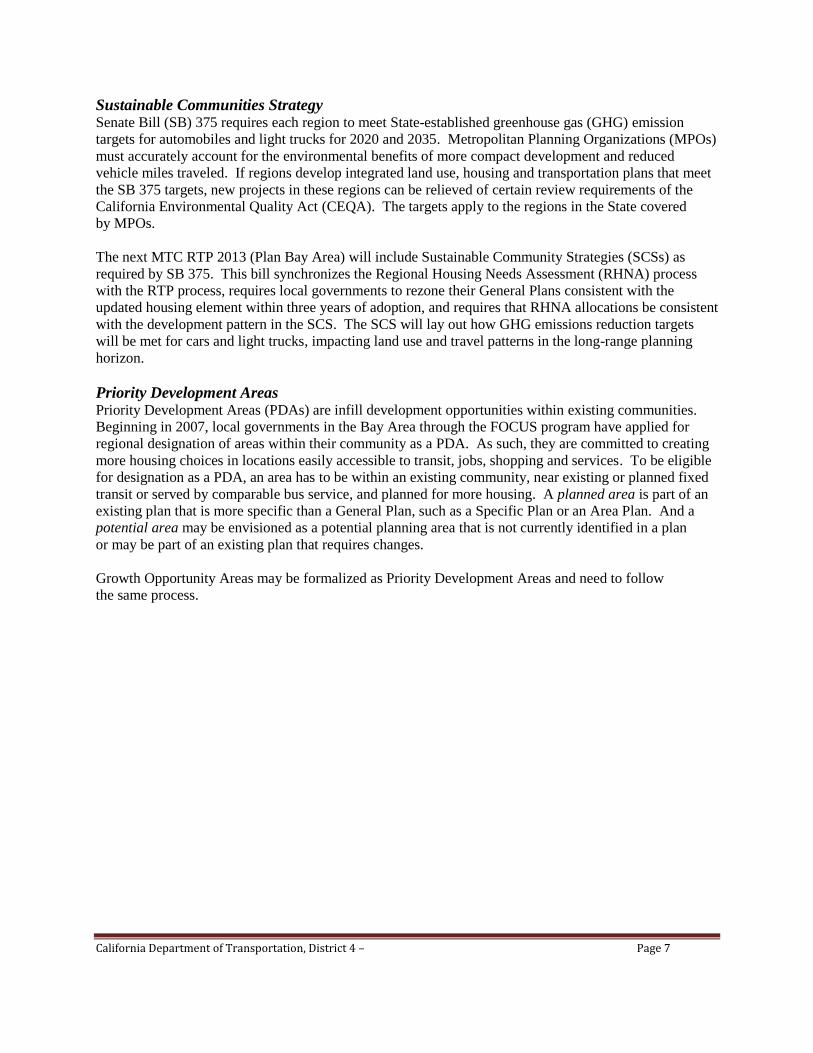
The following Place Types are identified in the areas along SR 237.
1A
Urban Cores
Central cities and large downtowns with full range of horizontally- and vertically-mixed land uses and
with high capacity transit stations/corridors present or planned. Urban Cores are hubs of transit systems
with excellent transit coverage, service levels, and intermodal passenger transfer opportunities including
convenient airport access. The downtown area of San Jose fits the category and is shown here in red.
4A
Centers
Mid-size and small downtowns, lifestyle centers, or other activity centers embedded within suburban
communities. Shown on the map is downtown Mountain View.
4B
Corridors
Arterial streets with a variety of fronting development types, frequently characterized by inadequate
walk and bike environments, low land use efficiency and poor aesthetics. Areas shown on the map
are Sunnyvale, Santa Clara, Milpitas, and the area around San Antonio Road and Castro City.
4C
Dedicated Use Areas
Large tracts of land used for commercial purposes, such as business or industrial park or warehousing,
or for recreational purposes such as golf courses. Shown in purple on the map, though spread more
throughout the region than place typing can show, Silicon Valley is clearly a prominent actor in this area.
4D
Neighborhoods
Residential subdivisions and complexes including housing, public facilities and local-serving commercial
uses, typically separated by arterial corridors.
7
Special Use Areas
Large tracts of single, special-use lands. In Figure 2, these areas include Mineta International Airport
and a treatment plant near Zanker Road.
Regional Blueprint Planning Program
The Regional Blueprint Planning Program is a Caltrans program that supports collaborative planning
processes that engage residents of a region in articulating a vision for the long term future of their region.
It also supports the Smart Growth element of the Strategic Growth Plan by promoting focused land use
choices at the regional and local levels. In the San Francisco Bay Area, the (FOCUS) program, sponsored
by the Association of Bay Area Governments (ABAG), works with local governments and others in the
Bay Area to collaboratively address issues such as high housing costs, traffic congestion, and protection
of natural resources. The primary goal of FOCUS is to encourage future growth near transit and in the
existing communities that surround the San Francisco Bay. Another goal is to enhance existing
neighborhoods and provide housing and transportation choices for all residents.
California Department of Transportation, District 4 – Page 7
Sustainable Communities Strategy Senate Bill (SB) 375 requires each region to meet State-established greenhouse gas (GHG) emission
targets for automobiles and light trucks for 2020 and 2035. Metropolitan Planning Organizations (MPOs)
must accurately account for the environmental benefits of more compact development and reduced
vehicle miles traveled. If regions develop integrated land use, housing and transportation plans that meet
the SB 375 targets, new projects in these regions can be relieved of certain review requirements of the
California Environmental Quality Act (CEQA). The targets apply to the regions in the State covered
by MPOs.
The next MTC RTP 2013 (Plan Bay Area) will include Sustainable Community Strategies (SCSs) as
required by SB 375. This bill synchronizes the Regional Housing Needs Assessment (RHNA) process
with the RTP process, requires local governments to rezone their General Plans consistent with the
updated housing element within three years of adoption, and requires that RHNA allocations be consistent
with the development pattern in the SCS. The SCS will lay out how GHG emissions reduction targets
will be met for cars and light trucks, impacting land use and travel patterns in the long-range planning
horizon.
Priority Development Areas Priority Development Areas (PDAs) are infill development opportunities within existing communities.
Beginning in 2007, local governments in the Bay Area through the FOCUS program have applied for
regional designation of areas within their community as a PDA. As such, they are committed to creating
more housing choices in locations easily accessible to transit, jobs, shopping and services. To be eligible
for designation as a PDA, an area has to be within an existing community, near existing or planned fixed
transit or served by comparable bus service, and planned for more housing. A planned area is part of an
existing plan that is more specific than a General Plan, such as a Specific Plan or an Area Plan. And a
potential area may be envisioned as a potential planning area that is not currently identified in a plan
or may be part of an existing plan that requires changes.
Growth Opportunity Areas may be formalized as Priority Development Areas and need to follow
the same process.
California Department of Transportation, District 4 – Page 8
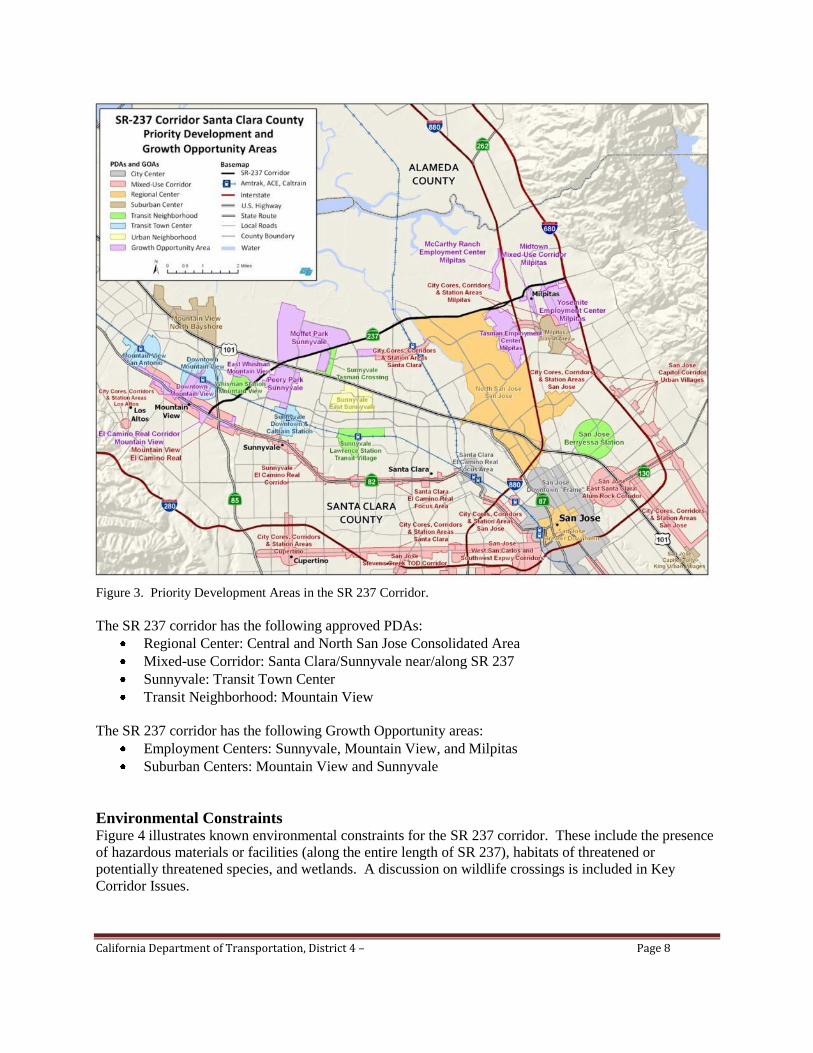
Figure 3. Priority Development Areas in the SR 237 Corridor.
The SR 237 corridor has the following approved PDAs:
Regional Center: Central and North San Jose Consolidated Area
Mixed-use Corridor: Santa Clara/Sunnyvale near/along SR 237
Sunnyvale: Transit Town Center
Transit Neighborhood: Mountain View
The SR 237 corridor has the following Growth Opportunity areas:
Employment Centers: Sunnyvale, Mountain View, and Milpitas
Suburban Centers: Mountain View and Sunnyvale
Environmental Constraints Figure 4 illustrates known environmental constraints for the SR 237 corridor. These include the presence
of hazardous materials or facilities (along the entire length of SR 237), habitats of threatened or
potentially threatened species, and wetlands. A discussion on wildlife crossings is included in Key
Corridor Issues.
California Department of Transportation, District 4 – Page 9
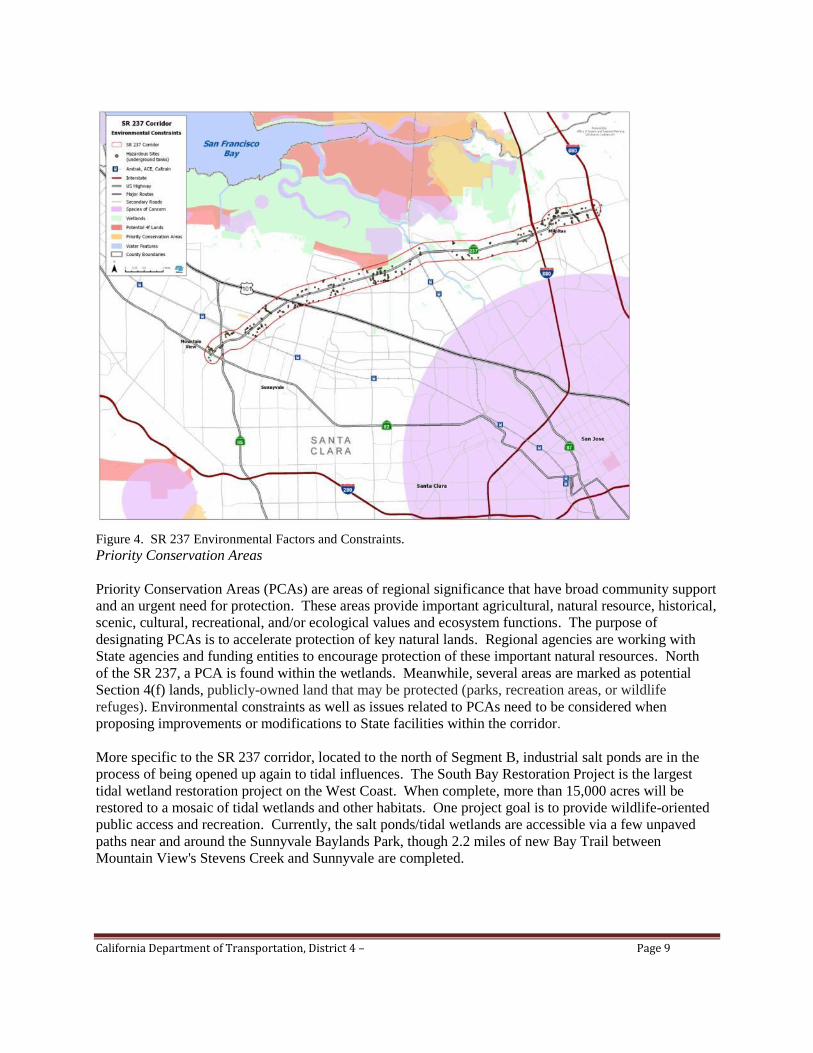
Figure 4. SR 237 Environmental Factors and Constraints.
Priority Conservation Areas
Priority Conservation Areas (PCAs) are areas of regional significance that have broad community support
and an urgent need for protection. These areas provide important agricultural, natural resource, historical,
scenic, cultural, recreational, and/or ecological values and ecosystem functions. The purpose of
designating PCAs is to accelerate protection of key natural lands. Regional agencies are working with
State agencies and funding entities to encourage protection of these important natural resources. North
of the SR 237, a PCA is found within the wetlands. Meanwhile, several areas are marked as potential
Section 4(f) lands, publicly-owned land that may be protected (parks, recreation areas, or wildlife
refuges). Environmental constraints as well as issues related to PCAs need to be considered when
proposing improvements or modifications to State facilities within the corridor.
More specific to the SR 237 corridor, located to the north of Segment B, industrial salt ponds are in the
process of being opened up again to tidal influences. The South Bay Restoration Project is the largest
tidal wetland restoration project on the West Coast. When complete, more than 15,000 acres will be
restored to a mosaic of tidal wetlands and other habitats. One project goal is to provide wildlife-oriented
public access and recreation. Currently, the salt ponds/tidal wetlands are accessible via a few unpaved
paths near and around the Sunnyvale Baylands Park, though 2.2 miles of new Bay Trail between
Mountain View's Stevens Creek and Sunnyvale are completed.
California Department of Transportation, District 4 – Page 10
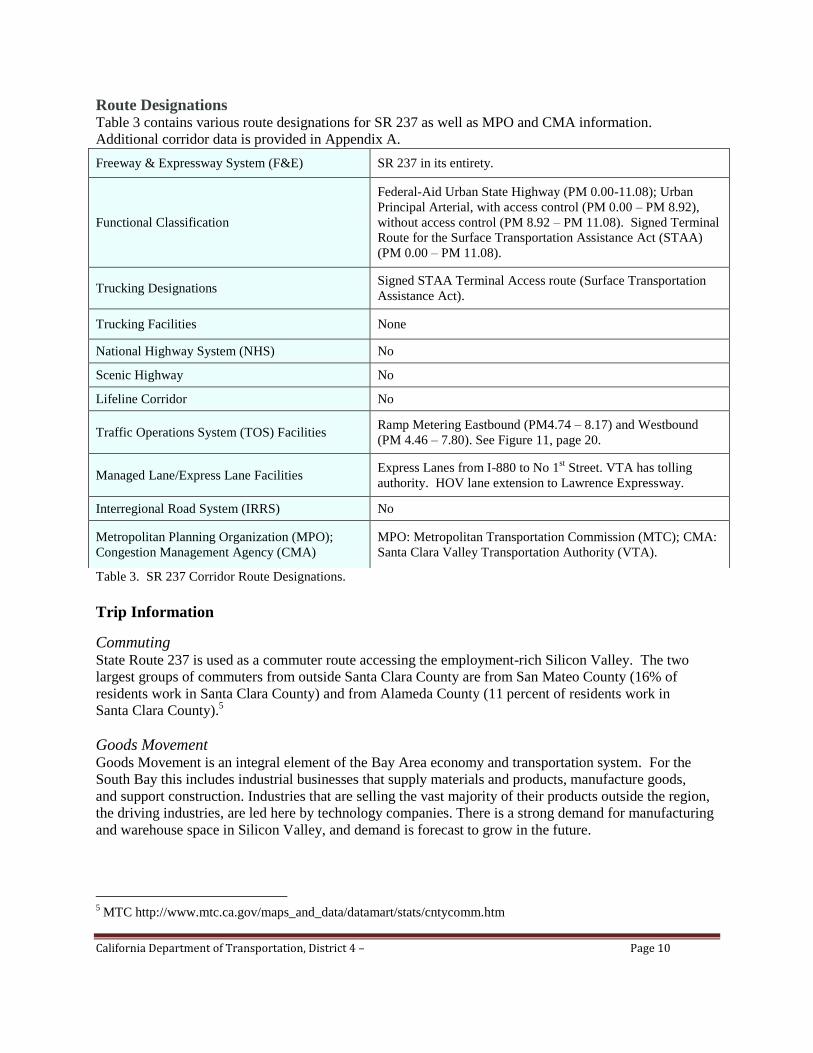
Route Designations Table 3 contains various route designations for SR 237 as well as MPO and CMA information.
Additional corridor data is provided in Appendix A.
Table 3. SR 237 Corridor Route Designations.
Trip Information
Commuting State Route 237 is used as a commuter route accessing the employment-rich Silicon Valley. The two
largest groups of commuters from outside Santa Clara County are from San Mateo County (16% of
residents work in Santa Clara County) and from Alameda County (11 percent of residents work in
Santa Clara County).5
Goods Movement Goods Movement is an integral element of the Bay Area economy and transportation system. For the
South Bay this includes industrial businesses that supply materials and products, manufacture goods,
and support construction. Industries that are selling the vast majority of their products outside the region,
the driving industries, are led here by technology companies. There is a strong demand for manufacturing
and warehouse space in Silicon Valley, and demand is forecast to grow in the future.
5 MTC http://www.mtc.ca.gov/maps_and_data/datamart/stats/cntycomm.htm
Freeway & Expressway System (F&E) SR 237 in its entirety.
Functional Classification
Federal-Aid Urban State Highway (PM 0.00-11.08); Urban
Principal Arterial, with access control (PM 0.00 – PM 8.92),
without access control (PM 8.92 – PM 11.08). Signed Terminal
Route for the Surface Transportation Assistance Act (STAA)
(PM 0.00 – PM 11.08).
Trucking Designations Signed STAA Terminal Access route (Surface Transportation
Assistance Act).
Trucking Facilities None
National Highway System (NHS) No
Scenic Highway No
Lifeline Corridor No
Traffic Operations System (TOS) Facilities Ramp Metering Eastbound (PM4.74 – 8.17) and Westbound
(PM 4.46 – 7.80). See Figure 11, page 20.
Managed Lane/Express Lane Facilities Express Lanes from I-880 to No 1
st Street. VTA has tolling
authority. HOV lane extension to Lawrence Expressway.
Interregional Road System (IRRS) No
Metropolitan Planning Organization (MPO);
Congestion Management Agency (CMA)
MPO: Metropolitan Transportation Commission (MTC); CMA:
Santa Clara Valley Transportation Authority (VTA).
California Department of Transportation, District 4 – Page 11
One of the region‘s three major airports, the Norman Y. Mineta San Jose International Airport is very
important to goods movement industries and other businesses throughout the South Bay. Particularly the
high-value products and parts imported and exported by Silicon Valley industries, prone to time sensitive
deliveries, rely on San Jose International Airport.
The freeway segment of State Route 237 serves as a commercial route, between the East Bay and the
Peninsula as well as to local destinations. There are no trucking restrictions on this STAA route, and
truck percentages on SR 237 range from 1 percent to over 6 percent.
Recreational Facilities Ed R. Levin County Park in Milpitas is within easy reach from eastbound SR 237 by using East Calaveras
Boulevard and Calaveras Road. Nearby, other East Bay Parks are found as well: the Sunol Regional
Wilderness and Mission Peak Regional Preserve to the north, and the Joseph D. Grant County Park plus
access to Mount Hamilton to the south.
To the west various parks are found in the foothills of the Santa Cruz Mountains and in the mountains
themselves. Arastradero Regional Preserve, the Palo Alto Foothills Park, the Rancho San Antonio Open
Space Reserve, and the Picchetti Ranch Open Space Reserve are all within a short distance from SR 237.
California‘s Great America theme park and water park are located within the triangle of SR 237, US 101,
and I-880. The San Francisco 49ers football team trains in Santa Clara and the groundbreaking took place
to build a new stadium (which could also accommodate other sports teams) on a site next to Great America.
The Santa Clara Municipal Golf Course is found within this area, just south of SR 237 in Santa Clara.
The Baylands Park is located to the north of SR 237 in Sunnyvale. The park provides over seventy acres
of developed parkland for active recreation, with pathways and picnic areas for families and large groups.
Baylands Park is known for its many acres of native grasses, open meadows and wonderful vistas.
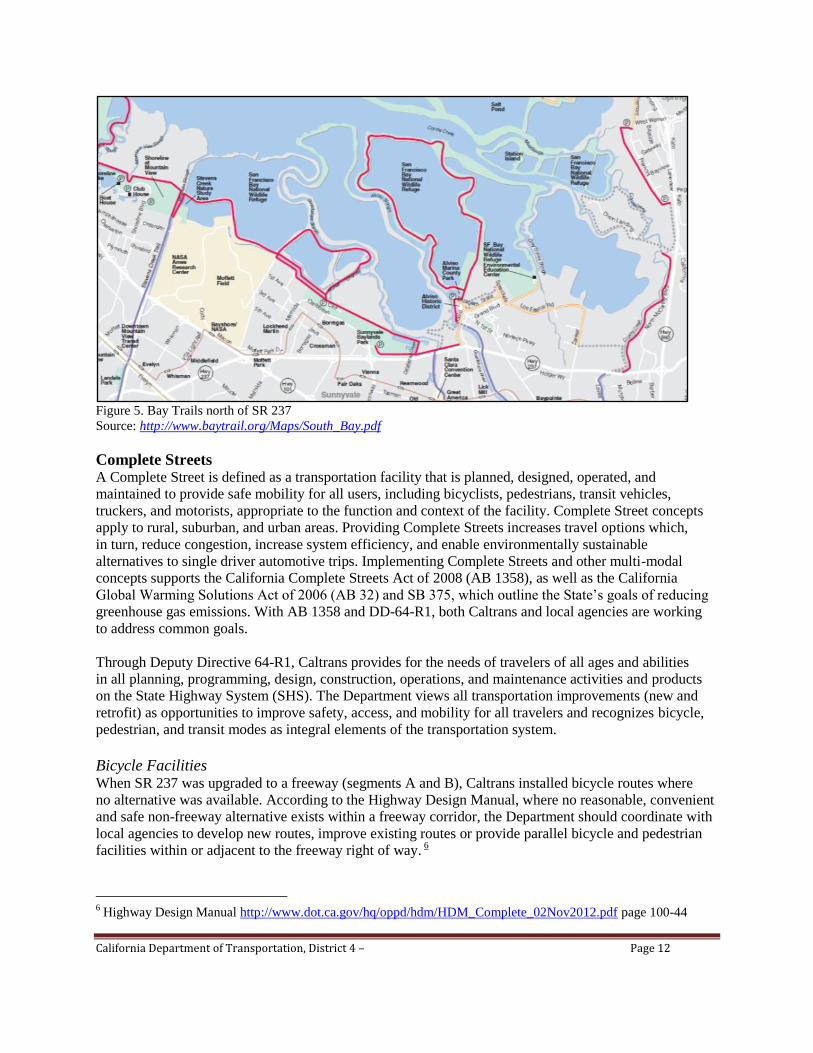
The San Francisco Bay Trail is a bicycle and pedestrian trail that will eventually allow continuous travel
around the shoreline of the bay. As Figure 5 shows, large sections of the Bay Trails have been established
to the North of SR 237.
California Department of Transportation, District 4 – Page 12
Figure 5. Bay Trails north of SR 237
Source: http://www.baytrail.org/Maps/South_Bay.pdf
Complete Streets
A Complete Street is defined as a transportation facility that is planned, designed, operated, and
maintained to provide safe mobility for all users, including bicyclists, pedestrians, transit vehicles,
truckers, and motorists, appropriate to the function and context of the facility. Complete Street concepts
apply to rural, suburban, and urban areas. Providing Complete Streets increases travel options which,
in turn, reduce congestion, increase system efficiency, and enable environmentally sustainable
alternatives to single driver automotive trips. Implementing Complete Streets and other multi-modal
concepts supports the California Complete Streets Act of 2008 (AB 1358), as well as the California
Global Warming Solutions Act of 2006 (AB 32) and SB 375, which outline the State‘s goals of reducing
greenhouse gas emissions. With AB 1358 and DD-64-R1, both Caltrans and local agencies are working
to address common goals.
Through Deputy Directive 64-R1, Caltrans provides for the needs of travelers of all ages and abilities
in all planning, programming, design, construction, operations, and maintenance activities and products
on the State Highway System (SHS). The Department views all transportation improvements (new and
retrofit) as opportunities to improve safety, access, and mobility for all travelers and recognizes bicycle,
pedestrian, and transit modes as integral elements of the transportation system.
Bicycle Facilities When SR 237 was upgraded to a freeway (segments A and B), Caltrans installed bicycle routes where
no alternative was available. According to the Highway Design Manual, where no reasonable, convenient
and safe non-freeway alternative exists within a freeway corridor, the Department should coordinate with
local agencies to develop new routes, improve existing routes or provide parallel bicycle and pedestrian
facilities within or adjacent to the freeway right of way. 6
6 Highway Design Manual http://www.dot.ca.gov/hq/oppd/hdm/HDM_Complete_02Nov2012.pdf page 100-44
California Department of Transportation, District 4 – Page 13
Caltrans has as policy that bicycles are not allowed on segments A and B of SR 237, with the exception of
the two-block stretch at SR 82. Some Class I off-street bike paths are located parallel to the freeway and there
are on-street Class II bike lanes and shared roadways near SR 237 on parallel streets. One section of the Bay
Trail located next to SR 237 is near the Sunnyvale Baylands Park (located between Lawrence Expressway
and Lafayette, center Segment B, shown on Figure 6b). In Milpitas conventional SR 237 does not have
dedicated bicycle facilities, though many segments have extra-wide outside lanes. There are no bicycle
facilities along the two blocks of conventional SR 237 in Mountain View; the road is shared with motor
vehicles. The eastbound direction has shoulders, but no signs are visible that prohibits parking.
Existing bikeways in SR237 corridor are listed below as the locations with critical Across Barrier
Connections, and where the freeway creates a barrier in the bike network:
WB Great America Parkway to Caribbean Drive (Baylands Park Trail, Class I Bikeway);
WB Caribbean Drive to Bordeaux Drive (Moffett Park Drive, Class II Bikeway);
EB East Dana Street to Evelyn Avenue (Moorpark Way, Class II Bikeway);
EB Mathilda Avenue to Lafayette (Old Mountain View, Yerba Buena, Class II Bikeway);
EB+WB Persian Drive (Class II Bikeway);
EB+WB Old Mountain View Road (Class II Bikeway);
EB+WB Manila Drive (along US 101, Class II Bikeway);
EB+WB Lafayette to North 1st (Class I Bikeway);
EB+WB North 1st to Zanker (Holger Way, Class II Bikeway);
EB+WB (Zanker to McCarthy Boulevard (Class I Bikeway).
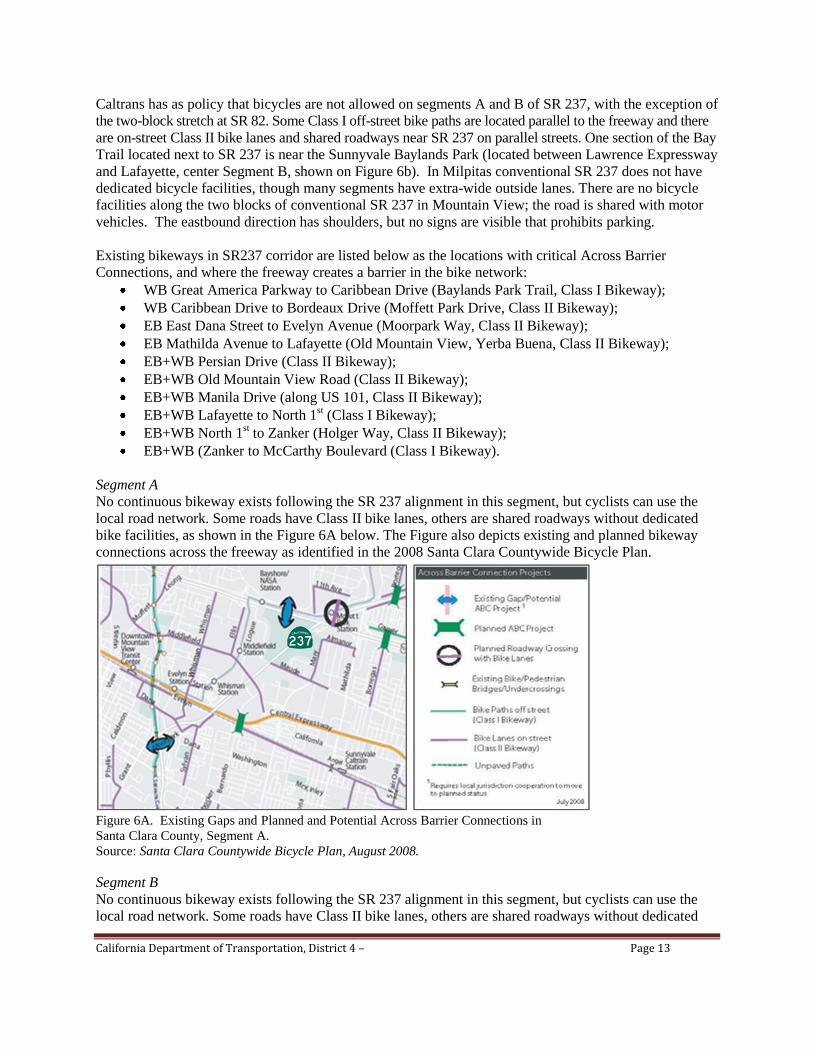
Segment A
No continuous bikeway exists following the SR 237 alignment in this segment, but cyclists can use the
local road network. Some roads have Class II bike lanes, others are shared roadways without dedicated
bike facilities, as shown in the Figure 6A below. The Figure also depicts existing and planned bikeway
connections across the freeway as identified in the 2008 Santa Clara Countywide Bicycle Plan.
Figure 6A. Existing Gaps and Planned and Potential Across Barrier Connections in
Santa Clara County, Segment A.
Source: Santa Clara Countywide Bicycle Plan, August 2008.
Segment B
No continuous bikeway exists following the SR 237 alignment in this segment, but cyclists can use the
local road network. Some roads have Class II bike lanes, others are shared roadways without dedicated
California Department of Transportation, District 4 – Page 14
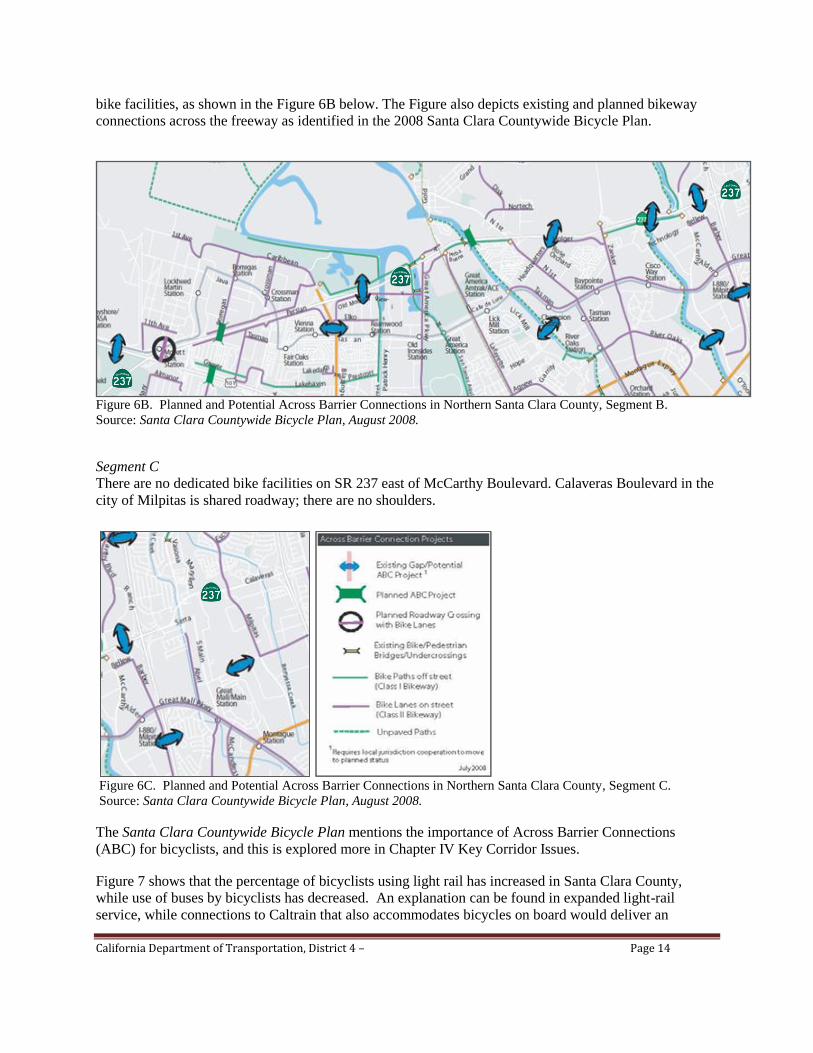
bike facilities, as shown in the Figure 6B below. The Figure also depicts existing and planned bikeway
connections across the freeway as identified in the 2008 Santa Clara Countywide Bicycle Plan.
Figure 6B. Planned and Potential Across Barrier Connections in Northern Santa Clara County, Segment B.
Source: Santa Clara Countywide Bicycle Plan, August 2008.
Segment C
There are no dedicated bike facilities on SR 237 east of McCarthy Boulevard. Calaveras Boulevard in the
city of Milpitas is shared roadway; there are no shoulders.
Figure 6C. Planned and Potential Across Barrier Connections in Northern Santa Clara County, Segment C.
Source: Santa Clara Countywide Bicycle Plan, August 2008.
The Santa Clara Countywide Bicycle Plan mentions the importance of Across Barrier Connections
(ABC) for bicyclists, and this is explored more in Chapter IV Key Corridor Issues.
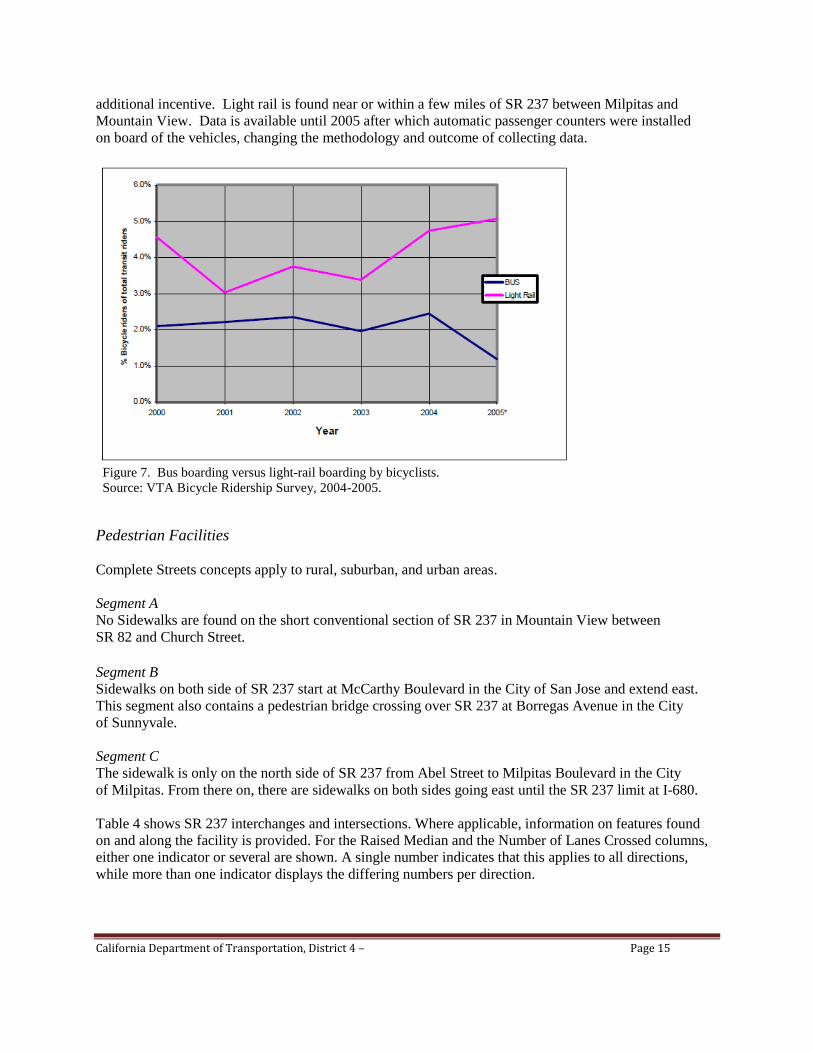
Figure 7 shows that the percentage of bicyclists using light rail has increased in Santa Clara County,
while use of buses by bicyclists has decreased. An explanation can be found in expanded light-rail
service, while connections to Caltrain that also accommodates bicycles on board would deliver an
California Department of Transportation, District 4 – Page 15
additional incentive. Light rail is found near or within a few miles of SR 237 between Milpitas and
Mountain View. Data is available until 2005 after which automatic passenger counters were installed
on board of the vehicles, changing the methodology and outcome of collecting data.
Figure 7. Bus boarding versus light-rail boarding by bicyclists.
Source: VTA Bicycle Ridership Survey, 2004-2005.
Pedestrian Facilities
Complete Streets concepts apply to rural, suburban, and urban areas.
Segment A
No Sidewalks are found on the short conventional section of SR 237 in Mountain View between
SR 82 and Church Street.
Segment B
Sidewalks on both side of SR 237 start at McCarthy Boulevard in the City of San Jose and extend east.
This segment also contains a pedestrian bridge crossing over SR 237 at Borregas Avenue in the City
of Sunnyvale.
Segment C
The sidewalk is only on the north side of SR 237 from Abel Street to Milpitas Boulevard in the City
of Milpitas. From there on, there are sidewalks on both sides going east until the SR 237 limit at I-680.
Table 4 shows SR 237 interchanges and intersections. Where applicable, information on features found
on and along the facility is provided. For the Raised Median and the Number of Lanes Crossed columns,
either one indicator or several are shown. A single number indicates that this applies to all directions,
while more than one indicator displays the differing numbers per direction.

California Department of Transportation, District 4 – Page 16
Table 4. SR 237 Ramp Intersection Features and Characteristics.
*http://www.dot.ca.gov/hq/oppd/hdm/pdf/english/chp0500.pdf
Using Serra Way as an example to show how this complex table reads,
with a small aerial shown in Figure 8, one can see that the controlled
intersection has three crossings that are marked for pedestrian
crossings, and one is not. Three of the road ways leading to the four-
way intersection have a raised median, with pedestrians needing to
cross seven, four, or three lanes. None of the lights has a pedestrian
countdown feature, while the radius indicates cars turning a corner will
do so at relatively low speeds. The width of the Figure 8. Serra Way aerial view.
sidewalk is six or ten feet at this intersection.
SR 237
Interchanges and
Intersections
I/C
Classifi-
cation*
Number of
Marked
Crossings/
Total
Raised
Median
Y/N
Number of
Lanes
Crossed
Pedestrian
Countdown
Timer Y/N
Size of
Ramp
Corner
radii
Width
Sidewalk
I-680 L-10 4/4 Y 1 NA 35-50 4
Hillview Drive Controlled
Intersection 3/4 Y/Y/Y/N 6/5/6/4 N < 25feet 6
Town Center Drive Controlled Intersection 2/3 Y 6/6 N < 25feet 6
Milpitas Boulevard Controlled
Intersection 4/4 Y 7/8 N 25-35 6 + 0
Main /Carlo Street Controlled Intersection 1/2 Y 1/0 NA 35-50 2 + 0
Abel Street Controlled
Intersection 4/4 Y 7/5/6/7 N < 25 feet
35-50 6 + 6 + 6
+ (2 + 0)
Butler Street Controlled
Intersection 0/3 Y/Y/N 2-4 NA < 25feet 6
Serra Way Controlled Intersection 3/4 Y/Y/Y/N 7/4/3 N Small 6 + 10
Abott Avenue Controlled
Intersection 2/4 Y 5/4 N Small 6
I-880 L-9 3/3 Y/Y/N 4/6/1 N 25-35
>75 feet 6
McCarthy Blvd L-3/L-5 3/4 Y/N 3/6 + 5/6 NA 25-35 feet 6
Zanker Road L-1/L-7 1/4 + 1/4 Y/N 3 N/Y* 25-35 feet 3-4
North 1Street L-2/L-8 2/4 + 1/4 Y/N 4 + 2 Y/Y 25-35 feet 4
Great America Pky L-1 2/4 Y/N 4 + 6 N/N 25–35 feet 5
Lawrence Expy L-10 3/4 + 2/4 N 8/2 + 10/3 N/N 25-35 feet 4
Java/No Fair Oaks ½ L-1 4/4 Y/N 4/5 + 4/6 N/N* 35-50 feet 4
Mathilda Avenue L-1 1/4 N 1 N/N > 75 feet 4
US 101 L-9 NA
Maude/
Middlefield
L-13 /
L-5
2/4 + 1/4
3/4 + 3/4
N
Y/N
3
8
Y/Y
N/Y*
50-75 feet
<25 feet
4 /
4
Whisman/Sylvan/
Moorpark/Dana
Off-set
L-4 NA NA NA NA NA NA
SR 85 L-9 NA NA NA NA NA NA
Church Street Uncontrol.
Intersection NA NA NA NA NA NA
Centre Street Uncontrol.
Intersection 0/3 Y/Y/N 2 NA < 25 feet shoulder
SR 82 Uncontrol.
Intersection 4/4 Y 8/9 Y 25-35 4
California Department of Transportation, District 4 – Page 17
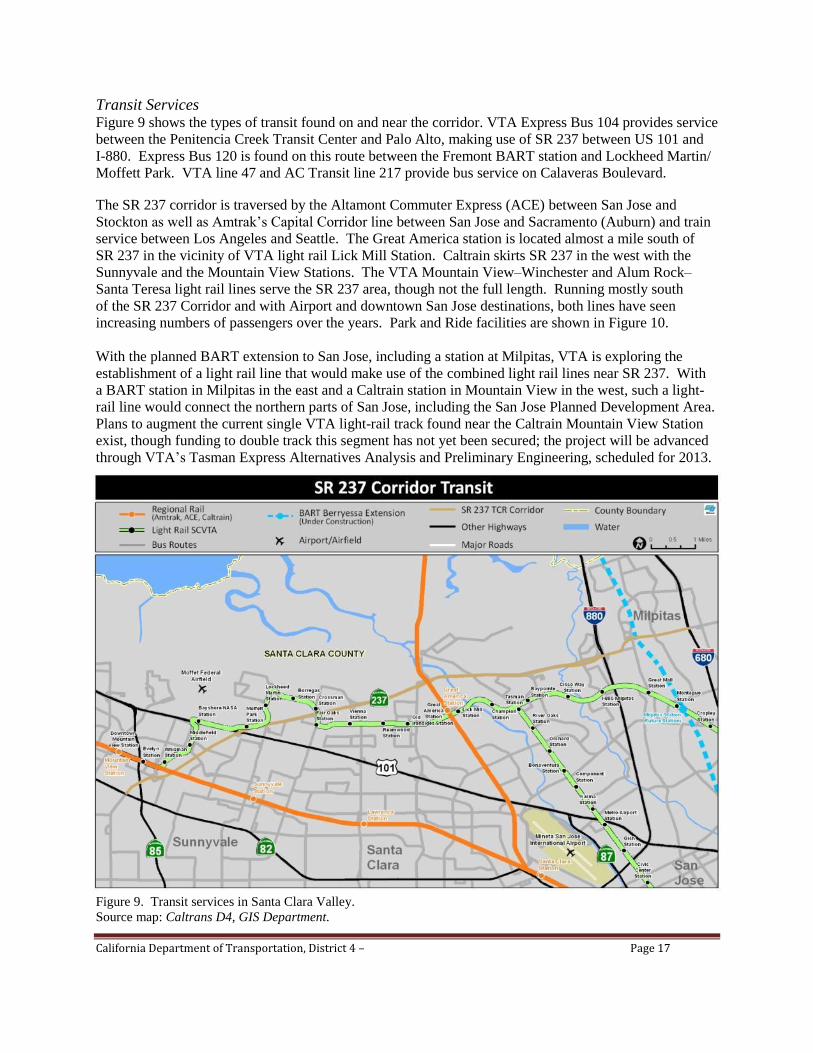
Transit Services Figure 9 shows the types of transit found on and near the corridor. VTA Express Bus 104 provides service
between the Penitencia Creek Transit Center and Palo Alto, making use of SR 237 between US 101 and
I-880. Express Bus 120 is found on this route between the Fremont BART station and Lockheed Martin/
Moffett Park. VTA line 47 and AC Transit line 217 provide bus service on Calaveras Boulevard.
The SR 237 corridor is traversed by the Altamont Commuter Express (ACE) between San Jose and
Stockton as well as Amtrak‘s Capital Corridor line between San Jose and Sacramento (Auburn) and train
service between Los Angeles and Seattle. The Great America station is located almost a mile south of
SR 237 in the vicinity of VTA light rail Lick Mill Station. Caltrain skirts SR 237 in the west with the
Sunnyvale and the Mountain View Stations. The VTA Mountain View–Winchester and Alum Rock–
Santa Teresa light rail lines serve the SR 237 area, though not the full length. Running mostly south
of the SR 237 Corridor and with Airport and downtown San Jose destinations, both lines have seen
increasing numbers of passengers over the years. Park and Ride facilities are shown in Figure 10.
With the planned BART extension to San Jose, including a station at Milpitas, VTA is exploring the
establishment of a light rail line that would make use of the combined light rail lines near SR 237. With
a BART station in Milpitas in the east and a Caltrain station in Mountain View in the west, such a light-
rail line would connect the northern parts of San Jose, including the San Jose Planned Development Area.
Plans to augment the current single VTA light-rail track found near the Caltrain Mountain View Station
exist, though funding to double track this segment has not yet been secured; the project will be advanced
through VTA‘s Tasman Express Alternatives Analysis and Preliminary Engineering, scheduled for 2013.
Figure 9. Transit services in Santa Clara Valley.
Source map: Caltrans D4, GIS Department.
California Department of Transportation, District 4 – Page 18
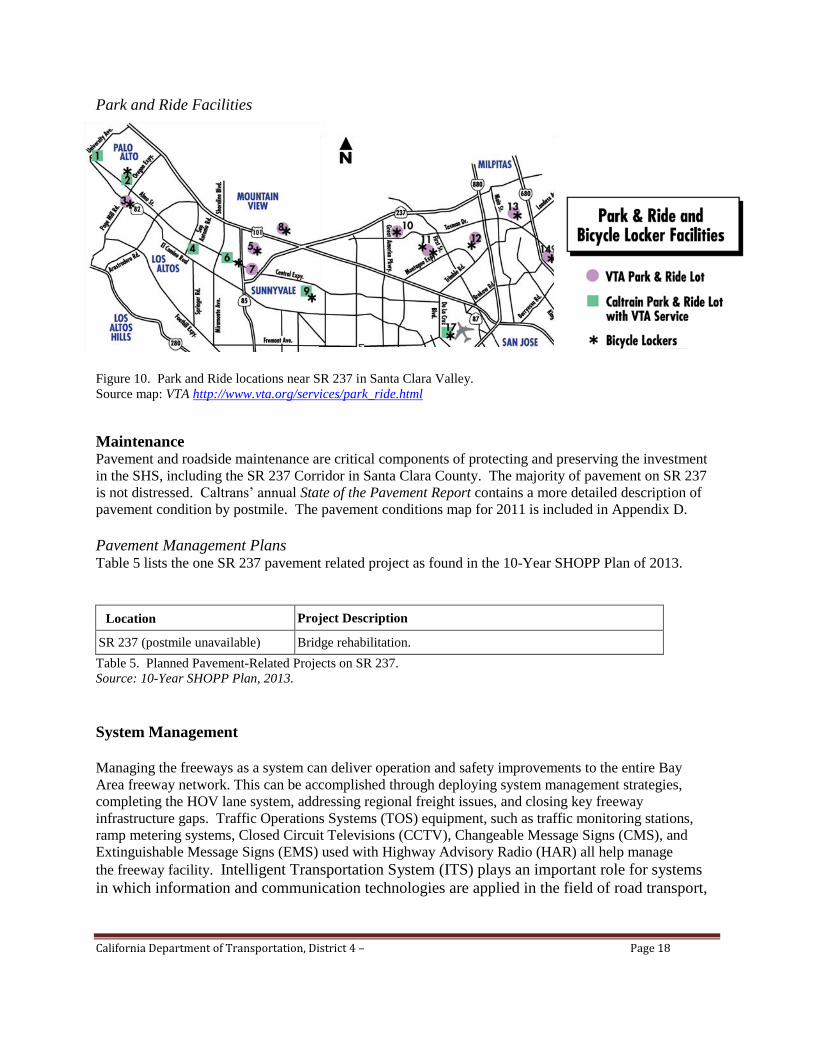
Park and Ride Facilities
Figure 10. Park and Ride locations near SR 237 in Santa Clara Valley.
Source map: VTA http://www.vta.org/services/park_ride.html
Maintenance Pavement and roadside maintenance are critical components of protecting and preserving the investment
in the SHS, including the SR 237 Corridor in Santa Clara County. The majority of pavement on SR 237
is not distressed. Caltrans‘ annual State of the Pavement Report contains a more detailed description of
pavement condition by postmile. The pavement conditions map for 2011 is included in Appendix D.
Pavement Management Plans Table 5 lists the one SR 237 pavement related project as found in the 10-Year SHOPP Plan of 2013.
Location Project Description
SR 237 (postmile unavailable) Bridge rehabilitation.
Table 5. Planned Pavement-Related Projects on SR 237.
Source: 10-Year SHOPP Plan, 2013.
System Management
Managing the freeways as a system can deliver operation and safety improvements to the entire Bay
Area freeway network. This can be accomplished through deploying system management strategies,
completing the HOV lane system, addressing regional freight issues, and closing key freeway
infrastructure gaps. Traffic Operations Systems (TOS) equipment, such as traffic monitoring stations,
ramp metering systems, Closed Circuit Televisions (CCTV), Changeable Message Signs (CMS), and
Extinguishable Message Signs (EMS) used with Highway Advisory Radio (HAR) all help manage
the freeway facility. Intelligent Transportation System (ITS) plays an important role for systems
in which information and communication technologies are applied in the field of road transport,
California Department of Transportation, District 4 – Page 19
including infrastructure, vehicles and users, traffic and mobility management, as well as
interfaces with other modes of transport.
Network connections
Creating complete networks and making connections fit smoothly onto each other are important aspects
to an overall system‘s functionality. When local agencies have an HOV lane on the right side of the road,
it makes sense to place the Caltrans on-ramp HOV lane on the right side as well. Similarly, but on a larger
scale, bridging the gaps between express lane segments helps establish a transportation environment that
is experienced consistently throughout.
For SR 237, the eastbound ramp meters are operational in the PM, while the westbound ramp meters
are operational both in the AM and PM. Additional AM ramps were activated in January 2012 on the
westbound slip on-ramp at Calaveras Boulevard and the westbound on-ramp at McCarthy Boulevard.
Study updates
Recently the El Camino Real/SR 85/SR 237 Middlefield Project Study Report/Project Development
Report was completed, which involved both the SR237/Middlefield Road interchange and the SR85/
El Camino Real interchange.
The SR 237 Express Lane Phase 2 Study and the northbound HOV/express lane I-680 between SR 237
and Alcosta Boulevard are underway. Proposed is the study for modifying the interchange at SR 237 and
Mathilda Avenue, as well as US 101 and Mathilda Avenue.
Additional information
TOS information shared by Caltrans is found on the http://quickmap.dot.ca.gov/ site. Additionally,
Department for Electrical Engineering and Computer Science of the University of Berkeley
http://pems.eecs.berkeley.edu provides traffic data via the Performance Measurement System (PeMS),
where information on Changeable Message Signs can be found.
For CMS (Changeable Message Signs) info, the ATMS - Advanced Transportation Management System
send out a web feed called the Commerical Wholesale Web Portal. This data is also available on PeMS.
For incidents, lane closures, and CMS messages, the QuickMap website delivers this info.
http://quickmap.dot.ca.gov/. For traffic cameras, see http://www.dot.ca.gov/dist4/realtime.htm
Parallel info is fed into MTC's 511 Traveler's Information Center (TIC), their information can be found
on http://www. 511.org
California Department of Transportation, District 4 – Page 20
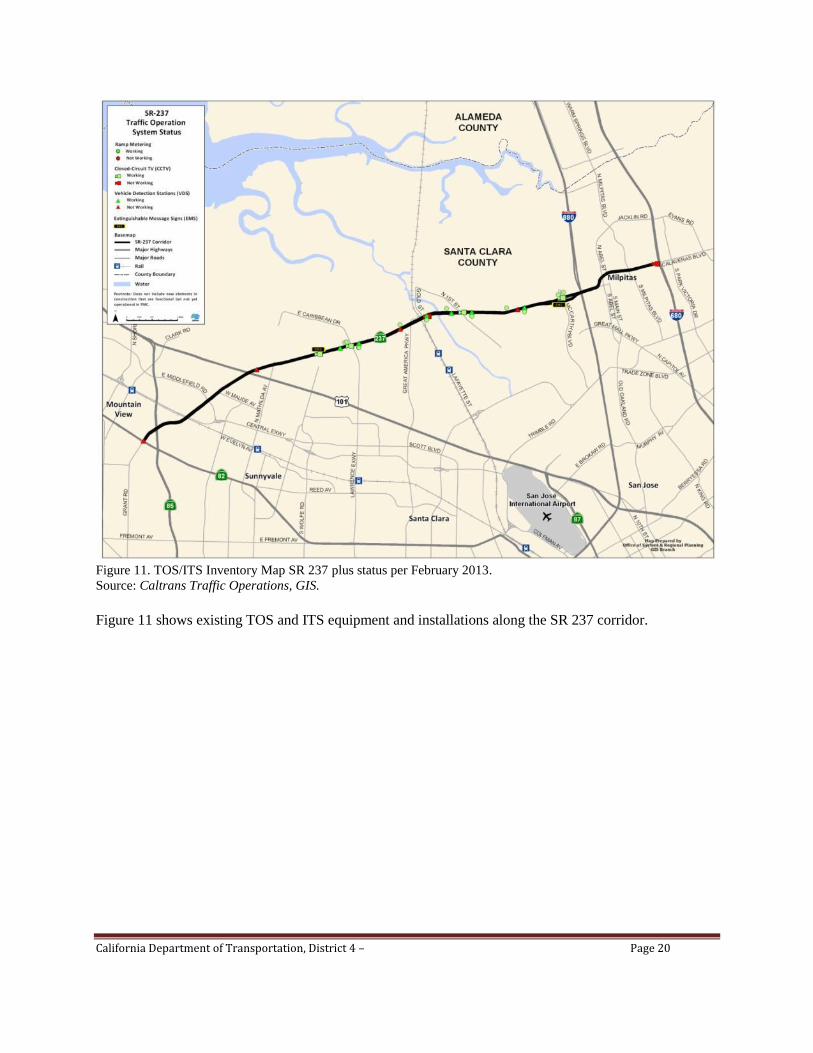
Figure 11. TOS/ITS Inventory Map SR 237 plus status per February 2013.
Source: Caltrans Traffic Operations, GIS.
Figure 11 shows existing TOS and ITS equipment and installations along the SR 237 corridor.
California Department of Transportation, District 4 – Page 21
III. Corridor Performance
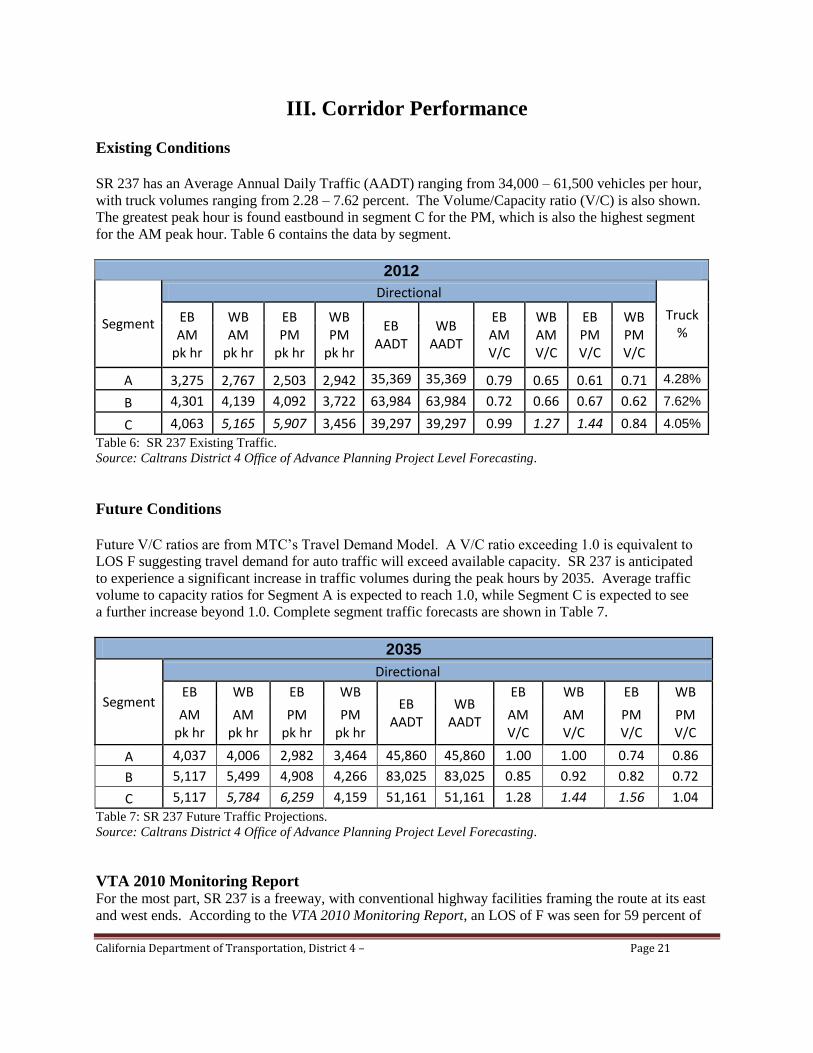
Existing Conditions
SR 237 has an Average Annual Daily Traffic (AADT) ranging from 34,000 – 61,500 vehicles per hour,
with truck volumes ranging from 2.28 – 7.62 percent. The Volume/Capacity ratio (V/C) is also shown.
The greatest peak hour is found eastbound in segment C for the PM, which is also the highest segment
for the AM peak hour. Table 6 contains the data by segment.
2012
Segment
Directional
Truck %
EB AM
pk hr
WB AM
pk hr
EB PM
pk hr
WB PM
pk hr
EB AADT
WB AADT
EB AM V/C
WB AM V/C
EB PM V/C
WB PM V/C
A 3,275 2,767 2,503 2,942 35,369 35,369 0.79 0.65 0.61 0.71 4.28%
B 4,301 4,139 4,092 3,722 63,984 63,984 0.72 0.66 0.67 0.62 7.62%
C 4,063 5,165 5,907 3,456 39,297 39,297 0.99 1.27 1.44 0.84 4.05%
Table 6: SR 237 Existing Traffic.
Source: Caltrans District 4 Office of Advance Planning Project Level Forecasting.
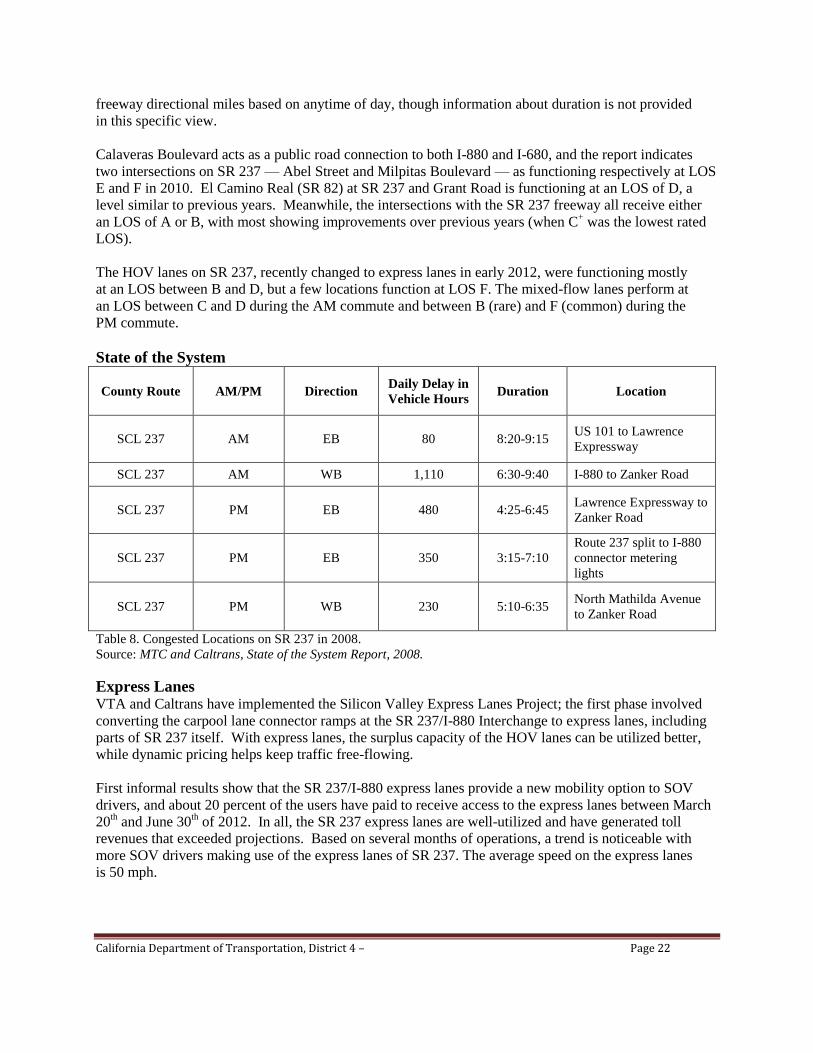
Future Conditions
Future V/C ratios are from MTC‘s Travel Demand Model. A V/C ratio exceeding 1.0 is equivalent to
LOS F suggesting travel demand for auto traffic will exceed available capacity. SR 237 is anticipated
to experience a significant increase in traffic volumes during the peak hours by 2035. Average traffic
volume to capacity ratios for Segment A is expected to reach 1.0, while Segment C is expected to see
a further increase beyond 1.0. Complete segment traffic forecasts are shown in Table 7.
2035
Segment
Directional
EB WB EB WB EB
AADT WB
AADT
EB WB EB WB
AM pk hr
AM pk hr
PM pk hr
PM pk hr
AM V/C
AM V/C
PM V/C
PM V/C
A 4,037 4,006 2,982 3,464 45,860 45,860 1.00 1.00 0.74 0.86
B 5,117 5,499 4,908 4,266 83,025 83,025 0.85 0.92 0.82 0.72
C 5,117 5,784 6,259 4,159 51,161 51,161 1.28 1.44 1.56 1.04
Table 7: SR 237 Future Traffic Projections.
Source: Caltrans District 4 Office of Advance Planning Project Level Forecasting.
VTA 2010 Monitoring Report
For the most part, SR 237 is a freeway, with conventional highway facilities framing the route at its east
and west ends. According to the VTA 2010 Monitoring Report, an LOS of F was seen for 59 percent of
California Department of Transportation, District 4 – Page 22
freeway directional miles based on anytime of day, though information about duration is not provided
in this specific view.
Calaveras Boulevard acts as a public road connection to both I-880 and I-680, and the report indicates
two intersections on SR 237 — Abel Street and Milpitas Boulevard — as functioning respectively at LOS
E and F in 2010. El Camino Real (SR 82) at SR 237 and Grant Road is functioning at an LOS of D, a
level similar to previous years. Meanwhile, the intersections with the SR 237 freeway all receive either
an LOS of A or B, with most showing improvements over previous years (when C+ was the lowest rated
LOS).
The HOV lanes on SR 237, recently changed to express lanes in early 2012, were functioning mostly
at an LOS between B and D, but a few locations function at LOS F. The mixed-flow lanes perform at
an LOS between C and D during the AM commute and between B (rare) and F (common) during the
PM commute.
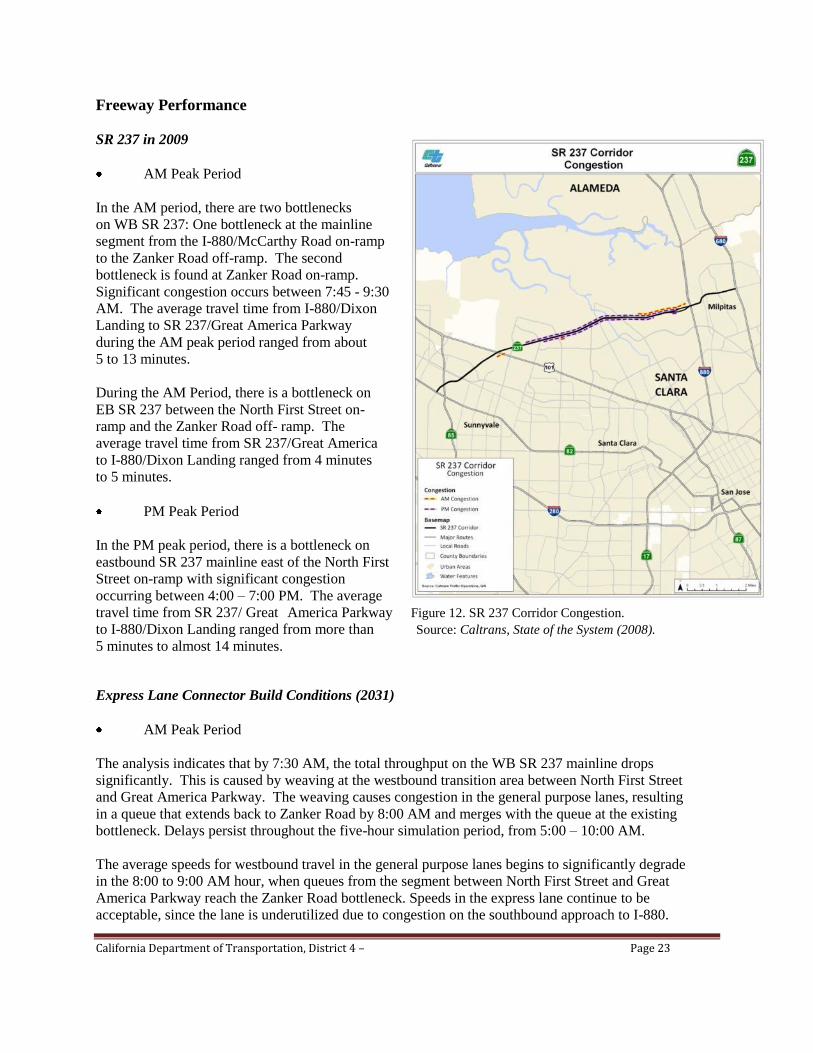
State of the System
County Route AM/PM Direction Daily Delay in
Vehicle Hours Duration Location
SCL 237 AM EB 80 8:20-9:15 US 101 to Lawrence
Expressway
SCL 237 AM WB 1,110 6:30-9:40 I-880 to Zanker Road
SCL 237 PM EB 480 4:25-6:45 Lawrence Expressway to
Zanker Road
SCL 237 PM EB 350 3:15-7:10
Route 237 split to I-880
connector metering
lights
SCL 237 PM WB 230 5:10-6:35 North Mathilda Avenue
to Zanker Road
Table 8. Congested Locations on SR 237 in 2008.
Source: MTC and Caltrans, State of the System Report, 2008.
Express Lanes VTA and Caltrans have implemented the Silicon Valley Express Lanes Project; the first phase involved
converting the carpool lane connector ramps at the SR 237/I-880 Interchange to express lanes, including
parts of SR 237 itself. With express lanes, the surplus capacity of the HOV lanes can be utilized better,
while dynamic pricing helps keep traffic free-flowing.
First informal results show that the SR 237/I-880 express lanes provide a new mobility option to SOV
drivers, and about 20 percent of the users have paid to receive access to the express lanes between March
20th and June 30
th of 2012. In all, the SR 237 express lanes are well-utilized and have generated toll
revenues that exceeded projections. Based on several months of operations, a trend is noticeable with
more SOV drivers making use of the express lanes of SR 237. The average speed on the express lanes
is 50 mph.
California Department of Transportation, District 4 – Page 23
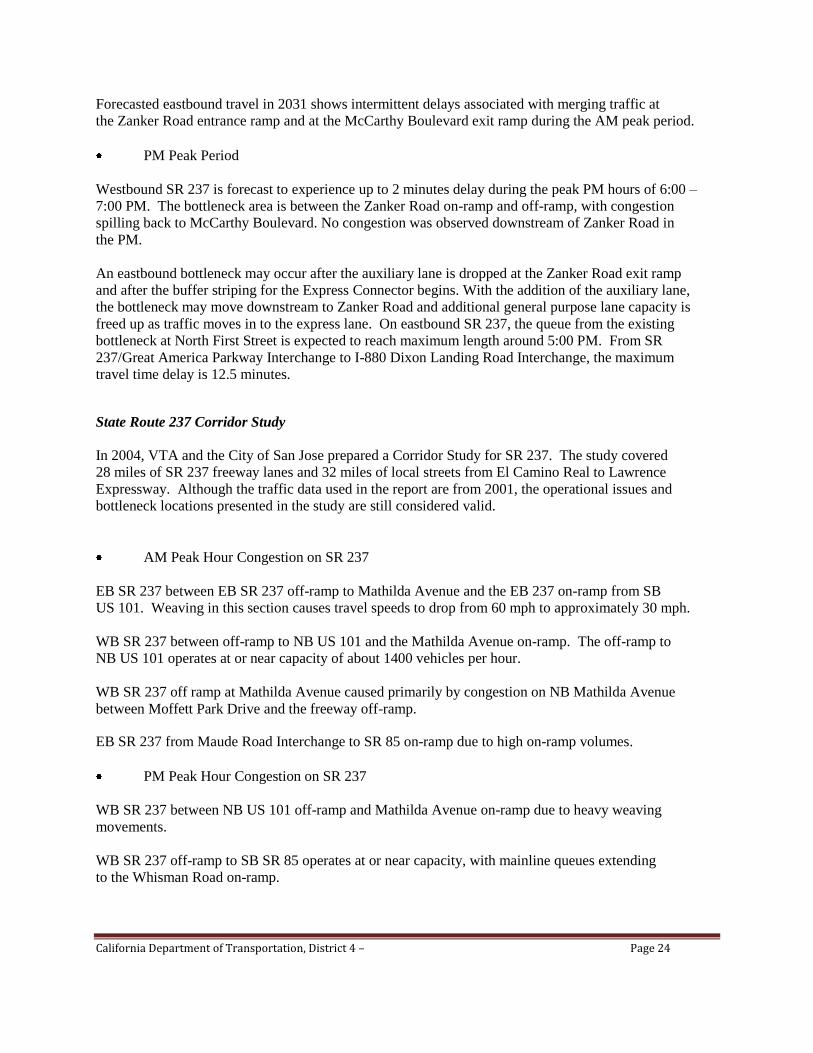
Freeway Performance
SR 237 in 2009
AM Peak Period
In the AM period, there are two bottlenecks
on WB SR 237: One bottleneck at the mainline
segment from the I-880/McCarthy Road on-ramp
to the Zanker Road off-ramp. The second
bottleneck is found at Zanker Road on-ramp.
Significant congestion occurs between 7:45 - 9:30
AM. The average travel time from I-880/Dixon
Landing to SR 237/Great America Parkway
during the AM peak period ranged from about
5 to 13 minutes.
During the AM Period, there is a bottleneck on
EB SR 237 between the North First Street on-
ramp and the Zanker Road off- ramp. The
average travel time from SR 237/Great America
to I-880/Dixon Landing ranged from 4 minutes
to 5 minutes.
PM Peak Period
In the PM peak period, there is a bottleneck on
eastbound SR 237 mainline east of the North First
Street on-ramp with significant congestion
occurring between 4:00 – 7:00 PM. The average
travel time from SR 237/ Great America Parkway Figure 12. SR 237 Corridor Congestion.
to I-880/Dixon Landing ranged from more than Source: Caltrans, State of the System (2008).
5 minutes to almost 14 minutes.
Express Lane Connector Build Conditions (2031)
AM Peak Period
The analysis indicates that by 7:30 AM, the total throughput on the WB SR 237 mainline drops
significantly. This is caused by weaving at the westbound transition area between North First Street
and Great America Parkway. The weaving causes congestion in the general purpose lanes, resulting
in a queue that extends back to Zanker Road by 8:00 AM and merges with the queue at the existing
bottleneck. Delays persist throughout the five-hour simulation period, from 5:00 – 10:00 AM.
The average speeds for westbound travel in the general purpose lanes begins to significantly degrade
in the 8:00 to 9:00 AM hour, when queues from the segment between North First Street and Great
America Parkway reach the Zanker Road bottleneck. Speeds in the express lane continue to be
acceptable, since the lane is underutilized due to congestion on the southbound approach to I-880.
California Department of Transportation, District 4 – Page 24
Forecasted eastbound travel in 2031 shows intermittent delays associated with merging traffic at
the Zanker Road entrance ramp and at the McCarthy Boulevard exit ramp during the AM peak period.
PM Peak Period
Westbound SR 237 is forecast to experience up to 2 minutes delay during the peak PM hours of 6:00 –
7:00 PM. The bottleneck area is between the Zanker Road on-ramp and off-ramp, with congestion
spilling back to McCarthy Boulevard. No congestion was observed downstream of Zanker Road in
the PM.
An eastbound bottleneck may occur after the auxiliary lane is dropped at the Zanker Road exit ramp
and after the buffer striping for the Express Connector begins. With the addition of the auxiliary lane,
the bottleneck may move downstream to Zanker Road and additional general purpose lane capacity is
freed up as traffic moves in to the express lane. On eastbound SR 237, the queue from the existing
bottleneck at North First Street is expected to reach maximum length around 5:00 PM. From SR
237/Great America Parkway Interchange to I-880 Dixon Landing Road Interchange, the maximum
travel time delay is 12.5 minutes.
State Route 237 Corridor Study
In 2004, VTA and the City of San Jose prepared a Corridor Study for SR 237. The study covered
28 miles of SR 237 freeway lanes and 32 miles of local streets from El Camino Real to Lawrence
Expressway. Although the traffic data used in the report are from 2001, the operational issues and
bottleneck locations presented in the study are still considered valid.
AM Peak Hour Congestion on SR 237
EB SR 237 between EB SR 237 off-ramp to Mathilda Avenue and the EB 237 on-ramp from SB
US 101. Weaving in this section causes travel speeds to drop from 60 mph to approximately 30 mph.
WB SR 237 between off-ramp to NB US 101 and the Mathilda Avenue on-ramp. The off-ramp to
NB US 101 operates at or near capacity of about 1400 vehicles per hour.
WB SR 237 off ramp at Mathilda Avenue caused primarily by congestion on NB Mathilda Avenue
between Moffett Park Drive and the freeway off-ramp.
EB SR 237 from Maude Road Interchange to SR 85 on-ramp due to high on-ramp volumes.
PM Peak Hour Congestion on SR 237
WB SR 237 between NB US 101 off-ramp and Mathilda Avenue on-ramp due to heavy weaving
movements.
WB SR 237 off-ramp to SB SR 85 operates at or near capacity, with mainline queues extending
to the Whisman Road on-ramp.
California Department of Transportation, District 4 – Page 25
Intersections
Both the WB SR 237 off-ramp and EB 237 off-ramp intersections along Mathilda Avenue are operating
at or near capacity. The northbound and southbound queues on Mathilda Avenue extend through the
upstream intersections in both the AM and PM peak hours.
SR 237/Grant Road/El Camino Real – The Grant Road intersection has extensive queues along
the eastbound, westbound, and southbound approaches in both the AM and PM peak periods.
Future Conditions (2025)
Future Year 2025 traffic projections were developed from the County-wide VTA Travel Demand model.
The list of roadway and transit improvement assumptions in this model refers to two specific SR 237
projects: SR 237/I-880 interchange improvement (stages A and B), and Measure B Roadway Project.
Measure B Roadway project involves SR 237/I-880 interchange improvements, stage C1 and C2
improvements (braided ramps on SB I-880 between SR 237 and Tasman Drive and direct HOV
connectors between I-880 to the north and SR 237 to the west).
The traffic projections were used as CORSIM input volumes for operational analysis. This Microscopic
Traffic Simulation Model is able to simulate both surface street data and freeway data. In addition to
the operational problems identified in the Existing Conditions, the following locations are expected to
experience operations issues in 2025:
AM Peak Hour
WB SR 237 from Lawrence Expressway to Fair Oaks Avenue due to increased on-ramp volumes.
LOS E or F at five intersections on Mathilda Avenue from Maude Avenue to the SR 237 EB on/off-ramp.
PM Peak Hour
LOS F at five intersections on Mathilda Avenue, from 3rd
Ave/Java to SR 237 WB on/off-ramp.
California Department of Transportation, District 4 – Page 26
IV. Key Corridor Issues
HOV and Express Lanes
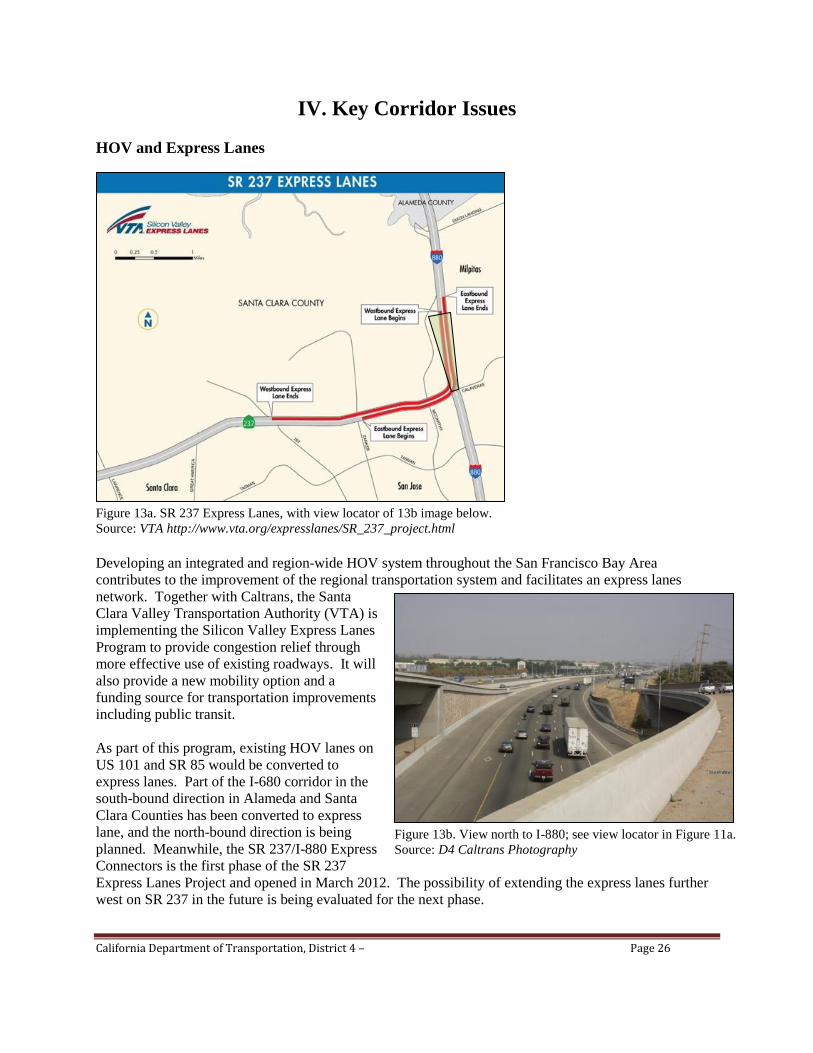
Figure 13a. SR 237 Express Lanes, with view locator of 13b image below.
Source: VTA http://www.vta.org/expresslanes/SR_237_project.html
Developing an integrated and region-wide HOV system throughout the San Francisco Bay Area
contributes to the improvement of the regional transportation system and facilitates an express lanes
network. Together with Caltrans, the Santa
Clara Valley Transportation Authority (VTA) is
implementing the Silicon Valley Express Lanes
Program to provide congestion relief through
more effective use of existing roadways. It will
also provide a new mobility option and a
funding source for transportation improvements
including public transit.
As part of this program, existing HOV lanes on
US 101 and SR 85 would be converted to
express lanes. Part of the I-680 corridor in the
south-bound direction in Alameda and Santa
Clara Counties has been converted to express
lane, and the north-bound direction is being
planned. Meanwhile, the SR 237/I-880 Express
Connectors is the first phase of the SR 237
Express Lanes Project and opened in March 2012. The possibility of extending the express lanes further
west on SR 237 in the future is being evaluated for the next phase.
Figure 13b. View north to I-880; see view locator in Figure 11a.
Source: D4 Caltrans Photography
California Department of Transportation, District 4 – Page 27
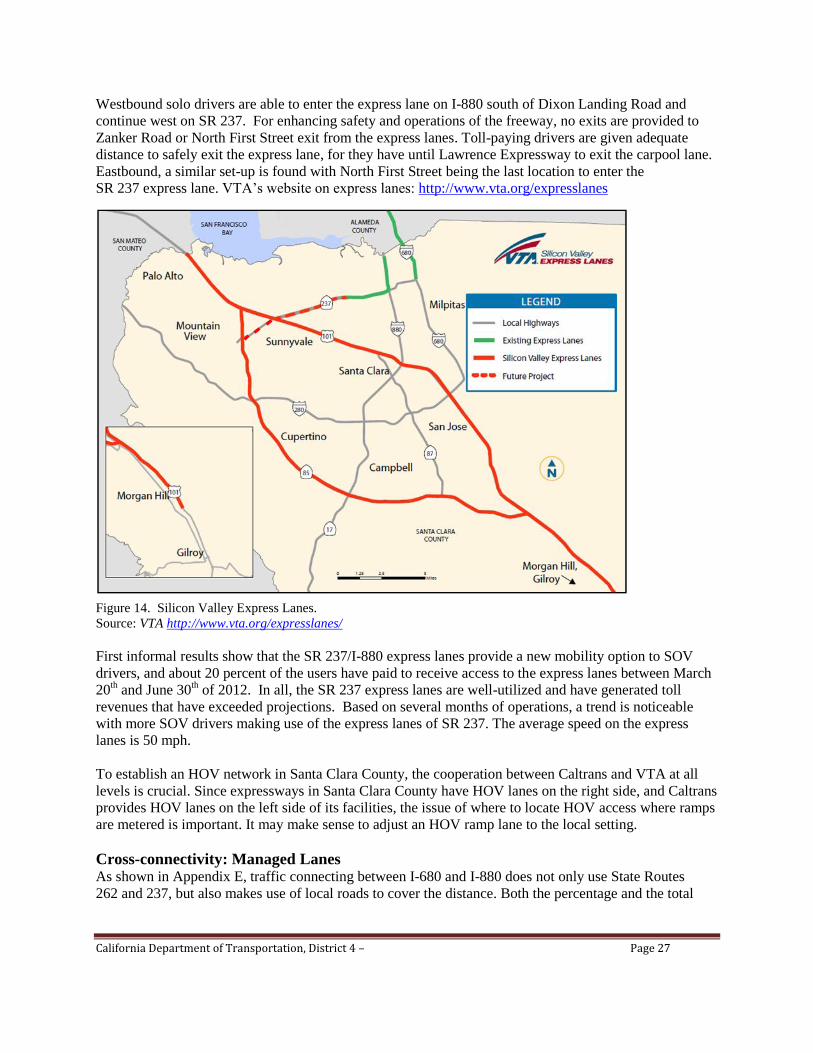
Westbound solo drivers are able to enter the express lane on I-880 south of Dixon Landing Road and
continue west on SR 237. For enhancing safety and operations of the freeway, no exits are provided to
Zanker Road or North First Street exit from the express lanes. Toll-paying drivers are given adequate
distance to safely exit the express lane, for they have until Lawrence Expressway to exit the carpool lane.
Eastbound, a similar set-up is found with North First Street being the last location to enter the
SR 237 express lane. VTA‘s website on express lanes: http://www.vta.org/expresslanes
Figure 14. Silicon Valley Express Lanes. Source: VTA http://www.vta.org/expresslanes/
First informal results show that the SR 237/I-880 express lanes provide a new mobility option to SOV
drivers, and about 20 percent of the users have paid to receive access to the express lanes between March
20th and June 30
th of 2012. In all, the SR 237 express lanes are well-utilized and have generated toll
revenues that have exceeded projections. Based on several months of operations, a trend is noticeable
with more SOV drivers making use of the express lanes of SR 237. The average speed on the express
lanes is 50 mph.
To establish an HOV network in Santa Clara County, the cooperation between Caltrans and VTA at all
levels is crucial. Since expressways in Santa Clara County have HOV lanes on the right side, and Caltrans
provides HOV lanes on the left side of its facilities, the issue of where to locate HOV access where ramps
are metered is important. It may make sense to adjust an HOV ramp lane to the local setting.
Cross-connectivity: Managed Lanes As shown in Appendix E, traffic connecting between I-680 and I-880 does not only use State Routes
262 and 237, but also makes use of local roads to cover the distance. Both the percentage and the total
California Department of Transportation, District 4 – Page 28
of traffic using local roads between I-680 and I-880 are expected to increase in 2040, due to SR 262
and SR 237 functioning at maximum capacity.
In 1997 a cross-connection study was performed for the Alameda County Congestion Management
Agency. This study, titled the Mission Boulevard (Route 262) Express Lane Project Feasibility Study,
focused on an overhead expressway route over the existing Mission Boulevard. In 2001, the Santa Clara
Valley Transportation Authority led a study to investigate alternatives for potential I-680/I-880 cross
connections along six corridors: three in Alameda County and three in Santa Clara. In 2011, a Project
Study Report was completed, centered on improvements at the I-680/Mission Boulevard Interchange and
on related Transportation System Management. Meanwhile, widening the rail bridges that cross SR 262
overhead (Bridges #37-0380L and R) are part of the preparations for the arrival of the BART extension to
San Jose. Additionally, a bridge widening on SR 237 (Calaveras Boulevard), crossing the rail tracks from
four lanes to six lanes plus bicycle lanes, is also planned. Both the studies and the progress towards
improving the cross-connecting facilities show there is a need for addressing the I-680 and I-880 cross
connectivity.
The conventional facility of SR 237 (Segment C), situated between the southbound express lane of
I-680 in Milpitas and the express lane segment of I-880/SR 237, is not the only opportunity for a cross
connection improvement. However, the traffic situation is such that this facility should be seen as part
of a multi-pronged approach to address cross-connecting traffic demands and local circulation concerns.
With an I-680 northbound express facility planned to start here in the future, Calaveras Boulevard has a
potential to connect the express lane facilities. Currently, the express lanes network is not envisioned to
connect these two facilities at this location. Without operational improvements, four intersections on the
conventional segment of SR 237 in Milpitas are projected to operate at an LOS F in 2035. Meanwhile,
converting Calaveras Boulevard to a freeway is not an option for Segment C.
System management improvements are feasible for this location and based on the projected LOS level
should be implemented. Establishing HOV lanes as is done on expressways in Silicon Valley (where not
the center lane, but the right lane becomes an HOV lane) is one option to manage traffic on Calaveras
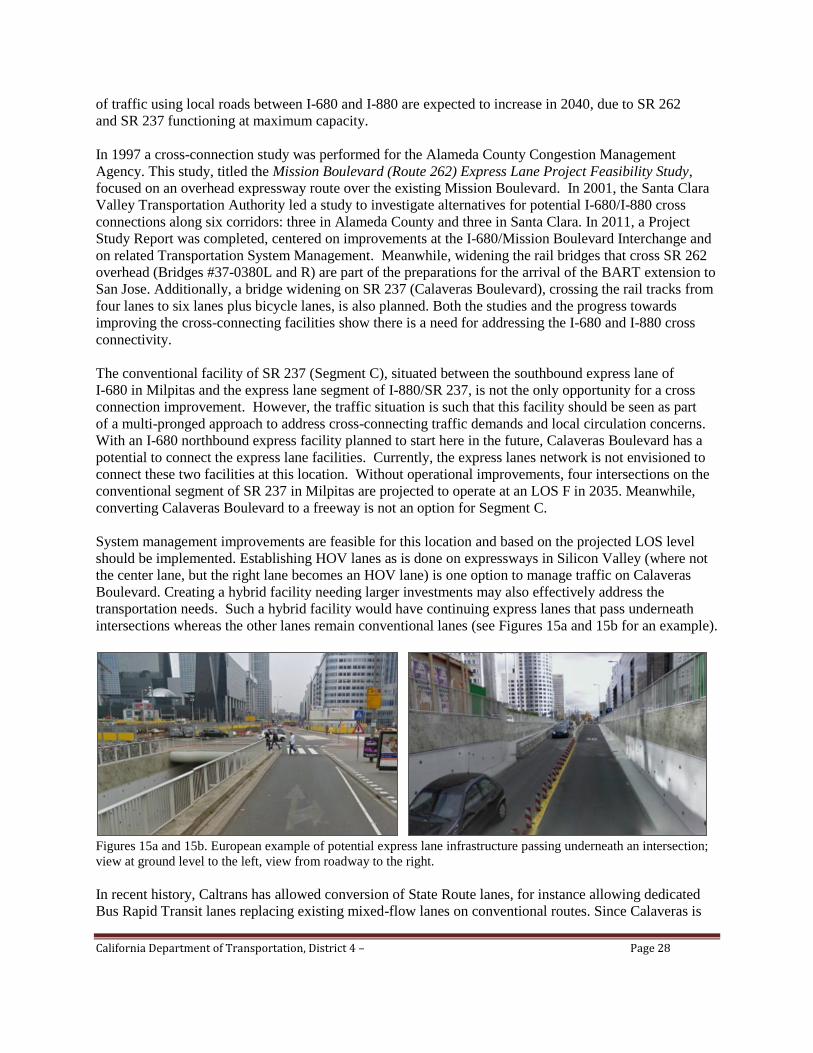
Boulevard. Creating a hybrid facility needing larger investments may also effectively address the
transportation needs. Such a hybrid facility would have continuing express lanes that pass underneath
intersections whereas the other lanes remain conventional lanes (see Figures 15a and 15b for an example).
Figures 15a and 15b. European example of potential express lane infrastructure passing underneath an intersection;
view at ground level to the left, view from roadway to the right.
In recent history, Caltrans has allowed conversion of State Route lanes, for instance allowing dedicated
Bus Rapid Transit lanes replacing existing mixed-flow lanes on conventional routes. Since Calaveras is
California Department of Transportation, District 4 – Page 29
not a freeway, on which facilities Caltrans has a policy to not convert existing lanes, establishing
Managed Lanes is one of the options. It should be studied whether a right-lane HOV treatment is
beneficial in the city of Milpitas.
With SR 237 one of the connections between I-680 and I-880, a second reason exists to review which
management improvements are the most effective alternatives for each cross-connecting facility. SR 262,
for instance, could be the more beneficial location, superseding the need to implement Managed Lanes
on SR 237.
Sea Level Rise Sea level rise and storm surge, more frequent and severe heat waves, and multiple changes concerning
precipitation are three anticipated climate changes of particular significance to the transportation system.
As described in the 2011 Adapting to Rising Tides (produced by MTC, the San Francisco Bay
Conservation and Development Commission and Caltrans), the Department emphasizes a dual approach
to managing climate risks with measures to reduce GHG emissions from transportation and minimize
impacts on essential transportation infrastructure through adaptation strategies.
Adaptation strategies related to corridor planning include:
Prioritize long-term improvements needed to reduce vulnerability
Identify at-risk facilities on particular route segments
Evaluate climate impacts on travel, modes, and emergency response
Integrate information on climatic events into transportation operational systems
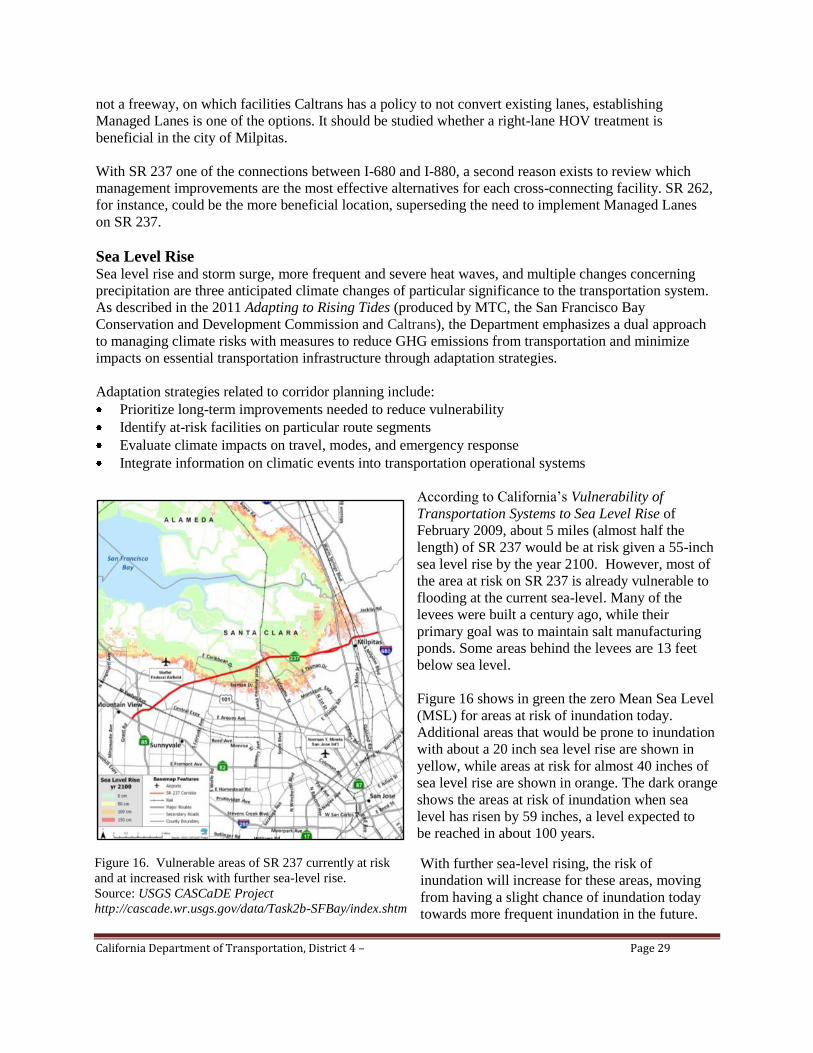
According to California‘s Vulnerability of
Transportation Systems to Sea Level Rise of
February 2009, about 5 miles (almost half the
length) of SR 237 would be at risk given a 55-inch
sea level rise by the year 2100. However, most of
the area at risk on SR 237 is already vulnerable to
flooding at the current sea-level. Many of the
levees were built a century ago, while their
primary goal was to maintain salt manufacturing
ponds. Some areas behind the levees are 13 feet
below sea level.
Figure 16 shows in green the zero Mean Sea Level
(MSL) for areas at risk of inundation today.
Additional areas that would be prone to inundation
with about a 20 inch sea level rise are shown in
yellow, while areas at risk for almost 40 inches of
sea level rise are shown in orange. The dark orange
shows the areas at risk of inundation when sea
level has risen by 59 inches, a level expected to
be reached in about 100 years.
With further sea-level rising, the risk of
inundation will increase for these areas, moving
from having a slight chance of inundation today
towards more frequent inundation in the future.
Figure 16. Vulnerable areas of SR 237 currently at risk
and at increased risk with further sea-level rise.
Source: USGS CASCaDE Project
http://cascade.wr.usgs.gov/data/Task2b-SFBay/index.shtm
California Department of Transportation, District 4 – Page 30
The Department‘s Project Initiation Document (PID) 7 guidance, used to determine whether and how to
incorporate sea level rise concerns into the programming and design of Caltrans projects, acknowledges
that future sea level rise poses a serious threat to residents and existing infrastructure along the coast of
California, including transportation assets. In an effort to better understand potential amounts of rise and
associated impacts, Governor Schwarzenegger signed Executive Order S-13-08 in November 20088. This
order directs State agencies planning construction projects in areas vulnerable to sea level rise to begin
planning for potential impacts by considering a range of scenarios for the years 2050 and 2100. Although
S-13-08 allows for some exemptions for routine maintenance projects and for projects programmed for
construction through 2013, the intent is to plan ahead to assess project vulnerability and reduce
anticipated risks associated with sea level rise.
Currently, two locations have been identified where a high water table causes drainage issues: WB SR-
237 between I-880 and Zanker Road, and Fair Oaks.
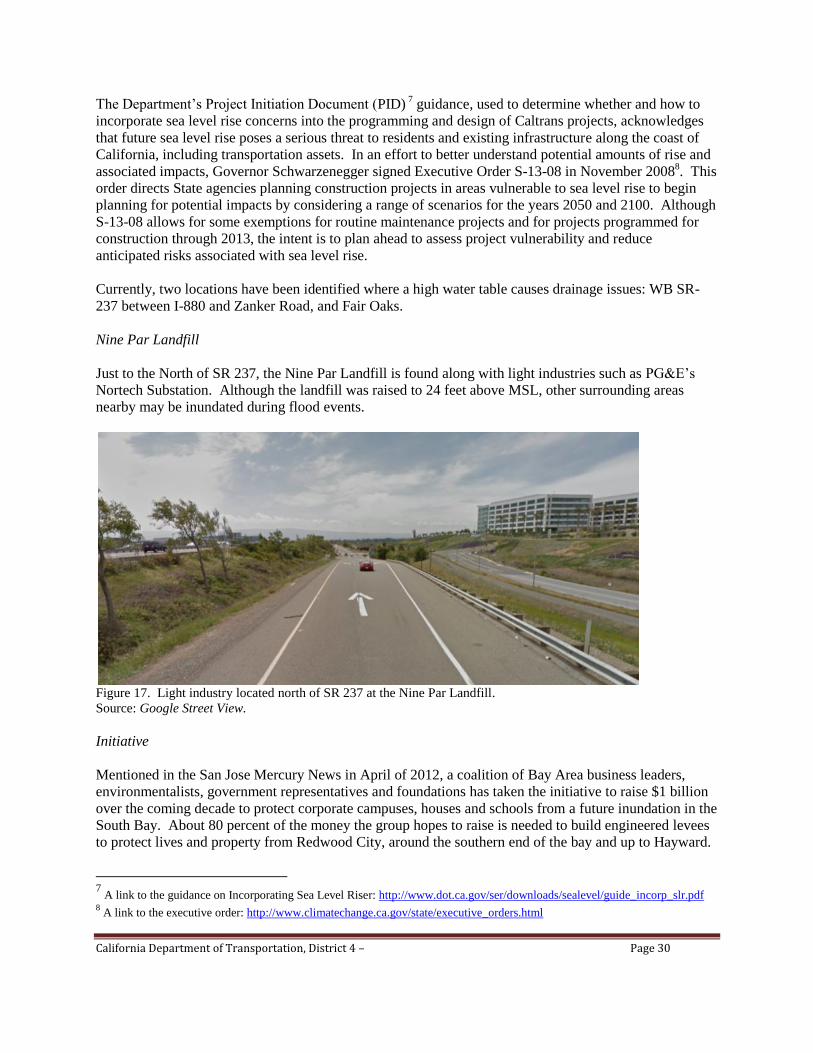
Nine Par Landfill
Just to the North of SR 237, the Nine Par Landfill is found along with light industries such as PG&E‘s
Nortech Substation. Although the landfill was raised to 24 feet above MSL, other surrounding areas
nearby may be inundated during flood events.
Figure 17. Light industry located north of SR 237 at the Nine Par Landfill.
Source: Google Street View.
Initiative
Mentioned in the San Jose Mercury News in April of 2012, a coalition of Bay Area business leaders,
environmentalists, government representatives and foundations has taken the initiative to raise $1 billion
over the coming decade to protect corporate campuses, houses and schools from a future inundation in the
South Bay. About 80 percent of the money the group hopes to raise is needed to build engineered levees
to protect lives and property from Redwood City, around the southern end of the bay and up to Hayward.
7 A link to the guidance on Incorporating Sea Level Riser: http://www.dot.ca.gov/ser/downloads/sealevel/guide_incorp_slr.pdf
8 A link to the executive order: http://www.climatechange.ca.gov/state/executive_orders.html
California Department of Transportation, District 4 – Page 31
The partnership will try to secure the necessary funding from a variety of sources that could include state
bonds, funding from Congress, local tax measures, contributions from affected business property owners,
and other sources.
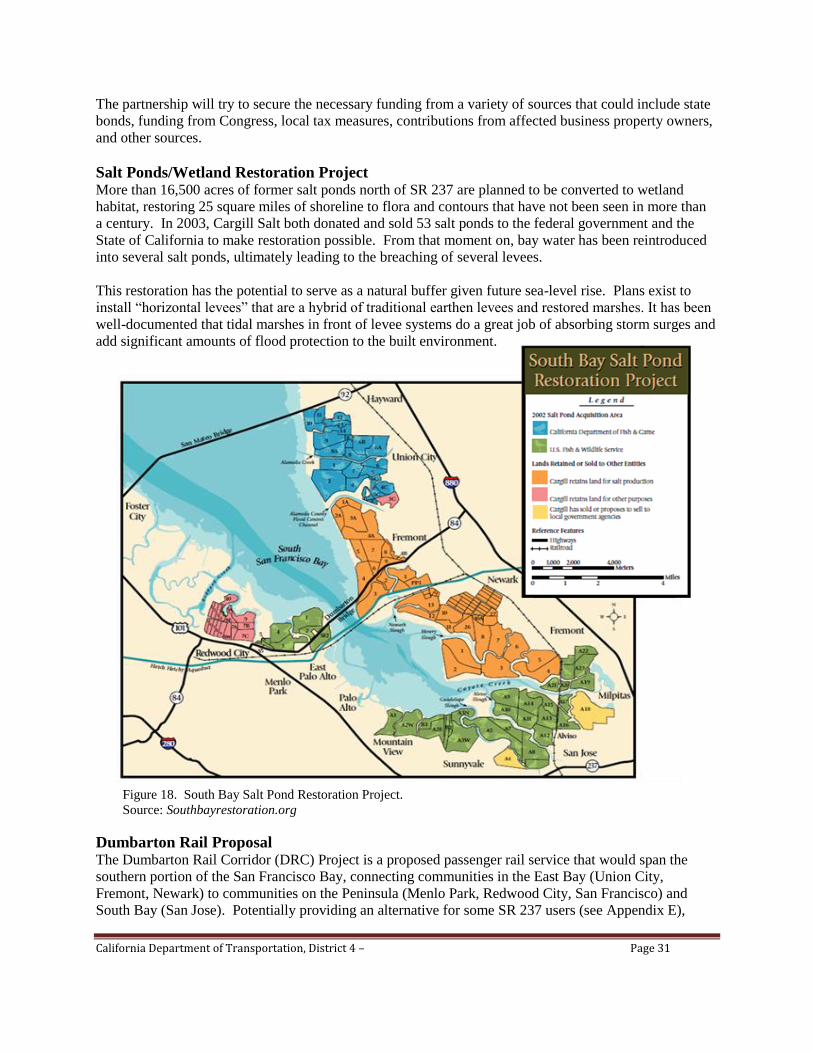
Salt Ponds/Wetland Restoration Project More than 16,500 acres of former salt ponds north of SR 237 are planned to be converted to wetland
habitat, restoring 25 square miles of shoreline to flora and contours that have not been seen in more than
a century. In 2003, Cargill Salt both donated and sold 53 salt ponds to the federal government and the
State of California to make restoration possible. From that moment on, bay water has been reintroduced
into several salt ponds, ultimately leading to the breaching of several levees.
This restoration has the potential to serve as a natural buffer given future sea-level rise. Plans exist to
install ―horizontal levees‖ that are a hybrid of traditional earthen levees and restored marshes. It has been
well-documented that tidal marshes in front of levee systems do a great job of absorbing storm surges and
add significant amounts of flood protection to the built environment.
Figure 18. South Bay Salt Pond Restoration Project.
Source: Southbayrestoration.org
Dumbarton Rail Proposal The Dumbarton Rail Corridor (DRC) Project is a proposed passenger rail service that would span the
southern portion of the San Francisco Bay, connecting communities in the East Bay (Union City,
Fremont, Newark) to communities on the Peninsula (Menlo Park, Redwood City, San Francisco) and
South Bay (San Jose). Potentially providing an alternative for some SR 237 users (see Appendix E),
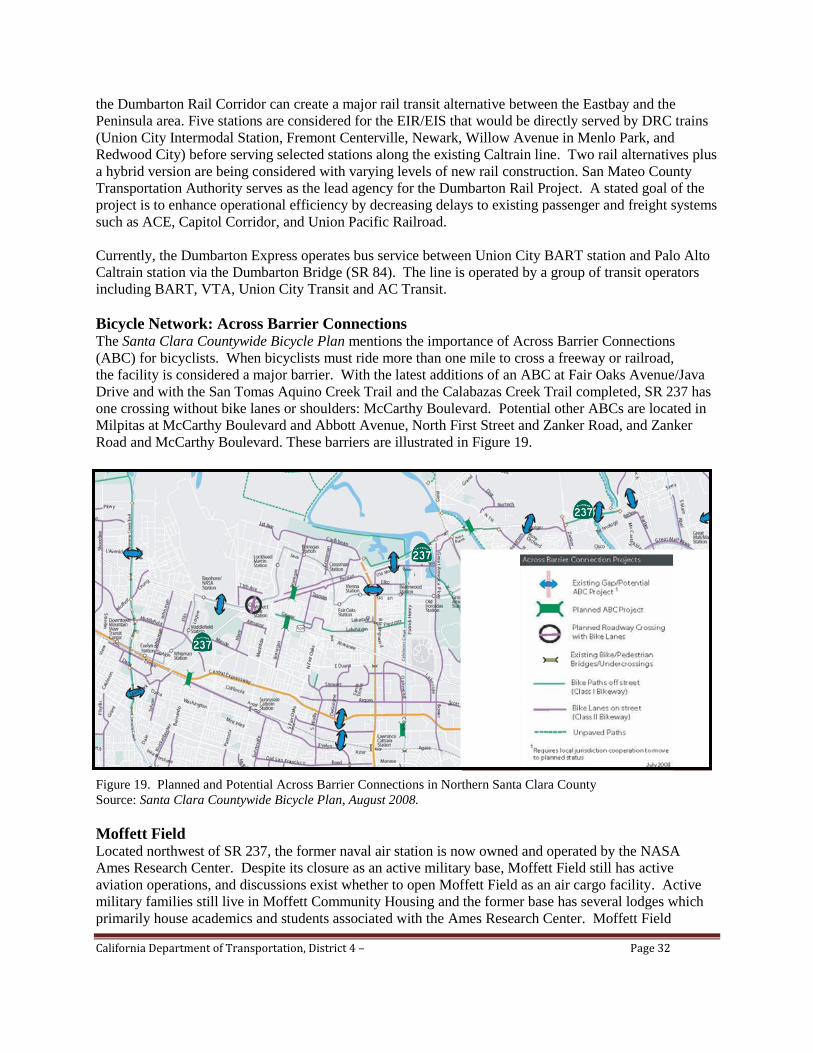
California Department of Transportation, District 4 – Page 32
the Dumbarton Rail Corridor can create a major rail transit alternative between the Eastbay and the
Peninsula area. Five stations are considered for the EIR/EIS that would be directly served by DRC trains
(Union City Intermodal Station, Fremont Centerville, Newark, Willow Avenue in Menlo Park, and
Redwood City) before serving selected stations along the existing Caltrain line. Two rail alternatives plus
a hybrid version are being considered with varying levels of new rail construction. San Mateo County
Transportation Authority serves as the lead agency for the Dumbarton Rail Project. A stated goal of the
project is to enhance operational efficiency by decreasing delays to existing passenger and freight systems
such as ACE, Capitol Corridor, and Union Pacific Railroad.
Currently, the Dumbarton Express operates bus service between Union City BART station and Palo Alto
Caltrain station via the Dumbarton Bridge (SR 84). The line is operated by a group of transit operators
including BART, VTA, Union City Transit and AC Transit.
Bicycle Network: Across Barrier Connections
The Santa Clara Countywide Bicycle Plan mentions the importance of Across Barrier Connections
(ABC) for bicyclists. When bicyclists must ride more than one mile to cross a freeway or railroad,
the facility is considered a major barrier. With the latest additions of an ABC at Fair Oaks Avenue/Java
Drive and with the San Tomas Aquino Creek Trail and the Calabazas Creek Trail completed, SR 237 has
one crossing without bike lanes or shoulders: McCarthy Boulevard. Potential other ABCs are located in
Milpitas at McCarthy Boulevard and Abbott Avenue, North First Street and Zanker Road, and Zanker
Road and McCarthy Boulevard. These barriers are illustrated in Figure 19.
Figure 19. Planned and Potential Across Barrier Connections in Northern Santa Clara County
Source: Santa Clara Countywide Bicycle Plan, August 2008.
Moffett Field Located northwest of SR 237, the former naval air station is now owned and operated by the NASA
Ames Research Center. Despite its closure as an active military base, Moffett Field still has active
aviation operations, and discussions exist whether to open Moffett Field as an air cargo facility. Active
military families still live in Moffett Community Housing and the former base has several lodges which
primarily house academics and students associated with the Ames Research Center. Moffett Field
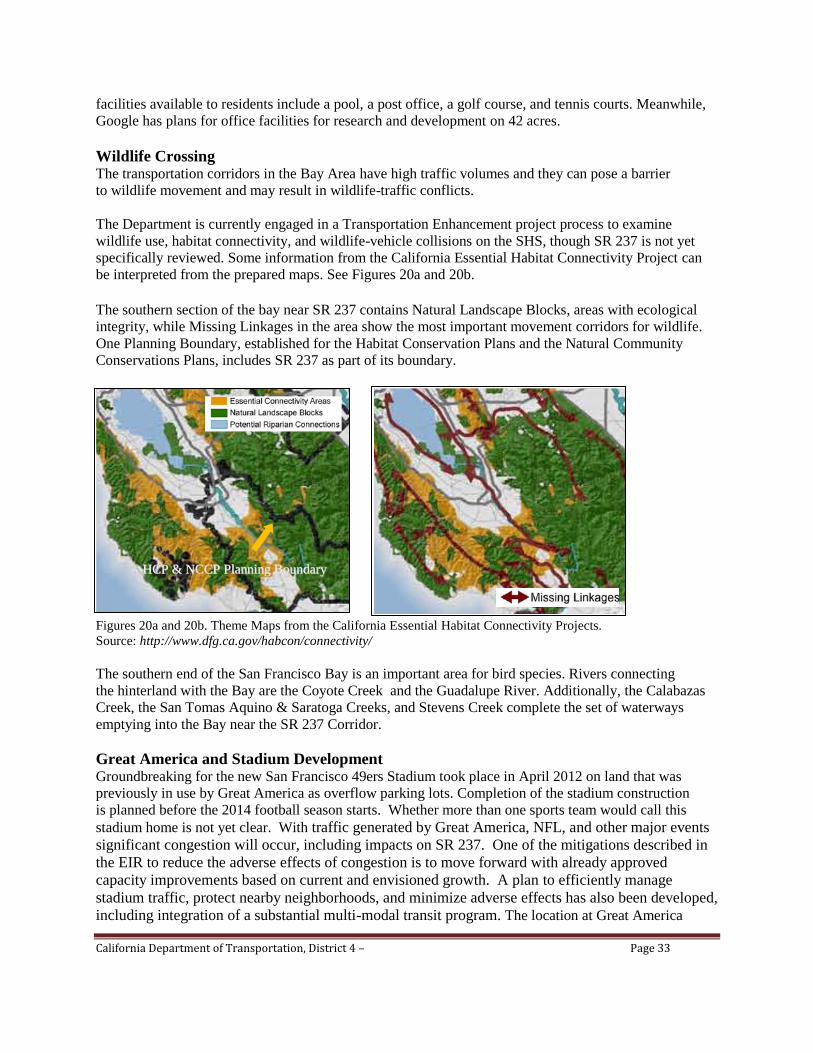
California Department of Transportation, District 4 – Page 33
facilities available to residents include a pool, a post office, a golf course, and tennis courts. Meanwhile,
Google has plans for office facilities for research and development on 42 acres.
Wildlife Crossing The transportation corridors in the Bay Area have high traffic volumes and they can pose a barrier
to wildlife movement and may result in wildlife-traffic conflicts.
The Department is currently engaged in a Transportation Enhancement project process to examine
wildlife use, habitat connectivity, and wildlife-vehicle collisions on the SHS, though SR 237 is not yet
specifically reviewed. Some information from the California Essential Habitat Connectivity Project can
be interpreted from the prepared maps. See Figures 20a and 20b.
The southern section of the bay near SR 237 contains Natural Landscape Blocks, areas with ecological
integrity, while Missing Linkages in the area show the most important movement corridors for wildlife.
One Planning Boundary, established for the Habitat Conservation Plans and the Natural Community
Conservations Plans, includes SR 237 as part of its boundary.
Figures 20a and 20b. Theme Maps from the California Essential Habitat Connectivity Projects.
Source: http://www.dfg.ca.gov/habcon/connectivity/
The southern end of the San Francisco Bay is an important area for bird species. Rivers connecting
the hinterland with the Bay are the Coyote Creek and the Guadalupe River. Additionally, the Calabazas
Creek, the San Tomas Aquino & Saratoga Creeks, and Stevens Creek complete the set of waterways
emptying into the Bay near the SR 237 Corridor.
Great America and Stadium Development Groundbreaking for the new San Francisco 49ers Stadium took place in April 2012 on land that was
previously in use by Great America as overflow parking lots. Completion of the stadium construction
is planned before the 2014 football season starts. Whether more than one sports team would call this
stadium home is not yet clear. With traffic generated by Great America, NFL, and other major events
significant congestion will occur, including impacts on SR 237. One of the mitigations described in
the EIR to reduce the adverse effects of congestion is to move forward with already approved
capacity improvements based on current and envisioned growth. A plan to efficiently manage
stadium traffic, protect nearby neighborhoods, and minimize adverse effects has also been developed,
including integration of a substantial multi-modal transit program. The location at Great America
HHCCPP && NNCCCCPP PPllaannnniinngg BBoouunnddaarryy
California Department of Transportation, District 4 – Page 34
Parkway is served both by light rail (VTA) and regional rail (ACE and Amtrak). It is assumed that
service will increase as attendees become better aware of the availability of transit and its ease
of use for this site.
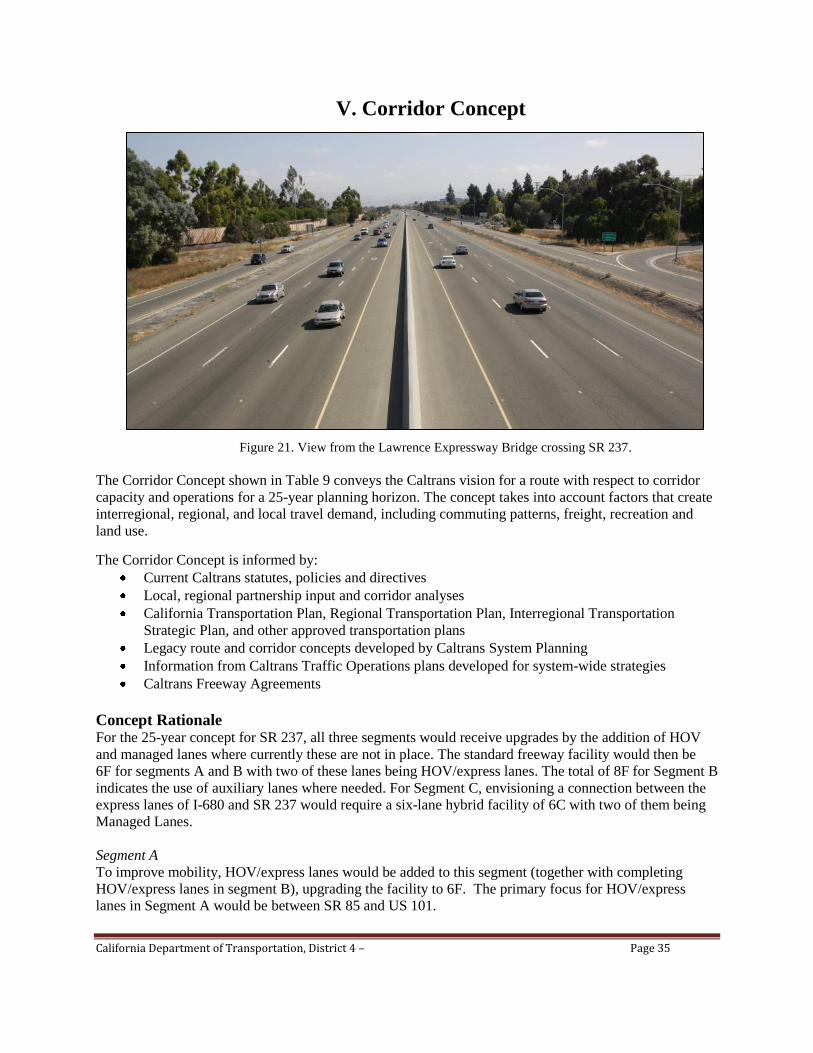
California Department of Transportation, District 4 – Page 35
V. Corridor Concept
Figure 21. View from the Lawrence Expressway Bridge crossing SR 237.
The Corridor Concept shown in Table 9 conveys the Caltrans vision for a route with respect to corridor
capacity and operations for a 25-year planning horizon. The concept takes into account factors that create
interregional, regional, and local travel demand, including commuting patterns, freight, recreation and
land use.
The Corridor Concept is informed by:
Current Caltrans statutes, policies and directives
Local, regional partnership input and corridor analyses
California Transportation Plan, Regional Transportation Plan, Interregional Transportation
Strategic Plan, and other approved transportation plans
Legacy route and corridor concepts developed by Caltrans System Planning
Information from Caltrans Traffic Operations plans developed for system-wide strategies
Caltrans Freeway Agreements
Concept Rationale
For the 25-year concept for SR 237, all three segments would receive upgrades by the addition of HOV
and managed lanes where currently these are not in place. The standard freeway facility would then be
6F for segments A and B with two of these lanes being HOV/express lanes. The total of 8F for Segment B
indicates the use of auxiliary lanes where needed. For Segment C, envisioning a connection between the
express lanes of I-680 and SR 237 would require a six-lane hybrid facility of 6C with two of them being
Managed Lanes.
Segment A
To improve mobility, HOV/express lanes would be added to this segment (together with completing
HOV/express lanes in segment B), upgrading the facility to 6F. The primary focus for HOV/express
lanes in Segment A would be between SR 85 and US 101.
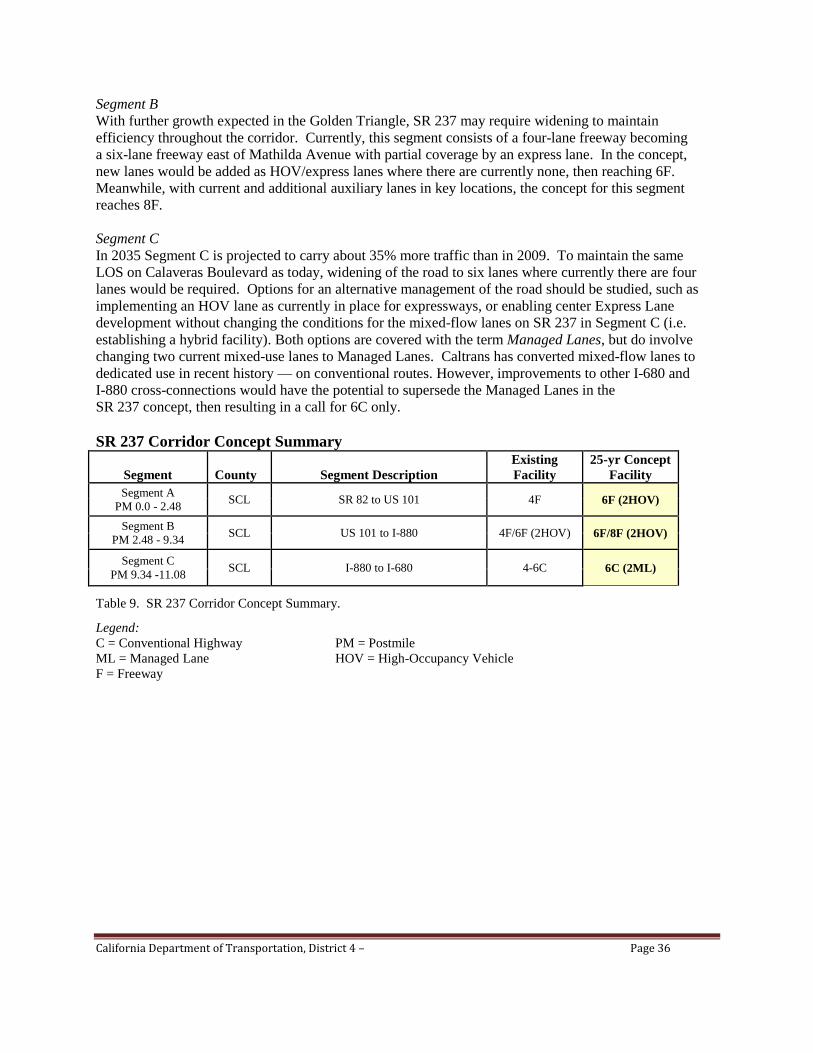
California Department of Transportation, District 4 – Page 36
Segment B
With further growth expected in the Golden Triangle, SR 237 may require widening to maintain
efficiency throughout the corridor. Currently, this segment consists of a four-lane freeway becoming
a six-lane freeway east of Mathilda Avenue with partial coverage by an express lane. In the concept,
new lanes would be added as HOV/express lanes where there are currently none, then reaching 6F.
Meanwhile, with current and additional auxiliary lanes in key locations, the concept for this segment
reaches 8F.
Segment C
In 2035 Segment C is projected to carry about 35% more traffic than in 2009. To maintain the same
LOS on Calaveras Boulevard as today, widening of the road to six lanes where currently there are four
lanes would be required. Options for an alternative management of the road should be studied, such as
implementing an HOV lane as currently in place for expressways, or enabling center Express Lane
development without changing the conditions for the mixed-flow lanes on SR 237 in Segment C (i.e.
establishing a hybrid facility). Both options are covered with the term Managed Lanes, but do involve
changing two current mixed-use lanes to Managed Lanes. Caltrans has converted mixed-flow lanes to
dedicated use in recent history — on conventional routes. However, improvements to other I-680 and
I-880 cross-connections would have the potential to supersede the Managed Lanes in the
SR 237 concept, then resulting in a call for 6C only.
SR 237 Corridor Concept Summary
Segment County Segment Description
Existing
Facility
25-yr Concept
Facility
Segment A
PM 0.0 - 2.48 SCL SR 82 to US 101 4F 6F (2HOV)
Segment B
PM 2.48 - 9.34 SCL US 101 to I-880 4F/6F (2HOV) 6F/8F (2HOV)
Segment C
PM 9.34 -11.08 SCL I-880 to I-680 4-6C 6C (2ML)
Table 9. SR 237 Corridor Concept Summary.
Legend:
C = Conventional Highway PM = Postmile
ML = Managed Lane HOV = High-Occupancy Vehicle
F = Freeway
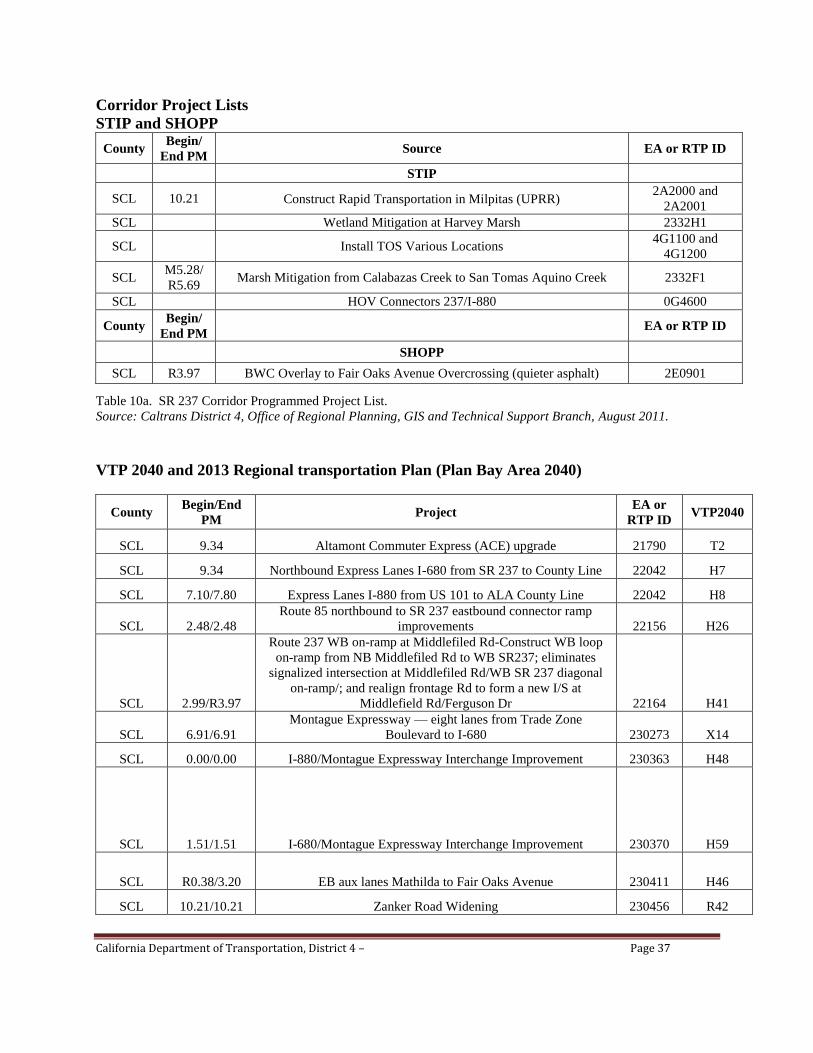
California Department of Transportation, District 4 – Page 37
Corridor Project Lists
STIP and SHOPP
County Begin/
End PM Source EA or RTP ID
STIP
SCL 10.21 Construct Rapid Transportation in Milpitas (UPRR) 2A2000 and
2A2001
SCL Wetland Mitigation at Harvey Marsh 2332H1
SCL Install TOS Various Locations 4G1100 and
4G1200
SCL M5.28/
R5.69 Marsh Mitigation from Calabazas Creek to San Tomas Aquino Creek 2332F1
SCL HOV Connectors 237/I-880 0G4600
County Begin/
End PM EA or RTP ID
SHOPP
SCL R3.97 BWC Overlay to Fair Oaks Avenue Overcrossing (quieter asphalt) 2E0901
Table 10a. SR 237 Corridor Programmed Project List.
Source: Caltrans District 4, Office of Regional Planning, GIS and Technical Support Branch, August 2011.
VTP 2040 and 2013 Regional transportation Plan (Plan Bay Area 2040)
County Begin/End
PM Project
EA or
RTP ID VTP2040
SCL 9.34 Altamont Commuter Express (ACE) upgrade 21790 T2
SCL 9.34 Northbound Express Lanes I-680 from SR 237 to County Line 22042 H7
SCL 7.10/7.80 Express Lanes I-880 from US 101 to ALA County Line 22042 H8
SCL 2.48/2.48
Route 85 northbound to SR 237 eastbound connector ramp
improvements 22156 H26
SCL 2.99/R3.97
Route 237 WB on-ramp at Middlefiled Rd-Construct WB loop
on-ramp from NB Middlefiled Rd to WB SR237; eliminates
signalized intersection at Middlefiled Rd/WB SR 237 diagonal
on-ramp/; and realign frontage Rd to form a new I/S at
Middlefield Rd/Ferguson Dr 22164 H41
SCL 6.91/6.91
Montague Expressway — eight lanes from Trade Zone
Boulevard to I-680 230273 X14
SCL 0.00/0.00 I-880/Montague Expressway Interchange Improvement 230363 H48
SCL 1.51/1.51 I-680/Montague Expressway Interchange Improvement 230370 H59
SCL R0.38/3.20 EB aux lanes Mathilda to Fair Oaks Avenue 230411 H46
SCL 10.21/10.21 Zanker Road Widening 230456 R42
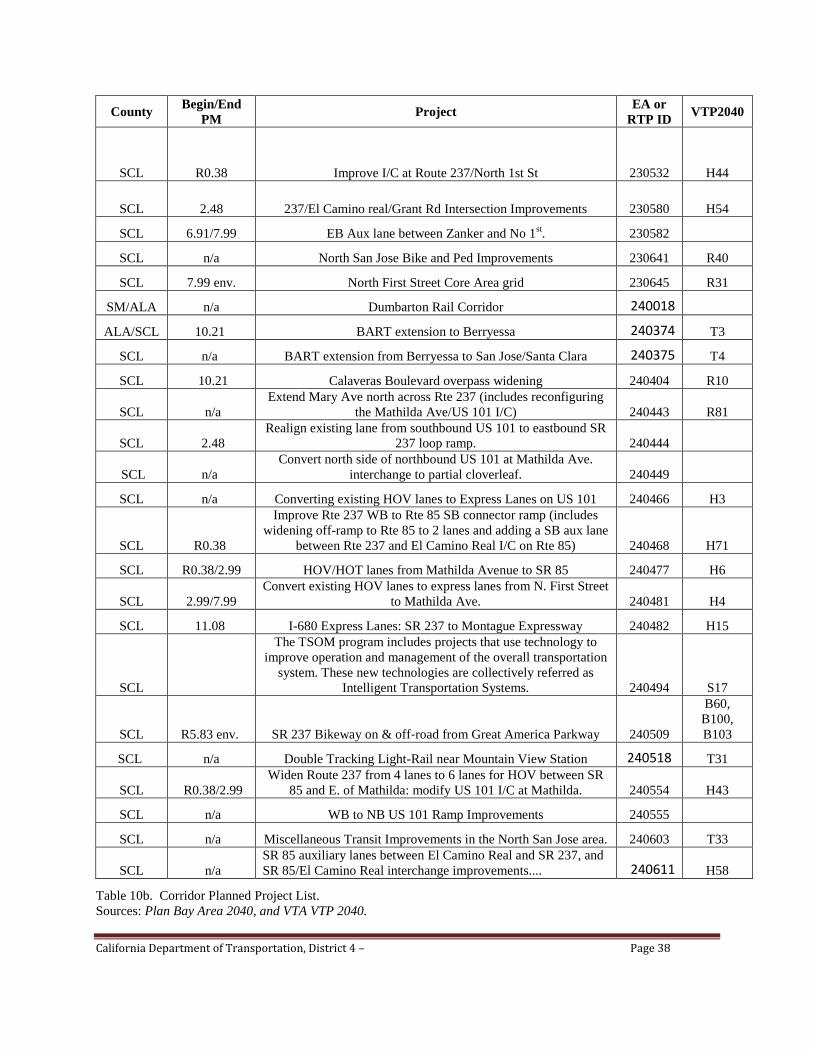
California Department of Transportation, District 4 – Page 38
County Begin/End
PM Project
EA or
RTP ID VTP2040
SCL R0.38 Improve I/C at Route 237/North 1st St 230532 H44
SCL 2.48 237/El Camino real/Grant Rd Intersection Improvements 230580 H54
SCL 6.91/7.99 EB Aux lane between Zanker and No 1st. 230582
SCL n/a North San Jose Bike and Ped Improvements 230641 R40
SCL 7.99 env. North First Street Core Area grid 230645 R31
SM/ALA n/a Dumbarton Rail Corridor 240018
ALA/SCL 10.21 BART extension to Berryessa 240374 T3
SCL n/a BART extension from Berryessa to San Jose/Santa Clara 240375 T4
SCL 10.21 Calaveras Boulevard overpass widening 240404 R10
SCL n/a
Extend Mary Ave north across Rte 237 (includes reconfiguring
the Mathilda Ave/US 101 I/C) 240443 R81
SCL 2.48
Realign existing lane from southbound US 101 to eastbound SR
237 loop ramp. 240444
SCL n/a
Convert north side of northbound US 101 at Mathilda Ave.
interchange to partial cloverleaf. 240449
SCL n/a Converting existing HOV lanes to Express Lanes on US 101 240466 H3
SCL R0.38
Improve Rte 237 WB to Rte 85 SB connector ramp (includes
widening off-ramp to Rte 85 to 2 lanes and adding a SB aux lane
between Rte 237 and El Camino Real I/C on Rte 85) 240468 H71
SCL R0.38/2.99 HOV/HOT lanes from Mathilda Avenue to SR 85 240477 H6
SCL 2.99/7.99
Convert existing HOV lanes to express lanes from N. First Street
to Mathilda Ave. 240481 H4
SCL 11.08 I-680 Express Lanes: SR 237 to Montague Expressway 240482 H15
SCL
The TSOM program includes projects that use technology to
improve operation and management of the overall transportation
system. These new technologies are collectively referred as
Intelligent Transportation Systems. 240494 S17
SCL R5.83 env. SR 237 Bikeway on & off‐road from Great America Parkway 240509
B60,
B100,
B103
SCL n/a Double Tracking Light-Rail near Mountain View Station 240518 T31
SCL R0.38/2.99
Widen Route 237 from 4 lanes to 6 lanes for HOV between SR
85 and E. of Mathilda: modify US 101 I/C at Mathilda. 240554 H43
SCL n/a WB to NB US 101 Ramp Improvements 240555
SCL n/a Miscellaneous Transit Improvements in the North San Jose area. 240603 T33
SCL n/a
SR 85 auxiliary lanes between El Camino Real and SR 237, and
SR 85/El Camino Real interchange improvements.... 240611 H58
Table 10b. Corridor Planned Project List.
Sources: Plan Bay Area 2040, and VTA VTP 2040.
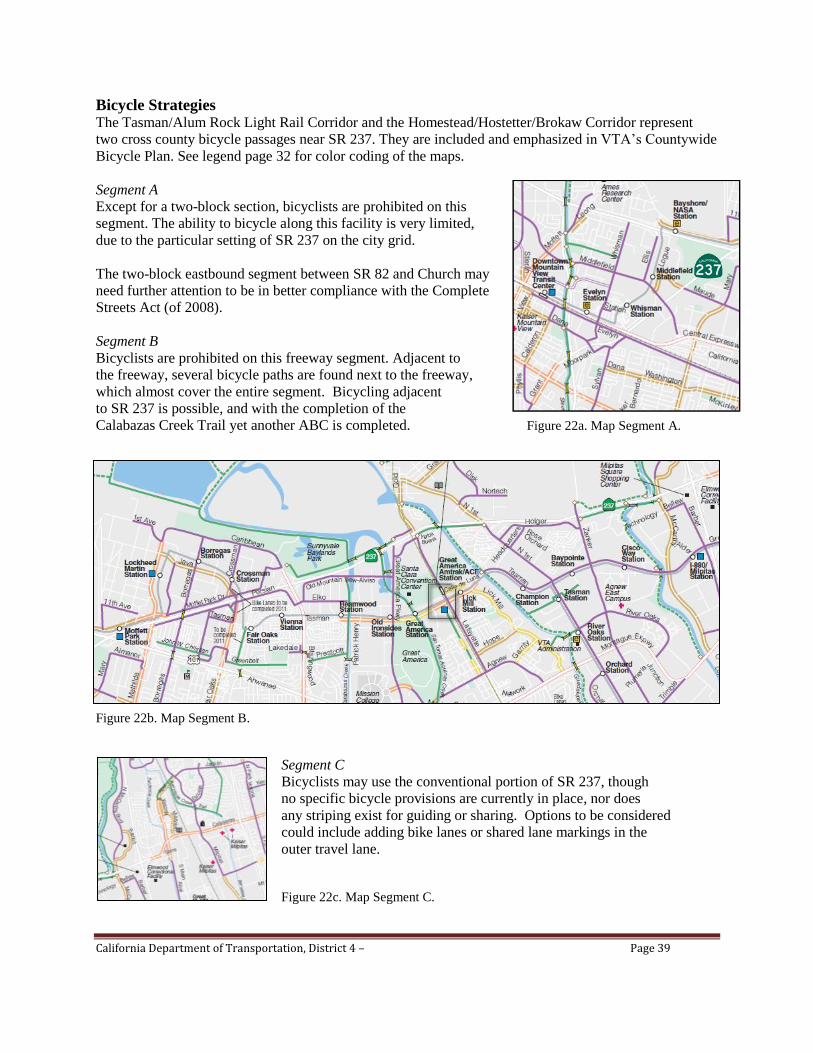
California Department of Transportation, District 4 – Page 39
Bicycle Strategies The Tasman/Alum Rock Light Rail Corridor and the Homestead/Hostetter/Brokaw Corridor represent
two cross county bicycle passages near SR 237. They are included and emphasized in VTA‘s Countywide
Bicycle Plan. See legend page 32 for color coding of the maps.
Segment A
Except for a two-block section, bicyclists are prohibited on this
segment. The ability to bicycle along this facility is very limited,
due to the particular setting of SR 237 on the city grid.
The two-block eastbound segment between SR 82 and Church may
need further attention to be in better compliance with the Complete
Streets Act (of 2008).
Segment B
Bicyclists are prohibited on this freeway segment. Adjacent to
the freeway, several bicycle paths are found next to the freeway,
which almost cover the entire segment. Bicycling adjacent
to SR 237 is possible, and with the completion of the
Calabazas Creek Trail yet another ABC is completed. Figure 22a. Map Segment A.
Figure 22b. Map Segment B.
Segment C
Bicyclists may use the conventional portion of SR 237, though
no specific bicycle provisions are currently in place, nor does
any striping exist for guiding or sharing. Options to be considered
could include adding bike lanes or shared lane markings in the
outer travel lane.
Figure 22c. Map Segment C.
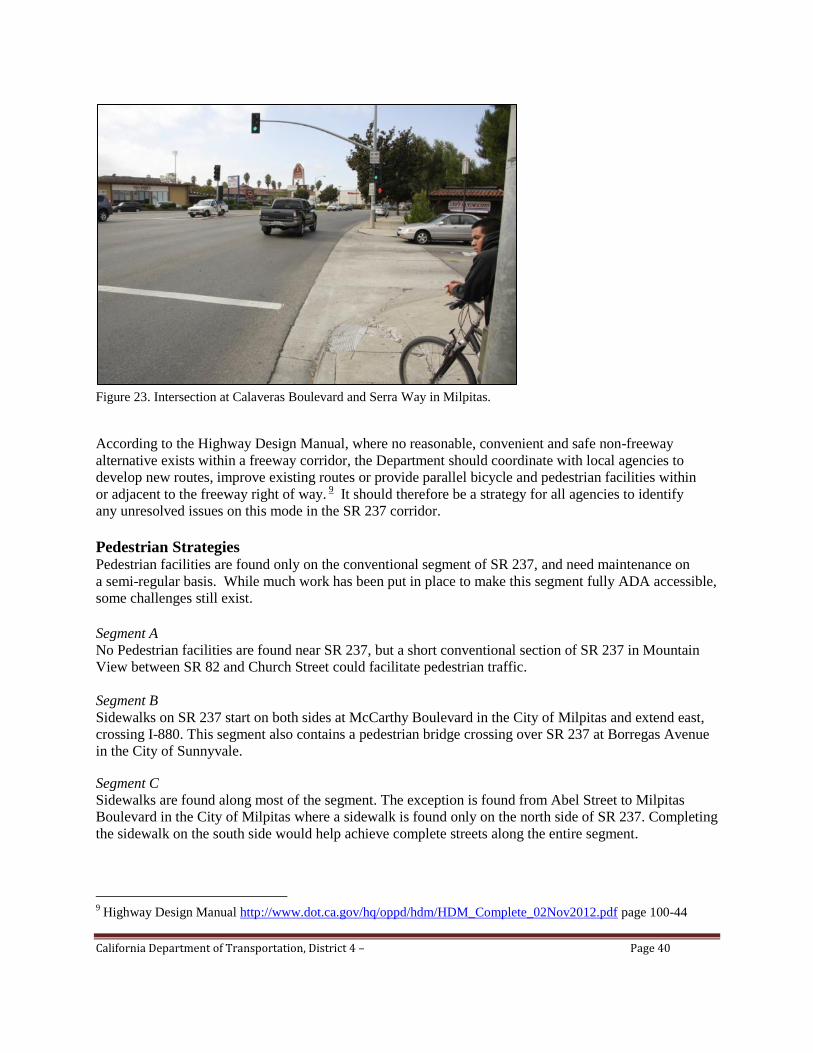
California Department of Transportation, District 4 – Page 40
Figure 23. Intersection at Calaveras Boulevard and Serra Way in Milpitas.
According to the Highway Design Manual, where no reasonable, convenient and safe non-freeway
alternative exists within a freeway corridor, the Department should coordinate with local agencies to
develop new routes, improve existing routes or provide parallel bicycle and pedestrian facilities within
or adjacent to the freeway right of way. 9 It should therefore be a strategy for all agencies to identify
any unresolved issues on this mode in the SR 237 corridor.
Pedestrian Strategies
Pedestrian facilities are found only on the conventional segment of SR 237, and need maintenance on
a semi-regular basis. While much work has been put in place to make this segment fully ADA accessible,
some challenges still exist. Segment A
No Pedestrian facilities are found near SR 237, but a short conventional section of SR 237 in Mountain
View between SR 82 and Church Street could facilitate pedestrian traffic.
Segment B
Sidewalks on SR 237 start on both sides at McCarthy Boulevard in the City of Milpitas and extend east,
crossing I-880. This segment also contains a pedestrian bridge crossing over SR 237 at Borregas Avenue
in the City of Sunnyvale.
Segment C
Sidewalks are found along most of the segment. The exception is found from Abel Street to Milpitas
Boulevard in the City of Milpitas where a sidewalk is found only on the north side of SR 237. Completing
the sidewalk on the south side would help achieve complete streets along the entire segment.
9 Highway Design Manual http://www.dot.ca.gov/hq/oppd/hdm/HDM_Complete_02Nov2012.pdf page 100-44
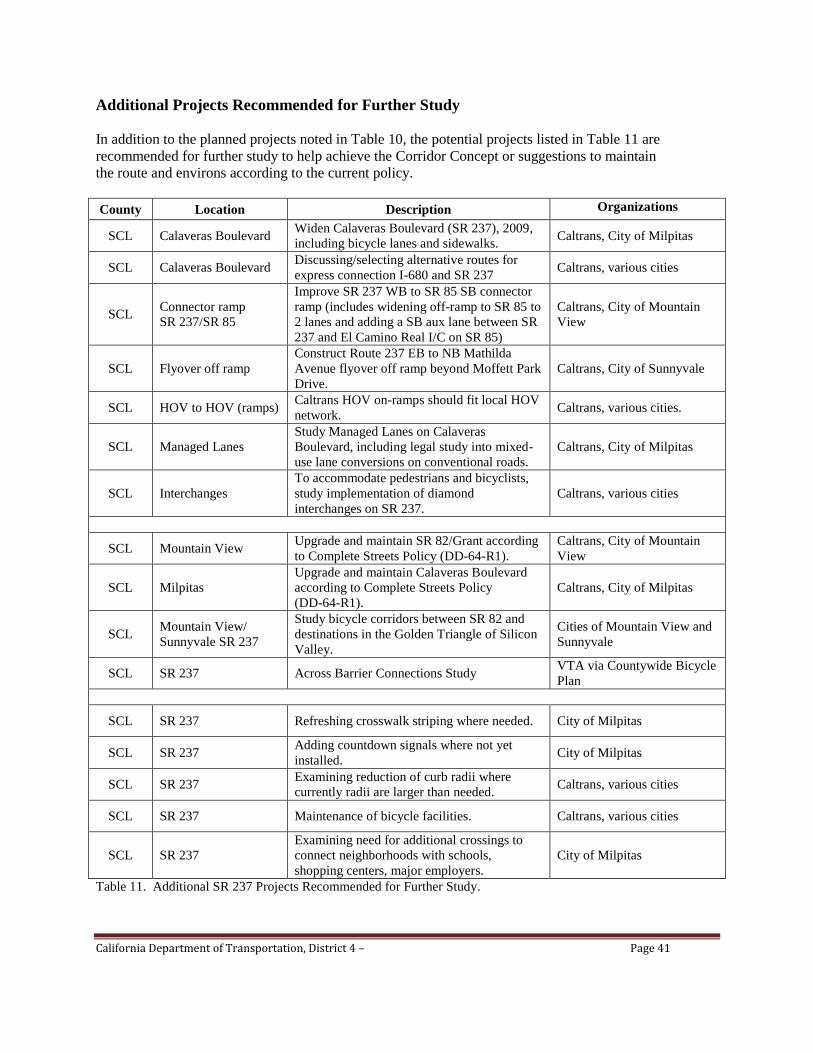
California Department of Transportation, District 4 – Page 41
Additional Projects Recommended for Further Study
In addition to the planned projects noted in Table 10, the potential projects listed in Table 11 are
recommended for further study to help achieve the Corridor Concept or suggestions to maintain
the route and environs according to the current policy.
County Location Description Organizations
SCL Calaveras Boulevard Widen Calaveras Boulevard (SR 237), 2009,
including bicycle lanes and sidewalks. Caltrans, City of Milpitas
SCL Calaveras Boulevard Discussing/selecting alternative routes for
express connection I-680 and SR 237 Caltrans, various cities
SCL Connector ramp
SR 237/SR 85
Improve SR 237 WB to SR 85 SB connector
ramp (includes widening off-ramp to SR 85 to
2 lanes and adding a SB aux lane between SR
237 and El Camino Real I/C on SR 85)
Caltrans, City of Mountain
View
SCL Flyover off ramp
Construct Route 237 EB to NB Mathilda
Avenue flyover off ramp beyond Moffett Park
Drive.
Caltrans, City of Sunnyvale
SCL HOV to HOV (ramps) Caltrans HOV on-ramps should fit local HOV
network. Caltrans, various cities.
SCL Managed Lanes
Study Managed Lanes on Calaveras
Boulevard, including legal study into mixed-
use lane conversions on conventional roads.
Caltrans, City of Milpitas
SCL Interchanges
To accommodate pedestrians and bicyclists,
study implementation of diamond
interchanges on SR 237.
Caltrans, various cities
SCL Mountain View Upgrade and maintain SR 82/Grant according
to Complete Streets Policy (DD-64-R1).
Caltrans, City of Mountain
View
SCL Milpitas
Upgrade and maintain Calaveras Boulevard
according to Complete Streets Policy
(DD-64-R1).
Caltrans, City of Milpitas
SCL Mountain View/
Sunnyvale SR 237
Study bicycle corridors between SR 82 and
destinations in the Golden Triangle of Silicon
Valley.
Cities of Mountain View and
Sunnyvale
SCL SR 237 Across Barrier Connections Study VTA via Countywide Bicycle
Plan
SCL SR 237 Refreshing crosswalk striping where needed. City of Milpitas
SCL SR 237 Adding countdown signals where not yet
installed. City of Milpitas
SCL SR 237 Examining reduction of curb radii where
currently radii are larger than needed. Caltrans, various cities
SCL SR 237 Maintenance of bicycle facilities. Caltrans, various cities
SCL SR 237
Examining need for additional crossings to
connect neighborhoods with schools,
shopping centers, major employers.
City of Milpitas
Table 11. Additional SR 237 Projects Recommended for Further Study.
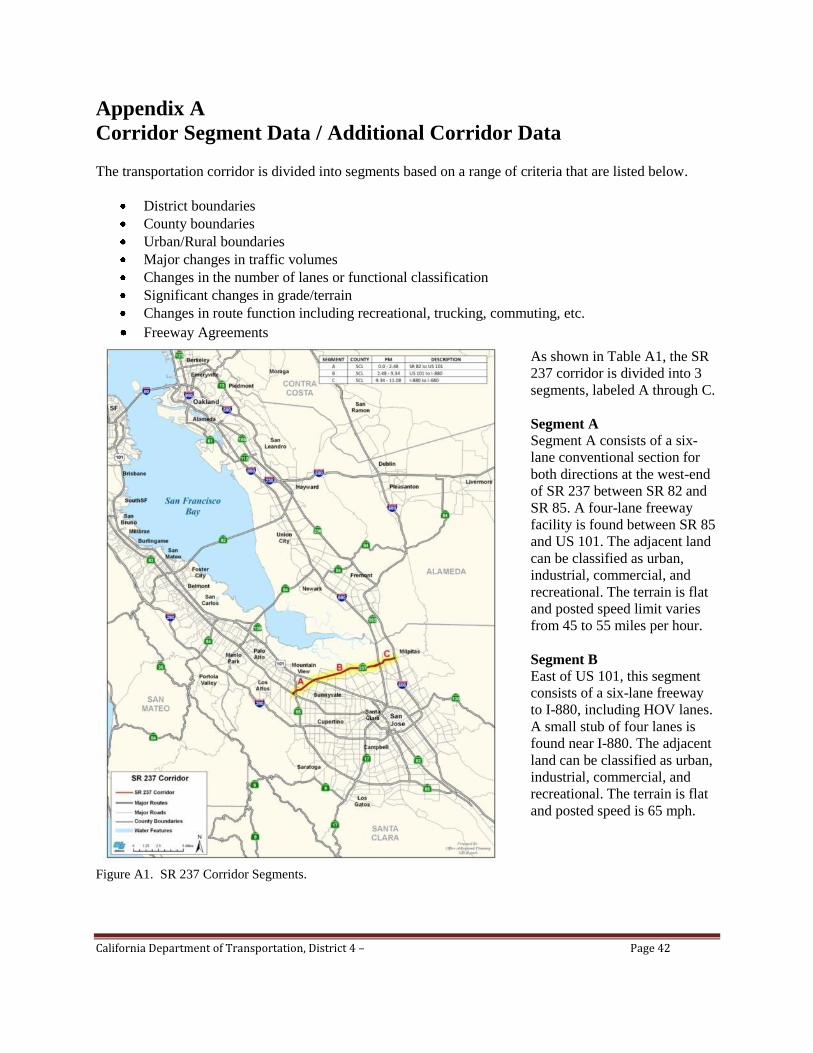
California Department of Transportation, District 4 – Page 42
Appendix A
Corridor Segment Data / Additional Corridor Data
The transportation corridor is divided into segments based on a range of criteria that are listed below.
District boundaries
County boundaries
Urban/Rural boundaries
Major changes in traffic volumes
Changes in the number of lanes or functional classification
Significant changes in grade/terrain
Changes in route function including recreational, trucking, commuting, etc.
Freeway Agreements
Figure A1. SR 237 Corridor Segments.
As shown in Table A1, the SR
237 corridor is divided into 3
segments, labeled A through C.
Segment A
Segment A consists of a six-
lane conventional section for
both directions at the west-end
of SR 237 between SR 82 and
SR 85. A four-lane freeway
facility is found between SR 85
and US 101. The adjacent land
can be classified as urban,
industrial, commercial, and
recreational. The terrain is flat
and posted speed limit varies
from 45 to 55 miles per hour.
Segment B
East of US 101, this segment
consists of a six-lane freeway
to I-880, including HOV lanes.
A small stub of four lanes is
found near I-880. The adjacent
land can be classified as urban,
industrial, commercial, and
recreational. The terrain is flat
and posted speed is 65 mph.
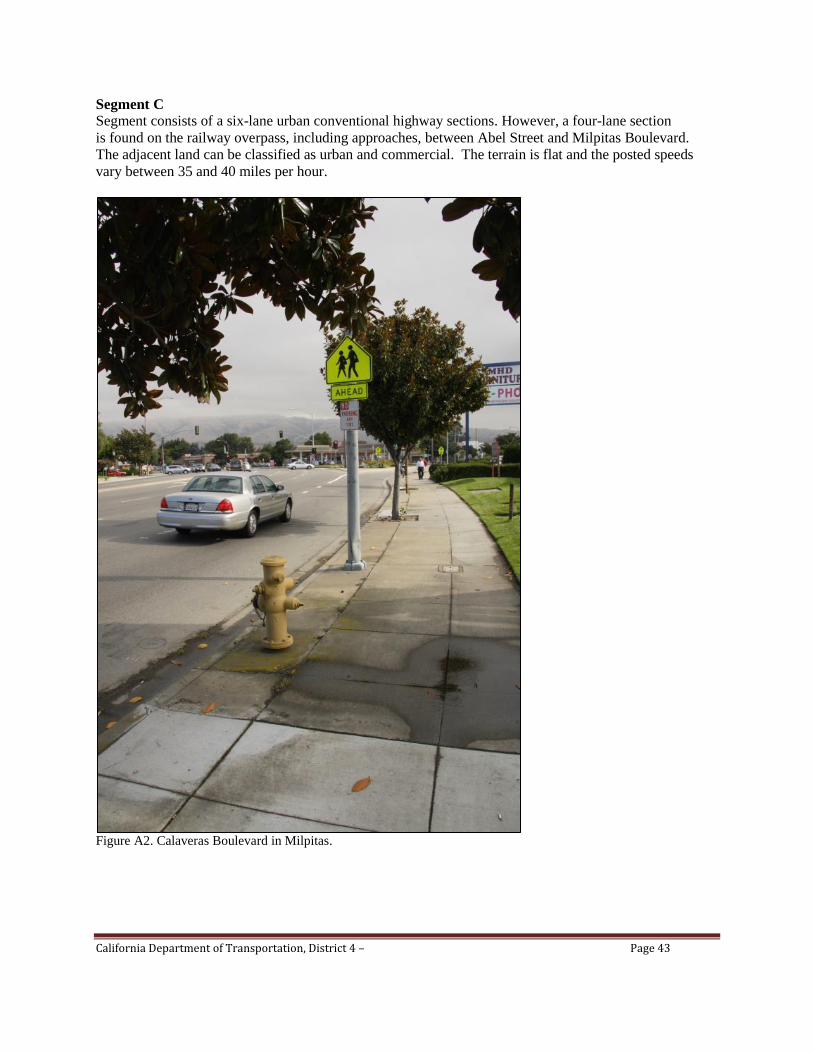
California Department of Transportation, District 4 – Page 43
Segment C
Segment consists of a six-lane urban conventional highway sections. However, a four-lane section
is found on the railway overpass, including approaches, between Abel Street and Milpitas Boulevard.
The adjacent land can be classified as urban and commercial. The terrain is flat and the posted speeds
vary between 35 and 40 miles per hour.
Figure A2. Calaveras Boulevard in Milpitas.
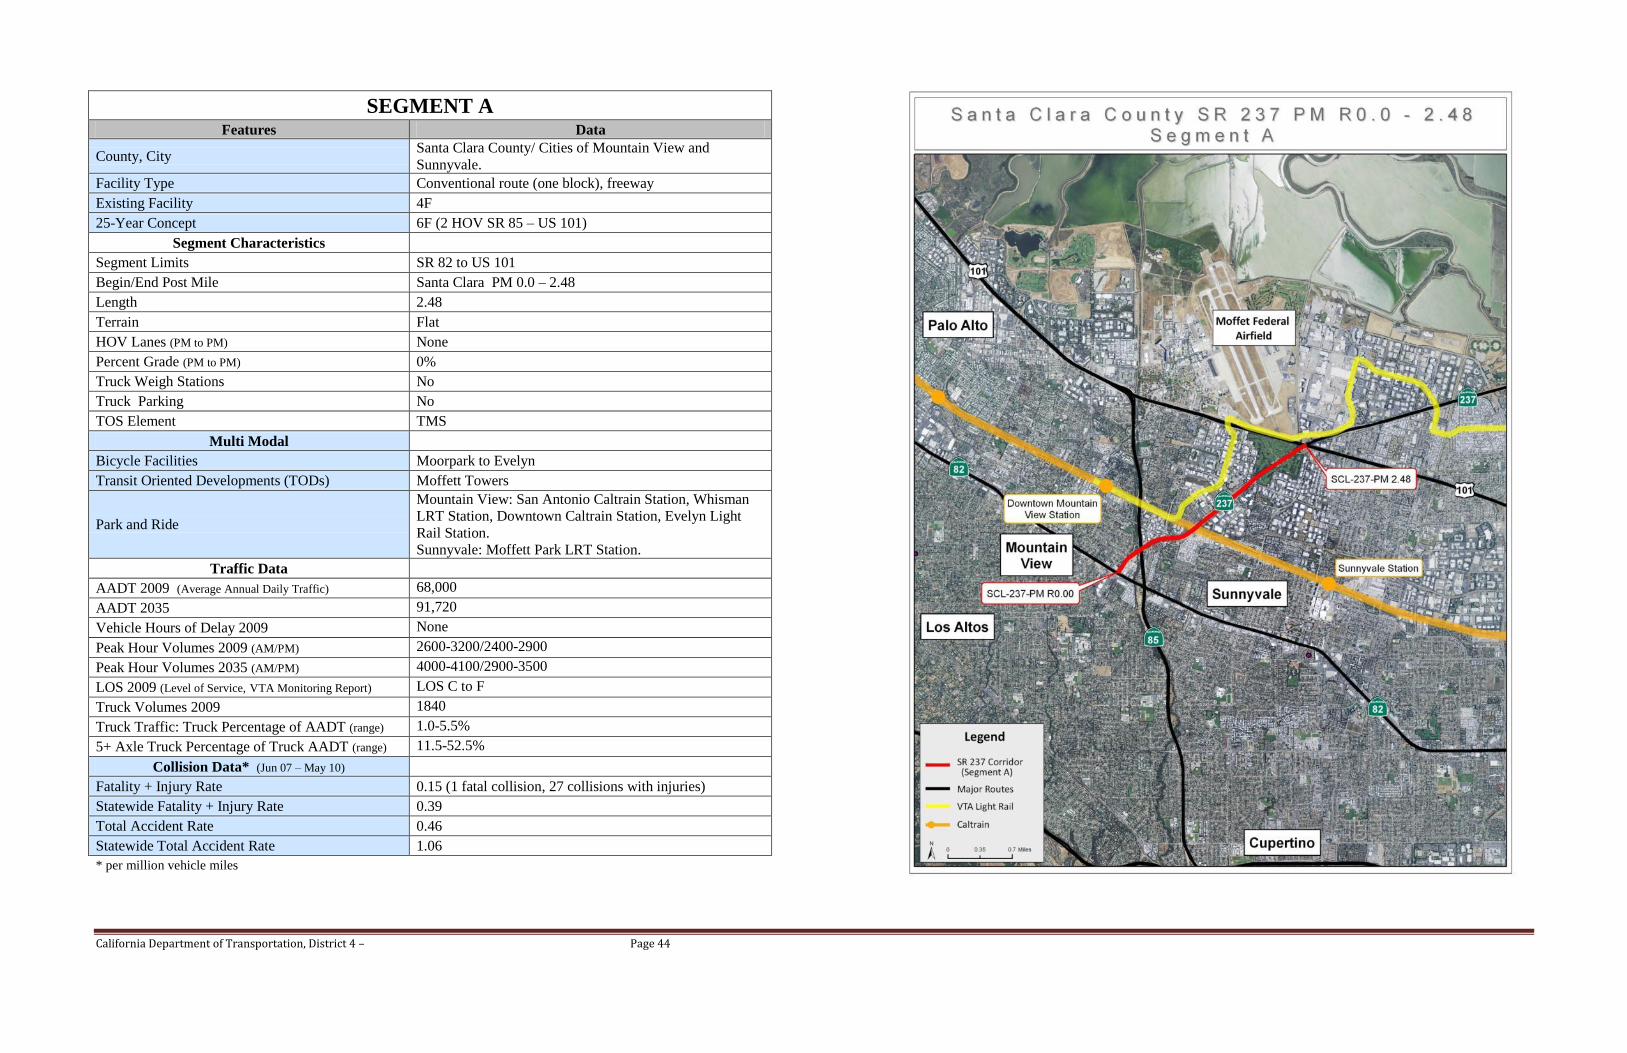
California Department of Transportation, District 4 – Page 44
SEGMENT A Features Data
County, City Santa Clara County/ Cities of Mountain View and
Sunnyvale.
Facility Type Conventional route (one block), freeway
Existing Facility 4F
25-Year Concept 6F (2 HOV SR 85 – US 101)
Segment Characteristics
Segment Limits SR 82 to US 101
Begin/End Post Mile Santa Clara PM 0.0 – 2.48
Length 2.48
Terrain Flat
HOV Lanes (PM to PM) None
Percent Grade (PM to PM) 0%
Truck Weigh Stations No
Truck Parking No
TOS Element TMS
Multi Modal
Bicycle Facilities Moorpark to Evelyn
Transit Oriented Developments (TODs) Moffett Towers
Park and Ride
Mountain View: San Antonio Caltrain Station, Whisman
LRT Station, Downtown Caltrain Station, Evelyn Light
Rail Station.
Sunnyvale: Moffett Park LRT Station.
Traffic Data
AADT 2009 (Average Annual Daily Traffic) 68,000
AADT 2035 91,720
Vehicle Hours of Delay 2009 None
Peak Hour Volumes 2009 (AM/PM) 2600-3200/2400-2900
Peak Hour Volumes 2035 (AM/PM) 4000-4100/2900-3500
LOS 2009 (Level of Service, VTA Monitoring Report) LOS C to F
Truck Volumes 2009 1840
Truck Traffic: Truck Percentage of AADT (range) 1.0-5.5%
5+ Axle Truck Percentage of Truck AADT (range) 11.5-52.5%
Collision Data* (Jun 07 – May 10)
Fatality + Injury Rate 0.15 (1 fatal collision, 27 collisions with injuries)
Statewide Fatality + Injury Rate 0.39
Total Accident Rate 0.46
Statewide Total Accident Rate 1.06
* per million vehicle miles
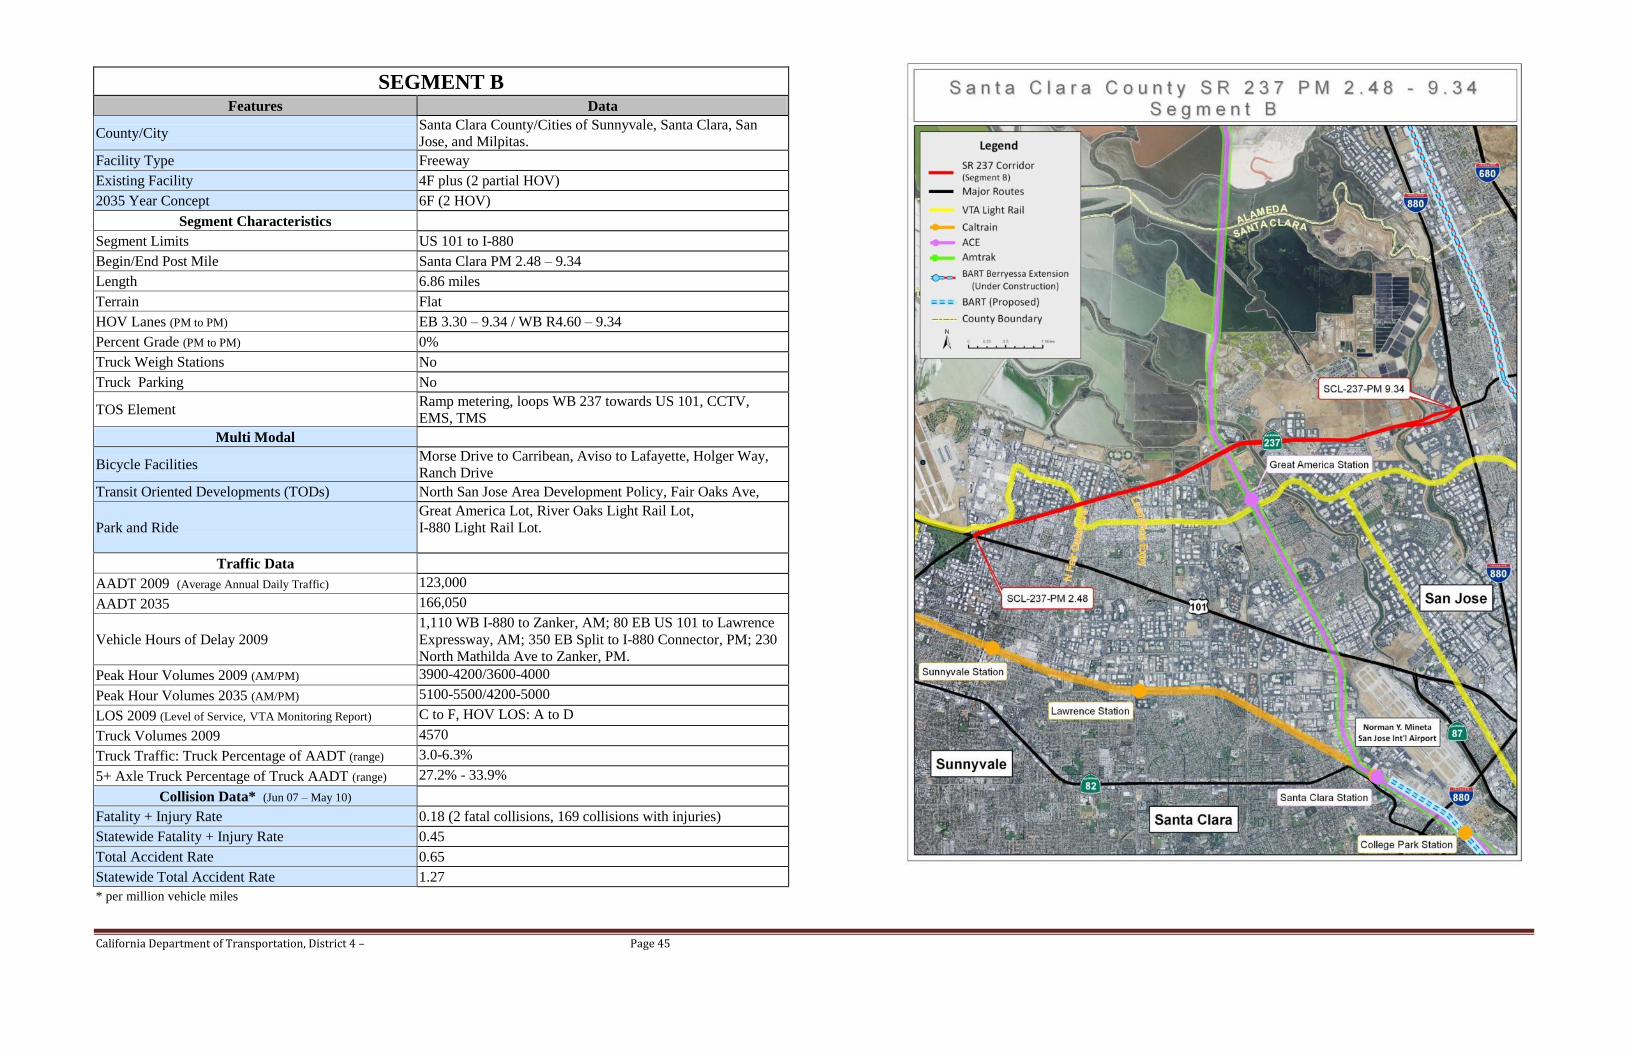
California Department of Transportation, District 4 – Page 45
SEGMENT B Features Data
County/City Santa Clara County/Cities of Sunnyvale, Santa Clara, San
Jose, and Milpitas.
Facility Type Freeway
Existing Facility 4F plus (2 partial HOV)
2035 Year Concept 6F (2 HOV)
Segment Characteristics
Segment Limits US 101 to I-880
Begin/End Post Mile Santa Clara PM 2.48 – 9.34
Length 6.86 miles
Terrain Flat
HOV Lanes (PM to PM) EB 3.30 – 9.34 / WB R4.60 – 9.34
Percent Grade (PM to PM) 0%
Truck Weigh Stations No
Truck Parking No
TOS Element Ramp metering, loops WB 237 towards US 101, CCTV,
EMS, TMS
Multi Modal
Bicycle Facilities Morse Drive to Carribean, Aviso to Lafayette, Holger Way,
Ranch Drive
Transit Oriented Developments (TODs) North San Jose Area Development Policy, Fair Oaks Ave,
Park and Ride
Great America Lot, River Oaks Light Rail Lot,
I-880 Light Rail Lot.
Traffic Data
AADT 2009 (Average Annual Daily Traffic) 123,000
AADT 2035 166,050
Vehicle Hours of Delay 2009
1,110 WB I-880 to Zanker, AM; 80 EB US 101 to Lawrence
Expressway, AM; 350 EB Split to I-880 Connector, PM; 230
North Mathilda Ave to Zanker, PM.
Peak Hour Volumes 2009 (AM/PM) 3900-4200/3600-4000
Peak Hour Volumes 2035 (AM/PM) 5100-5500/4200-5000
LOS 2009 (Level of Service, VTA Monitoring Report) C to F, HOV LOS: A to D
Truck Volumes 2009 4570
Truck Traffic: Truck Percentage of AADT (range) 3.0-6.3%
5+ Axle Truck Percentage of Truck AADT (range) 27.2% - 33.9%
Collision Data* (Jun 07 – May 10)
Fatality + Injury Rate 0.18 (2 fatal collisions, 169 collisions with injuries)
Statewide Fatality + Injury Rate 0.45
Total Accident Rate 0.65
Statewide Total Accident Rate 1.27
* per million vehicle miles
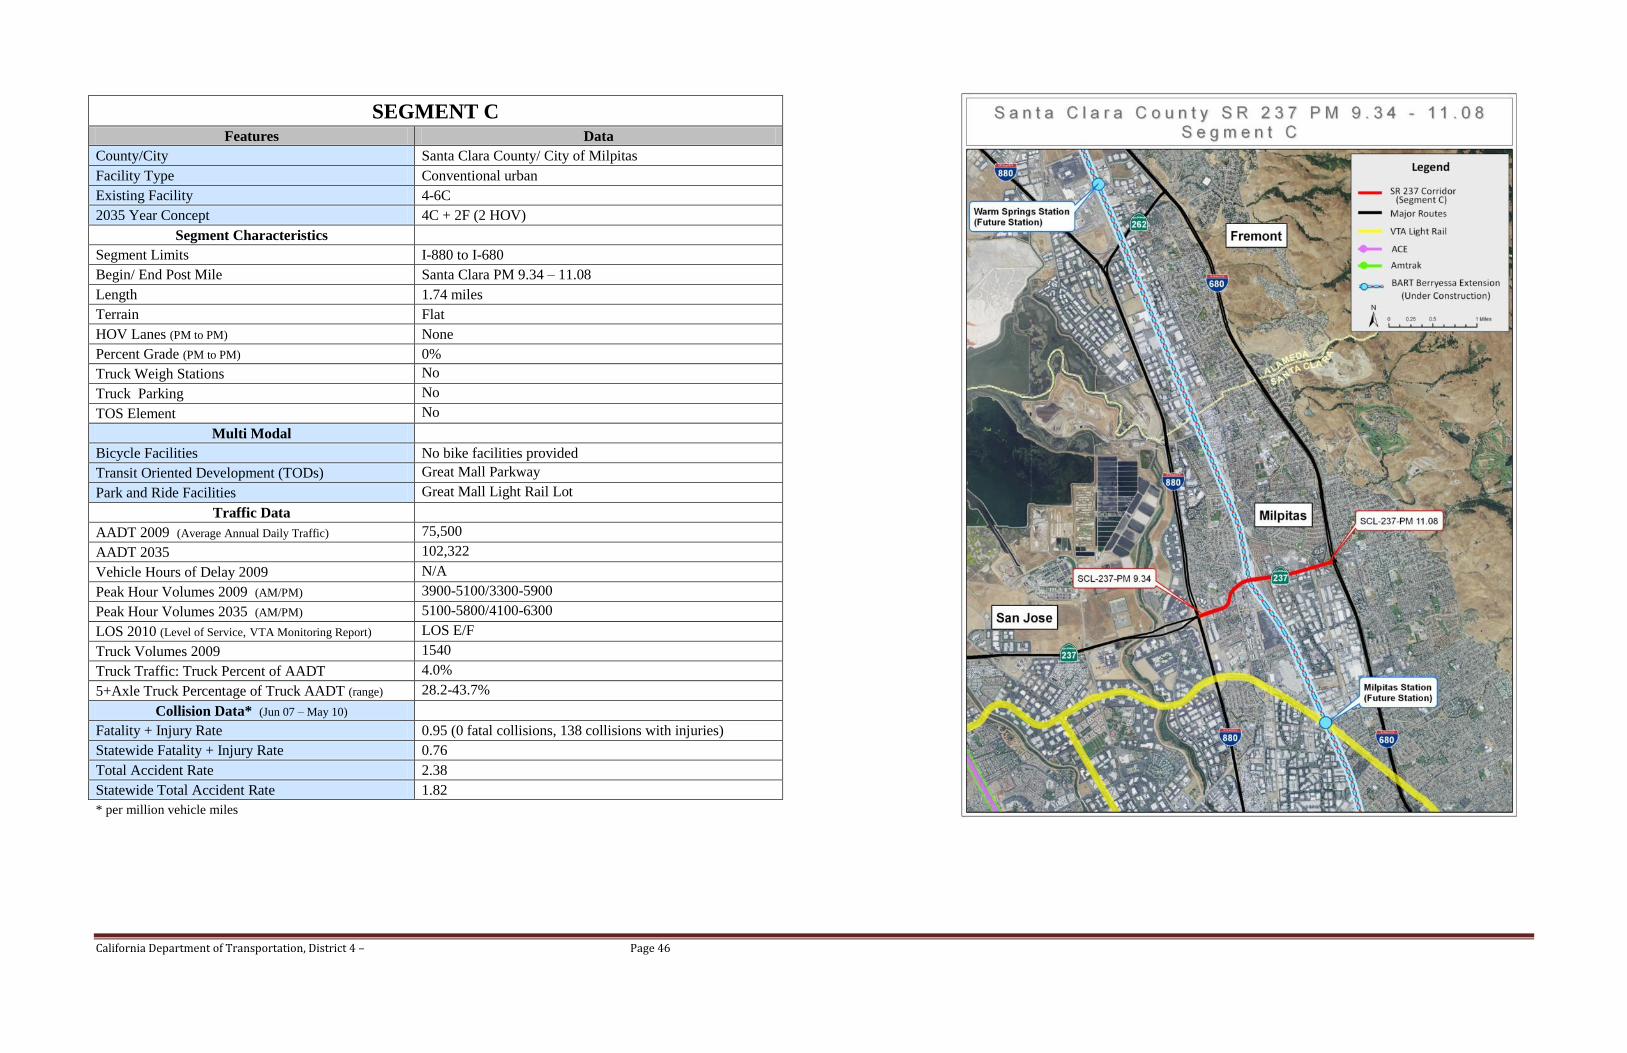
California Department of Transportation, District 4 – Page 46
SEGMENT C Features Data
County/City Santa Clara County/ City of Milpitas
Facility Type Conventional urban
Existing Facility 4-6C
2035 Year Concept 4C + 2F (2 HOV)
Segment Characteristics
Segment Limits I-880 to I-680
Begin/ End Post Mile Santa Clara PM 9.34 – 11.08
Length 1.74 miles
Terrain Flat
HOV Lanes (PM to PM) None
Percent Grade (PM to PM) 0%
Truck Weigh Stations No
Truck Parking No
TOS Element No
Multi Modal
Bicycle Facilities No bike facilities provided
Transit Oriented Development (TODs) Great Mall Parkway
Park and Ride Facilities Great Mall Light Rail Lot
Traffic Data
AADT 2009 (Average Annual Daily Traffic) 75,500
AADT 2035 102,322
Vehicle Hours of Delay 2009 N/A
Peak Hour Volumes 2009 (AM/PM) 3900-5100/3300-5900
Peak Hour Volumes 2035 (AM/PM) 5100-5800/4100-6300
LOS 2010 (Level of Service, VTA Monitoring Report) LOS E/F
Truck Volumes 2009 1540
Truck Traffic: Truck Percent of AADT 4.0%
5+Axle Truck Percentage of Truck AADT (range) 28.2-43.7%
Collision Data* (Jun 07 – May 10)
Fatality + Injury Rate 0.95 (0 fatal collisions, 138 collisions with injuries)
Statewide Fatality + Injury Rate 0.76
Total Accident Rate 2.38
Statewide Total Accident Rate 1.82
* per million vehicle miles
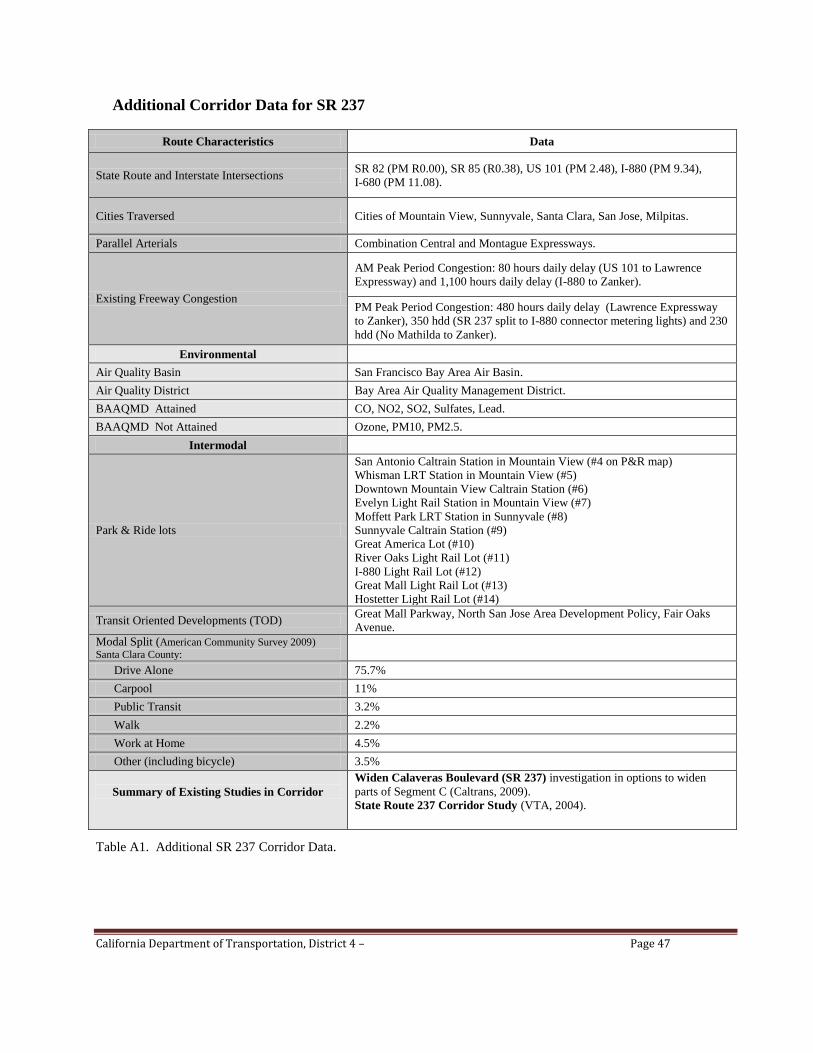
California Department of Transportation, District 4 – Page 47
Additional Corridor Data for SR 237
Route Characteristics Data
State Route and Interstate Intersections SR 82 (PM R0.00), SR 85 (R0.38), US 101 (PM 2.48), I-880 (PM 9.34),
I-680 (PM 11.08).
Cities Traversed Cities of Mountain View, Sunnyvale, Santa Clara, San Jose, Milpitas.
Parallel Arterials Combination Central and Montague Expressways.
Existing Freeway Congestion
AM Peak Period Congestion: 80 hours daily delay (US 101 to Lawrence
Expressway) and 1,100 hours daily delay (I-880 to Zanker).
PM Peak Period Congestion: 480 hours daily delay (Lawrence Expressway
to Zanker), 350 hdd (SR 237 split to I-880 connector metering lights) and 230
hdd (No Mathilda to Zanker).
Environmental
Air Quality Basin San Francisco Bay Area Air Basin.
Air Quality District Bay Area Air Quality Management District.
BAAQMD Attained CO, NO2, SO2, Sulfates, Lead.
BAAQMD Not Attained Ozone, PM10, PM2.5.
Intermodal
Park & Ride lots
San Antonio Caltrain Station in Mountain View (#4 on P&R map)
Whisman LRT Station in Mountain View (#5)
Downtown Mountain View Caltrain Station (#6)
Evelyn Light Rail Station in Mountain View (#7)
Moffett Park LRT Station in Sunnyvale (#8)
Sunnyvale Caltrain Station (#9)
Great America Lot (#10)
River Oaks Light Rail Lot (#11)
I-880 Light Rail Lot (#12)
Great Mall Light Rail Lot (#13)
Hostetter Light Rail Lot (#14)
Transit Oriented Developments (TOD) Great Mall Parkway, North San Jose Area Development Policy, Fair Oaks
Avenue.
Modal Split (American Community Survey 2009)
Santa Clara County:
Drive Alone 75.7%
Carpool 11%
Public Transit 3.2%
Walk 2.2%
Work at Home 4.5%
Other (including bicycle) 3.5%
Summary of Existing Studies in Corridor
Widen Calaveras Boulevard (SR 237) investigation in options to widen
parts of Segment C (Caltrans, 2009).
State Route 237 Corridor Study (VTA, 2004).
Table A1. Additional SR 237 Corridor Data.
California Department of Transportation, District 4 – Page 48
Appendix B
Pertinent Federal, State, and Regional Transportation Plans,
Programs, and Directives
Federal
Moving Ahead for Progress in the 21th Century Act (MAP-21)
This federal law authorizes transportation funding for the fiscal years 2013 and 2014. By transforming
the policy and programmatic framework for investments to guide the system‘s growth and development,
MAP-21 creates a streamlined and performance-based surface transportation program and builds on
many of the highway, transit, bike, and pedestrian programs and policies previously established.
Federal Transportation Improvement Program (FTIP)
All federally funded projects, and regionally significant projects (regardless of funding), must be listed
in the FTIP per federal law. A project is not eligible to be programmed in the FTIP until it is programmed
in the State Transportation Improvement Program (STIP) or in the State Highway Operations and
Protection Program (SHOPP). Other types of funding (Federal Demonstration, Congestion Mitigation
and Air Quality (CMAQ), Transportation Enhancement Activities (TEA), and Surface Transportation
Program (STP) must be officially approved before the projects can be included in the FTIP.
State
California Transportation Plan, April 2006
The ―CTP 2030‖ is a statewide, long-range transportation policy plan that provides for the movement
of people, goods, services, and information. The CTP offers a blueprint to guide future transportation
decisions and investments that will ensure California's ability to compete globally, provide safe and
effective mobility for all persons, better link transportation and land use decisions, improve air quality,
and reduce petroleum energy consumption.
Interregional Transportation Strategic Plan (ITSP)
Caltrans prepared the 1998 ITSP to consolidate and communicate key elements of its ongoing long- and
short-range planning. It serves as a counterpart to the Regional Transportation Plans prepared by the 43
Regional Transportation Planning Agencies in California. Caltrans addresses the State Highway system
in detail, with special emphasis on the statutorily-identified Interregional Road System (IRRS). The IRRS
serves interregional movement of people and goods. There are currently 87 IRRS routes.
State Transportation Improvement Program (STIP)
The STIP is a listing of all capital improvement projects that are expected to receive an allocation of state
transportation funds. The California Transportation Commission (CTC) biennially adopts and submits the
STIP to the Legislature and Governor. The STIP is a resource management document to assist state and
local entities to plan and implement transportation improvements and to utilize available resources in
a cost-effective manner.
Regional Transportation Improvement Program (RTIP)
The Regional Transportation Improvement Program is a sub-element of the State Transportation
Improvement Program (STIP). The Metropolitan Transportation Commission is responsible for
developing regional project priorities for the RTIP for the nine counties of the Bay Area. The biennial
RTIP is then submitted to the California Transportation Commission for inclusion in the STIP.
California Department of Transportation, District 4 – Page 49
Interregional Transportation Improvement Program (ITIP)
The ITIP is a sub-element of the State Transportation Improvement Program. The statutes of 1997,
Chapter 622-Senate Bill (SB) 45- established the Interregional Improvement Program (IIP) which
includes projects to improve State highways, intercity passenger rail system, and projects to improve
interregional movement of people and goods.
State Highway Operation and Protection Program (SHOPP) Caltrans prepares the SHOPP for the expenditure of transportation funds for major capital improvements
necessary to preserve and protect the State Highway System. The SHOPP is a four-year funding program.
SHOPP projects include capital improvements for maintenance, safety, and rehabilitation of State
highways and bridges.
Senate Bill 45
SB45 establishes guidelines for the California Transportation Commission to administer the allocation of
funds appropriated from the Public Transportation Account for capital transportation projects designed to
improve transportation facilities.
California Strategic Growth Plan, January 2007
The Governor and Legislature have initiated the first phase of a comprehensive Strategic Growth Plan to
address California‘s critical infrastructure needs over the next 20 years. California faces over $500 billion
in infrastructure needs to meet the demands of a population expected to increase by 23 percent over the
next two decades. In November 2006, the voters approved the first installment of that 20-year vision to
rebuild California by authorizing a series of general obligation bonds totaling $42.7 billion.
Transportation System Development Plan (TSDP), December 2011
The TSDP is a listing of Caltrans recommended capacity- increasing improvements on State Highways.
The purpose of the TSDP is to identify a comprehensive, reasonable and effective range of transportation
improvements in modal categories to improve interregional and regional mobility and intermodal transfer
of people and goods on State Highways and major travel corridors.
Goods Movement Action Plan (GMAP), January 2007
The Goods Movement Action Plan is a key component of California’s Strategic Growth Plan and will
guide allocation of $3.1 billion of the $19.9 billion approved by voters in the Highway Safety, Traffic
Reduction, Air Quality and Port Security Bond Act of 2006 (Proposition 1B). The GMAP identifies
projects for consideration in the California Transportation Commission‘s allocation of $2 billion for
infrastructure investment. The Air Resources Board will allocate the remaining $1 billion for emission
reduction projects related to Goods Movement.
California State Rail Plan, October 2007
California’s Vision for Intercity Passenger Rail: Transportation in California is guided by the
Governor‘s Strategic Growth Plan, The Global Warming Solutions Act, Assembly Bill (AB)32, the
California Transportation Plan (2025), and the Department of Transportation‘s Mission/Vision and
Strategic Goals. Caltrans prepares a ten-year Rail Plan that includes both passenger and freight rail
elements. The Rail Plan is updated every two years.
Caltrans Deputy Directive 64
Caltrans fully considers the needs of non-motorized travelers including pedestrians, bicyclists and
persons with disabilities in all programming, planning, maintenance, construction, operations, and
project development activities and products.

California Department of Transportation, District 4 – Page 50
State Assembly Bill 32 (AB 32) - Global Warming Solutions Act, September 2006
This bill requires the State‘s greenhouse gas emissions to be reduced to 1990 levels by the year 2020.
Caltrans‘ strategy to reduce global warming emissions has two elements. The first is to make
transportation systems more efficient through operational improvements. The second is to integrate
emission reduction measures into the planning, development, operations and maintenance of
transportation elements.
State Assembly Bill 375 (AB 375)
SB 375 (Steinberg) was passed by the California State Assembly on August 25th, 2008, and by the State
Senate on August 30th. The Governor signed it into law on September 30th, 2008. The bill mandates an
integrated regional land-use-and transportation-planning approach to reducing greenhouse-gas (GHG)
emissions from automobiles and light trucks, principally by reducing vehicle miles traveled (VMT).
Within the Bay Area, automobiles and light trucks account for about 26 percent of our 2007 GHG
inventory2 and about 64 percent of emissions from the transportation sector. SB 375 explicitly assigns
responsibilities to the Association of Bay Area Governments (ABAG) and to the Metropolitan
Transportation Commission (MTC) to implement the bill‘s provisions for the Bay Area. Both agencies
are members of the Joint Policy Committee (JPC). The polices in this document were approved by
the JPC and provide guidance to the two lead regional agencies in fulfilling their responsibilities in
collaboration with their JPC partners, the Bay Area Air Quality Management District (Air District)
and the San Francisco Bay Conservation and Development Commission (BCDC).
Our Changing Climate 2012
Greenhouse gas (GHG) emissions and the related subject of global climate change have emerged as
critical issues for the transportation community. With ―Our Changing Climate 2012‖ the California
Department of Transportation (Caltrans) not only recognizes the significance of cleaner, more energy
efficient transportation, but the vulnerability and the need for adaptation to the risks of climate change
as well. The Caltrans program highlights reducing congestion and improving efficiency of transportation
systems through smart land use, operational improvements, and Intelligent Transportation Systems
(objectives of the State‘s Strategic Growth Plan). The action plan on climate change also includes
institutionalizing energy efficiency and GHG emission reduction measures and technology into planning,
project development, operations, and maintenance of transportation facilities, fleets, buildings, and
equipment.
Region
Regional Transportation Plan (RTP)
The Metropolitan Transportation Commission is responsible for adopting the RTP for the nine-county
San Francisco Bay Area. The RTP defines a 25 year vision for the region‘s transportation network.
The RTP is updated every four years. The most recently approved RTP is the T2035 Plan approved in
2009. Work is in progress developing the 2013 RTP called Plan Bay Area (which will include the
SB-375 required Sustainable Community Strategy).
County
VTP 2040
The Valley Transportation Plan 2040 (VTP 2040) is the countywide long-range transportation plan
for Santa Clara County. As the Congestion Management Agency (CMA) for the county, the Santa Clara
Valley Transportation Authority (VTA) periodically updates this 25-year plan.

California Department of Transportation, District 4 – Page 51
VTP 2040 provides a planning and policy framework for developing and delivering future transportation
projects. Location-specific improvements for all modes of travel are covered in six program areas:
Highways, Local Streets and Roads, Expressways, Transit, Transportation Systems and
Management/Intelligent Transportation Systems, and Bicycles.
Countywide Plans
Santa Clara Countywide Bicycle Plan
In August 2008, VTA adopted the Santa Clara Countywide Bicycle Plan. The plan guides the
development of major bicycling facilities by identifying Cross County Bicycle Corridors and other
projects of countywide or intercity significance.
Comprehensive County Expressway Planning Study
Adopted in 2003, the Comprehensive County Expressway Planning Study provides a long-term plan
for the improvement and maintenance of the County Expressway System. The study includes capacity
and operational improvements, signal operations, high-occupancy vehicle (HOV) lanes, bicycle and
pedestrian improvements, and finishing elements such as landscaping and sound walls. Also included
are a summary of ongoing operating and maintenance needs and funding strategy recommendations.
The 2008 update addresses some further key issues, including the development of an expenditure plan
for the highest priority expressway capacity and operational improvements, and a plan for more
completely accommodating pedestrians on all expressways.
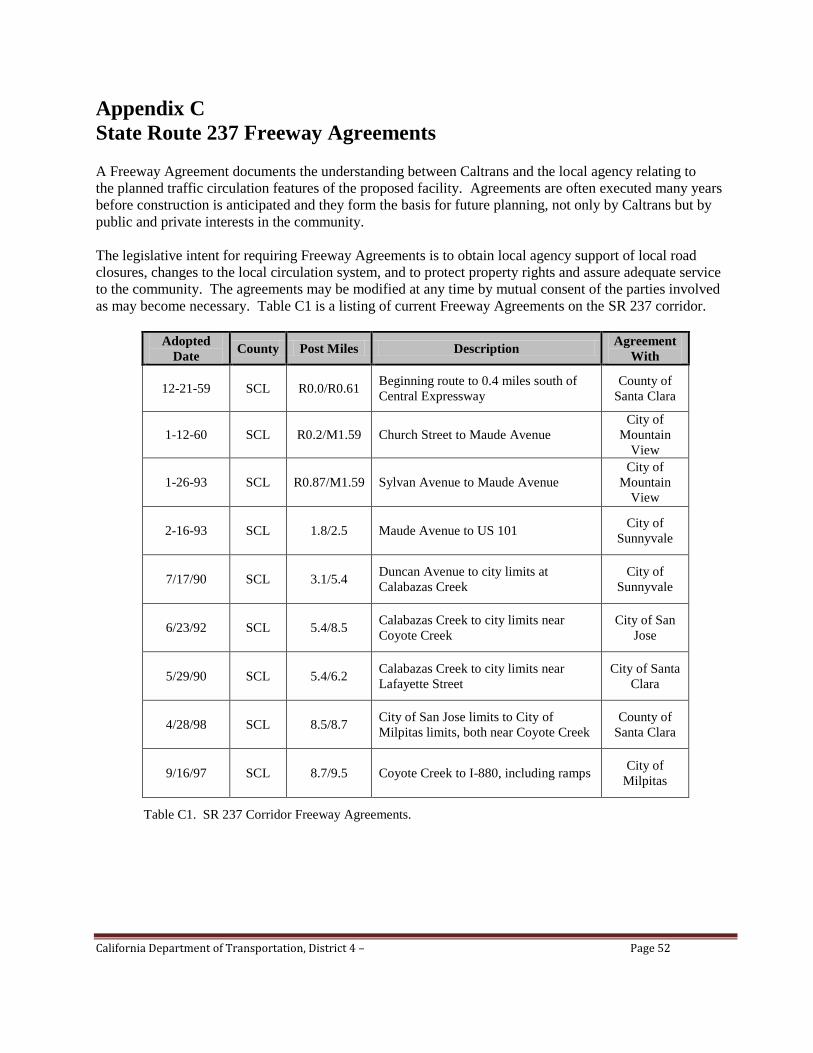
California Department of Transportation, District 4 – Page 52
Appendix C
State Route 237 Freeway Agreements A Freeway Agreement documents the understanding between Caltrans and the local agency relating to
the planned traffic circulation features of the proposed facility. Agreements are often executed many years
before construction is anticipated and they form the basis for future planning, not only by Caltrans but by
public and private interests in the community.
The legislative intent for requiring Freeway Agreements is to obtain local agency support of local road
closures, changes to the local circulation system, and to protect property rights and assure adequate service
to the community. The agreements may be modified at any time by mutual consent of the parties involved
as may become necessary. Table C1 is a listing of current Freeway Agreements on the SR 237 corridor.
Adopted
Date County Post Miles Description
Agreement
With
12-21-59 SCL R0.0/R0.61 Beginning route to 0.4 miles south of
Central Expressway
County of
Santa Clara
1-12-60 SCL R0.2/M1.59 Church Street to Maude Avenue
City of
Mountain
View
1-26-93 SCL R0.87/M1.59 Sylvan Avenue to Maude Avenue
City of
Mountain
View
2-16-93 SCL 1.8/2.5 Maude Avenue to US 101 City of
Sunnyvale
7/17/90 SCL 3.1/5.4 Duncan Avenue to city limits at
Calabazas Creek
City of
Sunnyvale
6/23/92 SCL 5.4/8.5 Calabazas Creek to city limits near
Coyote Creek
City of San
Jose
5/29/90 SCL 5.4/6.2 Calabazas Creek to city limits near
Lafayette Street
City of Santa
Clara
4/28/98 SCL 8.5/8.7 City of San Jose limits to City of
Milpitas limits, both near Coyote Creek
County of
Santa Clara
9/16/97 SCL 8.7/9.5 Coyote Creek to I-880, including ramps City of
Milpitas
Table C1. SR 237 Corridor Freeway Agreements.
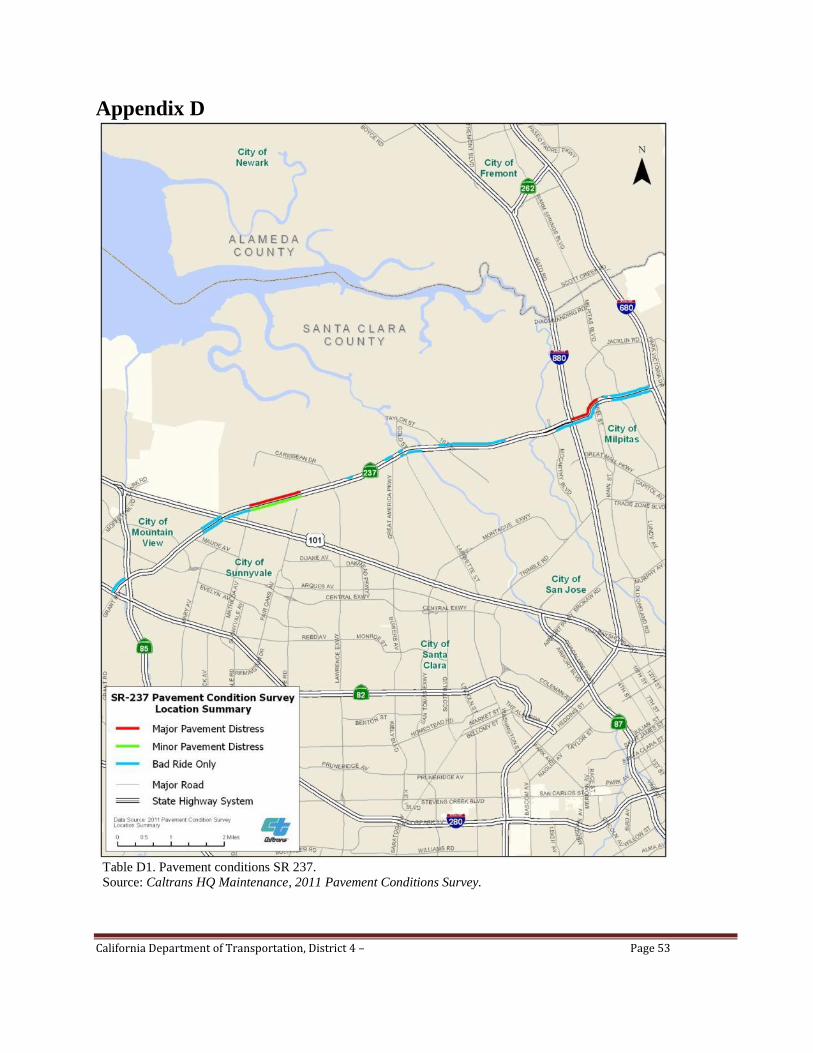
California Department of Transportation, District 4 – Page 53
Appendix D
Table D1. Pavement conditions SR 237.
Source: Caltrans HQ Maintenance, 2011 Pavement Conditions Survey.
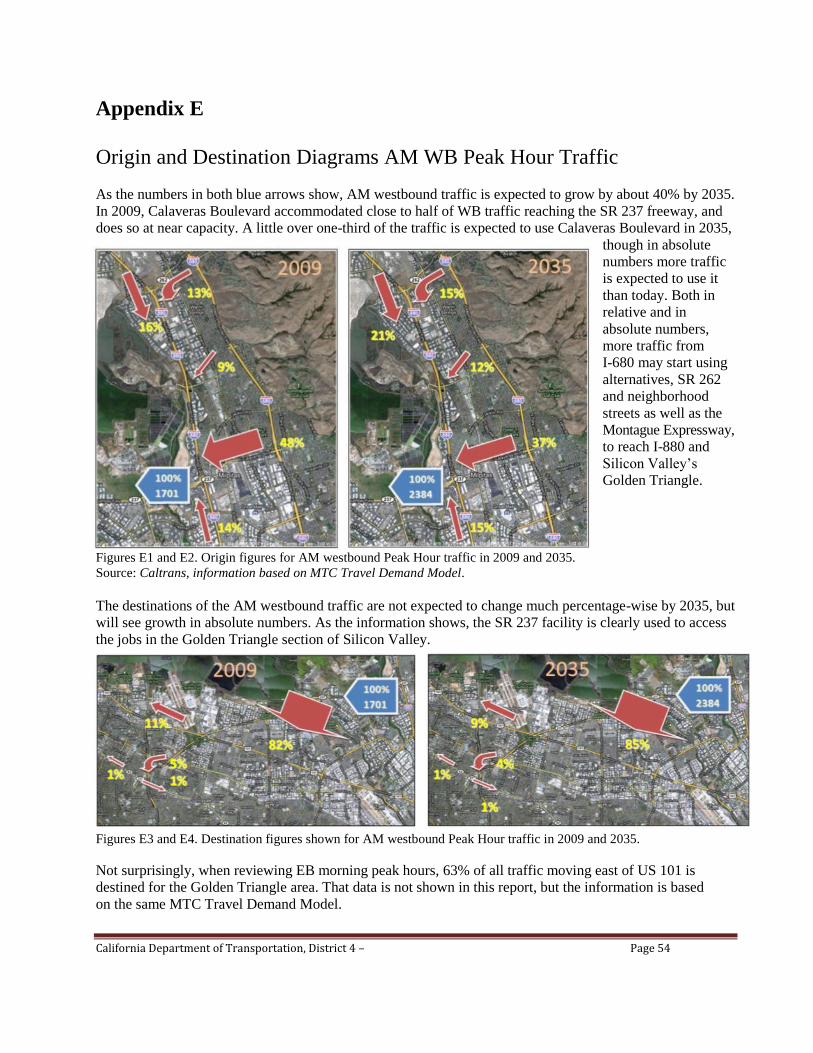
California Department of Transportation, District 4 – Page 54
Appendix E
Origin and Destination Diagrams AM WB Peak Hour Traffic
As the numbers in both blue arrows show, AM westbound traffic is expected to grow by about 40% by 2035.
In 2009, Calaveras Boulevard accommodated close to half of WB traffic reaching the SR 237 freeway, and
does so at near capacity. A little over one-third of the traffic is expected to use Calaveras Boulevard in 2035,
though in absolute
numbers more traffic
is expected to use it
than today. Both in
relative and in
absolute numbers,
more traffic from
I-680 may start using
alternatives, SR 262
and neighborhood
streets as well as the
Montague Expressway,
to reach I-880 and
Silicon Valley‘s
Golden Triangle.
Figures E1 and E2. Origin figures for AM westbound Peak Hour traffic in 2009 and 2035.
Source: Caltrans, information based on MTC Travel Demand Model.
The destinations of the AM westbound traffic are not expected to change much percentage-wise by 2035, but
will see growth in absolute numbers. As the information shows, the SR 237 facility is clearly used to access
the jobs in the Golden Triangle section of Silicon Valley.
Figures E3 and E4. Destination figures shown for AM westbound Peak Hour traffic in 2009 and 2035.
Not surprisingly, when reviewing EB morning peak hours, 63% of all traffic moving east of US 101 is
destined for the Golden Triangle area. That data is not shown in this report, but the information is based
on the same MTC Travel Demand Model.
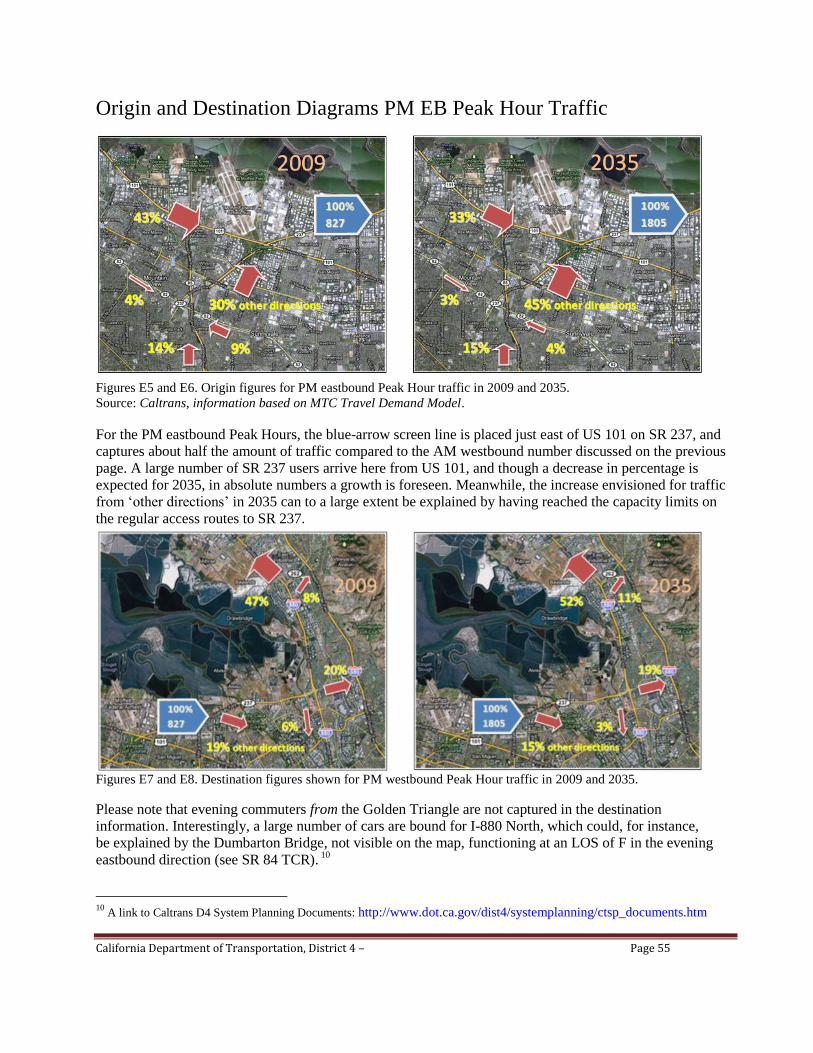
California Department of Transportation, District 4 – Page 55
Origin and Destination Diagrams PM EB Peak Hour Traffic
Figures E5 and E6. Origin figures for PM eastbound Peak Hour traffic in 2009 and 2035.
Source: Caltrans, information based on MTC Travel Demand Model.
For the PM eastbound Peak Hours, the blue-arrow screen line is placed just east of US 101 on SR 237, and
captures about half the amount of traffic compared to the AM westbound number discussed on the previous
page. A large number of SR 237 users arrive here from US 101, and though a decrease in percentage is
expected for 2035, in absolute numbers a growth is foreseen. Meanwhile, the increase envisioned for traffic
from ‗other directions‘ in 2035 can to a large extent be explained by having reached the capacity limits on
the regular access routes to SR 237.
Figures E7 and E8. Destination figures shown for PM westbound Peak Hour traffic in 2009 and 2035.
Please note that evening commuters from the Golden Triangle are not captured in the destination
information. Interestingly, a large number of cars are bound for I-880 North, which could, for instance,
be explained by the Dumbarton Bridge, not visible on the map, functioning at an LOS of F in the evening
eastbound direction (see SR 84 TCR). 10
10
A link to Caltrans D4 System Planning Documents: http://www.dot.ca.gov/dist4/systemplanning/ctsp_documents.htm