TCEQ 2010 Flare Study Final Report Main August 2011 · TCEQ 2010 Flare Study Final Report Prepared...
134
Texas Commission on Environmental Quality PGA No. 582-8-862-45-FY09-04 Tracking No. 2008-81 with Supplemental Support from the Air Quality Research Program TCEQ Grant No. 582-10-94300 TCEQ 2010 Flare Study Final Report Prepared by David T. Allen, Ph.D. Principal Investigator Vincent M. Torres Project Manager The University of Texas at Austin The Center for Energy and Environmental Resources August 1, 2011
Transcript of TCEQ 2010 Flare Study Final Report Main August 2011 · TCEQ 2010 Flare Study Final Report Prepared...

Texas Commission on Environmental Quality
PGA No. 582-8-862-45-FY09-04 Tracking No. 2008-81
with Supplemental Support from the Air Quality Research Program TCEQ Grant No. 582-10-94300
TCEQ 2010 Flare Study Final Report
Prepared by
David T. Allen, Ph.D. Principal Investigator
Vincent M. Torres Project Manager
The University of Texas at Austin The Center for Energy and Environmental Resources
August 1, 2011

TCEQ 2010 Flare Study The University of Texas at Austin 2 August 1, 2011 The Center for Energy & Environmental Resources
Executive Summary
In May 2009, the TCEQ contracted with The University of Texas at Austin (UT Austin) to conduct the Comprehensive Flare Study project (PGA No. 582-8-86245-fy09-04, Tracking Number 2008-81) (TCEQ, 2009). In August 2010, the project was provided supplemental funding by the Air Quality Research Program (TCEQ Grant No. 582-10-94300). The purpose of this project was to conduct field tests to measure flare emissions and collect process and operational data in a semi-controlled environment to determine the relationship between flare design, operation, vent gas lower heating value (LHV) and flow rate, destruction and removal efficiency (DRE), and combustion efficiency (CE). The TCEQ’s primary objectives for this study in order of decreasing priority were: • Assess the potential impact of vent gas flow rate turndown on flare CE and VOC DRE; • Assess the potential impact of steam/air assist on flare CE and Volatile Organic Compound
(VOC) DRE at various operating conditions, including low vent gas flow rates; • Determine whether flares operating over the range of requirements stated in 40 Code of
Federal Regulations (CFR) § 60.18 achieve the assumed hydrocarbon DRE of 98 percent at varying vent gas flow rate turndown, assist ratios and vent gas heat content; and
• Identify and quantify the hydrocarbon species in flare plumes visualized with passive infrared cameras.
In this report, the term vent gas will be used to represent the waste gas stream that would be sent to the flare for destruction in an industrial facility. The terms flare plume and plume will always refer to the total stream of gases that leave the flare and change composition due to some level of combustion. This final report is submitted to fulfill the requirements of PGA No. 582-8-86245-fy09-04, Tracking Number 2008-81, Task 10 and Task Order No. UTA10-000924-LOAT-RP9, Task 1 and presents the results for this project and the data collected to address the Study Objectives. Project Scope and Design Extensive research has been conducted in controlled environments on devices that are not full-scale flares, i.e., with diameters less than three inches as opposed to industrial scale flares, which are typically on the order of multiple feet in diameter and can be as large as ten feet in diameter. To make the results of this study most directly applicable to industrial scale operations, the field tests performed for this study were conducted on full-scale industrial design flares. Specifically, the flare designs selected were the John Zink Models EE-QSC-36” Flare Tip (36-inch diameter) with (3) EEP-503 pilots (steam assist) and the LHTS-24/60 Flare Tip (24-inch diameter) with (3) Pilots (air assist), with maximum capacities of 937,000 lb/hr and 144,000 lb/hr, respectively. These sizes and design configurations were selected as they represent a large number of flare models currently in the field and the results will be applicable to these and similar flare designs when operated under similar conditions to those used in this study.
TCEQ 2010 Flare Study The University of Texas at Austin 3 August 1, 2011 The Center for Energy & Environmental Resources
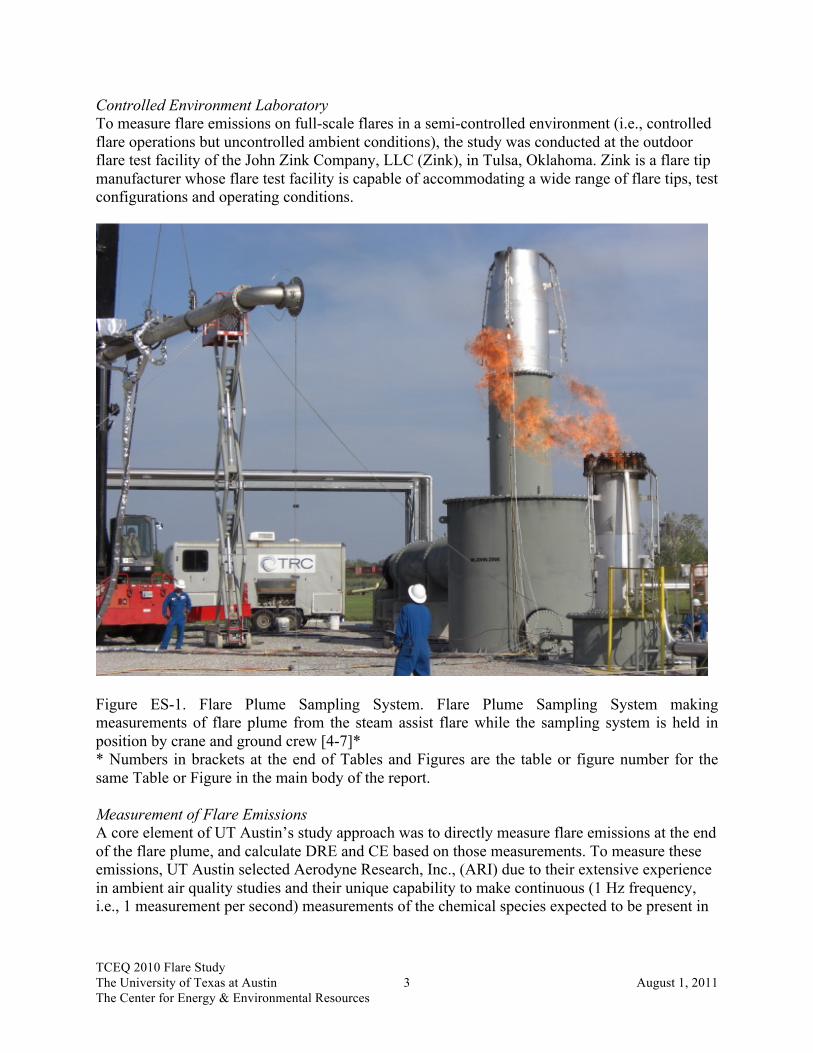
Controlled Environment Laboratory To measure flare emissions on full-scale flares in a semi-controlled environment (i.e., controlled flare operations but uncontrolled ambient conditions), the study was conducted at the outdoor flare test facility of the John Zink Company, LLC (Zink), in Tulsa, Oklahoma. Zink is a flare tip manufacturer whose flare test facility is capable of accommodating a wide range of flare tips, test configurations and operating conditions.
Figure ES-1. Flare Plume Sampling System. Flare Plume Sampling System making measurements of flare plume from the steam assist flare while the sampling system is held in position by crane and ground crew [4-7]* * Numbers in brackets at the end of Tables and Figures are the table or figure number for the same Table or Figure in the main body of the report. Measurement of Flare Emissions A core element of UT Austin’s study approach was to directly measure flare emissions at the end of the flare plume, and calculate DRE and CE based on those measurements. To measure these emissions, UT Austin selected Aerodyne Research, Inc., (ARI) due to their extensive experience in ambient air quality studies and their unique capability to make continuous (1 Hz frequency, i.e., 1 measurement per second) measurements of the chemical species expected to be present in
TCEQ 2010 Flare Study The University of Texas at Austin 4 August 1, 2011 The Center for Energy & Environmental Resources
the flare plume. These direct measurements of the flare emissions serve as the primary data used to address the study objectives. The measurement of the actual flare emissions was important to the TCEQ as the estimation method for calculating emission rates from flares prescribed by the TCEQ (Air Permit Division’s Technical Guidance for Flares and Vapor Oxidizers, RG-109 Dated October 2000 and 2010 Emissions Inventory Guidelines, Technical Supplement 4: Flares, Revised January 2008), assumes a constant DRE for propylene of 99% for a flare operated in compliance with the flow and thermal requirements of 40 CFR § 60.18. Compare Remote Sensing Technologies Remote sensing technologies were also included in the study and a comparison of their performance is included in the study results. The following remote sensing measurement methods were included: 1. Infrared Hyper-Spectral Imaging Technology (Contractor: Telops Inc.)
Identify flare hydrocarbon plume species and determine plume species concentrations. 2. Passive and Active Fourier Transform Infrared (PFTIR, AFTIR) Spectroscopy (Contractor:
Industrial Monitor and Control Corporation) Collect the required data to determine flare combustion efficiency.
3. FLIR GasFindIR Passive Infrared (IR) Cameras (Contractor: Leak Surveys Inc.) Provide a visual comparison of IR images to the infrared hyper-spectral imaging technology results, and assist other remote sensing tools to take measurements.
A single blind approach was used to compare the remote sensing technology measurements, i.e., the only information provided to the contractors performing remote sensing measurements was that which would be provided to them if they were engaged to measure combustion efficiencies at an industrial facility. The results of the CE and DRE measurements made by ARI were not made available to the remote sensing teams until this report was released to the public. Performance and Comparison Metrics VOC DRE was selected as the primary metric for assessing flare performance because of the critical role VOCs play in contributing to the formation of ozone. CE was selected as a secondary metric because the remote sensing technologies included in the study can only measure CE. DRE (hydrocarbon species X) is the mass percentage of species X that is destroyed relative to the quantity of species X entering the flare. Numerically, this is represented as
!"# % = 1− !!"#$%!!"
× 100 Eq. ES.1
where DRE (%) = destruction and removal efficiency (%) Xplume = mass flow rate of species X found in the flare plume after combustion has
ceased Xin = mass flow rate of species X in the vent gas entering the flare
TCEQ 2010 Flare Study The University of Texas at Austin 5 August 1, 2011 The Center for Energy & Environmental Resources
CE is the percentage of the total hydrocarbon stream entering the flare that burns completely to form only carbon dioxide and water. Numerically, this is represented as
!" % = !"! (!"#$%)
!"! (!"#$%)+ !" !"#$% + ℎ!"#$%&#'$() (!"#$%) × 100 Eq. ES.2
where CE (%) = combustion efficiency (%) CO2 (plume) = volume concentration of carbon dioxide in the plume (ppmv) after
combustion has ceased CO (plume) = volume concentration of carbon monoxide in the plume (ppmv) after
combustion has ceased Σ hydrocarbons (plume) = volume concentration of all the unburned hydrocarbons in the plume
after combustion has ceased multiplied by the number of carbons in the hydrocarbon (ppmCv)
Vent Gas Composition and Flow Rates For this study, the vent gas composition was a mixture of natural gas, propylene and nitrogen. The ratio of natural gas to propylene was 1:4 by volume. Nitrogen was used as the diluent to achieve the desired lower heating value (LHV) for the vent gas. This study focused on vent gases with low LHV (350 Btu/scf and 600 Btu/scf) and low flow rates because this range of LHV is close to the minimum (300 Btu/scf) LHV allowed for a vent gas in an assisted flare that complies with 40 CFR § 60.18. The range of vent gas flow rates was 0.1% to 0.65% of the flare’s design capacity. These vent gas flow rates were selected as they are in the range of operation for typical flow rates (less than 0.5%) used in industry. In the case of a steam-assisted flare, these flow rates introduce the greatest probability for over-assisted steam operation because of minimum levels of steam assist recommended to industry by flare manufacturers (email message from R. Nettles, TCEQ, to V. Torres, UT Austin, on September 8, 2010), 500 lb/hr center, 750 lb/hr upper, for the 36-inch diameter steam assisted flare used in this study to prevent thermal shock and condensation in the piping. Quality Assurance UT Austin prepared a Category 2 Quality Assurance Project Plan (The University of Texas at Austin, 2010) for this project that complied with the requirements of the Environmental Protection Agency’s (EPA) Requirements for Quality Assurance Project Plans, EPA QA/R-5, and Guidance for Quality Assurance Project Plans, EPA QA/G-5. This QAPP was posted for public comment by the TCEQ and was reviewed by the EPA.

TCEQ 2010 Flare Study The University of Texas at Austin 6 August 1, 2011 The Center for Energy & Environmental Resources
Test Plan A summary of the test series is shown in Table 1, where steam flare tests begin with the letter “S” in the designation of the test series and air flare tests begin with the letter “A”. The test plan consisted of multiple flare test series conducted on the air-assisted flare tip and multiple test series conducted on the steam-assisted flare tip. The designation used to identify each test point and run was: S[number 1].[number 2]R[number 3], where the number 1 is the test series number and number 2 designates the level of assist (air or steam) used in the test series. Number 3 is the run or repetition number for the test point. So, for example, S3.2R2 is steam flare test series number 3, the second set of assist conditions, repetition number 2. The Test Plan was designed to systematically vary only one flare operational parameter at a time while holding all other parameters constant during a test. To focus on low LHV vent gas streams and still comply with 40 CFR § 60.18, a LHV of 350 Btu/scf ± 50 Btu/scf was selected as the lowest target LHV for the vent gases used in the Test Plan. To obtain additional data on the effect of LHV on DRE and CE, a second LHV of 600 Btu/scf ± 80 Btu/scf was also included in the Test Plan. The steam flare burner used for this study had a design capacity of 937,000 lb/hr for use with propylene. Therefore the 0.1% and 0.25% of design capacity vent gas flow rates for this flare are 937 lb/hr and 2,342 lb/hr, respectively. The air flare burner used for this study had a design capacity of 144,000 lb/hr for use with propylene. The 0.1% of design capacity vent gas flow rate for this flare was thought to be too low for this air flare model, so values of 0.25% and 0.65% of design capacity were selected for the air flare, which were still in the range of interest of the TCEQ. Therefore vent gas flow rates used for the air flare were 359 lb/hr and 937 lb/hr, respectively. Because of favorable weather conditions and more rapid than anticipated completion of test conditions, a larger number of test points than originally planned were completed. The actual number of test points and replicates that were performed were almost twice the number of steam test points and 27% more air test points than originally planned.

TCEQ 2010 Flare Study The University of Texas at Austin 7 August 1, 2011 The Center for Energy & Environmental Resources
Table ES-1. Summary of Flare Test Plan [3-1]
Steam Flare Tests
Test Series
Vent Gas (Nominal) Target (Nominal) Steam Flow Rate LHV Composition Assist (lb/hr)
lb/hr Btu/scf % Center Upper S1 2342 2149 100% Propylene 500 ISP to <Snuff S2 937 2149 100% Propylene 500 ISP to <Snuff S3 937 350 1:4 TNG to Propylene Ratio Diluted to Target LHV 500 ISP to <Snuff S3 937 350 1:4 TNG to Propylene Ratio Diluted to Target LHV 100 230 S3 937 350 1:4 TNG to Propylene Ratio Diluted to Target LHV 0 230 S3 937 350 1:4 TNG to Propylene Ratio Diluted to Target LHV 0 0 S4 2342 350 1:4 TNG to Propylene Ratio Diluted to Target LHV 500 ISP to <Snuff S4 2342 350 1:4 TNG to Propylene Ratio Diluted to Target LHV 330 110 S4 2342 350 1:4 TNG to Propylene Ratio Diluted to Target LHV 0 330 S5 937 600 1:4 TNG to Propylene Ratio Diluted to Target LHV 500 ISP to <Snuff S6 2342 600 1:4 TNG to Propylene Ratio Diluted to Target LHV 500 ISP to <Snuff S7 2342 - 937 350 1:4 TNG to Propylene Ratio Diluted to Target LHV 500 525 S8 2342 - 937 350 1:4 TNG to Propylene Ratio Diluted to Target LHV 0 500 S9 2342 - 937 350 1:4 TNG to Propylene Ratio Diluted to Target LHV 0 1025
S10 2342 - 937 350 1:4 TNG to Propylene Ratio Diluted to Target LHV 0 825 S11 2342 - 937 350 1:4 TNG to Propylene Ratio Diluted to Target LHV 300 525 S12 2342 - 937 350 1:4 TNG to Propane Ratio Diluted to Target LHV 500 525 S13 2342 - 937 350 1:4 TNG to Propane Ratio Diluted to Target LHV 325 525 S14 2342 - 937 350 1:4 TNG to Propane Ratio Diluted to Target LHV 0 525
TNG = Tulsa Natural Gas Snuff = Visible flame extinguished ISP = Incipient Smoke Point LHV = Lower Heating Value
Air Flare Test Tests
Test Series
Vent Gas (Targets) Target (Nominal) Air
Assist (lb/hr) Flow Rate LHV Composition lb/hr Btu/scf %
A1 937 2149 100 % Propylene ISP to <Snuff A2 359 2149 100 % Propylene ISP to <Snuff A3 937 350 1:4 TNG to Propylene Ratio Diluted to Target LHV ISP to <Snuff A4 937 600 1:4 TNG to Propylene Ratio Diluted to Target LHV ISP to <Snuff A5 359 350 1:4 TNG to Propylene Ratio Diluted to Target LHV ISP to <Snuff A6 359 600 1:4 TNG to Propylene Ratio Diluted to Target LHV ISP to <Snuff A7 359 350 1:4 TNG to Propane Ratio Diluted to Target LHV ISP to <Snuff
TNG = Tulsa Natural Gas Snuff = Visible flame extinguished ISP = Incipient Smoke Point LHV = Lower Heating Value
TCEQ 2010 Flare Study The University of Texas at Austin 8 August 1, 2011 The Center for Energy & Environmental Resources
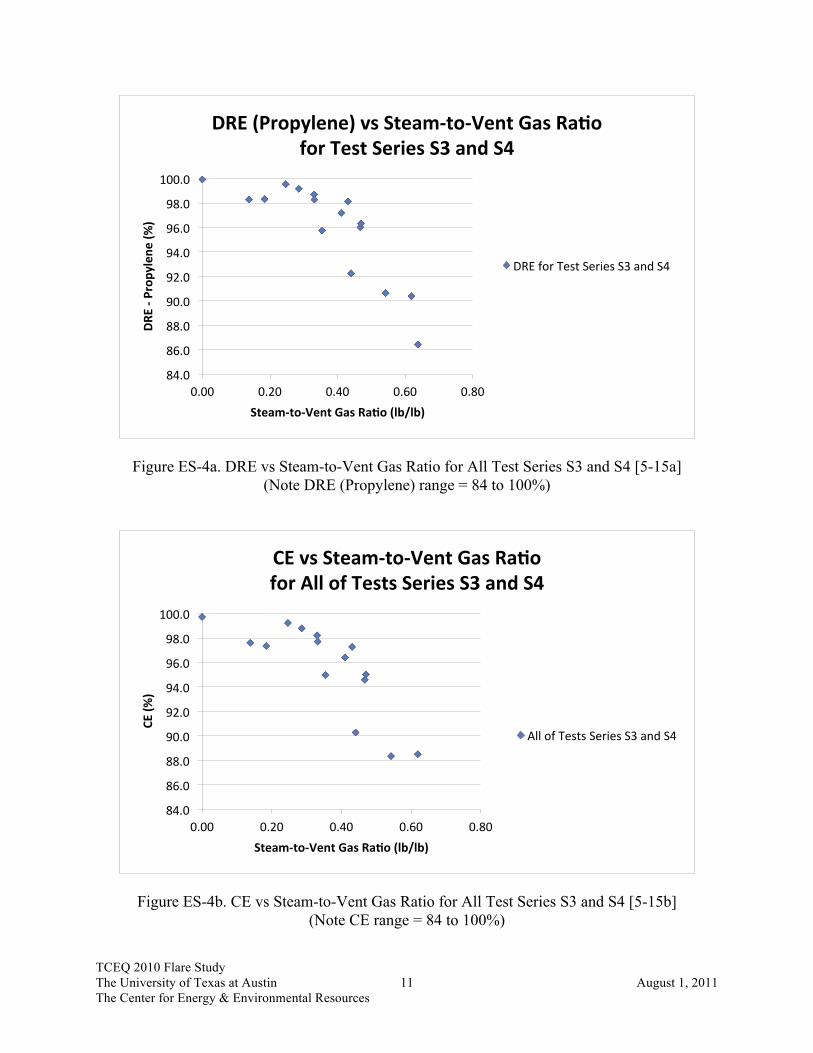
Summary of Flare Tests Results Figures ES-2a and ES-2b show DRE (propylene) versus steam assist rate and CE versus steam assist rate, respectively, for the two nominal steam flare vent gas flow rates, 937 lb/hr and 2,342 lb/hr at a nominal LHV of 350 Btu/scf. At this LHV, the 937 lb/hr vent gas flow rate (Test Series S3) was only able to achieve a DRE (propylene) > 99% at a steam-to-vent gas (S/VG) ratio of 0.25 or less, 230 lb/hr total steam assist rate (center steam = 0 lb/hr). The 2,342 lb/hr vent gas flow rate (Test Series S4) was able to sustain a 99% DRE (propylene) up to a S/VG = 0.29, 670 lb/hr total steam assist (center steam = 560 lb/hr) before the DRE and CE fell below 99% DRE. These levels of steam assist are lower than the minimum levels of steam assist (500 lb/hr center, 750 lb/hr upper) recommended to industry by flare manufacturers as reported to the TCEQ by industry representatives for the 36-inch diameter steam flare model used in this study with center and upper steam assist. Zink recommends a minimum continuous steam flow rate of 300 lb/hr center steam and 525 lb/hr upper steam for this steam flare tip. Figures ES-3a and ES-3b show DRE (propylene) versus S/VG ratio and CE versus S/VG ratio, respectively, for all of tests series S3 and S4 on one graph. Figures ES-4a and ES-4b are the same graphs focusing on the range DRE (propylene) ≥ 84%. It can be seen from Figures ES-4a and ES-4b that in this range of S/VG ratios there can be multiple DREs for a singe S/VG. This is due in part to the fact that, in this range of S/VG ratios, steam added at the center has a different effect on DRE than steam added at the upper nozzles. Center steam adds momentum to the vent gas flow but acts as a diluent, reducing the LHV of the vent gas flow. Adding momentum to the vent gas helps prevent combustion from occurring in the tip. Upper steam entrains air and provides turbulence and oxygen for combustion.

TCEQ 2010 Flare Study The University of Texas at Austin 9 August 1, 2011 The Center for Energy & Environmental Resources
Figure ES-2a. DRE vs Steam Assist for All Test Series S3 and S4 [5-12a]
Figure ES-2b. CE vs Steam Assist for All Test Series S3 and S4 [5-12b]
20
30
40
50
60
70
80
90
100
0 500 1,000 1,500 2,000 2,500
DRE -‐ P
ropylene
(%)
Total Steam Assist (lb/hr)
DRE (Propylene) for All Points Test Series S3 & S4 LHV = 350 Btu/scf, Constant Vent Gas Flow Rate
Vent Gas = 920 lb/hr, Center Steam = 540 lb/hr (S3)
Vent Gas = 2,342 lb/hr, Center Steam = 550 lb/hr (S4) Vent Gas = 920 lb/hr, Center Steam = 50 to 110 lb/hr (S3)
Vent Gas = 2,372 lb/hr, Center Steam = 0 lb/hr (S4)
Vent Gas = 920 lb/hr, Center Steam = 0 lb/hr (S3)
20
30
40
50
60
70
80
90
100
0 500 1,000 1,500 2,000 2,500
CE (%
)
Total Steam Assist (lb/hr)
CE for All Points Test Series S3 & S4 LHV = 350 Btu/scf, Constant Vent Gas Flow Rate
Vent Gas = 920 lbs/hr, Center Steam = 540 lb/hr (S3)
Vent Gas = 2,342 lbs/hr, Center Steam = 550 lb/hr (S4)
Vent Gas = 920 lbs/hr, Center Steam = 50 to 110 lb/hr (S3)
Vent Gas = 2,372 lbs/hr, Center Steam = 0 lb/hr (S4)
Vent Gas = 920 lb/hr, Center Steam = 0 lb/hr (S3)

TCEQ 2010 Flare Study The University of Texas at Austin 10 August 1, 2011 The Center for Energy & Environmental Resources
Figure ES-3a. DRE vs Steam-to-Vent Gas Ratio for All Test Series S3 and S4 [5-14a]
Figure ES-3b. CE vs Steam-to-Vent Gas Ratio for All Test Series S3 and S4 [5-14b]
20
30
40
50
60
70
80
90
100
0.00 0.50 1.00 1.50
DRE -‐ P
ropylene
(%)
Steam-‐to-‐Vent Gas RaNo (lb/lb)
DRE (Propylene) vs Steam-‐to-‐Vent Gas RaNo for Test Series S3 and S4
DRE for Test Series S3 and S4
20
30
40
50
60
70
80
90
100
0.00 0.50 1.00 1.50
CE (%
)
Steam-‐to-‐Vent Gas RaNo (lb/lb)
CE vs Steam-‐to-‐Vent Gas RaNo for Test Series S3 and S4
CE for Test Series S3 and S4
TCEQ 2010 Flare Study The University of Texas at Austin 11 August 1, 2011 The Center for Energy & Environmental Resources
Figure ES-4a. DRE vs Steam-to-Vent Gas Ratio for All Test Series S3 and S4 [5-15a] (Note DRE (Propylene) range = 84 to 100%)
Figure ES-4b. CE vs Steam-to-Vent Gas Ratio for All Test Series S3 and S4 [5-15b] (Note CE range = 84 to 100%)
84.0
86.0
88.0
90.0
92.0
94.0
96.0
98.0
100.0
0.00 0.20 0.40 0.60 0.80
DRE -‐ P
ropylene
(%)
Steam-‐to-‐Vent Gas RaNo (lb/lb)
DRE (Propylene) vs Steam-‐to-‐Vent Gas RaNo for Test Series S3 and S4
DRE for Test Series S3 and S4
84.0
86.0
88.0
90.0
92.0
94.0
96.0
98.0
100.0
0.00 0.20 0.40 0.60 0.80
CE (%
)
Steam-‐to-‐Vent Gas RaNo (lb/lb)
CE vs Steam-‐to-‐Vent Gas RaNo for All of Tests Series S3 and S4
All of Tests Series S3 and S4

TCEQ 2010 Flare Study The University of Texas at Austin 12 August 1, 2011 The Center for Energy & Environmental Resources
Figures ES-5a and ES-5b show DRE (propylene) versus steam assist rate and CE versus steam assist rate, respectively, for the two nominal steam flare vent gas flow rates, 937 lb/hr and 2,342 lb/hr at a nominal LHV of 600 Btu/scf. For a nominal 937 lb/hr vent gas flow rate (Test Series S5), a DRE (propylene) ≥ 98% was achieved at a S/VG = 0.82, 770 lb/hr total steam assist (center steam = 490 lb/hr). A lower S/VG would have been required to achieve a DRE (propylene) ≥ 99%. The 2,342 lb/hr vent gas flow rate (Test Series S6) was able to sustain a 99% DRE (propylene) up to a S/VG = 0.84, 2,000 lb/hr total steam assist (center steam = 520 lb/hr) before the DRE and CE fell below 99% DRE. This LHV and vent gas flow rate did achieve a DRE (propylene) ≥ 99% with a level of steam assist greater than the minimum levels of steam assist (500 lb/hr center, 750 lb/hr upper) recommended to industry by flare manufacturers as reported to the TCEQ by industry representatives for the 36-inch diameter stream flare model used in this study.

TCEQ 2010 Flare Study The University of Texas at Austin 13 August 1, 2011 The Center for Energy & Environmental Resources
Figure ES-5a. DRE vs Steam Assist for Test Series S5 and S6 [5-13a]
Figure ES-5b. DRE vs Steam Assist for Test Series S5 and S6 [5-13b]
20
30
40
50
60
70
80
90
100
0 1,000 2,000 3,000 4,000 5,000
DRE -‐ P
ropylene
(%)
Total Steam Assist (lb/hr) (Center Steam Constant @ 500 lb/hr)
DRE (Propylene) for Test Series S5 & S6 LHV = 600 Btu/scf, Constant Vent Gas Flow Rate
Vent Gas = 937 lb/hr (S5)
Vent Gas = 2,342 lb/hr (S6)
20
30
40
50
60
70
80
90
100
0 1,000 2,000 3,000 4,000 5,000
CE (%
)
Total Steam Assist (lb/hr) (Center Steam Constant @ 500 lb/hr)
CE for Test Series S5 & S6 LHV = 600 Btu/scf, Constant Vent Gas Flow Rate
Vent Gas = 937 lb/hr (S5)
Vent Gas = 2,342 lb/hr (S6)
TCEQ 2010 Flare Study The University of Texas at Austin 14 August 1, 2011 The Center for Energy & Environmental Resources
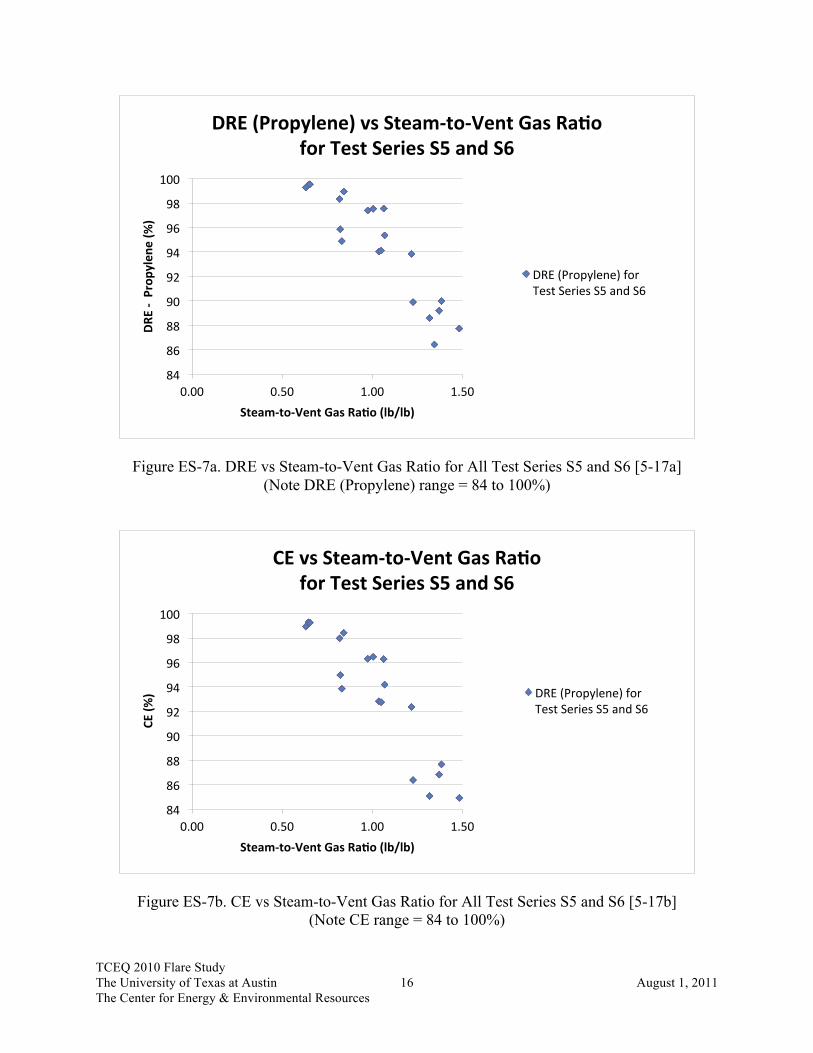
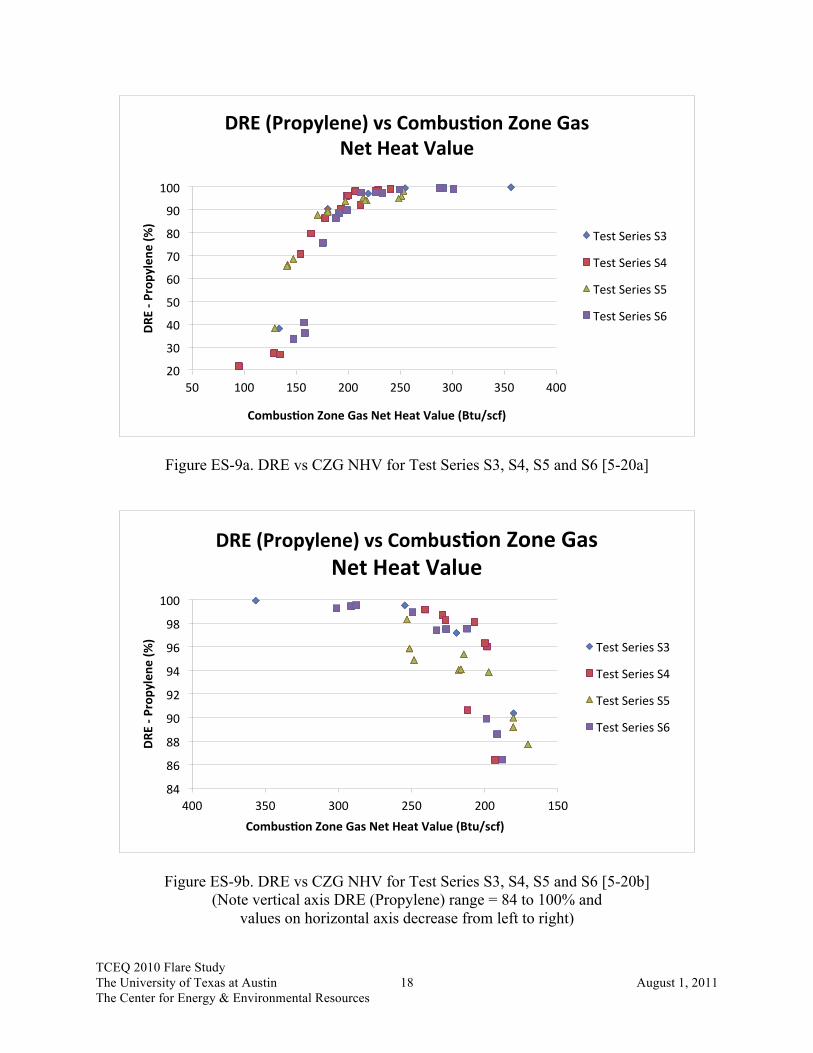
Figures ES-6a and ES-6b show DRE (propylene) versus S/VG ratio and CE versus S/VG ratio, respectively, for all of tests series S5 and S6 on one graph. Figures ES-7a and ES-7b are the same graphs focusing on the range DRE (propylene) ≥ 84%. It can be seen from Figures ES-7a and ES-7b that in this range of S/VG ratios there can be multiple DREs. The previous graphs have illustrated the effect of varying steam assist on a vent gas of constant flow rate and constant LHV. Figures ES-8a and ES-8b show how DRE and CE vary as the vent gas flow rate is varied for five different steam assist combinations that were held constant as the vent gas flow rate was varied. The nominal LHV was held constant at 350 Btu/scf for all tests shown in these two figures. Note that the horizontal axis (vent gas flow rate) is reversed and decreases from left to right. These graphs show the significant effect center and total steam have on DRE at low vent gas flow rates. The flare performance curves with small negative slopes are those with the lowest level of center steam (0 lb/hr) followed by low levels (500 lb/hr and 835 lb/hr) of upper steam assist flow rates (Test Series S8 and S10). The graph with the larger negative slopes (Test Series S7) has the highest center steam flow rate (500 lb/hr). For all graphs, if steam assist is held constant, as vent gas flow rate increases, DRE increases. Figures ES-9a and ES-9b show the relationship between DRE (propylene) and combustion zone gas net heat value (CZG NHV) for Test Series S3 to S6. Figures ES-10a and ES-10b provide the same information for Test Series S7 to S11. Note that the horizontal axis (CZG NHV) in Figures ES-9b and ES-10b has been reversed and decreases from left to right. Figures ES-9b and ES-10b focus on the range of DRE (Propylene) ≥ 84 % to better examine the relationship between these two parameters. There can be multiple DREs for CZG NHVs up to at least 250 Btu/scf and perhaps as high as 300 Btu/scf. Once again, this is due in part to the fact that, in this range of S/VG ratios, steam added at the center has a different effect on DRE than steam added at the upper nozzles.

TCEQ 2010 Flare Study The University of Texas at Austin 15 August 1, 2011 The Center for Energy & Environmental Resources
Figure ES-6a. DRE vs Steam-to-Vent Gas Ratio for All Test Series S5 and S6 [5-16a]
Figure ES-6b. CE vs Steam-to-Vent Gas Ratio for All Test Series S5 and S6 [5-16b]
30
40
50
60
70
80
90
100
0.00 0.50 1.00 1.50 2.00 2.50
DRE -‐ Prop
ylen
e (%
)
Steam-‐to-‐Vent Gas RaNo (lb/lb)
DRE (Propylene) vs Steam-‐to-‐Vent Gas RaNo for Test Series S5 and S6
DRE (Propylene) for Test Series S5 and S6
30
40
50
60
70
80
90
100
0.00 0.50 1.00 1.50 2.00 2.50
CE (%
)
Steam-‐to-‐Vent Gas RaNo (lb/lb)
CE vs Steam-‐to-‐Vent Gas RaNo for Test Series S5 and S6
DRE (Propylene) for Test Series S5 and S6
TCEQ 2010 Flare Study The University of Texas at Austin 16 August 1, 2011 The Center for Energy & Environmental Resources
Figure ES-7a. DRE vs Steam-to-Vent Gas Ratio for All Test Series S5 and S6 [5-17a] (Note DRE (Propylene) range = 84 to 100%)
Figure ES-7b. CE vs Steam-to-Vent Gas Ratio for All Test Series S5 and S6 [5-17b] (Note CE range = 84 to 100%)
84
86
88
90
92
94
96
98
100
0.00 0.50 1.00 1.50
DRE -‐ Prop
ylen
e (%
)
Steam-‐to-‐Vent Gas RaNo (lb/lb)
DRE (Propylene) vs Steam-‐to-‐Vent Gas RaNo for Test Series S5 and S6
DRE (Propylene) for Test Series S5 and S6
84
86
88
90
92
94
96
98
100
0.00 0.50 1.00 1.50
CE (%
)
Steam-‐to-‐Vent Gas RaNo (lb/lb)
CE vs Steam-‐to-‐Vent Gas RaNo for Test Series S5 and S6
DRE (Propylene) for Test Series S5 and S6

TCEQ 2010 Flare Study The University of Texas at Austin 17 August 1, 2011 The Center for Energy & Environmental Resources
Figure ES-8a. DRE vs Vent Gas Flow Rate for Test Series S7, S8, S9, S10 and S11 [5-19a] (Note values on horizontal axis decrease from left to right)
Figure ES-8b. CE vs Vent Gas Flow Rate for Test Series S7, S8, S9, S10 and S11 [5-19b] (Note values on horizontal axis decrease from left to right)
50 55 60 65 70 75 80 85 90 95 100
500 1,500 2,500 3,500
DRE -‐ P
ropylene
(%)
Vent Gas Flow Rate (lb/hr)
DRE (Propylene) for Test Series S7 to S11 LHV = 350 Btu/scf, Constant Steam Assist
Total Steam = 1,050 lb/hr, 500 lb/hr Center (S7)
Total Steam = 500 lb/hr, 0 lb/hr Center (S8)
Total Steam = 1,000 lb/hr, 0 lb/hr Center (S9)
Total Steam = 835 lb/hr, 0 lb/hr Center (S10)
Total Steam = 830 lb/hr, 240 lb/hr Center (S11)
50 55 60 65 70 75 80 85 90 95 100
500 1,500 2,500 3,500
CE (%
)
Vent Gas Flow Rate (lb/hr)
CE for Test Series S7 to S11 LHV = 350 Btu/scf, Constant Steam Assist
Total Steam = 1,050 lb/hr, 500 lb/hr Center (S7)
Total Steam = 500 lb/hr, 0 lb/hr Center (S8)
Total Steam = 1,000 lb/hr, 0 lb/hr Center (S9)
Total Steam = 835 lb/hr, 0 lb/hr Center (S10)
Total Steam = 830 lb/hr, 240 lb/hr Center (S11)
TCEQ 2010 Flare Study The University of Texas at Austin 18 August 1, 2011 The Center for Energy & Environmental Resources
Figure ES-9a. DRE vs CZG NHV for Test Series S3, S4, S5 and S6 [5-20a]
Figure ES-9b. DRE vs CZG NHV for Test Series S3, S4, S5 and S6 [5-20b] (Note vertical axis DRE (Propylene) range = 84 to 100% and
values on horizontal axis decrease from left to right)
20
30
40
50
60
70
80
90
100
50 100 150 200 250 300 350 400
DRE -‐ P
ropylene
(%)
CombusNon Zone Gas Net Heat Value (Btu/scf)
DRE (Propylene) vs CombusNon Zone Gas Net Heat Value
Test Series S3
Test Series S4
Test Series S5
Test Series S6
84
86
88
90
92
94
96
98
100
150 200 250 300 350 400
DRE -‐ P
ropylene
(%)
CombusNon Zone Gas Net Heat Value (Btu/scf)
DRE (Propylene) vs CombusNon Zone Gas Net Heat Value
Test Series S3
Test Series S4
Test Series S5
Test Series S6

TCEQ 2010 Flare Study The University of Texas at Austin 19 August 1, 2011 The Center for Energy & Environmental Resources
Figure ES-10a. DRE vs CZG NHV for Test Series S7, S8, S9, S10 and S11 [5-21a]
Figure ES-10b. DRE vs CZG NHV for Test Series S7, S8, S9, S10 and S11 [5-21b] (Note vertical axis DRE (Propylene) range = 84 to 100% and
values on horizontal axis decrease from left to right)
20
30
40
50
60
70
80
90
100
100 150 200 250 300
DRE -‐ P
ropylene
(%)
CombusNon Zone Gas Net Heat Value (Btu/scf)
DRE (Propylene) vs CombusNon Zone Gas Net Heat Value
Test Seris S7
Test Series S8
Test Series S9
Test Series S10
Test Series S11
84
86
88
90
92
94
96
98
100
100 150 200 250 300
DRE -‐ P
ropylene
(%)
CombusNon Zone Gas Net Heat Value (Btu/scf)
DRE (Propylene) vs CombusNon Zone Gas Net Heat Value
Test Seris S7
Test Series S8
Test Series S9
Test Series S10
Test Series S11

TCEQ 2010 Flare Study The University of Texas at Austin 20 August 1, 2011 The Center for Energy & Environmental Resources
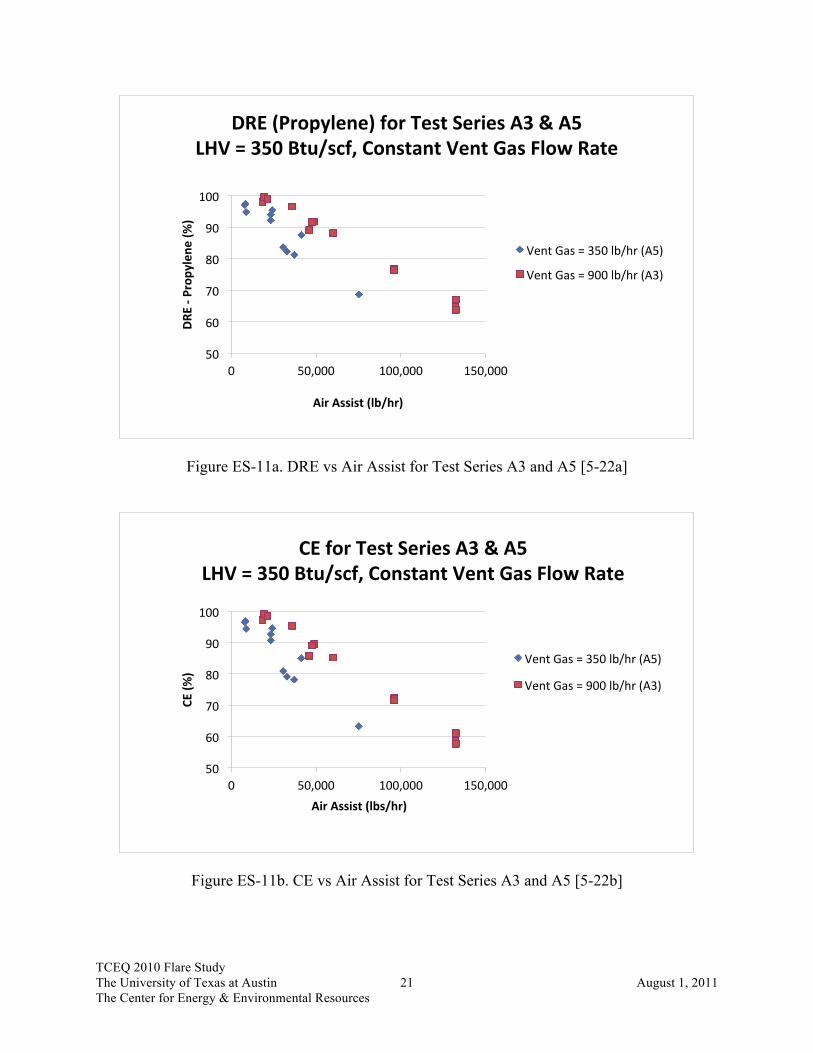
Figures ES-11a and ES-11b show DRE (propylene) versus air assist and CE versus air assist for the nominal LHV = 350 Btu/scf and the two nominal vent gas flow rates, 359 lb/hr and 937 lb/hr. Figures ES-12a and ES-12b show DRE (propylene) versus air assist and CE versus air assist for the nominal LHV = 600 Btu/scf and the two nominal vent gas flow rates, 359 lb/hr and 937 lb/hr. These show an almost linear decline in DRE and CE as air assist increases. The A4 and A6 test series with the vent gas flow rate having an LHV = 600 Btu/scf has a slope that is not as steep but falling below DRE = 99 % at air assist levels that equal approximately 6 times the quantity of air required for stoichiometric combustion. As air assist is increased beyond this quantity, the DRE decreases almost linearly for both of the nominal LHVs used in this study. Figures ES-13a and ES-13b show DRE (propane) versus vent gas flow rate and CE versus vent gas flow rate for three different steam assist combinations that were held constant as the vent gas flow rate was varied. The LHV was held constant at the nominal 350 Btu/scf for all tests shown in these two figures. As with propylene, the highest DREs (> 99.0%) are achieved in test series (S14) with the lowest center steam (0 lb/hr) and 540 lb/hr upper steam flow rates, while test series S12 with the highest center steam (490 lb/hr) and upper (560 lb/hr) steam assist flow rates only achieved a DRE = 97.7% (CE = 97.4%). Figures ES-14a and ES-14b show DRE (propane) versus air assist and CE versus air assist. The LHV was held constant at the nominal 350 Btu/scf for all tests shown in these two figures. As with propylene, at air assist levels that equal approximately 6 times the quantity of air required theoretically for stoichiometric combustion or less, SR ≤ 6, DRE (propane) was ≥ 99%.
TCEQ 2010 Flare Study The University of Texas at Austin 21 August 1, 2011 The Center for Energy & Environmental Resources
Figure ES-11a. DRE vs Air Assist for Test Series A3 and A5 [5-22a]
Figure ES-11b. CE vs Air Assist for Test Series A3 and A5 [5-22b]
50
60
70
80
90
100
0 50,000 100,000 150,000
DRE -‐ P
ropylene
(%)
Air Assist (lb/hr)
DRE (Propylene) for Test Series A3 & A5 LHV = 350 Btu/scf, Constant Vent Gas Flow Rate
Vent Gas = 350 lb/hr (A5)
Vent Gas = 900 lb/hr (A3)
50
60
70
80
90
100
0 50,000 100,000 150,000
CE (%
)
Air Assist (lbs/hr)
CE for Test Series A3 & A5 LHV = 350 Btu/scf, Constant Vent Gas Flow Rate
Vent Gas = 350 lb/hr (A5)
Vent Gas = 900 lb/hr (A3)

TCEQ 2010 Flare Study The University of Texas at Austin 22 August 1, 2011 The Center for Energy & Environmental Resources
Figure ES-12a. DRE vs Air Assist for Test Series A4 and A6 [5-23a]
Figure ES-12b. CE vs Air Assist for Test Series A4 and A6 [5-23b]
50
60
70
80
90
100
0 50,000 100,000 150,000
DRE -‐ P
ropylene
(%)
Air Assist (lb/hr)
DRE (Propylene) for Test Series A4 & A6 LHV = 570 Btu/scf, Constant Vent Gas Flow Rate
Vent Gas = 350 lbs/hr (A6)
Vent Gas = 920 lb/hr (A4)
50.0
60.0
70.0
80.0
90.0
100.0
0 50,000 100,000 150,000
CE (%
)
Air Assist (lb/hr)
CE for Test Series A4 & A6 LHV = 570 Btu/scf, Constant Vent Gas Flow Rate
Vent Gas = 350 lb/hr (A6)
Vent Gas = 920 lb/hr (A4)

TCEQ 2010 Flare Study The University of Texas at Austin 23 August 1, 2011 The Center for Energy & Environmental Resources
Figure ES-13a. DRE vs Vent Gas Flow Rate for Test Series S12, S13 and S14 [5-24a]
Figure ES-13b. CE vs Vent Gas Flow Rate for Test Series S12, S13 and S14 [5-24b]
20
30
40
50
60
70
80
90
100
500 1,000 1,500 2,000 2,500
DRE -‐ P
ropa
ne (%
)
Vent Gas Flow Rate (lb/hr)
DRE (Propane) for Test Series S12 to S14 (Propane) LHV = 340 Btu/scf, Constant Steam Assist
Upper Steam = 560 lb/hr, 490 lb/hr Center (S12)
Upper Steam = 550 lb/hr, 300 lb/hr Center (S13)
Upper Steam = 540 lb/hr, 0 lb/hr Center (S14)
20
30
40
50
60
70
80
90
100
500 1,000 1,500 2,000 2,500
CE (%
)
Vent Gas Flow Rate (lb/hr)
CE for Test Series S12 to S14 (Propane) LHV = 340 Btu/scf, Constant Steam Assist
Upper Steam = 560 lb/hr, 490 lb/hr Center (S12)
Upper Steam = 550 lb/hr, 300 lb/hr Center (S13)
Upper Steam = 540 lb/hr, 0 lb/hr Center (S14)

TCEQ 2010 Flare Study The University of Texas at Austin 24 August 1, 2011 The Center for Energy & Environmental Resources
Figure ES-14a. DRE vs Air Assist for Test Series A7 [5-25a]
Figure ES-14b. CE vs Air Assist for Test Series A7 [25b]
50
60
70
80
90
100
0 20,000 40,000 60,000 80,000
DRE -‐ P
ropa
ne (%
)
Air Assist (lb/hr)
DRE (Propane) for Test Series A7 (Propane) LHV = 350 Btu/scf, Constant Vent Gas Flow Rate
Vent Gas = 337 lb/hr
50
60
70
80
90
100
0 20,000 40,000 60,000 80,000
CE (%
)
Air Assist (lb/hr)
CE for Test Series A7 (Propane) LHV = 350 Btu/scf, Constant Vent Gas Flow Rate
Vent Gas = 337 lb/hr

TCEQ 2010 Flare Study The University of Texas at Austin 25 August 1, 2011 The Center for Energy & Environmental Resources
Comparison with Remote Sensing Technology Measurements with Test Results There were three remote sensing technologies participating in the study: IMACC PFTIR and AFTIR spectrometers, Telops Hyper-cam passive imaging radiometric spectrometer, and LSI FLIR GasFindIR and thermal IR cameras. The LSI cameras provide visual images of hydrocarbons in the gas phase and are useful in detection of these gases but were not used for quantitative assessment of flare combustion. The discussion in this section will focus on the IMACC and Telops instruments, which can measure the combustion efficiency of the flare. Telops can also make mass flow rate measurements of hydrocarbons in the plume. However, these results were provided so late in the preparation of this report that the comparison of the Telops mass flow rate results will be provided as an addendum to this report at a later date. As summarized in Section 3, the measurement of emissions in samples extracted from the plume and analyzed by ARI provided the baseline or reference DRE and CE values against which the remote sensing technologies would be compared. The results of the analyses of the extractive samples and determination of DRE and CE by ARI were not provided to IMACC or Telops. Subsequent to the field tests, IMACC and Telops submitted their CE measurements for each test run, including their standard deviation (σ) for their measurements. Three statistical criteria were selected to compare the measurements of IMACC and Telops with the ARI values. The first two are the mean difference and the standard deviation of the difference. These terms are defined numerically as follows.
!"#$ !"##$!"#$" = !"# (!"!" − !"!"#)!!
!!!
! Eq. ES.3
!"#$%#&% !"#$%&$'( = (!"!" − !"!"#)! !!
!!!! − 1 Eq. ES.4
where mean difference = average of the absolute values of the difference between the CE
determined by the remote sensing contractor and the CE determined by ARI for test point i
standard deviation = standard deviation of the differences between the CE determined by the remote sensing contractor and the CE determined by ARI for the test point i
CERS = combustion efficiency determined by the remote sensing contractor for the test point i
CEARI = combustion efficiency determined by ARI for the test point i N = total number of test points in the subset

TCEQ 2010 Flare Study The University of Texas at Austin 26 August 1, 2011 The Center for Energy & Environmental Resources
The third criterion is data return. Data return is the percentage of the total number of possible test points for which data were reported. It is defined numerically as follows.
!"#" !"#$!% = !"#$%& !" !"#! !"#$%& !"# !ℎ!"ℎ !"#" !"#" !"#$!%"&
!"#$% !"#$%& !" !"#! !"#$%& × 100 Eq. ES.5
To more easily compare IMACC’s and Telops’ data with ARI’s, the CE data sorted by ARI CE (CEARI) value in descending order for the range 100% ≥ CE ≤ 80%. On the assumption that the accuracy of the CE values may not be constant across this entire range, the data have been divided as follows: CEARI≥ 95%; 90 ≥ CEARI < 95%; 85% ≥ CEARI < 90%; and 80% ≥ CEARI< 85%. The difference between the IMACC’s and Telops’s CE values and the CEARI values are shown in each table. The CE mean differences and the standard deviation of the CE differences are calculated using Eqs. ES-3 and ES-4. These two criteria are summarized in Table ES-2, with data return. Steam Flare Tests As shown in Table ES-2, the mean difference and the standard deviation of the CE differences for the IMACC AFTIR and PFTIR increase as the CEARI decreases. The mean difference and the standard deviation of the CE differences for the Telops CE values do not have a clear trend. In examining the differences in CE values in Table D-2, the inaccuracies in the IMACC AFTIR and PFTIR do not appear to have a bias relative to CEARI, while the Telops values tend to be biased lower than the CEARI values. In examining the data return in Table ES-2, the IMACC AFTIR was 100% in all four ranges, while the PFTIR was 100% in all ranges except 90% ≤ CEARI < 95%, where it was 95%. Data return for the Telops CE values was less than 45% for all ranges except 80% ≤ CEARI < 85%, where it was 88%. Air Flare Tests As shown in Table ES-2, the mean difference and the standard deviation of the CE differences for the IMACC PFTIR increase as the CEARI decreases. The IMACC AFTIR was not deployed for any of the air flare tests. In examining the CE differences in Table ES-2, the inaccuracies in these data tend to be biased low relative to the CEARI values. The number of Telops data points, five, for all four ranges of the air flare tests are too few to statistically develop trend data. Additionally, the data return for these four CEARI ranges did not exceed 15%. Therefore, no additional analyses will be performed on the Telops air flare data.

TCEQ 2010 Flare Study The University of Texas at Austin 27 August 1, 2011 The Center for Energy & Environmental Resources
Table ES-2. Summary of Comparison Criteria for Remote Sensing CE Values for CEARI > 80% [10-1]
Steam
Range Criterion Telops AFTIR PFTIR ARI
CEARI ≥ 95%
Mean Difference (% pts) 20.2 1.7 1.1 Standard Deviation (% pts) 32.2 2.5 2.1
Data Return (%) 39 100 100 Number of Test points 14 22* 36 36
90% ≤ CEARI < 95%
Mean Difference (% pts) 9.6 3.2 2.2 Standard Deviation (% pts) 11.3 3.7 2.9
Data Return (%) 40 100* 95 Number of Test points 8 8 19 20
85% ≤ CEARI < 90%
Mean Difference (% pts) 3.8 12.2 2.8 Standard Deviation (% pts) 6.1 14.8 3.4
Data Return (%) 27 100* 100 Number of Test points 3 6 11 11
80% ≤ CEARI < 85%
Mean Difference (% pts) 18.8 12.2 4.6 Standard Deviation (% pts) 26.1 16.7 5.9
Data Return (%) 75 100* 100 Number of Test points 6 4 8 8
Air Range Criterion Telops AFTIR PFTIR ARI
CEARI ≥ 95%
Mean Difference (% pts) 1.2 1.9 Standard Deviation (% pts) 2.0 2.5
Data Return (%) 10 100 Number of Test points 2 21 21
90% ≤ CEARI < 95%
Mean Difference (% pts) 4.4 3.5 Standard Deviation (% pts) 6.3 4.1
Data Return (%) 11 100 Number of Test points 2 18 18
85% ≤ CEARI < 90%
Mean Difference (% pts) NMR 5.5 Standard Deviation (% pts) NMR 6.5
Data Return (%) 0 100 Number of Test points 0 10 10
80% ≤ CEARI < 85%
Mean Difference (% pts) 10.2 8.5 Standard Deviation (% pts) 10.2 9.9
Data Return (%) 13 100 Number of Test points 1 8 8
NMR = No CE vales were reported for these tests. *Instrument not on site to obtain measurements during some of these test points.

TCEQ 2010 Flare Study The University of Texas at Austin 28 August 1, 2011 The Center for Energy & Environmental Resources
In summary, the IMACC PFTIR mean differences for the range CEARI ≥ 90% for both the air and steam flare tests averaged 2.2 percentage points, with an average standard deviation of the CE differences of 2.9 percentage points and average data return of 99%. The IMACC AFTIR mean difference for the range CEARI ≥ 90% for the steam flare tests averaged 2.5 percentage points, with an average standard deviation of the CE differences of 3.1 percentage points and an average data return of 100%. The Telops Hyper-Cam mean difference for the range CEARI ≥ 90% for the steam flare tests averaged 14.9 percentage points, with an average standard deviation of the CE differences of 22.8 percentage points and an average data return of 39%. It is important to note that the difference in some of the values between the IMACC and Telops instruments and the ARI measurements may due to less than ideal aiming due to interference of the plume sampling system. In a few instances, the remote sensing operators indicated that the position of the plume sampling system had restricted their ability to aim their instruments. All participants were required to submit their preliminary data within six weeks of completion of the field campaign. Telops was unable to do so. Their report explains some of the challenges they had in making measurements and processing the large volume of data generated by their sensor and the number of test points conducted in this study.

TCEQ 2010 Flare Study The University of Texas at Austin 29 August 1, 2011 The Center for Energy & Environmental Resources
Major findings of the study were: 1. At a vent gas LHV = 350 Btu/scf and flow rates of 0.1% and 0.25% of rated design capacity
(propylene) for the John Zink Model EE-QSC-36” steam flare this flare design was able to achieve DREs (propylene) of > 99% and CE > 99%. At a nominal vent gas flow rate 937 lb/hr (0.1%), an S/VG = 0.25 or less was required to achieve a DRE (propylene) > 99%. This S/VG would equate to a total steam assist of approximately 234 lb/hr, which would be less than the minimum recommended (as reported by industry) steam-assist rates of center = 500 lb/hr and upper = 750 lb/hr for this flare. The John Zink Company LLC recommends continuous minimum center steam of 300 lb/hr and 525 lb/hr upper steam for this flare design. This study does not recommend that steam assist rates less than that recommended by the flare manufacturer be used.
2. At a vent gas LHV = 350 Btu/scf and flow rates of 0.25% and 0.65% of rated design capacity (propylene) for the John Zink Model LHTS-24/60 air flare, this flare model was able to achieve DREs (propylene) of > 99% and CE > 99%.
3. The most efficient flare operation, as measured by the DRE and CE, for the flare operating conditions tested, was achieved at or near the incipient smoke point (ISP). Higher efficiencies could have been achieved with steam or air assist slightly less than the ISP assist value but this condition, i.e., a smoking flare, would not have been in compliance with 40 CFR § 60.18. Therefore, the minimum levels of steam or air assist that comply with the flare manufacturer’s recommendations should be used when possible.
4. At these low vent gas flow rates (nominally 937 lb/hr and 2,342 lb/hr) and low LHVs (nominally 350 Btu/scf and 600 Btu/scf), the flare performance curve of DRE vs steam assist has a very short to non-existent “shelf” before the DRE falls off to less than 98%. Beyond this point, the DRE and CE decrease almost linearly as steam assist increases.
5. For nominal LHVs of 350 Btu/scf and 600 Btu/scf and vent gas flow rates of 359 lb/hr and 937 lb/hr, air flare test data showed that an air assist quantity of 6 times the stoichiometric air-to-fuel ratio (lb/lb) produced a DRE > 99%. Higher levels of air assist produced lower DREs in an almost linearly decreasing manner.
6. The IMACC PFTIR and AFTIR mean differences between their values of CE and the ARI values of CE averaged 2.2 and 2.5 percentage points, respectively, and had average standard deviations of the CE differences of 2.9 and 3.1 percentage points in the range CEARI ≥ 90% for the air and steam flare tests. The PFTIR and AFTIR had average data returns of 99% and 100% in this range.
7. The Telops Hyper-Cam mean differences between their values of CE and the ARI values of CE averaged 14.9 percentage points, with an average standard deviation of the CE differences of 22.8 percentage points in the range CEARI ≥ 90%. The Telops Hyper-Cam had average data return of 39% in this range.
TCEQ 2010 Flare Study The University of Texas at Austin 30 August 1, 2011 The Center for Energy & Environmental Resources
Table of Contents
Executive Summary 2 List of Figures 32 List of Tables 35 List of Acronyms, Abbreviations and Symbols 36 Acknowledgments 39 1.0 Introduction and Background 40 2.0 Project Scope and Design 41 3.0 Test Plan 47 4.0 Overview of Flare Test Facility and Instrumentation 51 5.0 Results of Flare Tests 67 6.0 Discussion of Test Results 91 7.0 Accuracy and Precision of Plume Sampling System Measurements 100 8.0 Measurements Made by Remote Sensing Technology Instruments 114 9.0 Comparison of Measured Emissions and Conventional Methods for Estimating Emissions 124 10.0 Quality Assurance 127 11.0 Conclusions 132 References 133 Appendices 134 Appendix A – Test Plan Appendix B – Flare Tests Facility Description Appendix C – Data Quality Objectives

TCEQ 2010 Flare Study The University of Texas at Austin 31 August 1, 2011 The Center for Energy & Environmental Resources
Appendix D – Summary of Steam-Assisted Flare Test Data Appendix E – Summary of Air-Assisted Flare Test Data Appendix F – Emissions Measured During Propylene Flare Tests for DRE (Propylene) > 60% Appendix G – Method for Determining Vent Gas Composition and Flow Rate Appendix H – Tulsa Natural Gas Analyses Appendix I – Method of Determining Destruction Removal Efficiency and Combustion
Efficiency Using the Flare Plume Extractive Sampling System and Quality Assurance Procedures Employed During Field Tests
Appendix J – Wind Speed and Direction Variation for Test Series S3, S4, S5, S6, A3, A4,
A5, and A6 Appendix K – Quality Assurance Documentation for Test Systems and Instrumentation Used During Field Tests (This Appendix is included on the digital media
section of the report. It is available only upon request.) Appendix L – Video Image and Raw Data Files (This Appendix is included on the digital
media section of the report. Due to the size of the electronic files, it is available only upon request.)

TCEQ 2010 Flare Study The University of Texas at Austin 32 August 1, 2011 The Center for Energy & Environmental Resources
List of Figures
Figure Title Page ES-1 Flare Plume Sampling System 3 ES-2a DRE vs Steam Assist for All Test Series S3 and S4 9 ES-2b CE vs Steam Assist for All Test Series S3 and S4 9 ES-3a DRE vs Steam-to-Vent Gas Ratio for All Test Series S3 and S4 10 ES-3b CE vs Steam-to-Vent Gas Ratio for All Test Series S3 and S4 10 ES-4a DRE vs Steam-to-Vent Gas Ratio for All Test Series S3 and S4 11 ES-4b CE vs Steam-to-Vent Gas Ratio for All Test Series S3 and S4 11 ES-5a DRE vs Steam Assist for All Test Series S5 and S6 13 ES-5b CE vs Steam Assist for All Test Series S5 and S6 13 ES-6a DRE vs Steam-to-Vent Gas Ratio for All Test Series S5 and S6 15 ES-6b CE vs Steam-to-Vent Gas Ratio for All Test Series S5 and S6 15 ES-7a DRE vs Steam-to-Vent Gas Ratio for All Test Series S5 and S6 16 ES-7b CE vs Steam-to-Vent Gas Ratio for All Test Series S5 and S6 16 ES-8a DRE vs Vent Gas Flow Rate for Test Series S7, S8, S9, S10 and S11 17 ES-8b CE vs Vent Gas Flow Rate for Test Series S7, S8, S9, S10 and S11 17 ES-9a DRE vs CZG NHV for Test Series S3, S4, S5 and S6 18 ES-9b DRE vs CZG NHV for Test Series S3, S4, S5 and S6 18 ES-10a DRE vs CZG NHV for Test Series S7, S8, S9, S10 and S11 19 ES-10b DRE vs CZG NHV for Test Series S7, S8, S9, S10 and S11 19 ES-11a DRE vs Air Assist for Test Series A3 and A5 21 ES-11b CE vs Air Assist for Test Series A3 and A5 21 ES-12a DRE vs Air Assist for Test Series A4 and A6 22 ES-12b CE vs Air Assist for Test Series A4 and A6 22 ES-13a DRE vs Vent Gas Flow Rate for Test Series S12, S13 and S14 23 ES-13b CE vs Vent Gas Flow Rate for Test Series S12, S13 and S14 23 ES-14a DRE vs Air Assist for Test Series A7 24 ES-14b CE vs Air Assist for Test Series A7 24 2-1 Flare Burners Used in Study 43 4-1 Overall View of Flare Test Facility 51 4-2 Flare Plume Sampling System During Morning Steam Only Start-up Routine 52 4-3 Flare Burners 53 4-4 Vent Gas Supply 53 4-5 Control Room for the Flare Test System 54 4-6 Control Room Display 54 4-7 Flare Plume Sampling System 55 4-8 Sample Collector at Near Ground Level 56 4-9 Meteorology System 58 4-10 Time Series of Sample Collector Inlet Thermocouples and CO2 Concentration for Test Point S4.1R1 60 4-11 Sample Collector Location and Wind Data 61 4-12 Time Series of S4.1R1 of CO2, CO and Propylene Concentrations of the Dilution Probe 62
TCEQ 2010 Flare Study The University of Texas at Austin 33 August 1, 2011 The Center for Energy & Environmental Resources
List of Figures (continued)
Figure Title Page 4-13 Propylene and CO2 Concentrations Relative to CO Concentration in Combustion-Associated Plume Intercept 63 4-14 Time Series for the CO Concentrations and Other Trace Selected Hydrocarbon Species 64 4-15 Correlations of Trace Hydrocarbon Concentration with CO Concentration for S4.1R1 65 5-10a DRE vs Steam Assist for Test Series S3 and S4 69 5-10b CE vs Steam Assist for Test Series S3 and S4 69 5-11a DRE vs Steam Assist for Test Series S3 and S4 Special 70 5-11b CE vs Steam Assist for Test Series S3 and S4 Special 70 5-12a DRE vs Steam Assist for All Test Series S3 and S4 72 5-12b CE vs Steam Assist for All Test Series S3 and S4 72 5-13a DRE vs Steam Assist for Test Series S5 and S6 74 5-13b CE vs Steam Assist for Test Series S5 and S6 74 5-14a DRE vs Steam-to-Vent Gas Ratio for All Test Series S5 and S6 75 5-14b CE vs Steam-to-Vent Gas Ratio for All Test Series S5 and S6 75 5-15a DRE vs Steam-to-Vent Gas Ratio for All Test Series S3 and S4 76 5-15b CE vs Steam-to-Vent Gas Ratio for All Test Series S3 and S4 76 5-16a DRE vs Steam-to-Vent Gas Ratio for All Test Series S5 and S6 77 5-16b CE vs Steam-to-Vent Gas Ratio for All Test Series S5 and S6 77 5-17a DRE vs Steam-to-Vent Gas Ratio for All Test Series S5 and S6 78 5-17b CE vs Steam-to-Vent Gas Ratio for All Test Series S5 and S6 78 5-18a DRE vs Vent Gas Flow Rate for Test Series S7, S8, S9, S10 and S11 80 5-18b CE vs Vent Gas Flow Rate for Test Series S7, S8, S9, S10 and S11 80 5-19a DRE vs Vent Gas Flow Rate for Test Series S7, S8, S9, S10 and S11 81 5-19b CE vs Vent Gas Flow Rate for Test Series S7, S8, S9, S10 and S11 81 5-20a DRE vs CZG NHV for Test Series S3, S4, S5 and S6 83 5-20b DRE vs CZG NHV for Test Series S3, S4, S5 and S6 83 5-21a DRE vs CZG NHV for Test Series S7, S8, S9, S10 and S11 84 5-21b DRE vs CZG NHV for Test Series S7, S8, S9, S10 and S11 84 5-22a DRE vs Air Assist for Test Series A3 and A5 86 5-22b CE vs Air Assist for Test Series A3 and A5 86 5-23a DRE vs Air Assist for Test Series A4 and A6 87 5-23b CE vs Air Assist for Test Series A4 and A6 87 5-24a DRE vs Vent Gas Flow Rate for Test Series S12, S13 and S14 89 5-24b CE vs Vent Gas Flow Rate for Test Series S12, S13 and S14 89 5-25a DRE vs Air Assist for Test Series A7 90 5-25b CE vs Air Assist for Test Series A7 90 6-1 CE (Propylene) vs Steam-to-Vent Gas Ratio for Selected Data from EPA 1983 and
TCEQ 2010 Studies 97 7-1 Time Series during Air Flare Tests A5.5R2 and A5.3R2 100
TCEQ 2010 Flare Study The University of Texas at Austin 34 August 1, 2011 The Center for Energy & Environmental Resources
List of Figures (continued)
Figure Title Page 7-2 DRE Instrument Span Error for the 80/20 Propylene/TNG Gas Conditions 104 7-3 Carbon Fraction of Propylene in the Vent Gas for the 80/20 Propylene/TNG Composition 106 7-4 DRE Variability Analysis for S4.6R1 109 7-5 Grouping by Sample Collector Height (z) 110 7-6 Histogram of Second-by-Second DRE Grouped by Sample Collector Height 111 8-1 Comparison of All Remote Sensing Measurements Made To ARI Steam Flare CE Measurements 116 8-2 Comparison of All Remote Sensing Measurements Made To ARI Air Flare CE Measurements 116 8-3 Comparison of All Remote Sensing Measurements Made To ARI Steam Flare CE Measurements ≥ 95% 118 8-4 Comparison of All Remote Sensing Measurements Made To ARI Steam Flare CE Measurements 90% ≤ CEARI < 95% 118 8-5 Comparison of All Remote Sensing Measurements Made To ARI Steam Flare CE Measurements 85% ≤ CEARI < 90% 119 8-6 Comparison of All Remote Sensing Measurements Made To ARI Steam Flare CE Measurements 80% ≤ CEARI < 85% 119 8-7 Comparison of All Remote Sensing Measurements Made To ARI Air Flare CE Measurements ≥ 95% 121 8-8 Comparison of All Remote Sensing Measurements Made To ARI Air Flare CE Measurements 90% ≤ CEARI < 95% 121 8-9 Comparison of All Remote Sensing Measurements Made To ARI Air Flare CE Measurements 85% ≤ CEARI < 90% 122 8-10 Comparison of All Remote Sensing Measurements Made To ARI Air Flare CE Measurements 80% ≤ CEARI < 85% 122 10-1 LSI Four-Way Video Images 129
TCEQ 2010 Flare Study The University of Texas at Austin 35 August 1, 2011 The Center for Energy & Environmental Resources
List of Tables
Table Title Page ES-1 Summary of Flare Test Plan 7 ES-2 Summary of Comparison Criteria for Remote Sensing CE Values for CEARI > 80% 27 3-1 Summary of Flare Test Plan 48 4-1 Fit Parameters for Selected Trace Hydrocarbons for S4.1R1 65 6-1 Selected Papers and Reports on Wind Effects on Flare Performance 98 7-1 Measurement Accuracy and Calibration Checks for Selected Species 103 7-2 Instrument Precision Specifications 105 7-3 Summary of Second-by-Second DRE by Sample Collector Height Groups 111 7-4 Estimated DRE Based on Slope Approach for Each Sample Collector Height Group 112 8-1 Summary of Comparison Criteria for Remote Sensing CE Values for CEARI > 80% 117 9-1 List of Hydrocarbons Emissions Found in Plume During Propylene Flare Tests and
Their Weight Ratio to Propylene 125 9-2 Summary of Selected Emissions Measured During Flare Tests 126 10-1 Repeatability of Test Results 131

TCEQ 2010 Flare Study The University of Texas at Austin 36 August 1, 2011 The Center for Energy & Environmental Resources
List Acronyms, Abbreviations and Symbols
A A/F Theoretical stoichiometric air-to-fuel ratio, mass basis (lb/lb) ARI Aerodyne Research, Inc. AFTIR Active Fourier Transform Infrared B Btu British thermal unit C CE Combustion efficiency CEER Center for Energy and Environmental Resources CFD Computational Fluid Dynamics CFR Code of Federal Regulations CH3CHO Acetaldehyde CH4 Methane C2H4 Ethylene, ethene C3H6 Propylene, propene CO Carbon monoxide CO2 Carbon dioxide D ° Degree of temperature °F Degree Fahrenheit DQO Data Quality Objective DRE Destruction and removal efficiency E EPA U.S. Environmental Protection Agency F FLIR Forward Looking Infrared fps Feet per second ft2 Feet squared G GC Gas Chromatograph GPS Global Positioning System H HCHO Formaldehyde

TCEQ 2010 Flare Study The University of Texas at Austin 37 August 1, 2011 The Center for Energy & Environmental Resources
List Acronyms, Abbreviations and Symbols (continued)
HCOOH Formic acid I IMACC Industrial Monitor and Control Corporation in Inch IR Infrared ISP Incipient smoke point J JZ John Zink Company, LLC L lb/hr Pounds per hour LHV Lower Heating Value LL Lower Limits LSI Leak Surveys, Inc. M MPH Miles per hour mm/Hg Millimeters of mercury min Minutes MFR Momentum flux ratio N NA Not Applicable NO Nitric oxide NO2 Nitrogen dioxide No. Number O O3 Ozone P % Percent PFTIR Passive Fourier Transforms Infrared PGA Proposal for Grant Activities ppbC Parts per billion carbon ppbv Parts per billion volume ppm Parts per million ppmC Parts per million carbon
TCEQ 2010 Flare Study The University of Texas at Austin 38 August 1, 2011 The Center for Energy & Environmental Resources
List Acronyms, Abbreviations and Symbols (continued)
ppmv Parts per million volume pptv Parts per trillion volume psia Pounds per square inch absolute ± Plus or minus Q QA Quality Assurance QAPP Quality Assurance Project Plan QC Quality Control S sec Seconds scf Standard cubic feet scfm Standard cubic feet per minute SO2 Sulfur dioxide ó Standard deviation SA Stoichiometric air SR Stoichiometric ratio T TCEQ Texas Commission on Environmental Quality THC Total hydrocarbons TRC TRC Company TNG Tulsa Natural Gas U UT Austin The University of Texas at Austin V VOC Volatile organic compound vs Versus W WD Wind direction WS Wind speed Z ZINK John Zink Company, LLC

TCEQ 2010 Flare Study The University of Texas at Austin 39 August 1, 2011 The Center for Energy & Environmental Resources
Acknowledgements
The 2010 TCEQ Flare Study Project Team express their appreciation to the project sponsors: the Texas Commission on Environmental Quality and the State of Texas Air Quality Research Program for their financial and technical support. In particular, we express our appreciation to Ms. Danielle Nesvacil and Mr. Russ Nettles, TCEQ Project Managers, whose input, support and guidance have been greatly appreciated. We also express our appreciation to the TCEQ’s Technical Review Panel: Peter E. G. Gogolek, Ph.D., CanmetENERGY, Canada John Pohl, SC.D., Virginia Polytechnic Institute and State University Eben Thoma, Ph.D., U.S. Environmental Protection Agency, for their technical input and review of the QAPP and preliminary and final project reports. We want to thank those who visited and observed the tests at the John Zink Test Facility and the organizations they represented: Lucy Randel, Industry Professionals for Clean Air; Bruce Davis, Texas Chemical Council; Scot Evans and Steve Smith, Texas Oil and Gas Association; and Brian Dickens, Eben Thoma, and Edgar Thompson, US EPA. Finally, we express our thanks to the John Zink, LLC flare test facility team: Scott Fox Vice President, Flare Systems Division Robert Schwartz Project Representative / Project Director Wes Bussman Project Quality Assurance Officer Zachary Kodesh Project Operations Officer Richard Lawhead Test Center Technician, steam / fuel control Clifford Pugh Test Center Technician, steam / fuel control Garrett Spaulding Test Center Technician, steam / fuel control
Charlie Crown Test Center Technician, chain gang lead, Instrumentation
Michael Bryant Test Center Technician, chain gang Chris Patrick Test Center Technician, chain gang Craig Skaggs Test Center Technician, instrumentation Leon Longacre Test Center Supervisor, fuel supply
coordinator Dan Doss Test Center Safety Manager Jerry Buhler Test Center Manager Crane Operator Joe Potter Belger Cartage Service, Inc. whose hard work, cooperation and support helped make the flare testing a success.

TCEQ 2010 Flare Study The University of Texas at Austin 40 August 1, 2011 The Center for Energy & Environmental Resources
1.0 Introduction and Background The results of previous research funded by and work performed for the Texas Commission on Environmental Quality (TCEQ) indicated a need to conduct a study to determine the relationship between flare design, operation and destruction and removal efficiency (DRE) (NPL 2008, URS 2004). In May 2009, the TCEQ contracted with The University of Texas at Austin (UT Austin) to conduct the 2010 TCEQ Flare Study project (PGA No. 582-8-86245-fy09-04, Tracking Number 2008-81) (TCEQ, 2009). The purpose of the 2010 TCEQ Flare Study project was to conduct field tests to measure flare emissions and collect process and operational data in a semi-controlled environment to determine the relationship between flare design, operation, vent gas lower heating value (LHV) and flow rate, DRE, and combustion efficiency (CE). Because the study was conducted outdoors, in a full-scale test facility, there was no attempt to control ambient conditions, i.e., temperature, humidity and wind speed and direction. It was anticipated that the results of these field tests would provide insight into operational conditions that may impact flare volatile organic compound (VOC) DRE and flare CE, such as assist rates or vent gas volumetric flow rates. In August 2010, the Air Quality Research Program funded a project (Task Order No. UTA10-000924-LOAT-RP9) that supplemented funding for this study. This final report is submitted to fulfill the requirements of PGA No. 582-8-86245-fy09-04, Tracking Number 2008-81, Task 10 and Task Order No. UTA10-000924-LOAT-RP9, Task 1 and presents the results for this project and the data collected to address the Study Objectives (see Section 2.0), as defined by the TCEQ. During this study and, in particular the field tests, data were collected that provided the information needed to address the Study Objectives. Due to excellent weather conditions, no major equipment problems that affected data quality, and efficient planning of the test series, the study team was able to collect data on almost 96% more test runs on the steam-assisted test flare and 27% more test runs on the air-assisted test flare than originally planned. The data collected are a valuable resource for addressing many questions related to flare operation and performance; however, work to date has focused on addressing the Study Objectives. The Study team recognizes that follow-on work with the data collected in this project would be valuable and looks forward to the opportunity to participate in those analyses.

TCEQ 2010 Flare Study The University of Texas at Austin 41 August 1, 2011 The Center for Energy & Environmental Resources
2.0 Project Scope and Design UT Austin was contracted to measure flare emissions in a semi-controlled environment and collect and analyze process and operational data to fulfill TCEQ’s study objectives for the project. The TCEQ’s primary study objectives, in order of decreasing priority, were: • Assess the potential impact of high vent gas flow rate turndown on flare CE and VOC DRE; • Assess the potential impact of steam and air assist on flare CE and VOC DRE at various
operating conditions, including low vent gas flow rates, i.e., high vent gas flow rate turndown;
• Determine whether flares operating over the range of requirements stated in 40 Code of Federal Regulations (CFR) § 60.18 achieve the assumed hydrocarbon DRE of 98% at varying vent gas flow rate turndown, assist ratios, and waste stream heat content; and
• Identify and quantify the hydrocarbon species in flare plumes visualized with passive infrared cameras.
In this study, the term vent gas will be used to represent the waste gas stream that would be sent to the flare for destruction in an industrial facility. The terms flare plume and plume will always refer to the total stream of gas that leaves the flare tip and changes composition due to some level of combustion. Industrial Scale Flares Extensive research has been conducted in controlled environments on devices that are not full-scale flares, i.e., with diameters less than three inches as opposed to industrial scale flares, which are typically on the order of multiple feet in diameter and can be as large as ten feet in diameter. To make the results of this study most directly applicable to industrial scale operations, the TCEQ required that the field tests performed for this study be conducted on full-scale industrial design flares. Specifically, the TCEQ required that both air-and steam-assisted flares be included in the study and that the minimum design capacity and diameter of the flare burners be one million lb/hr and 36 inches, respectively. While these minimum specifications were appropriate for steam-assisted flares, a comparable design capacity for an air-assisted flare would mean the nominal diameter of the air flare would need to be about 4 feet to comply with the maximum exit velocity limitation of 40 CFR § 60.18, which was also a requirement of the study. This diameter for an air-assisted flare would not typically represent the size of flares currently found in the field as reported by John Zink Company, LLC (Zink) representatives (email message from Z. Kodesh to V. Torres, UT Austin, February 15, 2010). So, this specification was modified to include an air-assisted flare burner representative of a design and size typically found in the field. There are multiple flare manufacturers who have a wide range of proprietary flare burner designs. It was not within the scope of this project to attempt to test representative samples of every different flare design each with its own set of design options. Instead, the decision was made to select one design of an air flare and one design of a steam flare that would represent a large number of flare burners currently in the field. Zink was asked to identify models of flares, based on their market data, which satisfied this criterion. Additionally, the TCEQ required that the steam flare design selected have both center and upper steam assist.
TCEQ 2010 Flare Study The University of Texas at Austin 42 August 1, 2011 The Center for Energy & Environmental Resources
The TCEQ established these flare design criteria on the following data from their 2009 Point Source Emissions Inventory (email message from D. Nesvacil, TCEQ, to V. Torres, UT Austin, July 22, 2001) so that the flare configurations tested represent flares commonly used in both routine process and emergency service (dual service). • Of 1,519 total flares in the TCEQ 2009 Emissions Inventory:
o 684 (45.0%) are designated as being in both routine and emergency/maintenance service o 322 (21.2%) are designated as being in routine service
o 275 (18.1%) are designated as being in emergency/maintenance service o 238 (15.7%) are not designated as being in any service (blank)
• Out of 684 flares in both routine and emergency/maintenance service: o 143 (21%) are air-assisted o 305 (45%) are steam-assisted
o 218 (32%) are unassisted o 18 (3%) have no designated assist type
• For these dual-service flares, 2009 TCEQ Emissions Inventory data indicates: o 21% of dual-service flares are air-assisted. Of these air-assisted, dual-service flares:
§ 77% are 12 to 36 inches in diameter and represent 95% of total 2009 emissions for dual-service, air-assisted flares.
o 45% of dual-service flares are steam-assisted. Of these steam-assisted, dual-service flares: § 41% are 24 to 48 inches in diameter and represent 57% of total 2009 emissions for
dual-service, steam-assisted flares. Based on these requirements for the flare burners, the John Zink Models EE-QSC-36” Flare Tip (36-inch diameter) with (3) EEP-503 pilots and the LHTS-24/60 (24-inch diameter) with (3) Pilots (Figure 2-1) were selected for the steam flare and air flares, respectively. Data sheets and drawings of these two flare tips are included in Appendix B.
TCEQ 2010 Flare Study The University of Texas at Austin 43 August 1, 2011 The Center for Energy & Environmental Resources
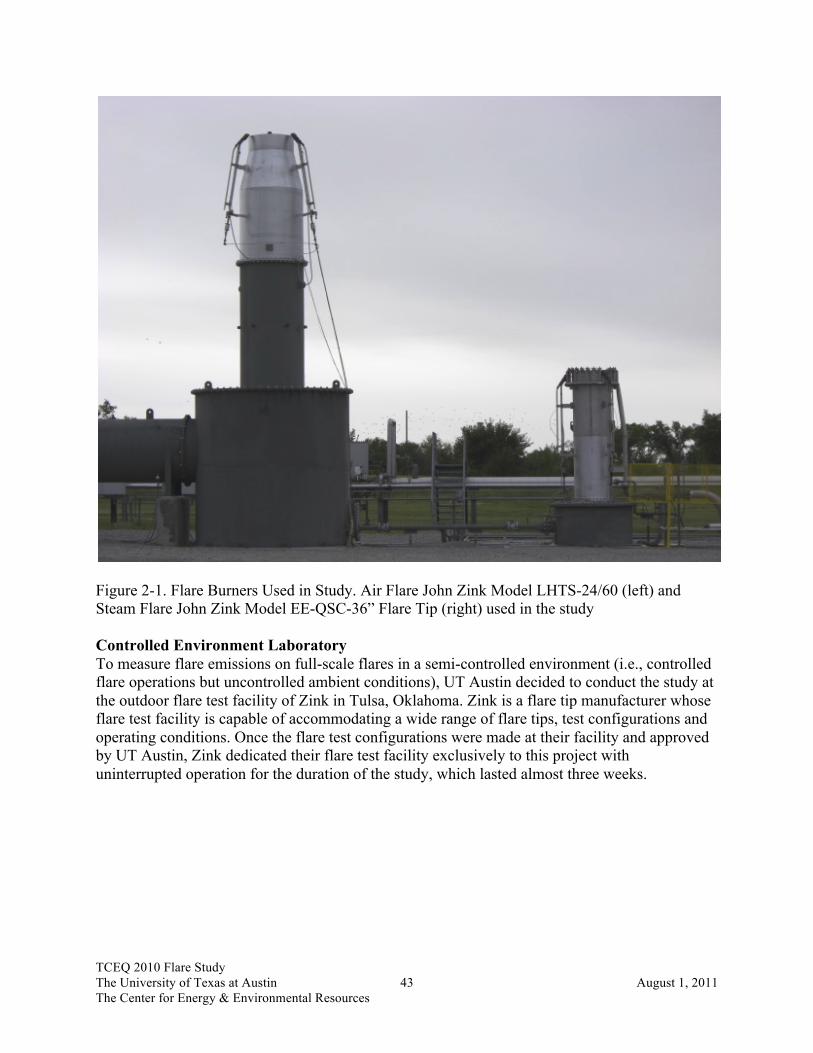
Figure 2-1. Flare Burners Used in Study. Air Flare John Zink Model LHTS-24/60 (left) and Steam Flare John Zink Model EE-QSC-36” Flare Tip (right) used in the study
Controlled Environment Laboratory To measure flare emissions on full-scale flares in a semi-controlled environment (i.e., controlled flare operations but uncontrolled ambient conditions), UT Austin decided to conduct the study at the outdoor flare test facility of Zink in Tulsa, Oklahoma. Zink is a flare tip manufacturer whose flare test facility is capable of accommodating a wide range of flare tips, test configurations and operating conditions. Once the flare test configurations were made at their facility and approved by UT Austin, Zink dedicated their flare test facility exclusively to this project with uninterrupted operation for the duration of the study, which lasted almost three weeks.

TCEQ 2010 Flare Study The University of Texas at Austin 44 August 1, 2011 The Center for Energy & Environmental Resources
Measurement of Flare Emissions A core element of UT Austin’s study approach was to directly measure flare emissions at the end of the flare plume where combustion had ceased, and calculate DRE and CE based on those measurements. To measure these emissions, UT Austin selected Aerodyne Research, Inc., (ARI) due to their extensive experience in ambient air quality studies and their unique capability to make continuous (1 Hz frequency) measurements of the chemical species expected to be present in the flare plume. These direct measurements of the flare emissions serve as the primary data used to address the study objectives. Compare Remote Sensing Technologies The TCEQ also required that remote sensing technologies be included in the study and a comparison of their performance be included in the study results. The following remote sensing measurement methods were specified by the TCEQ for inclusion in this study (TCEQ, 2009): 1. Infrared Hyper-Spectral Imaging Technology (Contractor: Telops Inc.)
Identify flare hydrocarbon plume species and determine plume species concentrations. 2. Passive Fourier Transform Infrared (PFTIR) Spectroscopy (Contractor: Industrial Monitor
and Control Corporation) Collect the required data to determine flare combustion efficiency.
3. FLIR GasFindIR Passive Infrared (IR) Cameras (Contractor: Leak Surveys Inc.) Provide a visual comparison of IR images to the infrared hyper-spectral imaging technology results, and assist other remote sensing tools to take measurements.
During the course of the study planning, UT Austin recommended that Active Fourier Transform Infrared (AFTIR) spectroscopy also be considered for comparison with these remote sensing technologies as this instrument is reported to be able to detect all organics and have better performance (Hashmonay 2010) in minimum detection levels and data quality than the PFTIR, thereby having greater precision in the determination of CE than the PFTIR systems (email from R. Spellicy, IMACC to E. Michel, UT Austin May 19, 2010). It was also decided by the UT Team that a single blind approach should be used to compare the remote sensing technology measurements, i.e., the only information provided to the contractors performing remote sensing measurements was that which would be provided to them if they were engaged to measure combustion efficiencies at an industrial facility. The results of the CE and DRE measurements made by ARI were not made available to the remote sensing teams until this report was released to the public. Performance and Comparison Metrics VOC DRE was selected by the TCEQ to be the primary metric for assessing flare performance. TCEQ selected this metric because of the critical role VOCs play in contributing to the formation of ozone. CE was selected as a secondary metric because the remote sensing technologies included in the study can only measure CE. DRE (hydrocarbon species X) is the percentage of species X that is destroyed relative to the quantity of species X entering the flare. Numerically, this is represented as
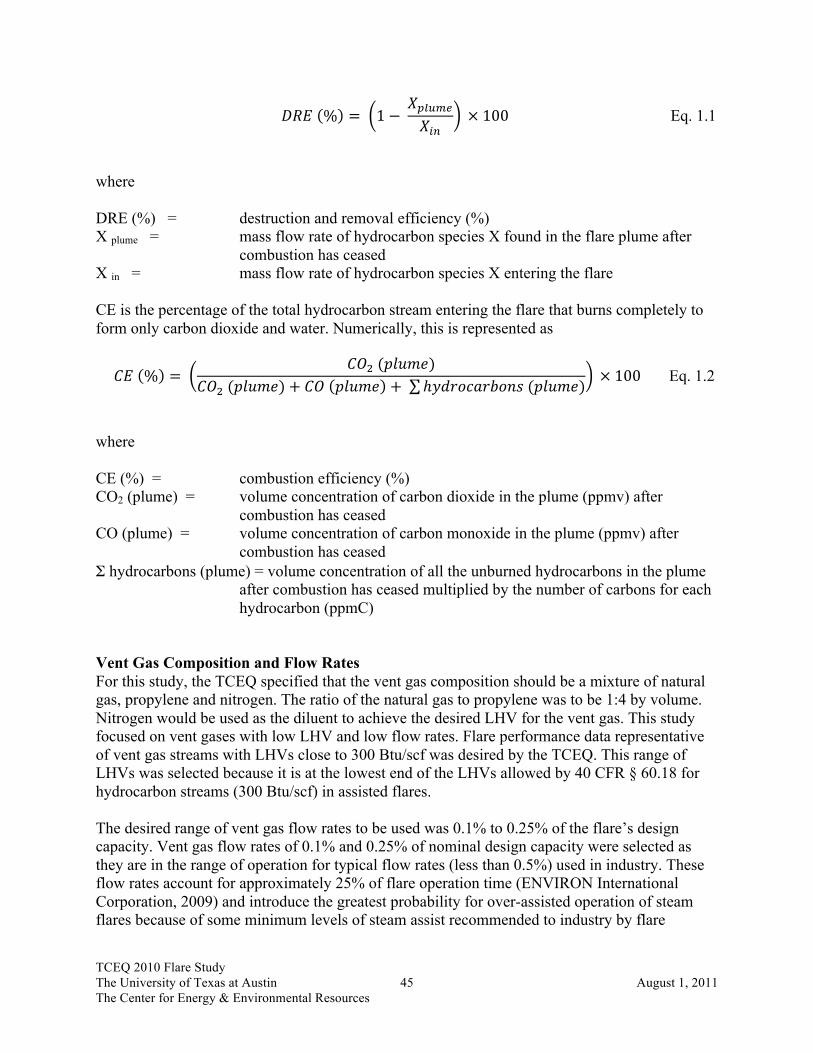
TCEQ 2010 Flare Study The University of Texas at Austin 45 August 1, 2011 The Center for Energy & Environmental Resources
!"# % = 1− !!"#$%!!"
× 100 Eq. 1.1
where DRE (%) = destruction and removal efficiency (%) X plume = mass flow rate of hydrocarbon species X found in the flare plume after
combustion has ceased X in = mass flow rate of hydrocarbon species X entering the flare CE is the percentage of the total hydrocarbon stream entering the flare that burns completely to form only carbon dioxide and water. Numerically, this is represented as
!" % = !"! (!"#$%)
!"! (!"#$%)+ !" !"#$% + ℎ!"#$%&#'$() (!"#$%) × 100 Eq. 1.2
where CE (%) = combustion efficiency (%) CO2 (plume) = volume concentration of carbon dioxide in the plume (ppmv) after
combustion has ceased CO (plume) = volume concentration of carbon monoxide in the plume (ppmv) after
combustion has ceased Σ hydrocarbons (plume) = volume concentration of all the unburned hydrocarbons in the plume
after combustion has ceased multiplied by the number of carbons for each hydrocarbon (ppmC)
Vent Gas Composition and Flow Rates For this study, the TCEQ specified that the vent gas composition should be a mixture of natural gas, propylene and nitrogen. The ratio of the natural gas to propylene was to be 1:4 by volume. Nitrogen would be used as the diluent to achieve the desired LHV for the vent gas. This study focused on vent gases with low LHV and low flow rates. Flare performance data representative of vent gas streams with LHVs close to 300 Btu/scf was desired by the TCEQ. This range of LHVs was selected because it is at the lowest end of the LHVs allowed by 40 CFR § 60.18 for hydrocarbon streams (300 Btu/scf) in assisted flares. The desired range of vent gas flow rates to be used was 0.1% to 0.25% of the flare’s design capacity. Vent gas flow rates of 0.1% and 0.25% of nominal design capacity were selected as they are in the range of operation for typical flow rates (less than 0.5%) used in industry. These flow rates account for approximately 25% of flare operation time (ENVIRON International Corporation, 2009) and introduce the greatest probability for over-assisted operation of steam flares because of some minimum levels of steam assist recommended to industry by flare

TCEQ 2010 Flare Study The University of Texas at Austin 46 August 1, 2011 The Center for Energy & Environmental Resources
manufacturers, 500 lb/hr center, 750 lb/hr upper, for the size and model of steam flare used in this study (email message from R. Nettles, TCEQ, to V. Torres, UT Austin, on September 8, 2010), potentially producing less than a 98% DRE (Marathon June 2010, Marathon November 2010). It was desired to increase the range to 0.5% of maximum design capacity for both the steam and air flares but the Zink test facility would not have been able to provide the nitrogen gas flow rates needed to achieve the LHVs specified by the TCEQ for the steam flare. Therefore, the vent gas flow rates used for the air flare were increased to 0.25% and 0.65% of the maximum design capacity of the air flare. Quality Assurance UT Austin prepared a Category 2 Quality Assurance Project Plan (The University of Texas at Austin, 2010) for this project that complied with the requirements of the Environmental Protection Agency’s (EPA) Requirements for Quality Assurance Project Plans, EPA QA/R-5, and Guidance for Quality Assurance Project Plans, EPA QA/G-5. This QAPP was posted for public comment by the TCEQ and was reviewed by the EPA. Reference Values and Standard Conditions The reference values for properties of gases used during the test and for subsequent calculations and analyses are taken from Perry’s Chemical Engineer’s Handbook, 8th Edition, 2008, unless otherwise stated. Standard conditions used in this study are atmospheric pressure = 14.696 psia and 68°F.

TCEQ 2010 Flare Study The University of Texas at Austin 47 August 1, 2011 The Center for Energy & Environmental Resources
3.0 Test Plan UT Austin worked with Zink, ARI and the TCEQ to develop a test plan that would provide data that would form the basis for addressing as many of the study objectives as possible within the project schedule and available budget ($2,191,332). The test plan developed for the study is included in Appendix A. A summary of the test series actually conducted is shown in Table 3-1, where steam flare tests begin with the letter “S” in the designation of the test series and air flare tests begin with the letter “A”. The test plan consisted of multiple flare test series conducted on the air-assisted flare tip and multiple test series conducted on the steam-assisted flare tip. The designation used to identify each test point and run was: S[number X].[number Y]R[number Z], where the number X is the test series number, number Y designates the level of assist (air or steam) used in the test series and number Z is the run or repetition number for the test point. So, for example, S3.2R2, is steam flare test series number 3, the second assist condition tested, repetition number 2. As stated in the previous section, the TCEQ specified that the vent gas be a mixture of natural gas (Tulsa Natural Gas was available at the Zink test facility) and propylene (1:4 ratio by volume) diluted with nitrogen to achieve the desired LHV. To focus on low LHV vent gas streams and still comply with 40 CFR § 60.18, a LHV of 350 Btu/scf ± 50 Btu/scf was selected as the lowest target LHV for the vent gases used in the Test Plan. To obtain additional data on the effect of LHV on DRE and CE, a second LHV of 600 Btu/scf ± 80 Btu/scf was also included in the Test Plan. The steam flare burner used for this study had a design capacity of 937,000 lb/hr for use with propylene. Therefore the 0.1% and 0.25% of design capacity vent gas flow rates for this flare are 937 lb/hr and 2,342 lb/hr, respectively. These two flow rates were the target vent gas flow rates used for the steam flare tests. The air flare burner used for this study had a design capacity of 144,000 lb/hr for use with propylene. The 0.25% and 0.65% of design capacity vent gas flow rates for this flare are 359 lb/hr and 937 lb/hr, respectively. These two flow rates were the target vent gas flow rates used for the air flare tests.
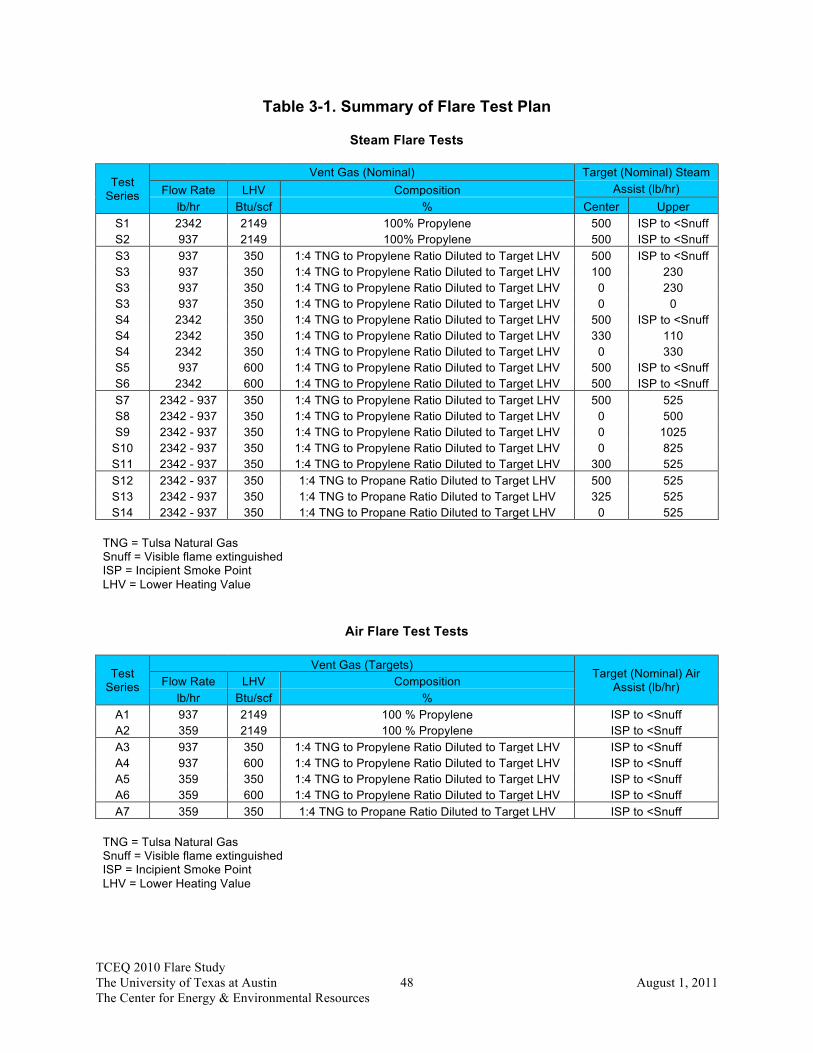
TCEQ 2010 Flare Study The University of Texas at Austin 48 August 1, 2011 The Center for Energy & Environmental Resources
Table 3-1. Summary of Flare Test Plan
Steam Flare Tests
Test Series
Vent Gas (Nominal) Target (Nominal) Steam Flow Rate LHV Composition Assist (lb/hr)
lb/hr Btu/scf % Center Upper S1 2342 2149 100% Propylene 500 ISP to <Snuff S2 937 2149 100% Propylene 500 ISP to <Snuff S3 937 350 1:4 TNG to Propylene Ratio Diluted to Target LHV 500 ISP to <Snuff S3 937 350 1:4 TNG to Propylene Ratio Diluted to Target LHV 100 230 S3 937 350 1:4 TNG to Propylene Ratio Diluted to Target LHV 0 230 S3 937 350 1:4 TNG to Propylene Ratio Diluted to Target LHV 0 0 S4 2342 350 1:4 TNG to Propylene Ratio Diluted to Target LHV 500 ISP to <Snuff S4 2342 350 1:4 TNG to Propylene Ratio Diluted to Target LHV 330 110 S4 2342 350 1:4 TNG to Propylene Ratio Diluted to Target LHV 0 330 S5 937 600 1:4 TNG to Propylene Ratio Diluted to Target LHV 500 ISP to <Snuff S6 2342 600 1:4 TNG to Propylene Ratio Diluted to Target LHV 500 ISP to <Snuff S7 2342 - 937 350 1:4 TNG to Propylene Ratio Diluted to Target LHV 500 525 S8 2342 - 937 350 1:4 TNG to Propylene Ratio Diluted to Target LHV 0 500 S9 2342 - 937 350 1:4 TNG to Propylene Ratio Diluted to Target LHV 0 1025
S10 2342 - 937 350 1:4 TNG to Propylene Ratio Diluted to Target LHV 0 825 S11 2342 - 937 350 1:4 TNG to Propylene Ratio Diluted to Target LHV 300 525 S12 2342 - 937 350 1:4 TNG to Propane Ratio Diluted to Target LHV 500 525 S13 2342 - 937 350 1:4 TNG to Propane Ratio Diluted to Target LHV 325 525 S14 2342 - 937 350 1:4 TNG to Propane Ratio Diluted to Target LHV 0 525
TNG = Tulsa Natural Gas Snuff = Visible flame extinguished ISP = Incipient Smoke Point LHV = Lower Heating Value
Air Flare Test Tests
Test Series
Vent Gas (Targets) Target (Nominal) Air
Assist (lb/hr) Flow Rate LHV Composition lb/hr Btu/scf %
A1 937 2149 100 % Propylene ISP to <Snuff A2 359 2149 100 % Propylene ISP to <Snuff A3 937 350 1:4 TNG to Propylene Ratio Diluted to Target LHV ISP to <Snuff A4 937 600 1:4 TNG to Propylene Ratio Diluted to Target LHV ISP to <Snuff A5 359 350 1:4 TNG to Propylene Ratio Diluted to Target LHV ISP to <Snuff A6 359 600 1:4 TNG to Propylene Ratio Diluted to Target LHV ISP to <Snuff A7 359 350 1:4 TNG to Propane Ratio Diluted to Target LHV ISP to <Snuff
TNG = Tulsa Natural Gas Snuff = Visible flame extinguished ISP = Incipient Smoke Point LHV = Lower Heating Value
TCEQ 2010 Flare Study The University of Texas at Austin 49 August 1, 2011 The Center for Energy & Environmental Resources
The range of steam or air assist values to be used in this study was bracketed on the lower end by the incipient smoke point and on the upper end by the snuff point. The definition of incipient smoke point (ISP) used for this project is the point of operation of the flare with the minimum amount of air or steam required, as appropriate for the flare type, so that no visible smoke emissions are observed two flame lengths away from the flare tip. For this study, as defined in the QAPP, a panel of three people, R. Schwartz (Zink), R. Nettles (TCEQ), and V. Torres (UT Austin), determined when this criterion was achieved. The snuff point is the point when the visible flame has been extinguished, i.e., no visible combustion is occurring at the flare. Visible smoke emissions are defined in this study as the appearance of a group of black particles produced by the flare combustion process. A requirement of this study was that all data be obtained at flare operating points that comply with 40 CFR § 60.18. A requirement of 40 CFR § 60.18 is that flares be operated with no visible smoke emissions, except for periods not to exceed 5 minutes during any two consecutive hours. If the vent gas in a flare does produce smoke during combustion, then the ISP air or steam assist value represents the flare operating point of minimum assist that achieves compliance with 40 CFR § 60.18. So the incipient smoke point was selected as the lower end of the range of steam or air assist values used for the study. The snuff point was selected as the upper bound of the range of steam or air assist and the value beyond which there is no further visible flare combustion occurring and therefore no further change in DRE or CE. In practice, the snuff point was never attained during this study before the maximum design rates for this project were reached. So the snuff point was a target not an actually achievable operating point at the maximum level of assist used in any test series. The target flow rate used for center steam was 500 lb/hr. This value was selected for use as it represented the level reported to the TCEQ by industry (email message from R. Nettles, TCEQ, to V. Torres, UT Austin, on September 8, 2010) as the value recommended most frequently for use by flare burner manufacturers to prevent thermal shock and condensation in the piping. Zink also agreed (meeting with J. Franklin and Z. Kodesh, Zink with E. Michel and V. Torres, UT Austin, and D. Nesvacil and R. Nettles, TCEQ, on February 11, 2010) that this would be a reasonable level to use with the Zink model steam-assisted flare burner that was to be used on this project. The Test Plan was designed to systematically vary only one flare operational parameter at a time while holding all other parameters constant. The approach used in implementation of the test plan and reflected in the Test Plan in Appendix A was to start a test series using one of the two study vent gas flow rates (0.1% or 0.25% of flare design capacity) and one of the two study LHVs (350 Btu/scf or 600 Btu/scf) and begin the first test point of the test series with the ISP level of steam or air assist. After data were collected for that test point and while maintaining this vent gas flow rate and LHV, the assist would be increased to the snuff point as the second test point in the series. Then, two more steam or air assist levels between the ISP level and the snuff would be run to complete the test series for a total of four test points, minimum, per test series. For the core test series, these same test points would be repeated two more times. For the next test series, this process would be repeated with the other LHV. If the 0.1% vent gas flow rate were used first, then the next test series would use the 0.25% vent gas flow rate and this whole process repeated with this vent gas flow rate.
TCEQ 2010 Flare Study The University of Texas at Austin 50 August 1, 2011 The Center for Energy & Environmental Resources
Test series S1, S2, A1, and A2 do not contain mixtures of natural gas and propylene. These tests were included as preparatory tests to allow all participants to practice with their equipment and optimize their measurement process on the specific flare about to be tested. The data from these tests are not included the data analysis of this study. Test series S3, S4, S5, S6, A3, A4, A5, and A6 are the core test series that were identified in the Study Plan. Because of very favorable weather conditions and no major equipment problems affecting data quality, the core test series were completed in less time than anticipated and tests in addition to the core test series could be conducted. In compliance with Appendix E, Flare Test Plan Modification Procedure, of the QAPP, a strategy was proposed for conducting additional tests that were not part of the original test plan. The strategy for conducting the additional tests was to run more operating points, which would help to better define the efficiency curve, and fewer, if any, repetitions. Preliminary data indicated that reproducibility of estimated DRE during the repetitions of the core test series was high with a percent standard deviation of less than 5%. (The percent standard deviation being equal to the standard deviation of the DREs for the three repetitions divided by the average DRE for the repetitions.) Another strategy incorporated in the proposal for more tests was to hold steam assist constant and vary vent gas flow rate rather than holding vent gas flow rate constant and varying steam assist. This strategy was proposed because during the core test series it was found that the Zink test facilities had greater difficulty making small incremental increases/decreases in steam flow rates and then returning to reproduce the same steam flow rate. Zink could more easily hold steam rate constant and quickly vary and stabilize the vent gas flow rate. So Test Series S7, S8, S9, S10, S11, S12, S13, S14 and A7 have few, if any repetitions. These test series are conducted at constant nominal steam assist levels (for the S test series) with the vent gas flow rates as the variable during the test series. One additional test plan modification was the inclusion of propane instead of propylene. Test Series S12, S13, S14, and A7 are test runs substituting propane for propylene. All other parameters remained the same as in the propylene runs for these four test series. The ARI team collected data in all of the test series, and the IMACC PFTIR and Telops Hyper-Cam collected data during the entire field test campaign. The IMACC AFTIR participated in the core steam tests but did not participate in the air flare tests as the air flare test configuration and height limitations of the scissor lifts supporting the reflectors would have prevented proper alignment of the camera, reflectors, and air flare plume. The data return (percent of test points reporting data relative to the total number of test points conducted) for all quality assured data reported in time to include in this report is reflected in the summary of test data in Appendices D and E.

TCEQ 2010 Flare Study The University of Texas at Austin 51 August 1, 2011 The Center for Energy & Environmental Resources
4.0 Overview of Flare Test Facility and Instrumentation Once the test plan was developed, UT Austin worked with ARI and Zink to design the test facility and instrumentation needed to make measurements of all the flare operational parameters and flare emissions in the plume. A brief description of the test facility and instrumentation follow. A detailed description the major test facility equipment and instrumentation is included in Appendix B. The flare test facility was composed of two major systems: the flare test system (Figure 4-1) and the flare plume sampling system (Figure 4-2). The flare test system consisted of the flare burners (air- and steam-assisted), the vent gas supply system, the air- or steam-assist system and the flare control room. The flare plume sampling system consisted of the sample collector, the eductor, global positioning system, crane, meteorology system, and the sampling probes and lines.
Figure 4-1. Overall View of Flare Test Facility

TCEQ 2010 Flare Study The University of Texas at Austin 52 August 1, 2011 The Center for Energy & Environmental Resources
Figure 4-2. Flare Plume Sampling System During Morning Steam Only Start-up Routine The operation of the flare burners (Figure 4-3) were controlled by Zink personnel and monitored using their standard process and control instrumentation with additional instrumentation and sampling ports added for this study where necessary. Vent gas supply (Figure 4-4) was controlled, flow rates measured and blended at the vent gas supply station before being sent to the flare. All operating data were recorded in a data acquisition system in the flare control room (Figures 4-5 and 4-6). To verify and determine the actual composition of the vent gas being used during each test run, a stack testing company, TRC, was employed to provide measurements of the vent gas composition entering the flare from a sample obtained at the beginning of the test run and one five minutes later. From these same samples, TRC made measurements of propylene/propane, methane and ethane in the flare plume as a back-up to ARI’s primary determination of DRE and CE. Appendix G describes the method used to calculate the vent gas composition and flow rate from the TRC and Zink measurements. The exits of the steam- and air-assisted flare burners were 13 and 33 feet above ground level, respectively.

TCEQ 2010 Flare Study The University of Texas at Austin 53 August 1, 2011 The Center for Energy & Environmental Resources
Figure 4-3. Flare Burners. Air-assisted on left and steam-assisted on right
Figure 4-4. Vent Gas Supply. Piping for flow control, mixing and measurement of the vent gas supply

TCEQ 2010 Flare Study The University of Texas at Austin 54 August 1, 2011 The Center for Energy & Environmental Resources
Figure 4-5. Control Room for the Flare Test System
Figure 4-6. Control Room Display. Monitor displayed Zink measurement of flare operating parameters (top left), LSI’s FLIR and IR video (right half) and ARI’s flare emissions measurements (bottom left)

TCEQ 2010 Flare Study The University of Texas at Austin 55 August 1, 2011 The Center for Energy & Environmental Resources
Flare Plume Sampling System The primary component of the Flare Plume Sampling System (Figure 4-7) was the sample collector. The goal of this sample collector (Figure 4-8) was to determine the “plume average” DRE and CE for a given set of flare operating conditions. It was not to determine the instantaneous combustion efficiency at a given point in the active combustion zone of the plume. Therefore, the sampler collector was designed to continuously draw as large a sample of the plume as possible, homogenize the sample and then obtain a sample of this well mixed portion of the plume for analysis.
Figure 4-7. Flare Plume Sampling System. Plume sampling system making measurements of flare plume while held in position by crane and ground crew The sample collector was moved into position so that during a test it was located approximately in the center of the flare plume at a distance far enough downwind from the flare tip to ensure that combustion reactions had ceased and with the face of the inlet oriented perpendicular to the travel of the plume. The method used as the gauge to know that the collector inlet was past the

TCEQ 2010 Flare Study The University of Texas at Austin 56 August 1, 2011 The Center for Energy & Environmental Resources
combustion zone was to position the inlet to the sample collector so that the plume temperature at the inlet was 250°F or less, as measured by three thermocouples in the inlet to the sample collector. The position of the sample collector at the midpoint of the plume was facilitated using the visual, two FLIR and one IR video camera images (Figure 4-6) filmed by Leak Surveys, Inc. (LSI) and the temperature of the flare plume as it entered the sample collector. The two FLIR cameras were positioned to view the flame approximately perpendicular to the plume and coincident with the wind direction. The eductor (Figure 4-8) of the sample collector would continuously draw approximately 1950 cfm of flare plume through the collector. The inlet of the sample collector was 20 inches in diameter with an effective draw of more than 24 inches in diameter. A mixing and flow conditioning section at the entrance to the sample collector would mix and then straighten the flow prior to reaching ARI’s and TRC’s sampling probes. Samples (approximately 1 liter per minute for the vent gas sample line and 8 liters per minute for plume sample line) would be continuously drawn through the sample lines to the analyzers and instruments in each company’s mobile laboratory trailers (Figure 4-8). Draw of the samples began at the start of testing in the morning and continue until the lunch break. This draw would start again before testing began in the afternoon and continue until the end of test day.
Figure 4-8. Sample Collector at Near Ground Level. Collector inlet is at foreground and eductor is at far end. In photo, Zink personnel make adjustments to heated transfer line supports. Shackles and cable at center allow crane to lift and position Sample Collector.

TCEQ 2010 Flare Study The University of Texas at Austin 57 August 1, 2011 The Center for Energy & Environmental Resources
The height of the sample collector inlet was tracked using a graduated chain attached to the sample collector. Zink personnel on the ground would also report the radial distance from the inlet of the sample collector to the center of the flare burner to the control room, where it would be logged. ARI also tracked the position of the inlet to the sample collector using a global positioning system (GPS) attached to the sample collector. TRC used gas chromatography to analyze both flare stack and plume gases (methane, ethane and propylene). Two grab samples were collected per test run, 5 minutes apart. Flare plume constituents (CO, CO2, O2, speciated VOCs, HCHO, NOx, particulate matter and THC) were measured continuously (1 Hz) by ARI using their mobile laboratory, which has two dual quantum cascade laser instruments and several LiCOR non-dispersive infrared sensor instruments. Destruction removal and combustion efficiencies were calculated based on the measurements of TRC (vent gas) and the ARI (flare plume) measurements using the carbon content of the constituents in the vent gas and flare plume. A detailed description of the method used to calculate the DRE and CE by ARI is included in Appendix I. A discussion of the accuracy and precision of these values is presented in Section 6.0. Meteorology measurements, i.e., wind speed, direction, temperature, and barometric pressure, were made to characterize the speed and direction of the cross wind at the exit of the flare burners. These measurements were made by ARI (Figure 4-9).

TCEQ 2010 Flare Study The University of Texas at Austin 58 August 1, 2011 The Center for Energy & Environmental Resources
Figure 4-9. Meteorology System Method for Measurement of Flare Emissions and Calculation of DRE and CE This section describes the methodology used to compute DRE and CE from the time series of measurements on the sample line. A more detailed description of this derivation can be found in Appendix I. The discussion of the sources of error in this approach is outlined in Section 7. The purpose of the description here is to go through an event analysis and describe the computational steps. The two fundamental characteristics of interest in this test are DRE and CE. The equations that define these quantities have been discussed previously, Equation 1.1 and 1.2. Appendix I derives an alternative form of Equation 1.1, labeled here as Equation 4.1
!"#/100 = 1−
!"#!$%&'&!"# !"#$%&!!"# !"#$%&
!"#!$%&'&!" !"#$%&!!" !"#$%&
= 1− !"!"#!$%&'& !"#!"!"#!$%&'& !" Eq. 4.1

TCEQ 2010 Flare Study The University of Texas at Austin 59 August 1, 2011 The Center for Energy & Environmental Resources
where CFpropylene (in) is based on the fraction of carbon found as propylene in the vent gas mixture, i.e., the carbon fraction of propylene. The carbon fraction of any species in a mixture is the ratio of the amount of carbon present in the species to the total amount of carbon present in the mixture. Nominally, in the 80% propylene, 20% TNG mixture this can be approximated as
!"!"#!$%&'& !" = !"#!$%&'& (!!"#)
!"#!$%&'& !!"# +!"#ℎ!"# !!"# + !"ℎ!" !"#$%& (!!"#)
Eq. 4.2 or
!"!"#!$%&'& !" = 3 ∗ 0.8
3 ∗ 0.8 + 1 ∗ 0.2 + !"ℎ!" !"#$%& (!!"#) ≈ 0.923 Eq. 4.3
where the contribution of other carbon constituents in the Tulsa Natural Gas are considered to be negligible. Note that for the actual computation of DRE, the measurement of the vent gas composition has been used, the example above is used for illustration. The other term required for DRE evaluation using Equation 4.1 is the CFpropylene (out) term. In this case, the combustion has occurred and species such as CO2 and CO are significant in the carbon fraction term.
!"!"#!"#$%$ = !"#!$%&'& (!!"#)
!"#!$%&'& !!"# + !"! + !" + !"ℎ!" !"#$%& (!!"#) Eq. 4.4
It will be illustrative to demonstrate how CFpropylene (out) is calculated for one of the test conditions. As a prelude to the calculation, however, it is important to examine the event from some simple metrics to be sure that the sample collector is sampling the flare plume. The first detail to be examined is the relationship between the temperature of the incoming sample and the relationship with the 1 Hz CO2 measurement, presuming this is the dominant product of the flare’s combustion. During every test series, ARI would continuously extract a sample from the portion of the flare plume drawn through the sample collector using a probe that would dilute the sample with pure dry nitrogen immediately as it entered the probe tip. Sample collection would begin well before a test series was conducted. Figure 4-10, shows a time series of the sample collector inlet temperature and CO2 concentration of the sample obtained by the dilution probe.
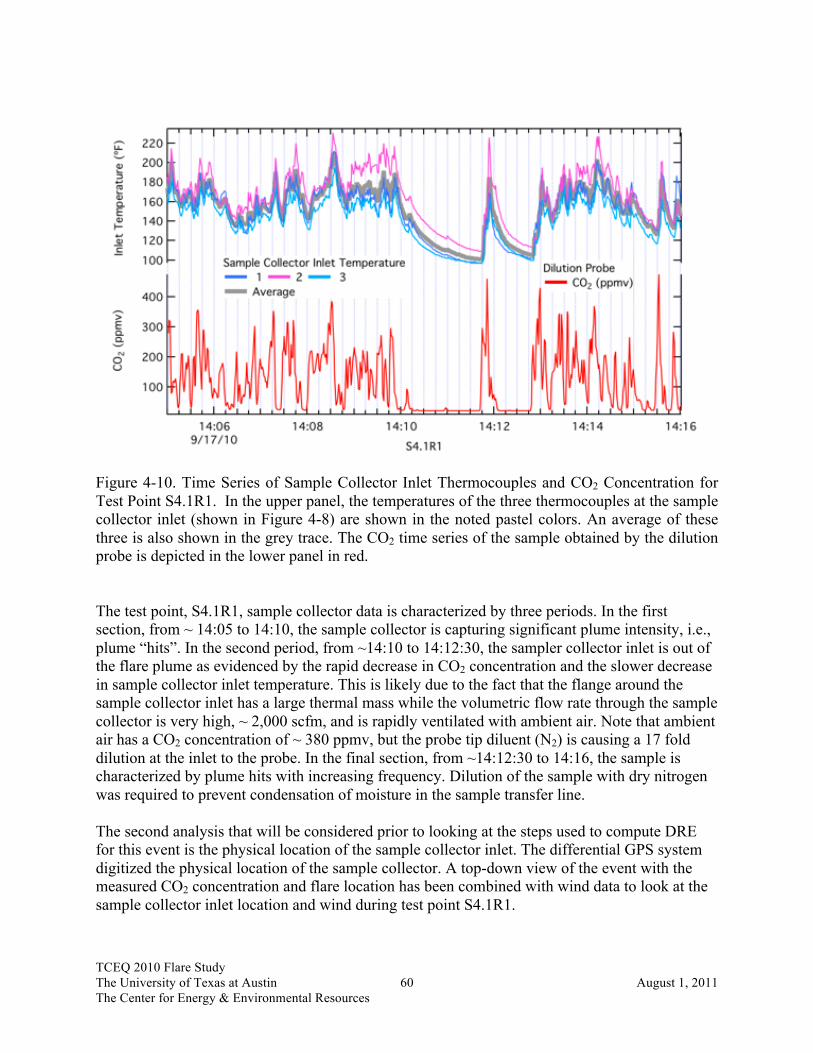
TCEQ 2010 Flare Study The University of Texas at Austin 60 August 1, 2011 The Center for Energy & Environmental Resources
Figure 4-10. Time Series of Sample Collector Inlet Thermocouples and CO2 Concentration for Test Point S4.1R1. In the upper panel, the temperatures of the three thermocouples at the sample collector inlet (shown in Figure 4-8) are shown in the noted pastel colors. An average of these three is also shown in the grey trace. The CO2 time series of the sample obtained by the dilution probe is depicted in the lower panel in red. The test point, S4.1R1, sample collector data is characterized by three periods. In the first section, from ~ 14:05 to 14:10, the sample collector is capturing significant plume intensity, i.e., plume “hits”. In the second period, from ~14:10 to 14:12:30, the sampler collector inlet is out of the flare plume as evidenced by the rapid decrease in CO2 concentration and the slower decrease in sample collector inlet temperature. This is likely due to the fact that the flange around the sample collector inlet has a large thermal mass while the volumetric flow rate through the sample collector is very high, ~ 2,000 scfm, and is rapidly ventilated with ambient air. Note that ambient air has a CO2 concentration of ~ 380 ppmv, but the probe tip diluent (N2) is causing a 17 fold dilution at the inlet to the probe. In the final section, from ~14:12:30 to 14:16, the sample is characterized by plume hits with increasing frequency. Dilution of the sample with dry nitrogen was required to prevent condensation of moisture in the sample transfer line. The second analysis that will be considered prior to looking at the steps used to compute DRE for this event is the physical location of the sample collector inlet. The differential GPS system digitized the physical location of the sample collector. A top-down view of the event with the measured CO2 concentration and flare location has been combined with wind data to look at the sample collector inlet location and wind during test point S4.1R1.
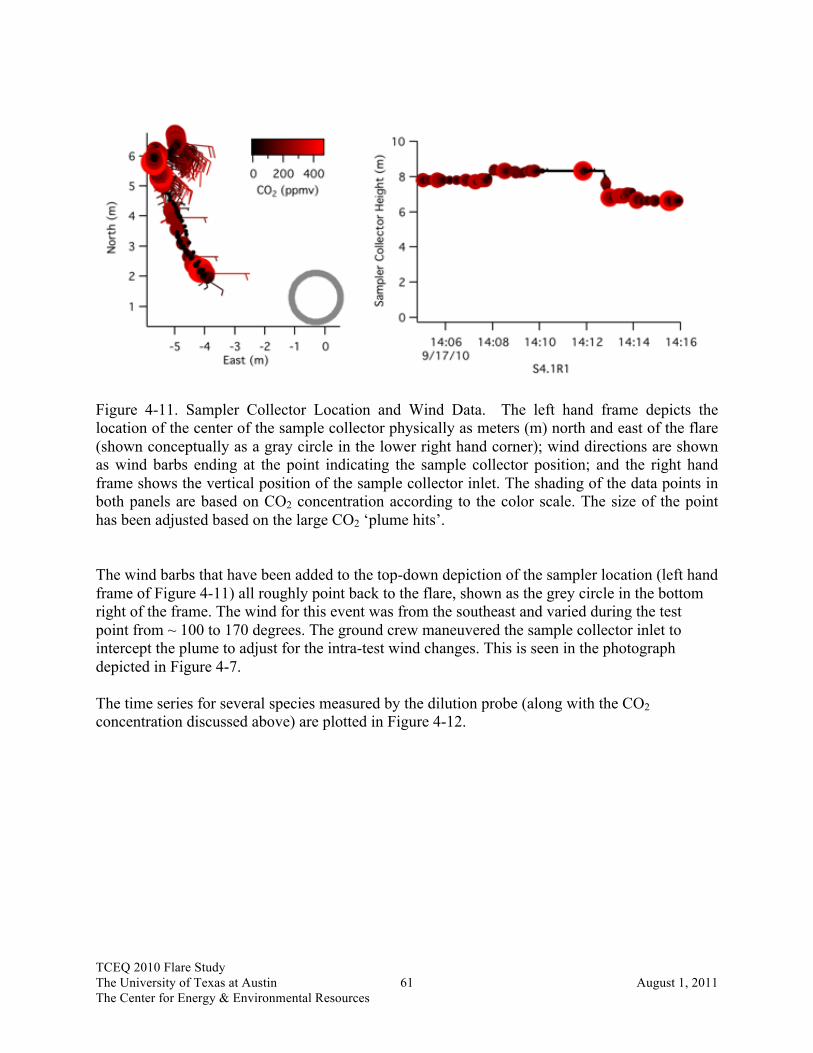
TCEQ 2010 Flare Study The University of Texas at Austin 61 August 1, 2011 The Center for Energy & Environmental Resources
Figure 4-11. Sampler Collector Location and Wind Data. The left hand frame depicts the location of the center of the sample collector physically as meters (m) north and east of the flare (shown conceptually as a gray circle in the lower right hand corner); wind directions are shown as wind barbs ending at the point indicating the sample collector position; and the right hand frame shows the vertical position of the sample collector inlet. The shading of the data points in both panels are based on CO2 concentration according to the color scale. The size of the point has been adjusted based on the large CO2 ‘plume hits’. The wind barbs that have been added to the top-down depiction of the sampler location (left hand frame of Figure 4-11) all roughly point back to the flare, shown as the grey circle in the bottom right of the frame. The wind for this event was from the southeast and varied during the test point from ~ 100 to 170 degrees. The ground crew maneuvered the sample collector inlet to intercept the plume to adjust for the intra-test wind changes. This is seen in the photograph depicted in Figure 4-7. The time series for several species measured by the dilution probe (along with the CO2 concentration discussed above) are plotted in Figure 4-12.
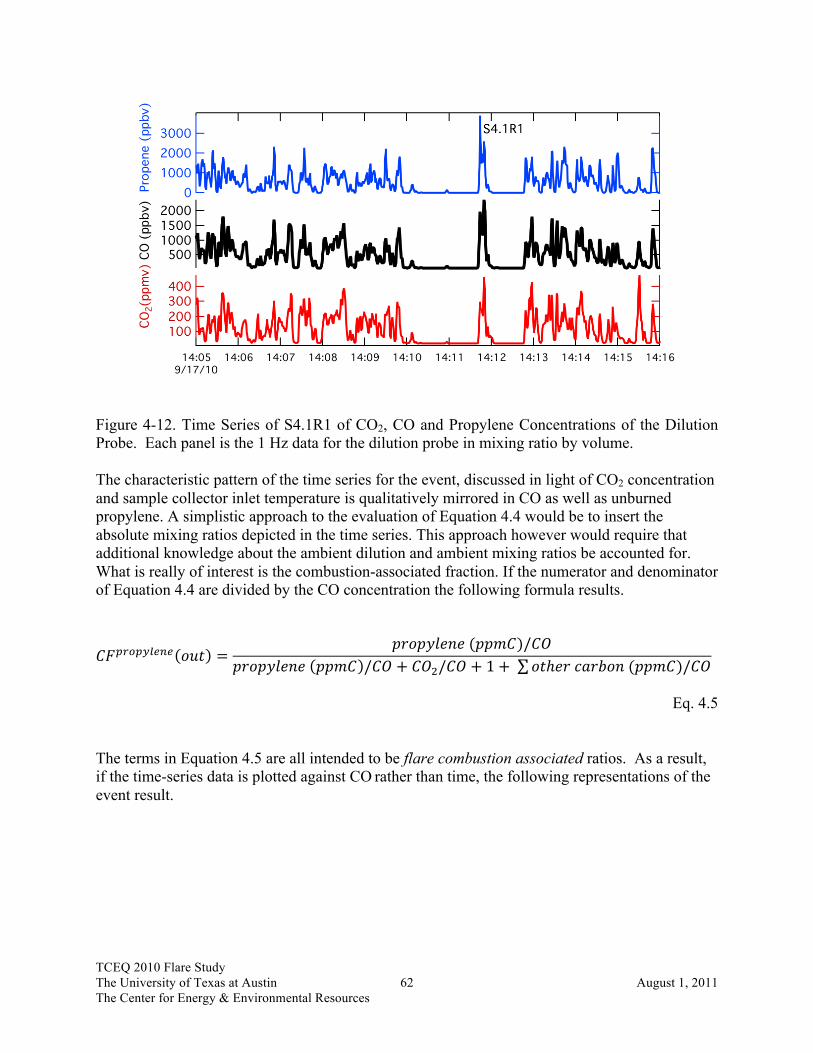
TCEQ 2010 Flare Study The University of Texas at Austin 62 August 1, 2011 The Center for Energy & Environmental Resources
Figure 4-12. Time Series of S4.1R1 of CO2, CO and Propylene Concentrations of the Dilution Probe. Each panel is the 1 Hz data for the dilution probe in mixing ratio by volume. The characteristic pattern of the time series for the event, discussed in light of CO2 concentration and sample collector inlet temperature is qualitatively mirrored in CO as well as unburned propylene. A simplistic approach to the evaluation of Equation 4.4 would be to insert the absolute mixing ratios depicted in the time series. This approach however would require that additional knowledge about the ambient dilution and ambient mixing ratios be accounted for. What is really of interest is the combustion-associated fraction. If the numerator and denominator of Equation 4.4 are divided by the CO concentration the following formula results.
!"!"#!$%&'& !"# =!"#!$%&'& (!!"#)/!"
!"#!$%&'& !!"# /!" + !"!/!" + 1+ !"ℎ!" !"#$%& (!!"#)/!"
Eq. 4.5 The terms in Equation 4.5 are all intended to be flare combustion associated ratios. As a result, if the time-series data is plotted against CO rather than time, the following representations of the event result.

TCEQ 2010 Flare Study The University of Texas at Austin 63 August 1, 2011 The Center for Energy & Environmental Resources
Figure 4-13. Propylene and CO2 Concentrations Relative to CO Concentration in the Combustion-Associated Plume Intercept. The relationship between the propylene and CO concentrations (left hand side of Figure 4-13) for the totality of event S4.1R1 is characterized by a linear slope of 1.19 ± 0.04 moles per mole, where the uncertainty is the 2 <sigma> precision determined from the fit assuming a normal distribution of error in the propylene measurement. The Pearson’s R2 statistic for this fit is 0.84. When the value is used in Equation 4.5, it must be converted to a ratio of ppmC, which in the case of propylene means multiplying by 3 to account for the three carbon atoms in propylene (e.g., 3.57 ± 0.12). The relationship between the CO2 and CO concentrations (right hand side of Figure 4-13) is evaluated using a linear fit with slope 206 ± 4 ppmC per ppmC. The Pearsons R2 for this fit is 0.89. As a first step in the pursuit of evaluating Equation 4.5 and eventually DRE for this test point, these combustion-associated slopes will be used to evaluate Equation 4.5 using only three chemical forms for carbon (propylene, CO, CO2).
!"!"#!$%&'& !"# = (3.57 ± 0.12)
(3.57 ± 0.12)+ 206 ± 4 + 1 = 1.69 ± 0.06 % Eq. 4.5a
Assuming there is no other form of carbon, the evaluation of Equation 4.5a, suggests that propylene in the flare plume is 1.69% of the total carbon considered in this example.

TCEQ 2010 Flare Study The University of Texas at Austin 64 August 1, 2011 The Center for Energy & Environmental Resources
Figure 4-14. Time Series for CO Concentration and Other Trace Selected Hydrocarbons Species. The measurements of the dilution probe for test point S4.1R1 for ethene (C2H4), ethyne (C2H2), formaldehyde (HCHO) and methane (CH4). Time series data for this event for other trace forms of carbon in the matrix are depicted in Figure 4-14. Note that CO concentration has been repeated for reference from the previous figures. The relationship of the trace hydrocarbon concentration relative to CO concentration is summarized in Figure 4-15.

TCEQ 2010 Flare Study The University of Texas at Austin 65 August 1, 2011 The Center for Energy & Environmental Resources
Figure 4-15. Correlation of Trace Hydrocarbon Concentration with CO Concentration for S4.1R1. The results of the fit parameters depicted by the red lines in each panel are tabulated in ppmC below.
Table 4-1. Fit Parameters for Selected Trace Hydrocarbons for S4.1R1
Species ppmC/ppmC CO 2 <sigma> R2 Influence on CF for S4.1R1 CH4 0.45 0.01 0.87 0.2% C2H4 0.212 0.004 0.95 0.1%
HCHO 0.0767 0.0001 0.96 0.03% C2H2 0.050 0.002 0.92 0.02%
The carbon fraction that results from including these trace species in the denominator of Equation 4.5 (the sum of ‘other’ carbon) is unchanged within the precision based error band, CFpropylene (out) = 1.69%. Using the nominal 80/20 propylene/TNG mixture, it is estimated that
TCEQ 2010 Flare Study The University of Texas at Austin 66 August 1, 2011 The Center for Energy & Environmental Resources
CFpropylene (in) = 92.3%. This implies the DRE for this test point, based on the definition in Equation 4.1 is 1 – 1.69/92.3 or 98.17% (98.10 - 98.23%). An analogous form of the combustion efficiency equation can be derived. Additional discussion of the sources of systematic error in this approach will be discussed in Section 7. The reader is also referred to Appendix I for additional information. Remote Sensing Technologies Remote sensing technologies were also included in this study to measure CE (IMACC and Telops) and/or flare emissions (Telops). The measurements made by the remote sensing technologies will be compared to the measurements made by ARI to assess and evaluate the performance of the remote sensing technologies (see Section 8.0).

TCEQ 2010 Flare Study The University of Texas at Austin 67 August 1, 2011 The Center for Energy & Environmental Resources
5.0 Results of Flare Tests The field tests were performed during the month of September 2010 at the Zink flare test facility in Tulsa, Oklahoma. The test plan (Appendix A) identified 56 test points, including replicates, to be performed on each of the air- and steam-assisted flares. Because of favorable weather conditions and more rapid than anticipated completion of test conditions, a larger number of test points than originally planned were completed. The actual number of test points and replicates that were performed were almost twice the number of steam test points and 27% more air test points than originally planned. These additional test points included tests using propane in place of propylene. Propane was not included in the original test plan. Summaries of the test results follow. Summaries of all test data for the steam and air flare tests are included in Appendices D and E, respectively. The values for DRE and CE are presented in this report using three significant figures based on the probable uncertainty in these measurements as explained in Section 7 of this report. The standard deviation, δ, for the ARI DRE & CE values and for the CE values reported by the remote sensing contractors are also included in Tables D-1 and E-1 in Appendices D and E, respectively. In these summaries, the terms steam-to-vent gas ratio (S/VG) and momentum flux ratio (MFR) are included to help characterize the flare operating parameters and are defined as follows.
!/!" = !"#$% !"#$"% !"#$ !""#$ !"#$% !""#"$ !"#$ !"#$ (!"/!!)!"#$ !"# !"#$ !"#$ (!"/!!)
Eq. 5.1
!"# = !!"#∙ !!"#!
!!"# ∙ !!"#$! Eq. 5.2
where: !!"# = !"#$%&'(") !"#$ !"# !"#$%&', !"/!"3 !!"# = !"#$%&'(") !"#$ !"# !"#$%&'(, !"/ℎ! !!"# = !"#$%&' !"# !"#$%&', !"/!"3 !!"#$ = !"#$ !"#$%&'(, !"/ℎ! The S/VG and the MFR are dimensionless quantities as the units in the numerator and denominator cancel out in both terms. Also, in the graphs that follow where test series are shown on a graph, i.e., multiple test points and run, the values on the axes and in the legend are typical or nominal values for the test series. In the following narrative where data is discussed for a specific test point and run, the actual values obtained for the test point and run are cited.

TCEQ 2010 Flare Study The University of Texas at Austin 68 August 1, 2011 The Center for Energy & Environmental Resources
Steam-Assisted Flare: DRE (propylene) and CE
Please refer to Figures 5-10a and 5-10b. At a total steam assist flow rate of 970 lb/hr (S/VG = 1.04 and center steam = 540 lb/hr) for a vent gas LHV of 349 Btu/scf and constant flow rate of 930 lb/hr, the DRE (propylene) was 38.1% (S3.1 R1). No higher steam assist levels were performed at this combination of flare operating parameters since the DRE was already below 50%. The CE for this test point/run was 34.3%. The average wind speed during this test point/run was 2.6 mph. The MFR for this test point/run was 0.005. At a total steam assist flow rate of 666 lb/hr (S/VG = 0.29, center steam = 555 lb/hr) for a vent gas LHV of 349 Btu/scf and constant flow rate of 2,335 lb/hr, the DRE (propylene) was 99.2% (S4.2 R3). Total steam assist levels greater than 666 lb/hr produced DREs below 99.2%. The CE for this test point/run was 98.9%. The average wind speed during this test point/run was 4.8 mph. The MFR for this test point/run was 0.092. Please refer to Figures 5-11a and 5-11b. At a total steam assist flow rate of 228 lb/hr (S/VG = 0.25, center steam = 0 lb/hr) for a vent gas LHV of 346 Btu/scf and constant flow rate of 926 lb/hr, the DRE (propylene) was 99.5% (S3.7 R1). Total steam assist levels greater than 228 lb/hr produced DREs below 99.5%. The CE for this test point/run was 99.3%. The average wind speed during this test point/run was 7.1 mph. When the total steam assist was reduced to zero (S3.6 R1), the DRE (propylene) was 99.9% and the CE was 99.8% for this test point/run. The average wind speed during this test point/run was 7.3 mph. The MFR for this test point/run was 0.003. At a total steam assist flow rate of 327 lb/hr (S/VG = 0.14, center steam = 0 lb/hr) for a vent gas LHV of 363 Btu/scf and constant flow rate of 2,372 lb/hr, the DRE (propylene) was 98.3% (S4.4 R1). The CE for this test point/run was 97.6%. The average wind speed during this test point/run was 5.9 mph. The MFR for this test point/run was 0.032.

TCEQ 2010 Flare Study The University of Texas at Austin 69 August 1, 2011 The Center for Energy & Environmental Resources
Figure 5-10a. DRE vs Steam Assist for Test Series S3 and S4
Figure 5-10b. CE vs Steam Assist for Test Series S3 and S4
20
30
40
50
60
70
80
90
100
0 1,000 2,000 3,000 4,000
DRE -‐ P
ropylene
(%)
Total Steam Assist (lb/hr) (Center Steam Constant @ 550 lb/hr)
DRE (Propylene) for Test Series S3 & S4 LHV = 350 Btu/scf, Constant Vent Gas Flow Rate
Vent Gas = 920 lb/hr (S3)
Vent Gas = 2,342 lb/hr (S4)
20
30
40
50
60
70
80
90
100
0 1,000 2,000 3,000 4,000
CE (%
)
Total Steam Assist (lb/hr) (Center Steam Constant @ 550 lb/hr)
CE for Test Series S3 & S4 LHV = 350 Btu/scf, Constant Vent Gas Flow Rate
Vent Gas = 920 lb/hr (S3)
Vent Gas = 2,342 lb/hr (S4)

TCEQ 2010 Flare Study The University of Texas at Austin 70 August 1, 2011 The Center for Energy & Environmental Resources
Figure 5-11a. DRE vs Steam Assist for Test Series S3 and S4 (Special - No Center Steam)
Figure 5-11b. CE vs Steam Assist for Test Series S3 and S4 (Special - No Center Steam)
20 30 40 50 60 70 80 90 100
0 100 200 300 400 500 600
DRE -‐ P
ropylene
(%)
Total Steam Assist (lb/hr)
DRE (Propylene) for Extra S3 & S4 Test Points where Center Steam <= 110 lb/hr
LHV = 350 Btu/scf, Constant Vent Gas Flow Rate
Vent Gas = 920 lb/hr, Center Steam = 0 lb/hr (S3)
Vent Gas = 2,372 lb/hr, Center Steam = 0 lb/hr (S4)
Vent Gas = 920 lb/hr, Center Steam = 50 to 110 lb/hr (S3)
20
30
40
50
60
70
80
90
100
0 100 200 300 400 500 600
CE (%
)
Total Steam Assist (lb/hr))
CE for Extra S3 & S4 Test Points where Center Steam <= 110 lb/hr
LHV = 350 Btu/scf, Constant Vent Gas Flow Rate
Vent Gas = 920 lb/hr, Center Steam = 0 lb/hr (S3)
Vent Gas = 2342 lb/hr, Center Steam = 0 lb/hr (S4)
Vent Gas = 920 lb/hr, Center Steam = 50 to 110 lb/hr (S3)

TCEQ 2010 Flare Study The University of Texas at Austin 71 August 1, 2011 The Center for Energy & Environmental Resources
Please refer to Figures 5-12a and 5-12b. These two figures are composites of the data for all test points from Test Series S3 and S4 shown in the previous four figures. These graphs illustrate and compare the effect increasing steam rate has on DRE and CE at a LHV of approximately 350 Btu/scf for these two vent gas flow rates. Note that for the lower vent gas flow rate, the DRE and CE begin to decrease at a lower steam assist value, i.e., approximately 1,000 lb/hr vs 300 lb/hr total steam assist.
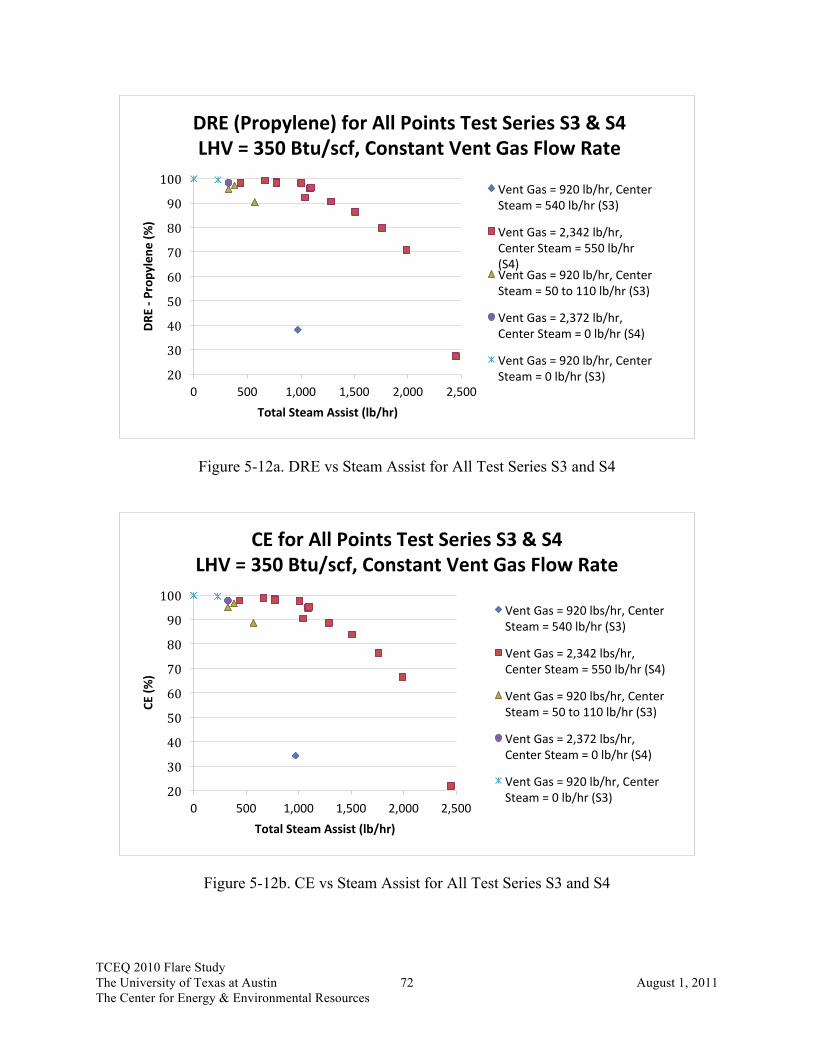
TCEQ 2010 Flare Study The University of Texas at Austin 72 August 1, 2011 The Center for Energy & Environmental Resources
Figure 5-12a. DRE vs Steam Assist for All Test Series S3 and S4
Figure 5-12b. CE vs Steam Assist for All Test Series S3 and S4
20
30
40
50
60
70
80
90
100
0 500 1,000 1,500 2,000 2,500
DRE -‐ P
ropylene
(%)
Total Steam Assist (lb/hr)
DRE (Propylene) for All Points Test Series S3 & S4 LHV = 350 Btu/scf, Constant Vent Gas Flow Rate
Vent Gas = 920 lb/hr, Center Steam = 540 lb/hr (S3)
Vent Gas = 2,342 lb/hr, Center Steam = 550 lb/hr (S4) Vent Gas = 920 lb/hr, Center Steam = 50 to 110 lb/hr (S3)
Vent Gas = 2,372 lb/hr, Center Steam = 0 lb/hr (S4)
Vent Gas = 920 lb/hr, Center Steam = 0 lb/hr (S3)
20
30
40
50
60
70
80
90
100
0 500 1,000 1,500 2,000 2,500
CE (%
)
Total Steam Assist (lb/hr)
CE for All Points Test Series S3 & S4 LHV = 350 Btu/scf, Constant Vent Gas Flow Rate
Vent Gas = 920 lbs/hr, Center Steam = 540 lb/hr (S3)
Vent Gas = 2,342 lbs/hr, Center Steam = 550 lb/hr (S4)
Vent Gas = 920 lbs/hr, Center Steam = 50 to 110 lb/hr (S3)
Vent Gas = 2,372 lbs/hr, Center Steam = 0 lb/hr (S4)
Vent Gas = 920 lb/hr, Center Steam = 0 lb/hr (S3)

TCEQ 2010 Flare Study The University of Texas at Austin 73 August 1, 2011 The Center for Energy & Environmental Resources
Please refer to Figure 5-13a and 5-13b. At a total steam assist flow rate of 768 lb/hr (S/VG = 0.82, center steam = 488 lb/hr) for a vent gas LHV of 594 Btu/scf and constant flow rate of 940 lb/hr, the DRE (propylene) was 98.3% (S5.1 R1) or less. Total steam assist levels greater than about 768 lb/hr produced DREs below 98.3%. The CE for this test point/run was 98.0%. The average wind speed during this test point/run was 8.0 mph. The MFR for this test point/run was 0.008. At a total steam assist flow rate of 1,529 lb/hr (S/VG = 0.63, center steam = 510 lb/hr) for a vent gas LHV of 625 Btu/scf and constant flow rate of 2,423 lb/hr, the DRE (propylene) was 99.3% (S6.1 Run 3). Total steam assist levels greater than about 1,529 lb/hr produced DREs below 99.3%. The CE for this test point/run is 98.9%. The average wind speed during this test point/run was 7.5 mph. The MFR for this test point/run was 0.032.
DRE (Propylene) and CE vs Steam-to-Vent Gas Ratio (S/VG)
Please refer to Figure 5-14a, 5-14b, 5-15a and 5-15b. DRE (Propylene) vs S/VG for all test points in Test Series S3 and S4 is shown in Figures 5-14a and 5-15a. Figures 5-14b and 5-15b show CE vs S/VG for the same test points. Figures 5-15a and 5-15b are provided to focus on a smaller DRE range to provide greater resolution between data points for easier analysis. Please refer to Figure 5-16a, 5-16b, 5-17a and 5-17b. DRE (Propylene) vs S/VG for all test points in Test Series S5 and S6 is shown in Figures 5-16a and 5-17a. Figures 5-16b and 5-17b show CE vs S/VG for the same test points. Figures 5-17a and 5-17b are provided to focus on a smaller DRE range to provide greater resolution between data points for easier analysis.
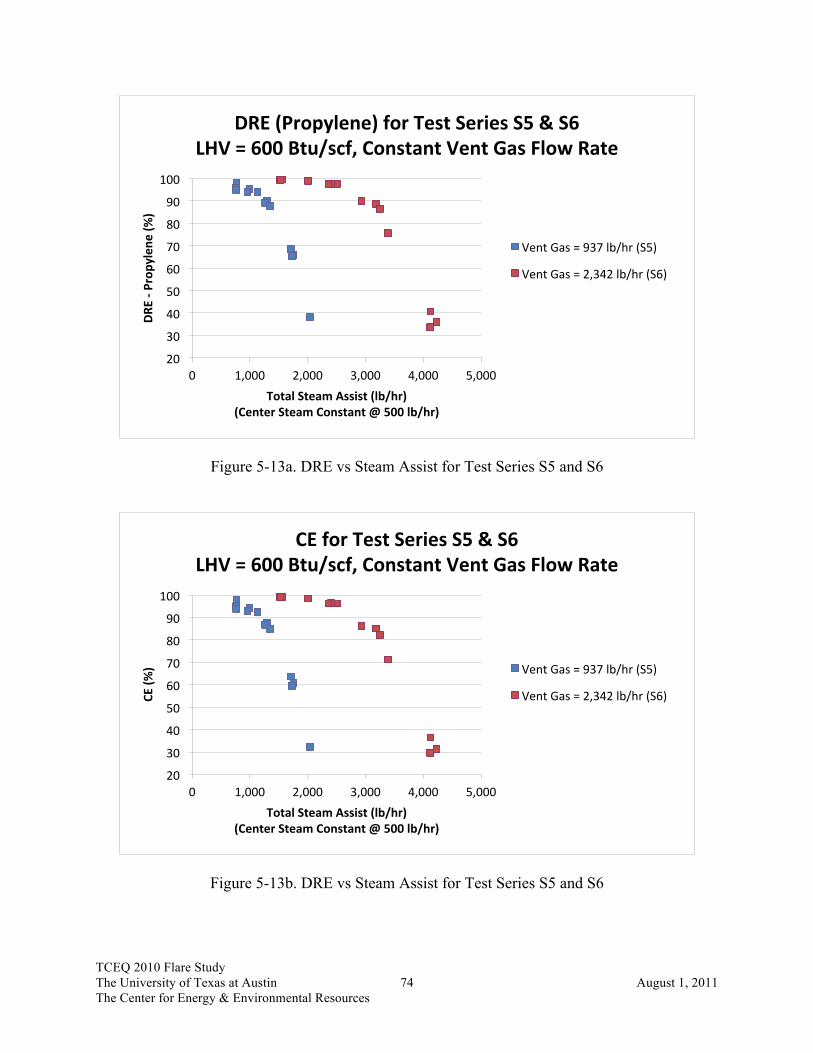
TCEQ 2010 Flare Study The University of Texas at Austin 74 August 1, 2011 The Center for Energy & Environmental Resources
Figure 5-13a. DRE vs Steam Assist for Test Series S5 and S6
Figure 5-13b. DRE vs Steam Assist for Test Series S5 and S6
20
30
40
50
60
70
80
90
100
0 1,000 2,000 3,000 4,000 5,000
DRE -‐ P
ropylene
(%)
Total Steam Assist (lb/hr) (Center Steam Constant @ 500 lb/hr)
DRE (Propylene) for Test Series S5 & S6 LHV = 600 Btu/scf, Constant Vent Gas Flow Rate
Vent Gas = 937 lb/hr (S5)
Vent Gas = 2,342 lb/hr (S6)
20
30
40
50
60
70
80
90
100
0 1,000 2,000 3,000 4,000 5,000
CE (%
)
Total Steam Assist (lb/hr) (Center Steam Constant @ 500 lb/hr)
CE for Test Series S5 & S6 LHV = 600 Btu/scf, Constant Vent Gas Flow Rate
Vent Gas = 937 lb/hr (S5)
Vent Gas = 2,342 lb/hr (S6)

TCEQ 2010 Flare Study The University of Texas at Austin 75 August 1, 2011 The Center for Energy & Environmental Resources
Figure 5-14a. DRE vs Steam-to-Vent Gas Ratio for All Test Series S3 and S4
Figure 5-14b. CE vs Steam-to-Vent Gas Ratio for All Test Series S3 and S4
20
30
40
50
60
70
80
90
100
0.00 0.50 1.00 1.50
DRE -‐ P
ropylene
(%)
Steam-‐to-‐Vent Gas RaNo (lb/lb)
DRE (Propylene) vs Steam-‐to-‐Vent Gas RaNo for Test Series S3 and S4
DRE for Test Series S3 and S4
20
30
40
50
60
70
80
90
100
0.00 0.50 1.00 1.50
CE (%
)
Steam-‐to-‐Vent Gas RaNo (lb/lb)
CE vs Steam-‐to-‐Vent Gas RaNo for Test Series S3 and S4
CE for Test Series S3 and S4

TCEQ 2010 Flare Study The University of Texas at Austin 76 August 1, 2011 The Center for Energy & Environmental Resources
Figure 5-15a. DRE vs Steam-to-Vent Gas Ratio for All Test Series S3 and S4 (Note DRE (Propylene) range = 84 to 100%)
Figure 5-15b. CE vs Steam-to-Vent Gas Ratio for All Test Series S3 and S4 (Note CE range = 84 to 100%)
84.0
86.0
88.0
90.0
92.0
94.0
96.0
98.0
100.0
0.00 0.20 0.40 0.60 0.80
DRE -‐ P
ropylene
(%)
Steam-‐to-‐Vent Gas RaNo (lb/lb)
DRE (Propylene) vs Steam-‐to-‐Vent Gas RaNo for Test Series S3 and S4
DRE for Test Series S3 and S4
84
86
88
90
92
94
96
98
100
0.00 0.20 0.40 0.60 0.80
CE (%
)
Steam-‐to-‐Vent Gas RaNo (lb/lb)
CE vs Steam-‐to-‐Vent Gas RaNo for Test Series S3 and S4
CE for Test Series S3 and S4
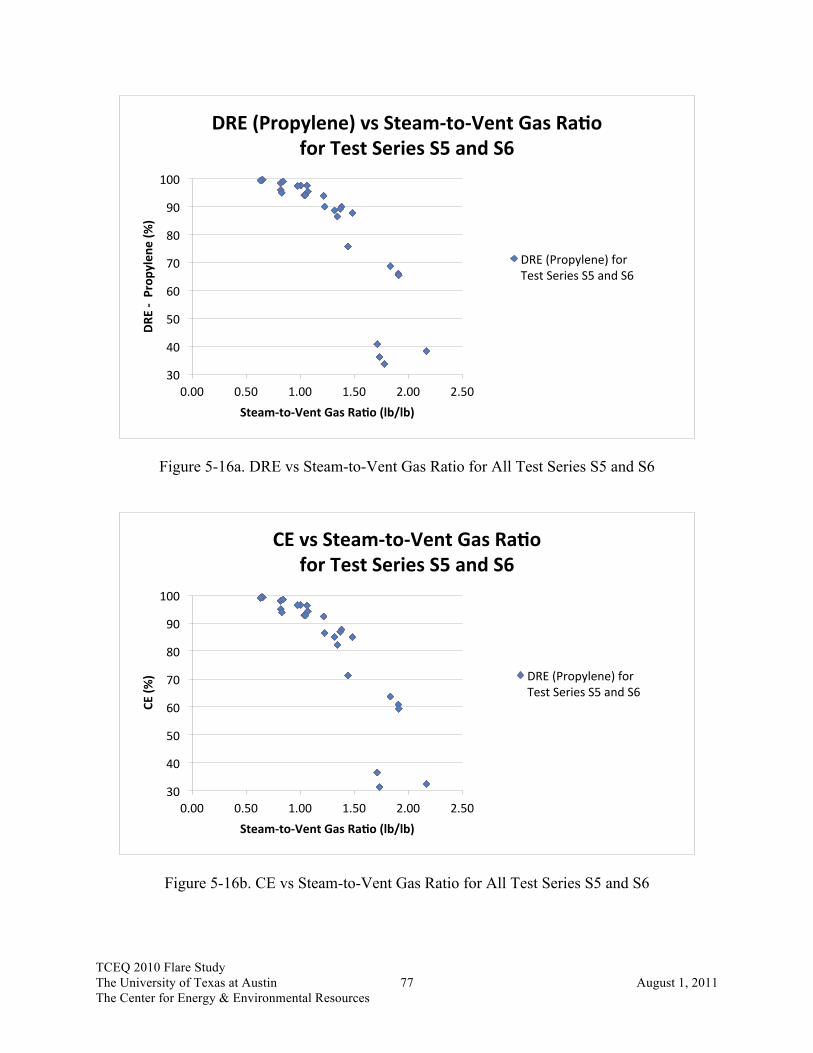
TCEQ 2010 Flare Study The University of Texas at Austin 77 August 1, 2011 The Center for Energy & Environmental Resources
Figure 5-16a. DRE vs Steam-to-Vent Gas Ratio for All Test Series S5 and S6
Figure 5-16b. CE vs Steam-to-Vent Gas Ratio for All Test Series S5 and S6
30
40
50
60
70
80
90
100
0.00 0.50 1.00 1.50 2.00 2.50
DRE -‐ Prop
ylen
e (%
)
Steam-‐to-‐Vent Gas RaNo (lb/lb)
DRE (Propylene) vs Steam-‐to-‐Vent Gas RaNo for Test Series S5 and S6
DRE (Propylene) for Test Series S5 and S6
30
40
50
60
70
80
90
100
0.00 0.50 1.00 1.50 2.00 2.50
CE (%
)
Steam-‐to-‐Vent Gas RaNo (lb/lb)
CE vs Steam-‐to-‐Vent Gas RaNo for Test Series S5 and S6
DRE (Propylene) for Test Series S5 and S6
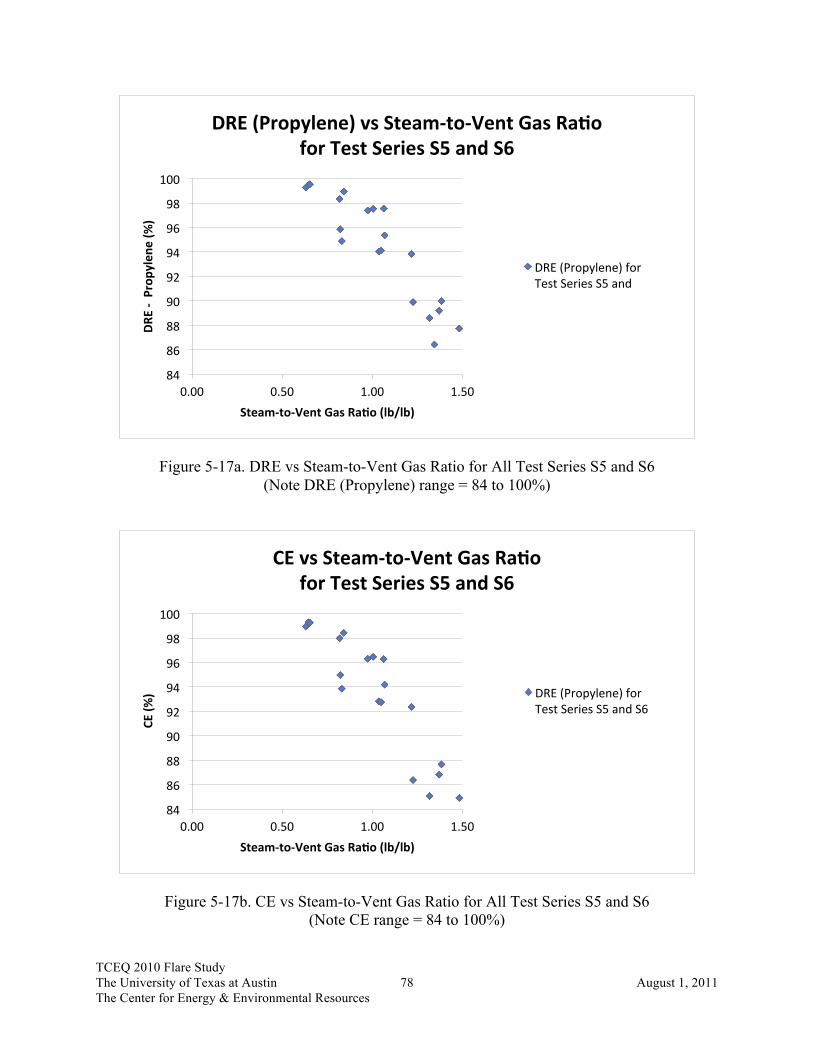
TCEQ 2010 Flare Study The University of Texas at Austin 78 August 1, 2011 The Center for Energy & Environmental Resources
Figure 5-17a. DRE vs Steam-to-Vent Gas Ratio for All Test Series S5 and S6 (Note DRE (Propylene) range = 84 to 100%)
Figure 5-17b. CE vs Steam-to-Vent Gas Ratio for All Test Series S5 and S6 (Note CE range = 84 to 100%)
84
86
88
90
92
94
96
98
100
0.00 0.50 1.00 1.50
DRE -‐ Prop
ylen
e (%
)
Steam-‐to-‐Vent Gas RaNo (lb/lb)
DRE (Propylene) vs Steam-‐to-‐Vent Gas RaNo for Test Series S5 and S6
DRE (Propylene) for Test Series S5 and
84
86
88
90
92
94
96
98
100
0.00 0.50 1.00 1.50
CE (%
)
Steam-‐to-‐Vent Gas RaNo (lb/lb)
CE vs Steam-‐to-‐Vent Gas RaNo for Test Series S5 and S6
DRE (Propylene) for Test Series S5 and S6
TCEQ 2010 Flare Study The University of Texas at Austin 79 August 1, 2011 The Center for Energy & Environmental Resources
The next five test series illustrate the impact of center steam on DRE. Please refer to Figures 5-18a, 5-18b, 5-19a and 5-19b for these cases. Using a center steam flow rate of 501 lb/hr and 536 lb/hr upper steam (S/VG = 0.34), at a vent gas LHV of 354 Btu/scf and a flow rate 3,028 lb/hr, the highest DRE achieved was 96.0% (S7.6 R1). The CE for this test point/run was 95.3%. The average wind speed during this test point/run was 10.8 mph. The MFR for this test point/run was 0.024. Using no center steam and 534 lb/hr upper steam (S/VG = 0.22) and a vent gas LHV of 356 Btu/scf and a flow rate of 2,399 lb/hr, the highest DRE achieved was 98.0% (S8.1 R1). The CE for this test point/run was 97.6%. The average wind speed during this test point/run was 12.6 mph. The MFR for this test point/run was 0.007. Using no center steam but twice as much upper steam (1,007 lb/hr, S/VG = 0.43) and a vent gas LHV of 347 Btu/scf and a flow rate of 2,364 lb/hr, the highest DRE achieved 94.4% (S9.1 R1). The CE for this test point/run was 93.3%. The average wind speed during this test point/run was 12.2 mph. The MFR for this test point/run was 0.007. Using no center steam, an upper steam rate of 542 lb/hr (S/VG = 0.36) and a vent gas LHV of 353 Btu/scf and a flow rate of 2,348 lb/hr, the highest DRE achieved was 95.8% (S10.1 R1). The CE for this test point/run was 95.0%. The average wind speed during this test point/run was 10.9 mph. The MFR for this test point/run was 0.009. Lastly, with 286 lb/hr of center steam and 830 lb/hr upper steam (S/VG = 0.35), a vent gas LHV of 355 Btu/scf and a flow rate of 2,354 lb/hr, the highest DRE achieved was 96.0% (S11.1 R1). The CE for this test point/run was 95.4%. The average wind speed during this test point/run was 10.5 mph. The MFR for this test point/run was 0.014. Figures 5-19a and 5-19b are the same data as Figures 5-18a and 5-18b except the horizontal axis has been reversed to show a decline in DRE and CE as the values on the horizontal axis decrease from left to right.

TCEQ 2010 Flare Study The University of Texas at Austin 80 August 1, 2011 The Center for Energy & Environmental Resources
Figure 5-18a. DRE vs Vent Gas Flow Rate for Test Series S7, S8, S9, S10 and S11
Figure 5-18b. CE vs Vent Gas Flow Rate for Test Series S7, S8, S9, S10 and S11
50 55 60 65 70 75 80 85 90 95 100
500 1,500 2,500 3,500
DRE -‐ P
ropylene
(%)
Vent Gas Flow Rate (lb/hr)
DRE (Propylene) for Test Series S7 to S11 LHV = 350 Btu/scf, Constant Steam Assist
Total Steam = 1050 lb/hr, 500 lb/hr Center (S7)
Total Steam = 500 lb/hr, 0 lb/hr Center (S8)
Total Steam = 1000 lb/hr, 0 lb/hr Center (S9)
Total Steam = 835 lb/hr, 0 lb/hr Center (S10)
Total Steam = 830 lb/hr, 240 lb/hr Center (S11)
50 55 60 65 70 75 80 85 90 95 100
500 1,500 2,500 3,500
CE (%
)
Vent Gas Flow Rate (lb/hr)
CE for Test Series S7 to S11 LHV = 350 Btu/scf, Constant Steam Assist
Total Steam = 1050 lb/hr, 500 lb/hr Center (S7)
Total Steam = 500 lb/hr, 0 lb/hr Center (S8)
Total Steam = 1000 lb/hr, 0 lb/hr Center (S9)
Total Steam = 835 lb/hr, 0 lb/hr Center (S10)
Total Steam = 830 lb/hr, 240 lb/hr Center (S11)

TCEQ 2010 Flare Study The University of Texas at Austin 81 August 1, 2011 The Center for Energy & Environmental Resources
Figure 5-19a. DRE vs Vent Gas Flow Rate for Test Series S7, S8, S9, S10 and S11 (Note values on horizontal axis decrease from left to right)
Figure 5-19b. CE vs Vent Gas Flow Rate for Test Series S7, S8, S9, S10 and S11 (Note values on horizontal axis decrease from left to right)
50 55 60 65 70 75 80 85 90 95 100
500 1,500 2,500 3,500
DRE -‐ P
ropylene
(%)
Vent Gas Flow Rate (lb/hr)
DRE (Propylene) for Test Series S7 to S11 LHV = 350 Btu/scf, Constant Steam Assist
Total Steam = 1,050 lb/hr, 500 lb/hr Center (S7)
Total Steam = 500 lb/hr, 0 lb/hr Center (S8)
Total Steam = 1,000 lb/hr, 0 lb/hr Center (S9)
Total Steam = 835 lb/hr, 0 lb/hr Center (S10)
Total Steam = 830 lb/hr, 240 lb/hr Center (S11)
50 55 60 65 70 75 80 85 90 95 100
500 1,500 2,500 3,500
CE (%
)
Vent Gas Flow Rate (lb/hr)
CE for Test Series S7 to S11 LHV = 350 Btu/scf, Constant Steam Assist
Total Steam = 1,050 lb/hr, 500 lb/hr Center (S7)
Total Steam = 500 lb/hr, 0 lb/hr Center (S8)
Total Steam = 1,000 lb/hr, 0 lb/hr Center (S9)
Total Steam = 835 lb/hr, 0 lb/hr Center (S10)
Total Steam = 830 lb/hr, 240 lb/hr Center (S11)

TCEQ 2010 Flare Study The University of Texas at Austin 82 August 1, 2011 The Center for Energy & Environmental Resources
The Combustion Zone Gas Net Heat Value (CZG NHV), Btu/scf, is defined in this study as the ratio of the sum of the combustion heating value (LHV) of the vent gas going through the flare plus the combustion heating value of the flare pilots to the total volume of gases going to the flare, including steam, i.e., vent gas plus pilot gas plus total steam assist. It is expressed numerically as
€
CZG NHV =(VG)(LHVVG)(386.3/MWVG)[ ]+ (PG)(LHVPG )(386.3/MWPG )[ ](VG)(386.3/MWVG) +(PG)(386.3/MWPG) +(S)(386.3/18.02)[ ] Eq. 5.3
where CZG NHV = combustion zone gas net heating value, Btu/scf VG = Vent gas mass flow rate, lb/hr LHVVG = Vent gas lower heating value, Btu/scf MWVG = Vent gas molecular weight, lb/lb-mol PG = Pilot gas mass flow rate, lb/hr LHVPG = Pilot gas lower heating value, Btu/scf MWPG = Pilot gas molecular weight, lb/lb-mol S = Total steam mass flow rate, lb/hr 386.3 = Ideal gas volume (scf) per lb-mol at 68°F and 1 atmosphere 18.02 = Steam molecular weight, lb/lb-mol Please refer to Figures 5-20a, 5-20b, 5-21a, and 5-21b Figure 5-20a plots the DRE (Propylene) vs CZG NHV for all test points in Test Series S3 through S6. Figure 21a plots the DRE (Propylene) vs CZG NHV for Test Series S7 through S11. Figures 5-20b and 5-21b have the horzontal axis reversed, i.e., the values on the axis decrease from left to right, and focus only on DRE and CE values above 84%, which is the more important section of these graphs for the study. It appears that until the CZG NHV gets above 300 Btu/scf for Test Series S3 through S6, does the DRE (Propylene) appear to have a single value of DRE above 98%. There is insufficient data to estimate a similar value for Test Series S7 through S11.

TCEQ 2010 Flare Study The University of Texas at Austin 83 August 1, 2011 The Center for Energy & Environmental Resources
Figure 5-20a. DRE vs CZG NHV for Test Series S3, S4, S5 and S6
Figure 5-20b. DRE vs CZG NHV for Test Series S3, S4, S5 and S6 (Note vertical axis DRE range = 84 to 100% and
values on horizontal axis decrease from left to right)
20
30
40
50
60
70
80
90
100
50 100 150 200 250 300 350 400
DRE -‐ P
ropylene
(%)
CombusNon Zone Gas Net Heat Value (Btu/scf)
DRE (Propylene) vs CombusNon Zone Gas Net Heat Value
Test Series S3
Test Series S4
Test Series S5
Test Series S6
84
86
88
90
92
94
96
98
100
150 200 250 300 350 400
DRE -‐ P
ropylene
(%)
CombusNon Zone Gas Net Heat Value (Btu/scf)
DRE (Propylene) vs CombusNon Zone Gas Net Heat Value
Test Series S3
Test Series S4
Test Series S5
Test Series S6

TCEQ 2010 Flare Study The University of Texas at Austin 84 August 1, 2011 The Center for Energy & Environmental Resources
Figure 5-21a. DRE vs CZG NHV for Test Series S7, S8, S9, S10 and S11
Figure 5-21b. DRE vs CZG NHV for Test Series S7, S8, S9, S10 and S11 (Note vertical axis DRE range = 84 to 100% and
values on horizontal axis decrease from left to right)
20
30
40
50
60
70
80
90
100
100 150 200 250 300
DRE -‐ P
ropylene
(%)
CombusNon Zone Gas Net Heat Value (Btu/scf)
DRE (Propylene) vs CombusNon Zone Gas Net Heat Value
Test Seris S7
Test Series S8
Test Series S9
Test Series S10
Test Series S11
84
86
88
90
92
94
96
98
100
100 150 200 250 300
DRE -‐ P
ropylene
(%)
CombusNon Zone Gas Net Heat Value (Btu/scf)
DRE (Propylene) vs CombusNon Zone Gas Net Heat Value
Test Seris S7
Test Series S8
Test Series S9
Test Series S10
Test Series S11
TCEQ 2010 Flare Study The University of Texas at Austin 85 August 1, 2011 The Center for Energy & Environmental Resources
Air-Assisted Flare: DRE (Propylene) and CE
In the following summaries the term stoichiometric ratio (SR) will be used to represent the ratio of the actual air assist (lb/hr) used during a test point/run to the amount of theoretical air (lb/hr) required to provide the exact amount of oxygen for stoichiometric combustion of the fuel, i.e., amount of theoretical stoichiometric air (SA) to fuel ratio on a mass basis. The following theoretical SA to fuel ratios were used: propylene -14.807 lb/lb, propane – 15.246 lb/lb, and TNG – 15.737 lb/lb. All values for theoretical SA/fuel ratios are from The John Zink Combustion Handbook (Baukal, 2001). The value for TNG is based on the average composition shown in Table H-1. As an example, if 100,000 lb/hr of assist air were used during a test point/run and the amount of SA required was 20,000 lb/hr for the amount of fuel in the vent gas flow, the SR would be 5.0 (100,000 lb/hr ÷ 20,000 lb/hr). As can be seen from this example the SR is a dimensionless quantity as the units in the numerator and the denominator cancel each other out. Please refer to Figures 5-22a and 5-22b. At an air assist flow rate of 21,300 lb/hr (SR = 7.2), for a vent gas LHV of 339 Btu/scf and a constant flow rate of 902 lb/hr, the DRE (propylene) was 99.0% (A3.1 R3). Higher air assist levels produced lower DREs. The CE for this test point/run was 98.5%. The average wind speed during this test point/run was 10.4 mph. The MFR for this test point/run was 0.25. At an air assist flow rate of 7,930 lb/hr (SR = 6.5), for a vent gas LHV of 351 Btu/scf and a constant flow rate of 355 lb/hr, the maximum DRE (propylene) was 97.0% (A5.1 R2). Higher air assist levels produced lower DREs. The CE for this test point/run was 96.6%. The average wind speed during this test was 9.0 mph. The average wind speed during this test point/run was 3.8 mph. The MFR for this test point/run was 0.53. Please refer to Figures 5-23a and 5-23b. At an air assist flow rate of 12,600 lb/hr (SR = 6.5), for a vent gas LHV of 584 Btu/scf and a constant flow rate of 352 lb/hr, the DRE (propylene) was 99.4% (A6.1 Run 3). Higher air assist levels produced lower DREs. The CE for this test point /run was 99.1%. The average wind speed during this test point/run was 13.8 mph. The MFR for this test point/run was 0.11. At an air assist flow rate of 30,200 lb/hr (SR = 6.2), for a vent gas LHV of 559 Btu/scf and a constant flow rate 594 lb/hr, the DRE (propylene) was 99.4% (A4.6 Run 1). Higher air assist levels produced lower DREs. The CE for this test point/run was 98.9%. The average wind speed during this test point/run was 16.3 mph. The MFR for this test point/run was 0.43.

TCEQ 2010 Flare Study The University of Texas at Austin 86 August 1, 2011 The Center for Energy & Environmental Resources
Figure 5-22a. DRE vs Air Assist for Test Series A3 and A5
Figure 5-22b. CE vs Air Assist for Test Series A3 and A5
50
60
70
80
90
100
0 50,000 100,000 150,000
DRE -‐ P
ropylene
(%)
Air Assist (lb/hr)
DRE (Propylene) for Test Series A3 & A5 LHV = 350 Btu/scf, Constant Vent Gas Flow Rate
Vent Gas = 350 lb/hr (A5)
Vent Gas = 900 lb/hr (A3)
50
60
70
80
90
100
0 50,000 100,000 150,000
CE (%
)
Air Assist (lbs/hr)
CE for Test Series A3 & A5 LHV = 350 Btu/scf, Constant Vent Gas Flow Rate
Vent Gas = 350 lb/hr (A5)
Vent Gas = 900 lb/hr (A3)

TCEQ 2010 Flare Study The University of Texas at Austin 87 August 1, 2011 The Center for Energy & Environmental Resources
Figure 5-23a. DRE vs Air Assist for Test Series A4 and A6
Figure 5-23b. CE vs Air Assist for Test Series A4 and A6
50
60
70
80
90
100
0 50,000 100,000 150,000
DRE -‐ P
ropylene
(%)
Air Assist (lb/hr)
DRE (Propylene) for Test Series A4 & A6 LHV = 570 Btu/scf, Constant Vent Gas Flow Rate
Vent Gas = 350 lbs/hr (A6)
Vent Gas = 920 lb/hr (A4)
50.0
60.0
70.0
80.0
90.0
100.0
0 50,000 100,000 150,000
CE (%
)
Air Assist (lb/hr)
CE for Test Series A4 & A6 LHV = 570 Btu/scf, Constant Vent Gas Flow Rate
Vent Gas = 350 lb/hr (A6)
Vent Gas = 920 lb/hr (A4)

TCEQ 2010 Flare Study The University of Texas at Austin 88 August 1, 2011 The Center for Energy & Environmental Resources
Steam-Assisted Flare: DRE (Propane) and CE Please refer to Figures 5-24a and 5-24b. For the combination of operating parameters shown in Figures 5-24a and 524b, with a vent gas flow rate of 2,363 lb/hr (S/VG = 0.44), the maximum DRE was 97.7% (S12.1 R1). The CE for this test point/run was 97.4%. The average wind speed during this test point/run was 2.9 mph. The MFR for this test point/run was 0.209. For the combination of operating parameters shown in Figures 5-24a and 5-24b, with a vent gas flow rate 2,394 lb/hr (S/VG = 0.35), the maximum DRE was 98.3% (S13.1 R1). The CE for this test point/run was 98.0%. The average wind speed during this test point/run was 5.2 mph. The MFR for this test point/run was 0.059. For the combination of operating parameters shown in Figures 5-24a and 5-24b, with a vent gas flow rate 2,370 lb/hr (S/VG = 0.23), the DRE was 99.1% (S14.1 R1). The CE for this test point/run was 98.9%. The average wind speed during this test point/run was 4.7 mph. The MFR for this test point/run was 0.051. Air-Assisted Flare: DRE (Propane) and CE Please refer to Figures 5-25a and 5-25b. At an air assist flow rate of 7,120 lb/hr (SR = 5.5), for a vent gas LHV of 356 Btu/scf and a constant flow rate of 365 lb/hr, the DRE (propane) was 99.8% (A7.1 R2). Higher air assist levels produced lower DREs. The CE for this test point/run was 99.8%. The average wind speed during this test point/run was 3.8 mph. The MFR for this test point/run was 0.45.
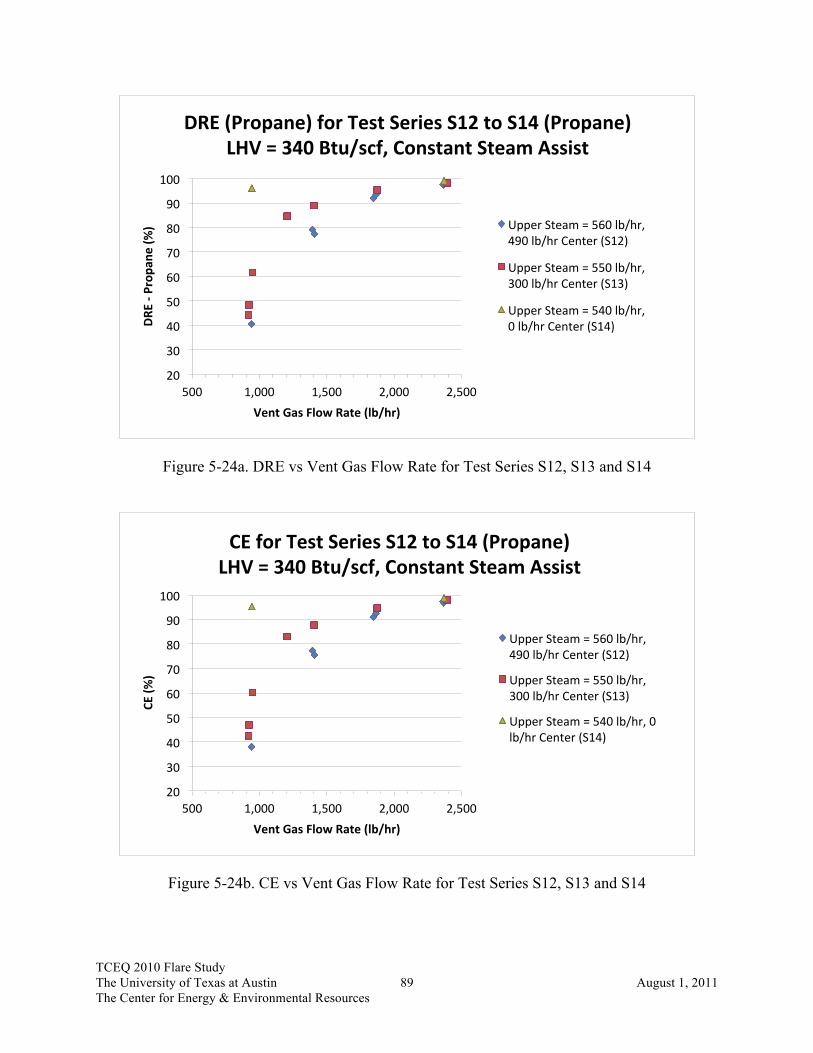
TCEQ 2010 Flare Study The University of Texas at Austin 89 August 1, 2011 The Center for Energy & Environmental Resources
Figure 5-24a. DRE vs Vent Gas Flow Rate for Test Series S12, S13 and S14
Figure 5-24b. CE vs Vent Gas Flow Rate for Test Series S12, S13 and S14
20
30
40
50
60
70
80
90
100
500 1,000 1,500 2,000 2,500
DRE -‐ P
ropa
ne (%
)
Vent Gas Flow Rate (lb/hr)
DRE (Propane) for Test Series S12 to S14 (Propane) LHV = 340 Btu/scf, Constant Steam Assist
Upper Steam = 560 lb/hr, 490 lb/hr Center (S12)
Upper Steam = 550 lb/hr, 300 lb/hr Center (S13)
Upper Steam = 540 lb/hr, 0 lb/hr Center (S14)
20
30
40
50
60
70
80
90
100
500 1,000 1,500 2,000 2,500
CE (%
)
Vent Gas Flow Rate (lb/hr)
CE for Test Series S12 to S14 (Propane) LHV = 340 Btu/scf, Constant Steam Assist
Upper Steam = 560 lb/hr, 490 lb/hr Center (S12)
Upper Steam = 550 lb/hr, 300 lb/hr Center (S13)
Upper Steam = 540 lb/hr, 0 lb/hr Center (S14)
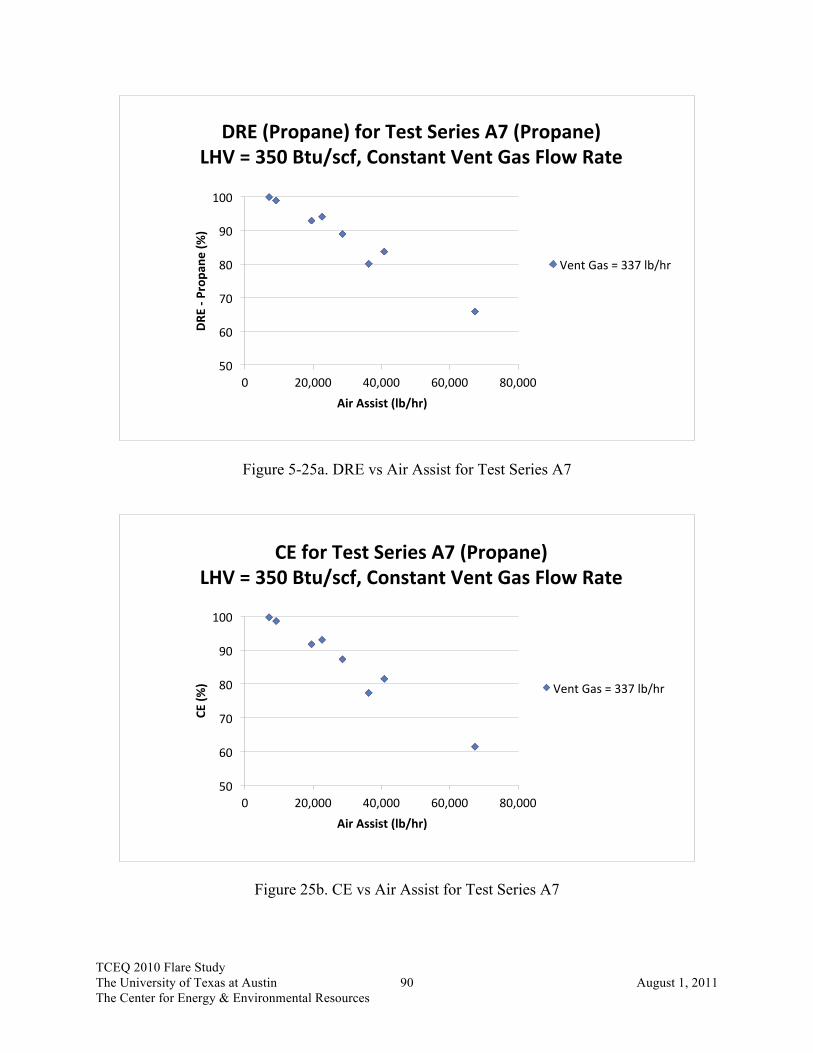
TCEQ 2010 Flare Study The University of Texas at Austin 90 August 1, 2011 The Center for Energy & Environmental Resources
Figure 5-25a. DRE vs Air Assist for Test Series A7
Figure 25b. CE vs Air Assist for Test Series A7
50
60
70
80
90
100
0 20,000 40,000 60,000 80,000
DRE -‐ P
ropa
ne (%
)
Air Assist (lb/hr)
DRE (Propane) for Test Series A7 (Propane) LHV = 350 Btu/scf, Constant Vent Gas Flow Rate
Vent Gas = 337 lb/hr
50
60
70
80
90
100
0 20,000 40,000 60,000 80,000
CE (%
)
Air Assist (lb/hr)
CE for Test Series A7 (Propane) LHV = 350 Btu/scf, Constant Vent Gas Flow Rate
Vent Gas = 337 lb/hr

TCEQ 2010 Flare Study The University of Texas at Austin 91 August 1, 2011 The Center for Energy & Environmental Resources
6.0 Discussion of Test Results The study objectives for this project included assessing the performance of industrial flares operating with low vent gas flow rates (high turn down ratios) and low LHV vent gas properties and assessing the impact of air and steam assist on DRE and CE for these low flow, low LHV vent gas streams. The analyses of the test results will focus on answering the TCEQ Study Objectives even though many more questions could be addressed with these data. In this discussion, the flare performance will always be evaluated in terms of DRE and CE. When the term DRE is used in the propylene tests, it will always refer to DRE (propylene). When the term DRE is used in the propane tests, it will always refer to DRE (propane). The DRE was not computed for any other hydrocarbons during this test series. Steam Flare Tests with Propylene (please refer to Table D-1 in Appendix D) For the lowest nominal LHV (350 Btu/scf) and lowest nominal vent gas flow rate (920 lb/hr) used in the study for the steam flare tests, Figures 5-12a and 5-12b illustrate the sensitivity of the flare’s performance to steam assist with this vent gas stream (S3), particularly the addition of center steam. The average wind speed for the S3 test series ranged between 2.6 mph and 7.5 mph. When the center steam was zero (Test Points S3.6 and S3.7) and total steam did not exceed about 230 lb/hr, the DRE and CE were the highest, in excess of 99%, even with the highest wind speed of the S3 test series (7.5 mph) during S3.5R2. However, as soon as the steam assist was progressively increased (Test Points S3.5 and S3.2) with average wind speeds ranging from 7.2 mph to 7.5 mph, comparable to or less than the Test Points S3.6 and S3.7, which had the highest DRE and CE, the DRE and CE progressively decreased. The DRE and CE were lowest, 36.1% and 34.3%, respectively, for S3.1R1, which had the lowest wind speed and nominal steam assist (center = 540 lb/hr, upper = 430 lb/hr) equating to a steam-to-vent gas ratio (S/VG) of 1.04. Industry reported to the TCEQ (email message from R. Nettles, TCEQ, to V. Torres, UT Austin, on September 8, 2010) prior to the study that this level of steam assist, is slightly lower than that recommended (center = 500 lb/hr, upper = 750 lb/hr) by flare manufacturers to industry for this size and model of steam flare. This one test series showed three characteristics of this flare at these operating conditions: 1. Average wind speeds up to 7.5 mph do not prevent this flare from achieving 99% DRE and
99% CE but only at operating conditions that are not recommended by flare manufacturers. 2. This flare’s performance curve as measured by DRE and CE versus steam assist, has a very
short, almost nonexistent, DRE “shelf” that is adversely affected by the addition of center steam.
3. Steam assist levels (center steam = 500 lb/hr, minimum, and upper steam = 750 lb/hr , minimum) currently used by industry would be too high to achieve a DRE of 99%.
Using the same LHV (350 Btu/scf) and a vent gas flow rate of nominally 2,342 lb/hr (S4.2R3), the DRE is sustained at 99% for a slightly greater amount of steam assist (S/VG = 0.29), approximately 666 lb/hr total (center = 555 lb/hr) before the DRE and CE start to fall below 99%. Once again, steam assist levels currently used by industry would be too high to achieve a DRE of 99% and these levels of steam assist would not comply with Zink’s recommended steam
TCEQ 2010 Flare Study The University of Texas at Austin 92 August 1, 2011 The Center for Energy & Environmental Resources
levels for this flare tip, i.e., minimum continuous center steam = 300 lb/hr and 525 lb/hr upper steam. For the highest nominal LHV (600 Btu/scf) used in this study for the steam flare tests and a nominal vent gas flow rate of 937 lb/hr (Test Series S5), as shown in Figures 5-13a and 5-13b, the flare’s best performance in response to steam assist is similar to the S3 test series but more robust in its response to center steam. In Test Point S5.1, with center steam = 480 lb/hr and upper steam = 283 lb/hr (S/VG = 0.82), the average DRE was 96.4% and CE was 95.6%. The average wind speed was 8.0 mph during this test. Whereas, test point/run S3.2R2, with only 570 lb/hr total steam (52 lb/hr center, 518 lb/hr upper), resulted in a DRE of 90.4% and a CE of 88.6% with a very comparable average wind speed of 7.5 mph. No operating condition in the Test Series S5 would have achieved a DRE ≥ 99% with levels of steam assist of 500 lb/hr center steam and 750 lb/hr upper steam. In Test Series S6 with the same nominal LHV (600 Btu/scf) and the higher vent gas flow rate of nominally 2,342 lb/hr, the DRE and CE exceed 99% (S6.1) and the DRE was sustained at almost 99% (S6.5) with additions of steam of up to approximately 2,000 lb/hr total (S/VG = 0.84). Average wind speeds in these two test series ranged from 7.5 mph to 8.0 mph. This combination of LHV and vent gas flow rate would achieve DRE ≥ 99% with levels of steam assist of 500 lb/hr center steam and 750 lb/hr upper steam. While it appears from Figure 5-14a that a S/VG value of approximately 0.4 or less ensures that the DRE is above 98%, expanding the graph for the region greater that 84% (Figure 5-15a and Figure 5-15b) reveals something different. Examining Figure 5-15a and the data summary in Appendix D, there are multiple values for DRE for a given S/VG until the S/VG gets much closer to 0.15 or less for this LHV (= 350 Btu/scf) and vent gas flow rates. A similar trend is noted for the CE (Figure 5-15b) with the critical S/VG value to obtain CE = 98% being much less than 0.1, perhaps even close to zero, since in general, the CE values are less than the DRE values for a given S/VG. As was seen at a LHV = 350 Btu/scf, it appears in Figure 16a that a S/VG = 0.9 or less would ensure a DRE of 98% or more. However, upon closer inspection of Figure 5-17a, in which the region DRE > 84% is expanded, and the summary data in Appendix D, once again due to multiple DRE values for a given S/VG, the S/VG must be less than about 0.70 to ensure a DRE above 98% for a LHV of 600 Btu/scf and these vent gas flow rates. As above, the S/VG must be less than 0.65 for the CE to be above 98%. Air Flare Tests with Propylene (please refer to Table E-1 in Appendix E) For the lowest nominal LHV (350 Btu/scf) and lowest nominal vent gas flow rate (350 lb/hr) used in this study for the air flare tests, Figures 5-22a and 5-22b illustrate the sensitivity of the flare’s performance to air assist with this vent gas stream (A5). When the air assist was 8,330 lb/hr (SR = 7.0), the DRE for this test point/run (A5.1R3) was 97.4% and the CE was 96.9%. This was the lowest air assist rate that satisfied the study’s definition of incipient smoke point so no lower air assist conditions were tested. As the air assist increased, the DRE and CE decreased almost linearly. The average wind speed for the A5 test series ranged from 2.1 mph to 5.6 mph.

TCEQ 2010 Flare Study The University of Texas at Austin 93 August 1, 2011 The Center for Energy & Environmental Resources
For the same nominal LHV (350 Btu/scf) and a nominal vent gas flow rate of 900 lb/hr, when the air assist rate was at or very near the incipient smoke point, the air assist rate was 19,400 lb/hr (SR = 6.5), the DRE for this test point/run (A3.1R2) was 99.6% and the CE was 99.2%. As the air assist increased, the DRE and CE decreased almost linearly. The average wind speed for the A3 test series varied from 10.3 mph to 13.4 mph. Equation 6.1 defines the air assist tip exit velocity. !"# !""#"$ !"# !"#$ !"#$%&'( !"ℎ = !"# !""#"$ (!"#$)
!.! !"!× !!"#
!× !!!"#
× !" !"#/!!!,!"# !"/!"#$
Eq. 6.1
where air assist tip exit velocity (mph) = speed of the air assist in mph as it exits the flare tip air assist (scfm) = volumetric flow rate of the air assist, scfm, from Table E-1 7.5 ft2 = free flow area of the air assist only PSTP = standard pressure, 14.696 psia P = ambient air pressure, psia, from Table E-1 T (ºR) = ambient air temperature, ºF, from Table E-1, plus 459.7 ºR TSTP (ºR) = standard temperature, ºR, 527.7 ºR (= 459.7 + 68) For the flare tests conducted, the range of molecular weights of the vent gas were 29.6 lb/lb-mol to 30.8 lb/lb-mol, similar to or slightly greater than that of air, 28.96 lb/lb-mol. Exit velocities for the vent gas from Table 1 for Test Series A3 and A4 were 1.9 fps, for A5 and A7 were 0.8 fps and for A6 were 0.7 fps. Converting these vent gas exit velocities to mph we get Test Series A3 and 4 were 1.3 mph, A5 and A7 were 0.6 mph and A6 were 0.5 mph. The volumetric flow rate for the air assist during this test series ranged from about 4,000 scfm to 29,400 scfm. Calculating the air assist tip exit velocity using Equation 6.1, these two volumetric flow rates equate to 6.4 mph and 47.1 mph, respectively. Comparing the air assist exit velocities with the vent gas exit velocities and their very comparable molecular weights, the velocity of the air assist will be the dominant driver in characterizing the momentum of the vent gas/air assist mixture exiting the tip of the flare, which is proportional to the square of the velocity. At every test point in this A3 test series, the velocity of the air assist exiting the flare was equal to or greater than the wind speed except for A3.1. So the momentum of the vent gas/air assist mixture exiting the flare tip was greater than the momentum of the crosswind, i.e., MFR ≥ 1.0. Therefore, particularly at the higher air assist rates (> 9,000 scfm), any adverse effect from the wind speed during these test series was difficult to distinguish from the adverse air assist impact. When the nominal LHV of 600 Btu/scf and the highest vent gas flow rate were used for the air flare tests (A4), for the test point/run A4.6R1, the DRE was 99.4% and the CE was 98.9% using an air assist rate of 30,200 lb/hr (SR = 6.2). The average wind speed for this test point was 16.3 mph. Using Equation 6.1, an air assist volumetric flow rate of 6,700 scfm equates to an air assist
TCEQ 2010 Flare Study The University of Texas at Austin 94 August 1, 2011 The Center for Energy & Environmental Resources
exit velocity of 10.5 mph. Even when the average wind speed was 55% greater than the air assist exit velocity, the DRE was > 99%. As with all of the other air flare tests, as the air assist increases, there appears to be a linear decrease in the DRE. In this test series, the decrease in DRE and CE has a slope that is less than in the previous tests. Steam Flare Tests with Propane (please refer to Table D-1) This test series (please see Figures 5-24a and 5-24b), conducted with the substitution of propane for propylene, was conducted at only one LHV, 350 Btu/scf. With the knowledge of the propylene test series, and the greater challenges the test system had with variation of steam assist at low steam levels, the propane test series were conducted at three nominal steam assist conditions, each held constant when employed: center = 0 lb/hr, upper = 550 lb/hr; center = 300 lb/hr, upper = 550 lb/hr; and center = 500 lb/hr, upper = 550 lb/hr. At a nominal LHV of 350 Btu/scf and a nominal vent gas flow rate of 2,342 lb/hr, with no center steam and 540 lb/hr upper steam (S/VG = 0.23) in test point/run S14.1R1, the DRE was 99.1% and the CE was 98.9%. The average wind speed for this test point/run was 4.7 mph (MFR = 0.051). When steam was added to the center, center = 300 lb/hr (S/VG = 0.35), the DRE decreased (S13.1R1) to 98.3% and the CE to 98.0%. The average wind speed for this test point/run was 5.2 mph (MFR = 0.059). As center steam was increased to 500 lb/hr (S12.1R1), S/VG = 0.44, the DRE decreased to 97.7% and the CE to 97.4%. The average wind speed for this test point/run was 2.3 mph (MFR = 0.209). The remainder of the propane test series were conducted at combinations of lower vent gas flow rates and lower steam assist than Test Series 12.1 that did not achieve higher levels of DRE or CE than test point/run S14.1R1. No operating condition in the propane tests conducted would have achieved a DRE ≥ 99% with levels of steam assist of 500 lb/hr center steam and 750 lb/hr upper steam. The average wind speed during the propane test series varied from 0.5 mph to 7.2 mph. Air Flare Tests with Propane (please refer to Table E-1) This test series (please see Figures 5-25a and 5-25b), conducted with the substitution of propane for propylene, was conducted at only one LHV, 350 Btu/scf. At a nominal LHV of 350 Btu/scf and a nominal vent gas flow rate of 350 lb/hr, with an air assist rate of 7,120 lb/hr (SR = 5.5) in test point/run A7.1R2, the DRE was 99.8% and the CE was 99.8%. The average wind speed for this test point/run was 3.8 mph (MFR = 0.45). The remainder of the air flare propane test series was conducted at higher air assist rates, which produced progressively lower DREs and CEs. The average wind speed, during the air flare propane test series, varied from 3.6 mph to 5.8 mph.

TCEQ 2010 Flare Study The University of Texas at Austin 95 August 1, 2011 The Center for Energy & Environmental Resources
Applicability of CZG NHV Some (Marathon, November 2010; Marathon, May 2010) have used the CZG NHV (Equation 5-3) as a way to adjust the LHV of the vent gas to reflect other components that are added at and in the flare tip. What has been learned in this study is that the manner in which these components, i.e., center and upper steam, etc., are introduced affects the impact these contributors have on the combustion process just as importantly as does the amount of these components that are added. Center steam certainly acts as a diluent. But how much so and is the degree the same for all possible vent gas components? Upper steam adds oxygen and turbulence. Is this impact the same in all cases, i.e., how does crosswind and vent gas exit velocity affect the contributions of the upper steam? Do these contributions impact positively or negatively under all circumstances? The CZG NHV as presently defined is a volume term. Should it be a rate term reflecting the heating value flux through the tip? More full-scale data and some computational fluid dynamics modeling are needed to address these questions. It was out of the scope of this effort to address the applicability of the CZG NHV in this study. Effects of Wind on DRE and CE As was stated in the scope, only one major parameter was not to be controlled during the testing: ambient conditions, including wind. Additionally the test plan in Section 3.0 did not include tests or instrumentation designed to quantify and characterize the effects of the wind on the flare’s performance. Therefore no quantification of the winds effect will be presented. In response to comments received during the public comment period of the draft final report for this study, the TCEQ (email message from D. Nesvacil, TCEQ, to V. Torres, UT Austin, July 22, 2011) has submitted a bibliography of publicly available papers that include observation on wind effects on flare performance and results from flare testing under windy conditions. This bibliography is shown in Table 6.1. Center and Upper Steam Effects on DRE Center steam is used to provide added momentum to the vent gas flow so as to help prevent combustion from occurring inside the tip. The upper steam nozzles draw air into the steam and help to increase the mixing of the steam and air mixture with the vent gas exiting the flare tip. The air provides additional oxygen for combustion when the ambient air is unable to reach all parts of the combustion zone thereby helping to prevent smoking of the flare. A minimum continuous flow of steam is needed to prevent condensation from occurring in the steam lines and thermal shock in the upper steam ring and nozzles. It can also act as a windshield to reduce adverse wind effects on the flare flame (ANSI/API Standard 537, 2008). But both forms of steam assist, as was seen in the data from this study, provide adverse effects on DRE and CE in different ways and in different amounts. Center steam acts as diluent of the vent gas because it adds no combustible heat content to the vent gas stream. A decrease in LHV reduces the hydrocarbon content (fuel) in the vent gas on a volume basis resulting in a lower DRE for the same steam-to-vent gas ratio. The exact magnitude of the decrease will depend on the LHV and combustion characteristics of the hydrocarbon fuels in the vent gas and the point of operation on the DRE curve.
TCEQ 2010 Flare Study The University of Texas at Austin 96 August 1, 2011 The Center for Energy & Environmental Resources
In addition to the effects of upper steam described above, upper steam can also provide adverse effects on the flare performance. Upper steam can dilute the LHV of the vent gas prior to combustion and quench the combustion zone, both tending to decrease the DRE. In this study, the data suggest that when operating the steam flare used in this study at a DRE near 98%, if comparable flow rates of steam are introduced at the center and upper nozzles, the center steam will have a greater adverse effect on DRE than will the upper steam on the low flow, low LHV vent gas flows used in this study. Comparison of Selected Data with US EPA 1983 Flare Study After the public comment period for the draft final report, the TCEQ requested that a comparison of selected steam data from the US EPA 1983 Flare Efficiency Study (McDaniel 1983) be included in the final report. As these two studies had quite different objectives, were conducted using significantly different flare tips (8-inch diameter vs. 36-inch diameter; flare design with upper steam and no center steam vs. flare design with upper and center steam), different pilot designs and steam nozzle designs (personal conversation between R. Schwartz, John Zink Company, and V. Torres, UT Austin, September 27, 2010), EPA study was conducted primarily during winds speeds of less than 5 mph and vent gas exit velocities were significantly different (EPA 1983 Study: 1,035 fpm to 3,749 fpm vs. TCEQ 2010 Study: 30 fpm to 120 fpm), any comparison must be done with great caution and thoughtfulness. In Figure 6-1, the CE (proplene) vs. S/VG ratio is shown for the 100% propylene flows (EPA 1983 Study: 2,183 Btu/scf and TCEQ 2010 Study: 2,149 Btu/scf) and for the low LHV flows EPA 1983 Study: 300 to 600 Btu/scf and TCEQ 2010 Study: 350 to 600 Btu/scf) for the steam flare tests whose flare operating conditions fall within these values. Please note that for all but one of the low LHV tests conducted during the EPA 1983 Study, no steam assist was used, i.e., S/VG = 0 lb/hr.

TCEQ 2010 Flare Study The University of Texas at Austin 97 August 1, 2011 The Center for Energy & Environmental Resources
Figure 6-1. CE (Propylene) vs Steam-to-Vent Gas Ratio for Selected Data from EPA 1983 and TCEQ 2010 Studies
(EPA 1983 study data taken from Table 4 in report)
For the 100% propylene (high LHV) vent gas tests, up to approximately an S/VG = 3, there is good agreement in the data between the two studies. Beyond that S/VG, the trends in the data are similar but the values begin to differ. For the low LHV vent gas tests (300 to 600 Btu/scf), the two study’s results are significantly different for all data points except those in the TCEQ 2010 Study conducted with little or no steam assist. This is due to the fact that during the EPA 1983 Study, steam assist was not used for the low LHV vent gas tests except for one of the test points shown and that test was conducted with an S/VG = 0.168. Links to Other Recent Full-Scale Flare Studies There have been other studies conducted recently on full-scale flares. The TCEQ is providing access to some of these studies at the following website.
http://www.tceq.texas.gov/airquality/stationary-‐rules/flare_stakeholder.html
60
70
80
90
100
0 2 4 6 8
CE (%
)
Steam-‐to-‐Vent Gas RaNo (lb/lb)
CE (Propylene) vs Steam-‐to Vent Gas RaNo for Selected Steam Flare Data
from EPA 1983 and TCEQ 2010 Studies
TCEQ 2010 Study, 2,149 Btu/scf
TCEQ 2010 Study, <= 600 Btu/scf
EPA 1983 Study, 2,183 Btu/scf
EPA 1983 Study, 300 to 600 Btu/scf

TCEQ 2010 Flare Study The University of Texas at Austin 98 August 1, 2011 The Center for Energy & Environmental Resources
Table 6-1. Selected Papers and Reports on Wind Effects on Flare Performance 1 Becker, R. [1974] “Ausbrandmessungen an Fackelflamen” (Measurement of residuals of
flare stacks – in German), Messen + Steuern, 32, pp. 23-25. 2 Bourguignon, E., Johnson, M.R., and Kostiuk, L.W. [1999] "The use of a closed-loop wind
tunnel for measuring the combustion efficiency of flames in a cross flow." Combustion and Flame, 119, pp.319-334.
3 Gogolek, P., Hayden, A.C.S., and Madrali, S. [2001] "Performance and Speciation of Solution Gas Flares Tested in the CANMET Flare Test Facility - Final Report." CETC report to PTAC.
4 Gogolek, P.E.G., and Hayden, A.C.S. [2002] “Efficiency of Flare Flames in Turbulent Crosswind.” Advanced Combustion Technologies, Natural Resources Canada, American Flame Research Committee Spring Meeting, May.
5 Gogolek, P.E.G., and Hayden, A.C.S. [2004] "Performance of flare flames in a crosswind with nitrogen dilution." Journal of Canadian Petroleum Technology, 43, pp. 43-47.
6 Gogolek, P.E.G., Caverly, A., Pohl, J., Schwarz, R., and Seebold, J. [2010] Emissions from Elevated Flares – A Survey of the Literature. CANMET Energy, Natural Resources Canada, prepared for the International Flaring Consortium.
7 Gollahalli and Parthasaronthy, R.P., "Turbulent Smoke Points in a Cross-Wind," Research Testing Services Agreement No. RTSA 3-1-98, University of Oklahoma, Norman, OK, August (1999).
8 Haus, Rainer, Wilkinson, Rob, Heland, Jorg, and Schafer, K. [1998] "Remote sensing of gas emissions on natural gas flares." Pure and Applied Optics, 7, pp.853-862.
9 Howell, L.W., Poudenx, P.D., Johnson, M.R., Wilson, D.J. and Kostiuk, L.W. [2003]. “Flare Stack Diameter Scaling.” Combustion Canada Conference 2003, Calgary, AB.
10 Johnson, Matthew R., Majeski, Adrian J., Wilson, David J., and Kostiuk, Larry W. [1998] "The Combustion Efficiency of a Propane Jet Diffusion Flame in Cross Flow." Fall Meeting of the Western States Section of the Combustion Institute, Seattle, Washington, 98F-38.
11 Johnson, M.R., and Kostiuk, L.W. [1999] "Effects of a Fuel Diluent on the Efficiencies of Jet Diffusion Flames in a Crosswind." The Combustion Institute, Canadian Section, 1999 Spring Technical Meeting, Edmonton, AB.
12 Johnson, M.R., Zastavniuk, O., Wilson, D.J., and Kostiuk, L.W. [1999] "Efficiency Measurements of Flares in a Cross Flow." Combustion Canada 1999, Calgary, AB.
13 Johnson, M.R., Zastavniuk, O., Dale, J.D., and Kostiuk, L.W. [1999] "The Combustion Efficiency of Jet Diffusion Flames in Cross-flow." Joint Meeting of the United States Sections - The Combustion Institute.
14 Johnson, M.R., and Kostiuk, L.W. [2000] "Efficiencies of Low-Momentum Jet Diffusion Flames in Crosswinds." Combustion and Flame, 123, pp. 189-200.
15 Johnson, M.R., Wilson, D.J., Kostiuk, L.W. [2000] “A Fuel Stripping Mechanism for Low-momentum Jet Diffusion Flames in a Crossflow.”Combustion Science and Technology, 169, pp. 155-174.
16 Kalghatgi, G.T. [1981] “Blow-Out Stability of Gaseous Jet Diffusion Flames. Part II: Effect of Cross Wind”, Combustion Science and Technology, 26, pp. 241-244.
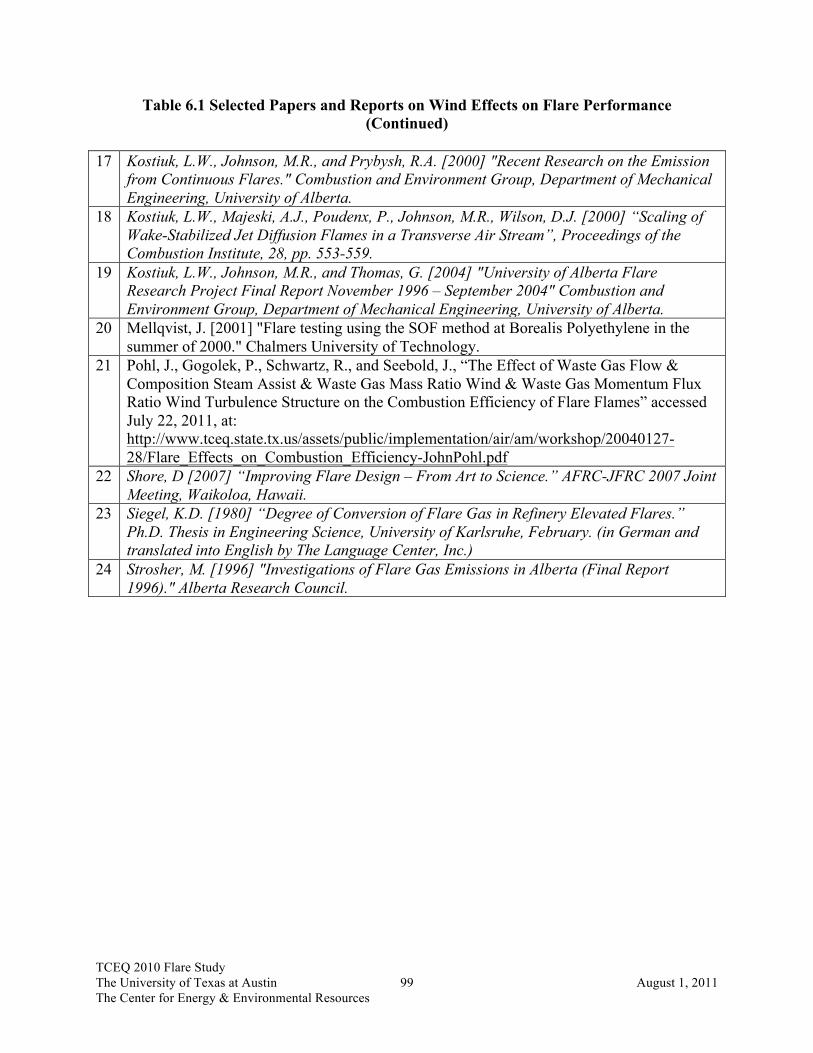
TCEQ 2010 Flare Study The University of Texas at Austin 99 August 1, 2011 The Center for Energy & Environmental Resources
Table 6.1 Selected Papers and Reports on Wind Effects on Flare Performance (Continued)
17 Kostiuk, L.W., Johnson, M.R., and Prybysh, R.A. [2000] "Recent Research on the Emission
from Continuous Flares." Combustion and Environment Group, Department of Mechanical Engineering, University of Alberta.
18 Kostiuk, L.W., Majeski, A.J., Poudenx, P., Johnson, M.R., Wilson, D.J. [2000] “Scaling of Wake-Stabilized Jet Diffusion Flames in a Transverse Air Stream”, Proceedings of the Combustion Institute, 28, pp. 553-559.
19 Kostiuk, L.W., Johnson, M.R., and Thomas, G. [2004] "University of Alberta Flare Research Project Final Report November 1996 – September 2004" Combustion and Environment Group, Department of Mechanical Engineering, University of Alberta.
20 Mellqvist, J. [2001] "Flare testing using the SOF method at Borealis Polyethylene in the summer of 2000." Chalmers University of Technology.
21 Pohl, J., Gogolek, P., Schwartz, R., and Seebold, J., “The Effect of Waste Gas Flow & Composition Steam Assist & Waste Gas Mass Ratio Wind & Waste Gas Momentum Flux Ratio Wind Turbulence Structure on the Combustion Efficiency of Flare Flames” accessed July 22, 2011, at: http://www.tceq.state.tx.us/assets/public/implementation/air/am/workshop/20040127-28/Flare_Effects_on_Combustion_Efficiency-JohnPohl.pdf
22 Shore, D [2007] “Improving Flare Design – From Art to Science.” AFRC-JFRC 2007 Joint Meeting, Waikoloa, Hawaii.
23 Siegel, K.D. [1980] “Degree of Conversion of Flare Gas in Refinery Elevated Flares.” Ph.D. Thesis in Engineering Science, University of Karlsruhe, February. (in German and translated into English by The Language Center, Inc.)
24 Strosher, M. [1996] "Investigations of Flare Gas Emissions in Alberta (Final Report 1996)." Alberta Research Council.

TCEQ 2010 Flare Study The University of Texas at Austin 100 August 1, 2011 The Center for Energy & Environmental Resources
7.0 Accuracy and Precision of Plume Sampling System Measurements The sources of ‘error’ in the extractive plume sampling methodology employed during the flare tests are addressed in this section. The known sources of bias, variability and noise present in this methodology are defined and addressed in this discussion. Before outlining the section, however, as an introduction we first consider a qualitative discussion looking at two chronological test points with different assist rates. The sampling measurement dataset has been described in Section 5. This introduction is a review of the method for determining the carbon fraction carried by propylene in the flare plume. It also depicts the time series data for two consecutive tests with different DRE on the same scale to illustrate the qualitative differences in the measurements.
Figure 7-1. Time Series During Air Flare Tests A5.5R2 and A5.3R2. The time series for the sample collector data is plotted for CO2, CO and propylene. The official stable test periods are denoted by the heavier line style. The point marked “a” is where the flare operational parameters were changed as described in the text. The “zero check” refers to overblowing the sample probe tip with dilution air to verify instrument zero drift performance. The assist air for Tests A5.5R2 and A5.3R2 was 23,100 lb/hr and 41,300 lb/hr, respectively. Figure 7-1 depicts a time series for propylene, carbon monoxide and carbon dioxide. The light coloring is the complete data time series and the two heavier line sections are the test conditions A5.5R2 and A5.3R2. The tests depicted here were run on the air flare using 80% propylene/20%

TCEQ 2010 Flare Study The University of Texas at Austin 101 August 1, 2011 The Center for Energy & Environmental Resources
TNG for the vent gas composition. The wind direction during the pair of events was consistently from the north (bearing 339° and 340° respectively). The median wind speed for the events depicted here were 3.1 and 5.0 mph respectively. The most significant change was the increase in air assist rate (made in the control room at or near the point marked “a”) which increased the air assist from 23,100 lb/hr to 41,300 lb/hr. The change in air assist was the only planned difference between A5.5R2 and A5.3R2. Inspection of Figure 7-1 reveals that the relative magnitude of high frequency plume intercepts by the sample collector for CO2 is qualitatively similar for the two test conditions. The CO and propylene however are significantly increased (A5.3R2 relative to A5.5R2). Although it is not depicted in the figure, the identical increases appear for methane, acetylene, ethylene, formaldehyde, and acetaldehyde. The carbon balance methodology, described briefly in Section 4 and more thoroughly in Appendix I, uses the following expression for determining DRE.
!"#/100 = 1−
!"#!$%&'&!"# !"#$%&!!"# !"#$%&
!"#!$%&'&!" !"#$%&!!" !"#$%&
= 1− !"!"#!$%&'& !"#!"!"#!$%&'& !" Eq. 7.1
In Equation 7.1, CF refers to the carbon fraction for the superscripted species and the DRE would be for propylene. The (in) term refers to the vent gas mixture, where the carbon fraction carried by propylene has been set according to the relative flow rates of propylene and TNG, but verified with gas chromatographic measurements (typically twice per test point). The (out) term refers to the flare plume emission to the atmosphere. Due to complete and partial combustion, there are several potential forms the vent gas carbon can take. “Complete combustion” will produce CO2 and a minor amount of CO and some trace hydrocarbons. The computation of CF must account for all forms of carbon in the flare plume. The expression for CF in the flare plume, derived in Appendix I, is repeated here as Equation 7.2.
!"!"#!$%&'& !"# =!"#!$%&'& (!!"#)/!"
!"#!$%&'& !!"# /!" + !"!/!" + 1+ !"ℎ!" !"#$%& (!!"#)/!"
Eq. 7.2
In Equation 7.2, each of the terms divided by CO are intended to be the ‘flare plume associated’ ratios. Figure (7-1) suggests that a time series analysis can extract the flare-associated ratios without any need to artificially subtract ambient levels or even know the extent of dilution if the time response for each of the instruments has been matched and any time offsets between the vectors accounted for.

TCEQ 2010 Flare Study The University of Texas at Austin 102 August 1, 2011 The Center for Energy & Environmental Resources
Although Figure 7-1 depicts two different test conditions, where the difference in the air assist rate is driving an obvious difference in DRE, the purpose of this section is to discuss the accuracy and precision in the DRE and CE reported by the sampling method. This section focuses on the topics below and will conclude with some overall assessment of the uncertainty in this approach.
7.1 Instrumentation Error a. Measurement accuracy (e.g., “span errors”) b. Measurement precision (e.g., Instrument noise) 7.2 Intra-test variability a. Vent gas composition variability b. Flare assist and operational control variability c. Sample intercept variability i. Height of sample probe ii. Wind/transverse location of sample probe 7.3 Test Condition Reproducibility

TCEQ 2010 Flare Study The University of Texas at Austin 103 August 1, 2011 The Center for Energy & Environmental Resources
7.1.a Measurement Accuracy The majority of the analytical instruments used for the in-situ sampling were chosen for their speed, sensitivity, accuracy and whenever possible their selectivity. Appendix I contains a description of the calibration procedures and results for each instrument. As was discussed in Section 4, the major constituents that determine DRE in the 80% propylene/20% TNG vent gas composition tests are CO2, CO, propylene and methane. The other trace hydrocarbon species constitute a smaller portion of the carbon in the exhaust. The accuracy of the specific trace hydrocarbon measurements does not affect the overall uncertainty in carbon fraction to the same extent as CO2, CO, propylene and methane. The accuracy of these species is more germane to the efforts to close the carbon balance which is discussed elsewhere. The CO2 concentration was measured using three different Licor brand non-dispersive infrared gas analyzers. The CO and methane concentrations were measured using different ARI quantum cascade laser (QCL) instruments based on tunable infrared laser differential absorption spectroscopy (TILDAS). The propylene was measured using proton transfer reaction mass spectrometry (PTRMS) and was verified using gas chromatography using a flame ionization detector (GC-FID).
Table 7-1. Measurement Accuracy and Calibration Checks for Selected Species
Compound Analytical Accuracy1
Calibration Check2
CO2 1% 1% CO 3% 1% Methane 6% 2% Propylene via PTRMS
15% 4%
Table Notes 1The tabulated analytical accuracy is the overall systematic uncertainty present in the specific method as deployed in general. It is either a manufacturer’s specification or is based on a propagation of systematic error present in the technique. 2The tabulated calibration check is an assessment of how well the specific instrument used for the test and data post-processing returned the input value when checked via some independent standard. The PTRMS calibration check tabulated here is explained in the text. The overall theoretical analytical accuracy for selected measurements is tabulated in Table 7-1 along with the in-field calibration evaluation. The instrument calibrations are described in Appendix-I. In the case of propylene quantification via PTRMS, the calibration check is the raw level of agreement between the returned mixing ratios (concentrations) measured during the test at 1 Hz averaged and compared to the periods where the GC-FID was also sampling from the diluted flare plume sample. The combined implication of instrument span error on the measured DRE should not be random. Based on the calibration checks that were performed over the course of the measurement period, for these species no obvious abrupt change in calibration or instrument sensitivity occurred. As a

TCEQ 2010 Flare Study The University of Texas at Austin 104 August 1, 2011 The Center for Energy & Environmental Resources
result, the instrument span source of error should be regarded as a uniform potential bias, thus consistent throughout the entire dataset. An estimate of the magnitude of this source of error is depicted in Figure 7-2. The variability in the uncertainty versus DRE expressed in Figure 7-2 reflects the associated accuracy of the different instruments. At high DRE where most of the carbon is CO2 the uncertainty approaches the accuracy limit (± 1%) that measurement. At low DRE the uncertainty increases towards the accuracy limit imposed by the measurement of propylene by the PTRMS technique.
Figure 7-2. DRE Instrument Span Error for the 80/20 Propylene/TNG Vent Gas Conditions. The red band reflects the propagated error sources in Table 7-1 expressed as DRE.
TCEQ 2010 Flare Study The University of Texas at Austin 105 August 1, 2011 The Center for Energy & Environmental Resources
7.1b Measurement Precision The majority of the results discussed in this report were derived from test conditions that exceeded 8 minutes in duration. As a result, the random noise associated with each specific instrument does not appreciably influence the computed carbon fraction when the whole test period is used as an ensemble.
Table 7-2. Instrument Precision Specifications
Low Scale Noise (1σ) High Scale Noise (1σ/average) Propylene 1.6 ppbv 6% CO2 38 ppbv < 1% CO 800 pptv < 1% Methane 3 ppbv < 1%
In Table 7-2 some precision related benchmarks are tabulated for the instrument as operated during the study. The low scale noise refers to the baseline instrument noise when the sample was at the lower ranges of signal detected in this study. The high-scale noise is more related to the proportional noise and has been quantified by expressing the ratio of 1 standard deviation of the sample to the mean value for the mid point of the calibration range for the instrument. The random noise performance of the instrument is not expected to appreciably influence the carbon fraction or DRE for the test point. 7.2.Intra-test variability Several parameters might vary during the test period where the flare has been called stable. The vent gas composition could be drifting during the event or not what was specified for the nominal composition for the test point. Operational characteristics (e.g., assist rate, total vent gas flow) might be drifting or variable. The sample collector flare plume intercept events (see Figure 7-1 for the nature of plume intercept events) will be influenced during the test by factors such as the height of the sample collector and the gusting nature of a variable wind. 7.2.a Vent gas composition variability The method for measuring the vent gas composition is described in detail in Appendix G. The TRC mobile laboratory collected a sample of the vent gas and analyzed the hydrocarbon concentration using GC every 5 minutes. The calibrated response for each of the peaks in the chromatogram was used to quantify the mixing ratio of the species in the vent gas exhaust. The carbon fraction of propylene in the vent gas, for the test conditions which nominally used 80%/20% propylene/TNG is computed from the measurement data using the following formula.
!"!"#!$%&'& !" = 3 × !"#!$%&'&
3 × !"#!$%&'& + 1 × !"#ℎ!"# + 2 × !"ℎ!"# + ! !"ℎ!" !"#
Eq. 7.3
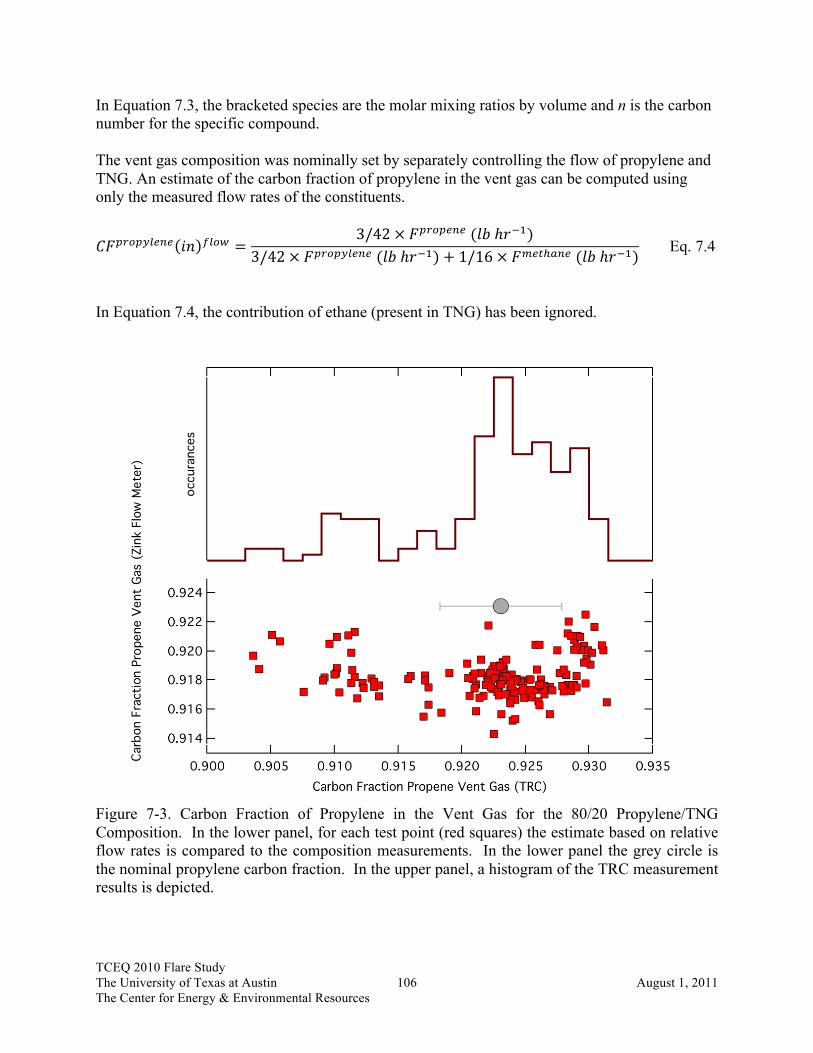
TCEQ 2010 Flare Study The University of Texas at Austin 106 August 1, 2011 The Center for Energy & Environmental Resources
In Equation 7.3, the bracketed species are the molar mixing ratios by volume and n is the carbon number for the specific compound. The vent gas composition was nominally set by separately controlling the flow of propylene and TNG. An estimate of the carbon fraction of propylene in the vent gas can be computed using only the measured flow rates of the constituents.
!"!"#!$%&'& !" !"#$ =3/42 × !!"#!$%$ (!" ℎ!!!)
3/42 × !!"#!$%&'& (!" ℎ!!!)+ 1/16 × !!!"!!"# (!" ℎ!!!) Eq. 7.4
In Equation 7.4, the contribution of ethane (present in TNG) has been ignored.
Figure 7-3. Carbon Fraction of Propylene in the Vent Gas for the 80/20 Propylene/TNG Composition. In the lower panel, for each test point (red squares) the estimate based on relative flow rates is compared to the composition measurements. In the lower panel the grey circle is the nominal propylene carbon fraction. In the upper panel, a histogram of the TRC measurement results is depicted.

TCEQ 2010 Flare Study The University of Texas at Austin 107 August 1, 2011 The Center for Energy & Environmental Resources
Figure 7-3 compares the carbon fraction of propylene in the vent gas computed using the flow rate data to the actual measurement using GC. Equation 7.1 uses the carbon fraction of propylene in the vent gas to compute DRE. The apparent variability based on the TRC measurements is 0.5%, 1σ of a Gaussian fit of the histogram of measurements. Based on the level of agreement observed between the flow rate and direct measurement methods, and the magnitude of variability in the resulting vent gas propylene carbon fraction, this source of error is not considered to be significant. 7.2.b Flare assist and operational control variability Zink personnel controlled the operation of the flare burners (air- and steam-assisted) and the vent gas composition nominally by separately controlling the flow of propylene (or propane), TNG and nitrogen. The process control instrumentation monitors were digitized and recorded. Prior to the establishment of a particular test point, the flare controls were set. Typically, three minutes elapsed while the flare control system was adjusted and monitored for stability. During the stable test periods, no modifications were made to the flare control parameters. Examination of the time series of the digitized parameters for flow assist rate (total steam and center steam for the steam flare and air flow for the air flare) does not suggest the control system had significant drift during the test point. At two points during the test, the near-real time diagnostics of flare control parameters alerted the control room when something was not following the test design and the data for the test point was set aside. The digital data record does not reveal any significant changes or variability in the operational flare control parameters. 7.2.c Sample collection variability The purpose of the TCEQ Comprehensive Flare Study was to determine the representative DRE as a function of flare operational parameters. It was not part of the project to quantify inhomogeneity in the combustion at varying flare radii. The study design deliberately attempted to sample a large volume of air and force mixing before characterizing the sampled constituents. Furthermore, during the project design phase, the sample collector was assumed to be at least two flame lengths away from the flare center to sample the plume at a location where combustion had ceased. Using estimates of stoichiometric combustion and the measured volumetric flow rate of the sample collector, it was estimated that the sample collector extracted approximately 15 - 20% of the total flare plume volume. At the distances the sample collector was deployed (away from the flare center), the flare combustion products were unavoidably diluted by an unknown, uncontrolled amount of non-combustion ambient air prior to entering the sample collector. It is clear that the sampler rapidly pulled in air that was highly influenced by the flare plume. Based on measurements of the inlet probe temperature, the portion the flare plume that entered the sampler was between 50° and 140° Fahrenheit above the measured ambient temperature. The air mass sampled during plume encounters had increases in CO2 concentration that were a factor of 2 to 50 times greater than the concentration of CO2 in the ambient air (e.g., the diluted flare plume had CO2 mixing ratios of 800 ppmv to 2%). The time series analysis approach used to generate the terms in Equation 7.2 that have the form of carbon-containing-compound per CO is not sensitive to the dilution by ambient air. In effect,

TCEQ 2010 Flare Study The University of Texas at Austin 108 August 1, 2011 The Center for Energy & Environmental Resources
this method is based on the variability in the dilution extent so that the concomitant increases in carbon-containing-compound and CO clearly reveal the flare plume associated ratio when compared to the mixing ratios in ambient air. The most important data quality indicator for DRE determined in the sampling methodology is its insensitivity to the extracted ratio with the chosen test time periods. To the extent that the ‘plume hits’ converge, this methodology asserts that the deduced DRE is the representative DRE needed to assess the emissions to the atmosphere. To test the intra test point variability that this analysis produces, test condition S4.6R1 has been partitioned into different intervals. The entire test point (approximately 10.5 min) has been partitioned into bins whose time intervals are ten seconds, twenty seconds, forty seconds and one minute and processed using the same methodology as used for the total ensemble analysis. The results of this analysis are depicted in Figure 7-4. The red diamond is the result from the whole event taken as an ensemble and reduced to a single DRE using Equation 7.2. The dark blue histogram in Figure 7-4 reflects the DRE for each of the shorter duration time periods. The central value of this histogram (fit to a Gaussian function) agrees well with the tabulated value 98.1% vs. 98.3%.

TCEQ 2010 Flare Study The University of Texas at Austin 109 August 1, 2011 The Center for Energy & Environmental Resources
Figure 7-4. DRE Variability Analysis for S4.6R1. The graph depicts the tabulated “ensemble” DRE and error bars (red diamond) along with the results of finer scale analysis described in text (histogram results and Gaussian fit). 7.2.c.i Height of sample probe The height of the sample probe was varied during many of the tests. Some additional tests were conducted for vertical profiling. Test point/run S4.1R1, described earlier in Section 4, was one of the test points where the sample collector was moved in the vertical direction to test whether or not a difference in the sampled DRE would be observed. There were tests, with DRE less than 70%, that exhibited some vertical variability and these results are a part of ongoing analyses. For the cases where the DRE was greater than 85%, no detectable dependence on DRE with sample collector height was observed. An alternative analysis of S4.1R1 results has been performed to evaluate the effect on DRE of sample collector height as well as to evaluate the extractive sampling method. Figure 7-5 plots the sample collector height time series along with observed total carbon (C) concentration. This analysis was conducted independently from ARI. Figure 7-5 is color coded into three segments, where DRE is calculated for each segment using the 1-second data and an independently derived

TCEQ 2010 Flare Study The University of Texas at Austin 110 August 1, 2011 The Center for Energy & Environmental Resources
formula for DRE. The time series analysis here does not use either the ‘ensemble’ slope or the time segment analysis.
Figure 7-5. Grouping by Sample Collector Height (z). See text for description of the color banding Figure 7-6 depicts the results for the alternative methodology to compare DRE with sample collector height This analysis which is based on the second-by-second calculations, from instrumentation that had time responses between 0.9 and 1.2 seconds). The results of a statistical analysis are tabulated in Table 7-3. For this analysis, which had a relatively high DRE, the DRE does not vary with sample collector height.
t
1e+05
2e+05
3e+05
4e+05
6.5
7.0
7.5
8.0
06.00 08.00 10.00 12.00 14.00 16.00
Total C (ppb)
z (m)
grp
1
2
3

TCEQ 2010 Flare Study The University of Texas at Austin 111 August 1, 2011 The Center for Energy & Environmental Resources
Figure 7-6. Histogram of Second-by-Second DRE Grouped by Sample Collector Height
Table 7-3. Summary of Second-by-Second DRE by Sample Collector Height Groups
Group No.
Accepted Records
Dropped Records
Mean (%)
Std. Dev. (%)
Min (%)
1Q (%)
Median (%)
3Q (%)
Max (%)
1 150 24 98.45 1.05 91.33 98.17 98.64 99.03 99.69 2 134 157 98.66 0.68 95.94 98.34 98.77 99.08 99.96 3 147 49 98.49 1.00 92.97 97.97 98.65 99.14 99.91
All Data 431 230 98.53 0.93 91.33 98.17 98.69 99.08 99.96 For the same grouping used above, DRE was verified using the slope methodology. These values are shown in Table 7-4. The net ensemble DRE calculated with this procedure agrees with the value reported in the ARI analysis. Table 7-4 shows relevant statistics from the analysis and subsequent calculations used to derive DRE. Also, the slope methodology did not indicate the
dre_cens
count 0
5
10
15
20
0
5
10
15
20
1
3
0.92 0.94 0.96 0.98 1.00
2
NA
0.92 0.94 0.96 0.98 1.00
grp2
1
2
3

TCEQ 2010 Flare Study The University of Texas at Austin 112 August 1, 2011 The Center for Energy & Environmental Resources
sample collector height as a significant variable in explaining the variation in DRE. The estimated range in DRE using the slope methodology was far smaller than the estimated range determined with the second-by-second method. This result is expected, as the nature of the estimates determined by each method is different. If the 1-second analysis method is used, the standard deviation captures the spread of the observation. If the slope method is used, the standard error is for the slope and it uses all of the observations to derive the slope. This method does not include a measure of spread of each data point. The slope method should also be less sensitive to the estimate of total carbon in the ambient air. Table 7-4. Estimated DRE Based on Slope Approach for Each of the Sample Collector Height Groups. Mid values are calculating using best estimates of slopes. Low/high value of CF and DRE are estimated using best estimate ± 2σ, assuming that CO2 and C3H6 do not correlate.
Group
No. CO2/CO slope C3H6/CO
slope CF (C3H6) DRE
best estimate
std. err.
best estimate
std. err.
Low (%)
mid (%)
High (%)
Low (%)
mid (%)
High (%)
1 182.69 6.99 3.28 0.13 1.503 1.754 2.045 97.78 98.10 98.37 2 205.66 4.05 3.60 0.08 1.577 1.714 1.861 97.98 98.14 98.29 3 205.97 8.81 3.86 0.13 1.576 1.829 2.128 97.69 98.02 98.29
All Data 199.38 3.52 3.57 0.06 1.637 1.752 1.875 97.97 98.10 98.23 7.2.c.ii Wind influence probe Between the real time diagnostics of temperature, CO2 concentration and the video record, it was straightforward to reposition the sample collector whenever there was a significant wind shift. During each test, the near real time analysis of the data stream suggested that the extracted DRE was not strongly influenced by changes in the wind. The measurements of DRE using the bulk sample collector (which rapidly collected a large volume of air that contained a mixture of the flare plume and ambient air) did not exhibit a strong sensitivity to gusting and changes in the winds. This is not an assertion that the degree of flare plume was not dependent on wind speed and direction. When the wind direction changed, the sample collector had to be repositioned to the new location ‘downwind’of the flare. However, the data suggest that at the typical distance downwind from the flare, the DRE from the sample that was collected depended more on the flare operational parameters than on the wind parameters. In general, the test conditions were favorable for obtaining data to address the study objectives. As the study objectives were not to develop a correlation between DRE and wind speed, additional analysis would be required to attempt to determine a relationship between DRE and crosswind speed for the two flare models used in this study.
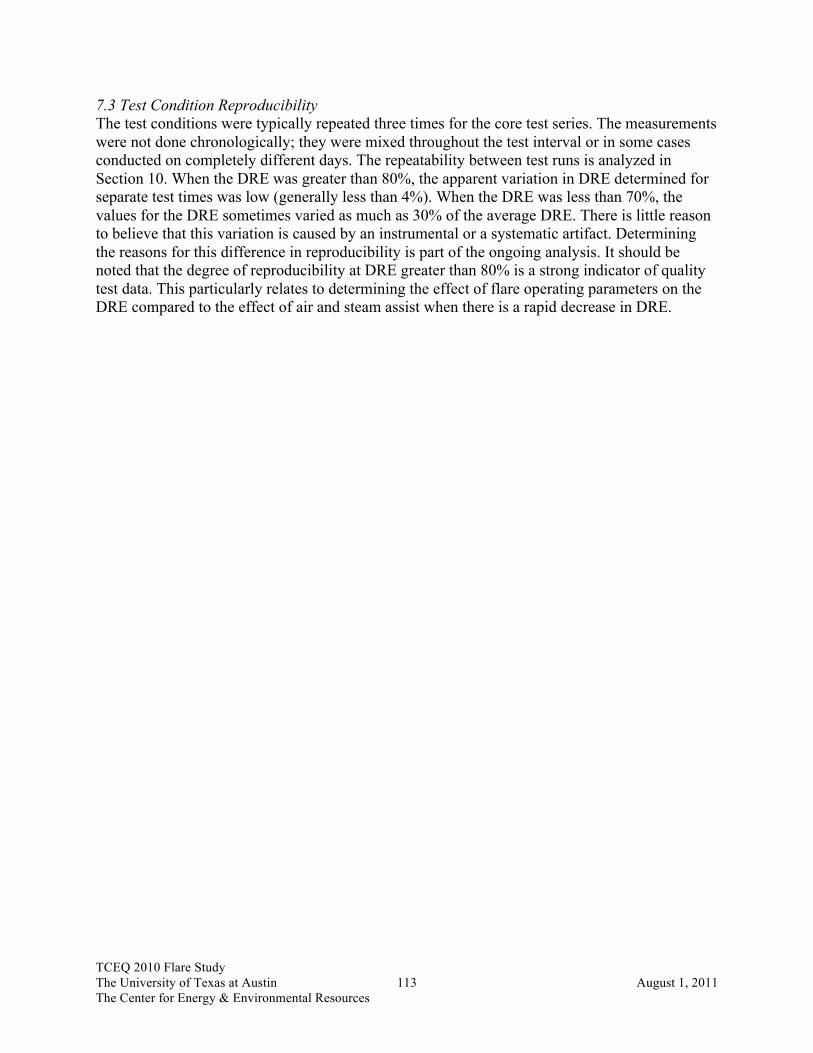
TCEQ 2010 Flare Study The University of Texas at Austin 113 August 1, 2011 The Center for Energy & Environmental Resources
7.3 Test Condition Reproducibility The test conditions were typically repeated three times for the core test series. The measurements were not done chronologically; they were mixed throughout the test interval or in some cases conducted on completely different days. The repeatability between test runs is analyzed in Section 10. When the DRE was greater than 80%, the apparent variation in DRE determined for separate test times was low (generally less than 4%). When the DRE was less than 70%, the values for the DRE sometimes varied as much as 30% of the average DRE. There is little reason to believe that this variation is caused by an instrumental or a systematic artifact. Determining the reasons for this difference in reproducibility is part of the ongoing analysis. It should be noted that the degree of reproducibility at DRE greater than 80% is a strong indicator of quality test data. This particularly relates to determining the effect of flare operating parameters on the DRE compared to the effect of air and steam assist when there is a rapid decrease in DRE.

TCEQ 2010 Flare Study The University of Texas at Austin 114 August 1, 2011 The Center for Energy & Environmental Resources
8.0 Measurements Made by Remote Sensing Technology Instruments There were three remote sensing technologies participating in the study: IMACC PFTIR and AFTIR spectrometers, Telops Hyper-Cam passive imaging radiometric spectrometer, and LSI FLIR GasFindIR and thermal IR cameras. The LSI cameras provide visual images of hydrocarbons in the gas phase and are useful in detection of these gases but cannot be used for quantitative assessment of flare combustion. The discussion in this section will focus on the IMACC and Telops instruments, which can measure parameters that can be used to calculate the combustion efficiency of the flare. Telops can also make mass flow rate measurements of hydrocarbons in the plume. However, the final quality assured Telops data were provided in February 2011 so comparison of the Telops mass flow rate results will be provided as an addendum to this report in September. As summarized in Section 3, the measurement of emissions in samples extracted from the plume and analyzed by ARI provided the baseline or reference DRE and CE values against which the remote sensing technologies would be compared. The results of the analyses of the extractive samples and determination of DRE and CE by ARI were not provided to IMACC or Telops. Subsequent to the field tests, IMACC and Telops submitted their CE measurements for each test run, including their standard deviation (σ) for their measurements. Three statistical criteria were selected to compare the measurements of IMACC and Telops with the ARI values. The first two are the mean difference and the standard deviation of the difference. These terms are defined numerically as follows.
!"#$ !"##$%$&'$ = !"# (!"!" − !"!"#)!!
!!!
! Eq. 8.1
!"#$%#&% !"#$%&$'( = (!"!" − !"!"#)! !!
!!!! − 1 Eq. 8.2
where mean difference = average of the absolute values of the difference between the CE
determined by the remote sensing contractor and the CE determined by ARI for test point i
standard deviation = standard deviation of the differences between the CE determined by the remote sensing contractor and the CE determined by ARI for the test point i
CERS = combustion efficiency determined by the remote sensing contractor for the test point i
CEARI = combustion efficiency determined by ARI for the test point i N = total number of test points in the subset

TCEQ 2010 Flare Study The University of Texas at Austin 115 August 1, 2011 The Center for Energy & Environmental Resources
The third criterion is data return. Data return is the percentage of the total number of possible test points for which data were reported. It is defined numerically as follows.
!"#" !"#$!% = !"#$%& !" !"#! !"#$%& !"# !ℎ!"ℎ !"#" !"#" !"#$!%"&
!"#$% !"#$%& !" !"#! !"#$%& × 100 Eq. 8.3
Tables D-1 and E-1 summarize data for all flare test results, including the IMACC and Telops CE and standard deviation, σ, by test series and run number. The CE values of ARI, IMACC and Telops for all steam flare tests have been graphed in Figure 8-1. These same data for all air flare tests are shown in Figure 8-2. As can be seen from these graphs, the scatter between values tends to increase significantly after about CE = 80%. Since the focus of this study is about DRE and CE above 90%, there is less importance in examining the performance of these remote sensing technologies much below CE = 90%. Therefore, the remainder of the comparison of these remote sensing technologies will focus on their performance in the range 100% ≥ CE ≤ 80%. To more easily compare IMACC’s and Telops’ data with ARI’s, the CE data have been extracted from Tables D-1 and E-1 and sorted by ARI CE (CEARI) value in descending order for the range 100% ≥ CE ≤ 80% in Tables D-2 and E-2. On the assumption that the accuracy of the CE values may not be constant across this entire range, the data have been further divided as follows: CEARI≥ 95%; 90 ≥ CEARI < 95%; 85% ≥ CEARI < 90%; and 80% ≥ CEARI< 85%. The difference between the IMACC’s and Telops’s CE values and the CEARI values are shown in each table. At the bottom of the column of the CE differences are the mean difference and the standard deviation of the CE differences are calculated as described in Equations 8-1 and 8-2. These two criteria are summarized in Table 8-1, where data return has also been calculated from the data in Tables D-2 and E-2. Steam Flare Tests The CE data for the four ranges are graphed in Figures 8-3 to 8-6 in descending CE order. As shown in Table 8-1, the mean difference and the standard deviation of the CE differences for the IMACC AFTIR and PFTIR increase as the CEARI decreases. The mean difference and the standard deviation of the CE differences for the Telops CE values do not have a clear trend. In examining the differences in CE values in Table D-2, the IMACC AFTIR and Telops values tend to be biased (sum of the differences) lower than the CEARI values. The PFTIR values do not appear to have a bias relative to CEARI.
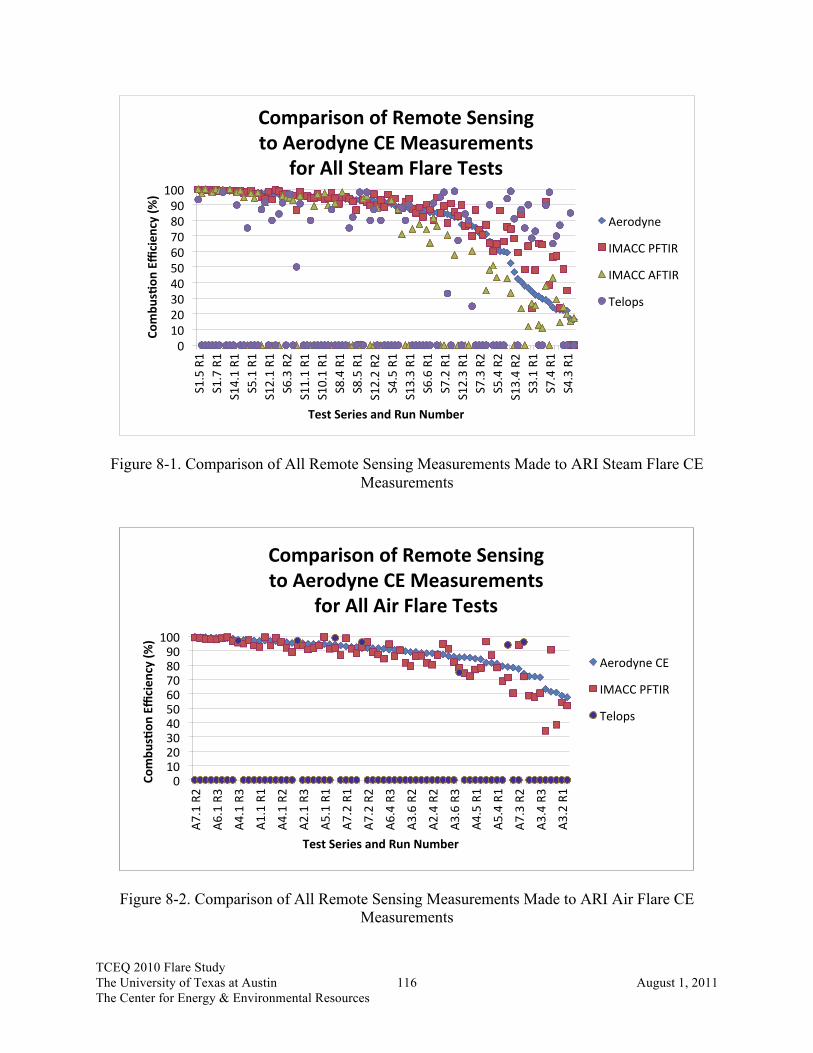
TCEQ 2010 Flare Study The University of Texas at Austin 116 August 1, 2011 The Center for Energy & Environmental Resources
Figure 8-1. Comparison of All Remote Sensing Measurements Made to ARI Steam Flare CE Measurements
Figure 8-2. Comparison of All Remote Sensing Measurements Made to ARI Air Flare CE Measurements
0 10 20 30 40 50 60 70 80 90
100 S1.5 R1
S1.7 R1
S14.1 R1
S5.1 R1
S12.1 R1
S6.3 R2
S11.1 R1
S10.1 R1
S8.4 R1
S8.5 R1
S12.2 R2
S4.5 R1
S13.3 R1
S6.6 R1
S7.2 R1
S12.3 R1
S7.3 R2
S5.4 R2
S13.4 R2
S3.1 R1
S7.4 R1
S4.3 R1
Combu
sNon
Efficien
cy (%
)
Test Series and Run Number
Comparison of Remote Sensing to Aerodyne CE Measurements
for All Steam Flare Tests
Aerodyne
IMACC PFTIR
IMACC AFTIR
Telops
0 10 20 30 40 50 60 70 80 90 100
A7.1 R2
A6.1 R3
A4.1 R3
A1.1 R1
A4.1 R2
A2.1 R3
A5.1 R1
A7.2 R1
A7.2 R2
A6.4 R3
A3.6 R2
A2.4 R2
A3.6 R3
A4.5 R1
A5.4 R1
A7.3 R2
A3.4 R3
A3.2 R1
Combu
sNon
Efficien
cy (%
)
Test Series and Run Number
Comparison of Remote Sensing to Aerodyne CE Measurements
for All Air Flare Tests
Aerodyne CE
IMACC PFTIR
Telops

TCEQ 2010 Flare Study The University of Texas at Austin 117 August 1, 2011 The Center for Energy & Environmental Resources
Table 8-1. Summary of Comparison Criteria for Remote Sensing CE Values for CEARI > 80%
Steam
Range Criterion Telops AFTIR PFTIR ARI
CEARI ≥ 95%
Mean Difference (% pts) 20.2 1.7 1.1 Standard Deviation (% pts) 32.2 2.5 2.1
Data Return (%) 39 100 100 Number of Test points 14 22* 36 36
90% ≤ CEARI < 95%
Mean Difference (% pts) 9.6 3.2 2.2 Standard Deviation (% pts) 11.3 3.7 2.9
Data Return (%) 40 100* 95 Number of Test points 8 8 19 20
85% ≤ CEARI < 90%
Mean Difference (% pts) 3.8 12.2 2.8 Standard Deviation (% pts) 6.1 14.8 3.4
Data Return (%) 27 100* 100 Number of Test points 3 6 11 11
80% ≤ CEARI < 85%
Mean Difference (% pts) 18.8 12.2 4.6 Standard Deviation (% pts) 26.1 16.7 5.9
Data Return (%) 75 100* 100 Number of Test points 6 4 8 8
Air Range Criterion Telops AFTIR PFTIR ARI
CEARI ≥ 95%
Mean Difference (% pts) 1.2 1.9 Standard Deviation (% pts) 2.0 2.5
Data Return (%) 10 100 Number of Test points 2 21 21
90% ≤ CEARI < 95%
Mean Difference (% pts) 4.4 3.5 Standard Deviation (% pts) 6.3 4.1
Data Return (%) 11 100 Number of Test points 2 18 18
85% ≤ CEARI < 90%
Mean Difference (% pts) NMR 5.5 Standard Deviation (% pts) NMR 6.5
Data Return (%) 0 100 Number of Test points 0 10 10
80% ≤ CEARI < 85%
Mean Difference (% pts) 10.2 8.5 Standard Deviation (% pts) 10.2 9.9
Data Return (%) 13 100 Number of Test points 1 8 8
NMR = No CE vales were reported for these tests. *Instrument not on site to obtain measurements during some of these test points.

TCEQ 2010 Flare Study The University of Texas at Austin 118 August 1, 2011 The Center for Energy & Environmental Resources
Figure 8-3. Comparison of All Remote Sensing Measurements Made to ARI Steam Flare CE Measurements ≥ 95%
Figure 8-4. Comparison of All Remote Sensing Measurements Made to ARI Steam Flare CE Measurements 90% ≤ CEARI <95%
50
60
70
80
90
100 S1.5 R1
S1.6 R1
S3.7 R1
S6.1 R1
S2.1 R1
S14.1 R1
S6.5 R1
S13.1 R1
S4.2 R2
S8.1 R1
S12.1 R1
S2.1 R2
S3.5 R2
S6.3 R3
S8.3 R1
S11.1 R1
S14.4 R1
S3.5 R1
Combu
sNon
Efficien
cy (%
)
Test Series and Run Number
Comparison of Remote Sensing to Aerodyne CE Measurements for Steam Flare Tests CE >= 95%
Aerodyne
IMACC PFTIR
IMACC AFTIR
Telops
50
60
70
80
90
100
S5.1 R2
S4.1 R2
S13.2 R1
S5.6 R1
S8.4 R1
S5.1 R3
S10.2 R1
S11.2 R1
S9.1 R1
S8.5 R1
S7.1 R1
S5.6 R2
S5.6 R3
S9.2 R1
S12.2 R2
S5.5 R1
S10.3 R1
S7.2 R2
S12.2 R1
S4.5 R1
Combu
sNon
Efficien
cy (%
)
Test Series and Run Number
Comparison of Remote Sensing to Aerodyne CE Measurements
for Steam Flare Tests 90% <= CE < 95 %
Aerodyne
IMACC PFTIR
IMACC AFTIR
Telops

TCEQ 2010 Flare Study The University of Texas at Austin 119 August 1, 2011 The Center for Energy & Environmental Resources
Figure 8-5. Comparison of All Remote Sensing Measurements Made to ARI Steam Flare CE Measurements 85% ≤ CEARI <90%
Figure 8-6. Comparison of All Remote Sensing Measurements Made to ARI Steam Flare CE Measurements 80% ≤ CEARI <85%
50
60
70
80
90
100 S7.1 R2
S4.7 R1
S3.2 R2
S11.3 R1
S13.3 R1
S5.3 R1
S9.3 R1
S5.3 R2
S7.2 R3
S6.6 R1
S6.4 R2
Combu
sNon
Efficien
cy (%
)
Test Series and Run Number
Comparison of Remote Sensing to Aerodyne CE Measurements
for Steam Flare Tests 85% <= CE < 90%
Aerodyne
IMACC PFTIR
IMACC AFTIR
Telops
50
60
70
80
90
100
S5.3 R3
S1.9 R1
S10.4 R1
S7.2 R1
S4.8 R1
S13.5 R1
S6.4 R3
S11.4 R1
Combu
sNon
Efficien
cy (%
)
Test Series and Run Number
Comparison of Remote Sensing to Aerodyne CE Measurements
for Steam Flare Tests 80%<= CE < 85%
Aerodyne
IMACC PFTIR
IMACC AFTIR
Telops

TCEQ 2010 Flare Study The University of Texas at Austin 120 August 1, 2011 The Center for Energy & Environmental Resources
In examining the data return in Table 10-1, the IMACC AFTIR was 100% in all four ranges, while the PFTIR was 100% in all ranges except 90% ≤ CEARI < 95%, where it was 95%. Data return for the Telops CE values was 40% or less for all ranges except 80% ≤ CEARI < 85%, where it was 75%. Air Flare Tests The CE data for the four ranges are graphed in Figures 10-7 to 10-10. As shown in Table 10-1, the mean difference and the standard deviation of the CE differences for the IMACC PFTIR increase as the CEARI decreases. The IMACC AFTIR was not deployed for any of the air flare tests. In examining the CE differences in Table E-2, the data tend to be biased low relative to the CEARI values. The number of Telops data points, five, for all four ranges of the air flare tests are too few to statistically develop trend data. Additionally, the data return for these four CEARI ranges did not exceed 13%. Therefore, no additional analyses will be performed on the Telops air flare data. In summary, the IMACC PFTIR mean differences for the range CEARI ≥ 90% for both the air and steam flare tests averaged 2.2 percentage points, with an average standard deviation of the CE differences of 2.9 percentage points and average data return of 99%. The IMACC AFTIR mean difference for the range CEARI ≥ 90% for the steam flare tests averaged 2.5 percentage points, with an average standard deviation of the CE differences of 3.1 percentage points and an average data return of 100%. The Telops mean difference for the range CEARI ≥ 90% for the steam flare tests averaged 14.9 percentage points, with an average standard deviation of the CE differences of 22.8 percentage points and an average data return of 39%. Data Processing All participants were required to submit their preliminary data within six weeks of completion of the field campaign. Telops was unable to do so. Their report explains some of the challenges they had in making measurements and processing the large volume of data generated by their sensor and the number of test points conducted in this study.
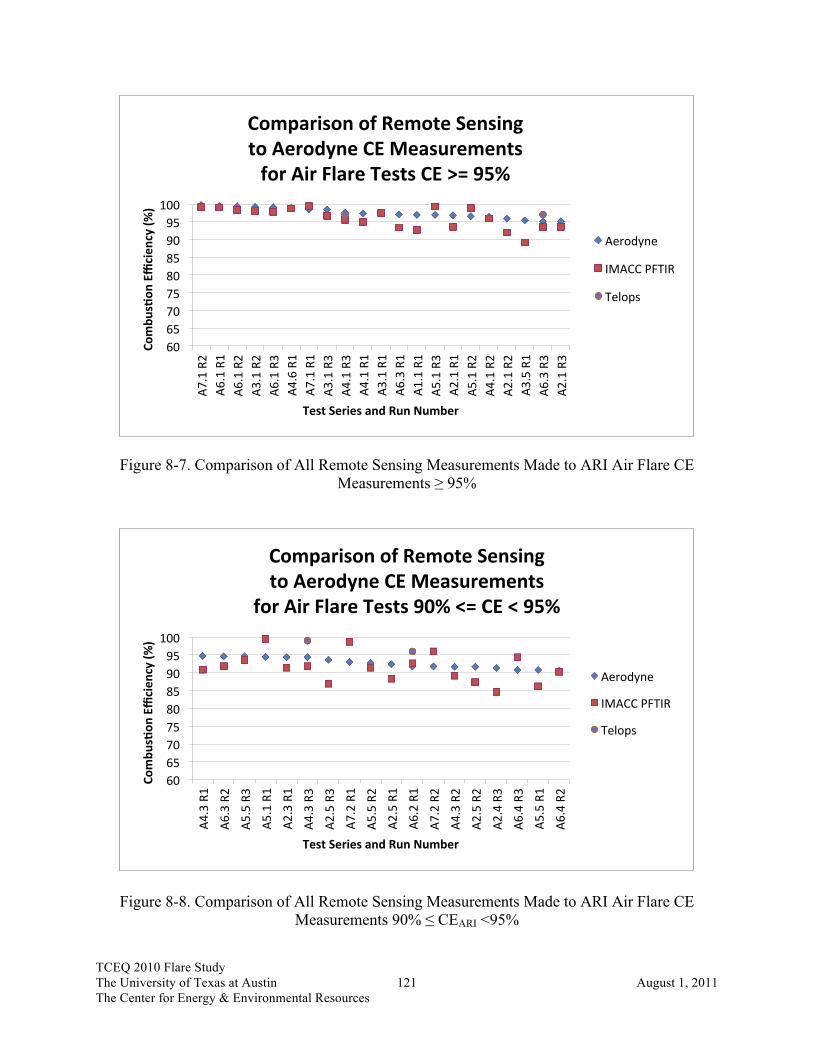
TCEQ 2010 Flare Study The University of Texas at Austin 121 August 1, 2011 The Center for Energy & Environmental Resources
Figure 8-7. Comparison of All Remote Sensing Measurements Made to ARI Air Flare CE Measurements ≥ 95%
Figure 8-8. Comparison of All Remote Sensing Measurements Made to ARI Air Flare CE Measurements 90% ≤ CEARI <95%
60 65 70 75 80 85 90 95 100
A7.1 R2
A6.1 R1
A6.1 R2
A3.1 R2
A6.1 R3
A4.6 R1
A7.1 R1
A3.1 R3
A4.1 R3
A4.1 R1
A3.1 R1
A6.3 R1
A1.1 R1
A5.1 R3
A2.1 R1
A5.1 R2
A4.1 R2
A2.1 R2
A3.5 R1
A6.3 R3
A2.1 R3
Combu
sNon
Efficien
cy (%
)
Test Series and Run Number
Comparison of Remote Sensing to Aerodyne CE Measurements for Air Flare Tests CE >= 95%
Aerodyne
IMACC PFTIR
Telops
60 65 70 75 80 85 90 95 100
A4.3 R1
A6.3 R2
A5.5 R3
A5.1 R1
A2.3 R1
A4.3 R3
A2.5 R3
A7.2 R1
A5.5 R2
A2.5 R1
A6.2 R1
A7.2 R2
A4.3 R2
A2.5 R2
A2.4 R3
A6.4 R3
A5.5 R1
A6.4 R2
Combu
sNon
Efficien
cy (%
)
Test Series and Run Number
Comparison of Remote Sensing to Aerodyne CE Measurements
for Air Flare Tests 90% <= CE < 95%
Aerodyne
IMACC PFTIR
Telops

TCEQ 2010 Flare Study The University of Texas at Austin 122 August 1, 2011 The Center for Energy & Environmental Resources
Figure 8-9. Comparison of All Remote Sensing Measurements Made to ARI Air Flare CE Measurements 85% ≤ CEARI <90%
Figure 8-10. Comparison of All Remote Sensing Measurements Made to ARI Air Flare CE Measurements 80% ≤ CEARI <85%
60 65 70 75 80 85 90 95 100
A3.6 R1
A3.6 R2
A4.4 R3
A4.4 R1
A2.4 R1
A2.4 R2
A4.4 R2
A7.5 R1
A6.4 R1
A3.6 R3
A4.5 R3
A3.3 R1
A5.3 R2
Combu
sNon
Efficien
cy (%
)
Test Series and Run Number
Comparison of Remote Sensing to Aerodyne CE Measurements
for Air Flare Tests 85% <= CE < 90%
Aerodyne
IMACC PFTIR
Telops
60 65 70 75 80 85 90 95 100
A4.5 R1 A4.5 R2 A7.3 R1 A6.5 R1 A5.4 R1
Combu
sNon
Efficien
cy (%
)
Test Series and Run Number
Comparison of Remote Sensing to Aerodyne CE Measurements
for Air Flare Tests 80% <= CE < 85%
Aerodyne
IMACC PFTIR
Telops

TCEQ 2010 Flare Study The University of Texas at Austin 123 August 1, 2011 The Center for Energy & Environmental Resources
Summary of the Development of Passive FTIR (PFTIR) Flare Monitoring The following information is provided in response to a comment received by the TCEQ during the public comment period for the draft flare study report. It was provide by Bob Spellicy, IMACC (email message from R. Spellicy, IMACC, to V. Torres, UT Austin, July 8, 2011).
The PFTIR methodology used in this study was developed over many years. It was initially constructed for a flare test at John Zink in 1984, which was funded by the US EPA Office of Research and Development in Research Triangle Park, NC. After that test, there was little interest in passive monitoring until the 2003 TCEQ test at John Zink. This was the first test that afforded an opportunity to challenge the methodologies. It also provided controlled data of a high quality so the algorithms and procedures could be tested and upgraded. Again, little was done until September of 2009 when the Marathon, Texas City test was conducted. IMACC and Clean Air Engineering approached this test believing more development would be required to perfect the passive technology. In reality, only minor alterations were needed in the algorithms and the calibration procedures. Between the Texas City test and the TCEQ 2010 Flare Study, several major flare programs were undertaken. These included: INEOS – Addyston, Ohio November 2009, Shell - Deer Park, Texas February 2010, and Marathon – Detroit, Michigan July 2010. All of these programs added to the knowledge of the passive techniques and allowed for further refinement of the procedures. The instrumentation, procedures, and algorithms used in the TCEQ 2010 Flare Study were extensively modified and upgraded from that used in the 2003 TCEQ test. The improvements in data quality since that test reflect the developments.
TCEQ 2010 Flare Study The University of Texas at Austin 124 August 1, 2011 The Center for Energy & Environmental Resources
9.0 Summary of Speciation of Emissions Measured During Propylene Tests
Excluding CO and CO2, Table 6-1 lists the hydrocarbon species typically found during the flare tests conducted with propylene/TNG flare tests and their weight ratios to propylene. An explanation of the determination of these weight ratios follows. The sum of all carbon containing species was compared to a measurement of CO2 following passage over an oxidation catalyst. The carbon budget balance was estimated by comparing the sum of the specific compounds to the total carbon proxy measurement. The specific compounds, named or quantified as sums, together with CO and CO2 account for 98% of the ppmC carbon measured using the oxidation catalyst method. The error in the overall ppmC measurement technique is 4% (Appendix I). The combined error in the sum of all carbon containing compounds (weighted by the estimated contribution to ppmC) is 7%. Additional discussion of the carbon balance in the extractive sampling method will be discussed in future publications focused on this issue. The forms of carbon containing species that would elude detection in the analytical suite are either not transmitted through the sample line or believed to be highly unlikely given knowledge of the vent gas composition. Thus, it is believed that we have achieved carbon balance was achieved within the systematic capability of the instruments as operated during the test. The 13 species tabulated below, in addition to CO and CO2 constitute 97.3% of the total carbon. These VOCs are the by-products of propene/methane partial and incomplete combustion. NOx was also measured during the flare tests, but it is not included because NOx was measured using a commercial chemiluminescence analyzer. This instrument did not meet the data quality objectives over all the ranges of DRE observed. Using the data from Table 9-1, the measured emissions tabulated for each of the propylene/TNG flare tests in Appendix F, Tables F-4 and F-5 in descending ARI DRE order. In Table 9-2, the measured emissions (lb/hr) for propylene, methane, total VOCs and THCs are listed for five steam and five air tests with DREs approximately 90% and above. As points of reference, the Test Point, Run Number and propylene flow rate (lb/hr) in the vent gas along with the DRE for the test point/run number are also included with the estimates. As an example, S3.6R1 with DRE (propylene) = 99.9%, the measured emissions were 0.13 lb/hr propylene and 0.15 lb/hr total VOCs. At a DRE (propylene) = 96.0% (S4.1R2), the measured emissions were 19.21 lb/hr propylene and 21.78 lb/hr total VOCs. And finally, at DRE (propylene) = 89.9% (S11.3R1), the measured emissions were 29.61 lb/hr propylene and 32.46 lb/hr total VOCs.

TCEQ 2010 Flare Study The University of Texas at Austin 125 August 1, 2011 The Center for Energy & Environmental Resources
Table 9-1. List of Hydrocarbons Emissions Found in Plume During Propylene Flare Tests and Their Weight Ratio to Propylene
Air Flare
DRE Range >98 >95-‐98 >80-‐95 ≤80 Species lb species per lb propylene Acetylene 0.06253619 0.045724095 0.043341381 0.021789857 Ethylene 0.030726667 0.020664 0.017978 0.009274 Propylene 1 1 1 1 Butene isomers 0.000207107 0.000167293 0.001650667 0.004800533 Formaldehyde 0.046316429 0.030311429 0.024688571 0.012678571 Acetaldehyde 0.030758095 0.019197619 0.014572381 0.006882857 Propanal 0.000966611 0.000695296 0.00066758 0.000404082 Acrolein 0.0186396 0.014219933 0.009904 0.003840427 Methanol 0.002015086 0.00140419 0.00156259 0.001172952 Acetone 0.001159934 0.000834355 0.000801096 0.000484898 Propylene-‐Oxide 0.001449917 0.001042944 0.000556317 0.000202041 Methane 0.131809524 0.131809524 0.131809524 0.131809524 Ethane 0.010281143 0.010281143 0.010281143 0.010281143
Steam Flare DRE Range >98 >95-‐98 >80-‐95 ≤80 Species lb species per lb propylene Acetylene 0.022798286 0.016445 0.01615219 0.010398143 Ethylene 0.038847333 0.027816 0.019898 0.009073333 Propylene 1 1 1 1 Butene isomers 0.000320947 0.00027444 0.002077067 0.007318667 Formaldehyde 0.058759286 0.038423571 0.026517857 0.010231429 Acetaldehyde 0.037277429 0.022619143 0.015254381 0.005405295 Propanal 0.001090317 0.001003566 0.00085347 0.000531901 Acrolein 0.0288852 0.0233274 0.0124624 0.005854933 Methanol 0.00131581 0.001346133 0.001088305 0.000779581 Acetone 0.001308381 0.001204279 0.001024164 0.000638282 Propylene-‐Oxide 0.001635476 0.001505349 0.000711225 0.000265951 Methane 0.131809524 0.131809524 0.131809524 0.131809524 Ethane 0.010281143 0.010281143 0.010281143 0.010281143
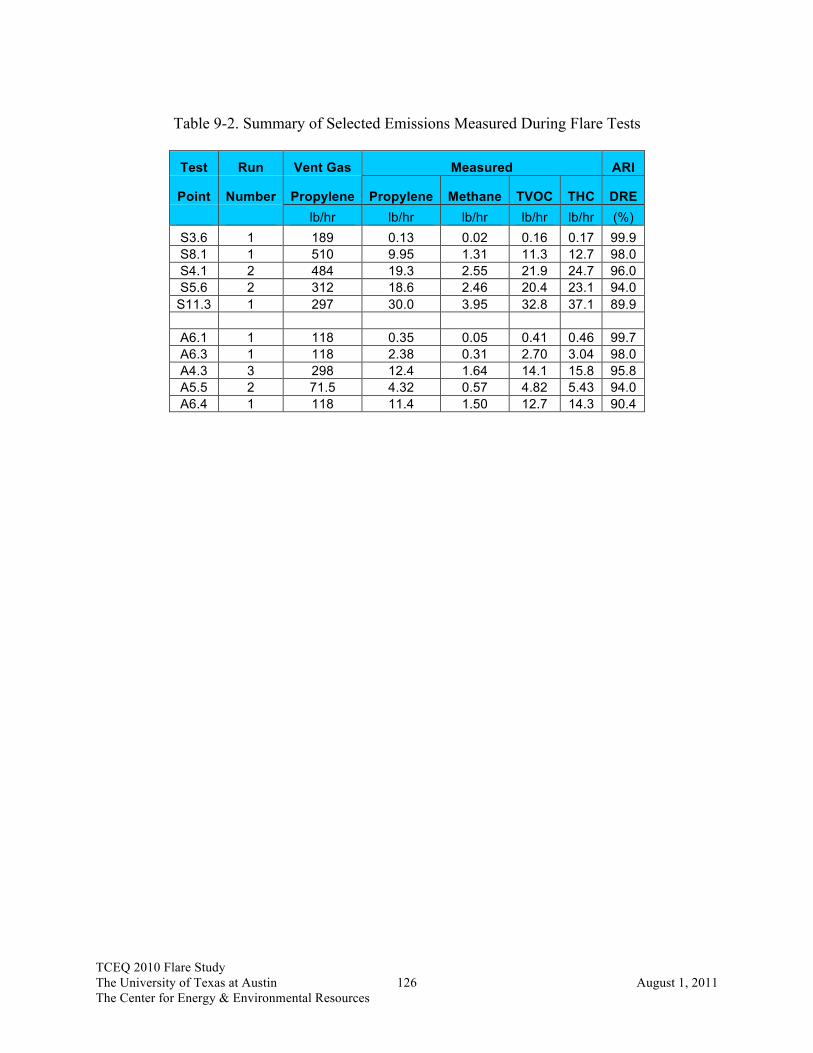
TCEQ 2010 Flare Study The University of Texas at Austin 126 August 1, 2011 The Center for Energy & Environmental Resources
Table 9-2. Summary of Selected Emissions Measured During Flare Tests
Test Run Vent Gas Measured ARI
Point Number Propylene Propylene Methane TVOC THC DRE lb/hr lb/hr lb/hr lb/hr lb/hr (%) S3.6 1 189 0.13 0.02 0.16 0.17 99.9 S8.1 1 510 9.95 1.31 11.3 12.7 98.0 S4.1 2 484 19.3 2.55 21.9 24.7 96.0 S5.6 2 312 18.6 2.46 20.4 23.1 94.0
S11.3 1 297 30.0 3.95 32.8 37.1 89.9
A6.1 1 118 0.35 0.05 0.41 0.46 99.7 A6.3 1 118 2.38 0.31 2.70 3.04 98.0 A4.3 3 298 12.4 1.64 14.1 15.8 95.8 A5.5 2 71.5 4.32 0.57 4.82 5.43 94.0 A6.4 1 118 11.4 1.50 12.7 14.3 90.4
TCEQ 2010 Flare Study The University of Texas at Austin 127 August 1, 2011 The Center for Energy & Environmental Resources
10.0 Quality Assurance Quality assurance for this study began with the development and approval of a Category 2 Quality Assurance Project Plan. This plan was followed during all phases of the testing from maintenance of certificates of conformance for gas standards and factory calibration of instruments, where appropriate, to initial calibration of instruments pre-test through daily calibration checks, most performed at least twice per day on critical measurement systems like the TRC and ARI instruments. An overview of the calibration activities and copies of the supporting documentation for field calibrations are included Appendix K by company. Data Quality Indicators During a flare test, there were four parameters that provided indications of the quality of the data being collected during the testing. These four parameters were: the sample collector inlet gas temperature as measured by the three thermocouples at the inlet; the live video feed of the LSI visible, IR and two FLIR cameras used to position the collector and view the flare plume as it traveled to the sample collector; ratios of key combustion emission concentrations; and repeatability of results. Additionally, post testing a fifth parameter also provided an indication of the the quality of the data. This fifth indicator was the degree of agreement in CE ≥ 85% between one of the remote sensing technology measurements and the extractive measurements made by ARI has provided further independent corroboration of the level of quality of the data from this study. Each will now be discussed. Average Sample Collector Inlet Temperature One of the most important criteria in obtaining a DRE and CE that reflects the all combustion that has occurred in the flare, is to ensure that emission measurements are made far enough downwind of the plume to ensure no further combustion is occurring in the plume. Since one product of combustion is heat, then an elevation of the plume temperature above the steam assist temperature would indicate some degree of combustion. Conversely, no or little combustion would result in a plume temperature at or below the steam assist temperature. So the anticipated steam temperature, approximately 250°F, was selected as an upper temperature limit for the collector inlet temperature. Indeed the steam temperatures ran in the range of 220°F to 300°F during the test series. On the lower end, the ambient temperature would be an indicator that the collector inlet could be outside the plume, i.e., any increase in temperature above ambient temperature would certainly indicate thermal effects of the plume and therefore being in some portion of the plume exhaust. But what if there was little or no steam assist as in the case of the air flare. Because the gauge used in the definition of the incipient smoke point involves distances two flame lengths from the flare tip, it was critical to always locate the sample collector inlet no closer in distance than this point in the plume. The first test point run was on the steam flare with the vent gas all propylene. This was a “practice” test to allow all participants to acquaint their systems with the protocol to be used. It allowed us to fine tune positioning of the collector. This test showed that just past two flame lengths away, the average collector inlet temperature was in the range of 150°F to 170°F. If the collector were backed away to an average collector inlet temperature of about 105°F, the signal required by ARI to adequately measure emissions had not degraded sufficiently, i.e.,

TCEQ 2010 Flare Study The University of Texas at Austin 128 August 1, 2011 The Center for Energy & Environmental Resources
greater dilution with ambient air, to adversely affect the accuracy of their measurement. So the temperature range of 105°F to 150°F was used for the steam-assisted flare tests as the average sample collector inlet temperature range where ARI measurements could be made that complied with the data quality objectives for their measurements of plume emissions needed to calculate DRE and CE. This assumed of course that that the collector was in a plume with a high level of combustion, i.e., strong thermal signal. Four Way Video Camera Images In practice, it was learned that with the test parameters and equipment that the flame could never be extinguished, i.e., snuff the flame, with the maximum flow of steam or air assist designed for this project. So the case of no combustion for the composition of the vent gas used never occurred in this test series. For the case of poor combustion or significant incomplete combustion, the UT Austin team depended on the two GasFind IR cameras, whose image of the plume actually improved with greater signal, i.e., when there were more unburned hydrocarbons in the plume. Figure 10-1 is video image produced by LSI using the four cameras used during the field tests. The Sony visible light camera, aimed approximately perpendicular to the travel of the plume, produced the top left image. The GasFind IR-stationary camera, aimed looking approximately perpendicular to the travel of the plume, produced the bottom left image. The GasFind IR-mobile camera, aimed approximately coincident with the travel of the plume, produced the bottom right image. The thermal IR camera, aimed at approximately the same angle as the GasFind IR-stationary camera, produced the top right image. These four cameras were used to help find the plume when there was minimal flame or a plume that was invisible to the naked eye and to verify that the unburned products of combustion were traveling in the same path as the thermal products of combustion. The sample collector can be seen in each of the images near the flare plume. The sample collector inlet would be positioned to intersect the largest portion of the plume. It was easy to line up the collector to intersect the plume if the wind direction was not changing rapidly. Fortunately for the study team, as can be seen in Appendix J, during the 7 to 10 minutes period of a test run, the wind direction did not change significantly during most of the test series. For those few runs where the wind direction was changing significantly, the collector would be repositioned frequently during the test to stay in the plume using the average collector inlet temperature, the real-time images of the four video cameras, and the ratios of concentrations of flare emissions in the plume measured by ARI. For these tests, longer run times were employed to obtain sufficient data to provide repeatable results.
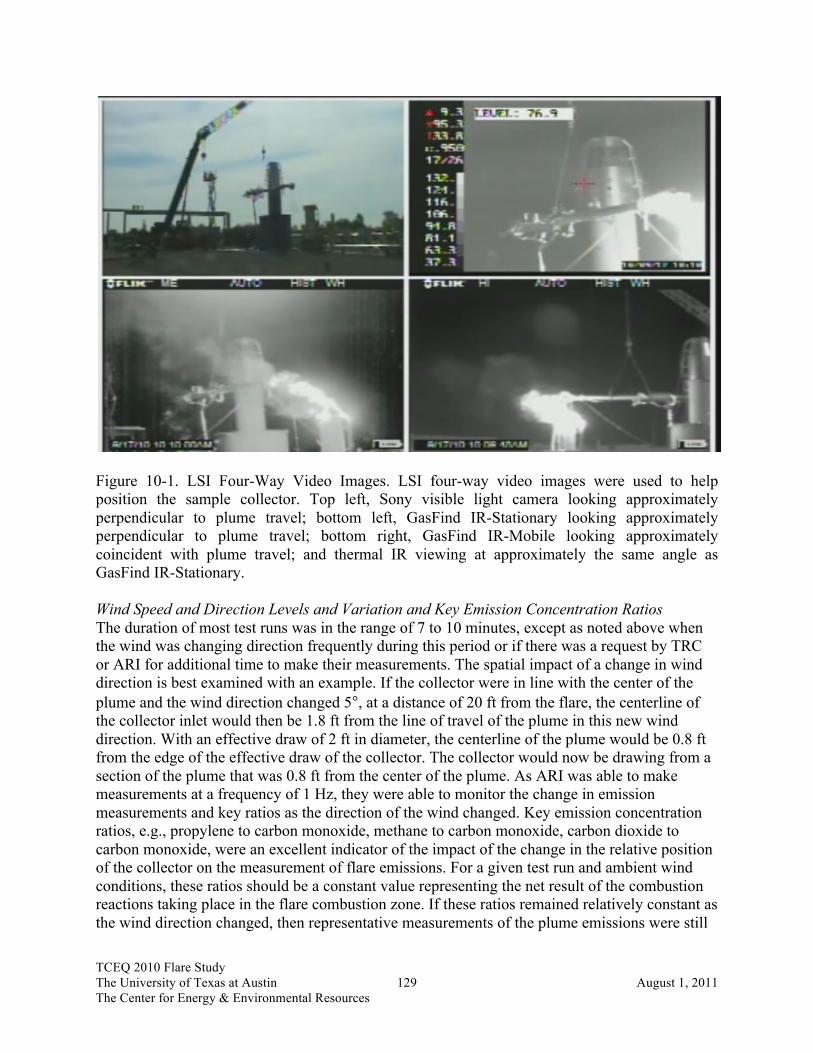
TCEQ 2010 Flare Study The University of Texas at Austin 129 August 1, 2011 The Center for Energy & Environmental Resources
Figure 10-1. LSI Four-Way Video Images. LSI four-way video images were used to help position the sample collector. Top left, Sony visible light camera looking approximately perpendicular to plume travel; bottom left, GasFind IR-Stationary looking approximately perpendicular to plume travel; bottom right, GasFind IR-Mobile looking approximately coincident with plume travel; and thermal IR viewing at approximately the same angle as GasFind IR-Stationary. Wind Speed and Direction Levels and Variation and Key Emission Concentration Ratios The duration of most test runs was in the range of 7 to 10 minutes, except as noted above when the wind was changing direction frequently during this period or if there was a request by TRC or ARI for additional time to make their measurements. The spatial impact of a change in wind direction is best examined with an example. If the collector were in line with the center of the plume and the wind direction changed 5°, at a distance of 20 ft from the flare, the centerline of the collector inlet would then be 1.8 ft from the line of travel of the plume in this new wind direction. With an effective draw of 2 ft in diameter, the centerline of the plume would be 0.8 ft from the edge of the effective draw of the collector. The collector would now be drawing from a section of the plume that was 0.8 ft from the center of the plume. As ARI was able to make measurements at a frequency of 1 Hz, they were able to monitor the change in emission measurements and key ratios as the direction of the wind changed. Key emission concentration ratios, e.g., propylene to carbon monoxide, methane to carbon monoxide, carbon dioxide to carbon monoxide, were an excellent indicator of the impact of the change in the relative position of the collector on the measurement of flare emissions. For a given test run and ambient wind conditions, these ratios should be a constant value representing the net result of the combustion reactions taking place in the flare combustion zone. If these ratios remained relatively constant as the wind direction changed, then representative measurements of the plume emissions were still
TCEQ 2010 Flare Study The University of Texas at Austin 130 August 1, 2011 The Center for Energy & Environmental Resources
occurring. If all the ratios began to change and there had been no change in the flare operating parameters, i.e., lower carbon dioxide to carbon monoxide ratio, and the ratios approach atmospheric ratios of these values, then the collector was not sufficiently in the plume and repositioning was needed. This approach was also employed if the wind direction were changing in a cyclic manner where repositioning of the collector would have been impractical. In this latter situation, the time period of the test run for collection of data would be extended until sufficient periods of data collection in the plume established repeatable emission concentration ratios representative of the combustion occurring for the test being conducted. Similar to the case of the cyclic change in wind direction, small changes in wind speed were addressed in the same manner, i.e., the time period of the test run for collection of data would be extended until sufficient periods of data collection in the plume established repeatable emission concentration ratios representative of the combustion occurring for the test being conducted. Repeatability of DRE and CE Results Another indicator to aid in evaluating the quality of the data is the repeatability of the data. Table 10-1 presents a summary the percent standard deviation of the DRE and CE for each test point where there were 3 repetitions of the flare test conditions and the average DRE for the three runs was greater than 60%. The percent (%) standard deviation (DRE) is defined as follows:
% !"#$%#&% !"#$%&$'( !"# = !"#$%#&% !"#$%&$'( (!"#)!"#$
!"#$%&# !"#!"#$ × 100 Eq. 10.1
Equation 10.1 can also be used to calculate % Standard Deviation (CE). When calculating the % Standard Deviation (CE), then all terms on the right refer to CE values rather than DRE values. It can be seen from these data in Table 10.1, that the maximum % standard deviation (DRE) was 8.3%, with all remainder Test Series less than 4.2%. In more than 79% of the cases, % standard deviation (DRE) was less than 2%. This typically low % standard deviation indicates a high degree of repeatability in the test system and in the measurements providing greater confidence that the data are not random results. Comparison with Independent Measurement of Remote Sensing Technology – IMACC PFTIR Not known during the field tests but upon analysis of measurements made by IMACC using their PFTIR spectrometer, in this study’s range of greatest interest, i.e., CE ≥ 85%, these two independent measurement methods show very good agreement. As these measurements were made employing a single blind approach, this level of agreement provides additional independent confirmation of the study’s data quality for the CE measurements. Each of these five factors taken separately would not necessarily ensure a high degree of data quality. But taken together, they provide strong evidence to support the conclusion that the DRE and CE measurements made by the flare plume extractive sampling system are reliable data of high quality

TCEQ 2010 Flare Study The University of Texas at Austin 131 August 1, 2011 The Center for Energy & Environmental Resources
Table 10-1. Repeatability of Test Results
Test Series ARI Extractive Sample Results
Average DRE
% Standard Deviation (DRE)
Average CE
% Standard Deviation (CE)
S2.1 99.2 0.8 98.7 1.3 S4.1 96.8 1.2 95.8 1.5 S4.2 98.7 0.5 98.3 0.5 S5.1 96.4 1.8 95.6 2.2 S5.3 89.0 1.3 86.5 1.6 S5.4 66.6 2.5 61.3 3.6 S5.6 94.5 0.8 93.2 0.9 S6.1 99.4 0.1 99.1 0.2 S6.3 97.5 0.1 96.3 0.1 S6.4 83.6 8.3 79.5 9.2 S7.2 88.8 4.2 87.5 4.4
A2.1 97.2 0.6 95.9 0.9 A2.4 93.0 1.7 89.3 2.0 A2.5 95.1 0.8 92.6 1.1 A3.1 98.8 0.8 98.3 1.0 A3.2 65.2 2.6 59.1 2.9 A3.4 76.6 0.4 72.0 0.4 A3.6 90.8 1.7 88.2 2.3 A4.1 97.9 0.5 97.1 0.7 A4.3 95.2 1.4 93.6 1.8 A4.4 91.0 0.5 88.5 0.6 A4.5 87.9 0.7 84.6 0.8 A5.1 96.4 1.5 96.0 1.4 A5.3 83.7 4.0 80.8 4.6 A5.5 93.9 1.7 92.7 2.1 A6.1 99.6 0.2 99.3 0.2 A6.3 97.1 0.8 95.6 1.4 A6.4 92.9 2.4 89.2 2.9

TCEQ 2010 Flare Study The University of Texas at Austin 132 August 1, 2011 The Center for Energy & Environmental Resources
11.0 Conclusions 1. At a vent gas LHV = 350 Btu/scf and flow rates of 0.1% and 0.25% of rated design capacity
(propylene) for the John Zink Model EE-QSC-36” steam flare this flare design was able to achieve DREs (propylene) of > 99% and CE > 99%. At a nominal vent gas flow rate 937 lb/hr (0.1%), an S/VG = 0.25 or less was required to achieve a DRE (propylene) > 99%. This S/VG would equate to a total steam assist of approximately 234 lb/hr, which would be less than the minimum recommended (as reported by industry) steam-assist rates of center = 500 lb/hr and upper = 750 lb/hr for this flare. The John Zink Company LLC recommends continuous minimum center steam of 300 lb/hr and 525 lb/hr upper steam for this flare design. This study does not recommend that steam assist rates less than that recommended by the flare manufacturer be used.
2. At a vent gas LHV = 350 Btu/scf and flow rates of 0.25% and 0.65% of rated design capacity (propylene) for the John Zink Model LHTS-24/60 air flare, this flare model was able to achieve DREs (propylene) of > 99% and CE > 99%.
3. The most efficient flare operation, as measured by the DRE and CE, for the flare operating conditions tested, was achieved at or near the incipient smoke point (ISP). Higher efficiencies could have been achieved with steam or air assist slightly less than the ISP assist value but this condition, i.e., a smoking flare, would not have been in compliance with 40 CFR § 60.18. Therefore, the minimum levels of steam or air assist that comply with the flare manufacturer’s recommendations should be used when possible.
4. At these low vent gas flow rates (nominally 937 lb/hr and 2,342 lb/hr) and low LHVs (nominally 350 Btu/scf and 600 Btu/scf), the flare performance curve of DRE vs steam assist has a very short to non-existent “shelf” before the DRE falls off to less than 98%. Beyond this point, the DRE and CE decrease almost linearly as steam assist increases.
5. For nominal LHVs of 350 Btu/scf and 600 Btu/scf and vent gas flow rates of 359 lb/hr and 937lb/hr, air flare test data showed that an air-to-fuel ratio (lb/lb) of approximately 6.0 or less produced a DRE > 99%. Higher levels of air assist produced lower DREs in an almost linearly decreasing manner.
6. The IMACC PFTIR and AFTIR mean differences between their values of CE and the ARI values of CE averaged 2.2 and 2.5 percentage points, respectively, and had average standard deviations of the CE differences of 2.9 and 3.1 percentage points in the range CEARI ≥ 90% for the air and steam flare tests. The PFTIR and AFTIR had average data returns of 99% and 100% in this range.
7. The Telops Hyper-Cam mean differences between their values of CE and the ARI values of
CE averaged 14.9 percentage points, with an average standard deviation of the CE differences of 22.8 percentage points in the range CEARI ≥ 90%. The Telops Hyper-Cam had average data return of 39% in this range.

TCEQ 2010 Flare Study The University of Texas at Austin 133 August 1, 2011 The Center for Energy & Environmental Resources
References Baukal, Jr., Charles E. (2001). The John Zink Combustion Handbook, CRC Press, New York. Environ International Corporation, (2009). Control of HRVOC Emissions in Flares at Low Flow Conditions, Project 2009-53 (DRAFT Interim Report). Flare Details for General Refinery and Petrochemical Service, American Petroleum Institute ANSI/API Standard 537, Washington, DC, 2008. Green, Don W. and R. Perry, (2008). Perry’s Chemical Engineer’s Handbook, 8th Edition, McGraw-Hill, New York, 2008. Hashmonay, Ram A.,Ravi M. Varma, Mark Modrak, and Robert H. Kagman, Simultaneous Measurement of Vaporous and Aerosolized Threats by Active Open Path FTIR. http://www.dtic.mil/cgi-bin/GetTRDoc?AD=ADA449529&Location=U2&doc=GetTRDoc.pdf (accessed May 18, 2010). Marathon Petroleum Company, LP, Detroit Refinery. Performance Test of a Steam-Assisted Elevated Flare with Passive FTIR – Detroit, Final Report. Detroit, Michigan, November 2010. Marathon Petroleum Company, LLC, Texas Refining Division. Performance Test of a Steam-Assisted Elevated Flare with Passive FTIR, Final Report. Texas City, Texas, May, 2010. McDaniel, Marc, Flare Efficiency Study, United States Environmental Protection Agency, Report No. 600/2-83-052, July 1983. National Physical Laboratory, Measurement of VOC Emissions from Petrochemical Industry Sites in the Houston Area Using Differential Absorption Lidar (DIAL) During Summer 2007, Draft for Comment. Texas Commission on Environmental Quality, February 2008. Texas Commission on Environmental Quality, (2009). Proposal for Grant Activities No. 582-8-86245-FY09-04, Comprehensive Flare Study, Tracking Number 2008-01, Amendments 1 & 3 (2010). The University of Texas at Austin, (2010). Quality Assurance Project Plan for Texas Commission on Environmental Quality Comprehensive Flare Study Project, PGA No. 582-8-862-45-FY09-04, Tracking No. 2008-81, Rev. 1. The University of Texas at Austin, August 2010. United States Government. Code of Federal Regulations - Standards of Performance for New Stationary Sources, General Control Device and Work Practice Requirements, 40CFR § 60.18. http://edocket.access.gpo.gov/cfr_2009/julqtr/pdf/40cfr60.18.

TCEQ 2010 Flare Study The University of Texas at Austin 134 August 1, 2011 The Center for Energy & Environmental Resources
URS Corporation. Passive FTIR Phase I Testing of Simulated and Controlled Flare Systems: Final Report. Texas Commission on Environmental Quality, June 2004.