TCAF1 promoter hypermethylation predicts biochemical recurrence … · 2017-04-14 · 1 RHCG and...
24
1 RHCG and TCAF1 promoter hypermethylation predicts biochemical recurrence in prostate cancer patients treated by radical prostatectomy Supplementary Materials and Methods Infinium HumanMethylation450 BeadChip Patient material: Fresh-frozen tissue samples were collected at Dept. of Urology, Aarhus University Hospital, DK (2004-2011). Malignant prostate tissue (T) was obtained from 20 clinically localized prostate cancers removed by RP and one transurethral resection of the prostate. Histologically benign prostate tissue samples (adjacent normal, AN) were obtained from 12 RP patients, and 9 true normal (N) prostate tissue samples from age-matched bladder cancer patients (cystoprostatectomy). Absence of cancer in AN and N samples was confirmed by a trained pathologist. Clinical data is listed in table S1. Cell lines: Malignant/NM prostate epithelial cell lines were maintained according to providers’ protocols (table S11) and cultured to ~80 % confluence before harvesting. Cells were tested negative for mycoplasma shortly before harvesting (PCR Mycoplasma Detection Set, Takara Bio Inc.), and cell line identity was confirmed by short tandem repeat (STR) analysis (IdentiCell). DNA purification: Genomic DNA (gDNA) was extracted from carefully selected macro dissected 20 μm sections of fresh frozen TissueTek (Sakura, Torrance, CA) embedded prostate tissue samples and cell lines using the PUREGENE DNA purification kit (Gentra systems) with proteinase K treatment (100 U, 30 min at 55 °C), as previously described [1]. Cell line gDNA was extracted after cell harvesting by Trypsin- EDTA (Invitrogen) for all cells except PrEC, which were harvested using Trypsin-EDTA for primary cells (ATCC) and Trypsin Neutralizing Solution (ATCC) according to manufacturer’s protocol. 450K data handling and statistical analysis: The 450K array investigates DNA methylation at 485,577 CpG sites in the human genome at single base resolution. Each investigated CpG is assigned a β-value ranging from 0 (unmethylated) to 1 (fully methylated). Raw data was processed through the minfi package [2],
Transcript of TCAF1 promoter hypermethylation predicts biochemical recurrence … · 2017-04-14 · 1 RHCG and...
1
RHCG and TCAF1 promoter hypermethylation predicts biochemical
recurrence in prostate cancer patients treated by radical prostatectomy
Supplementary Materials and Methods
Infinium HumanMethylation450 BeadChip
Patient material: Fresh-frozen tissue samples were collected at Dept. of Urology, Aarhus
University Hospital, DK (2004-2011). Malignant prostate tissue (T) was obtained from 20 clinically localized
prostate cancers removed by RP and one transurethral resection of the prostate. Histologically benign prostate
tissue samples (adjacent normal, AN) were obtained from 12 RP patients, and 9 true normal (N) prostate tissue
samples from age-matched bladder cancer patients (cystoprostatectomy). Absence of cancer in AN and N
samples was confirmed by a trained pathologist. Clinical data is listed in table S1.
Cell lines: Malignant/NM prostate epithelial cell lines were maintained according to providers’
protocols (table S11) and cultured to ~80 % confluence before harvesting. Cells were tested negative for
mycoplasma shortly before harvesting (PCR Mycoplasma Detection Set, Takara Bio Inc.), and cell line identity
was confirmed by short tandem repeat (STR) analysis (IdentiCell).
DNA purification: Genomic DNA (gDNA) was extracted from carefully selected macro
dissected 20 µm sections of fresh frozen TissueTek (Sakura, Torrance, CA) embedded prostate tissue samples
and cell lines using the PUREGENE DNA purification kit (Gentra systems) with proteinase K treatment (100 U,
30 min at 55 °C), as previously described [1]. Cell line gDNA was extracted after cell harvesting by Trypsin-
EDTA (Invitrogen) for all cells except PrEC, which were harvested using Trypsin-EDTA for primary cells
(ATCC) and Trypsin Neutralizing Solution (ATCC) according to manufacturer’s protocol.
450K data handling and statistical analysis: The 450K array investigates DNA methylation at
485,577 CpG sites in the human genome at single base resolution. Each investigated CpG is assigned a β-value
ranging from 0 (unmethylated) to 1 (fully methylated). Raw data was processed through the minfi package [2],
2
followed by statistical analysis on logit-transformed [3], peak-corrected [4] β-values in R [5] using LIMMA [6]
(t-statistics) to identify differential methylation between T and NM samples (Δβ: mean βT - mean βNM). N and
AN samples were pooled into one control group (NM) for further analysis, as analysis for differential
methylation (LIMMA applied to peak-corrected M-values) revealed highly similar methylation patterns for the
two groups. All samples passed the inclusion criteria of a detection P-value <10-5
. Multi-dimensional scaling
analysis was performed using the 10,000 most variable CpG sites across all tissue samples. Correction for
multiple testing (adjusted P-value, adj. P) was performed according to the Benjamini-Hochberg procedure [7].
Differentially methylated CpG sites (DMCs) were defined as CpG sites with Δβ ≥│0.2│ and adj. P<0.05.
Bisulfite sequencing
Bisulfite sequencing (BS) of genomic DNA from prostatic cell lines was performed as previously described [8].
Briefly, primers (table S13) were designed using MethPrimer [9]. Bisulfite converted DNA was PCR amplified,
gel purified and sub-cloned using the TOPO®TA Cloning® Kit for sequencing (Invitrogen). A minimum of 5
colonies were PCR amplified and sequenced using the M13 forward and reverse primers (included in the TOPO
cloning kit), followed by manual inspection of C/T status at each CpG site. Results were visualized and analyzed
using QUMA [10].
RNA-seq
A total of 14 T, 6 N, and 6 AN fresh-frozen prostate tissue samples were collected at Dept. of Urology, Aarhus
University Hospital, DK (2004-2011). Of these, 6 T samples were also included in a previous RNA-seq study
[11]. Total RNA was isolated from tissue samples using the RNeasy Mini Kit (Qiagen) according to
manufacturer’s instructions, except that at the time of extraction, 1.5x (vol.) 100% EtOH was added to the tissue
samples. All included samples had a RIN score >7, according to RNA Pico chip analysis on a 2100 Bioanalyzer
3
(Agilent Technologies). Whole transcriptome, strand-specific RNA-seq libraries for multiplexed paired-end
sequencing were prepared using Ribo-Zero Gold and ScriptSeq v2 kit (Epicentre), as previously described [11].
Di-tagged cDNA was amplified (10 cycles, FailSafe PCR Enzyme (Epicentre)) and purified (Agencourt XP Kit,
Beckman Coulter). RNA-seq libraries were combined into 2 nM pooled stocks, denatured and diluted to 10 pM
before loading into TruSeq PE v3 flowcells on an Illumina cBot followed by indexed paired-end sequencing
(101+7+101 bp) on Illumina HiSeq 2000 using TruSeq SBS Kit v3 chemistry (Illumina). Paired de-multiplexed
fastq files were generated using CASAVA software (Illumina).
RNA-seq data handling and statistical analysis: Paired-end RNA-seq reads were mapped to the
human genome (hg19) using TopHat [12] with the Bowtie aligner [13]. HTSeq [14] was used to summarize
reads per gene of interest with the "union" overlap resolution mode. Differential expression analysis was
performed using edgeR [15] with the most complex dispersion found for each gene. Correction for multiple
testing (adjusted P-value, adj. P) was performed according to the Benjamini-Hochberg procedure [7].
External datasets
450K and RNA-seq data sets (297 T, 34 AN) from The Cancer Genome Atlas (TCGA) were downloaded from
the TCGA data portal [16, 17] and processed as described above.
Marmal-aid data was downloaded from the Marmal-aid database [18]. Raw beta-values were batch- and peak
corrected using ChAMP [19]. Methylation in malignant and NM bladder (cancer: N= 85. NM: N= 10) and
kidney (cancer: N=244. NM: N=136) tissue was assessed by calculating the mean β-values for the CpG sites
identified as hypermethylated in PC (probe IDs listed in supplementary table S3) for each candidate gene in each
cancer type and corresponding NM tissue.

4
References
1. Sorensen KD, Borre M, Orntoft TF, Dyrskjot L, Torring N. Chromosomal deletion, promoter
hypermethylation and downregulation of FYN in prostate cancer. Int J Cancer. 2008; 122: 509-19. doi:
10.1002/ijc.23136.
2. Aryee MJ, Jaffe AE, Corrada-Bravo H, Ladd-Acosta C, Feinberg AP, Hansen KD, Irizarry
RA. Minfi: a flexible and comprehensive Bioconductor package for the analysis of Infinium DNA
methylation microarrays. Bioinformatics. 2014; 30: 1363-9. doi: 10.1093/bioinformatics/btu049.
3. Du P, Zhang X, Huang CC, Jafari N, Kibbe WA, Hou L, Lin SM. Comparison of Beta-value
and M-value methods for quantifying methylation levels by microarray analysis. BMC Bioinformatics. 2010;
11: 587. doi: 10.1186/1471-2105-11-587.
4. Dedeurwaerder S, Defrance M, Calonne E, Denis H, Sotiriou C, Fuks F. Evaluation of the
Infinium Methylation 450K technology. Epigenomics. 2011; 3: 771-84. doi: 10.2217/epi.11.105.
5. The R project for statistical computing. (https://www.r-project.org/).
6. Jeanmougin M, de Reynies A, Marisa L, Paccard C, Nuel G, Guedj M. Should we abandon
the t-test in the analysis of gene expression microarray data: a comparison of variance modeling strategies.
PLoS One. 2010; 5: e12336. doi: 10.1371/journal.pone.0012336.
7. Benjamini Y, Hochberg Y. Controlling the False Discovery Rate: A Practical and Powerful
Approach to Multiple Testing. Journal of the Royal Statistical Society Series B (Methodological). 1995; 57:
289-300. doi:
8. Vestergaard EM, Nexo E, Torring N, Borre M, Orntoft TF, Sorensen KD. Promoter
hypomethylation and upregulation of trefoil factors in prostate cancer. Int J Cancer. 2010; 127: 1857-65. doi:
10.1002/ijc.25209.
9. Li LC, Dahiya R. MethPrimer: designing primers for methylation PCRs. Bioinformatics.
2002; 18: 1427-31. doi:
10. Kumaki Y, Oda M, Okano M. QUMA: quantification tool for methylation analysis. Nucleic
Acids Res. 2008; 36: W170-5. doi: 10.1093/nar/gkn294.
11. Hedegaard J, Thorsen K, Lund MK, Hein AM, Hamilton-Dutoit SJ, Vang S, Nordentoft I,
Birkenkamp-Demtroder K, Kruhoffer M, Hager H, Knudsen B, Andersen CL, Sorensen KD, et al. Next-
generation sequencing of RNA and DNA isolated from paired fresh-frozen and formalin-fixed paraffin-
embedded samples of human cancer and normal tissue. PLoS One. 2014; 9: e98187. doi:
10.1371/journal.pone.0098187.
12. Trapnell C, Pachter L, Salzberg SL. TopHat: discovering splice junctions with RNA-Seq.
Bioinformatics. 2009; 25: 1105-11. doi: 10.1093/bioinformatics/btp120.
13. Langmead B, Trapnell C, Pop M, Salzberg SL. Ultrafast and memory-efficient alignment of
short DNA sequences to the human genome. Genome Biol. 2009; 10: R25. doi: 10.1186/gb-2009-10-3-r25.
14. Anders S, Pyl PT, Huber W. HTSeq--a Python framework to work with high-throughput
sequencing data. Bioinformatics. 2015; 31: 166-9. doi: 10.1093/bioinformatics/btu638.
15. Robinson MD, McCarthy DJ, Smyth GK. edgeR: a Bioconductor package for differential
expression analysis of digital gene expression data. Bioinformatics. 2010; 26: 139-40. doi:
10.1093/bioinformatics/btp616.
16. Zhu Y, Qiu P, Ji Y. TCGA-assembler: open-source software for retrieving and processing
TCGA data. Nat Methods. 2014; 11: 599-600. doi: 10.1038/nmeth.2956.
17. Zhu Y, Xu Y, Helseth DL, Jr., Gulukota K, Yang S, Pesce LL, Mitra R, Muller P, Sengupta S,
Guo W, Silverstein JC, Foster I, Parsad N, et al. Zodiac: A Comprehensive Depiction of Genetic Interactions
in Cancer by Integrating TCGA Data. J Natl Cancer Inst. 2015; 107. doi: 10.1093/jnci/djv129.
18. Lowe R, Rakyan VK. Marmal-aid--a database for Infinium HumanMethylation450. BMC
Bioinformatics. 2013; 14: 359. doi: 10.1186/1471-2105-14-359.
19. Morris TJ, Butcher LM, Feber A, Teschendorff AE, Chakravarthy AR, Wojdacz TK, Beck S.
ChAMP: 450k Chip Analysis Methylation Pipeline. Bioinformatics. 2014; 30: 428-30. doi:
10.1093/bioinformatics/btt684.
5
6
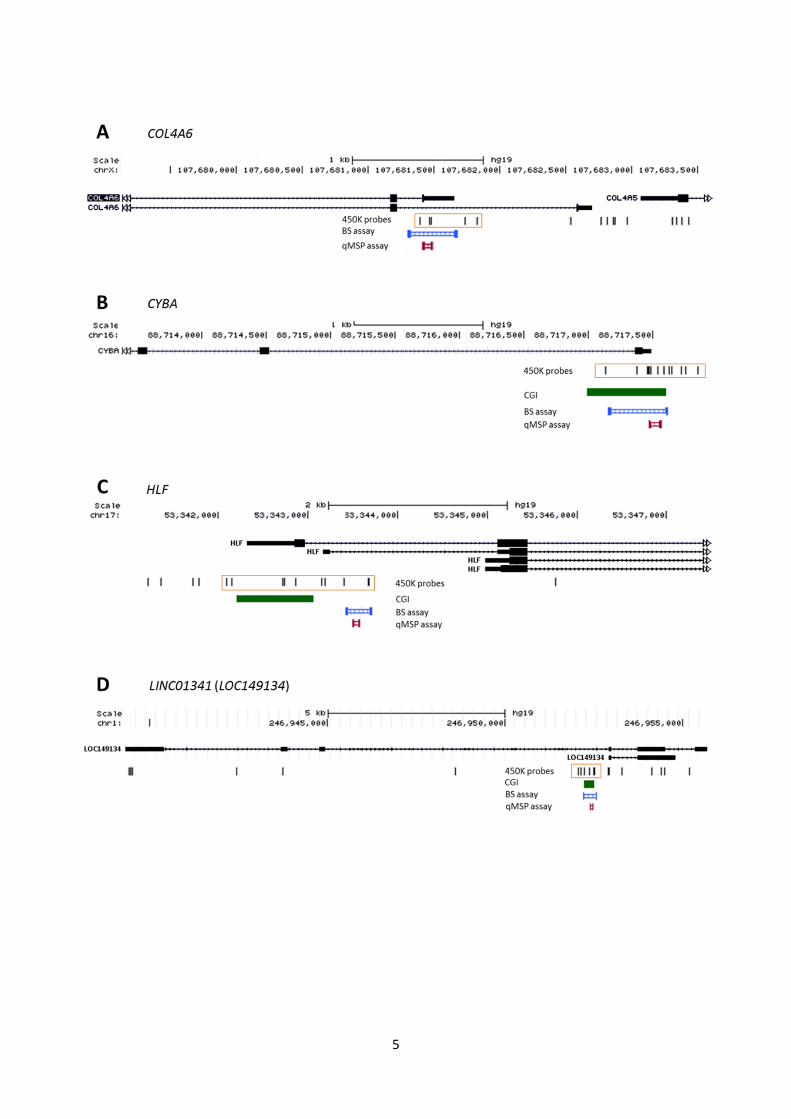
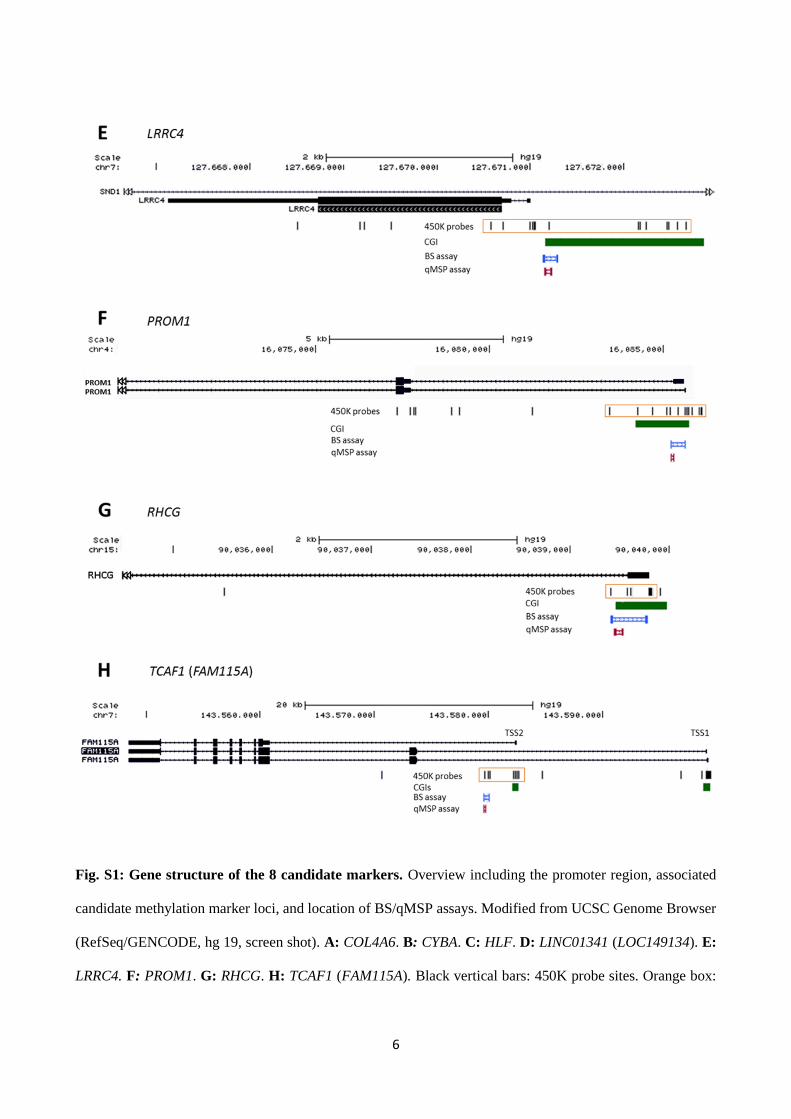
Fig. S1: Gene structure of the 8 candidate markers. Overview including the promoter region, associated
candidate methylation marker loci, and location of BS/qMSP assays. Modified from UCSC Genome Browser
(RefSeq/GENCODE, hg 19, screen shot). A: COL4A6. B: CYBA. C: HLF. D: LINC01341 (LOC149134). E:
LRRC4. F: PROM1. G: RHCG. H: TCAF1 (FAM115A). Black vertical bars: 450K probe sites. Orange box:

7
Significantly hypermethylated DMCs according to 450K analysis. Green bars: CGIs. Blue bars: Location of
BS assays. Red bars: Location of qMSP assays.
8
9
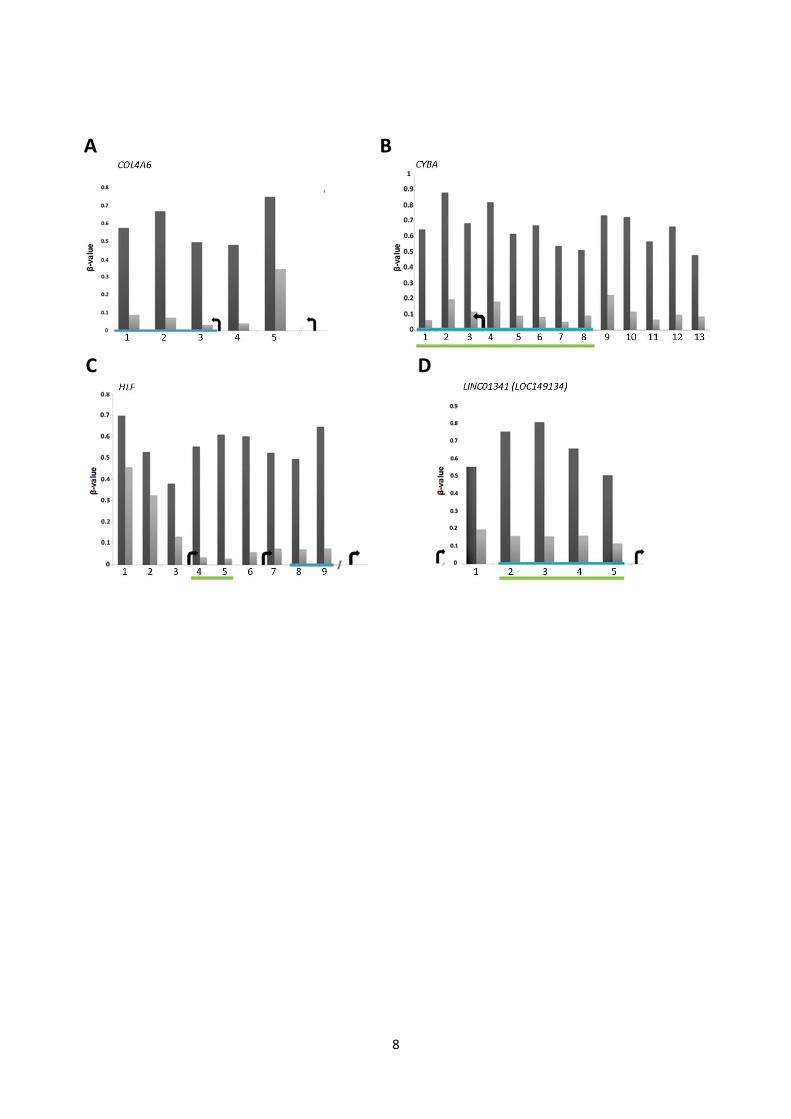
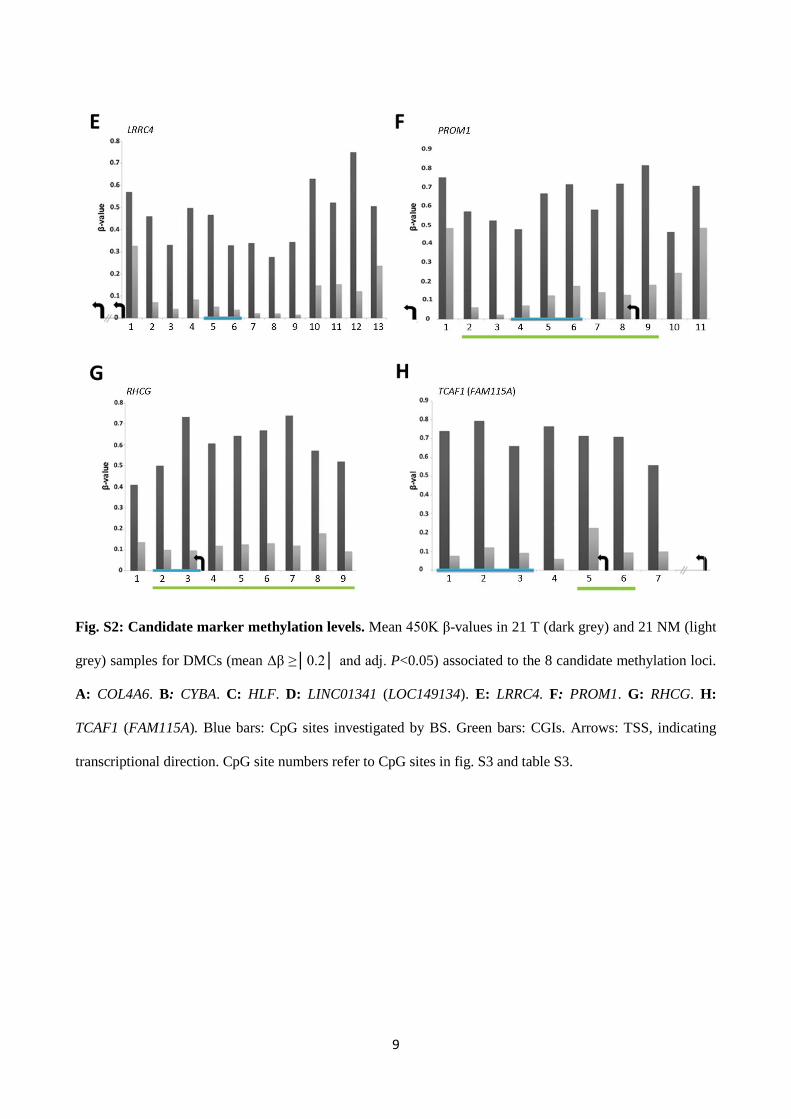
Fig. S2: Candidate marker methylation levels. Mean 450K β-values in 21 T (dark grey) and 21 NM (light
grey) samples for DMCs (mean Δβ ≥│0.2│ and adj. P<0.05) associated to the 8 candidate methylation loci.
A: COL4A6. B: CYBA. C: HLF. D: LINC01341 (LOC149134). E: LRRC4. F: PROM1. G: RHCG. H:
TCAF1 (FAM115A). Blue bars: CpG sites investigated by BS. Green bars: CGIs. Arrows: TSS, indicating
transcriptional direction. CpG site numbers refer to CpG sites in fig. S3 and table S3.
10
11
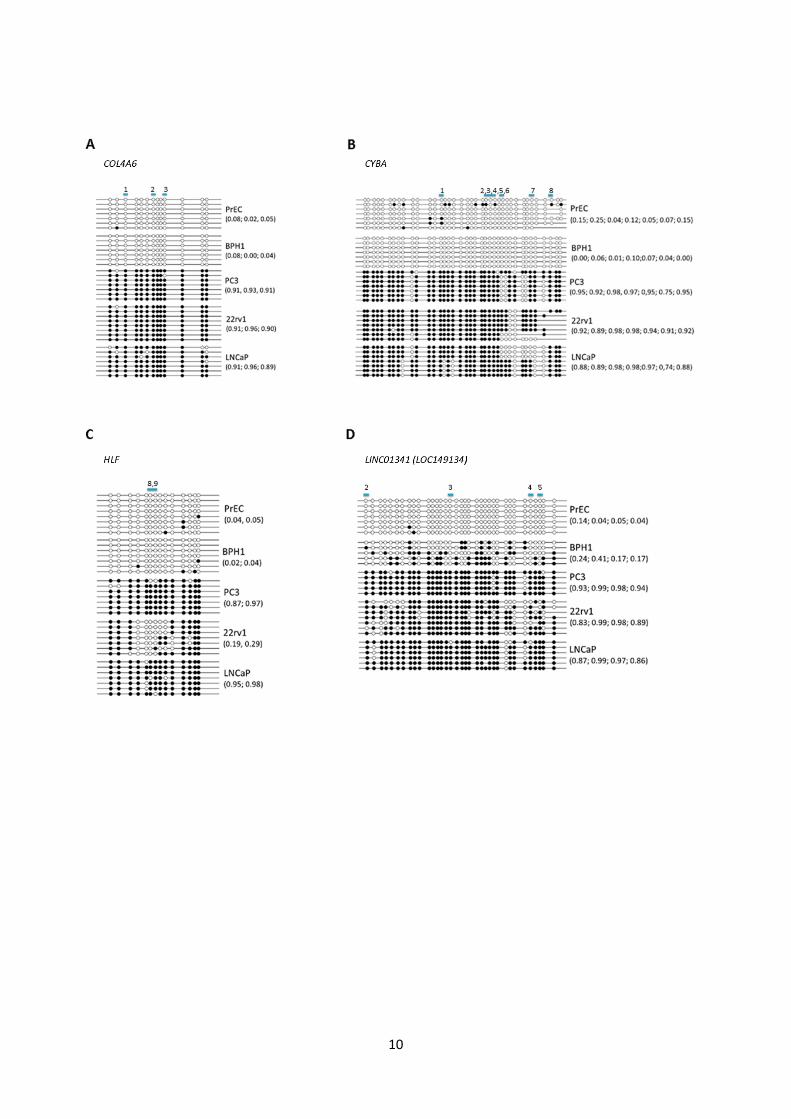
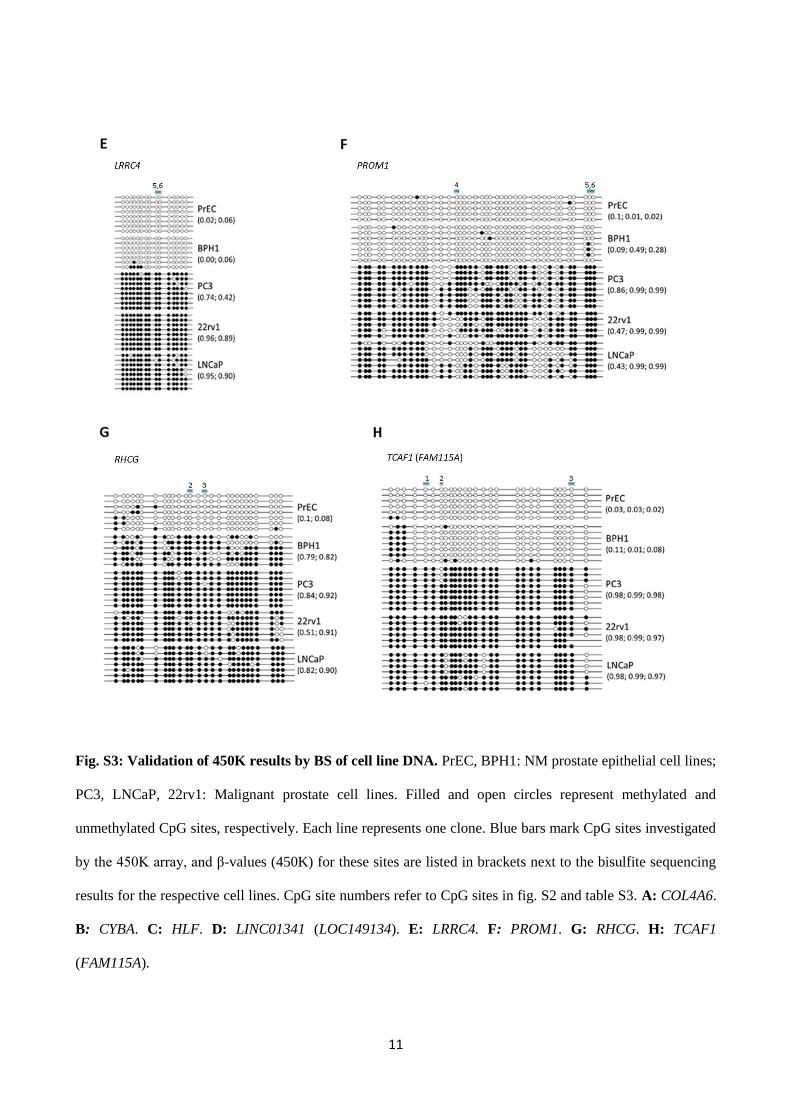
Fig. S3: Validation of 450K results by BS of cell line DNA. PrEC, BPH1: NM prostate epithelial cell lines;
PC3, LNCaP, 22rv1: Malignant prostate cell lines. Filled and open circles represent methylated and
unmethylated CpG sites, respectively. Each line represents one clone. Blue bars mark CpG sites investigated
by the 450K array, and β-values (450K) for these sites are listed in brackets next to the bisulfite sequencing
results for the respective cell lines. CpG site numbers refer to CpG sites in fig. S2 and table S3. A: COL4A6.
B: CYBA. C: HLF. D: LINC01341 (LOC149134). E: LRRC4. F: PROM1. G: RHCG. H: TCAF1
(FAM115A).
12
13
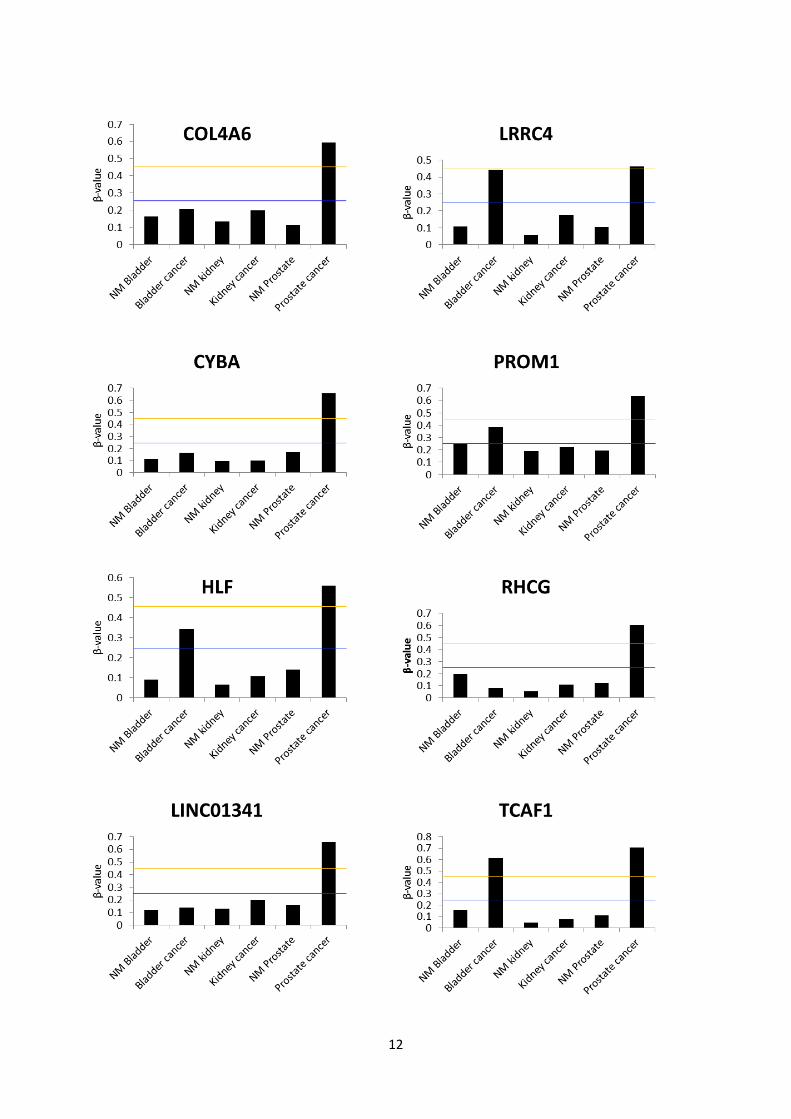
Fig. S4: Mean β-value of all CpG sites identified as being hypermethylated in prostate cancer
(supplementary table S3) for each candidate in malignant and non-malignant bladder and kidney tissue
specimens from the Marmal-aid database, in addition to prostate specimens from the present analysis. The
lines mark arbitrary thresholds for hypomethylation (blue, mean β<0.25) and hypermethylation (orange,
mean β>0.45). Bladder cancer: N=85. NM Bladder: N=10. Kidney cancer: N=244. NM kidney N=136.
Prostate cancer: N=21. NM prostate: N=21.
14
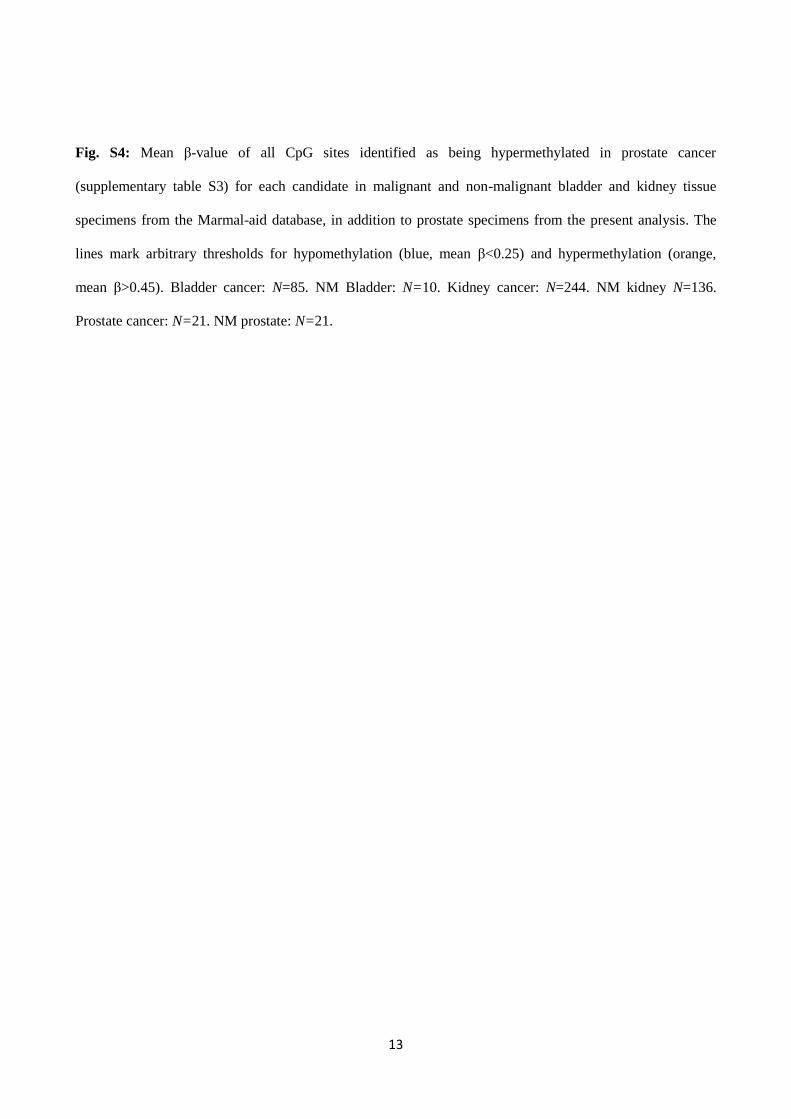
Fig. S5: Differential candidate gene expression in T vs. NM prostate samples. TCGA and in-house RNA-
seq data for 7 of the 8 candidate genes. LINC01341 was not annotated in either data set. Log2 fold-change
(FC) T vs. NM samples (EdgeR analysis). (**) adj. P<0.01. TCGA: T, N=297; NM, N=34. In-house: T,
N=14; NM, N=12.
15
16
17
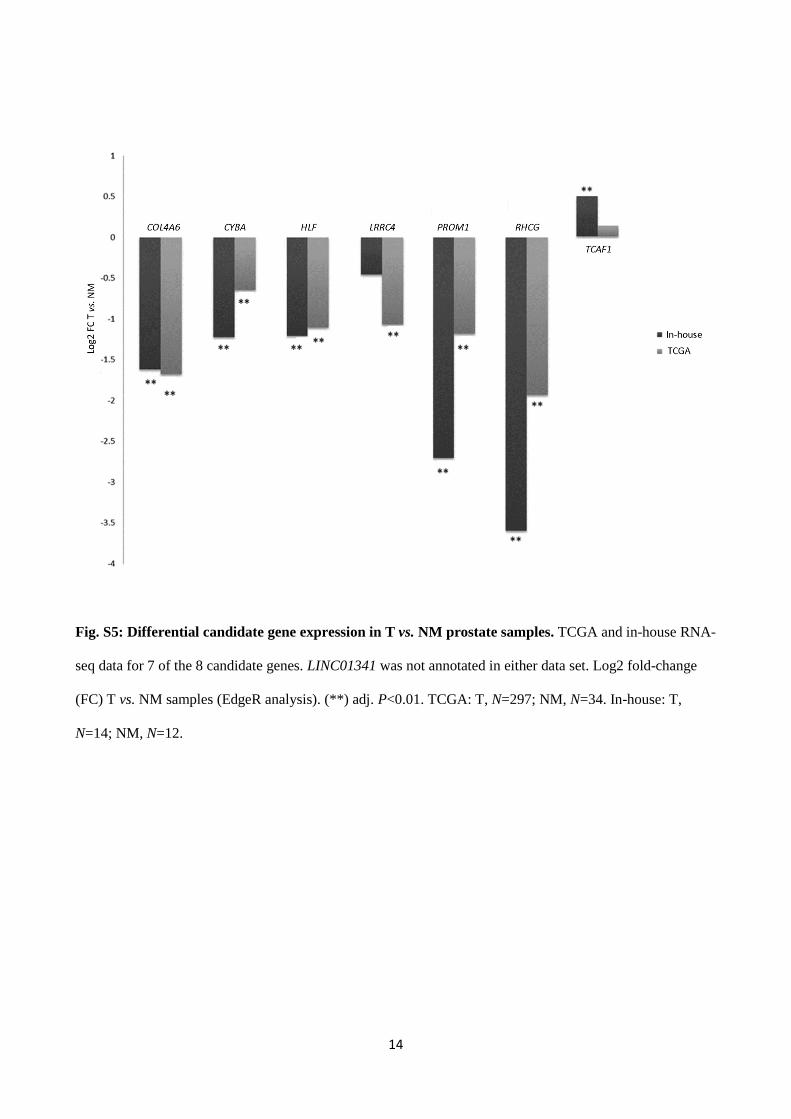
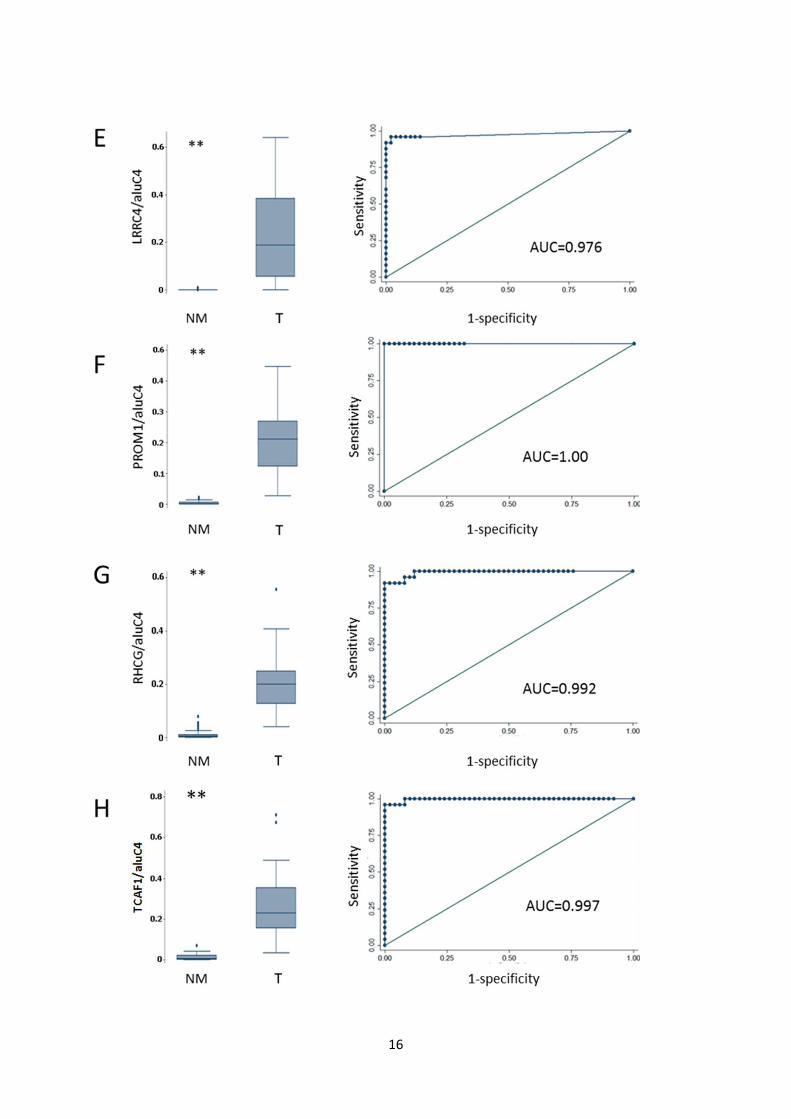
Fig. S6: Diagnostic potential of candidate methylation markers in DNBs. Receiver operating
characteristics (ROC) analysis of NM samples (AN and N, N=50) vs. T samples (N=25). Left: Box
plots of methylation levels of NM and T biopsy specimens. (**) P<0.001, rank-sum test. Right: ROC
curves of data displayed in box plots. A: COL4A6. B: CYBA. C: HLF. D: LINC01341
(LOC149134). E: LRRC4. F: PROM1. G: RHCG. H: TCAF1 (FAM115A).
18
19
20
21
22
23
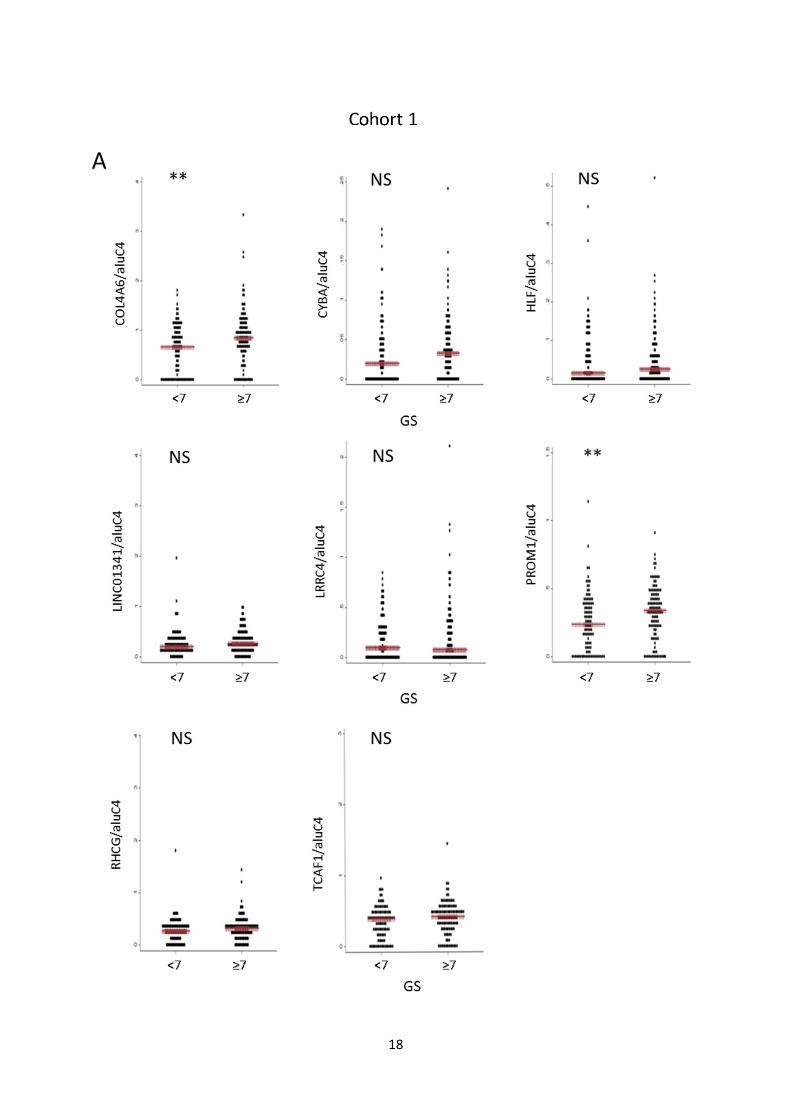
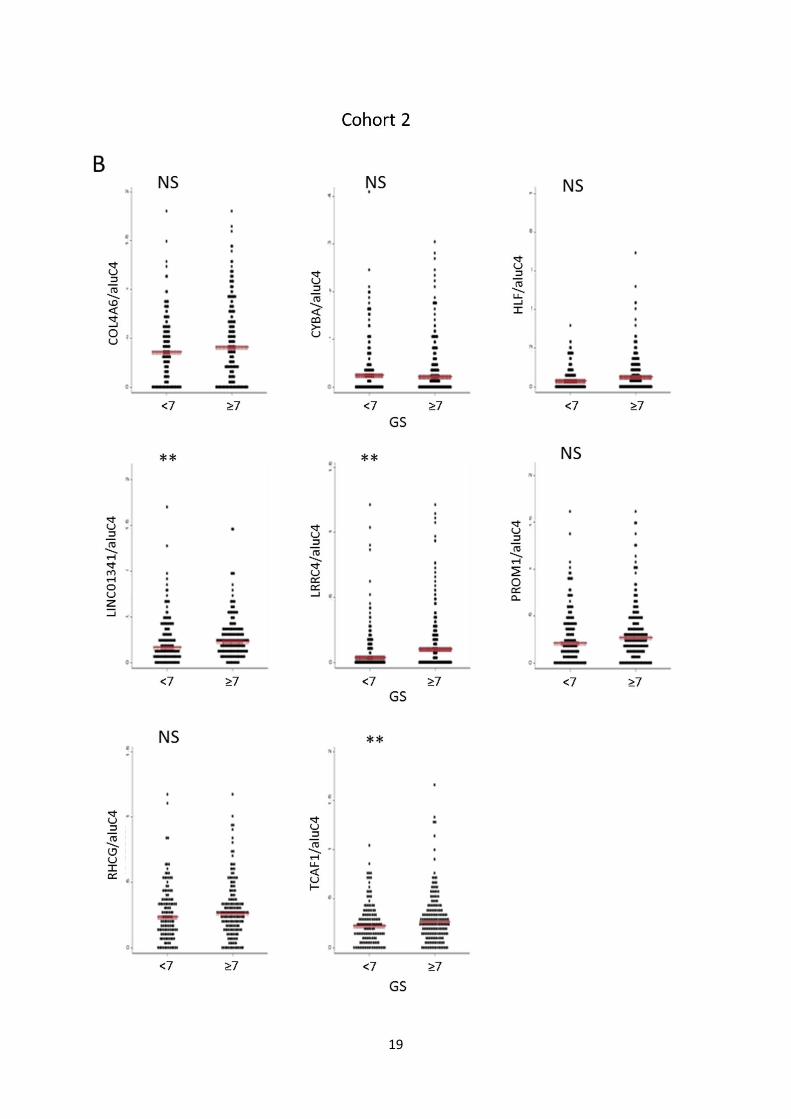
Fig. S7: Candidate marker methylation levels vs. clinicopathological variables. A, B: Methylation levels
of individual candidate markers in cohort 1 (A) and 2 (B) stratified by Gleason score (<7 vs. ≥7). Red bar:
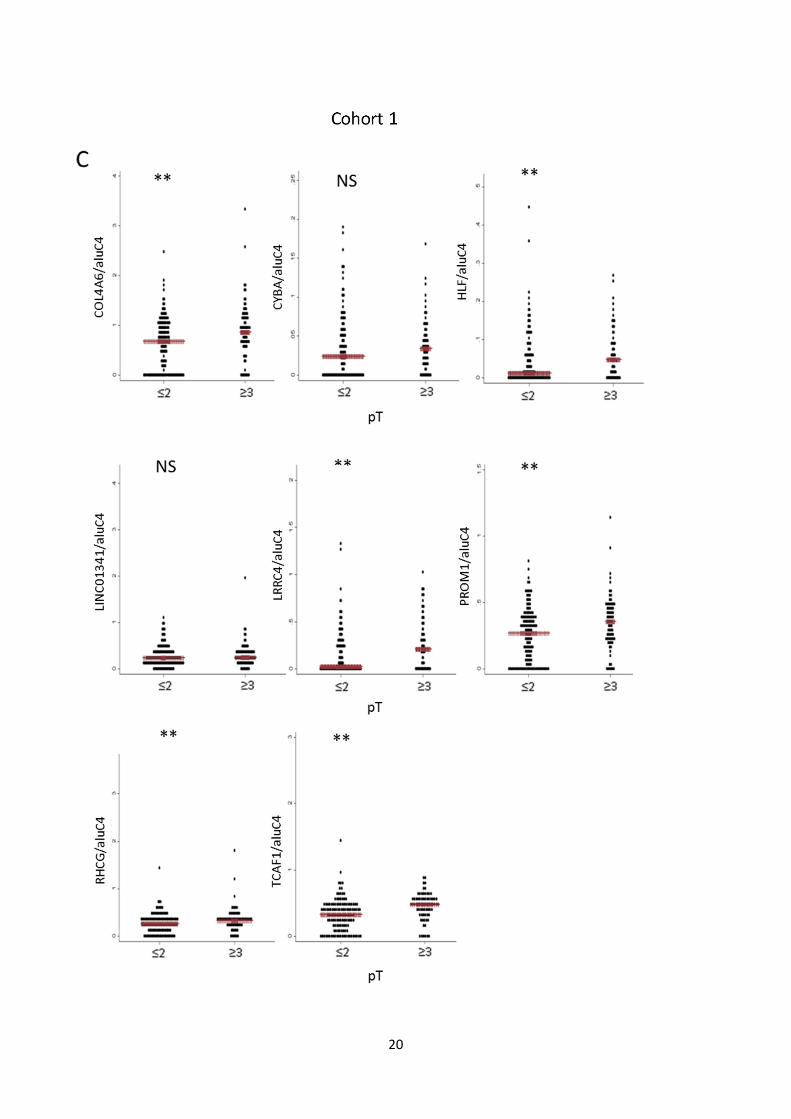
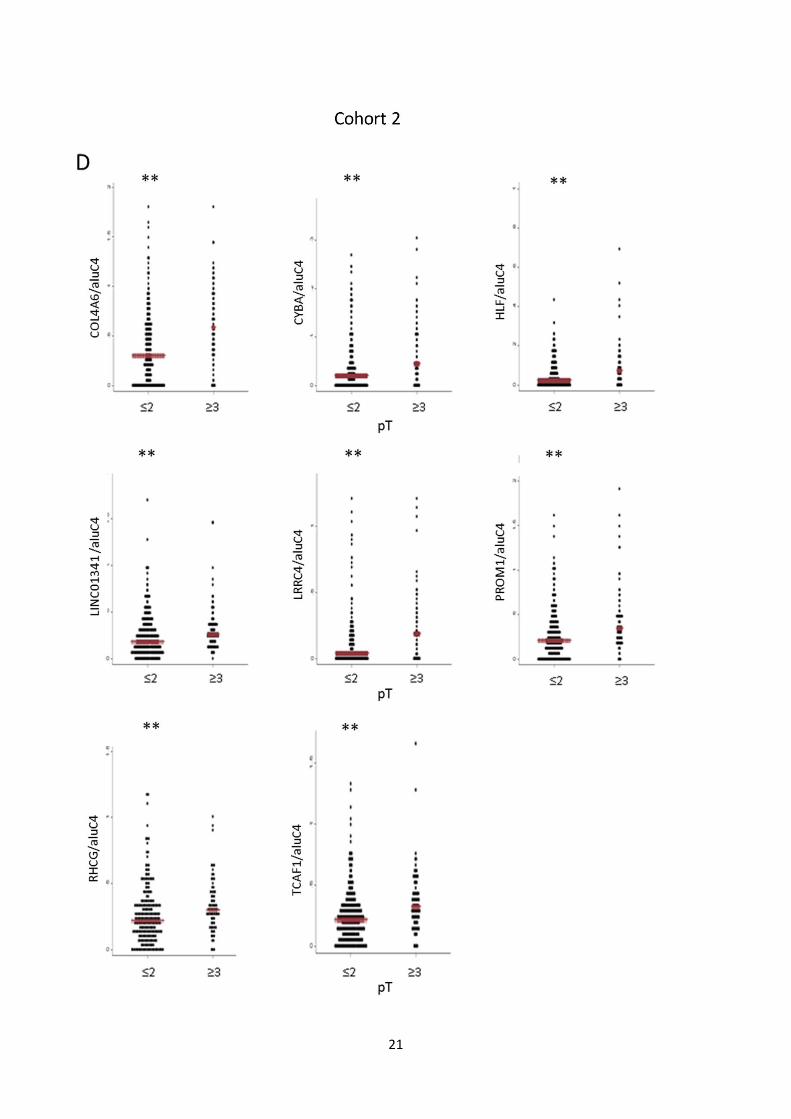
Median. P-values from rank-sum test. C, D: Methylation levels of individual candidate markers in cohort 1
(C) and 2 (D) stratified by pathological tumor stage (≤2 vs. ≥3). Red bar: Median. P-values from rank-sum
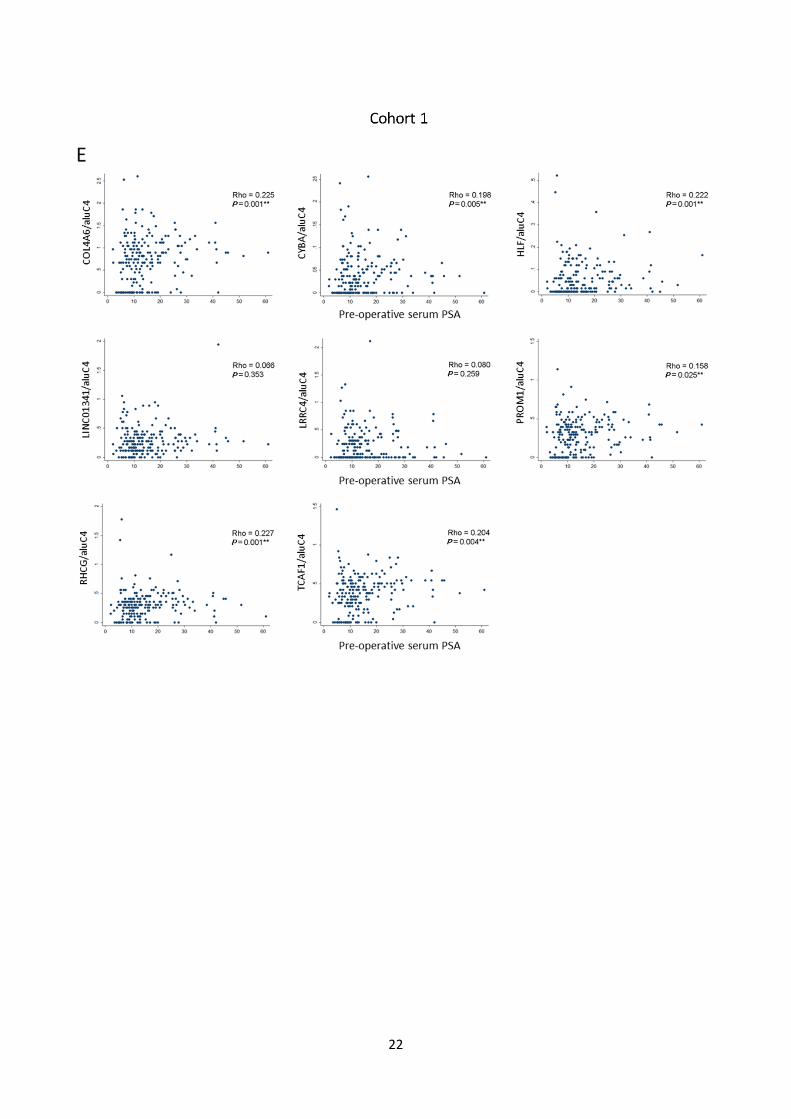
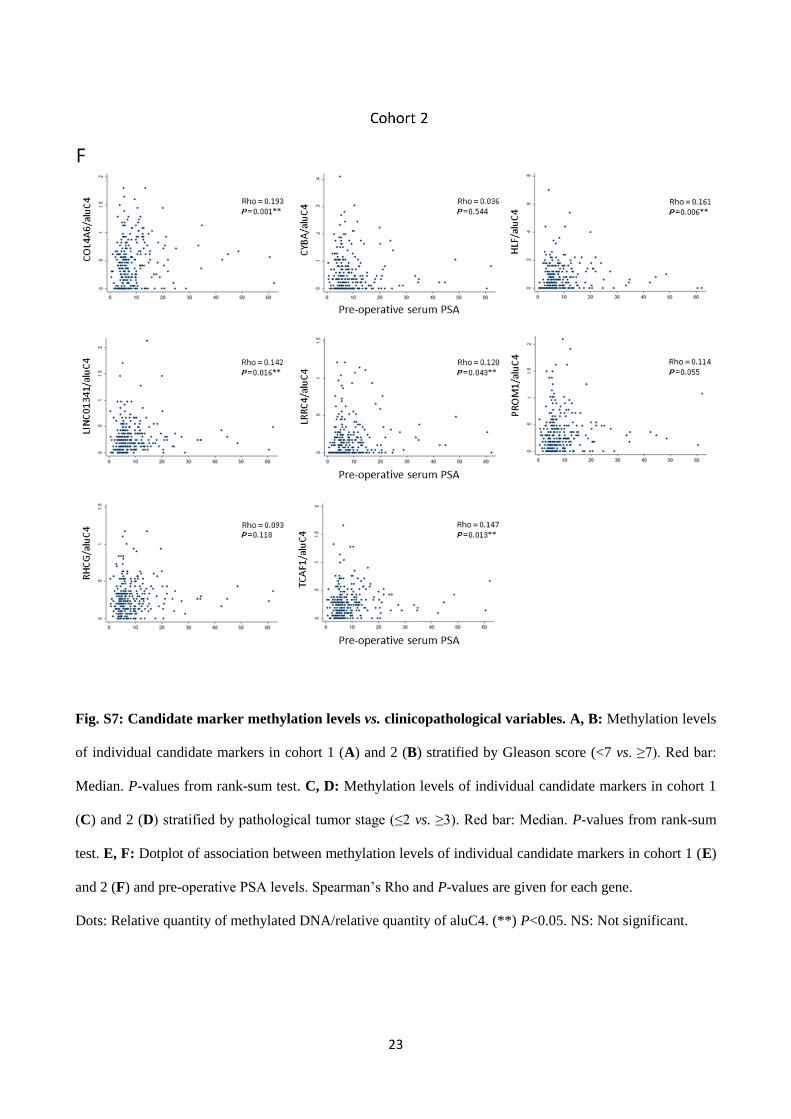
test. E, F: Dotplot of association between methylation levels of individual candidate markers in cohort 1 (E)
and 2 (F) and pre-operative PSA levels. Spearman’s Rho and P-values are given for each gene.
Dots: Relative quantity of methylated DNA/relative quantity of aluC4. (**) P<0.05. NS: Not significant.
24
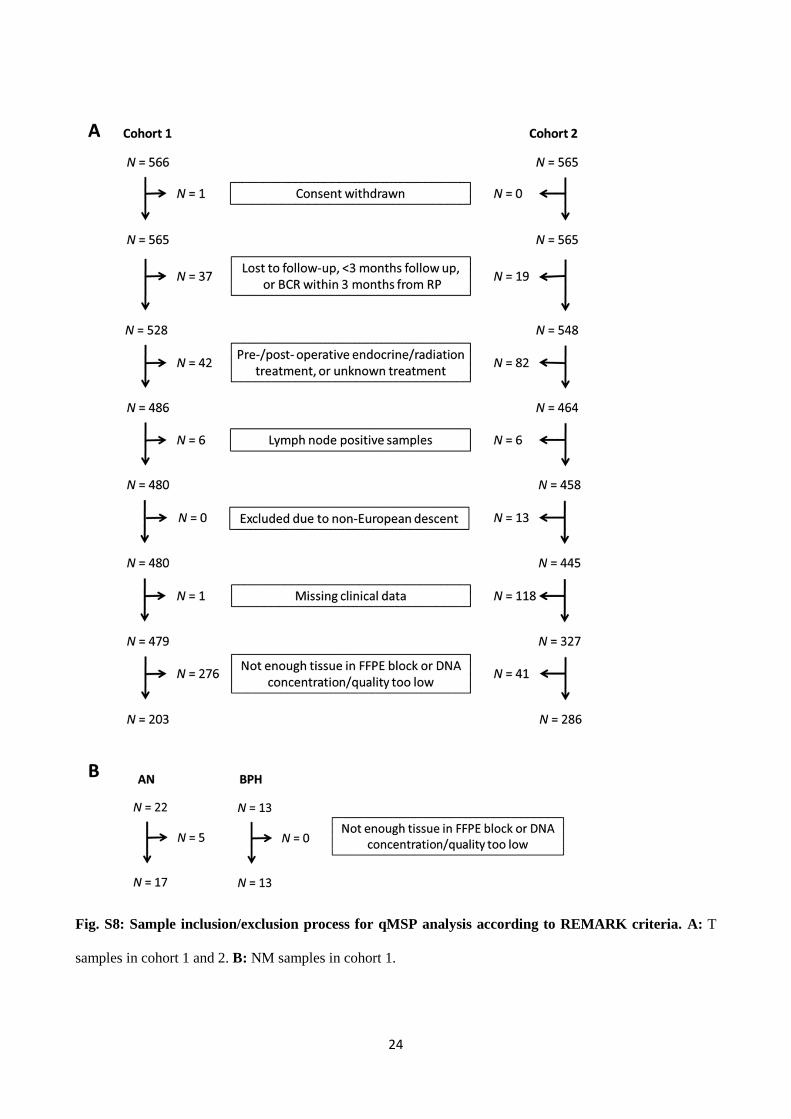
Fig. S8: Sample inclusion/exclusion process for qMSP analysis according to REMARK criteria. A: T
samples in cohort 1 and 2. B: NM samples in cohort 1.


![Promoter hypermethylation profiling of distant breast ... · phenotype of distant breast cancer metastases [14–16]. Extensive knowledge of the hypermethylation status of tumor suppressor](https://static.fdocuments.in/doc/165x107/5d21f00788c993722e8c67ea/promoter-hypermethylation-profiling-of-distant-breast-phenotype-of-distant.jpg)