TBM Performance Prediction Ozdemir - Inside...
13
1 CSM COMPUTER MODEL FOR TBM PERFORMANCE PREDICTION 1. Background The CSM model for TBM performance prediction was developed by the Earth Mechanics Institute (EMI) over a time period extending over 25 years. The development efforts on the CSM model began with a theoretical analysis of cutter penetration into the rock without any adjacent cuts or free-faces. As shown in Figure 1, this first step was crucial in understanding stress fields and the resultant fractures that are created beneath the penetrating edge of a disc cutter. Initially, the analysis focused on V-profile disc cutters, but later modified to include the constant-cross section discs as they became the industry standard. In this analysis, various previous theories derived from wedge indentation into rock were used as a guide. This analysis helped confirm the occurrence of a highly stressed crushed zone and the radial tension cracks during cutter penetration into the rock. Figure 1. Stress fields and the resultant fractures beneath the penetrating edge of a disc cutter
-
Upload
duonghuong -
Category
Documents
-
view
223 -
download
3
Transcript of TBM Performance Prediction Ozdemir - Inside...

1
CSM COMPUTER MODEL FOR TBM PERFORMANCE PREDICTION
1. Background
The CSM model for TBM performance prediction was developed by the Earth Mechanics
Institute (EMI) over a time period extending over 25 years. The development efforts on the CSM
model began with a theoretical analysis of cutter penetration into the rock without any adjacent
cuts or free-faces. As shown in Figure 1, this first step was crucial in understanding stress fields
and the resultant fractures that are created beneath the penetrating edge of a disc cutter. Initially,
the analysis focused on V-profile disc cutters, but later modified to include the constant-cross
section discs as they became the industry standard. In this analysis, various previous theories
derived from wedge indentation into rock were used as a guide. This analysis helped confirm the
occurrence of a highly stressed crushed zone and the radial tension cracks during cutter
penetration into the rock.
Figure 1. Stress fields and the resultant fractures beneath the penetrating edge of a disc cutter
2
The next step was to extend this single cutter analysis into multiple cutter operation to
simulate the interaction of adjacent cutting paths on a TBM. This means a free face (cut) exists
on one side of the cutter to which the chip formation occurs, as illustrated in Figure 2. In this
scenario, the rock under the cutter is again crushed to a fine powder, which behaves in a state of
hydrostatic stress, causing radial cracks to form and radiate from this crushed zone or the so-
called pressure-bulb. As these cracks are forced to grow, one or more of them reach the
neighboring cut, causing rock failure in the form of a chip. Detailed analysis of this chip
formation mechanism aided with high-speed movies taken during cutting and chip surface
inspections led to the conclusion that rock failure was occurring in tension. As a result, in the
first formulation of the CSM model, rock compressive and tensile strengths were used as input to
characterize the rock boreability by disc roller cutters. The compressive strength was used to
describe the rock crushing beneath the cutter tip while the tensile strength accounted for the chip
formation between adjacent cuts. Hence, using these two rock properties, a correlation was
developed between cutter thrust force and the depth of penetration achieved as a function of
cutter edge geometry and the cutter diameter.
Figure 2. Chip formation between adjacent cuts

3
Once the equation relating cutter thrust to penetration was established, the cutter rolling
force was determined using a ratio called the cutting coefficient. Figure 3 illustrates three cutting
forces that are exerted to the tip of the disc cutter during excavation.
Figure 3. Individual forces acting on a cutter
2. Prediction of Penetration Rate in CSM Model
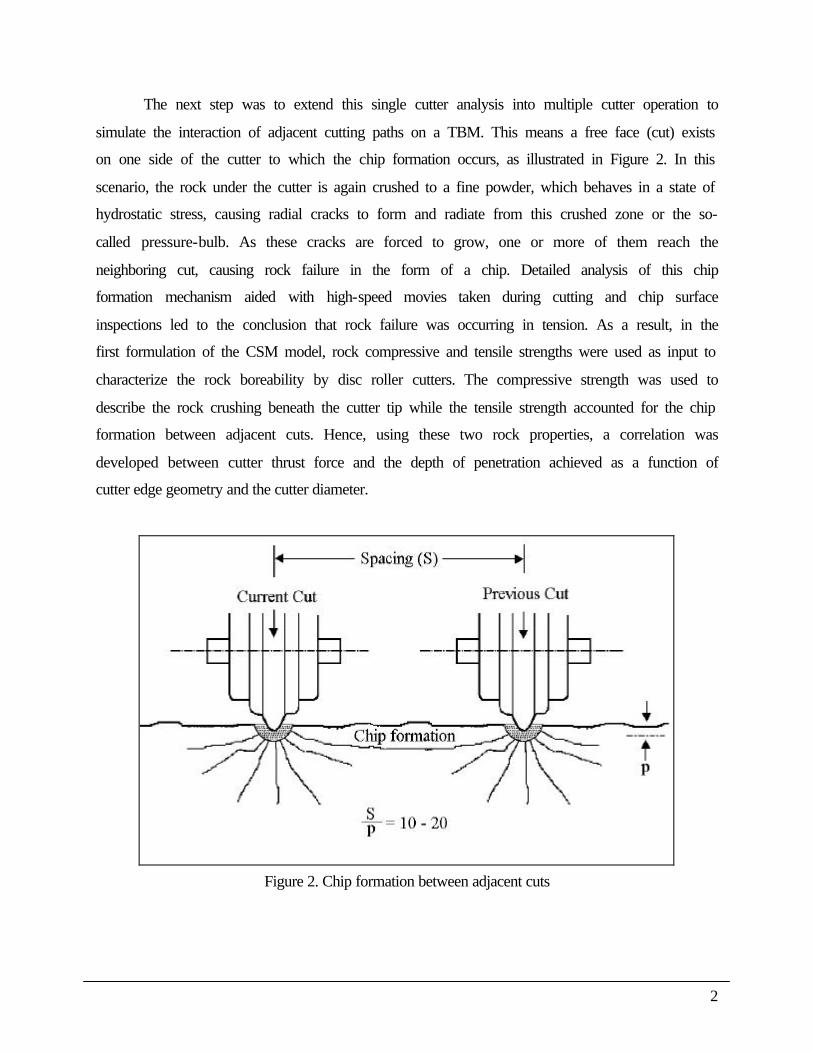
The formulation of the initial model was followed with calibration with actual cutting
data obtained from laboratory tests performed on the CSM Linear Cutting Machine (LCM). The
LCM allows testing of full size field cutters under field-simulated conditions in terms of cut
spacing, penetration, speed, etc (Figure 4). The accuracy of LCM test results has been validated
with extensive field TBM data. The statistical analysis of the cutting forces from LCM testing
with intact rock properties (such as unconfined compressive strength and tensile strength),
cutting geometry (spacing and penetration), and cutter geometry (diameter and tip width) became
the basis of the CSM computer model in order to formulate the cutting forces that are exerted on
tip of the disc cutter. This made penetration rate prediction possible for a tunnel boring machine
in given rock conditions by using the formulation from LCM testing. This also means that one
4
can make performance prediction without doing any laboratory-cutting test, such as LCM, with
an acceptable accuracy.
Figure 4. LCM test set-up and cutting forces recorded
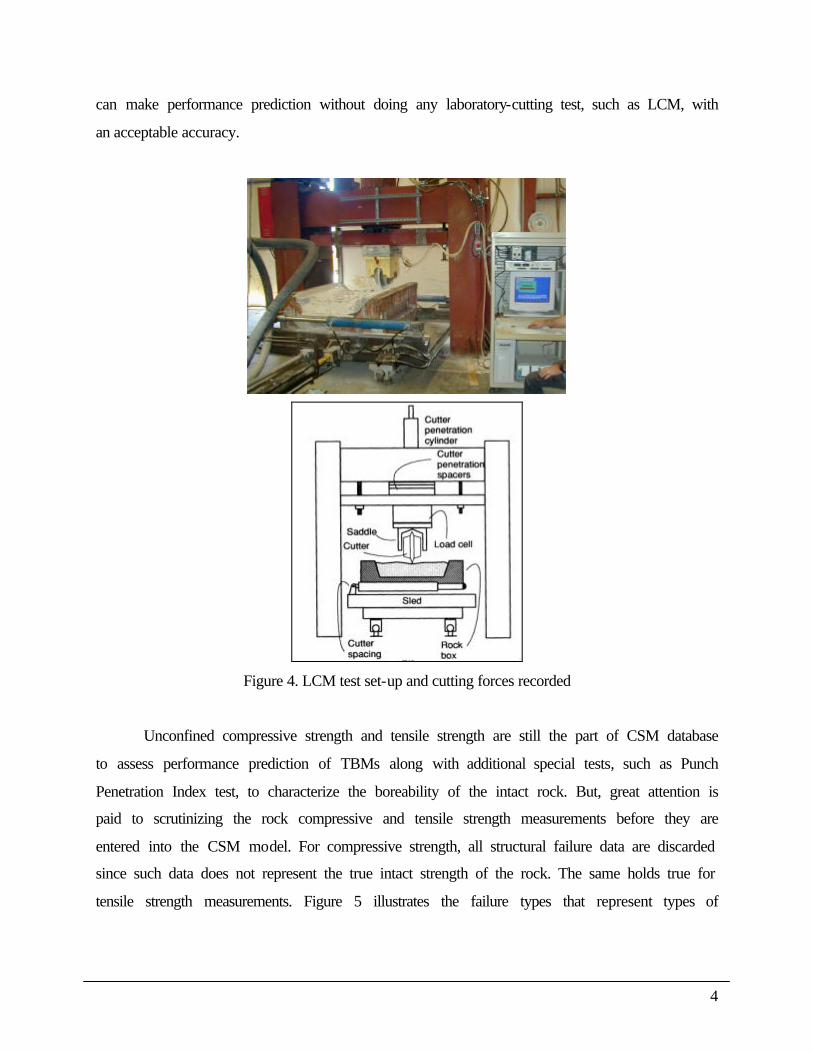
Unconfined compressive strength and tensile strength are still the part of CSM database
to assess performance prediction of TBMs along with additional special tests, such as Punch
Penetration Index test, to characterize the boreability of the intact rock. But, great attention is
paid to scrutinizing the rock compressive and tensile strength measurements before they are
entered into the CSM model. For compressive strength, all structural failure data are discarded
since such data does not represent the true intact strength of the rock. The same holds true for
tensile strength measurements. Figure 5 illustrates the failure types that represent types of

5
failures. The failure of a core sample along an existing fracture, joint or bedding/foliation planes
during laboratory test is considered as structural failure.
UCS non-structural UCS structural
BTS non-structural BTS structural
Figure 5. Failure types for UCS and BTS
Prediction of penetration rate is first based on the new cutters for the entire cutterhead.
This value is then adjusted to account for cutter wear as the TBM will always include cutters at
different levels of wear during mining. Because of this, a correction factor must be included to

6
account for the weighted average new and worn cutters at a time. The CSM computer model
performs this adjustment.
Figure 6. New and worn disc cutters
From the comparison of the model results with field data, it became apparent that the
compressive and tensile strengths themselves were not sufficient to fully characterize and
describe rock failure by disc cutters. This meant there were some other rock properties, which
influenced cuttability in addition to its compressive and tensile strengths. This property was
referred to as the toughness, meaning some rocks required either more or less cutting effort than
would be predicted based on their strength values alone. In some cases, rock was found to resist
efficient chipping with more than usual crushing occurring beneath the cutter tip. In others, rock
chipping occurred with less effort than anticipated. Following further theoretical and
experimental studies, this toughness issue was addressed by two methods. First was the adoption
of the Punch Penetration test as one measure of rock toughness. The punch test was originally
developed by Ingersoll-Rand for estimating raise borer performance and later adapted and used
by Robbins for TBM performance prediction. This test is described in literature; it basically
involves the penetration of a cone-shaped indentor into the rock and analyzing the load vs.
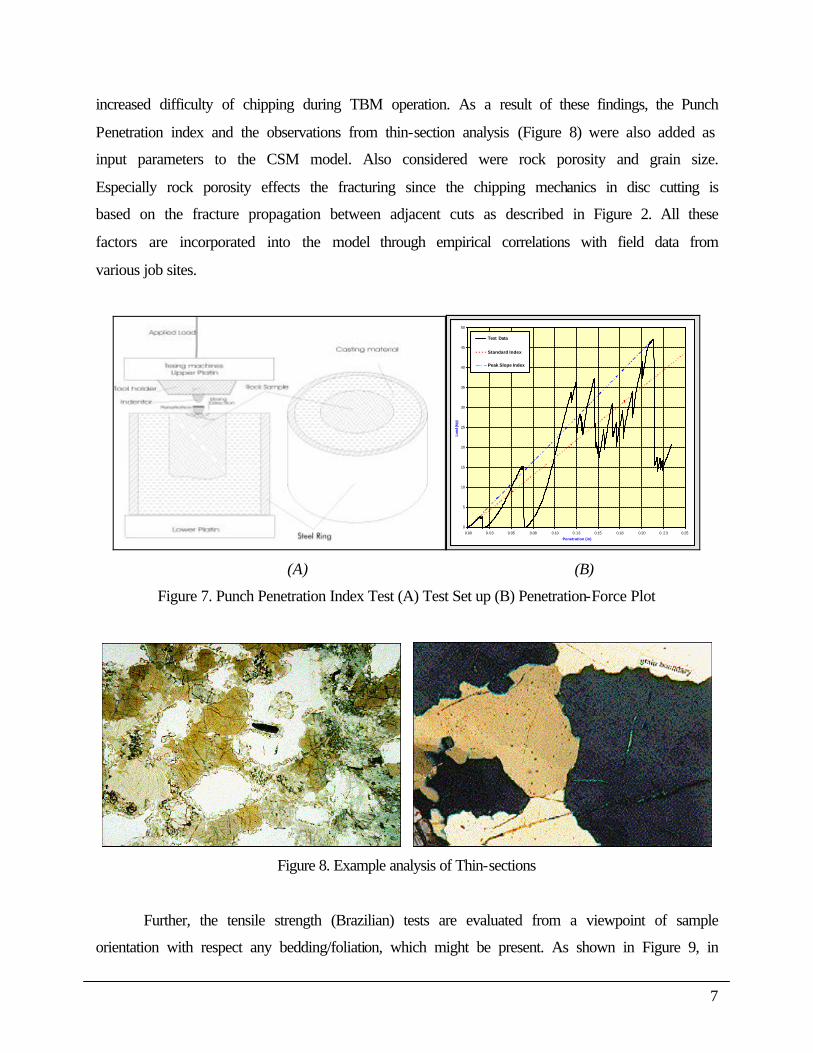
penetration curve recorded during the test (Figures 7). This slope is then used to provide a
measure of rock toughness. Another method to assist in defining rock toughness is the thin-
section petrographic analysis. It was found that in some rocks, certain grain/matrix
characteristics contributed to rock exhibiting certain toughness by impeding efficient chipping.
In such rock types, extensive crushing of rock was seen to occur in the cutter path prior to
formation of chips. Petrographic evaluations of such rocks revealed the occurrence of grain
suturing/interlocking, which made the rock fabric more difficult to “tear apart”, hence the
7
increased difficulty of chipping during TBM operation. As a result of these findings, the Punch
Penetration index and the observations from thin-section analysis (Figure 8) were also added as
input parameters to the CSM model. Also considered were rock porosity and grain size.
Especially rock porosity effects the fracturing since the chipping mechanics in disc cutting is
based on the fracture propagation between adjacent cuts as described in Figure 2. All these
factors are incorporated into the model through empirical correlations with field data from
various job sites.
Queens Tunnel Queens, NY Metamorphic massive 68+10P.dat 220.37 0.00 0.00
45-deg slope0 0.000.25000 43.75Peak slope0 0.000.21346 47.04102Average slope0 0.000.23458 0.00Energy slope0 0.000.15993 0.00
0
5
10
15
20
25
30
35
40
45
50
0.00 0.03 0.05 0.08 0.10 0.13 0.15 0.18 0.20 0.23 0.25
Penetration (in)
Load
(kip
)
Test Data
Standard Index
Peak Slope Index
(A) (B)
Figure 7. Punch Penetration Index Test (A) Test Set up (B) Penetration-Force Plot
Figure 8. Example analysis of Thin-sections
Further, the tensile strength (Brazilian) tests are evaluated from a viewpoint of sample
orientation with respect any bedding/foliation, which might be present. As shown in Figure 9, in

8
rocks exhibiting directional behavior due to existence of bedding/foliation, the Brazilian disks
need to be oriented so that failure occurs in more or less the same direction as chipping between
cutter paths.
(A) (B)
Figure 9. Rock failure in bedded/foliated rock formations (A) parallel to foliation and (B)
perpendicular to foliation
The CSM model predicts the penetration rate without any consideration given to the
influence of existing joints/fissures in the rock. To account for these effects, the model makes
use of the correlation factors developed for joint effects by the Norwegian Geotechnical Institute
(NTNU). Depending on joint/fissure spacing and angle that these weakness planes make with the
tunnel axis (i.e. the alpha angle), NTNU has derived a set of relationships between TBM
penetration rate and the fracturing factor. The CSM model results are then adjusted accordingly
to account for the joint/fissure effects using the relationships similar to those developed by
NTNU.
3. Model Description
The equations and the specific algorithms used in the CSM model for relating cutter force
to penetration are proprietary and are not disclosed to third parties. However to demonstrate how
the model functions, following is a step-by-step explanation as to the logic, which the model
utilizes to estimate the TBM penetration rate and cutter life.
9
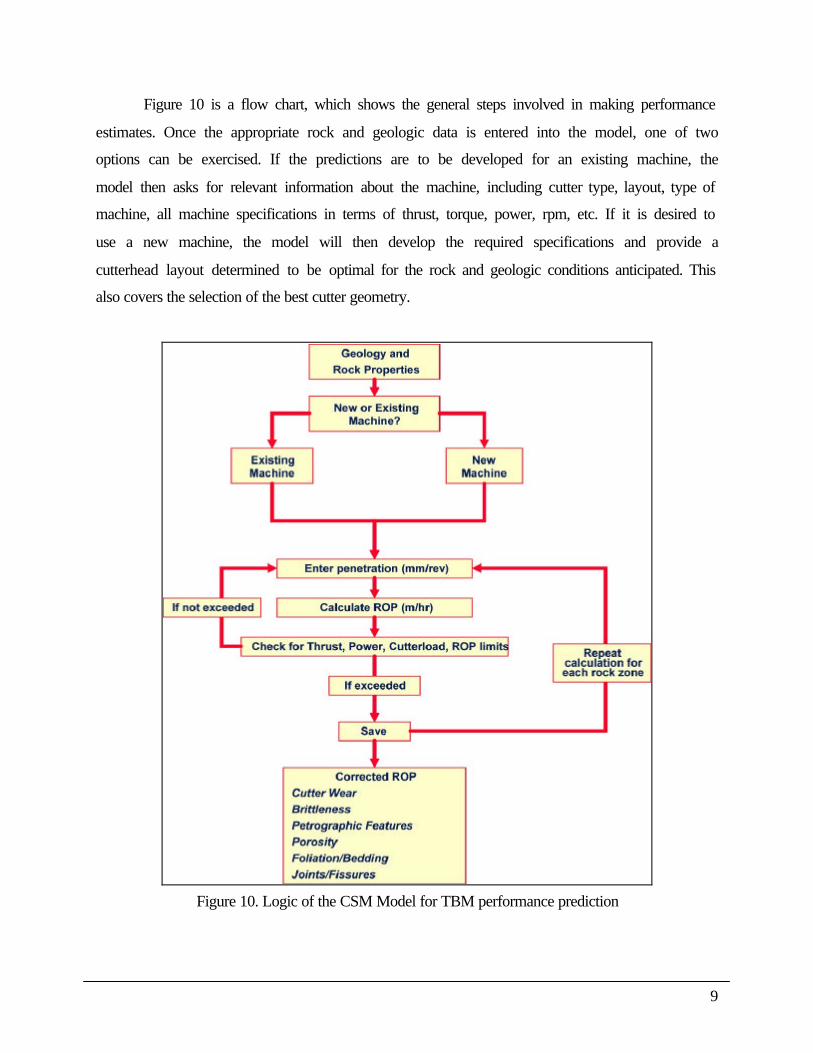
Figure 10 is a flow chart, which shows the general steps involved in making performance
estimates. Once the appropriate rock and geologic data is entered into the model, one of two
options can be exercised. If the predictions are to be developed for an existing machine, the
model then asks for relevant information about the machine, including cutter type, layout, type of
machine, all machine specifications in terms of thrust, torque, power, rpm, etc. If it is desired to
use a new machine, the model will then develop the required specifications and provide a
cutterhead layout determined to be optimal for the rock and geologic conditions anticipated. This
also covers the selection of the best cutter geometry.
Figure 10. Logic of the CSM Model for TBM performance prediction

10
Figure 11 shows the model window where the machine specifications are entered
together with power and thrust efficiency factors. The model then asks whether the actual
cutterhead is layout is available and if so, whether the estimates are to be developed using actual
layout or the average cutter spacing. These two approaches give very close results. The only
difference is that by using the actual head layout, the model can also calculate individual loads,
which vary as transition begins to occur from face to gage cutters (Figure 12).
Figure 11. Data Input Window for CSM Model
(A) Drawing (B) Model Plot
Figure 12. Cutterhead layout

11
The next step is to perform the calculations using the force-penetration algorithms built
into the model. The model accomplishes the required calculations using an iterative approach. It
starts from a low ROP and gradually increases it until one or more cutter or machine limits are
reached (Figure 13). It then records the corresponding penetration rate as the maximum
achievable ROP for the rock and geologic conditions anticipated. It follows the same procedure
for all other rock types to be encountered in the tunnel. All estimates are then summarized and
listed in a tabular form. As noted previously, the basic penetration is then adjusted by the model
to account for joints/foliation, porosity and rock toughness.
Figure 13. Calculation of ROP
The model can also produce a plot of cutter load distributions over the cutterhead. An
example of this is shown in Figure 14.
Figure 14. Thrust, Power and ROP at different rock strengths
12
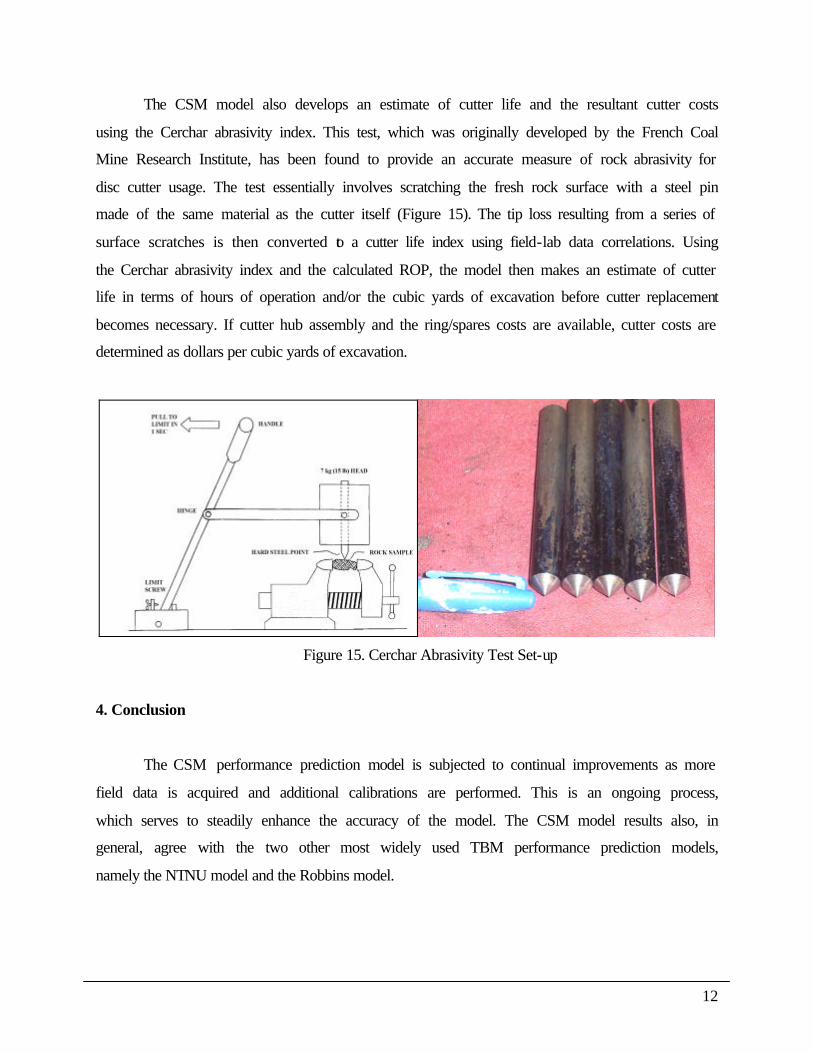
The CSM model also develops an estimate of cutter life and the resultant cutter costs
using the Cerchar abrasivity index. This test, which was originally developed by the French Coal
Mine Research Institute, has been found to provide an accurate measure of rock abrasivity for
disc cutter usage. The test essentially involves scratching the fresh rock surface with a steel pin
made of the same material as the cutter itself (Figure 15). The tip loss resulting from a series of
surface scratches is then converted to a cutter life index using field-lab data correlations. Using
the Cerchar abrasivity index and the calculated ROP, the model then makes an estimate of cutter
life in terms of hours of operation and/or the cubic yards of excavation before cutter replacement
becomes necessary. If cutter hub assembly and the ring/spares costs are available, cutter costs are
determined as dollars per cubic yards of excavation.
Figure 15. Cerchar Abrasivity Test Set-up
4. Conclusion
The CSM performance prediction model is subjected to continual improvements as more
field data is acquired and additional calibrations are performed. This is an ongoing process,
which serves to steadily enhance the accuracy of the model. The CSM model results also, in
general, agree with the two other most widely used TBM performance prediction models,
namely the NTNU model and the Robbins model.

13
REFERENCES:
Ozdemir, L., and Nilsen, B. "Hard Rock Tunnel Boring Prediction and Field Performance", Rapid Excavation and Tunneling Conference (RETC) Proceedings, Chapter 52, Boston, USA, (1993) Friant, E. J., Ozdemir, L., "Tunnel Boring Technology - Present and Future", Rapid Excavation and Tunneling Conference (RETC) Proceedings, Boston, USA, (1993) Bilgin, N., Nasuf, E., Cigla, M. "Stability Problems effecting the performance of a full-face tunnel boring machine in Istanbul - Baltilimani Tunnel", Proceeding on Assessment and Prevention of Failure Phenomena in Rock Engineering, Istanbul, Turkey, (1993) J. Rostami, L. Ozdemir, and B. Nilson, " Comparison Between CSM and NTH Hard Rock TBM Performance Prediction Models", ISDT, LAS VEGAS NV, (1996) Heer B., Essex R., Young D., "Manapouri Second Tailrace Tunnel Design and Construction Considerations", Rapid Excavation and Tunneling Conference (RETC) Proceedings, Chapter 1, (1997) Khalighi B. B., Diehl J. J., "High Performance Tunnel Boring Machine for Queens Water Tunnel, No. 3: A Design and Case History", Rapid Excavation and Tunneling Conference (RETC) Proceedings, (1997). Nelson, B., Ozdemir, L., "Recent Developments in Site Investigation and Testing For Hard Rock TBM Projects”, Rapid Excavation and Tunneling Conference (RETC) Proceedings, Chapter 39, (1999) Cigla M., Ozdemir L., "Computer Modeling For Improved Production of Mechanical Excavators", Society for Mining, Metallurgy and Exploration (SME) Annual Meeting, Salt Lake City, UT, (February 2000) M. Cigla, S. Yagiz and L. Ozdemir, "Application of Tunnel Boring Machines in Underground Mine Development", International Mining Congress, Ankara, Turkey, (2001) Kimball R. W., Estep F. B., Easterling D., "Chattahoochee Tunnel", Rapid Excavation and Tunneling Conference (RETC) Proceedings, (2003) Martin T. F., Heer B., "Second Manapouri Tailrace Tunnel - Not just Another Walk in the Park", Rapid Excavation and Tunneling Conference (RETC) Proceedings, (2003) Merguerian C., Ozdemir L., "Rock Mass Properties and Hard Rock TBM Penetration Rate Investigations, Queens Tunnel Complex, NYC Water Tunnel #3, Stage #2", Rapid Excavation and Tunneling Conference (RETC) Proceedings, (2003)