TBA Trading and Liquidity in the Agency MBS Market · PDF file2 TBA Trading and Liquidity in...
18
FRBNY Economic Policy Review / May 2013 1 TBA Trading and Liquidity in the Agency MBS Market 1. Introduction he U.S. residential mortgage market has experienced significant turmoil in recent years, leading to important shifts in the way mortgages are funded. Mortgage securitization by private financial institutions declined to negligible levels during the financial crisis that began in August 2007, and remains low today. In contrast, throughout the crisis there continued to be significant ongoing securitization in the agency mortgage-backed-securities (MBS) market, consisting of MBS with a credit guarantee by Fannie Mae, Freddie Mac, or Ginnie Mae. 1 Agency MBS in the amount of $2.89 trillion were issued in 2008 and 2009, but no non-agency securitizations of new loans occurred during this period. The outstanding stock of agency MBS also increased significantly during the crisis period, from $3.99 trillion at June 2007 to $5.27 trillion by December 2009. 2 1 Fannie Mae and Freddie Mac are the common names for the Federal National Mortgage Association and Federal Home Loan Mortgage Corporation, respectively, the government-sponsored enterprises (GSEs) that securitize and guarantee certain types of residential mortgages. Ginnie Mae, shorthand for the Government National Mortgage Association, is a wholly-owned government corporation within the Department of Housing and Urban Development. See Section 2 for more details. 2 Data on MBS issuance are from the Securities Industry and Financial Markets Association (SIFMA) and the Inside Mortgage Finance Mortgage Market Statistical Annual. Data on agency MBS outstanding are from the Federal Reserve Statistical Release Z.1, “Flow of Funds Accounts of the United States,” Table L.125. Throughout this article, unless otherwise noted, we use the term MBS to refer to residential MBS, not to securities backed by commercial mortgages. James Vickery is a senior economist at the Federal Reserve Bank of New York; Joshua Wright is a policy and markets analyst on the open market trading desk at the Federal Reserve Bank of New York. [email protected] [email protected] The authors thank Kenneth Garbade, two anonymous referees, Marco Cipriani, David Finkelstein, Michael Fleming, Ed Hohmann, Dwight Jaffee, Patricia Mosser, and market participants for their insights and help with institutional details, and Diego Aragon and Steven Burnett for outstanding research assistance. The views expressed are those of the authors and do not necessarily reflect the position of the Federal Reserve Bank of New York or the Federal Reserve System. • While mortgage securitization by private financial institutions has declined to low levels since 2007, issuance of agency mortgage- backed-securities (MBS) has remained robust. • A key feature of agency MBS is that each bond carries a credit guarantee by Fannie Mae, Freddie Mac, or Ginnie Mae. • More than 90 percent of agency MBS trading occurs in the to-be-announced (TBA) forward market. In a TBA trade, the exact securities to be delivered to the buyer are chosen just before delivery, rather than at the time of the original trade. • This study describes the key institutional features of the TBA market, highlighting recent trends and changes in market structure. • It presents suggestive evidence that the liquidity associated with TBA eligibility increases MBS prices and lowers mortgage interest rates. James Vickery and Joshua Wright T
Transcript of TBA Trading and Liquidity in the Agency MBS Market · PDF file2 TBA Trading and Liquidity in...

FRBNY Economic Policy Review / May 2013 1
TBA Trading and Liquidity in the Agency MBS Market
1. Introduction
he U.S. residential mortgage market has experienced significant turmoil in recent years, leading to important
shifts in the way mortgages are funded. Mortgage securitization by private financial institutions declined to negligible levels during the financial crisis that began in August 2007, and remains low today. In contrast, throughout the crisis there continued to be significant ongoing securitization in the agency mortgage-backed-securities (MBS) market, consisting of MBS with a credit guarantee by Fannie Mae, Freddie Mac, or Ginnie Mae.1 Agency MBS in the amount of $2.89 trillion were issued in 2008 and 2009, but no non-agency securitizations of new loans occurred during this period. The outstanding stock of agency MBS also increased significantly during the crisis period, from $3.99 trillion at June 2007 to $5.27 trillion by December 2009.2
1 Fannie Mae and Freddie Mac are the common names for the Federal National Mortgage Association and Federal Home Loan Mortgage Corporation, respectively, the government-sponsored enterprises (GSEs) that securitize and guarantee certain types of residential mortgages. Ginnie Mae, shorthand for the Government National Mortgage Association, is a wholly-owned government corporation within the Department of Housing and Urban Development. See Section 2 for more details. 2 Data on MBS issuance are from the Securities Industry and Financial Markets Association (SIFMA) and the Inside Mortgage Finance Mortgage Market Statistical Annual. Data on agency MBS outstanding are from the Federal Reserve Statistical Release Z.1, “Flow of Funds Accounts of the United States,” Table L.125. Throughout this article, unless otherwise noted, we use the term MBS to refer to residential MBS, not to securities backed by commercial mortgages.
James Vickery is a senior economist at the Federal Reserve Bank of New York; Joshua Wright is a policy and markets analyst on the open market trading desk at the Federal Reserve Bank of New York.
[email protected]@ny.frb.org
The authors thank Kenneth Garbade, two anonymous referees, Marco Cipriani, David Finkelstein, Michael Fleming, Ed Hohmann, Dwight Jaffee, Patricia Mosser, and market participants for their insights and help with institutional details, and Diego Aragon and Steven Burnett for outstanding research assistance. The views expressed are those of the authors and do not necessarily reflect the position of the Federal Reserve Bank of New York or the Federal Reserve System.
• While mortgage securitization by private financial institutions has declined to low levels since 2007, issuance of agency mortgage-backed-securities (MBS) has remained robust.
• A key feature of agency MBS is that each bond carries a credit guarantee by Fannie Mae, Freddie Mac, or Ginnie Mae.
• More than 90 percent of agency MBS trading occurs in the to-be-announced (TBA) forward market. In a TBA trade, the exact securities to be delivered to the buyer are chosen just before delivery, rather than at the time of the original trade.
• This study describes the key institutional features of the TBA market, highlighting recent trends and changes in market structure.
• It presents suggestive evidence that the liquidity associated with TBA eligibility increases MBS prices and lowers mortgage interest rates.
James Vickery and Joshua Wright
T

2 TBA Trading and Liquidity in the Agency MBS Market
A key distinguishing feature of agency MBS is that each bond either carries an explicit government credit guarantee or is perceived to carry an implicit one, protecting investors from credit losses in case of defaults on the underlying mortgages.3 This government backing has been the subject of a long-running academic and political debate. A second, less widely
recognized feature is the existence of a liquid forward market for trading agency MBS, out to a horizon of several months.4 The liquidity of this market improves market functioning and helps mortgage lenders manage risk, since it allows them to “lock in” sale prices for new loans as, or even before, those mortgages are originated.
More than 90 percent of agency MBS trading volume occurs in this forward market, which is known as the TBA (to-be-announced) market. In a TBA trade, the seller of MBS agrees to a sale price, but does not specify which particular securities will be delivered to the buyer on settlement day. Instead, only a few basic characteristics of the securities are agreed upon, such as the coupon rate, the issuer, and the approximate face value of the bonds to be delivered. While the agency MBS market consists of thousands of heterogeneous MBS pools backed by millions of individual mortgages, the TBA trading convention allows trading to be concentrated in only a small number of liquid forward contracts. TBA prices, which are observable to market participants, also serve as the basis for pricing and hedging a variety of other MBS, which
3 MBS guaranteed by Ginnie Mae carry an explicit federal government guarantee of the timely payment of mortgage principal and interest. Securities issued by Fannie Mae and Freddie Mac carry a credit guarantee from the issuer; although this guarantee is not explicitly backed by the federal government, it is very widely believed that the government would not allow Fannie Mae and Freddie Mac to default on their guarantee obligations. Consistent with this view, the U.S. Treasury has committed to support Fannie Mae and Freddie Mac since September 2008, when they were placed in conservatorship by their primary regulator, the Federal Housing Financing Agency (FHFA). (See Section 2 for a further discussion of this conservatorship.)4 In a forward contract, the security and cash payment for that security are not exchanged until after the date on which the terms of the trade are contractually agreed upon. The date the trade is agreed upon is called the “trade date.” The date the cash and securities change hands is called the “settlement date.”
The liquidity of [the TBA] market improves
market functioning and helps mortgage
lenders manage risk, since it allows them
to “lock in” sale prices for new loans as, or
even before, those mortgages are
originated.
themselves would not be delivered into a TBA trade and may not even be eligible for TBA delivery.
The main goal of this article is to describe the basic features and mechanics of the TBA market, and to review recent legislative changes that have affected the types of mortgages eligible for TBA trading. The article also presents some preliminary evidence suggesting that the liquidity benefits associated with TBA eligibility increase MBS prices and reduce mortgage interest rates. Our analysis exploits changes in legislation to help disentangle the effects of TBA eligibility from other characteristics of agency MBS. In particular, we study pricing for “super-conforming” mortgages that became eligible for agency MBS securitization through legislation in 2008, but that were ruled ineligible to be delivered to settle TBA trades. We show that MBS backed by super-conforming mortgages trade at a persistent price discount in the secondary market, and also that interest rates on such loans are correspondingly higher in the primary mortgage market. Preliminary evidence suggests that these stylized facts are not fully explained by differences in prepayment risk. We interpret our estimates to suggest that the liquidity benefits of TBA eligibility may be of the order of 10 to 25 basis points on average in 2009 and 2010, and are larger during periods of greater market stress.
Our institutional discussion and empirical results support the view that the TBA market serves a valuable role in the mortgage finance system. This finding suggests that evaluations of proposed reforms to U.S. housing finance should take into account potential effects of those reforms on the operation of the TBA market and its liquidity.
2. Background
Most residential mortgages in the United States are securitized, rather than held as whole loans by the original lender.5 Securitized loans are pooled in a separate legal trust, which then issues the MBS and passes on mortgage payments to the MBS investors after deducting mortgage servicing fees and other expenses. These MBS are actively traded and held by a wide range of fixed-income investors.
Even in the wake of the subprime mortgage crisis, securitization remains central to the U.S. mortgage finance system because of continuing large issuance volumes of agency MBS. In the agency market, each MBS carries a credit
5 As of December 2011, 67 percent of home mortgage debt was either securitized through agency or non-agency MBS or held on the balance sheets of Fannie Mae and Freddie Mac (source: Federal Reserve Statistical Release Z.1, “Flow of Funds Accounts of the United States,” Table L.218).

FRBNY Economic Policy Review / May 2013 3
guarantee from either Fannie Mae or Freddie Mac, two housing GSEs currently under public conservatorship,6 or from Ginnie Mae. (Hereafter, we sometimes refer to these three institutions as “the agencies.”) In return for monthly guarantee fees, the guarantor promises to forward payments of mortgage principal and interest to MBS investors, even if there are prolonged delinquencies among the underlying mortgages.7 In other words, mortgage credit risk is borne by the guarantor, not by investors. However, investors are still subject to uncertainty about when the underlying borrowers will prepay their mortgages. This prepayment risk is the primary source of differences in fundamental value among agency MBS.
Only mortgages that meet certain size and credit quality criteria are eligible for inclusion in mortgage pools guaranteed by Fannie Mae, Freddie Mac, or Ginnie Mae. The charters of Fannie Mae and Freddie Mac restrict the types of loans that may be securitized; these limits include a set of loan size restrictions known as “conforming loan limits.”8 Mortgages exceeding these size limits are referred to as “jumbo” loans; such mortgages can be securitized only by private financial institutions and do not receive an explicit or implicit government credit guarantee. Ginnie Mae MBS include only loans that are explicitly federally insured or guaranteed, mainly loans insured by the Federal Housing Administration (FHA) or guaranteed by the Department of Veterans Affairs.
6 This period of conservatorship began on September 7, 2008. As of this date, the FHFA—Fannie Mae and Freddie Mac’s primary regulator—assumed control of major operating decisions made by these two firms. This was accompanied by an injection of preferred stock by the U.S. Treasury and the establishment of a secured lending credit facility with the Treasury. These steps were made necessary by Fannie Mae’s and Freddie Mac’s deteriorating financial condition, attributable to mortgage-related credit losses. (For more details, see www.ustreas.gov/press/releases/hp1129.htm.)7 The timing of these payments can differ depending on the class of security. For example, Freddie Mac’s Gold PCs (participation certificates), which have a forty-five-day payment delay, promise timely payment of both principal and interest, but Freddie Mac’s adjustable-rate-mortgage PCs, which have a seventy-five-day payment delay, promise timely payment of interest and ultimate payment of principal. For both agencies, a loan that is seriously delinquent is eventually removed from the MBS pool, in exchange for a payment of the remaining principal at par. Thus, a mortgage default is effectively equivalent to a prepayment from the MBS investor’s point of view, since the investor receives an early return of principal, but does not suffer any credit losses.8 Until 2008, the one-family conforming loan limit for loans securitized through Fannie Mae and Freddie Mac was $417,000, with higher limits applying to two-to-four-family mortgages and loans from Alaska, Hawaii, Guam, and the U.S. Virgin Islands. Lower size limits applied to loans guaranteed by Ginnie Mae. These conforming size limits were raised significantly in high-cost housing areas in 2008, as discussed in Section 4.1.
2.1 Mortgage Interest Rates during the Financial Crisis
Only a small number of non-agency residential MBS have been issued since mid-2007 and, during this period, secondary markets for trading non-agency MBS have been extremely illiquid. In contrast, issuance and trading volumes in the agency MBS market remained relatively robust throughout the crisis period. Providing evidence of this market liquidity, Table 1 presents data on daily average trading volumes for different types of U.S. bonds. Agency MBS daily trading volumes have averaged around $300 billion from 2005 to 2010, a level that did not decline significantly during the financial crisis of 2007-09. While in each year MBS trading volumes were lower than Treasury volumes, they were of a larger order of magnitude than corporate bonds or municipal bonds.
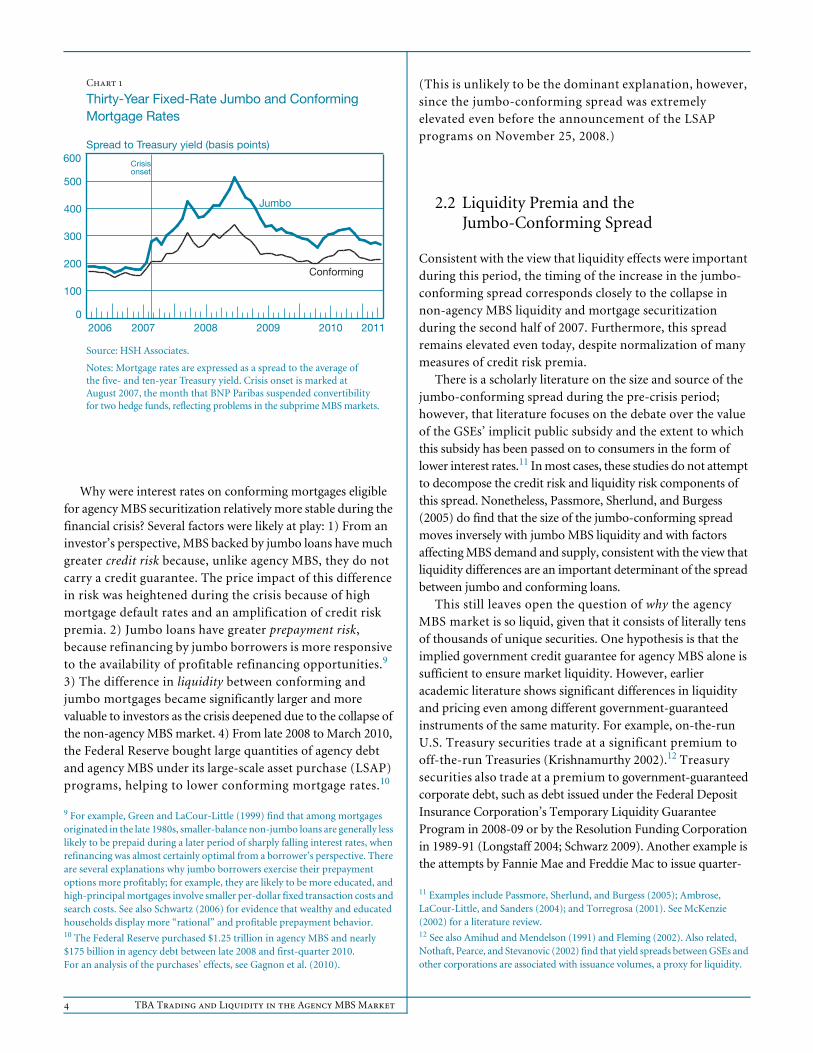
The effects of this divergence between the agency and non-agency MBS markets on primary mortgage rates can be seen in Chart 1, which shows the evolution of interest rates on jumbo and conforming mortgages between 2007 and mid-2011. Rates on both loan types are expressed as a spread to Treasury yields. Both spreads increased during the financial crisis, but the increase was much more pronounced for jumbo loans. Before the crisis, interest rates on jumbo loans were only around 25 basis points higher than rates on conforming mortgages; this “jumbo-conforming spread” increased to 150 basis points or more during the crisis. While the jumbo-conforming spread has narrowed more recently, it still significantly exceeds pre-crisis levels, as of mid-2011.
Table 1
Daily Average Trading Volumes in MajorU.S. Bond MarketsBillions of dollars
YearMunicipal
BondsTreasurySecurities
Agency Mortgage-Backed Securities
Corporate Bonds
2005 16.9 554.5 251.8 16.7
2006 22.5 524.7 254.6 16.9
2007 25.2 570.2 320.2 16.4
2008 19.4 553.1 344.9 11.8
2009 12.5 407.9 299.9 16.8
2010 13.3 523.2 320.6 16.3
Source: Federal Reserve Bank of New York.
Notes: Figures are based on purchases and sales of securities reported by primary dealers (see www.newyorkfed.org/markets/gsds/search.cfm). Figures for corporate bonds refer only to securities with a maturity greater than one year.
4 TBA Trading and Liquidity in the Agency MBS Market
Chart 1
Thirty-Year Fixed-Rate Jumbo and ConformingMortgage Rates
Spread to Treasury yield (basis points)
0
100
200
300
400
500
600
Jumbo
Conforming
201120102009200820072006
Source: HSH Associates.
Notes: Mortgage rates are expressed as a spread to the average of the five- and ten-year Treasury yield. Crisis onset is marked at August 2007, the month that BNP Paribas suspended convertibility for two hedge funds, reflecting problems in the subprime MBS markets.
Crisisonset
Why were interest rates on conforming mortgages eligible for agency MBS securitization relatively more stable during the financial crisis? Several factors were likely at play: 1) From an investor’s perspective, MBS backed by jumbo loans have much greater credit risk because, unlike agency MBS, they do not carry a credit guarantee. The price impact of this difference in risk was heightened during the crisis because of high mortgage default rates and an amplification of credit risk premia. 2) Jumbo loans have greater prepayment risk, because refinancing by jumbo borrowers is more responsive to the availability of profitable refinancing opportunities.9 3) The difference in liquidity between conforming and jumbo mortgages became significantly larger and more valuable to investors as the crisis deepened due to the collapse of the non-agency MBS market. 4) From late 2008 to March 2010, the Federal Reserve bought large quantities of agency debt and agency MBS under its large-scale asset purchase (LSAP) programs, helping to lower conforming mortgage rates.10
9 For example, Green and LaCour-Little (1999) find that among mortgages originated in the late 1980s, smaller-balance non-jumbo loans are generally less likely to be prepaid during a later period of sharply falling interest rates, when refinancing was almost certainly optimal from a borrower’s perspective. There are several explanations why jumbo borrowers exercise their prepayment options more profitably; for example, they are likely to be more educated, and high-principal mortgages involve smaller per-dollar fixed transaction costs and search costs. See also Schwartz (2006) for evidence that wealthy and educated households display more “rational” and profitable prepayment behavior. 10 The Federal Reserve purchased $1.25 trillion in agency MBS and nearly $175 billion in agency debt between late 2008 and first-quarter 2010. For an analysis of the purchases’ effects, see Gagnon et al. (2010).
(This is unlikely to be the dominant explanation, however, since the jumbo-conforming spread was extremely elevated even before the announcement of the LSAP programs on November 25, 2008.)
2.2 Liquidity Premia and the Jumbo-Conforming Spread
Consistent with the view that liquidity effects were important during this period, the timing of the increase in the jumbo-conforming spread corresponds closely to the collapse in non-agency MBS liquidity and mortgage securitization during the second half of 2007. Furthermore, this spread remains elevated even today, despite normalization of many measures of credit risk premia.
There is a scholarly literature on the size and source of the jumbo-conforming spread during the pre-crisis period; however, that literature focuses on the debate over the value of the GSEs’ implicit public subsidy and the extent to which this subsidy has been passed on to consumers in the form of lower interest rates.11 In most cases, these studies do not attempt to decompose the credit risk and liquidity risk components of this spread. Nonetheless, Passmore, Sherlund, and Burgess (2005) do find that the size of the jumbo-conforming spread moves inversely with jumbo MBS liquidity and with factors affecting MBS demand and supply, consistent with the view that liquidity differences are an important determinant of the spread between jumbo and conforming loans.
This still leaves open the question of why the agency MBS market is so liquid, given that it consists of literally tens of thousands of unique securities. One hypothesis is that the implied government credit guarantee for agency MBS alone is sufficient to ensure market liquidity. However, earlier academic literature shows significant differences in liquidity and pricing even among different government-guaranteed instruments of the same maturity. For example, on-the-run U.S. Treasury securities trade at a significant premium to off-the-run Treasuries (Krishnamurthy 2002).12 Treasury securities also trade at a premium to government-guaranteed corporate debt, such as debt issued under the Federal Deposit Insurance Corporation’s Temporary Liquidity Guarantee Program in 2008-09 or by the Resolution Funding Corporation in 1989-91 (Longstaff 2004; Schwarz 2009). Another example is the attempts by Fannie Mae and Freddie Mac to issue quarter-
11 Examples include Passmore, Sherlund, and Burgess (2005); Ambrose, LaCour-Little, and Sanders (2004); and Torregrosa (2001). See McKenzie (2002) for a literature review.12 See also Amihud and Mendelson (1991) and Fleming (2002). Also related, Nothaft, Pearce, and Stevanovic (2002) find that yield spreads between GSEs and other corporations are associated with issuance volumes, a proxy for liquidity.

FRBNY Economic Policy Review / May 2013 5
Timeline for a TBA Trade
Source: Salomon Smith Barney.
Tradedate
7/27 8/14 8/16
Tradeconfirmation
7/28
Six parameters
Issuer: Freddie MacMaturity: Thirty-yearCoupon: 6 percentPrice: $102Par amount: $200 millionSettlement: August
Forty-eight-hour day
Seller notifiesbuyer of specificpools and theircharacteristics
Settlementdate
Seller deliverspools
coupon MBS and participation certificates. Even for the same guarantor and loan term, these quarter-coupon securities have traded at wider bid-ask spreads and have had higher average yields than neighboring whole- and half-coupon securities, which are more liquid. These examples, as well as the literature on the jumbo-conforming spread, are relatively consistent in suggesting that a pure liquidity premium for the most liquid government or government-like securities may be in the range of 10 to 30 basis points under “normal” financial market conditions and significantly larger during periods of market disruption, such as those experienced during the financial crisis.13
Thus, the presence of a government credit guarantee alone does not appear to be sufficient explanation for the liquidity of agency MBS and the wedge between jumbo and conforming mortgage rates. The sheer aggregate size of the agency MBS market no doubt contributes to its liquidity, but this does not account for why agency MBS are more liquid than corporate bonds, whose market is similar in total size. The agency MBS market is substantially more homogenous than the corporate bond market, however, and TBA trading helps homogenize the market further, at least for trading purposes. The TBA market has received relatively little attention in the academic literature, and the mechanics of this market are not well understood by many non-specialist observers.14 To help fill this gap, we now turn to a detailed description of the TBA market.
3. The TBA Market
In a TBA trade, similar to other forward contracts, the two parties agree upon a price for delivering a given volume of agency MBS at a specified future date.15 The characteristic feature of a TBA trade is that the actual identity (that is, the particular CUSIPs) of the securities to be delivered at settlement is not specified on the trade date. Instead, participants agree upon only six general parameters of the securities to be delivered: issuer, maturity, coupon, price, par amount, and settlement date. Coupon rates vary in 50-basis-point increments, in keeping with the underlying MBS.
13 See Beber, Brandt, and Kavajecz (2009) for a discussion of liquidity premia amid flight-to-quality flows.14 Many GSE reform commentaries have similarly made little mention of the TBA market. Exceptions include SIFMA and the Mortgage Bankers Association.15 Note that all TBA-eligible securities involve a so-called “pass-through” structure, whereby the underlying mortgage principal and interest payments are forwarded to securityholders on a pro rata basis, with no tranching or structuring of cash flows. Collateralized mortgage obligations (CMOs) are not TBA-eligible.
A smaller but still significant portion of agency MBS trading volume occurs outside of the TBA market. This is known as “specified pool” trading, because the identity of the securities to be delivered is specified at the time of the trade, much like in other securities markets. Some of these pools are ineligible for TBA trading because the underlying loans have nonstandard features. Others, however, trade outside the TBA market by choice, because they are backed by loans with more favorable prepayment characteristics from an investor’s point of view, allowing them to achieve a higher price, as described below. Similarly, some TBA trades will involve additional stipulations, or “stips,” beyond the six characteristics listed above, such as restrictions on the seasoning, number of pools, or geographic composition of the pools to be delivered.
3.1 Mechanics of a TBA Trade
A timeline for a typical TBA trade, including three key dates, is shown in the exhibit. The detailed conventions that have developed around TBA trading are encoded in the “good delivery guidelines” determined by the Securities Industry and Financial Markets Association, an industry trade group whose members include broker-dealers and asset managers, as part of its Uniform Practices for the Clearance and Settlement of Mortgage-Backed Securities and Other Related Securities. These conventions were developed as the MBS market emerged in the 1970s and became more detailed and formalized in the ensuing decades.

6 TBA Trading and Liquidity in the Agency MBS Market
Trade day. The buyer and seller establish the six trade parameters listed above. In the example shown in the exhibit, a TBA contract agreed upon in July will be settled in August, for a security issued by Freddie Mac with a thirty-year maturity, a 6 percent annual coupon, and a par amount of $200 million at a price of $102 per $100 of par amount, for a total price of $204 million. TBA trades generally settle within three months, with volumes and liquidity concentrated in the two nearest months. To facilitate the logistics of selecting and delivering securities from the sellers’ inventory, SIFMA sets a single settlement date each month for each of several types of agency MBS.16 Thus, depending on when it falls in the monthly cycle of settlements, the trade date will usually precede settlement by between two and sixty days.
Two days before settlement. No later than 3 p.m. two business days prior to settlement (“forty-eight-hour day”), the seller provides the buyer with the identity of the pools it intends to deliver on settlement day. If two counterparties have offsetting trades for the same TBA contract, these trades will be netted out.
Settlement day. The seller delivers the securities specified two days prior and receives the cash specified on the trade date. Amid the trading, lending, analysis, selection, and settling of thousands of individual securities each month, operational or accounting problems can arise—the resolution of which relies on a detailed set of conventions developed by SIFMA.
3.2 “Cheapest-to-Deliver” Pricing
Similar to Treasury futures, TBAs trade on a “cheapest-to-deliver” basis. On a forty-eight-hour day, the seller selects which MBS in its inventory will be delivered to the buyer at settlement. The seller has a clear incentive to deliver the lowest-value securities that satisfy the terms of the trade (recall that differences in value across securities are driven by pool characteristics affecting prepayment risk, such as past prepayment rates, or the geographic composition of the pool). This incentive is well understood by the TBA buyer, who expects to receive a security of lower value than average and accordingly adjusts downward the price it is willing to pay in the TBA market at the time of the trade. This is an example of a market phenomenon known to economists as “adverse selection.”17 Compounding this cheapest-to-deliver effect, the fact that the TBA seller effectively receives a valuable option well before settlement date to choose at settlement which bonds will be delivered, after additional information about the value
16A full calendar of future settlement dates can be found at www.sifma.org.17 For evidence of how adverse selection affects the types of securities resecuritized into multiclass MBS, see Downing, Jaffee, and Wallace (2009).
of each security has been realized, further reduces the equilibrium price of the TBA contract relative to the value of an average MBS deliverable into that contract.
3.3 Temporary Fungibility and TBA Liquidity
TBA trading effectively applies a common cheapest-to-deliver price level to an intrinsically diverse set of securities and underlying mortgages. While the practice also occurs in the Treasury futures market, this homogenization seems more striking in the context of agency MBS because of the greater heterogeneity of the underlying assets. For trading purposes, groups of MBS that share the six general characteristics listed
above may be treated as fungible, in the sense that any could be delivered into a given TBA trade. This fungibility is only temporary, however, because after physical settlement the buyer observes additional characteristics of each pool that it has received (one or more of hundreds deliverable into the relevant TBA contract), which provide information about prepayment behavior and hence value.
Thus, while the agency MBS market consists of tens of thousands of pools, backed by millions of individual mortgages, trading is concentrated in only a few dozen TBA contracts spread across three maturity points (thirty-year, twenty-year, and fifteen-year mortgages). For each maturity point, there are usually only three or four coupons in active production at any time. TBA trading may occur across a larger number of coupons, reflecting the broader range of coupons in the outstanding stock of agency MBS, which itself reflects the previous path of interest rates. We computed some simple trading summary statistics for calendar years 2010 and 2011 using data from TradeWeb, an agency MBS trading platform (discussed in more detail in Section 3.6) for outright Fannie Mae thirty-year TBAs. For this product, there is positive trading volume for an average of 6.6 different coupons on any given trading day. The most active coupon on each day contributes 49 percent of total trading volume.
Due in part to the concentration of trading in a small number of contracts, market participants are able to place TBA trades in amounts of as much as $100 million to $200 million or
TBA trading effectively applies a
common cheapest-to-deliver price level
to an intrinsically diverse set of securities
and underlying mortgages.

FRBNY Economic Policy Review / May 2013 7
more (for securities backed by individual loans of several hundred thousand dollars each) with a high degree of liquidity. This is reflected in the high trading volumes in the agency MBS market (several hundred billion dollars per day, as reported in Table 1), as well as relatively narrow bid-ask spreads.18 See Section 3.6 for further discussion of trading volume data in the agency MBS market.
Similar to the MBS pooling process itself, TBA trading simplifies the analytical and risk management challenges for participants in agency MBS markets. Rather than attempting to value each individual security, participants need only to analyze the more tractable set of risks associated with the parameters of each TBA contract. This helps encourage market
participation from a broader group of investors, notably foreign central banks and a variety of mutual funds and hedge funds, translating into a greater supply of capital for financing mortgages and presumably lower rates for homeowners.
The treatment of TBA pools as fungible is sustainable in part because a significant degree of actual homogeneity is present among the securities deliverable into any particular TBA contract. Most notably, each TBA-eligible security carries the same high-quality, GSE-backed credit guarantee on the underlying mortgage cash flows, which essentially eliminates credit risk. However, standardization of underwriting and securitization practices in the agency MBS market contributes meaningfully to homogeneity as well. At the loan level, the standardization of lending criteria for loans eligible for agency MBS constrains the variation among the borrowers and properties underlying the MBS. At the security level, homogenizing factors include the geographic diversification incorporated into the pooling process, the limited number of issuers, the simple structure of “pass-through” security features, and the restriction of the range of interest rates on loans deliverable into a single security. The GSEs’ pooling criteria also help assure that pools are relatively homogenous. These criteria include mortgage contract rate ranges (limits on mortgage
18 Emphasizing the lower trading costs and greater liquidity of the TBA market, recent research by Friewald, Jankowitsch, and Subrahmanyam (2012) finds that the average transaction cost of a round-trip trade in the TBA market is only 5 basis points, compared with 48 basis points for MBS specified pool trades.
The treatment of TBA pools as fungible is
sustainable in part because a significant
degree of actual homogeneity is present
among the securities deliverable into any
particular TBA contract.
contract rates, defined relative to the MBS coupon rate) and limits on the distribution of loan age.
3.4 Adverse Selection without Market Failure
Because of the incentives associated with cheapest-to-deliver pricing, not all eligible MBS pools actually trade on a TBA basis. Higher-value pools (those with the most advantageous prepayment characteristics from an investor’s point of view) can command a higher price in the less liquid specified pool market.19 Specified pool trading, as well as the use of “stips,” is generally more common for seasoned pools than for newly issued pools, reflecting their lower prepayment risk and therefore higher value. However, specified pools are much less liquid, largely because of the much greater fragmentation of the market.20
According to conversations with market participants, a significant volume of physical delivery of securities occurs through the TBA market because, for many securities, the liquidity value of TBA trading generally exceeds any adverse-selection discount implied by cheapest-to-deliver pricing. In part, this is because the significant level of homogeneity in the underwriting and pooling process constrains the variation in value among securities deliverable into a given TBA contract. Paradoxically, the limits on information disclosure inherent in the TBA market seem to actually increase the market’s liquidity by creating fungibility across securities and reducing information acquisition costs for buyers of MBS. A similar argument explains why DeBeers diamond auctions involve selling pools of diamonds in unmarked bags that cannot be inspected by potential buyers. More generally, the idea that limited information can reduce adverse selection and increase trade is known to economists as the “Hirshleifer paradox” (Hirshleifer 1971).21
19 Note that the term “specified pool” can also apply to an agency MBS that is not deliverable into a TBA contract because it does not meet the good delivery guidelines set by SIFMA. These include pools backed by high-balance mortgages, forty-year mortgages, and interest-only mortgages. These ineligible pools may trade at lower values than do TBAs.20 In calendar year 2011, TBA trades (including dollar rolls) made up 94 percent of agency MBS trading, based on TRACE data, including a large volume of both customer trades and dealer-to-dealer trades. This figure includes trading across a wide range of coupons on any given day. See Section 3.6 for more information on TRACE.21 See French and McCormick (1984) for a discussion of the DeBeers example. Glaeser and Kallal (1997) present a formal model demonstrating how restricting the set of information provided to MBS investors may enhance liquidity by decreasing information asymmetries and hence opportunities for adverse selection. Dang, Gorton, and Holmström (2009) present a related model in which shocks to fundamentals can generate adverse selection and market freezes.

8 TBA Trading and Liquidity in the Agency MBS Market
3.5 Hedging and Financing Mortgages through TBAs
TBAs also facilitate hedging and funding by allowing lenders to prearrange prices for mortgages that they are still in the process of originating, thereby hedging their exposure to interest rate risk. In the United States, lenders frequently give successful mortgage applicants the option to lock in a mortgage rate for a period of thirty to ninety days. Lenders are exposed to the risk that the market price will fluctuate in the period from the time the rate lock is set to when the loan is eventually sold in the secondary market. The ability to sell mortgages forward through the TBA market hedges originators against this risk. It is important for originators to offer applicants fixed-rate loan terms before a mortgage
actually closes, which greatly facilitates the final negotiations of house purchases and the overall viability of the thirty-year fixed-rate mortgage as a business line.
Although this price risk could also be hedged with other instruments, TBAs provide superior hedging benefits because of their lower basis risk. Confirming this view, Atanasov and Merrick (2012) find that prices of specified pool trades for TBA-deliverable securities co-move almost perfectly with prices for the corresponding TBA contract, except for trades small (below $25,000) in size. Price movements of Treasury futures, in contrast, can diverge significantly from those of MBS because of movements in prepayment risk premia or changes in relative supply. Mortgage option contracts are more expensive than TBAs, less liquid, and only available for short time horizons (these options are instead used to hedge against variation in the fraction of rate locks subsequently utilized by borrowers). While a mortgage futures contract might provide some of the benefits of TBAs, historical attempts to establish a mortgage futures contract in the United States have been unsuccessful (see Nothaft, Lekkas, and Wang [1995] and Johnston and McConnell [1989]). The hedging benefits provided by TBAs will likely be passed on to mortgage borrowers in the form of lower interest rates because of competition among lenders.
TBA trading has also led to the development of a funding and hedging mechanism unique to agency MBS: the dollar roll. A dollar roll is simply the combination of one TBA trade with a simultaneous and offsetting TBA trade settling on a different date.
TBA trading has . . . led to the development
of a funding and hedging mechanism
unique to agency MBS: the dollar roll.
This mechanism allows investors and market makers great flexibility in adjusting their positions for either economic or operational reasons. For example, an investor who has purchased a TBA, but faces operational concerns about receiving delivery as scheduled, could sell an offsetting TBA on that date and simultaneously buy another TBA due one month later, effectively avoiding the operational issue but retaining his economic exposure. An investor could also obtain what amounts to a short-term loan at a favorable rate by selling a TBA for one date and buying another TBA for a later one. For market makers on the other side of such trades, dollar rolls provide an efficient means for maintaining a neutral position while providing liquidity.
A dollar roll transaction is similar to a repurchase agreement (repo), in which two parties simultaneously agree to exchange a security for cash in the near term and to reverse the exchange at a later date.22 Dollar rolls facilitate financing by providing an alternative and cheaper financing vehicle to the MBS repo, drawing in market participants whose preferences are better suited to the idiosyncrasies of the dollar roll.23 Note that dollar rolls also simplify the adjustment of originators’, servicers’, and other market participants’ TBA commitments and hedges by reducing not only the total cost but also the cash outlay associated with hedging, because the cost of a dollar roll is only the difference between the prices of two different TBAs.
The ability to lock in TBA forward prices may be particularly useful for smaller originators, who have less access to complex risk management tools that would otherwise be needed to hedge price risk. Some smaller banks already can and do engage in “correspondent” relationships, whereby they sell some or all of their whole loans to larger banks, which then arrange securitization and may be able to negotiate more attractive prices from GSEs. In the absence of a TBA market, this practice might become more widespread. A further consequence could be an increase in the overall share of mortgages originated by the largest commercial banks.24
22 As with a repurchase agreement, these are two separate purchase/sale transactions, but the economic effect is equivalent to secured borrowing/lending. Since the initial exchange of cash and security is reversed, the economic impact is measured by the difference in the prices of the two transactions and the allocation of principal and interest payments over the term of the dollar roll. One fundamental difference is that while the second leg in a repo (reversing the original exchange) requires the return of the original security, in a dollar roll only a “substantially similar” security needs to be delivered, consistent with a definition of substantially similar directly tied to SIFMA’s “good delivery” guidelines for TBAs.23 For instance, dollar rolls can be used to transfer prepayment risk, since, unlike MBS repos, dollar rolls transfer rights to principal and interest payments over the term of the transaction.24 Currently, the four largest commercial banks originate more than half of all mortgages (source: www.mortgagestats.com), a sharp increase compared with the banks’ market share before the onset of the financial crisis.

FRBNY Economic Policy Review / May 2013 9
3.6 Price Discovery and Transparency
TBA trading occurs electronically on an over-the-counter basis, primarily through two platforms, DealerWeb (for interdealer trades) and TradeWeb (for customer trades).25 Quotes on DealerWeb are “live,” in the sense that dealers must trade at their posted prices if a counterparty wishes to do so. The TradeWeb platform continuously provides indicative bids and offers (known as Composite Market indicators) for each agency MBS coupon, offering investors “real-time” estimates of the prices at which trades can be executed. While these quotes are indicative, internal Federal Reserve analysis shows that the quotes generally track prices of completed transactions closely.
Since May 2011, market participants that are members of the securities self-regulatory body FINRA (the Financial Industry Regulatory Authority) have been required to report agency
MBS trades to the FINRA TRACE (Trade Reporting and Compliance Engine) system. After each trading day, FINRA publicly reports summary statistics of trading volumes and prices for trades completed during the day, such as the weighted average transaction price for different coupons, issuers, and settlement months, and the number and volume of trades.26 Current coupon MBS prices and spreads between yields on MBS and other assets are also available on Bloomberg and Reuters. These different data sources allow market participants to obtain timely estimates of current market prices for TBA contracts.
The TRACE data also illustrate the concentration of MBS trading activity in the TBA segment. According to these data, for calendar year 2011 TBA trading volume (including stips and dollar rolls) is sixteen times larger than trading in specified pools (including pass-through and collateralized mortgage obligation pools), and 187 times larger than trading in non-agency MBS. It is also common to observe trades in the TRACE data exceeding $100 million.27
Within the TBA segment, FINRA’s TRACE summary reports do not break down the relative volumes of dollar rolls and outright trades; however, as a guide, TradeWeb data analyzed by the Federal Reserve Bank of New York suggest that, on average
25 Although agency MBS are not exchange-traded, TBA trades are subject to centralized clearing through a centralized counterparty operated by the Depository Trust and Clearing Corporation.26 For the most recent daily report, visit www.finra.org/Industry/Compliance/MarketTransparency/TRACE/StructuredProduct/. Historical summary statistics (by trading day) based on these data are reported by SIFMA at www.sifma.org/research/statistics.aspx. 27 See Atanasov and Merrick (2012) and Friewald et al. (2012) for a more detailed analysis of agency MBS TRACE data.
TBA trading occurs electronically on an over-the-counter basis.
over 2010 and 2011, 58 percent of thirty-year Fannie Mae trading volume was part of a dollar roll or swap transaction.
3.7 Settlement Volumes
In practice, most TBA trades do not ultimately lead to a transfer of physical MBS. In many cases, the seller will either unwind or “roll” an outstanding trade before maturity, rather than physically settle it. Furthermore, as part of the settlement process, a centralized counterparty operated by the Depository Trust and Clearing Corporation nets all offsetting trades that have been registered with it, greatly reducing the value of securities and cash that must change hands between TBA counterparties.
Even so, TBA trading still generates a large volume of physical MBS settlement. We have conducted some preliminary analysis using Fedwire Securities Service data for the first calendar quarter of 2012 to try to quantify these volumes. During this period, average daily agency MBS settlement volume was $94 billion, representing a mix of TBA, dollar roll, stip, and specified pool transactions. Notably, the three dates with the highest settlement volume corresponded exactly to the three Class A TBA settlement dates in the three-month period. Settlement volume on these dates averaged $418 billion, more than four times the overall daily market average. This evidence suggests that, even though the TBA market is by its nature subject to adverse selection, it is still used as a vehicle for transacting large volumes of physical agency MBS—most likely because of its liquidity.
3.8 Legal Basis of TBA Trading
From a legal perspective, the TBA market, as it currently operates, is made possible by Fannie Mae’s and Freddie Mac’s exemption from the registration requirements of the Securities Act of 1933 with respect to sales of their MBS. This exemption allows newly issued agency MBS to be offered and sold (including in TBAs) without registration statements filed with the Securities and Exchange Commission (SEC). In contrast, public offers and sales of newly issued private-label MBS are subject to the registration requirements of the Securities Act.
Sales of newly issued agency MBS by way of TBA trading would not be possible without such an exemption because, at the time of a TBA trade, the securities that will eventually be delivered often do not exist. Even if they do exist, the buyer is not told the identity of the specific securities that will be delivered until two days before settlement, which is usually significantly after the trade date itself. Indeed, for many MBS delivered to fulfill TBA contracts, the underlying mortgages
10 TBA Trading and Liquidity in the Agency MBS Market
have not even been originated as of the trade date (enabling the hedging described in the previous section).
In practice, while offers and sales of GSE MBS are exempt from SEC registration requirements, the agencies do publicly disclose summary information about the composition of each pool. This information includes the average loan-to-valuation ratio, debt-to-income ratio, borrower credit score, the number and value of mortgages from each U.S. state, weighted average mortgage coupon rates and maturities, and broker versus non-broker origination channels. Nevertheless, at the time of trade, the TBA buyer lacks access to this information simply because it does not know which securities it will receive.
4. TBA Eligibility of Super-Conforming Loans
4.1 Increases in Conforming Loan Limits in 2008
Recent changes in the conforming loan limits provide a useful natural experiment to study the price impact of TBA eligibility, even for agency MBS pools that already enjoy a credit guarantee. As discussed, Fannie Mae and Freddie Mac are prohibited from
purchasing mortgages larger than a set of conforming loan limits set by the Federal Home Financing Agency. The FHFA adjusts these limits annually in line with the general level of home prices.28 As the U.S. housing market deteriorated in 2007 and mortgage market stresses increased, market participants and policymakers looked to the GSEs to support the housing sector in a variety of ways, for example, by expanding their retained portfolios, and raised the conforming loan limit to allow the GSEs to support a broader range of residential mortgages, particularly the prime jumbo market.
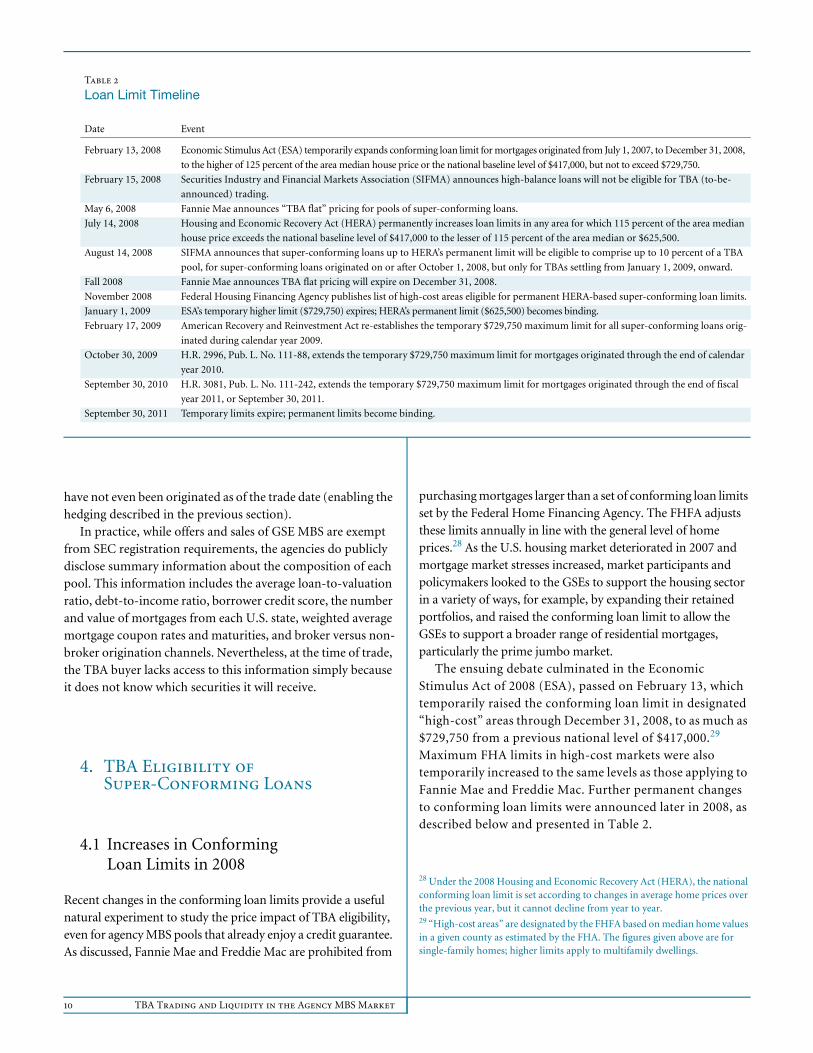
The ensuing debate culminated in the Economic Stimulus Act of 2008 (ESA), passed on February 13, which temporarily raised the conforming loan limit in designated “high-cost” areas through December 31, 2008, to as much as $729,750 from a previous national level of $417,000.29 Maximum FHA limits in high-cost markets were also temporarily increased to the same levels as those applying to Fannie Mae and Freddie Mac. Further permanent changes to conforming loan limits were announced later in 2008, as described below and presented in Table 2.
28 Under the 2008 Housing and Economic Recovery Act (HERA), the national conforming loan limit is set according to changes in average home prices over the previous year, but it cannot decline from year to year.29 “High-cost areas” are designated by the FHFA based on median home values in a given county as estimated by the FHA. The figures given above are for single-family homes; higher limits apply to multifamily dwellings.
Table 2
Loan Limit Timeline
Date Event
February 13, 2008 Economic Stimulus Act (ESA) temporarily expands conforming loan limit for mortgages originated from July 1, 2007, to December 31, 2008,
to the higher of 125 percent of the area median house price or the national baseline level of $417,000, but not to exceed $729,750.
February 15, 2008 Securities Industry and Financial Markets Association (SIFMA) announces high-balance loans will not be eligible for TBA (to-be-
announced) trading.
May 6, 2008 Fannie Mae announces “TBA flat” pricing for pools of super-conforming loans.
July 14, 2008 Housing and Economic Recovery Act (HERA) permanently increases loan limits in any area for which 115 percent of the area median
house price exceeds the national baseline level of $417,000 to the lesser of 115 percent of the area median or $625,500.
August 14, 2008 SIFMA announces that super-conforming loans up to HERA’s permanent limit will be eligible to comprise up to 10 percent of a TBA
pool, for super-conforming loans originated on or after October 1, 2008, but only for TBAs settling from January 1, 2009, onward.
Fall 2008 Fannie Mae announces TBA flat pricing will expire on December 31, 2008.
November 2008 Federal Housing Financing Agency publishes list of high-cost areas eligible for permanent HERA-based super-conforming loan limits.
January 1, 2009 ESA’s temporary higher limit ($729,750) expires; HERA’s permanent limit ($625,500) becomes binding.
February 17, 2009 American Recovery and Reinvestment Act re-establishes the temporary $729,750 maximum limit for all super-conforming loans orig-
inated during calendar year 2009.
October 30, 2009 H.R. 2996, Pub. L. No. 111-88, extends the temporary $729,750 maximum limit for mortgages originated through the end of calendar
year 2010.
September 30, 2010 H.R. 3081, Pub. L. No. 111-242, extends the temporary $729,750 maximum limit for mortgages originated through the end of fiscal
year 2011, or September 30, 2011.
September 30, 2011 Temporary limits expire; permanent limits become binding.

FRBNY Economic Policy Review / May 2013 11
4.2 TBA Deliverability of Super-Conforming Mortgages
While the GSEs’ purchases are authorized by Congress and regulated by the FHFA, TBA trading conventions are set by SIFMA. Two days after enactment of the ESA, SIFMA announced that high-balance loans (“super-conforming loans”) between $417,000 and the new, higher conforming loan limits would not be eligible for inclusion in TBA-eligible pools.30 Instead, these pools could only be securitized as a new category of specialty products and traded as specified pools. In testimony to Congress in May 2008, SIFMA explained its opposition to allowing the new super-conforming loans to be included in TBA-eligible pools.31 Two main concerns were cited: First, the initial increases in conforming loan limits were temporary, expiring at the end of 2008. SIFMA judged that the addition and subtraction of super-conforming loans from TBA pools over such a short horizon could cause significant market disruption. Second, including super-conforming loans would undermine the homogeneity underpinning the TBA market. SIFMA noted that mortgages with high principal balances tend to be prepaid more efficiently, reflecting the greater sophistication of the underlying borrowers and the larger dollar amount of incentive for optimal exercise of the prepayment option (given the larger loan balance). This could therefore establish a new and lower cheapest-to-deliver price for TBAs, making it less attractive to deliver standard conforming pools into TBA trades, thereby reducing the liquidity of these standard pools. The inclusion of super-conforming pools could also make TBAs a less effective tool for hedging price risk for other MBS pools.
To support the super-conforming market in the face of this lack of TBA eligibility, Fannie Mae announced on May 6, 2008, that it would purchase pools of super-conforming loans at a price on par with TBA-eligible pools throughout the remainder of 2008.32 Supported by this announcement, the issuance of super-conforming specified pools increased over the summer of 2008, and the underlying loans were originated at primary mortgage rates close to those for standard conforming loans.
30 To our knowledge, there is no generally accepted term to describe loans between the national conforming loan limit and high-cost housing area limits. Other terms sometimes used to describe these mortgages are “high-balance conforming” loans and “jumbo-conforming” loans. Both these names are potentially confusing: the first because loans near to but below the national limit are also sometimes called high-balance conforming loans; the second because the term jumbo-conforming could also be interpreted to mean prime jumbo loans. For this reason, we use the term “super-conforming” to refer to these mortgages. 31 Written testimony by SIFMA Vice Chairman Thomas Hamilton to the House Committee on Financial Services, May 22, 2008 (www.sifma.org/legislative/testimony/pdf/Hamilton-052208.pdf). 32 This commitment expired in December 2008. Yet in October 2008, Fannie Mae, in an effort to ease the transition to market-based pricing, promised to continue in 2009 to purchase super-conforming mortgages originated in 2008, but with a 175-basis-point fee added to the TBA mortgage rates.
Nevertheless, the U.S. housing market continued to deteriorate, and on July 14, 2008, Congress passed the Housing and Economic Recovery Act (HERA), permanently increasing to $625,500 the conforming loan limit in high-cost areas.33
Noting the permanent nature of this change, SIFMA announced a month later that super-conforming loans up to the HERA limit would be TBA eligible. However, it imposed a de minimis limit—that is, super-conforming loans could represent at most 10 percent of a TBA pool. The announcement had little immediate market impact because of Fannie Mae’s previous commitment to purchase super-conforming loans at “TBA flat” pricing. However, it proved critical in 2009 as Fannie Mae’s price support expired.
4.3 Further Adjustments to Conforming Loan Limits
The temporary conforming loan limits (up to $729,750) established under the ESA expired at the end of 2008. However, in February 2009 these temporary limits were reestablished, and in November 2009 they were extended until the end of 2010. On September 30, 2010, the temporary limits were extended for another year. They finally expired on September 30, 2011.
5. Effects on the MBS Market
5.1 Issuance of Super-Conforming MBS Pools
Chart 2 presents data on the issuance of super-conforming MBS since the ESA raised the agency loan limits in February 2008. As the chart shows, issuance of super-conforming pools has been volatile. There was little issuance of MBS backed by super-conforming mortgages in the months immediately following passage of the ESA, reflecting the TBA ineligibility of these loans and the time needed by issuers to set up their super-conforming securitization program. Spurred by Fannie Mae’s announcement that it would purchase pools backed by super-conforming loans at par to TBA pricing, issuance of super-conforming specified pools grew during summer 2008, concentrated in Fannie Mae and Ginnie Mae pools.
33 HERA uses a slightly different calculation methodology from ESA for identifying high-housing-cost areas, complicating comparison of the two sets of high-balance loan limits.

12 TBA Trading and Liquidity in the Agency MBS Market
Issuance of super-conforming pools dropped sharply in fall 2008. This decrease likely reflected both the overall turmoil in financial markets during this period as well as uncertainties specific to super-conforming loans that may have discouraged originators from extending such loans. First, lenders faced significant regulatory risk because the FHFA did not publish until November 2008 its list of “high-cost” census tracts eligible for the permanent higher-loan limits. In addition, market participants were uncertain how prices for super-conforming loans would respond to the expiration of Fannie Mae’s commitment to TBA-equivalent pricing, and some originators may have simply waited to deliver their super-conforming loans into TBA pools starting in January 2009.
Issuance of super-conforming pools remained low between January and April 2009, reflecting the withdrawal of Fannie Mae’s price support for this market.34 Super-conforming issuance rose more steeply in summer 2009, likely for two reasons: the sharp rise in mortgage rates during this period led many borrowers to close on pending mortgages out of fear that rates would rise further, and bank-driven demand for short-duration CMO tranches rose during that period, increasing demand for faster-prepaying agency MBS.35
34 Although overall issuance was low during this period, super-conforming issuance rose modestly in February 2009, as pressures on financial institutions’ balance sheets began to subside.35 A CMO is a structured MBS that distributes payments and prepayments of mortgage principal across a number of different tranches in order of seniority. Banks tend to demand more short-duration CMO tranches in steep yield curve environments to avoid an asset-liability mismatch when rates rise.
5.2 Secondary-Market Pricing of Super-Conforming MBS Pools
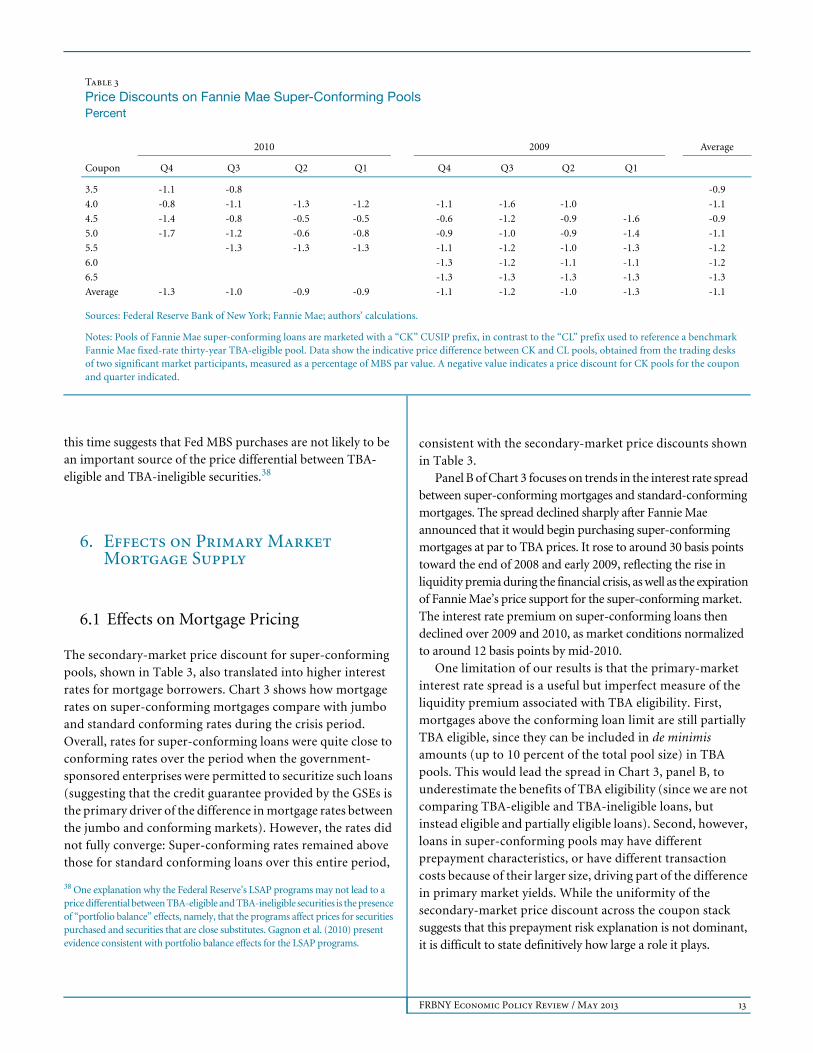
Table 3 presents data on the price premium (or discount) for Fannie Mae super-conforming pools relative to standard TBA-eligible pools between first-quarter 2009 and first-quarter 2010.36 During this span, corresponding to the period after Fannie Mae’s price support of super-conforming loans expired in December 2008, super-conforming pools consistently traded at a significant discount to the corresponding TBA contract. The average discount is 1.1 percent of MBS par value, averaging through time and across securities with different coupons (the “coupon stack”). Applying a simple “rule-of-thumb” that MBS have an approximate duration of four years, we see that this figure corresponds to an average difference in yield of 27.5 basis points.37
Three possible explanations for this price discount are: 1) the price differential reflects an illiquidity discount for super-conforming pools, since these pools trade on a specified pool basis, rather than in the TBA market; 2) the price discount reflects greater prepayment risk for super-conforming pools; 3) the higher price for TBA pools reflects the effects of the Federal Reserve MBS purchase program, which purchased only TBA-eligible MBS.
It is difficult, and beyond the scope of this article, to fully disentangle the prepayment and liquidity risk explanations. However, we note that during this period the super-conforming price discount was persistent and relatively homogenous across the coupon stack. This is notable, because differences in prepayment risk would be expected to have a larger price impact on securities trading further from par (that is, when the coupon rate is significantly different from the market yield). We view the relative consistency of the discount across the coupon stack as evidence suggesting that illiquidity, and not just differences in prepayment characteristics, is likely to be an important explanation for the spreads observed in Table 3. Furthermore, these super-conforming pools were sought after as collateral for the growing CMO market precisely because of their higher prepayment rates, suggesting that the price discount reflected in Table 3 may be lower than would otherwise have been the case.
It is easier to rule out the effects of the Federal Reserve’s purchases of TBAs as an explanation for the discounts in Table 3, since the Fed’s purchases were completed in March 2010. The fact that we observe little change in the price discount around
36 While the table focuses on Fannie Mae pools, data for Ginnie Mae super-conforming pools indicate a similar price discount. The magnitude of the price discount is less uniform than it is for Fannie Mae pools, however, likely reflecting the lower issuance volumes and consequent lack of liquidity.37 Duration is a measure of the maturity of a fixed-rate security or, equivalently, its sensitivity to movements in interest rates. A duration of four years implies that a 1 percent change in yields is associated with a 4 percent change in price. Note that this market rule-of-thumb estimate of MBS duration is approximate—because future prepayment rates are unknown, the expected duration of an MBS will fluctuate over time because of variation in market conditions and the term structure of interest rates.
Billions of dollars
Chart 2
Issuance of Non-TBA-Eligible Super-ConformingMortgage-Backed Securities (MBS)
01
2
3
4
5
6
7
8
2011201020092008
Source: Federal Reserve Bank of New York.
Notes: The chart shows the monthly issuance of non-TBA-eligible MBS backed by loans above the national conforming loan limit of $417,000 sponsored by Fannie Mae, Freddie Mac, and Ginnie Mae. Note that after August 2008, the Securities Industry and Financial Markets Association allowed super-conforming loans to be securitized in TBA-eligible pools in de minimis amounts (up to 10 percent of the pool balance). The chart does not include super-conforming securitizations through these TBA-eligible pools.
Ginnie MaeFreddie MacFannie Mae
FRBNY Economic Policy Review / May 2013 13
this time suggests that Fed MBS purchases are not likely to be an important source of the price differential between TBA-eligible and TBA-ineligible securities.38
6. Effects on Primary Market Mortgage Supply
6.1 Effects on Mortgage Pricing
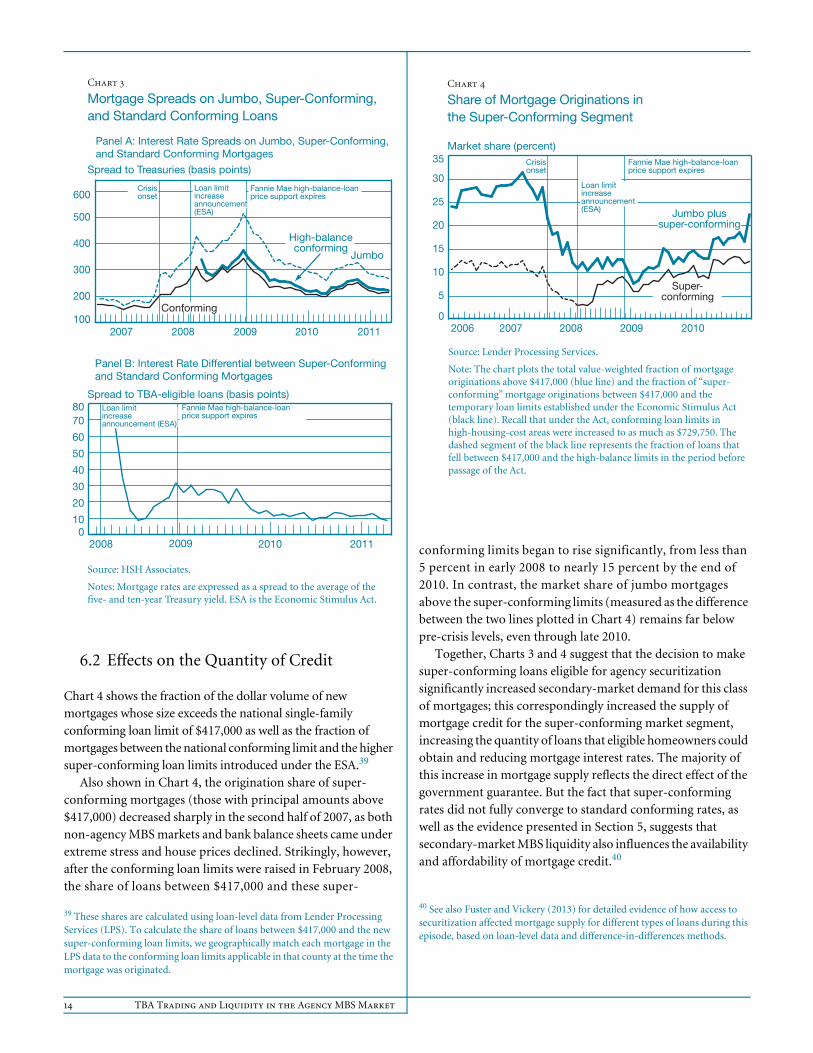
The secondary-market price discount for super-conforming pools, shown in Table 3, also translated into higher interest rates for mortgage borrowers. Chart 3 shows how mortgage rates on super-conforming mortgages compare with jumbo and standard conforming rates during the crisis period. Overall, rates for super-conforming loans were quite close to conforming rates over the period when the government-sponsored enterprises were permitted to securitize such loans (suggesting that the credit guarantee provided by the GSEs is the primary driver of the difference in mortgage rates between the jumbo and conforming markets). However, the rates did not fully converge: Super-conforming rates remained above those for standard conforming loans over this entire period,
38 One explanation why the Federal Reserve’s LSAP programs may not lead to a price differential between TBA-eligible and TBA-ineligible securities is the presence of “portfolio balance” effects, namely, that the programs affect prices for securities purchased and securities that are close substitutes. Gagnon et al. (2010) present evidence consistent with portfolio balance effects for the LSAP programs.
consistent with the secondary-market price discounts shown in Table 3.
Panel B of Chart 3 focuses on trends in the interest rate spread between super-conforming mortgages and standard-conforming mortgages. The spread declined sharply after Fannie Mae announced that it would begin purchasing super-conforming mortgages at par to TBA prices. It rose to around 30 basis points toward the end of 2008 and early 2009, reflecting the rise in liquidity premia during the financial crisis, as well as the expiration of Fannie Mae’s price support for the super-conforming market. The interest rate premium on super-conforming loans then declined over 2009 and 2010, as market conditions normalized to around 12 basis points by mid-2010.
One limitation of our results is that the primary-market interest rate spread is a useful but imperfect measure of the liquidity premium associated with TBA eligibility. First, mortgages above the conforming loan limit are still partially TBA eligible, since they can be included in de minimis amounts (up to 10 percent of the total pool size) in TBA pools. This would lead the spread in Chart 3, panel B, to underestimate the benefits of TBA eligibility (since we are not comparing TBA-eligible and TBA-ineligible loans, but instead eligible and partially eligible loans). Second, however, loans in super-conforming pools may have different prepayment characteristics, or have different transaction costs because of their larger size, driving part of the difference in primary market yields. While the uniformity of the secondary-market price discount across the coupon stack suggests that this prepayment risk explanation is not dominant, it is difficult to state definitively how large a role it plays.
Table 3
Price Discounts on Fannie Mae Super-Conforming PoolsPercent
2010 2009 Average
Coupon Q4 Q3 Q2 Q1 Q4 Q3 Q2 Q1
3.5 -1.1 -0.8 -0.9
4.0 -0.8 -1.1 -1.3 -1.2 -1.1 -1.6 -1.0 -1.1
4.5 -1.4 -0.8 -0.5 -0.5 -0.6 -1.2 -0.9 -1.6 -0.9
5.0 -1.7 -1.2 -0.6 -0.8 -0.9 -1.0 -0.9 -1.4 -1.1
5.5 -1.3 -1.3 -1.3 -1.1 -1.2 -1.0 -1.3 -1.2
6.0 -1.3 -1.2 -1.1 -1.1 -1.2
6.5 -1.3 -1.3 -1.3 -1.3 -1.3
Average -1.3 -1.0 -0.9 -0.9 -1.1 -1.2 -1.0 -1.3 -1.1
Sources: Federal Reserve Bank of New York; Fannie Mae; authors’ calculations.
Notes: Pools of Fannie Mae super-conforming loans are marketed with a “CK” CUSIP prefix, in contrast to the “CL” prefix used to reference a benchmark Fannie Mae fixed-rate thirty-year TBA-eligible pool. Data show the indicative price difference between CK and CL pools, obtained from the trading desks of two significant market participants, measured as a percentage of MBS par value. A negative value indicates a price discount for CK pools for the coupon and quarter indicated.
14 TBA Trading and Liquidity in the Agency MBS Market
Chart 4
Share of Mortgage Originations in the Super-Conforming Segment
Market share (percent)
Source: Lender Processing Services.
Note: The chart plots the total value-weighted fraction of mortgage originations above $417,000 (blue line) and the fraction of “super-conforming” mortgage originations between $417,000 and the temporary loan limits established under the Economic Stimulus Act (black line). Recall that under the Act, conforming loan limits in high-housing-cost areas were increased to as much as $729,750. The dashed segment of the black line represents the fraction of loans that fell between $417,000 and the high-balance limits in the period before passage of the Act.
0
5
10
15
20
25
30
35
20102009200820072006
Crisisonset
Fannie Mae high-balance-loan price support expires
Super-conforming
Jumbo plussuper-conforming
Loan limitincreaseannouncement(ESA)
6.2 Effects on the Quantity of Credit
Chart 4 shows the fraction of the dollar volume of new mortgages whose size exceeds the national single-family conforming loan limit of $417,000 as well as the fraction of mortgages between the national conforming limit and the higher super-conforming loan limits introduced under the ESA.39
Also shown in Chart 4, the origination share of super-conforming mortgages (those with principal amounts above $417,000) decreased sharply in the second half of 2007, as both non-agency MBS markets and bank balance sheets came under extreme stress and house prices declined. Strikingly, however, after the conforming loan limits were raised in February 2008, the share of loans between $417,000 and these super-
39 These shares are calculated using loan-level data from Lender Processing Services (LPS). To calculate the share of loans between $417,000 and the new super-conforming loan limits, we geographically match each mortgage in the LPS data to the conforming loan limits applicable in that county at the time the mortgage was originated.
conforming limits began to rise significantly, from less than 5 percent in early 2008 to nearly 15 percent by the end of 2010. In contrast, the market share of jumbo mortgages above the super-conforming limits (measured as the difference between the two lines plotted in Chart 4) remains far below pre-crisis levels, even through late 2010.
Together, Charts 3 and 4 suggest that the decision to make super-conforming loans eligible for agency securitization significantly increased secondary-market demand for this class of mortgages; this correspondingly increased the supply of mortgage credit for the super-conforming market segment, increasing the quantity of loans that eligible homeowners could obtain and reducing mortgage interest rates. The majority of this increase in mortgage supply reflects the direct effect of the government guarantee. But the fact that super-conforming rates did not fully converge to standard conforming rates, as well as the evidence presented in Section 5, suggests that secondary-market MBS liquidity also influences the availability and affordability of mortgage credit.40
40 See also Fuster and Vickery (2013) for detailed evidence of how access to securitization affected mortgage supply for different types of loans during this episode, based on loan-level data and difference-in-differences methods.
Chart 3
Mortgage Spreads on Jumbo, Super-Conforming,and Standard Conforming Loans
Spread to Treasuries (basis points)
100
200
300
400
500
600
High-balanceconforming
Jumbo
20112010200920082007
Spread to TBA-eligible loans (basis points)
010
20
30
40
50
60
7080
2011201020092008
Panel A: Interest Rate Spreads on Jumbo, Super-Conforming,and Standard Conforming Mortgages
Panel B: Interest Rate Differential between Super-Conformingand Standard Conforming Mortgages
Source: HSH Associates.
Notes: Mortgage rates are expressed as a spread to the average of the five- and ten-year Treasury yield. ESA is the Economic Stimulus Act.
Fannie Mae high-balance-loanprice support expires
Loan limit increaseannouncement (ESA)
High-balanceconforming
Conforming
Loan limitincreaseannouncement(ESA)
Crisisonset
Fannie Mae high-balance-loanprice support expires
FRBNY Economic Policy Review / May 2013 15
6.3 Interpretation
The evidence presented above suggests that the liquidity associated with TBA eligibility increases MBS prices and lowers mortgage interest rates, consistent with evidence in other fixed-income markets, such as the “old bond” illiquidity discount in the Treasury market documented by Krishnamurthy (2002) and others. We strive to be somewhat cautious in our interpretation,
however, because pricing differences between conforming and super-conforming loans may also reflect differences in prepayment risk, at least in part. While we present some evidence on this point, our analysis does not allow us to fully quantify the relative importance of prepayment risk. Conducting a more detailed statistical analysis—for example, using loan-level data to exploit variation in loan size around the TBA-eligibility limits—would be an interesting topic for future research.
With this caveat in mind, our preliminary assessment of this evidence is that: the premium associated with TBA eligibility is likely about 10 to 25 basis points on average over 2009 and 2010, and this premium is magnified during periods of market stress or disruption, consistent with evidence from other fixed-income markets (recall Section 2.2). For example, the primary-market spread between TBA-eligible and TBA-ineligible mortgages was as large as 65 basis points (when the conforming loan limit was first raised in March 2008 and there was no secondary market at all for super-conforming mortgages) and 25 to 30 basis points at the start of 2009 (when Fannie Mae’s price support for super-conforming loans first expired and the financial crisis was still near its peak). The spread then declined steadily over 2009 and 2010, to around 9 to 12 basis points, as financial market conditions gradually normalized.
7. Prospects for the TBA Market amid Housing Finance Reform
Congress and the U.S. Treasury Department continue to consider different options for reshaping the housing GSEs
The evidence . . . suggests that the liquidity
associated with TBA eligibility increases
MBS prices and lowers mortgage interest
rates, consistent with evidence in other
fixed-income markets.
Fannie Mae and Freddie Mac. As part of this process, the Treasury has published a paper discussing a number of prominent policy options (Department of the Treasury and Department of Housing and Urban Development 2011). Market observers, as well as Federal Reserve Chairman Ben Bernanke and former Treasury Secretary Henry Paulson, have considered a spectrum of GSE reform options ranging from full privatization to full nationalization. Intermediate options between these extremes include an industry-owned mortgage cooperative,41 the introduction of a public tail-risk insurer, covered bonds, and the conversion of Fannie Mae and Freddie Mac into “public utilities.”
Perhaps surprisingly, many discussions of mortgage finance reform make little mention of the TBA market or secondary-market trading more generally. Preservation of a liquid TBA market in something akin to its present form is likely compatible with a number of different market structures and should not be viewed as a reason to avoid reform per se. However, given the central role currently played by the TBA market, it is important to consider how different reform options could affect the operation and liquidity of this market. There is little consensus on exactly how much actual homogeneity in the underlying mortgages and securities is necessary to support the fungibility and liquidity created by the TBA market, as demonstrated by SIFMA’s concerns regarding super-conforming loan eligibility and other revisions to TBA delivery guidelines. However, beyond some unknown point, fragmentation of the MBS market through greater diversity of loan and MBS features would likely reduce liquidity. In contrast, standardization of documentation, structuring, and mortgage underwriting criteria within the TBA-eligible universe is likely important to help maintain fungibility across securities, and thus promote market liquidity.
As a matter of law, a fully private TBA market might be possible with sufficient amendments to current securities law. The key would be to provide exceptions to the Securities Act of 1933 for private mortgage securities, such that commitments to purchase mortgage pools could become binding before the receipt of the pool’s prospectus. However, such changes could be challenging given the current trend in securities law toward greater disclosure. In addition, it is unclear whether greater disclosure could itself impair the operation of the TBA market, by increasing sellers’ ability to discriminate value among MBS pools and leading to greater adverse selection, siphoning off the most valuable securities into the specified pool market.
The history of the TBA market illustrates that the consequences of changes to market structure are unpredictable and sometimes negative. One example is the failure of mortgage
41 See Dechario et al. (2010) for one proposed design of a cooperative model.

16 TBA Trading and Liquidity in the Agency MBS Market
futures contracts that have been launched several times over recent decades (Johnston and McConnell 1989). In another example, Freddie Mac’s decision to alter the timing of payments to MBS holders was poorly received by market participants, contributing to a negative spread between Freddie Mac and Fannie Mae MBS that persists more than twenty years later.
In conclusion, this article has described the mechanics of the TBA market and presented summary statistics documenting its substantial size and liquidity. We have also provided preliminary evidence suggesting that its liquidity raises market prices and lowers mortgage interest rates for TBA-eligible loans. Our interpretation of the existing evidence is that these liquidity effects are of the order of 10 to 25 basis points on
average during 2009 and 2010, and are magnified during periods of greater market stress. These estimates are consistent with statistical estimates in the academic literature for liquidity premia on other government-guaranteed bonds. Our discussion and preliminary evidence therefore suggest that agency MBS liquidity is not solely attributable to implicit government guarantees, and that the structure of secondary markets can significantly affect MBS liquidity and thereby influence borrowing rates paid by households. This in turn suggests that evaluations of proposed reforms to the U.S. housing finance system should take into account the potential effects of those reforms on the operation of the TBA market and its liquidity.

References
FRBNY Economic Policy Review / May 2013 17
Ambrose, B. W., M. LaCour-Little, and A. B. Sanders. 2004. “The Effect of
Conforming Loan Status on Mortgage Yield Spreads: A Loan-Level
Analysis.” Real Estate Economics 32, no. 4 (December): 541-69.
Amihud, Y., and H. Mendelson. 1991. “Liquidity, Maturity, and the
Yields on U.S. Treasury Securities.” Journal of Finance 46, no. 4
(September): 1411-25.
Atanasov, V., and J. Merrick Jr. 2012. “Liquidity and Value in the Deep
vs. Shallow Ends of Mortgage-Backed Securities Pools.”
Unpublished paper. Available at papers.ssrn.com/sol3/
papers.cfm?abstract_id=2023779.
Beber, A., M. W. Brandt, and K. A. Kavajecz. 2009. “Flight-to-Quality
or Flight-to-Liquidity? Evidence from the Euro-Area Bond
Market.” Review of Financial Studies 22, no. 3 (March): 925-57.
Dang, T. V., G. Gorton, and B. Holmström. 2009. “Opacity and the
Optimality of Debt for Liquidity Provision.” Unpublished paper,
Yale University.
Dechario, T., P. Mosser, J. Tracy, J. Vickery, and J. Wright. 2010.
“A Private Lender Cooperative Model for Residential Mortgage
Finance.” Federal Reserve Bank of New York Staff Reports,
no. 466, August.
Department of the Treasury and Department of Housing and Urban Development. 2011. Reforming America’s Housing Finance
Market: A Report to Congress. Available at:
www.treasury.gov/initiatives/documents/
reforming%20america's%20housing%20finance%20market.pdf.
Downing, C., D. Jaffee, and N. Wallace. 2009. “Is the Market for
Mortgage-Backed Securities a Market for Lemons?” Review of
Financial Studies 22, no. 7 (July): 2457-94.
Fleming, M. 2002. “Are Larger Treasury Issues More Liquid? Evidence
from Bill Reopenings.” Journal of Money, Credit, and
Banking 34, no. 3 (August): 707-35.
French, K. R., and R. E. McCormick. 1984. “Sealed Bids, Sunk Costs,
and the Process of Competition.” Journal of Business 57, no. 4
(October): 417-41.
Friewald, N., R. Jankowitsch, and M. G. Subrahmanyam. 2012.
“Liquidity, Transparency, and Disclosure in the Securitized
Product Market.” Unpublished paper, New York University Stern
School of Business.
Fuster, A., and J. Vickery. 2013. “Securitization and the Fixed-Rate
Mortgage.” Federal Reserve Bank of New York Staff Reports,
no. 594, January.
Gagnon, J., M. Raskin, J. Remache, and B. Sack. 2010. “Large-Scale
Asset Purchases by the Federal Reserve: Did They Work?” Federal
Reserve Bank of New York Staff Reports, no. 441, March.
Glaeser, E. L., and H. D. Kallal. 1997. “Thin Markets, Asymmetric
Information, and Mortgage-Backed Securities.” Journal of
Financial Intermediation 6, no. 1 (January): 64-86.
Green, R. K., and M. LaCour-Little. 1999. “Some Truths about Ostriches:
Who Doesn’t Prepay Their Mortgages and Why They Don’t.”
Journal of Housing Economics 8, no. 3 (September): 233-48.
Hirshleifer, J. 1971. “The Private and Social Value of Information
and the Reward to Inventive Activity.” American Economic
Review 61, no. 4 (September): 561-74.
Johnston, E. T., and J. J. McConnell. 1989. “Requiem for a Market:
An Analysis of the Rise and Fall of a Financial Futures Contract.”
Review of Financial Studies 2, no. 1 (January): 1-23.
Krishnamurthy, A. 2002. “The Bond/Old-Bond Spread.” Journal of
Financial Economics 66, nos. 2-3 (November-December): 463-506.
Longstaff, F. A. 2004. “The Flight-to-Liquidity Premium in U.S. Treasury
Bond Prices.” Journal of Business 77, no. 3 (July): 511-26.
McKenzie, J. A. 2002. “A Reconsideration of the Jumbo/Non-Jumbo
Mortgage Rate Differential.” Journal of Real Estate Finance
and Economics 25, nos. 2-3 (September-December): 197-213.
Nothaft, F. E., V. Lekkas, and G. H. K. Wang. 1995. “The Failure of the
Mortgage-Backed Futures Contract.” Journal of Futures
Markets 15, no. 5 (August): 585-603.
References (Continued)
18 TBA Trading and Liquidity in the Agency MBS Market
Nothaft, F. E., J. E. Pearce, and S. Stevanovic. 2002. “Debt Spreads between
GSEs and Other Corporations.” Journal of Real Estate Finance
and Economics 25, nos. 2-3 (September-December): 151-72.
Passmore, W., S. M. Sherlund, and G. Burgess. 2005. “The Effect of
Housing Government-Sponsored Enterprises on Mortgage Rates.”
Real Estate Economics 33, no. 3 (September): 427-63.
Schwartz, A. 2006. “Household Refinancing Behavior in Fixed-Rate
Mortgages.” Unpublished paper, Harvard University.
Schwarz, K. 2009. “Mind the Gap: Disentangling Credit and Liquidity
in Risk Spreads.” Unpublished paper, University of Pennsylvania.
Available at ssrn.com/abstract=1486240.
Torregrosa, D. 2001. “Interest Rate Differentials between Jumbo and
Conforming Mortgages, 1995-2000.” Congressional Budget Office
CBO Paper, May.
The views expressed are those of the authors and do not necessarily reflect the position of the Federal Reserve Bank of New York or the Federal Reserve System. The Federal Reserve Bank of New York provides no warranty, express or implied, as to the accuracy, timeliness, completeness, merchantability, or fitness for any particular purpose of any information contained in documents produced and provided by the Federal Reserve Bank of New York in any form or manner whatsoever.


![[Bank of America] Prepayments on Agency Hybrid ARM MBS](https://static.fdocuments.in/doc/165x107/577d38c61a28ab3a6b9877d9/bank-of-america-prepayments-on-agency-hybrid-arm-mbs.jpg)
![[Bank of America] An Introduction to Agency MBS Derivatives.pdf](https://static.fdocuments.in/doc/165x107/55cf9904550346d0339b0e6e/bank-of-america-an-introduction-to-agency-mbs-derivativespdf.jpg)


![[Bank of America] the Agency ARM MBS Sector](https://static.fdocuments.in/doc/165x107/577cde461a28ab9e78aec82c/bank-of-america-the-agency-arm-mbs-sector.jpg)