TB MEDICINE SUPPLY CHAIN MANAGEMENT: THE SOUTH … file1 TB MEDICINE SUPPLY CHAIN MANAGEMENT: THE...
17
1 TB MEDICINE SUPPLY CHAIN MANAGEMENT: THE SOUTH AFRICAN PERSPECTIVE Dr Lindiwe Mvusi Africa TB Regional Conference on Management of TB Medicines 06 December 2012
-
Upload
trinhxuyen -
Category
Documents
-
view
217 -
download
0
Transcript of TB MEDICINE SUPPLY CHAIN MANAGEMENT: THE SOUTH … file1 TB MEDICINE SUPPLY CHAIN MANAGEMENT: THE...

1
TB MEDICINE SUPPLY CHAIN MANAGEMENT: THE SOUTH AFRICAN PERSPECTIVE
Dr Lindiwe Mvusi Africa TB Regional Conference on
Management of TB Medicines 06 December 2012
2
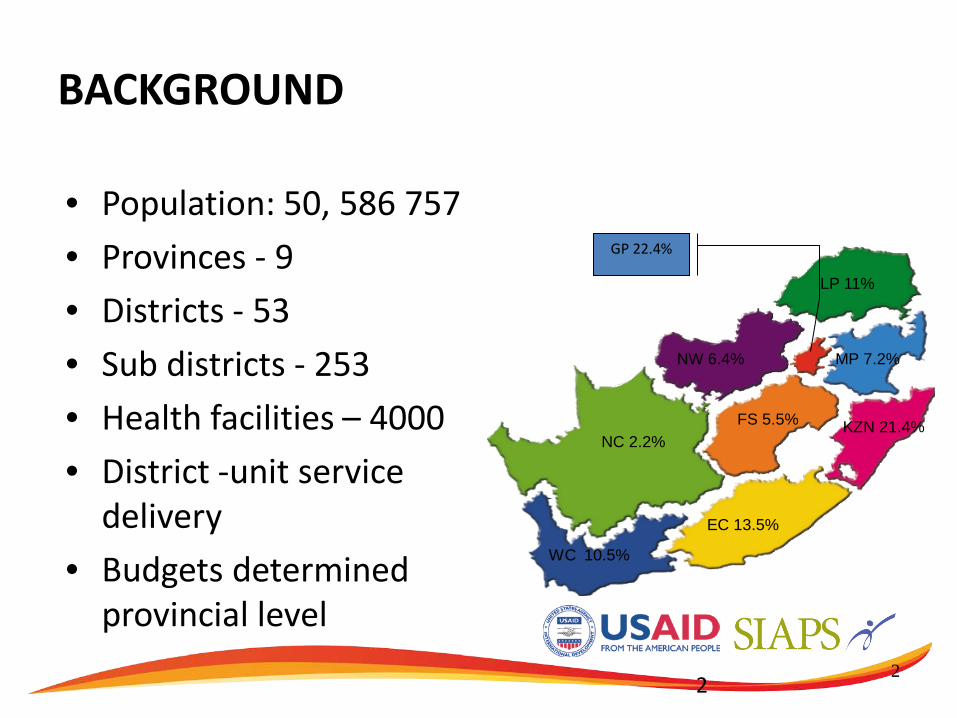
BACKGROUND
• Population: 50, 586 757 • Provinces - 9 • Districts - 53 • Sub districts - 253 • Health facilities – 4000 • District -unit service
delivery • Budgets determined
provincial level 2
NC 2.2%
WC 10.5%
EC 13.5%
KZN 21.4% FS 5.5%
NW 6.4%
LP 11%
MP 7.2%
GP 22.4%

3
THE EPIDEMIC IN SOUTH AFRICA 1990-2010
ART for TB co-infected patients
TB Prevalence (per 100 000)
TB Mortality rate (per 100 000)
Incidence vs Notification rate (per 100 000)
Global Report on TB Control 2011

4
TRENDS IN TB NOTIFICATIONS BY PROVINCE: 2007-2011
0
20000
40000
60000
80000
100000
120000
140000
EC FS GP KZN LP MP NC NW WC
2007
2008
2009
2010
2011

5
6.9% 6.3% 6.4% 6.7% 6.9%
0.0%
5.0%
10.0%
2007 2008 2009 2010 2011
EC (N=8 648)
2.7%
5.8% 4.0%
7.6% 7.1%
0.0%
5.0%
10.0%
2007 2008 2009 2010 2011
FS (N= 1 561)
3.8% 5.0% 4.6% 3.7%
6.5%
0.0%
5.0%
10.0%
2007 2008 2009 2010 2011
LP (N= 953)
8.7%
3.2%
6.0% 7.7%
0.0%
5.0%
10.0%
2007 2008 2009 2010 2011
MP (N= 3 076)
5.6% 3.9%
5.3%
2.8%
6.5%
0.0%
5.0%
10.0%
2007 2008 2009 2010 2011
NW (N= 1 701)
3.1% 3.3% 4.6% 3.8%
6.5%
0.0%
5.0%
10.0%
2007 2008 2009 2010 2011
NC (N= 1 579)
5.6% 6.0% 4.4% 4.1%
6.3%
0.0%
5.0%
10.0%
2007 2008 2009 2010 2011
WC (N= 8 376)
3.2% 2.6% 3.4% 3.0% 4.7%
0.0%
5.0%
10.0%
2007 2008 2009 2010 2011
GA (N= 6 117)
MDR Trends (2007-11)

6
XDR Trends (2007-11)
10.1% 12.4% 12.0% 11.7%
10.1%
0.0%
5.0%
10.0%
15.0%
20.0%
2007 2008 2009 2010 2011
EC (N=973)
2.8% 2.6% 3.8%
1.9%
6.6%
0.0%
5.0%
10.0%
2007 2008 2009 2010 2011
FS (N=58)
3.8% 3.8% 4.7%
5.7% 5.2%
0.0%
5.0%
10.0%
2007 2008 2009 2010 2011
GA (N=289)
2.8% 1.7%
4.6%
1.1%
4.8%
0.0%
5.0%
10.0%
2007 2008 2009 2010 2011
LP (N=31)
2.4% 1.9% 3.8% 4.6%
3.2%
0.0%
5.0%
10.0%
2007 2008 2009 2010 2011
MP (N=95)
0.8%
3.3% 3.1% 1.4%
4.4%
0.0%
5.0%
10.0%
2007 2008 2009 2010 2011
NW (N=47) 7.4%
11.9% 10.2% 10.8%
18.4%
0.0%
5.0%
10.0%
15.0%
20.0%
2007 2008 2009 2010 2011
NC (N=201)
3.3% 3.4% 5.0% 5.9%
6.9%
0.0%
5.0%
10.0%
2007 2008 2009 2010 2011
WC (N=413)

7
PROBLEM STATEMENT • Incorrect completion of
BIN cards • Poor follow up of
outstanding stock • Overstocking of TB
medicines at facility level
• Hoarding of stock by facilities
• Wastage – due to inappropriate storage and expiry
• Most clinics do not have pharmacists but pharmacy assistants (PA)
• Poor supervision of clinics • Inaccurate estimates of TB
medicines • Ordering of medicines not
informed by the disease burden and profile of patients seen at facilities
• Increase in reports of stock out of medicines

8
INTERVENTIONS (1) • Training of health care workers responsible for managing
TB medicines in clinics, pharmacists and TB coordinators – 3 day training workshops – Methodology
• Didactic, exercises, group discussions – Sessions
• Management and policies • Principles of quantification • Procurement • Distribution • Supervision and monitoring • Quality improvement plans

9
INTERVENTIONS (2)
• Involvement of TB programme managers in the quantification process
• Strengthened collaboration between programme and pharmacists at national and provincial levels

10
POST INTERVENTIONS
11
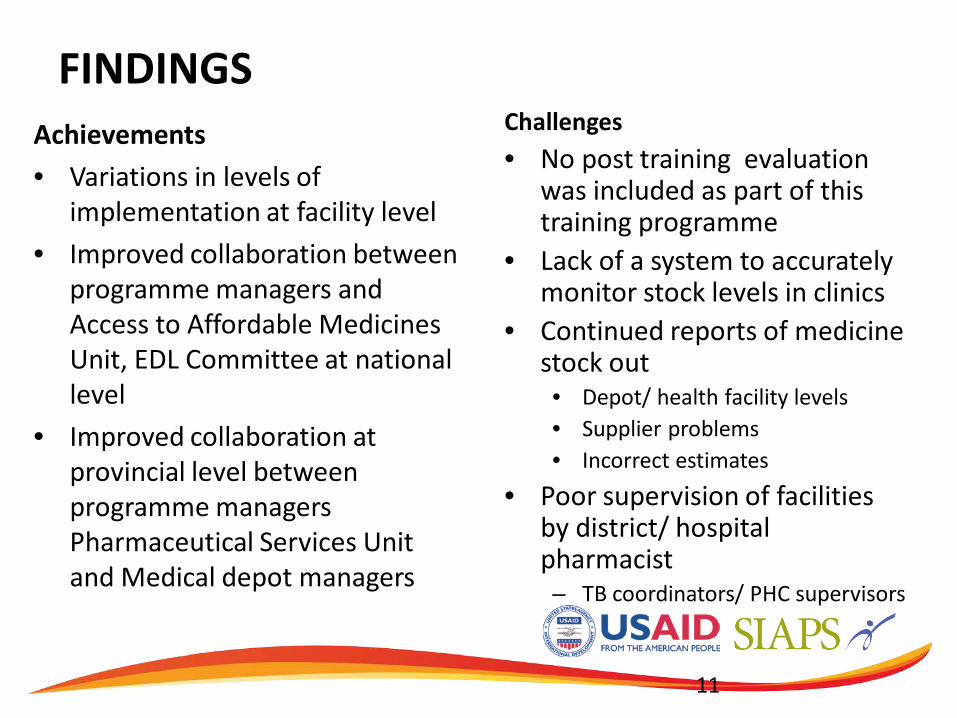
FINDINGS Achievements • Variations in levels of
implementation at facility level • Improved collaboration between
programme managers and Access to Affordable Medicines Unit, EDL Committee at national level
• Improved collaboration at provincial level between programme managers Pharmaceutical Services Unit and Medical depot managers
Challenges • No post training evaluation
was included as part of this training programme
• Lack of a system to accurately monitor stock levels in clinics
• Continued reports of medicine stock out • Depot/ health facility levels • Supplier problems • Incorrect estimates
• Poor supervision of facilities by district/ hospital pharmacist – TB coordinators/ PHC supervisors

12
Comprehensive Assessment of the Problem • Assessment of the TB medicines supply chain and
management • Objectives:
– Assess the status of the TB medicines supply chain – Document best practises in the TB pharmaceutical management – Describe the current practises in the budgeting and resource planning
for TB supply management at all levels – Describe the quantification process for TB medicines at all levels – Make recommendations for strengthening the TB pharmaceutical
management
• Conducted in seven of the nine provinces in priority districts
13
FOCUS AREAS
• Strategic areas – selection and procurement procedures, financing and budgeting for TB
drugs and payment of suppliers, ordering system from suppliers, stock management, storage of TB drugs and distribution to healthcare facilities.
• Operational areas – storage, stock management, availability of tracer drugs and supplies,
ordering systems, prescription practises, patient counselling/ education, availability of necessary human resources
• Methodology − Interviews (managers at all levels, HCW, patients), record review, site
visits and physical stock count

FINDINGS
•TB treatment protocol development •EDL process for TB •Availability at different levels of healthcare system
Selection (Strategic NDOH)
•Determining quantities needed •Tender for suppliers •Creation of standard drugs
& suppliers list for depots •Bidding and negotiation
Procurement (strategic – NDOH): •Payments
•Logistics and distribution •Review consumption information and product selection
Distribution (strategic, operational – provincial):
• Stock management • Prescribing (STG’S) • Dispensing to patients
– labeling, packaging, advise
Use (operational – facility):
14
• Good governance over selection of national EDL drugs list
• Involved PTC’s in most provinces
• Provinces develop own code lists by facility type and monitor compliance
• Tenders process improving since taken over from Treasury
• Concerns with TB tender as no supplier splits for critical medicines
• prices negotiated on average 35 % lower than SEP (priv)
• Provinces use National Supplier list. Some do own tenders or purchase off contract
• Provincial depots in all • Manual ordering
processes with financial vetting which delays process
• Old IT system so no stock visibility of facility pharmacy and poor stock management in WH
• Mixture of In house distribution & Outsourced

FINDINGS
•TB treatment protocol development •EDL process for TB •Availability at different levels of healthcare system
Selection (Strategic NDOH)
•Determining quantities needed •Tender for suppliers •Creation of standard drugs
& suppliers list for depots •Bidding and negotiation
Procurement (strategic – NDOH): •Payments
•Logistics and distribution •Review consumption information and product selection
Distribution (strategic, operational – provincial):
• Stock management • Prescribing (STG’S) • Dispensing to patients
– labeling, packaging, advise
Use (operational – facility):
15
USE • Stock management in smaller facilities poor as nurse driven and no pharmacy support or
supervision • stock unavailability is minimal and varies between TB and ARV’s depending on which province • less than 70% compliance with treatment protocols for non drug resistant TB and even worse
compliance for MDR • Main reasons for non compliance is
• poor recordkeeping: • no weights monitored, • Treatment changes due to side effects not documented
• In correct dose for weight and phase – either too high or too low • No correction of dose on continuation phase
• Patients well educated in taking their medication, side effects and nutrition support • Minimal use of community DOT supporters or CHW in treatment

16
WAY FORWARD
• Dissemination of findings • Development and implementation of a work plan to
address the weaknesses • Monitoring and evaluation framework

17
Thank you for your attention