
European Empires: 1660s 16c-18c: New Ideas Brewing in Europe.

Taxing the brewing sector: a Europeananalysis of the costs of producing beerand the impact of excise duties *
A Report for The Brewers of Europe
September 2010
*connectedthinking


Foreword
PricewaterhouseCoopers was created in 1998 by the merger of two firms – Pricewaterhouse andCoopers & Lybrand - each with historical roots going back some 150 years. Drawing on the talentsof more than 139,000 people in 148 countries, PricewaterhouseCoopers provides a full range ofadvisory, financial, human resources and training, and strategy & security services to leadingglobal, national and local companies and to public institutions, including national governments andinternational institutions.
The Brewers of Europe, founded in 1958 and based in Brussels, is the voice of the Europeanbrewing sector to the European institutions and international organizations. Current members arethe national brewers’ associations from EU Member States, plus Norway, Switzerland and Turkey.
This report has been prepared solely for The Brewers of Europe. The report sets out the workundertaken by PwC into the impact of excise taxation on the brewing sector at national level andEuropean level, and on the comparable cost analysis of the alcoholic beverages sector atEuropean level. As part of this study we obtained relevant information regarding direct and indirectemployment generated by the relevant sectors and have been asked by The Brewers of Europe toinclude comments on this area within our report.
The study has been prepared in accordance with our letter of engagement dated May 25, 2009 andattached terms and conditions. The main work has been undertaken until October 2009 with furtherdevelopments afterwards. PwC accepts no liability or responsibility of any kind from any third partyin connection with the use or misuse of the contents of this report without the previousauthorization of PwC.


i
Executive Summary
PricewaterhouseCoopers Asesores de Negocios, S.L. (PricewaterhouseCoopers or PwC) hasundertaken an analysis for The Brewers of Europe into the impact of changes in excise taxesacross the European Union (EU). The analysis considers the impact on consumption, Governmentrevenues, profitability in the brewing sector and direct and indirect employment and is laid out inChapter I of this report.
PwC were also commissioned by The Brewers of Europe to study the comparable costs in theroute to market for the different categories of alcoholic beverages across the European Union. Thefocus of that part of the report - Chapter II - has been on the main drinks categories, being beer,wine and spirits.
The basis for taxation of alcoholic beverages in the European Union is contained in a number ofDirectives, which establish a framework that determines the methodology for taxing the differentdrinks categories and the minimum rates of taxation to be applied. However, the framework leavesto individual Member States setting the level of rates of excise duties, which can be applieddifferently to the different alcoholic drinks categories. As part of this study, PwC has additionallyconsidered the impact of the differing rates of excise taxation of each drink category in the cost tomarket for that product.
During the course of this study it was necessary for PwC to investigate the cost of wages and othersalary related costs. From this work PwC obtained information regarding direct and indirectemployment generated by the overall alcoholic beverage sector. We have also includedemployment findings in this report.
The conclusions and key findings of the study come from a detailed analysis of publicly availabledata for seven representative countries, representing each one a cluster of countries, and selectedfollowing a number of parameters.
The main results from our analysis are the following:
Chapter I – Impact of tax changes
First. We have found evidence of different impact of excise tax rises in the on-trade (bars,restaurants, etc.) and off-trade (supermarkets, hypermarkets, etc.) distribution channels. Inparticular, excise tax rises are in general more than passed-through into on-trade prices. Thismeans that prices are increased by more than the amount of the tax rise. In the off-tradechannel, retail prices are increased either by the same amount of the tax rise or by less of thisamount.
Second. There is evidence that increases in excise tax revenue (resulting from rises in theexcise tax rate) are, at least in the short term, more than offset by decreases in the revenuesobtained by the Government from personal and corporate income taxes, social securitypayments and, in some cases, also from value added tax (VAT). Our calculations show that arise of 20% in excise taxes in the countries considered in the study would lead in aggregate toa fall in Government revenues of over EURO 115 million. Even excluding additional socialsecurity costs from subsequent job losses, this 20% rise would only lead to an increase inoverall government revenues from beer sales of less than 1%.
Third. Any significant rise in the excise tax rate invariably leads to a reduction in employmentacross the beer supply chain. According to our estimates, an increase by 20% in beer excisetaxes would lead to over 70,000 jobs losses, the majority in the on-trade distribution channel.
Fourth. There are significant differences between the markets analyzed in this study. The ownprice elasticity for beer varies considerably by country and by trade channel (on-trade and off-trade), as does the rate of pass-through of tax increases into final retail prices. This highlightsthe importance of considering the impact of excise duty rates, and any subsequent changes tothese, at individual Member State level, and taking into account the local characteristics of the

ii
market and the impact on the different stakeholders (Government, consumers, industry andemployees).
Chapter II – Comparable cost analysis
Fifth. The alcohol beverage sector generates approximately 4.7m jobs, most of them indirectjobs in the on-trade. Of the 4.4m indirect jobs generated by the alcoholic beverages sector,approximately half (2.25m jobs) were employed in the on-trade mainly in bars, clubs,restaurants and hotels and 80% of which were generated by the beer sector.
Sixth. Beer is the most expensive form of alcohol to produce: €45.2 per litre of pure alcohol.The cost of producing a litre of spirits (in terms of finished product) was 3.5 times higher in2007 than for a litre of wine or beer. However when converted to pure alcohol, wine is thecheapest form of alcohol to produce €17.9, similar to spirits (€18.6), and two and a half timesless the cost of producing a litre of pure alcohol in beer €45.2.
Seventh. Adding excise taxes, beer is still the most expensive form of alcohol to produce anddeliver to the consumer. Although the average rate of excise tax on spirits was higher than thatof beer and wine, the difference was not enough to offset the additional costs of producing anddelivering beer to the consumer. The average retail price (including taxes) of a litre of alcoholin beer is €84 compared to €77 for wine and €65 for spirits. Any move towards taxing all drinksbased solely on alcohol content (unitary taxation) would therefore disadvantage beer further interms of the cost of the product to the consumer.

Table of Contents
Chapter I: Impact of tax changes ................................................................ 1
Chapter II: Comparable cost analysis....................................................... 55
Glossary ..................................................................................................... 91
Contact information.................................................................................... 94


Chapter I
Impact of tax changes
Index
Key findings .................................................................................................. 41. Introduction ....................................................................................... 72. Methodology.................................................................................... 10
2.1 Overview............................................................................................. 102.2 Level of pass-through ......................................................................... 122.3 Demand elasticities............................................................................. 122.4 Impact on employment, profitability and Government revenues ......... 13
2.4.1 Impact on employment................................................................................. 132.4.2 Impact on profitability ................................................................................... 162.4.3 Impact on tax revenues................................................................................ 16
2.5 Selection of countries.......................................................................... 173. Main results ..................................................................................... 19
3.1 Level of pass-through ......................................................................... 193.2 Demand elasticities............................................................................. 203.3 Impact analysis ................................................................................... 21
3.3.1 Results at the EU-level................................................................................. 213.3.2 Results at the country level .......................................................................... 22
References................................................................................................... 28Appendix A. Econometric model of pass-through .................................. 30Appendix B. Econometric model of elasticities....................................... 31Appendix C. Relationship between employment and consumption ..... 33Appendix D. Analysis of impact on profitability ...................................... 34Appendix E. Impact on Government revenues ........................................ 35Appendix F. Selection of countries: methodology.................................. 36Appendix G. Estimated levels of pass-through ....................................... 39Appendix H. Estimated demand elasticities ............................................ 45Appendix I. Current level of excise tax rates ........................................... 53

Key findings

The Brewers of EuropeImpact of tax changes
4
Key findings
PricewaterhouseCoopers Asesores de Negocios, S.L. (PricewaterhouseCoopers or PwC) hasundertaken an analysis for The Brewers of Europe into the impact of an increase in excise taxesacross the European Union (EU). The analysis considers the impact on consumption, Governmentrevenues, profitability in the brewing sector and direct and indirect employment.
The main results from our analysis are the following:
First. We have found evidence of different impact of excise tax rises in the on-trade (bars,restaurants, etc.) and off-trade (supermarkets, hypermarkets, etc.) distribution channels. Inparticular, excise tax rises are in general more than passed-through into on-trade prices. Thismeans that prices are increased by more than the amount of the tax rise. In the off-tradechannel, retail prices are increased either by the same amount of the tax rise or by less of thisamount.
Second. There is also evidence on different sensitivities to prices on-trade and off-trade. Inparticular, the demand for beer is more elastic (i.e., more price-sensitive) in the on-tradechannel. This means that the same percentage increase in prices leads to a higher fall inconsumption on-trade than off-trade.
Third. Taking into account both effects (higher rate of pass-through and elasticity in the on-trade channel), excise tax increases are likely to have a larger negative effect on on-tradeconsumption. In this regard, there is currently a shift within the EU from on-trade to off-tradeconsumption. This trend could be explained by income effects, i.e. consumers divertingpurchases from higher price – beer on-trade – to lower price goods – beer off-trade – inresponse to adverse economic conditions, or by a change in consumer tastes. Excise dutiescan contribute to this trend as beer consumption in the on-trade channel becomes lessaffordable.
Fourth. There is evidence that increases in excise tax revenue (resulting from rises in theexcise tax rate) are, at least in the short term, more than offset by decreases in the revenuesobtained by the Government from personal and corporate income taxes, social securitypayments and, in some cases, also from value added tax (VAT). Our calculations show that arise of 20% in excise taxes in the countries considered in the study would lead in aggregate toa fall in Government revenues of over EURO 115 million. Even excluding additional socialsecurity costs from subsequent job losses, this 20% rise would only lead to an increase inoverall government revenues from beer sales of less than 1%.
Fifth. The impact of the increase in the excise tax rate on industry profitability is more thanproportional to the reduction in consumption, due to the importance of fixed costs in the beerindustry. According to our calculations, if excise taxes were raised by 20% in the whole of theEU, beer consumption would fall by 3.32%, while the profits of the beer industry would drop bymore than 10%, due to a combination of lower margins and reduced volumes. This will result injob losses and could lead to a reduction in investment.
Sixth. Any significant rise in the excise tax rate invariably leads to a reduction in employmentacross the beer supply chain. According to our estimates, an increase by 20% in beer excisetaxes would lead to over 70,000 jobs losses, the majority in the on-trade distribution channel.
Seventh. Our analysis shows that the unitary taxation system would have, at least in the shortrun, a negative impact on the budget of Governments, and a very negative and long-lastingeffect on industry employment and profitability. Across the EU, Government revenues wouldfall by over EURO 750 million, the profitability of brewers would be halved, and over 420,000jobs would be lost.
Eighth. There is some evidence of substitution between beer and other alcoholic drinks inresponse to variations in their relative prices. In particular we have found evidence ofsubstitution between beer and spirits and/or wine in some countries. Where this is the case, the

The Brewers of EuropeImpact of tax changes
5
introduction of a unitary taxation policy, or any other selective rise on beer taxes, would lead toa reduction in beer consumption to the benefit of other alcoholic drinks. This means that a partof the beer consumption foregone would be diverted to other alcoholic drinks.
Ninth. There are significant differences between the markets analyzed in this study. The ownprice elasticity for beer varies considerably by country and by trade channel (on-trade and off-trade), as does the rate of pass-through of tax increases into final retail prices. This highlightsthe importance of considering the impact of excise duty rates, and any subsequent changes tothese, at individual Member State level, and taking into account the local characteristics of themarket and the impact on the different stakeholders (Government, consumers, industry andemployees).

The Brewers of EuropeImpact of tax changes
6
1Introduction

The Brewers of EuropeImpact of tax changes
7
1. Introduction
PricewaterhouseCoopers has been retained by The Brewers of Europe to undertake an analysisinto the impact of excise taxation on the beer industry. The Brewers of Europe has in particularrequested PwC to quantify the effect of a variation of excise taxes on the following key variables:
the consumption of beer and other alcoholic beverages, both on-trade (i.e., in bars, pubs andrestaurants) and off-trade (supermarkets and hypermarkets);
overall tax collection by national governments; and
employment and profitability in the brewing sector.
Excise taxes on beer and other alcoholic beverages are normally justified on two grounds. Firstly,they are sources of funding for the Government. At the same time, Governments often cite healthconcerns as a reason for increasing excise taxes. The effectiveness of using taxes to tackleharmful alcohol consumption is beyond the scope of this report.
Governments across the EU have been increasing taxes on beer over recent years. For instance,the British Government has been raising beer taxes on a yearly basis since 2003, with the onlyexception of 2008, when taxes were increased twice (in March and again in December). Overall,the excise tax on beer has grown by 34.8% (4.4% annually) between April 2003 and April 2009.VAT and excise taxes now account for 33.6% of the average price paid for a litre of beer in theUnited Kingdom (UK).
1
In other countries where beer taxes had remained unchanged for a number of years, the nationalgovernments have recently decided to increase the level of taxes substantially – e.g. Netherlands:+30% in 2008; Finland: +10% in 2008, +10% in January 2009, and a further +10% in October;Poland: +13.6% in 2009, Hungary and Estonia: +10% in January 2010, Greece: three tax rises inthe first half of 2010. The Governments of other countries are also considering significant excisetax rises.
Although the situation varies from country to country, this increase in fiscal pressure has notaffected all alcoholic drinks, and in particular wine. According to the data from the EuropeanCommission, the wine industry benefits from a EURO 0.00 excise tax rate in 15 member States(Austria, Bulgaria, Cyprus, Czech Republic, Germany, Greece, Hungary, Italy, Luxembourg, Malta,Portugal, Romania, Slovakia, Slovenia, and Spain), and excise is a very small amount in France.
The European Commission is now also evaluating possible reforms of the community tax policy onalcoholic beverages. One of these reforms may consist of a single or unitary tax per litre of purealcohol that would apply to any non-exempted alcoholic beverage (and in particular to beer andspirits). Depending on how it is implemented, this reform could lead to a significant increase in thelevel of the excise tax per litre of beer.
This report presents the results of the analysis undertaken by PwC. We have considered threedifferent scenarios of variation in excise taxes in the impact analysis:
1. Scenario 1: excise taxes on beer are increased by 20%;
2. Scenario 2: excise taxes on beer are reduced by 20%; and
1According to the data provided by Nielsen, the average price paid for a litre of beer in the United Kingdom
amounted to GBP 3.51 in March 2009. The current level of the excise tax on beer is GBP 0.6588 per litre (4%alcohol by volume), and the value added tax (VAT) rate is 17.5% (source: British Government – HM Revenueand Customs).

The Brewers of EuropeImpact of tax changes
8
3. Scenario 3: introduction of a unitary taxation system in which the excise tax per litre of purealcohol is set to the current level of excise taxes for spirits.
Detailed individual impact analyses have been carried out for the beer markets of 7 EU MemberStates, in particular, Czech Republic, Finland, France, Germany, Poland, Spain and the UnitedKingdom. This sample of countries is considered representative of the whole of the EU, andaccounts for about 70% of European beer consumption by volume.
2The results achieved at the
country level have been extrapolated to obtain estimates of the impact of the selected policyscenarios at the EU level.
This chapter is structured in two additional sections. In section 2, we describe our impact analysismethodology. Section 3 presents the main results. The appendices to the report provide furtherdetails on the methodology and results of the analysis.
2These seven countries account for 70.7% of total consumption in the 20 EU markets covered by market
research company Datamonitor (Austria, Belgium, Czech Republic, Denmark, Finland, France, Germany,Greece, Hungary, Ireland, Italy, Netherlands, Poland, Portugal, Romania, Slovakia, Slovenia, Spain, Swedenand the UK).

The Brewers of EuropeImpact of tax changes
9
2Methodology

The Brewers of EuropeImpact of tax changes
10
2. Methodology
This section is aimed at describing our impact analysis methodology. Further detail is also providedin the appendices. We first provide an overview of the possible effects of a variation in excise taxes(see subsection 2.1). Then we move to explain how each one of these effects is measured. Inparticular, we present our methodology to calculate the impact of excise taxes on prices (seesubsection 2.2), consumption (subsection 2.3), employment, profitability and Government revenues(subsection 2.4). We finally provide an overview of the methodology used for the selection of thesample of countries for the study (see subsection 2.5).
2.1 Overview
Our analysis is aimed at quantifying the impact of different scenarios of excise tax policy onconsumption, Government revenues, and industry profitability and employment.
The impact of a variation in excise taxes on each one of the variables mentioned above is theresult of a combination of effects (see Figure below).
Figure 2-1 Impact of excise taxation – identification of possible effects
Excise taxesBeer
consumptionIndustry
employment
Beer priceIndustry
profitability
Other drinksconsumption
Governmenttax revenues
% pass-throughelasticities
elasticities
margins
tax onincome
excise taxes
VAT
tax onincome
empl./hl
Excise taxesBeer
consumptionIndustry
employment
Beer priceIndustry
profitability
Other drinksconsumption
Governmenttax revenues
% pass-throughelasticities
elasticities
margins
tax onincome
excise taxes
VAT
tax onincome
empl./hl
Source: PwC analysis.
Impact on prices
The most direct effect of a variation in excise taxes for beer is on beer prices. Excise taxes areusually paid directly by the brewer. If there is a rise in excise taxes, the brewer has to decide howmuch of this tax rise is passed through into prices to their customers (e.g. wholesalers,supermarkets or pub owners). These will in turn decide any change in the price they charge to thefinal consumer. This is generally assessed on a case by case basis and depends on many factorsincluding competition within the market place, the current economic climate and its impact ondisposable incomes, the impact of raw materials and other cost components, along with generalconsumer price sensitivity. All of these factors may influence the decision by the brewer and otheragents in the beer supply chain to increase prices and whether and to what extent an excise taxrise can be passed on to the consumer without a corresponding adverse reduction in consumptionand sales. The brewer, wholesaler or retailer could therefore decide to pass through only part ofthe tax rise, even if this is at the expense of a reduction in margins. Conversely, he could decide toincrease prices by more than the tax rise to maintain a fixed gross margin.
The level of pass-through is a relevant issue that must be considered in our analysis. Themethodology to estimate the level of pass-through is explained in subsection 2.2 below.

The Brewers of EuropeImpact of tax changes
11
Impact on consumption
Any change in the price of a product or service – regardless of whether it is motivated by avariation of excise taxes or by other factors – is likely to have an impact on the level ofconsumption. In economics, the sensitiveness of consumption to variations in prices is normallymeasured by the elasticity of demand.
There are different concepts of elasticity. In what follows, we will focus specifically on theelasticities of the demand for beer.
The own price elasticity of demand measures the percentage change in the consumption of beerfollowing a variation of one per cent in its price.
3For instance, an estimated own price elasticity of -
0.5 indicates that an increase by 1% in the price of beer would lead to a decrease of 0.5% in thelevel of consumption. Increases in the price of any good will lead to variations of opposite sign (i.e.,decreases) in its consumption. The own price elasticity of demand is therefore expected to benegative (lower than zero). Broadly speaking, the demand for a good is considered to be elastic ifits own price elasticity is greater than -1 (in absolute value), and inelastic in other case.
The cross price elasticity measures the percentage change in the consumption of beer following avariation by 1% in the price of another good.
4For example, if the elasticity of the demand for beer
to the price of soft drinks is equal to 0.5, this means that an increase of 1% in the price of softdrinks would lead to an increase of 0.5% in the consumption of beer. If two goods are substitutes,an increase in the price of one will lead to an increase in the consumption of the other, and thecross price elasticity is expected to be positive (greater than zero). The cross price elasticity will benegative for complementary goods (i.e., goods that are consumed together in fixed proportions, likecoffee and sugar), and zero for goods with unrelated demands.
The magnitude of the impact of an excise tax change on industry employment and profits and onGovernment revenues will be a combination of both a price and a volume effect. For instance, anincrease in the excise tax rate will lead in general to an increase in the amount collected by theGovernment from each litre of beer sold (i.e., will have a positive price effect). However, if the taxrise is passed-through and prices increase, it will have a negative impact on consumption, and thenumber of litres of beer over which the tax is collected will fall (i.e., there will be a negative volumeeffect). The net impact of the tax rise on Government revenues will depend on the relativemagnitude of these two effects.
Similarly, an increase of taxes that is passed-through into prices and does not affect unit margins(i.e., has a neutral price effect), can still lead to a drop in consumption and affect negatively thetotal profit made by the brewing industry.
The sensitiveness of consumption to prices is therefore a relevant issue in our analysis. Themethodology to estimate demand elasticities is explained in subsection 2.3 below.
3The mathematical expression of the own price elasticity of demand is the following:
x
x
x
xx
q
p
p
q
where qx and px are, respectively, the quantity sold and the price of good x, and qx/px is the marginalvariation in the quantity of good x sold following a marginal variation in its price.
4The mathematical expression of the cross price elasticity of demand is the following:
x
y
y
xxy
q
p
p
q
where qx and py are, respectively, the quantity sold of good x and the price of good y, and qx/py is themarginal variation in the quantity of good x sold following a marginal variation in the price of y.

The Brewers of EuropeImpact of tax changes
12
The methodology to calculate the impacts on industry employment and profits and on Governmentrevenues is presented in subsection 2.4.
2.2 Level of pass-through
Our estimate of the level of pass-through has been obtained from an analysis of historical data. Inparticular, we have calculated which has been the impact of past variations of tax rates on beerprices in the different countries under analysis.
Any variation in prices observed following an increase in excise taxes is not necessarily explainedin its entirety by the tax rise. Other factors that have an effect on prices, like increases in operatingcosts, can also explain a part of these price movements. For this reason, we have usedeconometrics for the analysis of historical data. The advantage of using econometrics is that wecan isolate the impact of the excise tax rises from the remaining cost factors that also have aneffect on prices. The cost factors considered in our analysis are, in addition to excise taxes, labourand raw materials costs.
5
The details of the econometric models used in this analysis are included in Appendix A.
2.3 Demand elasticities
Our estimates of demand elasticities are also based on the analysis of historical data. In particular,we have estimated the impact of past variations in prices on beer consumption.
Demand elasticities cannot be inferred directly from data on beer consumption and prices, sinceconsumption is affected by other variables different from beer prices, such as the price ofsubstitutes, or the disposable income of consumers. This means that any change in consumptionobserved following a variation in prices could be explained in part by the evolution of these othervariables. Any attempt to estimate demand elasticities without taking into account their influencecould lead to misleading results.
We have therefore used econometric techniques for the analysis of the historical data on beerconsumption and prices. As explained above, by using econometrics, we can isolate the impact onconsumption of a particular variable, such as beer prices. In the analysis, we have also consideredthe possible effect on consumption of variations in the price of potential substitutes of beer, inparticular, spirits, wine and soft drinks, and income.
6With econometrics, we can also obtain
simultaneously estimates of the own and cross-price elasticities required for the impact analysis.
5In our model, the evolution of beer prices is explained as a function of labour and raw materials costs, and
excise taxes. In particular countries, we had to use a different model specification. For instance, in the UK, theBritish Government decided to temporarily lower VAT rates in December 2008. The UK pass-through modelincludes an additional (artificial or dummy) variable to account for this effect. In Spain, we could not obtainreliable proxies for labour and raw materials costs. In this particular case, we used time-series (ARIMA)modelling and intervention analysis techniques to obtain our estimates of pass-through effects.
6In our model, beer consumption is a function of beer prices, the price of potential substitutes, and the
disposable income of consumers. The substitutes considered in the analysis vary from country to country,depending on which is the most popular drink (e.g., vodka in Finland, Poland, and the UK; whisky in Spain),and the information available. In this last regard, it should be noted that data on soft drink prices was onlyavailable for Spain and the UK. In France, Germany and the Czech Republic, we could not obtain data on theprice of other alcoholic drinks different from beer. In these countries, beer consumption is explained as afunction of beer prices and income. In some countries, we have also considered the impact of climateconditions and, in particular, of temperature, on consumption. Temperature is not a relevant determinant ofconsumption once that seasonal effects have been considered by including monthly or quarterly artificial ordummy variables, or by taking inter-annual differences.

The Brewers of EuropeImpact of tax changes
13
The details of the econometric models used in this analysis are included in Appendix B.7
2.4 Impact on employment, profitability and Governmentrevenues
2.4.1 Impact on employment
We have considered the impact on both direct and indirect employment generated by the beerindustry. We understand direct employment as the total workforce contracted by the brewingcompanies directly. Indirect employment is the number of jobs generated by the beer industry inrelated sectors, i.e., those that supply products or services to the brewing companies (producers ofbarley and malt, transport companies, etc.) or distribute beer to final consumers (bars, restaurants,supermarkets, etc.).
Figures on employment have been provided by The Brewers of Europe. They are based onestimates from Ernst & Young. Employment is measured in equivalent full-time jobs.
In the analysis, we assume that consumption is the main driver of employment in the beer industry.This assumption is strongly supported by empirical evidence.
The Figure below shows the relationship between consumption and direct employment in theEuropean brewing sector. The data in the Figure are for 20 EU Member States
8and have been
taken from Datamonitor (consumption) and The Brewers of Europe (estimates of directemployment by Ernst & Young).
9
The correlation between direct employment and consumption is 0.96 (close the maximum of1.00).
10This means that there is an almost perfect positive linear relationship between employment
and consumption, and that the level of employment in a Member State can be inferred quiteprecisely from its level of consumption.
7It should be noted that the estimation of demand elasticities poses difficulties that in some cases cannot be
resolved with standard econometric techniques. In particular, the fact that producers set their prices taking intoaccount the reaction of consumers, and consumers decide their levels of consumption taking into account theprice of the producer, gives raise to problems of simultaneity and endogeneity. In the presence of endogeneity,the use of standard estimation techniques, like ordinary least squares (OLS), leads to biased and inconsistentresults. For this reason, we have used instrumental variables (two stages least squares – 2SLS) estimationtechniques in those cases in which endogeneity problems have been found.
8The 20 EU Member States covered by Datamonitor. See footnote 2 in page 8.
9Data on consumption are for year 2007 (the latest year available from Datamonitor at the time this analysis
was carried out), while data on employment are for year 2008. The consideration of data on consumption foryear 2008 has not any material impact on the results of the analysis. We have also estimated the relationshipbetween consumption and employment by using data provided by The Brewers of Europe (based onestimates from Ernst & Young) for year 2008. The correlation between employment and consumption is 0.97.The impacts of a variation of 10% in consumption on direct and indirect employment are, respectively, 6.90%and 9.92%.
10The correlation coefficient is a statistical measure of the degree of linear relationship between two variables
(e.g., consumption and prices). It can take values in the range from -1 to 1. The larger the correlationcoefficient (in absolute value), the stronger the relationship between the two variables. A correlation coefficientof -1 indicates that there is a perfect negative linear relationship between the variables (i.e., any change in thelevel of one variable is followed by a variation of opposite sign and fixed amount in the other). A correlation of1 is indicative of a perfect positive linear relationship between the variables (i.e., changes in the value of onevariable are followed by variations of the same sign and fixed amount in the other). A correlation of 0 meansthat the two variables are not linearly related. The correlation between beer consumption and employment isrobust to the exclusion of countries with larger levels of consumption from the sample.

The Brewers of EuropeImpact of tax changes
14
Figure 2-2 Relationship between beer consumption and direct employment
Source: Datamonitor (consumption) and The Brewers of Europe (based on estimates from Ernst & Young,direct employment).
We have undertaken an econometric simple regression analysis to estimate the precise impact ofbeer consumption on direct employment from the data in the Figure above (see Appendix C fordetails).
11According to our estimates, a decrease in beer consumption by 10% would lead to a
decrease in direct employment of 7.67%.
The correlation between beer consumption and indirect employment is even higher, 0.98 (seeFigure 2-3). According to our estimates (also based on regression analysis), a drop by 10% inconsumption would lead to a decrease in indirect employment of 9.60%.
12
The difference between the impact on direct and indirect employment is explained by the differentflexibility of the brewing sector and other related sectors to adjust their workforce followingreductions in the level of activity. In particular, most of the indirect employment generated by thebrewing industry is in the hospitality sector,
13where temporary workers are a significant part of total
workforce.
11For the regression, data on consumption and employment have been expressed in logarithms to obtain an
estimate of the percentage variation in employment following a 1% fall in consumption. The R-square of theregression is 0.8393, which means that consumption explains 83.93% of the variability of direct employment.The coefficient estimated for consumption is statistically different from 0 at any confidence level (p-value of0.000).
12The R-square of the regression is 0.8427. The coefficient estimated for consumption is different from 0 at
any confidence level (p-value of 0.000).
13According to the data provided by The Brewers of Europe (based on Ernst & Young estimates), 78.0% of
the indirect employment generated by the brewing industry is in the hospitality sector.

The Brewers of EuropeImpact of tax changes
15
Figure 2-3 Relationship between beer consumption and indirect employment
Source: Datamonitor (consumption) and The Brewers of Europe (based on estimates from Ernst & Young,indirect employment).
Table 2-1 shows the data available on the evolution of consumption and total (direct and indirect)employment in the seven countries considered in our study from 2004 to 2008. These data are notsufficient to estimate the actual (long-term) impact of consumption on employment. In particular,data on employment is only available for years 2004 and 2008 (not for years 2005, 2006 and 2007),and the relationship between change in employment and consumption calculated could be affectedby temporary disequilibria due to workforce adjustment costs, cyclical patterns of consumption, orthe anticipated evolution of sales. Notwithstanding, these data are useful to check whether theimpacts estimated from the cross-country comparison are of a reasonable order of magnitude.
Table 2-1 Evolution of employment and consumption in selected EU countries
Employment (‘000) Consumption (million hl)Country2004 2008 % inc 2004 2008 % inc
impliedelasticity
Czech R. 76.0 54.5 -28.3% 17.9 16.2 -9.3% 3.05Finland 19.5 17.5 -10.3% 4.9 4.7 -4.6% 2.21France 91.7 71.5 -22.0% 20.2 18.8 -7.0% 3.13Germany 549.6 521.2 -5.2% 95.5 91.0 -4.7% 1.10Poland 186.0 207.9 11.8% 28.8 36.9 28.1% 0.42Spain 220.2 225.1 2.3% 33.5 35.7 6.4% 0.35UK 450.0 397.2 -11.7% 60.3 51.3 -14.9% 0.79
TOTAL 1,592.9 1,494.9 -6.1% 261.1 254.5 -2.5% 2.45
Source: PwC analysis, The Brewers of Europe (based on estimates from Ernst & Young).
The ratio between the percentage variations of total employment and consumption (in the Table,implied elasticity) ranges from 0.35 to 3.05 (average of 2.45). An implied elasticity of 0.35 indicatesthat a 10% fall in consumption leads to a 3.5% reduction in employment. The impacts estimatedfrom the cross-country comparison (implied elasticities of 0.767 and 0.960 for direct and indirectemployment, respectively) are in this range, and below the average for the seven countries underanalysis. Therefore, these impacts seem to be of a reasonable order of magnitude (and maybe abit conservative).
Following the above, we consider that each percentage point of reduction in consumption in any ofthe countries covered by our study leads to 0.767 percentage points of reduction in directemployment, and to 0.960 percentage points of reduction in indirect employment.

The Brewers of EuropeImpact of tax changes
16
2.4.2 Impact on profitability
If the price of beer is over its production cost, every reduction of one litre in the volume of beer soldwill lead (other things equal) to a reduction in industry profits.
This reduction in profits is equal to the difference between the revenue or price per litre, and theavoided costs of production. Avoided costs are those which are not incurred if the litre of beer is notproduced and sold. These are typically variable costs, like energy, raw materials (water, barley,etc.) or transport costs. Avoided costs do not include fixed costs (i.e., costs that do not vary withthe level of production). One example of fixed costs is the investment in plant or machinery. Once abrewing company has invested in a production plant, any reduction in sales or consumption thatleads to a situation of overcapacity will not affect the original cost of the plant (which has alreadybeen incurred). Labour costs can also be regarded fixed to a certain extent, in particular in areas ofthe company such as administration (accounting, human resources, etc.) or management.
The Table below shows our estimates of the profit loss per litre of beer not sold for each of thecountries considered in the study. Further details on the methodology to analyze the impact onprofitability are in Appendix D.
Table 2-2 Profit loss per litre of beer not sold in selected EU countries
Country loss of profit(EURO/litre)
Czech R. 0.13Finland 0.32France 0.12Germany 0.18Poland 0.04Spain 0.26UK 0.24
Source: PwC analysis.
In our analysis, we have not taken into account the likely effects of the variation in excise taxes onother financial performance indicators of the brewing industry, like investments, nor the impact onthe profits of other related industries.
Notwithstanding, it should be noted that any measure that affects negatively the profits of the beerindustry is likely to have a negative effect on its level of investment. Moreover, to the extent that thefall in beer consumption affects negatively the activity of other related sectors, it will also havenegative effects on the profitability of these sectors.
2.4.3 Impact on tax revenues
We have considered the impact on the following sources of revenue for the Government:
Excise taxes.
VAT.
Tax on corporate income.
Tax on personal income.
Contributions to Social Security.
Our analysis only measures the impact on the revenues obtained by the Governments from beersales. Revenues from other alcoholic drinks are not considered.

The Brewers of EuropeImpact of tax changes
17
The main assumptions in our analysis of impact on Government revenues are presented inAppendix E. Figures on VAT and corporate income tax rates have been taken from the EuropeanCommission. The average contributions per employee to total personal income tax collection andsocial security have been provided by The Brewers of Europe, and are based on estimates fromErnst & Young.
We have also considered the cost for the Government of the unemployment benefits that should bepaid to employees who would loose their jobs following an excise tax rise. This cost has beenestimated from the average duration of unemployment and the amount of the unemploymentbenefit. The details of this calculation are presented in Appendix E.
2.5 Selection of countries
Our methodology for the selection of the sample of countries for the study is aimed at ensuring thatcountries are selected attending to criteria of representativeness, so as to facilitate theextrapolation of the results of the study to the whole of the EU.
Broadly speaking, our methodology comprises two major stages:
First, the set of countries initially considered as candidates for the sample are divided into 7clusters of countries regarded similar or homogeneous.
Second, one representative country is selected from each cluster.
The Figure below shows the resulting clusters and the sample of countries selected for the study,which comprises Czech Republic, Finland, France, Germany, Poland, Spain and the UK.
A full explanation of the approach taken and the variables considered is in Appendix F.
Figure 2-4 Countries selected from each cluster
Beer volume (*) CountryCountry Beer volume (*)
• Austria
• Hungary
• Slovakia
• Czech Republic
• Greece
• Portugal
870.70
771.10
368.20
1,572.90
446.50
647.30
cluster 1:
• Finland
• Sweden
450.10
469.50
cluster 2:• Ireland
• United Kingdom
548.20
5,903.10
cluster 5:
• Germany 9,253.40
cluster 7:
• Poland
• Romania
3,486.40
1,954.10
cluster 6:
(*) In millions of litres
• Italy
• Spain
1,815.30
3,274.60
cluster 4:
• Belgium
• Netherlands
• Denmark
• France
953.00
1,297.50
427.10
2,019.10
cluster 3:
Beer volume (*) CountryCountry Beer volume (*)Country Beer volume (*)
• Austria
• Hungary
• Slovakia
• Czech Republic
• Greece
• Portugal
870.70
771.10
368.20
1,572.90
446.50
647.30
cluster 1:
• Finland
• Sweden
450.10
469.50
cluster 2:• Ireland
• United Kingdom
548.20
5,903.10
cluster 5:
• Germany 9,253.40
cluster 7:
• Poland
• Romania
3,486.40
1,954.10
cluster 6:
(*) In millions of litres
• Italy
• Spain
1,815.30
3,274.60
cluster 4:
• Belgium
• Netherlands
• Denmark
• France
953.00
1,297.50
427.10
2,019.10
cluster 3:
Source: PwC analysis, Datamonitor (consumption).

The Brewers of EuropeImpact of tax changes
18
3Main results
The Brewers of EuropeImpact of tax changes
19
3. Main results
This section presents the main results from our analysis. It is structured in 3 subsections. First, wepresent our estimates of the level of pass-through and demand elasticities for the differentcountries considered in the study (see subsections 3.1 and 3.2). The results of the impact analysisat the country and EU-level are presented in subsection 3.3.
3.1 Level of pass-through
There is little previous empirical work on the level of pass-through and the impact of excise taxvariations on prices. The most relevant reference is the study undertaken by OEF (OxfordEconomic Forecasting) for The British Beer and Pub Association in 2004. In this study, OEFanalyzes the evolution of beer prices in the UK between the first quarter of 1986 and the fourthquarter of 2003.
Our estimates of pass-through levels (see Table 3-1) are consistent with the findings of OEF.14
Inparticular, we find that the impact of a variation in excise taxes in the on-trade channel is differentfrom (larger than) the effect of the same variation in the off-trade channel. Data on prices split bydistribution channel was only available for Finland, Spain, and the UK. In these countries, theestimated levels of pass-through are positive in the on-trade channel and zero or negative in theoff-trade channel. The pass-through levels estimated in the on-trade and off-trade channels forFinland are, respectively, 0.216 and 0.000. This means that a rise by 1% in excise taxes in Finlandwould lead to an increase by 0.216% in the price (net of excise taxes) of beer on-trade. Put anotherway, the price inclusive of tax rises by more than the excise tax increase. The net price of beer off-trade would remain unchanged. In Spain, a 1% rise in the excise tax rate would lead to a 0.114%increase of the net on-trade price, and would not affect significantly the net off-trade price. Theestimated pass-through levels for the UK are similar to those reported by OEF (0.420 on-trade, -0.293 off-trade, as compared to 0.5 and -0.3 estimated by OEF).
In the case of France and Poland, we only had sufficiently detailed information on prices for the off-trade channel, since market research companies (e.g., Nielsen) do not provide reliable on-tradedata in these countries. The levels of pass-through reported in the Table for these two countries(0.000) are therefore estimates for the off-trade channel, although in the impact analysis we haveconsidered this same level of pass-through for the on-trade channel. This assumption is regardedconservative (in that it probably leads to underestimate the magnitude of the impact) since,according to the evidence available, pass-through effects in the on-trade channel are probablyhigher. In the Czech Republic and Germany, there have not been changes in excise taxes alongthe period covered by the data on prices available. We have therefore assumed that the level ofpass-through is also 0.000. This means that, following a rise in excise taxes, the price of beer in allthese countries would increase by the same amount of the tax rise (or, what is the same, the pricenet of excise taxes would remain constant).
14See Appendix G for a description of the data available for each one of the countries and detailed results of
the econometric estimates.

The Brewers of EuropeImpact of tax changes
20
Table 3-1 Levels of pass-through estimated
Country Pass-through on-trade Pass-through off-trade
Czech Republic 0.000e
Finland 0.216 0.000France 0.000Germany 0.000
e
Poland 0.000Spain 0,114 0.000UK 0.420 -0.293
Source: PwC analysis.
3.2 Demand elasticities
There is considerable more empirical work available on the sensitiveness of beer consumption toprices and on the elasticity of the demand for beer.
Gallet (2007) makes a compilation of the results from over 300 studies on this subject. He finds thatthe median own-price elasticity estimated by these studies for the demand for beer is -0.360. Thisindicates that 50% of the studies estimated an elasticity of -0.360 or lower, and 50% estimated anelasticity of -0.360 or higher. The author does not report the maximum, minimum and averagevalues of the elasticity.
Wagenaar et al. (2009) survey over 100 studies. They find estimated values of the own-priceelasticity of demand that range between -0.00 and -0.61.
15The average own-price elasticity
calculated from these studies is -0.46.
With quarterly data for the period between 1993 and 2006, Cooper and Logan (2007) find that,depending on the precise specification of the model, the value of the on-trade elasticity for beerranged between -1.53 and -1.62. The elasticity of the off-trade demand was considerably lower (inthe range between -0.64 and -0.96).
16
Our estimates of the own-price elasticity of demand are reported in Table 3-2.17
They areconsistent with the results of the work by Cooper and Logan.
There was only data available for Spain and the UK to estimate elasticities by distribution channel.In both countries, the sensitiveness of demand to price is higher on-trade than off-trade. The valuesof the elasticities calculated for the UK are also in the range of those estimated by previous studies.The elasticities for Finland and Germany are total market elasticities. For France, Poland and theCzech Republic, elasticities are for the off-trade channel. In these three countries, we haveconsidered the same elasticity for the on-trade channel. This assumption is regarded conservative(and probably leads to underestimate the magnitude of the impact) since, according to theevidence available, demand is more elastic on-trade than off-trade.
15One of the studies surveyed by Wagenaar et al. (2009) finds a positive (statistically significant) own price
elasticity of demand. See Wagenaar et al. (2009), p. 184.
16Other papers that have been reviewed for the purpose of this study include the following: Crawford et al.
(1999), Crooks (1989), Fogarty (2006), Huang (2003), Jones (1989), Kenkel (2005), Leung and Phelps (1993),Manning et al. (1995), Ornstein and Levin (1983), Salisu and Balasubramanyam (1997), Tsolakis et al. (1983),and Young and and Bielinska-Kwapisz (2002).
17See Appendix H for a description of the data available for each one of the countries and detailed results of
the econometric estimates.

The Brewers of EuropeImpact of tax changes
21
Table 3-2 Estimated elasticities of the demand for beer
Own price elasticityCountryOn-trade Off-trade
Substitutes ofbeer (*)
Czech Republic -1.144Finland -0.765 VodkaFrance -1.352Germany -0.568Poland -1.490 WineSpain -0.905 -0.835 Whisky, still wineUK -1.267 -1.146 Vodka, light wine
NOTE: (*) Cross price elasticity positive and statistically significant (different from zero).Source: PwC analysis.
There are notable differences across countries. In particular, the demand for beer seems to berelatively elastic (higher than -1 in absolute value) in the Czech Republic, France, Poland and theUK, and inelastic in Finland, Germany and Spain. The range varies from -0.568 in Germany to -1.49 in Poland.
We have also found evidence of substitution between beer and other alcoholic drinks in responseto changes in their relative prices in Finland, Poland, Spain and the UK. The data available for theremaining three countries covered by our study was not sufficient to estimate cross-priceelasticities.
Finally, we have observed a shift of beer consumption from the on-trade to the off-trade channel inthose countries with data split by distribution channel.
18Our analysis of cross-price elasticities
shows that this shift is not motivated by changes in the relative prices of beer in both channels.19
This suggests that it is mainly the result of an income effect (consumers diverting purchases fromhigher price – beer on-trade – to lower price goods – beer off-trade – in response to adverseshocks in economic conditions), or of a change in consumer preferences.
3.3 Impact analysis
3.3.1 Results at the EU-level
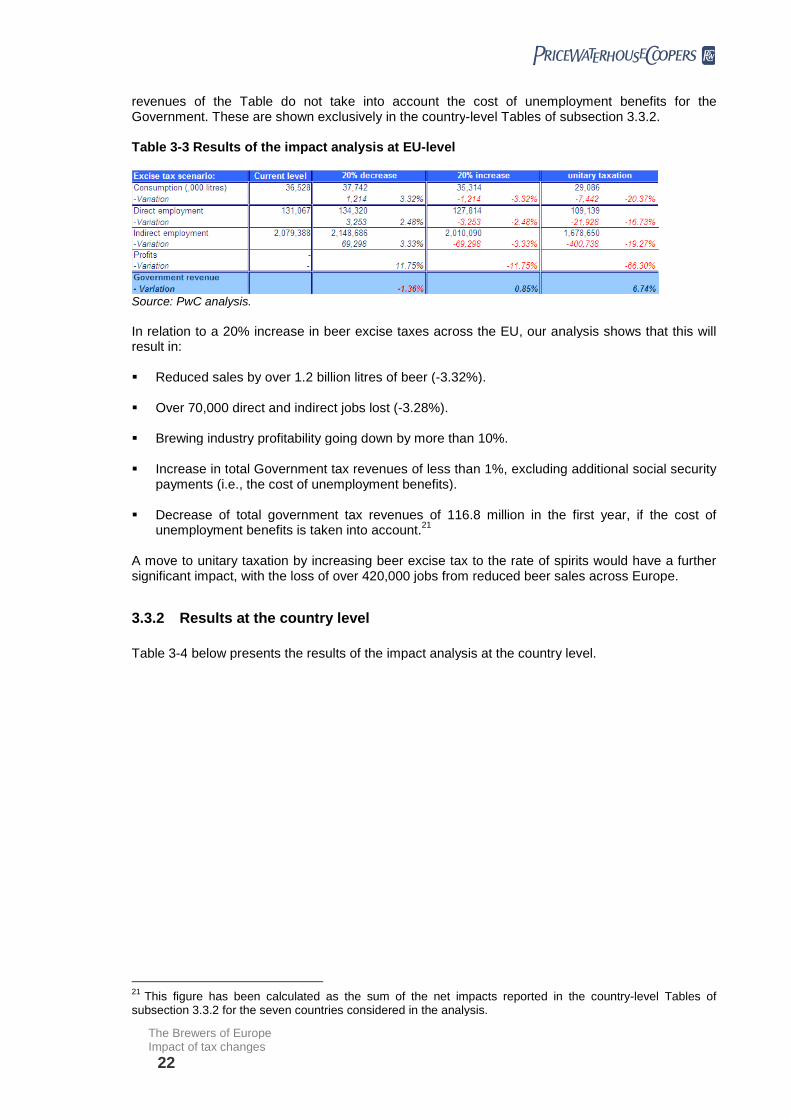
The results at the EU-level are presented in Table 3-3. EU estimates are the result of extrapolatingthe impacts calculated at the country level. In particular, we assume that the results for eachcountry are representative of the whole of its cluster. Then we calculate a weighted average impactat the EU level.
20
The first column in the Table shows the current level of beer consumption, employment, profitabilityand Government tax revenues from beer sales. Subsequent columns show the impact on thesevariables of a 20% change in beer excise rates, and the impact if beer excise rates were increasedto the level of the excise tax for spirits (unitary taxation). The impact in terms of social securitypayments under these scenarios is also highlighted. The percentage variations of Government
18In particular, in the UK, the proportion of beer consumed off-trade has grown by 4.3 percentage points, from
37.2% in 2006 to 41.5% in 2008. In Spain, the weight of off-trade sales has grown 1.7 percentage points (from39.3% to 41.0%) over the same period. Source: Nielsen.
19Cross elasticities of the demand of beer on-trade with respect to the price of beer off-trade, and of the
demand for beer off-trade with respect to the price of beer on-trade found not statistically different from zero(p-value larger than 0.100).
20In the case of consumption and profits, the average is weighted by sales in volume. In the case of
employment, the average is weighted by the number of employees.
The Brewers of EuropeImpact of tax changes
22
revenues of the Table do not take into account the cost of unemployment benefits for theGovernment. These are shown exclusively in the country-level Tables of subsection 3.3.2.
Table 3-3 Results of the impact analysis at EU-level
Source: PwC analysis.
In relation to a 20% increase in beer excise taxes across the EU, our analysis shows that this willresult in:
Reduced sales by over 1.2 billion litres of beer (-3.32%).
Over 70,000 direct and indirect jobs lost (-3.28%).
Brewing industry profitability going down by more than 10%.
Increase in total Government tax revenues of less than 1%, excluding additional social securitypayments (i.e., the cost of unemployment benefits).
Decrease of total government tax revenues of 116.8 million in the first year, if the cost ofunemployment benefits is taken into account.
21
A move to unitary taxation by increasing beer excise tax to the rate of spirits would have a furthersignificant impact, with the loss of over 420,000 jobs from reduced beer sales across Europe.
3.3.2 Results at the country level
Table 3-4 below presents the results of the impact analysis at the country level.
21This figure has been calculated as the sum of the net impacts reported in the country-level Tables of
subsection 3.3.2 for the seven countries considered in the analysis.

The Brewers of EuropeImpact of tax changes
23
Table 3-4 Results of the impact analysis at the country level
Czech Republic:
Finland:
France:

The Brewers of EuropeImpact of tax changes
24
Table 3-4 Results of the impact analysis at the country level (continued)
Germany:
Poland:
Spain:

The Brewers of EuropeImpact of tax changes
25
Table 3-4 Results of the impact analysis at the country level (continued)
UK:
NOTES: Current levels of the excise tax in EURO per litre have been calculated for the different countriesassuming a standard of 5% alcohol by volume or 12.5 Plato degree (see Appendix I for details). They areshown for illustration purposes only. The average excise tax collected per litre of beer can differ from thisfigure, since the average alcohol content of beer does not have to be exactly equal to 12.5 Plato degree in theseven countries under analysis. In our estimates of impact on Government revenues, we considered theactual average tax rate (not that shown in the Table). Consumption, price and employment levels in our basecase scenario (current level) are for year 2008, have been provided by The Brewers of Europe, and are basedon estimates from Ernst & Young. In those cases in which the excise tax rate has been modified after 2008,prices, volumes and employment levels have been adjusted accordingly with estimated levels of pass-throughand elasticities. In the UK, there was also a variation in the VAT rate, which was reduced from 17.5% to 15.0%.2008 price levels were also adjusted accordingly.Source: PwC analysis.
The country Tables show that a 20% increase in beer excise taxes is to a great extent, if not totally,offset by a fall in other sources of revenues, as beer sales and employment fall accordingly.
According to our calculations, a rise of 20% in excise taxes would lead to an increase in overallbeer-related tax revenues for the Government of only 0.33% in Germany (some EURO 41.8 million),0.48% in Spain (EURO 16.9 million), 0.75% in France (EURO 19.8 million), 2.09% in Poland(EURO 66.2 million), 2.12% in Czech Republic (EURO 14.8 million), and 3.84% in Finland (EURO46.7 million).
In the UK, the increase in excise tax revenues would be more than offset by the drop in revenuesfrom income taxes and VAT. As a result, an increase of 20% in the tax rate would lead to adecrease of 0.41% in total Government revenues (some EURO 53.6 million).
If we consider the cost for the Government of the unemployment benefits associated to this loss ofjobs, then an increase by 20% in excise taxes leads to an immediate reduction in Governmentrevenues not only in the UK, but also in France and Spain. In Germany and the Czech Republic,the net benefit for the Government budget in the first year would amount to less than EURO 10million (4.6 million in Germany and 9.7 million in the Czech Republic). In the case of Finland, wehave not taken into account in our estimates the possible effect of a excise tax increase on so-called ‘passenger imports’ from lower price countries, which in 2007 accounted for about 12.52% oftotal alcohol consumption in this market.
22According to our calculations, the net immediate impact
on the budget of the Finnish Government of a 20% tax rise would also be negative if the weight ofpassenger imports over total consumption increases by 5.0 percentage points or more.
22Lower scale imports, in some cases made by final consumers themselves, from countries located next to
Finland where the price of alcoholic drinks in substantially lower. According to the Finnish National ResearchCenter for Welfare and Health (STAKES), passenger imports accounted for 12.52% of total alcohol consumedin Finland in 2007. See STAKES (2008), p. 43.

The Brewers of EuropeImpact of tax changes
26
These findings highlight the importance of considering the wider consequences of beer excise taxchanges on the European economy and on overall tax revenues. The structure of the industry, itslinks with the on-trade sector and the wider economy, and how excise changes ultimately impacton demand, mean that changes to excise rates will have an effect well beyond the change in totalexcise revenue.

The Brewers of EuropeImpact of tax changes
27
Appendix
The Brewers of EuropeImpact of tax changes
28
References
Central Statistical Office of Poland, http://www.stat.gov.pl/.
Cooper, A. and A. Logan (2007), “Has the demand for beer in the UK become more price sensitivesince the opening of the single European market?”, Mimeo.
Crawford, I., Z. Smith and S. Tanner (1995), “Alcohol taxes, tax revenues and the Single EuropeanMarket”, Fiscal Studies, vol. 16, No. 2, pp. 287-304.
Crooks, E. (1989), “Alcohol consumption and taxation”, Institute of Fiscal Studies Working Paper,No. 95/3.
Czech Statistical Office, http://www.czso.cz/.
Gallet, C.A. (2007), “The demand for alcohol: a meta-analysis of elasticities”, The AustralianJournal of Agricultural and Resource Economics, vol. 51, pp. 121-135.
Datamonitor, http://www.datamonitor.com/.
Ernst & Young (2006), The Contribution Made By Beer to the European Economy, available athttp://www.brewersofeurope.org/.
Ernst & Young (2009), The Contribution Made By Beer to the European Economy, available athttp://www.brewersofeurope.org/.
European Commission (2009), Taxation Trends in the European Union. Main Results, available athttp://ec.europa.eu/.
European Commission (2009), VAT Rates Applied in the Member States of the EuropeanCommunity. Situation at 1
stJanuary 2009, available at http://ec.europa.eu/.
Eurostat, http://ec.europa.eu/eurostat/.
Fogarty, J. (2006), “The nature of the demand for alcohol: understanding elasticity”, British FoodJournal, vol. 108, pp. 316-332.
HM Revenue and Customs (British Government), http://www.hmrc.gov.uk/.
Huang, C.H. (2003), “Econometric models of alcohol demand in the United Kingdom”, GovernmentEconomic Service Working Paper, No. 140.
INSEE, http://www.insee.fr/.
Instituto Nacional de Estadística, http://www.ine.es/.
International Labour Organization, http://www.ilo.org/.
International Monetary Fund, http://www.imf.org/.
Jones, A.M. (1989), “A system approach to the demand for alcohol and tobacco”, Bulletin ofEconomic Research, vol. 41, pp. 185-201.
KELA (2009), Pocket Statistics 2009, available at http://www.kela.fi/.
Kenkel, D.S. (2005), “Are alcohol tax hikes fully passed through to prices? Evidence from Alaska”,American Economic Review, vol. 95, No. 2, pp. 273-277.
The Brewers of EuropeImpact of tax changes
29
Leung, S. and C. Phelps (1993), "My kingdom for a drink …? A review of estimates of the pricesensitivity of demand for alcoholic beverages", in M.E. Hilton and G. Bloss (Eds.), Economics andthe Prevention of Alcohol-Related Problems, NIAAA Research Monograph, No. 25.
Manning, W.G., L. Blumberg, and L.H. Moulton (1995). “The demand for alcohol: The differentialresponse to price,” Journal of Health Economics, vol. 14, No. 2, pp. 123-148.
Ministerio de Trabajo e Inmigración (Spanish Government), http://www.mtas.es/.
Ministry of Labour and Social Policy (Polish Government), http://www.mpips.gov.pl/.
Nielsen, http://www.nielsen.com/.
OECD, http://www.oecd.org/.
OEF (2004), Modelling the Beer Market, Final Report for The British Beer and Pub Association.
Office of Retirement and Disability Policy (2008), Social Security Programs Throughout the World:Europe, 2008, available at http://www.ssa.gov/.
Office for National Statistics, http://www.statistics.gov.uk/.
Ornstein, S.I. and D. Levy (1983), “Price and income elasticities of demand for alcoholicbeverages”, in Galanter, M. (Ed.), Recent Developments in Alcoholism, vol. 1, Plenum Press: NewYork, pp. 303-345.
Salisu, M.A. y V.N. Balasubramanyam (1997), “Income and price elasticities of demand foralcoholic drinks”, Applied Economic Letters, vol. 4, pp. 247-251.
Tsolakis, T., T. Rierhmuller, and G. Muller (1983), “Demand for wine and beer”, Review ofMarketing and Agricultural Economics, vol. 51, No. 2.
STAKES (2008), Yearbook of Alcohol and Drug Statistics 2008, http://www.stakes.fi/.
Statistics Finland, http://www.stat.fi/.
Statistisches Bundesamt, http://www.destatis.de/.
Valvira, http://www.valvira.fi/.
Wagenaar, A.C., M.J. Salois, y K.A. Komro (2009), “Effects of beverage alcohol price and tax levelson drinking: a meta-analysis of 1003 estimates from 112 studies”, Addiction, vol. 104, pp. 179-190.
Young, D.J. and A. Bielinska-Kwapisz (2002), “Alcohol taxes and beverages price”, National TaxJournal, vol. 55, pp. 57-73.

The Brewers of EuropeImpact of tax changes
30
Appendix A. Econometric model of pass-through
For assessing the level of pass through, we have specified a model where the price of beer is afunction of input prices and excise levels. In particular, we have estimated the following equation:
ttttt excisewagesmaterialsppricenet 3210 )ln()_ln()_ln(
where:
net_pricet is the nominal net price of beer in period t. It is defined as the selling price to finalconsumers minus the excise on beer.
p_materialst is an index of the price of raw materials.
wagest is an index of the level of wages.
exciset is the level of the excise tax rate.
t is the error term of the regression.
ln(.) is the natural logarithm function.
is the seasonal lag operator (Xt = Xt - Xt-i). Note that the transformation used in the model isequivalent to interannual percent variations, since (ln(Xt) [Xt - Xt-i]/ Xt-i).
k (for k = 1, 2, …) are the parameters to be estimated.
The precise specification of the model used to estimate the level of pass-through in the differentcountries and distribution channels (on-trade and off-trade) may differ from this general formdepending on the information available (see Appendix G).
Econometric estimates have been obtained with STATA. This software tool is standard ineconometric analysis. The method of estimation has been OLS. In those cases in which we havefound autocorrelation, the error term of the regression has been simultaneously modelled with time-series (ARIMA) techniques, in order to obtain white noise residuals.

The Brewers of EuropeImpact of tax changes
31
Appendix B. Econometric model of elasticities
On-trade
In order to estimate own- and cross-price elasticities of the demand of beer in the on-trade channel,we have used the following equation:
ttt
tt
ttt
gdponsoftp
onwineponspiritsp
offbeerponbeerponbeerq
)ln()__ln(
)__ln()__ln(
)__ln()__ln()__ln(
65
43
210
where:
q_beer_ont is the consumption of beer in the on-trade channel in period t.
p_beer_ont, p_spirits_ont, p_wine_ont and p_soft_ont are real prices of, respectively, beer, spirits,wine and soft drinks in the on-trade channel. These prices are selling prices to the final consumerand, in those cases in which the original data was on nominal terms, have been deflated by usingthe consumer price index (CPI).
p_beer_offt is the real price of beer in the off-trade channel.
gdpt is the real gross domestic product (GDP) in period t.
ln(.) and are defined as in Appendix A.
t is the error term of the regression.
k (for k = 1, 2, …) are the elasticities to be estimated.
Off-trade
The estimating equation for off-trade beer is the following
ttt
tt
ttt
gdpoffsoftp
offwinepoffspiritsp
onbeerpoffbeerpoffbeerq
)ln()__ln(
)__ln()__ln(
)__ln()__ln()__ln(
65
43
210
where:
q_beer_offt is the consumption of beer in the off-trade channel in period t.
p_beer_offt, p_spirits_offt, p_wine_offt and p_soft_offt are real prices of, respectively, beer, spirits,wine and soft drinks in the off-trade channel.
p_beer_ont is the real price of beer in the on-trade channel.
gdpt is the real GDP in period t.
ln(.) and are defined as in Appendix A.
t is the error term of the regression.
k (for k = 1, 2, …) are the elasticities to be estimated.

The Brewers of EuropeImpact of tax changes
32
The specification of the model used to estimate elasticities in the different countries and channelsmay differ from this general forms depending on the information available (see Appendix H).
Econometric estimates have been obtained with STATA, a software tool that is standard ineconometric analysis.
The method of estimation has been in first instance OLS. We checked for endogeneity in theresults of OLS estimates by using the Durwin-Wu-Hausman test. In those cases in which evidenceof endogeneity was found, we used the instrumental variables (two stage least squares or 2SLS)estimator. In the presence of autocorrelation, the error term has been modelled with ARIMAtechniques, in order to obtain white noise residuals.

The Brewers of EuropeImpact of tax changes
33
Appendix C. Relationship between employment andconsumption
Table C-1 Results of regression: logarithm of direct employment v. consumption
dependent variable:
log(direct employment)
estimated coefficients
(p-value)
Constant 3.0249661
(0.0001)
log(consumption) 0.7673827
(0.0000)
# observations 19
R-squared 0.8393
Source: PwC estimates.
Table C-2 Results of regression: logarithm of indirect employment v. consumption
dependent variable:
log(indirect employment)
estimated coefficients
(p-value)
Constant 4.2978690
(0.0000)
log(consumption) 0.9604581
(0.0000)
# observations 19
R-squared 0.8427
Source: PwC estimates.

The Brewers of EuropeImpact of tax changes
34
Appendix D. Analysis of impact on profitability
Our analysis of the impact on profitability is very much based on the results of the study undertakenby PwC for The Brewers of Europe into the cost of production of a number of alcoholic beverages,including beer. In particular, we have taken from the study estimates on total net revenues,operating margins, amortization and labour costs (as a percentage of net sales) for the beerindustry in each one of the seven countries considered in our analysis. Most of them are year 2007estimates.
From these estimates, we have calculated the average profit lost per litre of beer not sold.
Operating margin is the difference between revenue and total operating costs, including variableand fixed (non-avoidable) costs. The average loss of profit, as a percentage of net sales, istherefore calculated as the sum of the operating margin (revenue - variable costs - fixed costs) plusfixed costs.
We have considered that fixed costs comprise 100% of amortization costs and 23.3% of labourcosts. The percentage of labour costs regarded fixed is based on the results of the regressionanalysis detailed in subsection 2.4.1 above, which showed that a decrease of 1% in consumptionwould lead to a reduction of 0.767% in employment. This means that 23.3% of labour costs (1minus 0.767) do not vary with consumption and are fixed.
The profit loss per litre of beer not sold is calculated as the net revenue per litre of beer (ratiobetween net sales in EURO, and total consumption) multiplied by the percentage resulting from thesum of operating margin and fixed costs.
The impact on total industry profits has been estimated, for each of the countries covered in ourstudy, as the product between the total variation in consumption and the profit loss per litre of beernot sold.

The Brewers of EuropeImpact of tax changes
35
Appendix E. Impact on Government revenues
Table E-1 Analysis of impact on Government revenues: main assumptions
Personal income and SS (EURO).Country VAT rate Corporateincome rate direct empl. indirect empl.
Czech R. 19.0% 20.0% 6,361 5,541Finland 22.0% 26.0% 21,857 18,391France 19.6% 34.4% 32,654 16,094Germany 19.0% 29.8% 21,335 15,175Poland 22.0% 19.0% 22,933 4,169Spain 7.0% / 16.0%
(*)30.0% 20,158 9,205
UK 15.0% 28.0% 17,961 12,271
NOTES: (*) VAT rate of 7.0% applicable to sales of beer made in the on-trade channel. VAT rate of 16.0% applicable tosales of beer in the off-trade channel.Source: European Commission (VAT and corporate income rate), and The Brewers of Europe (based on estimates fromErnst & Young, personal income tax and social security contributions).
Table E-2 Calculation of the cost of unemployment benefits: main assumptions
Country Average duration ofunemployment (months)
(1)Average unemploymentbenefit (EURO/month)
Czech R. 21.9 201.08(2)
Finland 10.1 1,948.77(3)
France 13.8 1,623.12(4)
Germany 12.0 2,138.10(5)
Poland 16.5 160.72(6)
Spain 11.6 1,001.70(7)
UK 9.2 349.92
NOTES: (1) Average duration of unemployment along the period between 2005 and 2008. Figures for Czech Republic,Finland, France, Poland and Spain were obtained directly from the OECD. For Germany, we assumed an average durationof unemployment of 12 months since, depending on their particular situation, jobseekers in this country receive theunemployment benefit for a period of between 6 and 18 months. The unemployment benefit for the UK was estimated fromdata provided by the OCDE on number of jobseekers by duration of unemployment (less than 1 month, between 1 and 3months, etc.). From these data, we can only obtain a rough figure that underestimates the real duration of unemployment inthe UK; (2) The unemployment benefit in the Czech Republic has been estimated with data from the Czech Statistical Officeon total expenditure in unemployment social protection (CZK 18,559 million) and jobseekers for year 2006. We haveexcluded from the total number of jobseekers those whose economic status prior to seeking employment was retirement,maternity or parental leave or education or training (only 10% of these excluded). The resulting number of jobseekersreceiving unemployment subsidies in 2006 is 336,900 people. The unemployment benefit for 2008 has been estimated byapplying the inflation rate for years 2007 and 2008 (2.8% and 6.3% respectively) to the unemployment benefit calculated for2006. Original figures in national currency have been converted into EURO by using a 24.946 CZK/EURO exchange rate;(3) The unemployment benefit in Finland has been calculated from data on total benefits (EURO 2,206.4 million) andrecipients (94,350) in 2008 provided by The Social Insurance Institution of Finland (KELA); (4) In France, jobseekers receive75% of their gross salary (EURO 25,070 per capita and year in 2008, according to Eurostat); (5) According to The Office ofRetirement and Disability Office, the unemployment benefit in Germany amounts to 60% of net earnings (people withoutchildren). Noncontributory unemployment benefit amounts to EURO 347 per month. In our calculations, we have assumedan average 2008 gross salary of EURO 35,822 per year (source: Eurostat); (6) The unemployment benefit in Polandamounts to PLN 575 per month, and is perceived for a maximum of 12 months, according to the Polish Ministry for Labourand Social Policy. The Government also pays the contribution to the Social Security (25.52% of this amount) for the wholeof the period of unemployment. The figure in the Table is a monthly average assuming a duration of unemployment of 16.52months. Original figures in PLN were converted into EURO by using a 3.5125 PLN/EURO exchange rate; (7) Averageunemployment benefit in August 2009 according to the Spanish Ministerio de Trabajo e Inmigración; (8) We have assumedan unemployment allowance of GBP 64.30 per week (15% of average weekly salary). Additional subsidies from tax ormortgage interest reliefs, or housing benefits have not been considered in the analysis. Original figures in national currencyhave been converted into EURO by using a 0.79628 GBP/EURO exchange rate.Source: OECD, Czech Statistical Office, KELA, The Office of Retirement and Disability Policy, Ministry of Labour and SocialPolicy, Ministerio de Trabajo e Inmigración and Eurostat.

The Brewers of EuropeImpact of tax changes
36
Appendix F. Selection of countries: methodology
Initial set of countries
We have considered an initial set comprising the following 20 EU countries:
Table F-1 Initial set of countries considered in the cluster analysis
Austria Greece Romania Belgium Hungary Slovakia Czech Republic Ireland Slovenia Denmark Italy Spain Finland Netherlands Sweden France Poland UK Germany Portugal
Source: Datamonitor.
These are the EU countries for which Datamonitor provides information on sales of beer (in volumeand value). For most of these countries, Datamonitor also provides data on sales of other threedrink categories considered relevant in our study, in particular of wine, spirits and soft drinks.
No comparable information has been found for the remaining seven EU Member States (Bulgaria,Cyprus, Estonia, Latvia, Lithuania, Luxembourg and Malta). According to the information providedby The Brewers of Europe (based on estimates from Ernst & Young) these seven countriesrepresent 3.0% of total beer consumption in the EU.
Introduction to cluster analysis
Cluster analysis is a standard statistical technique that objectively groups individual observations(countries) into clusters that can be regarded homogeneous according to a number ofcharacteristics or variables.
The “distance” between observations is calculated by averaging their differences in terms of eachone of the characteristics or variables.
In an iterative process, the cluster analysis groups together the observations that are closest (ordiffer less), as illustrated below.
23
Figure F-1 Illustration of the iterative process for the definition of clusters
Country 1
Country 2
“Distance” between countries Iterative process
Beer price (€/l.) On-trade sales (%)
3.10
3.00
55.00
45.00
Difference 1-2 0.10 10.0+
= 10.10Overall distance 1-2
Country 2
Country 1
Country 3
Cluster A
Country 4
Country 5Cluster B
Cluster C
distancecountries 1-2
distancecountries 4-5
distance country 3 -cluster A
distance
Country 1
Country 2
“Distance” between countries Iterative process
Beer price (€/l.) On-trade sales (%)
3.10
3.00
55.00
45.00
Difference 1-2 0.10 10.0+
= 10.10Overall distance 1-2
Country 2
Country 1
Country 3
Cluster A
Country 4
Country 5Cluster B
Cluster C
distancecountries 1-2
distancecountries 4-5
distance country 3 -cluster A
distance
Source: PwC analysis.
List of variables considered
We have considered a basic set with the following variables:
23For illustration purposes only. In our analysis, distance between countries has been measured in terms of
the normalized Euclidean distance. Distance with respect to a particular cluster has been measured withrespect to the cluster average.
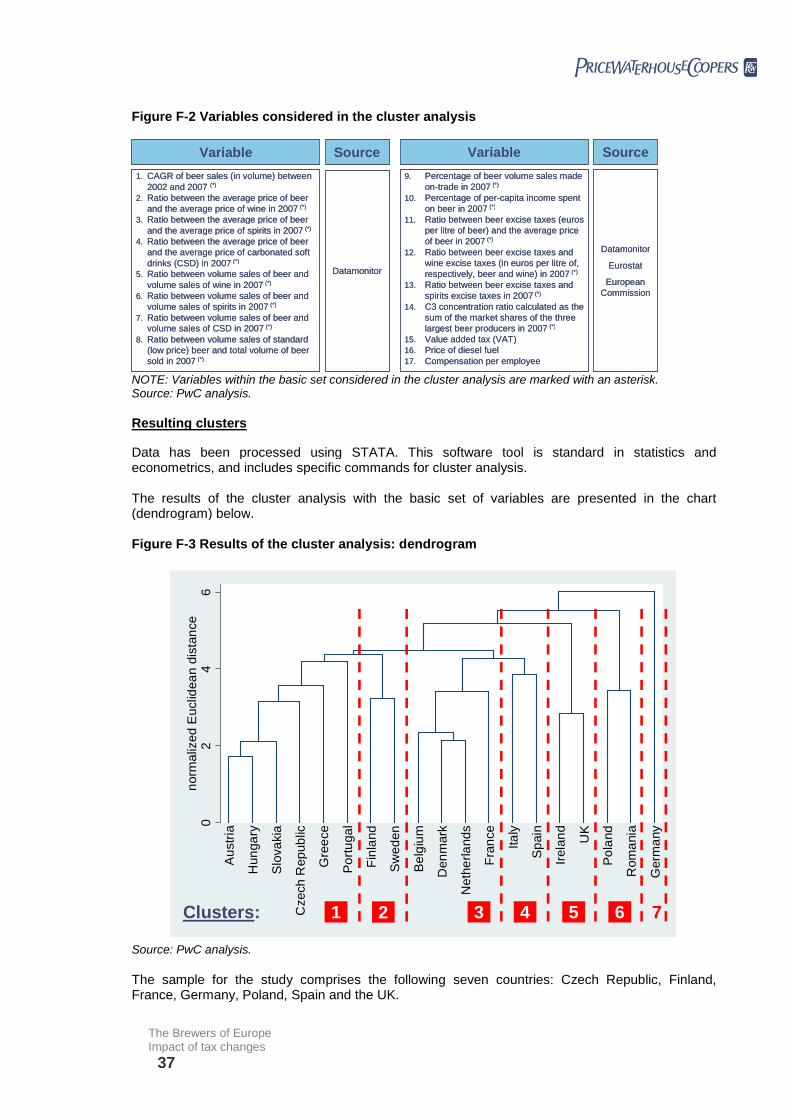
The Brewers of EuropeImpact of tax changes
37
Figure F-2 Variables considered in the cluster analysis
Variable Source Variable Source
1. CAGR of beer sales (in volume) between2002 and 2007 (*)
2. Ratio between the average price of beerand the average price of wine in 2007 (*)
3. Ratio between the average price of beerand the average price of spirits in 2007 (*)
4. Ratio between the average price of beerand the average price of carbonated softdrinks (CSD) in 2007 (*)
5. Ratio between volume sales of beer andvolume sales of wine in 2007 (*)
6. Ratio between volume sales of beer andvolume sales of spirits in 2007 (*)
7. Ratio between volume sales of beer andvolume sales of CSD in 2007 (*)
8. Ratio between volume sales of standard(low price) beer and total volume of beersold in 2007 (*)
9. Percentage of beer volume sales madeon-trade in 2007 (*)
10. Percentage of per-capita income spenton beer in 2007 (*)
11. Ratio between beer excise taxes (eurosper litre of beer) and the average priceof beer in 2007 (*)
12. Ratio between beer excise taxes andwine excise taxes (in euros per litre of,respectively, beer and wine) in 2007 (*)
13. Ratio between beer excise taxes andspirits excise taxes in 2007 (*)
14. C3 concentration ratio calculated as thesum of the market shares of the threelargest beer producers in 2007 (*)
15. Value added tax (VAT)16. Price of diesel fuel17. Compensation per employee
Datamonitor
Datamonitor
Eurostat
EuropeanCommission
NOTE: Variables within the basic set considered in the cluster analysis are marked with an asterisk.Source: PwC analysis.
Resulting clusters
Data has been processed using STATA. This software tool is standard in statistics andeconometrics, and includes specific commands for cluster analysis.
The results of the cluster analysis with the basic set of variables are presented in the chart(dendrogram) below.
Figure F-3 Results of the cluster analysis: dendrogram
02
46
norm
aliz
ed
Euclid
ea
ndis
tan
ce
Au
str
ia
Hun
ga
ry
Slo
va
kia
Czech
Rep
ub
lic
Gre
ece
Po
rtu
ga
l
Fin
land
Sw
ed
en
Be
lgiu
m
Den
mark
Neth
erla
nd
s
Fra
nce
Ita
ly
Sp
ain
Irela
nd
UK
Po
land
Rom
ania
Germ
any
Clusters: 1 3 4 5 6 72
02
46
norm
aliz
ed
Euclid
ea
ndis
tan
ce
Au
str
ia
Hun
ga
ry
Slo
va
kia
Czech
Rep
ub
lic
Gre
ece
Po
rtu
ga
l
Fin
land
Sw
ed
en
Be
lgiu
m
Den
mark
Neth
erla
nd
s
Fra
nce
Ita
ly
Sp
ain
Irela
nd
UK
Po
land
Rom
ania
Germ
any
Clusters: 1 3 4 5 6 72
Source: PwC analysis.
The sample for the study comprises the following seven countries: Czech Republic, Finland,France, Germany, Poland, Spain and the UK.

The Brewers of EuropeImpact of tax changes
38
The countries listed above represent more than 70% of total beer sold in the initial set of 20 EUcountries considered (source:Datamonitor).
The country selected as representative from each cluster has almost consistently been that withthe higher volume of beer sold.
The only exception is Finland. Beer consumption in this country is only slightly lower than in theother country within its cluster, Sweden. It was included in the sample according to its specificcharacteristics in terms of location, excise taxes and availability of information.
We have conducted sensitivity analyses to check the robustness of the results of the clusteranalysis to variations in the set of variables considered. The results are very robust in that theCzech Republic, Germany, Poland, Spain and the UK have to be included in the sample ofcountries for the study.

The Brewers of EuropeImpact of tax changes
39
Appendix G. Estimated levels of pass-through
UK results
The pass-through models for the on-trade and off-trade channels have been estimated withmonthly data from January 2005 to March 2009.
Data on prices have been provided by Nielsen. Data on excise tax rates are from the BritishGovernment (HM Revenue and Customs).
The source of the indexes used as proxies for production costs is the UK Office for NationalStatistics. In particular, we have used the following cost indexes to estimate the level of pass-through in the on-trade channel:
p_materials is an index of prices of raw materials and fuels purchased in the food, beveragesand tobacco industry in the UK.
w_beverages is an index of the evolution of wages in the food, beverages and tobacco industryin the UK.
w_horeca is an index of the evolution of wages in the hospitality sector in the UK.
The model includes five variables to model the changes introduced in the beer excise tax levelalong the period considered in the analysis. These changes occurred on 20 March 2005 (from50.36 £/Hl to 51.68 £/Hl), 26 March 2006 (53.04 £/Hl), 26 March 2007 (54.84 £/Hl), 17 March 2008(59.84 £/Hl) and 1 December 2008 (64.60 £/Hl).
24
In order to account for the impact of these changes on final prices, we have defined the dummiesvariables d_exciseJt (for J = 1, 2, 3, 4, 5), which take the value 1 in the periods after theintroduction of the Jth change in the excise level (and 0 in the periods before the change). In theprecise month where the Jth change was made, the variable d_exciseJt takes a value which isequal to the percentage of days within the month in which the new tax rate was effectively applied.
The results of the regression for the on-trade channel are included in Table G-1.
The estimated coefficients for input price indexes have all the expected sign (positive), althoughonly the wages in the food, beverage and tobacco industry has been found statistically significantat the 15% confidence level (p-value lower than 0.15). This can be due to the high level ofaggregation of these indexes, obtained from public sources.
The first three changes in excise taxes had a positive and statistically significant impact on netprices (the coefficients are positive, and their p-values are lower than 0.10).
25This means that
these tax changes were more than passed-through into on-trade prices. The fourth and fifth excisetax changes, occurred in 2008 (when economic conditions started to deteriorate) had, respectively,a null and negative and significant impact on net prices. This means that the fourth tax change wasfully passed-through into prices, whereas the fifth was passed-through only in part.
244% alcohol by volume.
25The p-value reported in the Table indicates whether the estimated coefficients can be regarded statistically
different from zero at a certain confidence level. A p-value lower than 0.01 indicates that the coefficient isstatistically significant at the 1% confidence level, a p-value lower than 0.05 indicates that it is significant at the5% level, and so on. The standard confidence levels are 1%, 5% and 10%. A p-value higher than 0.10indicates that the coefficient is not statistically different from 0.

The Brewers of EuropeImpact of tax changes
40
Table G-1 Pass-through equation for on-trade beer in the UK
dependent variable:12ln(net_price_on)
estimated coefficients(p-value)
Constant 0.0154209(0.092)
12ln(p_materials) 0.0528591(0.322)
12ln(w_beverages) 0.324727(0.106)
12ln(w_horeca) 0.0395023(0.462)
12d_excise1 0.0254151(0.008)
12d_excise2 0.0208944(0.013)
12d_excise3 0.0197697(0.017)
12d_excise4 0.013244(0.157)
12d_excise5 -0.0194403(0.000)
# observations 38
Source: PwC estimates.
The estimated parameters for the excise changes imply an average elasticity of 0.42035, accordingto the calculations included in Table G-2. This means that a 1% increase in the excise level makesthe net price increase by 0.42035%
Table G-2 Elasticity of net price to excise in the on-trade channel in the UK
Changesin excise
DateFormerexcise(£/Hl)
Newexcise(£/Hl)
%Excise
Estimatedparameter
Impliedelasticity
d_excise1 20/03/2005 50.36 51.68 2.62% 0.0254151 0.96962
d_excise2 26/03/2006 51.68 53.04 2.63% 0.0208944 0.79399
d_excise3 26/03/2007 53.04 54.84 3.39% 0.0197697 0.58255
d_excise4 17/03/2008 54.84 59.84 9.12% not significant 0.00000
d_excise5 01/12/2008 59.84 64.60 7.95% -0.0194403 -0.24439
AVERAGE ELASTICITY 0.42035
Source: PwC estimates.
The result of the estimation for the off-trade channel is included in Table G-3.

The Brewers of EuropeImpact of tax changes
41
Table G-3 Pass-through equation for off-trade beer in the UK
dependent variable:12ln(net_price_off)
estimated coefficients(p-value)
Constant 0.0388311(0.280)
12d_excise1 -0.0494082(0.679)
12d_excise2 -0.055087(0.142)
12d_excise3 -0.0733316(0.035)
12d_excise4 -0.0496844(0.150)
12d_excise5 0.0553964(0.008)
# observations 38
Source: PwC estimates.
The estimated parameters imply an overall elasticity of -0.29289, as shown in Table G-4.
Table G-4 Elasticity of net price to excise in the off-trade channel in the UK
Changesin excise
DateFormerexcise(£/Hl)
Newexcise(£/Hl)
%Excise
Estimatedparameter
Impliedelasticity
d_excise1 20/03/2005 50.36 51.68 2.62% not significant 0.00000
d_excise2 26/03/2006 51.68 53.04 2.63% not significant 0.00000
d_excise3 26/03/2007 53.04 54.84 3.39% -0.0733316 -2.16084
d_excise4 17/03/2008 54.84 59.84 9.12% not significant 0.00000
d_excise5 01/12/2008 59.84 64.60 7.95% 0.0553964 0.69641
AVERAGE ELASTICITY -0.29289
Source: PwC estimates.
Spain results
Pass-through models for the on-trade and off-trade channels have been estimated with bi-monthlydata from December 1998 to March 2009.
Data on prices has been provided by Nielsen. Data on evolution of excise tax rates has beenprovided by The Brewers of Europe.
Excise tax changes have been modelled, as in the UK, with dummy variables which take the value0 before the tax variation, and 0 afterwards.
Table G-5 shows the results of the regression for the on-trade channel. The impact on net on-tradeprices of the tax changes occurred along the period considered in the regression is found to bepositive and statistically significant.

The Brewers of EuropeImpact of tax changes
42
Table G-5 Pass-through equation for on-trade beer in Spain
dependent variable:ln(net_price_on)
estimated coefficients(p-value)
Constant 1.309632(0.000)
d_excise1 0.008012(0.058)
d_excise2 0.0111837(0.000)
# observations 61
NOTES: In this regression, we included a dummy variable to account for asignificant increase in prices occurred in October 2004. This variable takes value 0before October 2004, and 1 afterwards. We also included seasonal dummyvariables in the regression. The estimated coefficients for these variables were notstatistically significant.Source: PwC estimates.
Table G-6 shows the calculation of the implied elasticity for the on-trade channel.
Table G-6 Elasticity of net price to excise in the on-trade channel in Spain
Changesin excise
DateFormerexcise(€/Hl)
Newexcise(€/Hl)
%Excise
Estimatedparameter
Impliedelasticity
d_excise1 01/01/2002 8.38 8.87 5.85% 0.008012 0.13702
d_excise2 16/09/2005 8.87 9.96 12.29% 0.0111837 0.09101
AVERAGE ELASTICITY 0.11402
Source: PwC estimates.
The impact of excise tax changes on net off-trade prices was not found to be statistically significantat any confidence level. The pass-through elasticity used for the analysis of impact in the off-tradechannel is therefore equal to zero.
Poland results
In the case of Poland, data on prices is only available for the off-trade channel.
The pass-through model for the off-trade channel has been estimated with monthly data fromJanuary 2000 to March 2009.
Data on prices has been provided by Nielsen. The following cost variables were included in theregressions:
p_barley is the price of barley (Canadian No. 1 Western barley) in international commoditymarkets according to the International Monetary Fund.
wages is the evolution of earnings per month in non-agricultural activities in Poland accordingto the International Labour Organization.
There has been only one tax change along the period for which data on prices and the remainingvariables are available (in March 2009, when the excise tax rate was increased from PLN 6.86 to7.79 per Plato degree). The impact of this tax change on net prices is not found to be statisticallysignificant. We have therefore assumed a pass-through elasticity of zero for the analysis of impact.
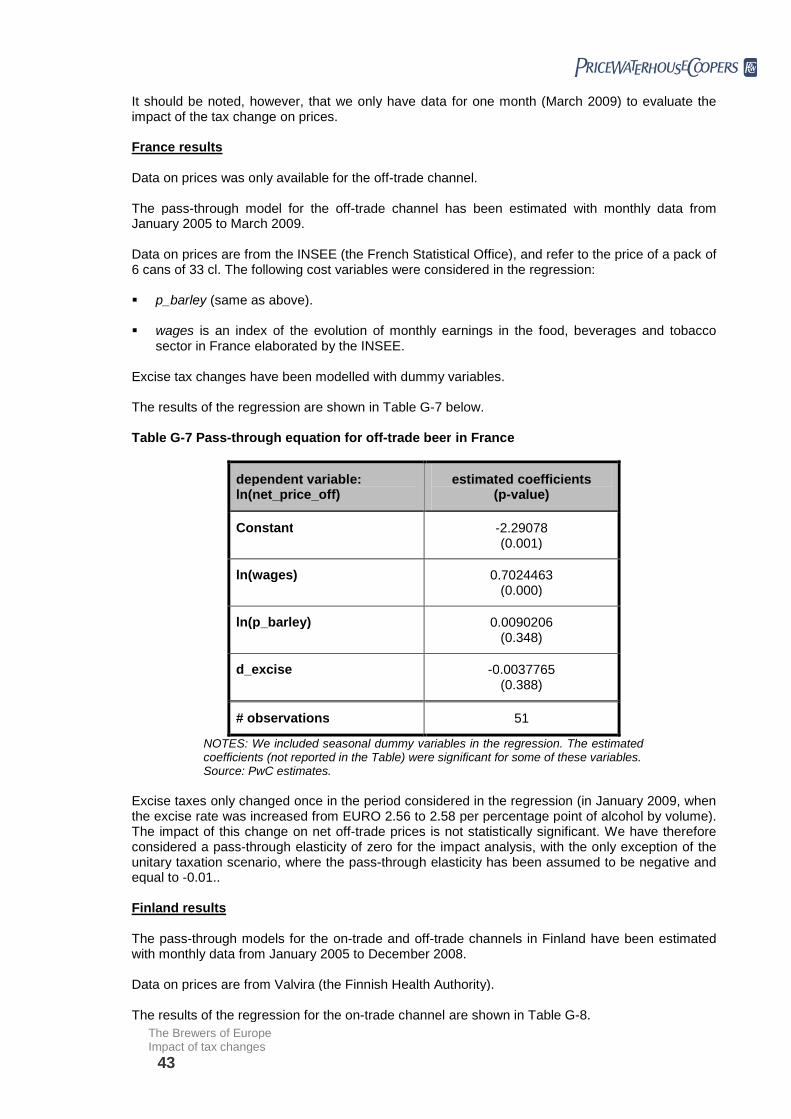
The Brewers of EuropeImpact of tax changes
43
It should be noted, however, that we only have data for one month (March 2009) to evaluate theimpact of the tax change on prices.
France results
Data on prices was only available for the off-trade channel.
The pass-through model for the off-trade channel has been estimated with monthly data fromJanuary 2005 to March 2009.
Data on prices are from the INSEE (the French Statistical Office), and refer to the price of a pack of6 cans of 33 cl. The following cost variables were considered in the regression:
p_barley (same as above).
wages is an index of the evolution of monthly earnings in the food, beverages and tobaccosector in France elaborated by the INSEE.
Excise tax changes have been modelled with dummy variables.
The results of the regression are shown in Table G-7 below.
Table G-7 Pass-through equation for off-trade beer in France
dependent variable:ln(net_price_off)
estimated coefficients(p-value)
Constant -2.29078(0.001)
ln(wages) 0.7024463(0.000)
ln(p_barley) 0.0090206(0.348)
d_excise -0.0037765(0.388)
# observations 51
NOTES: We included seasonal dummy variables in the regression. The estimatedcoefficients (not reported in the Table) were significant for some of these variables.Source: PwC estimates.
Excise taxes only changed once in the period considered in the regression (in January 2009, whenthe excise rate was increased from EURO 2.56 to 2.58 per percentage point of alcohol by volume).The impact of this change on net off-trade prices is not statistically significant. We have thereforeconsidered a pass-through elasticity of zero for the impact analysis, with the only exception of theunitary taxation scenario, where the pass-through elasticity has been assumed to be negative andequal to -0.01..
Finland results
The pass-through models for the on-trade and off-trade channels in Finland have been estimatedwith monthly data from January 2005 to December 2008.
Data on prices are from Valvira (the Finnish Health Authority).
The results of the regression for the on-trade channel are shown in Table G-8.

The Brewers of EuropeImpact of tax changes
44
Table G-8 Pass-through equation for on-trade beer in Finland
dependent variable:ln(net_price_on)
estimated coefficients(p-value)
Constant -0.9043797(0.066)
excise 0.2157843(0.036)
# observations 48
NOTES: We included seasonal dummy variables in the regression. The estimatedcoefficients (not reported in the Table) were significant for most of these variables.Source: PwC estimates.
The tax changes occurred along the period considered in the analysis had a positive and significantimpact on net prices. The estimated pass-through elasticity is 0.2157843.

The Brewers of EuropeImpact of tax changes
45
Appendix H. Estimated demand elasticities
UK results
The on-trade and off-trade models have been estimated with monthly data from February 2005 toDecember 2008.
Data on volume of beer sold and prices of beer, spirits and wine have been provided by Nielsen,and are split by distribution channel (on-trade and off-trade). In the regressions, we haveconsidered the price of the most popular type of spirit and wine in the UK, i.e., vodka and light wine.Original data on nominal prices have been converted into real prices by using the CPI provided bythe Office of National Statistics as deflator.
Data on the price of soft drinks has been taken from the Office for National Statistics and is for thewhole of the British market (on-trade plus off-trade).
Data on real GDP are quarterly and have been taken from the Office for National Statistics.
The results of the regression and the estimated elasticities for the on-trade channel are included inTable H-1.
Table H-1 Estimated elasticities for the on-trade beer demand in the UK
dependent variable:12ln(q_beer_on)
estimated coefficients(p-value)
constant -0.1074669(0.000)
12ln(p_beer_on) -1.267037(0.000)
12ln(p_beer_off) -0.2086386(0.359)
12ln(p_vodka_on) 0.6178926(0.069)
12ln(p_lightwine_on) 0.8636521(0.000)
12ln(p_soft) -0.1332371(0.541)
12ln(gdp) 1.165549(0.000)
# observations 35
Source: PwC estimates.
The estimated own-price elasticity in the on-trade channel is -1.27. The main substitutes for beerconsumed on-trade are light wine and vodka, with cross elasticities of 0.86 and 0.62, respectively.The coefficients of the price of off-trade beer and soft drinks have not been found to be significantlydifferent from zero, which means that they are not close substitutes for on-trade beer.

The Brewers of EuropeImpact of tax changes
46
The results of the regression for the off-trade channel are included in Table H-2. In this case, inorder to correct for endogeneity, we have used instrumental variables (2SLS) estimationtechniques.
26
Table H-2 Estimated elasticities for the off-trade beer demand in the UK
dependent variable:12ln(q_beer_off)
estimated coefficients(p-value)
constant 0.0146534(0.641)
12ln(p_beer_off) -1.146489(0.000)
12ln(p_beer_on) 0.647338(0.491)
12ln(p_vodka_off) -0.9397669(0.124)
12ln(p_lightwine_off) 0.7892149(0.414)
12ln(p_soft) -1.815358(0.152)
12ln(gdp) 0.2575445(0.700)
# observations 35
Source: PwC estimates.
The estimated own-price elasticity for off-trade beer is -1.15. The remaining drinks have not beenfound to be close substitutes for off-trade beer.
Spain results
Demand elasticities have been estimated with bi-monthly data from December 2004 to March 2009.Prior to December 2004, there were data available on beer sales and prices, but not for other drinkcategories (spirits, vodka and soft drinks).
Data on volume of beer sold and prices of beer, spirits, wine and soft drinks have been provided byNielsen. Original data on nominal prices have been converted into real prices by using the CPIprovided by the Instituto Nacional de Estadística (Spanish Statistics Office) as deflator. Real GDPdata are quarterly and have been taken from the Spanish Statistics Office.
The results of the regression for the on-trade channel are reported in Table H-3 below. Theelasticity of the demand for beer on-trade with respect to its own price is found to be negative,statistically significant and equal to -0.90.
The price of the remaining drinks considered in the regression has not a significant effect on theconsumption of beer on-trade.
26Input prices and excise dummy variables have been employed as instruments.

The Brewers of EuropeImpact of tax changes
47
Table H-3 Estimated elasticities for the on-trade beer demand in Spain
dependent variable:ln(q_beer_on)
estimated coefficients(p-value)
constant 7.116279(0.015)
ln(p_beer_on) -0.9045412(0.081)
ln(p_beer_off) 0.2353813(0.720)
ln(p_still wine_on) -0.2801977(0.838)
ln(p_spirits_on) 1.042375(0.463)
ln(gdp) 0.6353788(0.034)
# observations 24
NOTES: We included seasonal dummy variables in the regression. The estimatedcoefficients (not reported in the Table) were significant for some of these variables.Source: PwC estimates.
The results of the regression for the off-trade channel are shown in Table H-4 below. Theestimated elasticity of the demand for off-trade beer with respect to its own price is -0.83. The crosselasticity with respect to the price of whisky is positive and significant, which means that whisky is aviable substitute of beer in this channel. The coefficients for wine and soft drinks are also positiveand nearly significant (p-values of around 0.15).
Both the on-trade and off-trade demand equations have been estimated with instrumental variables(2SLS) techniques to correct endogeneity.
27
27Input price indexes (from the Instituto Nacional de Estadística) and excise dummy variables have been
employed as instruments.

The Brewers of EuropeImpact of tax changes
48
Table H-4 Estimated elasticities for the off-trade beer demand in Spain
dependent variable:ln(q_beer_off)
estimated coefficients(p-value)
constant 2.513648(0.036)
ln(p_beer_off) -0.8346004(0.096)
ln(p_beer_on) 0.1870708(0.317)
ln(p_still wine_off) 0.1987898(0.153)
ln(p_wine wod_off)(1)
-0.0618589(0.430)
ln(p_spark wine_off) -0.1035822(0.438)
ln(p_whisky_off) 0.8096024(0.007)
ln(p_carbonated soft_off) 0.3573772(0.146)
ln(gdp) 1.426924(0.000)
# observations 24
NOTES: (1) Wine wod stands for wine without denomination of origin. We includedseasonal dummies in the regression. The coefficients (not reported in the Table)were significant for most of these variables.Source: PwC estimates.
Poland results
Demand elasticities have been estimated with the data for the off-trade channel from January 2000to January 2009.
Data on volume of beer sold has been taken from the Central Statistical Office of Poland. Data onoff-trade prices have been provided by Nielsen. Nominal prices have been deflated by using theCPI provided by the Central Statistical Office. Data on real GDP are quarterly and have beenobtained from Eurostat.
The estimated elasticities are reported in Table H-5 below. The own-price elasticity is negative,statistically significant and equal to -1.49. The estimated coefficient for the price of wine is almostsignificant at the 10% confidence level, which means that wine could be a substitute for beer in thePolish market.

The Brewers of EuropeImpact of tax changes
49
Table H-5 Estimated elasticities for the off-trade beer demand in Poland
dependent variable:ln(q_beer)
estimated coefficients(p-value)
constant 9.254841(0.004)
ln(p_beer_off) -1.490342(0.004)
ln(p_vodka_on) -0.0015416(0.990)
ln(p_wine_on) 0.6741848(0.103)
ln(gdp) 0.4688499(0.041)
# observations 109
NOTES: We included seasonal dummy variables in the regression. The estimatedcoefficients (not reported in the Table) were significant for most of these variables.Source: PwC estimates.
Germany results
The elasticity of demand has been estimated with data for the total market (on-trade plus off-trade)from the first quarter of 2005 to the first quarter of 2009. These data have been provided by Nielsenand the German Statistics Office (Statistisches Bundesamt). Original data on nominal prices havebeen deflated by using the CPI provided by this source. Real GDP has been obtained fromEurostat.
The results of the regression are included in Table H-6 below.
Table H-6 Estimated elasticity for the beer demand in Germany
dependent variable:ln(q_beer)
estimated coefficients(p-value)
constant -13.1289(0.000)
ln(p_beer) -0.5679822(0.000)
ln(gdp) 1.225293(0.000)
# observations 109
NOTES: We included seasonal dummy variables in the regression. The estimatedcoefficients (not reported in the Table) were significant for all of these variables.We also included a linear trend. The coefficient for this trend was found to benegative and statistically significant.Source: PwC estimates.

The Brewers of EuropeImpact of tax changes
50
France results
The elasticity of demand has been estimated with monthly data for the off-trade channel fromJanuary 2005 to March 2009.
Data on volume of beer sold have been provided by the French Brewers Association (Brasseurs deFrance). Data on off-trade prices have been taken from the French Statistics Office (INSEE). RealGDP data have also been obtained from INSEE.
The results of the regression are reported in Table H-7 below. The own-price elasticity is found tobe negative, statistically significant and equal to -1.35. For the unitary taxation scenario, we haveassumed a reduction of 30% with respect to the estimated elasticity.
Table H-7 Estimated elasticity for the off-trade beer demand in France
dependent variable:12ln(q_beer)
estimated coefficients(p-value)
constant -0.0071364(0.567)
12ln(p_beer_off) -1.352153(0.099)
12ln(gdp) 0.6705251(0.643)
# observations 39
NOTES: We included yearly dummies in the regression. The estimated coefficients(not reported in the Table) were significant for one of these variables.Source: PwC estimates.
Finland results
Demand elasticities have been estimated with yearly data for the whole market (on-trade plus off-trade) from 1991 to 2007.
Data on volume of beer sold and prices of beer and other drinks have been obtained from Valvira.Data on real GDP and an index of the cost of living (used as deflator to calculate real prices) havebeen taken from Eurostat and Statistics Finland.
The results of the regression are presented in the Table below. The estimated own-price elasticityof the demand for beer is equal to -0.76. The estimated cross elasticity with respect to the price ofvodka is positive and statistically significant, which means that vodka is a substitute for beer inFinland.

The Brewers of EuropeImpact of tax changes
51
Table H-8 Estimated elasticities for the beer demand in Finland
dependent variable:ln(q_beer)
estimated coefficients(p-value)
constant 0.0002488(0.567)
ln(p_beer) -0.7646451(0.024)
ln(p_vodka) 0.2005673(0.005)
ln(p_fortified wine) -0.1271283(0.716)
ln(p_other wine) -0.0459078(0.894)
ln(p_cider) 0.0500467(0.419)
ln(gdp) -0.0634532(0.899)
# observations 17
Source: PwC estimates.
Czech Republic results
The elasticity of demand has been estimated with monthly data for the off-trade channel from July2006 to March 2009.
Data on volume of beer sold and prices have been provided by market research company IRI. Dataon real GDP and CPI (used as a deflator to calculate real prices) have been obtained from Eurostat.The results of the regression are reported in the Table below.
Table H-9 Estimated elasticity for the off-trade beer demand in the Czech Republic
dependent variable:12ln(q_beer_off)
estimated coefficients(p-value)
constant 0.0441981(0.317)
12ln(p_beer_off) -1.143961(0.015)
12ln(gdp) 0.7842367(0.502)
# observations 21
Source: PwC estimates.

The Brewers of EuropeImpact of tax changes
52
The estimated own-price elasticity of demand is equal to -1.14. Instrumental variables (2SLS)estimation techniques have been used to correct endogeneity.
28
28Input price indexes (from the Czech Statistical Office) have been employed as instruments.

The Brewers of EuropeImpact of tax changes
53
Appendix I. Current level of excise tax rates
Table I-1 Current level of excise tax rates in the countries considered in the study
Country Current excise tax rate(per hectolitre of beer)
Exchange rate(national currency / EURO)
Czech R. CZK 24.00 / Plato degree 24.9460 CZK/EUROFinland EURO 25.96 / 1% of abv -France EURO 2.64 / 1% of abv -Germany EURO 0.79 / Plato degree -Poland PLN 7.79 / Plato degree 3.5121 PLN/EUROSpain EURO 9.96 -UK GBP 16.47 / 1% of abv 0.79628 GBP/EURO
NOTE: Exchange rates are 2008 averages.Source: European Commission, HM Revenue and Customs.


Chapter II
Comparable cost analysis

Index
1. Key findings..................................................................................... 592. Study scope & methodology.......................................................... 62
2.1 Objective of the study ......................................................................... 622.2 Scope of the study .............................................................................. 622.3 Methodology ....................................................................................... 62
3. European Union overall results ..................................................... 673.1 Foreword............................................................................................. 673.2 The value chain within the alcoholic beverages industry .................... 673.3 Comparable cost of production for Beer, Wine and Spirits ................. 723.4 Comparable cost per litre pure alcohol ............................................... 743.5 Impact of taxation ............................................................................... 763.6 Retail price per category of drink per litre pure alcohol....................... 793.7 The tax contribution by the alcoholic beverage sector is significant.... 80
Appendix A – List of companies as representative sample ................... 82Appendix B – Comparable cost model ..................................................... 85Appendix C – Data Source......................................................................... 87Appendix D – Exchange Rates .................................................................. 90

List of Charts
CHART 1: NET MARGINS PER ACTIVITY IN THE EUROPEAN UNION ......................................... 68CHART 2: EU VOLUMES IN M’S LFP VS. MARGINS IN € M ...................................................... 69CHART 3: NET MARGINS IN RETAIL SALES (ON-TRADE & OFF-TRADE) EUROPEAN UNION ...... 70CHART 4: CONTRIBUTION TO THE ON-TRADE ...................................................................... 70CHART 5: 2007 SALES VOLUMES PER DRINK CATEGORY ON AND OFF TRADE ........................ 71CHART 6: 2007 SALES VALUES PER DRINK CATEGORY ON AND OFF TRADE ........................... 71CHART 7: TOTAL MANUFACTURERS COSTS (€ BN) IN 2007 ................................................... 72CHART 8: COMPARISON OF DIRECT EMPLOYMENT ............................................................... 73CHART 9: INDIRECT EMPLOYMENT...................................................................................... 73CHART 10: DISTRIBUTION COSTS ....................................................................................... 74CHART 11: COMPARABLE COST PER ................................................................................... 75CHART 12: COMPARABLE COST PER ................................................................................... 75CHART 13: BREWERS COSTS ............................................................................................. 76CHART 14: WINE MANUFACTURERS COSTS......................................................................... 76CHART 15: SPIRITS MANUFACTURERS COSTS ..................................................................... 76CHART 16: COMPARABLE COST PER LPA INCLUDING EXCISE TAX ........................................ 77CHART 17: WEIGHTED RETAIL PRICE ON & OFF-TRADE €/LFP .............................................. 78CHART 18: AVERAGE RETAIL PRICE OF DRINKS IN TERMS OF LITRE OF PURE ALCOHOL .......... 79CHART 19: TAX CONTRIBUTION BY THE ALCOHOLIC BEVERAGE SECTOR WITHIN THE EU......... 80

The Brewers of EuropeComparable Cost analysis for the European alcoholic beverage sector
4
1
Key findings

The Brewers of EuropeComparable cost analysis
59
1. Key findings
The alcohol beverage sector is a significant industry within the European Union
The alcoholic beverage sector in the European Union in 2007 was worth €242.5bn in termsof sales
1. Of this number, sales of beer in absolute terms accounts for the highest
proportion by value €111.5bn or 46.0%.
However, margins are low
Spirits was the most profitable drink category achieving an aggregated net margin per litreof finished product of €1.90 across the value chain. Wine achieves €0.63, with beerachieving just €0.35 across the value chain. However, due to the high volumes sold, beercontributes 50% (€13bn) of the total margin achieved across the value chain (€26bn).
Across the value chain most of the margin is enjoyed in the on-trade
o 79% (€20.5bn) of total margins in 2007 were achieved in the on trade. This illustrates theessential contribution of the different alcohol categories to the sustainability of many bars,clubs, hotels and restaurants, with the significant employment this generates. Over half ofthis margin (€11.0bn) was generated by beer sales.
The alcohol beverage sector generated approximately 4.7m jobs, most of them indirectjobs in the on-trade
Of the 4.4m indirect jobs generated by the alcoholic beverages sector, approximately half(2.25m jobs) were employed in the on trade mainly in bars, clubs, restaurants and hotelsand 80% of which were generated by the beer sector.
Only 10% of the total margin was enjoyed by alcohol producers
Of the total margin of €2.5bn enjoyed at the manufacturing stage in 2007, approximately45% (€1.12bn) was achieved by spirit producers. Brewers achieved a margin ofapproximately €0.97bn, whilst wine producers achieved just €0.42bn.
However, wine producers received in 2007 direct subsidies totaling €0.51bn2
(reaching€1.2bn in 2009). No such subsidies were provided to either spirits or beer producers.
Beer is the most expensive form of alcohol to produce: €45.2 per litre of pure alcohol
The cost of producing a litre of spirits (in terms of finished product) was 3.5 times higher in2007 than for a litre of wine or beer.
However when converted to pure alcohol, wine is the cheapest form of alcohol to produce€17.9, similar to spirits (€18.6), and two and a half times less the cost of producing a litre ofpure alcohol in beer €45.2.
1Sales do not include either VAT or Excise Tax
2See details on http://europa.eu/rapid/pressReleasesAction.do?reference=IP/07/1654 and
http://europa.eu/rapid/pressReleasesAction.do?reference=IP/09/1214&format=HTML&aged=0&language=EN&guiLanguage=en

The Brewers of EuropeComparable cost analysis
60
Adding excise taxes, beer is still the most expensive form of alcohol to produce anddeliver to the consumer
Although the average rate of excise tax on spirits was higher than that of beer and wine,the difference was not enough to offset the additional costs of producing and deliveringbeer to the consumer.
The average retail price (including taxes) of a litre of alcohol in beer is €84 compared to€77 for wine and €65 for spirits.
Any move towards taxing all drinks based solely on alcohol content (unitary taxation) wouldtherefore disadvantage beer further in terms of the cost of the product to the consumer.
The total tax contribution in 2007 of the alcoholic drinks sector was in excess of €158bn
Beer contributed the highest amount, €68.0bn, in taxes to Members States across theEuropean Union, in the form of indirect taxes (excise taxes and VAT) and via direct taxes(Personal Income Tax, Corporate Income Tax and Social Security Contributions). Spiritswere next, accounting for €51.4bn.
Wine accounted for the lowest amount (€39.4bn) but benefited from a reduced rate ofexcise in France and zero rate in 15 EU Member States, whilst beer and spirits weresubject to a positive rate of excise in all countries.

The Brewers of EuropeComparable cost analysis
61
2Study scope &methodology

The Brewers of EuropeComparable cost analysis
62
2. Study scope & methodology
2.1 Objective of the study
The purpose of this study was to undertake a detailed and comprehensive analysis of thecomparable costs of alcoholic beverages across the value chain. The objective was for PwC toproduce a report of key findings, which could then be used by The Brewers of Europe to furtherinform the debate around taxation of alcoholic beverages across the European Union.
2.2 Scope of the study
This report analyzes the differences in terms of costs and margins of each of the main parties inthe value chain and for each of the main categories of alcoholic beverages (beer, wine and spirits).
PwC has undertaken a comparable cost analysis in aselection of EU countries given their relevance according to acluster methodology. PwC has applied a mathematical clusteranalysis methodology that has resulted in a selection of sevenEuropean countries. Detailed individual analyses have beencarried out for the following 7 EU Member States:
Czech Republic, Finland, France, Germany, Poland, Spain, and United Kingdom.
This sample of countries is considered representative of thewhole of the EU. An overview of the cluster methodology isprovided below. A more detailed explanation and selection ofrepresentative countries is included in Appendix F of Chapter Iabove (on impact of tax changes).
2.3 Methodology
2.3.1 Sample of countries criteria
PwC’s methodology for the selection of the sample of countries for the study is aimed at ensuringthat countries are selected attending to criteria of representativeness, so as to facilitate theextrapolation of the results of the study to the whole of the European Union.
Broadly speaking, our methodologycomprises two major stages:
First, the set of countries initiallyconsidered as candidates for thesample are divided into 7 clusters ofcountries regarded as similar orhomogeneous
Second, one representative countryis selected from each cluster
Figure 1: Cluster Countriesas a result of our analysis
Figure 2: Countries selected from each cluster
Country Total volumes (*) Country Total volumes (*)
• Austria
• Hungary
• Slovakia
• Czech Republic
• Greece
• Portugal
870.70
771.10
368.20
1,572.90
446.50
647.30
cluster1:
• Belgium
• Netherlands
• Denmark
• Sweden
• Finland
953.00
1,297.50
427.10
469.50
450.10
cluster2:
• France
• Italy
• Spain
2,019.10
1,815.30
3,274.60
cluster3:
• Ireland
• United Kingdom
548.20
5,903.10
cluster4:
• Germany 9,253.40
cluster5:
• Poland
• Romania
3,486.40
1,954.10
cluster6:
(*) Beer in millions of litres

The Brewers of EuropeComparable cost analysis
63
2.3.2 Comparable cost main assumptions
Our analysis has been accomplished following two main director principles:
1. All our cost ratios across different activities in the value chain, for different industries andcountries, have been estimated based on publicly available financial statements on differentdatabases.
2. The cost components of the value chain selected for comparison were those that were readilyidentifiable in the abovementioned reports, in order to undertake a homogeneous comparisonbetween countries and industries.
2.3.3 Bottom-up methodology
We have followed a “bottom-up” methodology as the best option to determine the main figures andconclusions in our study. This has involved an analysis of the publicly available information tounderstand the costs implied in the manufacturing of the different alcoholic beverages, as well as inthe other activities such as supply, distribution and retail sales through on-trade and off-tradechannels
3. This bottom-up methodology has comprised the following steps:
Initial step
As a first approach to fully understand the costs involved across the value chain, we carried out areview of existing literature on the subject in order to analyze the value chain of an alcoholicbeverage. Accordingly, we defined and designed the value chain from supply of raw materials toretail sales in order to identify all relevant cost components in each activity.
Figure 3: Complete Value Chain of an alcoholic beverage
Supply:Raw
Materials,Packaging
ManufacturingProcess
Media &Marketing
Logistics,Distribution &
Post Sales
Retail Sales:On-tradeOff-trade
Consumer
Working Force• Employees ‘
Salary• Employees’
S.Security• Temporary
workers
MarketingExpenses
• Research• Copyeditor• Advertising
Campaigns
Other Expenses• Administration
Costs• Merchandising
and CommercialCosts
Taxes
• CorporateIncome Tax
Working Force• Employees‘
Salary• Employees’
S.Security• Temporary
workers
TransportVehicles
• Petrol• Depreciation• Insurance Policy• Maintenance
Taxes
• Corporate &PersonalIncome Tax
• HydrocarbonTax
• Excise Duty
Other Expenses
• SubcontractedServices
• AdministrationCosts
Working Force• Employees ‘
Salary• Employees’
S.Security• Temporary
workers
Beer• Beer Purchase
Taxes• Corporate &
PersonalIncome Tax
Other Expenses• Rent• Warehouse• Subcontracted
Services
• AdministrationCosts
Beer• Beer Paid at
Pointof Sales
Taxes• VAT
Working Force• Employees’
Salary• Employee s’
S.Security• Temporary
workers
Ingredients• Water• Barley• Malting• Yeast
• Hops• Others
Packaging
• Cans• Bottle• Barrel (5 L.)• On-trade
Barrel
Taxes• Corporate &
PersonalIncome Tax
Working Force• Employees’ Salary• Employees’
S.Security• Temporary
Workers
Plant Property &Equipment
• Maintenance• Depreciation• Energy Supply
Financial Expenses• On Trade
Investment• Depreciation
Taxes• Corp.&Personal
Income Tax
Other Expenses• Rent• Subcontracted
Services• Insurance Policy
• AdministrationCosts
3On-trade is the general term used to describe on premise sales, i.e. those sales through bars, restaurants, hotels clubs
and similar establishments. Off-trade is widely used to describe sales through retail establishments, shops, supermarkets,etc.
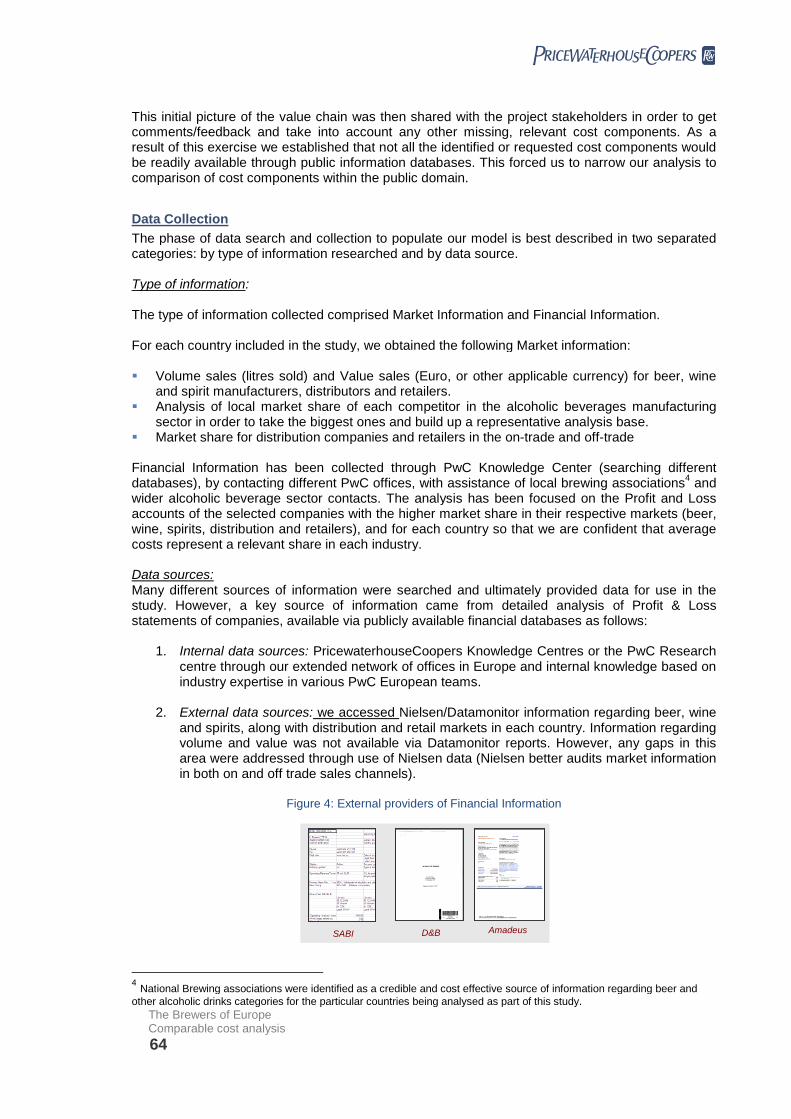
The Brewers of EuropeComparable cost analysis
64
This initial picture of the value chain was then shared with the project stakeholders in order to getcomments/feedback and take into account any other missing, relevant cost components. As aresult of this exercise we established that not all the identified or requested cost components wouldbe readily available through public information databases. This forced us to narrow our analysis tocomparison of cost components within the public domain.
Data Collection
The phase of data search and collection to populate our model is best described in two separatedcategories: by type of information researched and by data source.
Type of information:
The type of information collected comprised Market Information and Financial Information.
For each country included in the study, we obtained the following Market information:
Volume sales (litres sold) and Value sales (Euro, or other applicable currency) for beer, wineand spirit manufacturers, distributors and retailers.
Analysis of local market share of each competitor in the alcoholic beverages manufacturingsector in order to take the biggest ones and build up a representative analysis base.
Market share for distribution companies and retailers in the on-trade and off-trade
Financial Information has been collected through PwC Knowledge Center (searching differentdatabases), by contacting different PwC offices, with assistance of local brewing associations
4and
wider alcoholic beverage sector contacts. The analysis has been focused on the Profit and Lossaccounts of the selected companies with the higher market share in their respective markets (beer,wine, spirits, distribution and retailers), and for each country so that we are confident that averagecosts represent a relevant share in each industry.
Data sources:Many different sources of information were searched and ultimately provided data for use in thestudy. However, a key source of information came from detailed analysis of Profit & Lossstatements of companies, available via publicly available financial databases as follows:
1. Internal data sources: PricewaterhouseCoopers Knowledge Centres or the PwC Researchcentre through our extended network of offices in Europe and internal knowledge based onindustry expertise in various PwC European teams.
2. External data sources: we accessed Nielsen/Datamonitor information regarding beer, wineand spirits, along with distribution and retail markets in each country. Information regardingvolume and value was not available via Datamonitor reports. However, any gaps in thisarea were addressed through use of Nielsen data (Nielsen better audits market informationin both on and off trade sales channels).
Figure 4: External providers of Financial Information
D&B AmadeusSABI
4National Brewing associations were identified as a credible and cost effective source of information regarding beer and
other alcoholic drinks categories for the particular countries being analysed as part of this study.

The Brewers of EuropeComparable cost analysis
65
Figure 5: External SourcesFrom external data sources such as Nielsen or Datamonitor, weusually extracted the following kind of information:
Market volume and value for each Member State for three analyzedcategories of beer, wine and spirits.
Market share by company in terms of volume and value for eachMember State
Market share by channel (on and off trade routes), including volumeand value for each
We have also reviewed several market research documents, workingpapers and statistical handbooks from other sources –such asCanadean; academic papers from University or Beer/Wine/Spirits localassociations - to gain a better insight into local alcoholic beverageactivities in each country.
Amadeus and Dun & Bradstreet have been our prime financial information providers, although notall the companies originally selected -for which information was received- have been included inour final model due to incomplete information regarding homogeneous and comparable information.
We also obtained some other annual reports from company websites (where available),downloading full detailed information.
All the data above has been collected for beer, wine and spirits’ markets as well as distributors andretailers. A full list of data sources in included at Appendix C.
Validation of information
Finally, once we had analyzed, reviewed and validated the information, it was entered into thecomparable cost model
3. A full list of companies considered for the cost comparable analysis with
relevant information available is presented in Appendix A to this report.
From the Profit and Loss statements of representative companies, we analyzed the maximumdetail available in the 7 cluster countries and selected a final list of homogeneous comparablecosts across different countries considering the differences in reporting:
Total Net Revenues Packaging and Raw Material supplies Wages, salaries and other compensations Amortization and Depreciation Result from operating activities (EBIT) Net Income Number of employees
Comparable cost modeling
The information was then entered into our comparable cost model, full details of which are includedat Appendix B. The following represents the main findings of this analysis and modeling exercise.
3Companies for which there was no clear information or where information was not well enough broken-down were
discarded and the next company in its industry selected as the primary data source.
Datamonitor’s Reports

The Brewers of EuropeComparable cost analysis
66
3European Unionoverall results

The Brewers of EuropeComparable cost analysis
67
3. European Union overall results
3.1 Foreword
In this chapter, we share the main findings of our analysis of the value chain according to theoutput of our comparable cost model. Based on our understanding and know-how of the alcoholicbeverages sector we have identified three main activities across the value chain:
Manufacturing processes
Distribution and logistics
Retail sales
The value chain also comprises suppliers to the alcoholic beverages sector, mainly suppliers ofagricultural products and packaging. However, since these costs are implied within themanufacturing process, we have not focused our analysis on this part of the value chain, preferringinstead to limit our analysis to the above three activities and the companies operating in them.
For the purpose of our analysis, we have had to make a number of assumptions across all drinkscategories regarding the comparative cost of distribution and logistics as follows.
1. Distribution and logistics activities in the on-trade are generally not-owned bymanufacturers and outsourced to third party specialized service providers
4.
2. Manufacturers transport product for sale in the off-trade and include the cost of distributionand logistics within the price charged to retailers.
3. Transportation from the point of manufacture to distribution/logistics warehouses isarranged by manufacturers, rather than being outsourced.
Our analysis considered the two main routes to market for alcoholic beverages: sales in bars, clubs,hotels and restaurants (on-trade sales) and retail sales in shops, supermarkets, etc (off-tradesales).
The aggregated net margin concept described below is based on our model definition, along withthe information we have collected and analyzed as part of this study. This concept is intended todescribe the net margins achieved for all the different parties in the value chain and represents theremaining value of products, or services sold after deducting the costs incurred to carry out normalactivities, as reflected in the Profit and Loss account
In order to extract main figures and conclusions, we have followed a bottom-up methodologychosen as the best option in terms of public available information to understand the costs implied inthe manufacturing of the different alcoholic beverages as well as the other activities of supply,distribution and sales through on and off trade channels.
3.2 The value chain within the alcoholic beverages industry
The alcoholic drinks sector in the European Union is significant worth approximately €242.5bn5
in2007 with an estimated total net margin of €26.0bn.
Of the three main drinks categories beer makes the largest contribution in terms of the absolutevalue of sales €111.5bn, with a total net margin across the value chain of €13.1bn. Beer is avolume based business where margins in percentage terms are low (0.35€/L. across the valuechain).
4Reviewing different distribution yearbooks for European countries, it is fact that out of many beverage distribution
companies (this is a very fragmented business), very few of them are vertically integrated into alcoholic beveragesmanufacturing groups5
VAT and Excise Tax excluded in sales value

The Brewers of EuropeComparable cost analysis
68
Wine is next in terms of the value of sales (€86.8bn), with a total net margin across the value chainof €7.5bn. Wine margins in percentage terms are again comparatively low and in line with those forbeer (0.63€/L. across the value chain).
The value of spirits sales total €43.6bn, with a margin across the value chain worth €5.3bn, thelargest in percentage terms of the three alcoholic drink categories (1.90€/L.)..Chart 1 provides a further detailed breakdown by drink category and by activity within the supplychain
Chart 1: Net Margins per activity in the European Union
Manufacturing
BEER
DistributionRetail Sales
On & Off-trade
2.5 % 0.35
Sales do not include either VAT or Excise Tax
* Net Margin expressed in million Euros as a difference of net revenues minus total costs
5.5 % 17.7 %
WINE 2.6 % 0.633.8 % 10.9 %
SPIRITS 7.5 % 1.903.7 % 16.2 %
Net Margin /L.
Net Margin /L.
Net Margin /L.
971 278 11,851
421 303 6,792
1,117 136 4,084
Sales m €(VAT excl.) 39,377
Sales m €(VAT excl.) 5,054
Sales m €(VAT excl.) 67,034
Sales m €(VAT excl.) 16,405
Sales m €(VAT excl.) 7,912
Sales m €(VAT excl.) 62,477
Sales m €(VAT excl.) 14,877
Sales m €(VAT excl.) 3,640
Sales m €(VAT excl.) 25,236
Net Margin*( m € )
Net Margin*( m € )
Net Margin*( m € )
Net Margin*( m € )
Net Margin*( m € )
Net Margin*( m € )
Net Margin*( m € )
Net Margin*( m € )
Net Margin*( m € )
Source: Ernst & Young 2009/ Datamonitor/ Nielsen
An analysis by activity (Manufacture, Distribution and Retail) shows that for each categoryof alcoholic beverage the majority of the margin in the value chain is enjoyed in the retailstage: the total retail margin in 2007 is €22.7bn (or 87.3%) of total alcoholic drinks sectormargin (€26.0bn). The retail sector is predominantly reliant on beer for this margin: beercontributes approximately 52%, or €11.9bn of the total retail sector margin, with wine andspirit contributing approximately 30% and 18% respectively.
In contrast with this, Distribution is a comparatively low margin activity accounting for only€718m, or 2.8% of total margins across all drinks categories.
The remainder of the margin (approximately, 10% of the total value chain or €2.5bn) isrealized at the manufacturing stage.
Despite comparatively smaller total value of sales, manufacturers of spirits have a marginof €1.12bn, or approximately 45% of the total margin enjoyed at the manufacturing stageacross the three alcoholic drinks categories. Brewers enjoy a margin of €0.97bn, orapproximately 39% of the margin at the manufacturing stage, with wine achieving a marginof just €421m.

The Brewers of EuropeComparable cost analysis
69
However, it is important for the purposes of this study to record that in 2007 wine producersbenefited from €0.51bn in direct subsidies across the European Union
6. No such subsidies
are available for either spirits or beer. Wine also benefits from a favorable excise taxregime in 16 countries of the EU. Further explanation of the excise taxation of alcoholicbeverages is provided below.
Chart 2: EU Volumes in m’s LFP vs. margins in € m
13.100
7.516
5.337
37.222
11.919
2.803
0
5.000
10.000
15.000
20.000
25.000
30.000
35.000
40.000
Beer Wine Spirits
Margins m€ Sales by Volume (m LFP)
Source: Ernst & Young 2009/ Datamonitor/ Nielsen/ PwC Analysis
This chart further illustrates the above comments, but shows the comparison between the volumein litres of finished product sold by alcoholic beverage and the net margin made for that product(across the whole value chain) in 2007.
Further analysis of the retail stage was undertaken to understand the comparative position for thetwo routes to market (on and off trade channels). Chart 3 provides a summary of our findings:
62007 EU wine budget details are available on the following press release
http://europa.eu/rapid/pressReleasesAction.do?reference=IP/07/1654. In 2009, the EU wine subsidies have reached morethan double the amount budgeted for 2007 as stated on this press releasehttp://europa.eu/rapid/pressReleasesAction.do?reference=IP/09/1214&format=HTML&aged=0&language=EN&guiLanguage=en

The Brewers of EuropeComparable cost analysis
70
Chart 3: Net Margins in Retail Sales (On-trade & Off-trade) European Union
ManufacturingManufacturing
BEERBEER
DistributionDistribution Retail SalesOn & Off-trade
Retail SalesOn & Off-trade
2.5 %2.5 % 0.370.5 %0.5 % 10 %10 %
WINEWINE2.6 %2.6 % 0.661.2 %1.2 % 7.7%7.7%
SPIRITSSPIRITS7.5 %7.5 % 2.410.6 %0.6 % 8.3 %8.3 %
Net Margin/L.
Net Margin/L.
Net Margin/L.
1,129 278 12,428
421 303 7,118
1,567 136 5,060
Sales m €(VAT excl.)
45,809Sales m €(VAT excl.)Sales m €(VAT excl.)
5,054Sales m €(VAT excl.)Sales m €(VAT excl.)
72,822
Sales m €(VAT excl.)Sales m €(VAT excl.)
16,405Sales m €(VAT excl.)Sales m €(VAT excl.)
8,272Sales m €(VAT excl.)Sales m €(VAT excl.)
68,065
Sales m €
(VAT excl.)
Sales m €
(VAT excl.)20,876
Sales m €
(VAT excl.)
Sales m €
(VAT excl.)3,640
Sales m €
(VAT excl.)
Sales m €
(VAT excl.)36,491
Net Margin( m € )
Net Margin( m € )
Net Margin( m € )
Net Margin( m € )
Net Margin( m € )
Net Margin( m € )
Net Margin( m € )
Net Margin( m € )
Net Margin
( m € )
Net Margin
( m € )Net Margin
( m € )Net Margin
( m € )
Net Margin
( m € )
Net Margin
( m € )
Net Margin
( m € )
Net Margin
( m € )
Net Margin
( m € )
Net Margin
( m € )
7% 0.04
0.13
1.50
0.19
4.35
0.81
Net Margin /L.
Off Trade
On Trade
Off Trade
On Trade
Off Trade
On Trade
Sales m €(VAT excl.)
845
12,446
Retail Sales (On & Off-trade)
BEER
WINE
SPIRITS
Net Margin*( m € )
18%
Sales m €(VAT excl.)
11,006
62,373
Net Margin*( m € )
3 %
Sales m €(VAT excl.)
1,039
41,959
Net Margin*( m € )
28 %
Sales m €(VAT excl.)
5,753
20,518
Net Margin*( m € )
5%
Sales m €(VAT excl.)
371
7,598
Net Margin*( m € )
21 %
Sales m €(VAT excl.)
3,712
17,638
Net Margin*( m € )
Sales do not include either VAT or Excise Tax
* Net Margin expressed in million Euros as a difference of net revenues minus total costs
Source: Ernst & Young 2009/ Datamonitor/ Nielsen
The on-trade channel achieves significantly higher margins than in the off trade. Of the total marginat the retail stage (€22.7bn), 90%, or €20.5bn is captured in the on trade with the remaining 10%achieved by the off trade. It is also relevant to record that of the margin enjoyed in the on trade€11.0bn (53.7%) is contributed by beer, with wine and spirits contributing €5.8bn (28.1%) and€4.4bn (18.2%), respectively (as illustrated in the chart below)
Chart 4: Contribution to the On-Trade
54%
28%
18%
Beer Wine Spirits
11,006m€
3,712 m€
5,753 m€
Source: PwC Analysis
This demonstrates the importance of the on trade route to market for all operators in the alcoholicbeverage sector. Equally importantly this illustrates the essential contribution of the differentalcohol categories to the sustainability of many bars, clubs, hotels and restaurants, with thesignificant employment this generates. It should be noted that the on-trade sector is made up of a

The Brewers of EuropeComparable cost analysis
71
large proportion of small operators selling small volumes. Therefore higher operating margins areessential to their survival, particularly in the current economic climate and often as many will havebusiness loans to service. In the UK, as sales decline, over 50 pubs a week are currently closing.
7
Chart 5: 2007 Sales Volumes per drink category on and off trade
23.714
8.0951.949
13.508
3.824
854
0
5.000
10.000
15.000
20.000
25.000
30.000
35.000
40.000
Beer Wine Spirits
On-trade
Off-trade
32%
68%
30%
70%
36%
64%
Chart 6: 2007 Sales Values8 per drink category on and off trade
41.10255.062
32.315
105.877
54.719
40.181
0
20.000
40.000
60.000
80.000
100.000
120.000
140.000
160.000
Beer Wine Spirits
On-trade
Off-trade
50%
50%
55%
45%28%
72%
In Charts 5 and 6, it can be noted that the share of sales by value for each product sold in the on-trade ranges between 72% for beer and 50% for Wine (spirits 55%). However, sales of alcohol byvolume via the on-trade are comparatively low 36% for beer, 32% for wine and 30% for spirits.Contrast this with the off trade position where beer sells 64%
9by volume, which corresponds to just
28% by value; Spirits with 70% by volume for 45% by value and wine with 68% by volume for 50%by value. These statistics illustrate the importance of the on-trade in value terms to all categories,whilst volumes for all products are driven through the off trade channel.
7British Beer and Pub Association website www.beerandpub.com
8Sales values presented at Retail Sales Prices (including VAT and Excise Tax)
9Private label beer sales are sold mainly through the off-trade and account for just 4% of total volume of beer, but 1% of
total value.

The Brewers of EuropeComparable cost analysis
72
Summary
The alcoholic beverage sector in Europe is of significant size, with sales of beer in absoluteterms accounting for the highest proportion by value and volume.
However, the brewing sector is fundamentally a high volume business, but with comparativelylow margins across the whole value chain.
The spirits industry has lower value of sales than beer in absolute terms, but enjoys highermargins that beer or wine in both absolute and percentage terms.
Wine sales are one and a half times greater in value than those for spirits, but still less than thevalue of sales for beer
87% of the margin made in the value chain across all categories of alcoholic drinks are enjoyedby the retail sector, and of this almost 90% is achieved in the on trade, which is illustrative ofthe importance of this route to market and the reliance of the on-trade on margin generatedfrom sales of alcohol.
Beer is the largest contributor to on trade margins supporting more than half the margin madein the on-trade channel.
Alcoholic beverage manufacturers achieved just 9.6% of the total margin in the value chain andof this, almost half was realized by spirits €1.12bn
Brewers achieved a margin of €0.97bn, and whilst the margin for wine was just €421m, winereceived €0.51bn in 2007 in direct subsidies.
3.3 Comparable cost of production for Beer, Wine and Spirits
In this chapter we explore the relative costs of production for the different categories of alcoholicdrink. The following chart summarizes our main findings regarding spending per category in theareas of raw materials (and other supplies to alcohol producers), wages and salaries andamortization and depreciation. The choice of these categories has been driven by the availability(or otherwise) of public information and the need for this information to be consistent, i.e. the needfor comparison of homogeneous data.
Chart 7: Total manufacturers costs (€ bn) in 2007
Results fromoperating activities
(€’bn)*
Brewers
WineManufacturers
SpiritManufacturers
RawMaterials &
Othersupplies
Wages, salaries& related costs
(including socialsecurity)
Amortization& depreciation
Otheroperatingexpenses
Total
79.2
25.6
20.9
34.9
13.7
9.3
12.3
2,0
5.1
4,0 0.8
27.0
7.2
9.3
5.7
4.8
0.7
* This figure accounts for Earnings Before Interests, Taxes and Outstanding results which better approximates the profitability ofoperating activities
0.3
Source: Dun & Bradstreet/Amadeus/ Companies Public Financial Report

The Brewers of EuropeComparable cost analysis
73
Raw materials and other supplies
Our analysis confirmed that the alcoholic beverage sector is a large consumer of raw materials andother supplies with spending totaling €57.9bn. It therefore has a significant impact on supplyingindustries, in particular on agriculture (suppliers of grapes, malt, barley, etc), aluminum, glass andpaper suppliers, suppliers that process these raw materials, e.g. maltsters, can manufacturers,makers of glass bottles, crates and pallets, along with suppliers of other packing materials.
The brewing sector is the largest consumer of raw materials and supplies with spending ofapproximately €34.9bn. The brewing sector consumes high volumes of malt, hops, barley andpackaging materials.
Wine is the next largest consumer with annual spending of €13.7bn, reflective of the high cost ofgrowing and harvesting grapes and the high cost for the type of packaging used. Again this is incorrelation with the volume of wine sales.
Spending on raw material and supplies by spirits manufacturers totals €9.3bn.
Wages and employment
The next highest area of comparable spending by alcohol manufacturers is on wages and relatedcosts. Across the three alcoholic drinks categories total spending in this area was €18.3bn in 2007.This represents total direct employment
10of approximately 300,000 people, more than half
employed in the brewing sector.
Chart 8: Comparison of direct employment Chart 9: Indirect Employment
150,600*
68,14576,447
0
25.000
50.000
75.000
100.000
125.000
150.000
175.000
Beer Wine Spirits
*Wine and spirits employment data has been extracted from Amadeus while beer
data is an Eurostat figure out of the Labour Force Survey 2008. The corresponding
Amadeus figure for direct emplyment in the beer sector is 250,000. However, to beconsistent with previous studies we have chosen to rely on the lower figure recorded
by Eurostat.
1,800,000
350,676110,224
549,400
863,533
781,388
0
500.000
1.000.000
1.500.000
2.000.000
2.500.000
Beer Wine Spirits
Rest of employment (suppliers and retailers) On-trade jobs
2,349,400
1,214,209
891,612
Source: Amadeus /Eurostat/Ernst&Young 2009 Source: Amadeus /Eurostat/ Ernst&Young 2009
The European alcohol drinks industry is also a significant driver for employment in related sectors(see Chart 9). The total for indirect
11jobs generated by the alcoholic beverages sector is
approximately 4.45m as of end of 2007. Of this number, approximately half (2.25m jobs) areemployed in the on trade mainly in bars, clubs, restaurants and hotels. Most of this on tradeemployment (1.8m jobs) is generated by the beer sector. This is reflective of the reliance of the ontrade on margin generated by the beer category.
10Employment data corresponds to aggregated information from Amadeus financial database, except for beer which
employment information was available on the study “The contribution made by beer to the European Economy” (Edition2009) undertaken by Ernst & Young11
Rest of employment (suppliers and retailers) calculations were prepared based on Amadeus, Eurostat information andthe Ernst&Young report (“The contribution made by beer to the European Economy”, Edition 2009)

The Brewers of EuropeComparable cost analysis
74
The remainder of the indirect jobs generated by the alcoholic beverages sector are spread acrosssupplier industries (reflective of the €57bn spent in this area) and in the off-trade. Most of thesejobs (1.6m) are split evenly between wine and spirits, with beer generating 550 thousand jobs.
Further detailed information regarding indirect employment in the beer sector is available12
in areport prepared by Ernst & Young. However, no further analysis of indirect jobs generated by thewine and spirits sectors was undertaken as part of this study, so no further comparison of theseremaining jobs is possible here.
Distribution costs
An analysis of the cost of distribution shows that producers of wine incur the highest costs €7.9bnin 2007. This could be indicative of a combination of higher wine volumes than spirits and longerdistances traveled than beer. The brewing sector by contrast transports large volumes, but typicallyover short distances being predominately local businesses.
Chart 10: Distribution Costs
3,640
7,912
5,054
0
1,000
2,000
3,000
4,000
5,000
6,000
7,000
8,000
9,000
Beer Wine Spiri ts
Source: PwC Analysis
3.4 Comparable cost per litre pure alcohol
The final sections of this report consider the impact of excise taxation. Excise taxes are asignificant component of the cost of producing and retailing alcoholic beverages and ultimately theprice paid by the consumer. Excise taxes are generally based on alcohol content and therefore inthe first instance we have undertaken a comparative cost analysis (excluding excise tax) for themanufacturer to:
12“Contribution made by beer to the European economy” a report by Ernst & Young Netherlands (2009),

The Brewers of EuropeComparable cost analysis
75
(a) produce a litre of finished product for each drink (i.e. total value divided by total volumesold);and,
(b) produce a litre of pure alcohol in each product, i.e. a litre of alcohol in spirit, a litre of alcohol inwine and a litre of alcohol in beer (this is achieved dividing the cost of a litre of finished productby the average alcoholic strength for each drink and then multiplying by 100).
Chart 11: Comparable cost perLitre of Finished Product
Chart 12: Comparable cost perLitre of Pure Alcohol
45.19
17.91
18.62
0,00
10,00
20,00
30,00
40,00
50,00
Beer Wine Spirits
2.13 2.15
7.45
0,00
10,00
20,00
30,00
40,00
50,00
Beer Wine Spirits
Source: PwC Analysis
Chart 11 is an illustration of the comparable cost per litre of finished product, i.e. a litre of beer, alitre of wine and a litre of spirit.
This illustrates the comparative cost of producing a litre of finished product and shows that thecomparative cost is highest for a litre of spirit (such as Whiskey or Vodka) at € 7.45. The cost ofproducing a litre of beer and a litre of wine are less than spirit, but comparable to one another (€2.13 vs. €2.15, respectively). This finding is reflective of the cost of producing higher alcoholiccontent; (a litre of spirit is typically 40% alcohol by volume per litre bottle, compared to 12% alcoholfor a litre of wine and between 4 and 5% for a litre of beer (a calculated average across the EU of4.7% abv. is used in this report).
However, when these costs are adjusted to reflect the cost of producing a litre of pure alcohol ineach of these drinks this produces markedly different results.
The cost of producing a litre of pure alcohol in
Beer rises from €2.13 LFP to €45.19 LPA; Wine rise from €2.15 LFP to €17.91 LPA; and Spirit from €7.45 LFP to €18.62 LPA
Beer is the most costly beverage to produce per litre of pure alcohol, costing approximately 2.5times or €27 more per litre alcohol than either wine or spirit.
The following charts show a comparison between the cost per litre finished product to the cost perlitre pure alcohol by drink category:

The Brewers of EuropeComparable cost analysis
76
Chart 13: Brewers costs(€’s / ltr)
Wages, salaries& related costs
Amortization& depreciation
Otheroperatingexpenses
Raw materials &Packaging
8
20Euros
16
12
4
19.89
6.99
2.88
15.43
0.940.33
Pure alcoholFinished product
00.14
0.73
Source: PwC Analysis
The amount of alcohol in beer (between 4 and 5% alcohol by volume) is comparatively lowcompared to wine (12%) and spirits (40%) in the respective most common product ranges. For abrewer to produce a litre of pure alcohol in beer requires production of 20 to 25 litres of finishedproduct (8 to 8.5 times the volume of finished product than spirits). This is reflected in thecomparatively high cost of raw materials and packaging in the above chart. Beer is a high volumebusiness and requires significant investment in plant and machinery, e.g. bottling and canning lines.This is reflected in the comparatively high figure above for amortization and depreciation.
Chart 14: Wine Manufacturers costs(€’s / ltr)
Chart 15: Spirits Manufacturers costs(€’s / ltr)
Wages, salaries& related costs
Amortization& depreciation
Otheroperatingexpenses
Raw materials &Packaging
4
10Euros
8
6
2
9.56
2,80
5.01
1.15 0.060.60
0
Pure alcoholFinished product
0.34 0.54
Wages, salaries& related costs
Amortization& depreciation
Otheroperatingexpenses
Raw materials &Packaging
4
10
1.74
Euros
0.35
8
6
2
8.32 8.20
3.33
0.70
3.28
Pure alcoholFinished product
0.140
Source: PwC Analysis Source: PwC Analysis
Wine and spirits have a higher concentration of alcohol than beer and therefore require lessvolume to produce a litre of pure alcohol (just over 8 litres of wine and 2.5 litres of spirit). Figuresfor raw materials and packaging per litre pure alcohol for these drinks are higher for wine thanspirits but the figures are broadly comparable for these categories compared to beer. Wine hasslightly higher costs than spirits for both wages and amortization and depreciation per litre purealcohol. However, the production cost of a litre of pure alcohol in wine and spirit are comparable.
3.5 Impact of taxation
Indirect taxation in the form of value added tax (VAT) and excise tax is a material component withinthe final selling price of alcoholic drinks, representing on a weighted average between 21% and40% of the retail price.
VAT is typically applied at the standard rate to domestic sales of all categories of alcoholic drinksand is applied to the net price of the product, inclusive of excise. The impact of VAT should beneutral for the purpose of this study as it is applied at the same rate to each of the different drinkscategories. However, differences in excise taxation per category of alcoholic beverage impact thetax base to which VAT is applied. This means that the impact of VAT is higher where one productis subject to a positive rate of excise, whilst another is subject to a zero, or reduced rate. We have
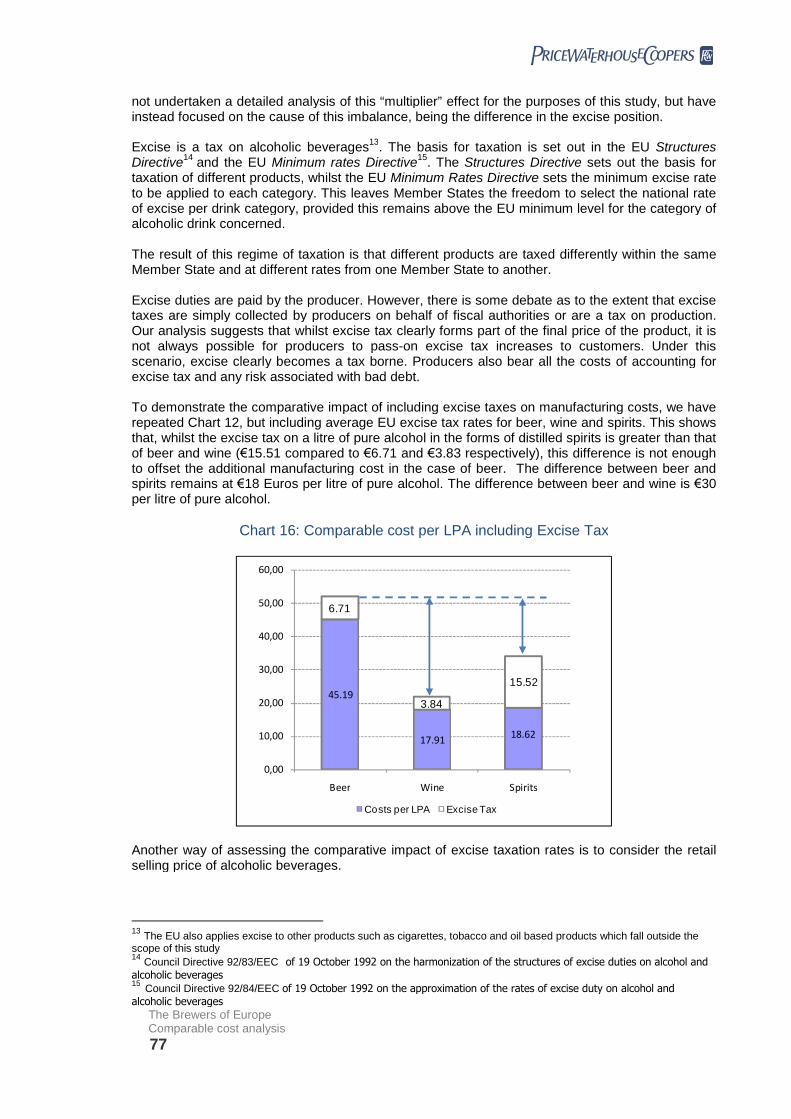
The Brewers of EuropeComparable cost analysis
77
not undertaken a detailed analysis of this “multiplier” effect for the purposes of this study, but haveinstead focused on the cause of this imbalance, being the difference in the excise position.
Excise is a tax on alcoholic beverages13
. The basis for taxation is set out in the EU StructuresDirective
14and the EU Minimum rates Directive
15. The Structures Directive sets out the basis for
taxation of different products, whilst the EU Minimum Rates Directive sets the minimum excise rateto be applied to each category. This leaves Member States the freedom to select the national rateof excise per drink category, provided this remains above the EU minimum level for the category ofalcoholic drink concerned.
The result of this regime of taxation is that different products are taxed differently within the sameMember State and at different rates from one Member State to another.
Excise duties are paid by the producer. However, there is some debate as to the extent that excisetaxes are simply collected by producers on behalf of fiscal authorities or are a tax on production.Our analysis suggests that whilst excise tax clearly forms part of the final price of the product, it isnot always possible for producers to pass-on excise tax increases to customers. Under thisscenario, excise clearly becomes a tax borne. Producers also bear all the costs of accounting forexcise tax and any risk associated with bad debt.
To demonstrate the comparative impact of including excise taxes on manufacturing costs, we haverepeated Chart 12, but including average EU excise tax rates for beer, wine and spirits. This showsthat, whilst the excise tax on a litre of pure alcohol in the forms of distilled spirits is greater than thatof beer and wine (€15.51 compared to €6.71 and €3.83 respectively), this difference is not enoughto offset the additional manufacturing cost in the case of beer. The difference between beer andspirits remains at €18 Euros per litre of pure alcohol. The difference between beer and wine is €30per litre of pure alcohol.
Chart 16: Comparable cost per LPA including Excise Tax
45.19
17.9118.62
6.71
3.84
15.52
0,00
10,00
20,00
30,00
40,00
50,00
60,00
Beer Wine Spirits
Costs per LPA Excise Tax
Another way of assessing the comparative impact of excise taxation rates is to consider the retailselling price of alcoholic beverages.
13The EU also applies excise to other products such as cigarettes, tobacco and oil based products which fall outside the
scope of this study14
Council Directive 92/83/EEC of 19 October 1992 on the harmonization of the structures of excise duties on alcohol andalcoholic beverages15
Council Directive 92/84/EEC of 19 October 1992 on the approximation of the rates of excise duty on alcohol andalcoholic beverages
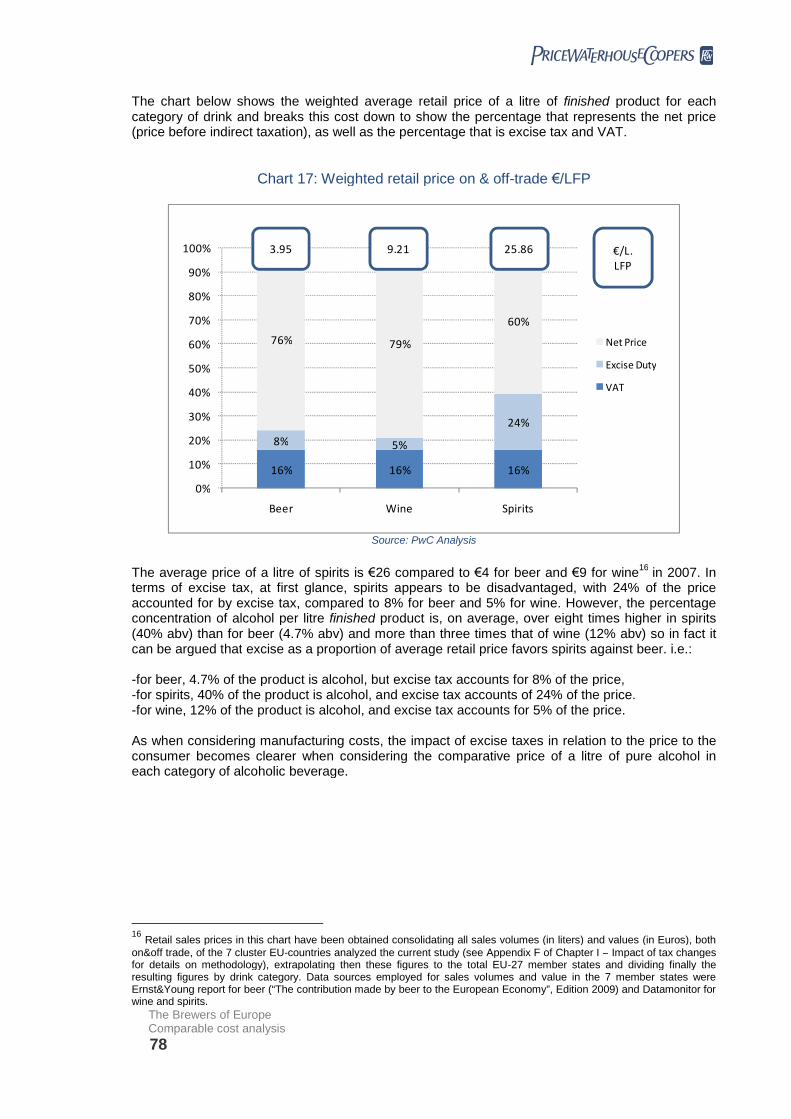
The Brewers of EuropeComparable cost analysis
78
The chart below shows the weighted average retail price of a litre of finished product for eachcategory of drink and breaks this cost down to show the percentage that represents the net price(price before indirect taxation), as well as the percentage that is excise tax and VAT.
Chart 17: Weighted retail price on & off-trade €/LFP
16% 16% 16%
8% 5%
24%
76% 79%
60%
0%
10%
20%
30%
40%
50%
60%
70%
80%
90%
100%
Beer Wine Spirits
Net Price
Excise Duty
VAT
€/L.LFP
3.95 9.21 25.86
Source: PwC Analysis
The average price of a litre of spirits is €26 compared to €4 for beer and €9 for wine16
in 2007. Interms of excise tax, at first glance, spirits appears to be disadvantaged, with 24% of the priceaccounted for by excise tax, compared to 8% for beer and 5% for wine. However, the percentageconcentration of alcohol per litre finished product is, on average, over eight times higher in spirits(40% abv) than for beer (4.7% abv) and more than three times that of wine (12% abv) so in fact itcan be argued that excise as a proportion of average retail price favors spirits against beer. i.e.:
-for beer, 4.7% of the product is alcohol, but excise tax accounts for 8% of the price,-for spirits, 40% of the product is alcohol, and excise tax accounts of 24% of the price.-for wine, 12% of the product is alcohol, and excise tax accounts for 5% of the price.
As when considering manufacturing costs, the impact of excise taxes in relation to the price to theconsumer becomes clearer when considering the comparative price of a litre of pure alcohol ineach category of alcoholic beverage.
16Retail sales prices in this chart have been obtained consolidating all sales volumes (in liters) and values (in Euros), both
on&off trade, of the 7 cluster EU-countries analyzed the current study (see Appendix F of Chapter I – Impact of tax changesfor details on methodology), extrapolating then these figures to the total EU-27 member states and dividing finally theresulting figures by drink category. Data sources employed for sales volumes and value in the 7 member states wereErnst&Young report for beer (“The contribution made by beer to the European Economy”, Edition 2009) and Datamonitor forwine and spirits.

The Brewers of EuropeComparable cost analysis
79
3.6 Retail price per category of drink per litre pure alcohol
Chart 18: Average retail price of Drinks in terms of litre of pure alcohol
63.7 60.6
38.8
6.73.8
15.5
13.4
12.3
10.3
0
10
20
30
40
50
60
70
80
90
Beer Wine Spirits
Euro
s/
litre
Net price Excise tax VAT
83.8
76.7
64.6
Price to Consumer
Source: PwC Analysis
The graph confirms that to deliver alcohol in beer is the most expensive in terms of price to theconsumer. The weighted average price of a litre of 100% alcohol in the form of beer is €84compared to €77 in wine and €65 in spirits. This reflects the higher cost of producing anddelivering alcohol in the form of a lower alcohol dilute beverage. Although the average rate ofexcise tax on spirits is just over two times that of beer, this difference is not enough the offset theadditional costs of producing and delivering beer to the consumer.
This report has highlighted that the cost of producing alcohol in beer is considerably higher thanproducing alcohol in the form of distilled spirits. This, is reflected both in the analysis of producercosts and also in the final price to the consumer. Apart from any health and social considerations,this reflects one reason why spirits generally have a higher tax rate than beer and wine in mostcountries across the world. However as the comparative analysis shows, in Europe, the currentrates particularly disadvantage beer in terms of cost to the consumer. Clearly any move to taxingproducts solely based on alcohol content (unitary taxation) would further disadvantage beer.

The Brewers of EuropeComparable cost analysis
80
3.7 The tax contribution by the alcoholic beverage sector is significant
The final section of this report briefly highlights the importance of the alcoholic beverage sector interms of the total tax contribution to member state governments. In 2007, whilst excise taxes onalcoholic beverages raise over €35bn, VAT on sales contributes a further €52bn, employmenttaxes an additional €56bn and corporation tax €6bn.
Chart 19: Tax contribution by the alcoholic beverage sector within the EU17
Beer Wine Spirits
67,982 m€
41,398 m€
39,428 m€
m€ VAT 23,294
m€ ET 12,220
m€ EIT 11,224
m€ SSC 18,718
Beer
m€ CIT 2,526
67,982
m€ VAT 17,399
m€ ET 5,588
m€ EIT 5,522
m€ SSC 9,208
Wine
m€ CIT 1,711
39,428
m€ VAT 11,490
m€ ET 17,254
m€ EIT 4,173
m€ SSC 6,959
Spirits
m€ CIT 1,522
41,398
Of the total tax contribution of the alcoholic drinks sector, beer sales contributes 46%, wine sales26% and spirits sales 28%.
17ET stands for Excise Tax; EIT is the Employee (or Personal) Income Tax; SSC are the Social Security Contributions
comprised by the financial payments of employees and employers in order to obtain access to the social security system(this SSC figure includes total employment effect of each drink); and CIT is the Corporate Income Tax

The Brewers of EuropeComparable cost analysis
81
Appendix
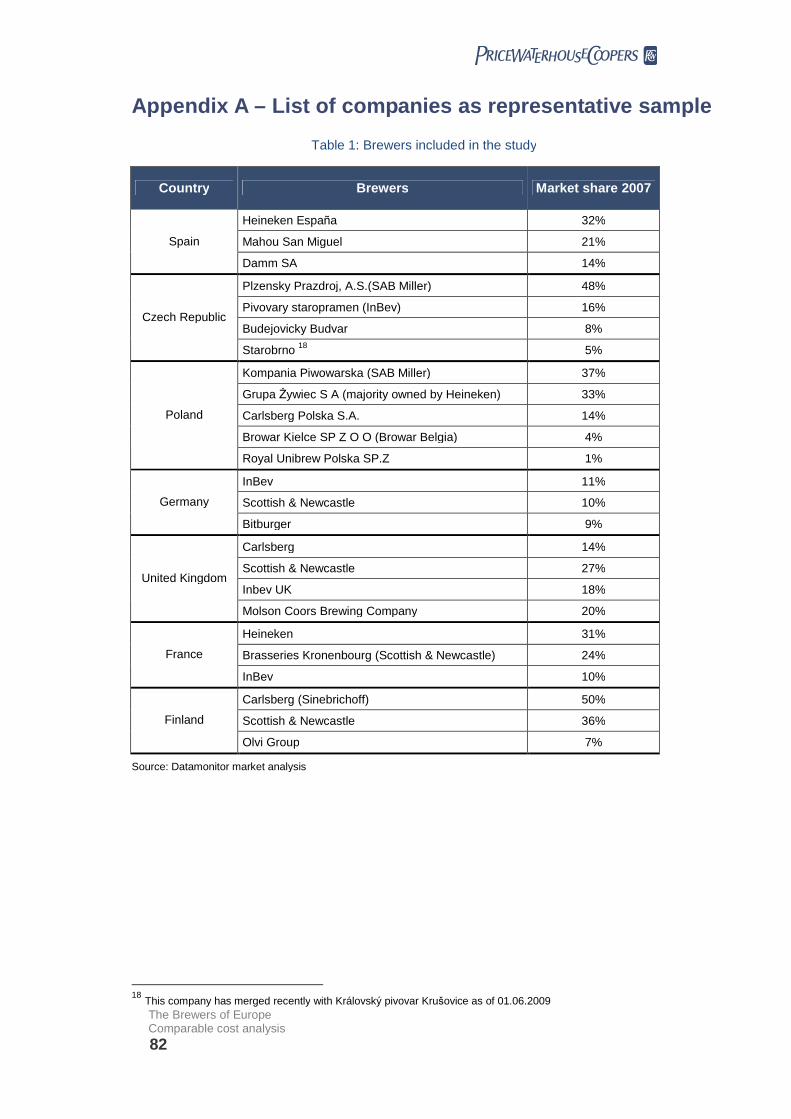
The Brewers of EuropeComparable cost analysis
82
Appendix A – List of companies as representative sample
Table 1: Brewers included in the study
Country Brewers Market share 2007
Heineken España 32%
Mahou San Miguel 21%Spain
Damm SA 14%
Plzensky Prazdroj, A.S.(SAB Miller) 48%
Pivovary staropramen (InBev) 16%
Budejovicky Budvar 8%Czech Republic
Starobrno18
5%
Kompania Piwowarska (SAB Miller) 37%
Grupa Żywiec S A (majority owned by Heineken) 33%
Carlsberg Polska S.A. 14%
Browar Kielce SP Z O O (Browar Belgia) 4%
Poland
Royal Unibrew Polska SP.Z 1%
InBev 11%
Scottish & Newcastle 10%Germany
Bitburger 9%
Carlsberg 14%
Scottish & Newcastle 27%
Inbev UK 18%United Kingdom
Molson Coors Brewing Company 20%
Heineken 31%
Brasseries Kronenbourg (Scottish & Newcastle) 24%France
InBev 10%
Carlsberg (Sinebrichoff) 50%
Scottish & Newcastle 36%Finland
Olvi Group 7%
Source: Datamonitor market analysis
18This company has merged recently with Královský pivovar Krušovice as of 01.06.2009

The Brewers of EuropeComparable cost analysis
83
Table 2: Wine companies included in the study
Country Wine Manufacturers Market share 2007
Freixenet 2.0%
Codorniú 1.0%Spain
González Byass 0.1%
Vinium Velké Pavlovice 16%Czech Republic
Znovin 9%
Ambra SA 23%
Jantón SA 13%Poland
Castel Freres 4%
Reh Kendermann 9%Germany
Moselland 8%
Constellation Europe Ltd. 8%United Kingdom
Foster's EMEA Ltd. 3%
Patriarche Kriter (SA KBB ) 27%
Roche Mazet 9%France
St. Chinian 7%
Pernod Ricard Finland 27%
Gran Sasso Ortona 7%Finland
Pearly Bay Winery 3%
Source: Datamonitor market analysis

The Brewers of EuropeComparable cost analysis
84
Table 3: Spirits companies included in the study
Country Spirit Manufacturers Market share 2007
Diageo 15%
Bacardi 11%Spain
Beam Global Spirits & Wine Hold 6%
Jan Becher 10%Czech Republic
Palrina 4%
Przedsiebiorstwo Polmos Bialystok 19%Poland
Bols SP (Unicom Bols) 9%
Diageo Deutschland 8%Germany
Pernod Ricard 6%
Diageo 29%
Glen Catrine Bonded Warehouse 11%
Pernod Ricard 9%United Kingdom
Bacardi Martini 4%
Pernod Ricard 27%
SVS La Martiniquaise 11%
Diageo 7%
Marie Brizard & Roger 4%
William Pitters 4%
France
Chartreuse Diffusion 4%
Diageo Plc (Hartwa) 25%
Chymos Juomat Oy 7%Finland
Moet- Hennessy 3%
Source: Datamonitor market analysis

The Brewers of EuropeComparable cost analysis
85
Appendix B – Comparable cost model
Once all the information has been entered into the cost comparable model, all available averagecost ratios were calculated for each company within the value chain and for all the countriesconsidered in the study.
Following, and taking the average of a cost ratio for the different companies considered in themodel, we calculated, for a combination of industry and country, the average cost ratio expressedas % over Net Revenues as an average of averages as a valid indicator of the weight of costs bycountry and industry. When available, more than one year of P&L data for each company wasentered in the model to gain robustness out of extended history in the operations, costs andmargins of a company. This level of data elaboration would let us deploy the report on comparablecosts for each Member State.
In order to gain a global European view and produce the EU level of analysis, the way to approachthe EU cost average ratios was to calculate a weighted average cost ratios considering marketsales in each country. At this point of our methodology, we had extrapolated the value of themarket at European level taking the volume in litres sold in the 7 cluster-countries against totallitres sold in the EU.
Figure 11: Country Cost Analysis Model Figure 12: EU Cost Analysis Model
Once the calculation phase was completed, we made final verifications and double-checks to themodel to make sure that figures and assumptions were reliable. As a result, the following chartsand analysis for each country have been prepared for the study among others:
Value chain analysis per alcoholic beverage in terms of costs, valued added and netmargins
Analysis of average ratios by manufacturer Comparison of sales by volume and value by type of beer (branded beer vs. private label
beer) delete? Comparison of sales by volume and value in the on-trade and in the off-trade channel. Analysis of total costs for beer, wine and spirits (by volume) Analysis of total costs for beer, wine and spirits per €/litre of finished product Analysis of total costs for beer, wine and spirits per €/litre of pure alcohol
All the above was finally prepared and calculated to be represented in different chartsaccompanied by comments and interpretations to our best understanding of the economic realitydescribed.

The Brewers of EuropeComparable cost analysis
86
Figure 13: Examples of charts as model output
13.835
7.842 6.764
37.222
11.919
2.803
0
5.000
10.000
15.000
20.000
25.000
30.000
35.000
40.000
Beer Wine Spirits
Margins m€ Sales by Volume (m LFP)Wages, salaries& related costs
Amortization& depreciation
Other
operating
expenses
Raw materials &Packaging
8
20Euros
16
12
4
19.89
6.99
2.88
15.43
0.940.33
Pure alcoholFinished product
00.14
0.73
Beer Wine Spirits
67,982 m€51,365 m€
39,428 m€
The following chart describes a final summary of the detailed methodology we have followedthrough the project in order to prepare the comparable cost analysis:
Provides average cost ratios:• Per country• Global average for 7 countries
Annual reports
Cost model definition
for each country
Reconsiders initialvalue chain definition
The Br ewers o f Euro pe
Pro je ct pro gre ss and s tatus
Margin break down on manufacturers
2 8
.6. Preli minary Results: S pain
10 0%
3 1%
16 %
8 %
3 3%
1 3%0
0,1
0,2
0,3
0,4
0,5
0,6
0,7
0,8
0,9
1
T ota lNe t
Sa le s
R aw Ma teri a ls
&Ot he r
sup pli e s
W ag es,
sa l ari es a nd
o th ers
A mo rtizatio n
&
d ep re ciatio n
Othe r
o pe ratin g
e xp en se s
R esul tsf ro m
op era ting
a cti vities
BREW ERS
10 0 %
4 0%
1 5%
3 %
37%
5 %
0
0 ,1
0 ,2
0 ,3
0 ,4
0 ,5
0 ,6
0 ,7
0 ,8
0 ,9
1
To talNe t
S ales
R aw M ate rial s
& Othe r
suppl ie s
W ag es ,
sal ari e sa nd
oth e rs
A m ortiza tion
&
de pre ciat io n
Othe r
o pe ra tin g
exp e nse s
R e sul ts from
o pe ratin g
a cti vities
WINE
MANUFACTURER S
10 0%
57%
9%
9%
2 2%
3%
0
0,1
0,2
0,3
0,4
0,5
0,6
0,7
0,8
0,9
1
T ota lNe t
Sa le s
Ra w Ma teria ls
&Oth e rs up p lie s
W age s,
sa la ries an dothers
A mortizati on
&d ep re ci ati on
Oth er
op e ratinge xp en ses
Resu ltsfro m
opera tingac tivi tie s
SPIRITSMANUFAC TURERS
Comparable costconclusions
Figure 14: Comparable Cost Methodology

The Brewers of EuropeComparable cost analysis
87
Appendix C – Data Source
The data sources that have been used within the report to provide data from individual companiesand at whole market level are classified as follows
a) Market Information Sourcesb) Companies Financial Information Sourcesc) Brewers Associationsd) PwC Questionnaire
Market Information Sources
Market information has been obtained through reports and studies of the following specializedgroups:
Datamonitor
Provider of global business information, delivering data, analysis and opinion across theAutomotive, Consumer Markets, Energy and Utilities, Financial Services, Logistics and Express,Pharmaceutical and Healthcare, Retail, Technology and Telecoms industries.
In the Retail sector the information covered has been:
- Market dynamics – key market data, forecasts, issues and challenges in the sector- Retailers – analysis of strategy, financials, store strategy and customers- Consumers – changing usage and attitudes towards retail- Channels and location – use of space, stores, locations and retail channels
Nielsen
Worldwide marketing and media information company supplying information on:
- Consumer Packaged Goods – Global retail trends, the relationship between retailerand manufacturer or in-store consumer behavior, etc
- Media – Contents on television, entertainment, sports and Advertising- Telecom
Canadean
Global market research providing benchmarks and comparable data on beverage markets. Itsstudies include information on drinks, packaging and allied supplier industries worldwide.
Alimarket
Publications Alimarket, SA is specialized in generating information of economic content fromdifferent sectors in the Spanish market: food and beverages, hotel and tourism, consumer productsnon-food (drugstore, perfumery, DIY, textiles, toys, ...), appliances and consumer electronics,packaging, transportation and logistics, healthcare and general business management.
Business Monitor International
Business Monitor International offers information products and trough newsletters, reports anddirectories on three main areas of expertise: Country Risk BMI's country risk and macroeconomic

The Brewers of EuropeComparable cost analysis
88
forecast portfolio includes weekly financial market reports, monthly regional Monitors, and in-depthquarterly Business Forecast Reports.
Financial Information Sources
In order to get to manage valid financial information of the main companies of the brewing, wineryand spirits sector of the different countries, PricewaterhouseCoopers national and regional offices,and their specialized Knowledge Centers, have obtain the financial statements from companiesoperating in their markets from the following sources:
Financial Reports registered at the national mercantile records in the countries studied.
Amadeus
Amadeus is a comprehensive, pan-European database containing financial information on over 11million public and private companies in 41 European countries. It combines data from over 30specialist regional information providers (IPs).
Dun & Bradstreet
It is a world-class source of commercial information and insight on businesses. D&B’s globalcommercial database contains more than 140 million business records. The database is enhancedby D&B’s proprietary DUNSRight® Quality Process, which provides quality business information.
Thomson Reuters
Information for businesses and professionals in the financial, legal, tax and accounting, scientific,healthcare and media markets. Thomson Reuters operates in 93 countries.
SABI
Spanish database containing financial information on over 1,500,000 public and private companiesin Spain and Portugal.
Emerging Markets Information Service
EMIS delivers news, company and financial data direct from more than 80 emerging markets inAsia, Latin America, Central and Eastern Europe, the Middle East and Africa. The emergingmarkets business intelligence information managed comes straight from the local markets and fromover 16,000 publications.
Brewers Associations
1. The Brewers of Europe
The Brewers of Europe has been the major source for the recompilation of publicly availableinformation and data of the brewing sector. Through the Brewers of Europe we have had access topublicly available information from brewing companies, market information as well as orientation onthe analysis of the data.
2. Local Brewer Associations
Within the local brewer associations, the collaboration has been closer with those associations ofthe countries studied independently in the cluster analysis:
- British Beer & Pub Association- Czech Beer and Malt Association (Český Svaz Pivovarů a Sladoven)

The Brewers of EuropeComparable cost analysis
89
- Deutscher Brauer-Bund- Finnish Federation of the Brewing and Soft Drinks Industry- Union of the Brewing Industry Employers in Poland - Browary Polskie- The Brewers of Spain
Again all information supplied has been available in the public domain
PwC Questionnaire
Through The Brewers of Europe and the local brewing associations, a questionnaire has beendistributed to the main companies of the market of each country in order to obtain publicly availableinformation on:
- Supply of raw materials to manufacturers – Employment, Revenues and Net-income ofcompanies operating in the sub-industry.
- Beer Manufacturing Process – on-trade investments, average % ofpromotional/merchandising spending over revenues, average % of commercial marketresearch.
- Media and Marketing – Employment, Revenues and Net-income of companies operating inthe sub-industry
- Logistics and Distribution – Employment, Revenues and Net-income of companiesoperating in the sub-industry, Transportation Costs, Equipment Logistics.
- Off-trade/On-trade – Employment, Revenues and Net-income of companies operating inthe sub-industry

The Brewers of EuropeComparable cost analysis
90
Appendix D – Exchange Rates
For our calculations in the comparable cost model, the P&L figures of companies in Member statesout of the eurozone
19needed to be converted into Euros for comparable purposes applying the
following exchange rates:
Currency Euro exchange rate
Czech Koruna (CZK) 26.667
Polish Złoty (PLN) 3.626
Pound Sterling (GBP) 1.357
Source: www.oanda.com
These exchange rates are fixing prices as of 31/12/2007 according to the closing date of thefinancial reports that were available and have considered in our model at the time of thepreparation of this study.
19The eurozone (officially the euro area) is an economic and monetary union (EMU) of 16 European Union member states
which have adopted the euro currency as their sole legal tender. It currently consists of Austria, Belgium, Cyprus, Finland,
France, Germany, Greece, Ireland, Italy, Luxembourg, Malta, the Netherlands, Portugal, Slovakia, Slovenia and Spain.

The Brewers of Europe
91
Glossary
Average strength Percentage of alcohol volume in alcoholic drinks; in thecase of beer, each country within the European Uniongets its own average strength for our analysis andcalculations as reported by the 2009 Statistical Handbookpublished by the British Beer and Pub Association
Bottom-up methodology Analysis of a selection of companies comprising anindustry starting from its data aggregation in a significanttotal market share and building up from the resultingfigures a consolidated industry view
Branded Beer Beer labeled by a distinctive word or symbol indicating atrademark with exclusive rights
Brewers Companies dedicated to the production of beer from maltand hops by infusion, boiling, and fermentation
Brewing sector Involves all companies dedicated to the manufacturing ofbeer
Cross-price elasticity ofdemand
Measure of the percentage change in the demand for aproduct or service following a variation by 1% in the priceof another good
Cluster Set of individuals or observations regarded similar orhomogenous according to objective criteria
Correlation coefficient Statistical measure of the degree of linear relationshipbetween two variables. It can take values in the rangefrom -1 to 1. A correlation coefficient of -1 indicates thatthere is a perfect negative linear relationship between thevariables. This means that any change in the level of onevariable is followed by a variation of opposite sign andfixed amount in the other. A correlation of 1 is indicativeof a perfect positive linear relationship between thevariables. A correlation of 0 means that the two variablesare not linearly related
Demand elasticity (see Own-price and Cross-price elasticity of demand)
Direct Employment Employment created by the brewers or its manufacturingactivities
Distribution and Logistic Activities involving total output or income beingdistributed among On-trade establishments or individuals
Econometrics Statistical techniques for the analysis of data which allowinferring the relationship between different variables
EU European Union (Austria, Belgium, Bulgaria, Cyprus,Czech Republic, Denmark, Estonia, Finland, France,Germany, Greece, Hungary Ireland, Italy Latvia,Lithuania, Luxembourg, Malta, Netherlands, Poland,Portugal, Romania, Slovakia, Slovenia, Spain, Sweden,United Kingdom)

The Brewers of Europe
92
Excise Tax Tax levied on the volume production. In the case ofalcoholic beverages, it involves taxation according to thelevel of alcohol
Government Revenues Amount of money received by the government fromoutside the government entity
Hectoliter Measure equivalent to 100 litres
Indirect employment Number of jobs generated by the beer industry in relatedsectors
Level of pass-through Measured as the percentage variation in the price of beernet of excise taxes following a variation of 1% in theexcise tax rate
LFP Litre of finished Product
LPA Litre of Pure Alcohol
Manufacturing processes The act of making a product from raw materials from theacquisition of Raw materials to the production of afinished product, ready to be consumed or distributed
Market Share Percentage sold by a company, product or brand over thetotal sales value or volume of a specific market
Net Margin Percentage of a company’s revenue after all costs,expenses and taxes
Net Revenues Gross Earnings a company obtains with the sail of itsproduct
Off trade Sales made through retail establishments (shops,supermarket, etc)
On trade Sales made trough restaurants, cafeterias, pubs andother On-trade establishments that are licensed to do so
Own price elasticity ofdemand
Measure of the percentage change in the demand for aproduct or service following a variation by 1% in its ownprice
Personal Income Tax Tax levied on the income of individuals or business(corporations or other legal entities)
Price Sensitivity Awareness of the consumers to the cost of particularproduct or service they wish to buy in relation tosubstitutes and its expected utility (see also demandelasticity)
Private Label Beer Beer with a brand owned not by a manufacturer orproducer but by a retailer or supplier who gets its goodsmade by a contract manufacturer under its own label
Profit and Loss accounts Accounts compiled at the end of an accounting period toshow gross and net profit or loss of a company
PwC PricewaterhouseCoopers
Regression analysis (see Econometrics)
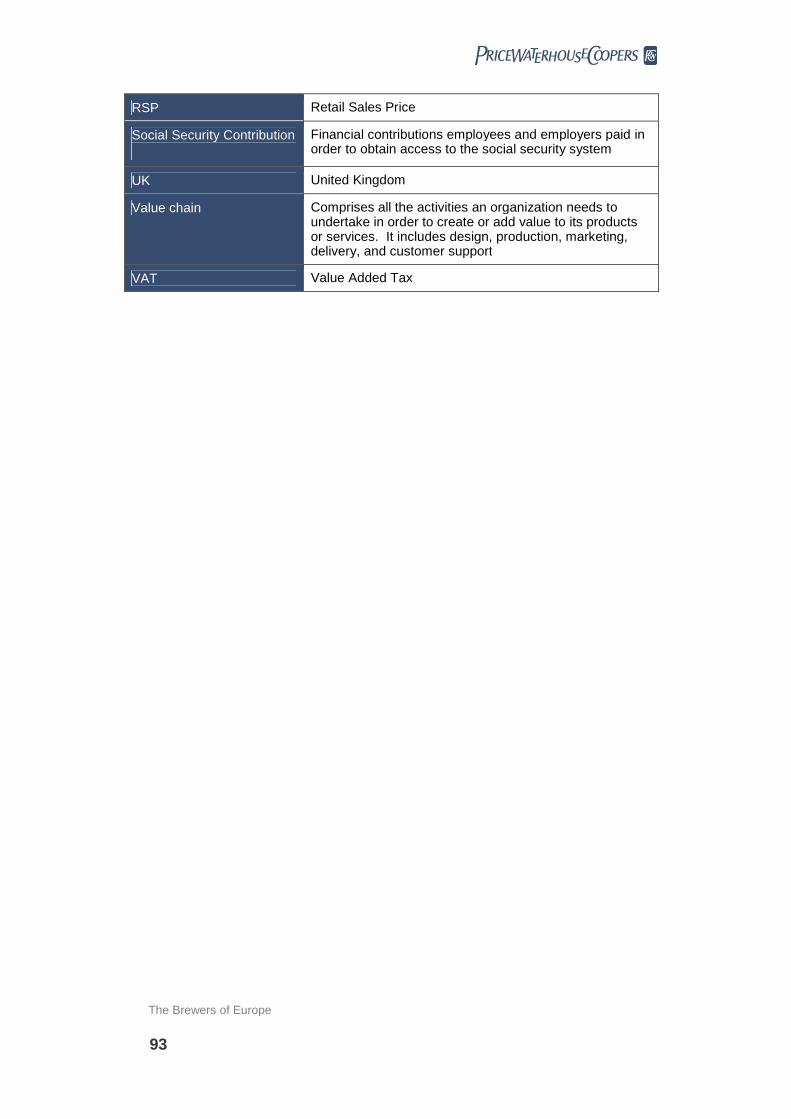
The Brewers of Europe
93
RSP Retail Sales Price
Social Security Contribution Financial contributions employees and employers paid inorder to obtain access to the social security system
UK United Kingdom
Value chain Comprises all the activities an organization needs toundertake in order to create or add value to its productsor services. It includes design, production, marketing,delivery, and customer support
VAT Value Added Tax

The Brewers of Europe
94
Contact Information
For more information about this study, please contact us. See below for contact details:
The Brewers of Europe23-25 Rue CarolyB- 1050 BrusselsBelgium
Phone: (32) 2 – 551 18 10Fax: (32) 2 – 660 94 02Web: www.brewersofeurope.org
Head of Communications: Niall DohenyEmail: [email protected]
SecretariatEmail:[email protected]
PwC AdvisoryAlmagro, 4028010 MadridSpain
Phone: (34) 91 – 568 44 00Fax: (34) 91 – 568 58 26Web: www.pwc.com
Chapter I – Impact of tax changes
Director: Enrique Cañizares PachecoEmail: [email protected]
Chapter II – Comparable cost analysis
Director: Pablo García VelascoEmail: [email protected]