TAXES AND YOUR PORTFOLIO - Fidelity Investments and your Portfolio . Topic overview: It is important...
35
TAXES AND YOUR PORTFOLIO: It’s not what you earn, it’s what you keep
Transcript of TAXES AND YOUR PORTFOLIO - Fidelity Investments and your Portfolio . Topic overview: It is important...

TAXES AND YOUR PORTFOLIO:
It’s not what you earn, it’s what you keep

2
John Sweeney
Executive Vice President, Retirement & Investing Strategies,
Fidelity Investments
YOUR HOST
JOIN THE CONVERSATION: @SweeneyFidelity

3
Louis Satisky
Regional Vice President,
Fidelity Investments
Howard Spielberg
Regional Vice President,
Fidelity Investments
PRESENTERS Taxes and
your Portfolio
JOIN THE CONVERSATION: @Fidelity │ @SweeneyFidelity │ #SomedayEvent

4
Retirement Planning
• Savings Strategy
• Income Strategy
• Personal
(Taxable, IRA,
Annuity)
• Workplace
Investments
• Benefits and
Social Security
• Health Care/
Long-Term Care
Income Protection
• Disability
• Premature Death
Protection
• Outliving Income
Asset Protection
• Estate Planning
• Wills
• Trusts
• Wealth Transfer
• Charitable Giving
Family Conversations
• Education
• Living Expenses:
Children and Parents
• Assisting Parents and
Relatives
Your Family Wealth planning is complex and unique to every family. We can guide you in considering questions and addressing concerns that help your family reach its wealth planning goals.
Investment Strategy
• Asset Allocation
• Tactical Allocation
• Asset Location
• Tax-Efficient
Investing
• Taxable Savings
Strategy
Retirement Planning
• Savings Strategy
• Income Strategy
• Personal
(Taxable, IRA,
Annuity)
• Workplace
Investments
• Benefits and
Social Security
• Health Care/
Long-Term Care
Income Protection
• Disability
• Premature Death
Protection
• Outliving Income
Asset Protection
• Estate Planning
• Wills
• Trusts
• Wealth Transfer
• Charitable Giving
Family Conversations
• Education
• Living Expenses:
Children and Parents
• Assisting Parents and
Relatives
Investment Strategy
• Asset Allocation
• Tactical
Allocation
• Asset Location
• Tax-Efficient
Investing
• Taxable Savings
Strategy
Fidelity does not provide legal, tax, or estate planning advice. Please consult an appropriately licensed professional for advice on your specific situation.
Primarily sourced from The New Advisor for Life, John Wiley & Sons, 2011, by Stephen D. Gresham with permission to reprint.
Fidelity Brokerage Services LLC, Member NYSE, SIPC, 900 Salem Street, Smithfield, RI 02917. © 2014 FMR LLC. All rights reserved. 581279.12.0
WEALTH PLANNING OVERVIEW Taxes and
your Portfolio

5
OVERVIEW Taxes and
your Portfolio
Topic overview:
It is important to have a plan in place that addresses taxes. The fact is, taxes can have a significant impact on your investment returns at any stage of your investing life. We believe overlooking the potential impact of taxes is a common investor mistake.
Goals:
At Fidelity, we can help you develop an ongoing strategy – a plan that seeks to defer, manage, and reduce taxes.
What you’ll learn:
• How taxes can affect yourinvestments
• Strategies to help defer,manage and reduce taxes
• How Fidelity can help

6
POLL QUESTION #1
How would you describe your understanding of how taxes impact your investments?
Taxes and
your Portfolio
A. Very knowledgeable
B. Somewhat knowledgeable
C. Not very knowledgeable

YOUR RESPONSE
How would you describe your understanding of how taxes impact your investments?
15.5%
61.2%
23.4%
Very knowledgeable Somewhat knowledgeable Not very knowledgeable
Taxes and
your Portfolio
7

8
TYPES OF TAXES
*Tax rates as of January 2015.
†Includes 3.8% Medicare surtax, which applies to single filers with Modified Adjusted Gross Income (MAGI) above $200,000 and jointfilers with MAGI above $250,000.
Tax Types Impact*
Long-Term Capital Gains
Up to 23.8%† (plus state and local taxes)
Qualified Dividends
Short-Term Capital Gains Ordinary income tax rates are potentially subject to
the Medicare surtax — up to a total of 43.4%† (plus
state and local taxes) Interest and Non-Qualified
Dividends
Alternative Minimum Tax (AMT) Potential to increase your effective marginal tax rate
on long-term capital gains and qualified dividends
Do you know what you pay in taxes on
your investments? Q
Taxes and
your Portfolio

9
POLL QUESTION #2
Where do you think your tax rate will be in five years?
Taxes and
your Portfolio
A. Your tax rate will be higher
B. Your tax rate will be lower
C. Your tax rate will be
unchanged

YOUR RESPONSE Taxes and
your Portfolio
Where do you think your tax rate will be in five years?
40.7%
28.3% 31.0%
Taxes will be higher Taxes will be lower Taxes will be unchanged
10

11
100%
80%
60%
40%
20%
HISTORICAL TAX RATES
Top U.S. Federal Tax Rates
Data represents the top federal marginal ordinary income tax rates and long-term capital gains tax rates, including the Medicare surcharge, as reported by http://www.taxfoundation.org/taxdata/show/151.html, “U.S. Federal Individual Income Tax Rates History,” The Tax Foundation, September 9, 2011, and “Top Federal Income Tax Rates on Regular Income and Capital Gains since 1916,” Citizens for Tax Justice, May 2004.
Ta
x R
ate
0%
Top income tax rate Top capital gains tax rate
Year
1916 1932 1948 1964 1980 1996 2015
Where do you think your tax rate is headed
in the future? Q
Taxes and
your Portfolio

12
TAXES CAN SIGNIFICANTLY REDUCE RETURNS
Impact of taxes on investment returns* from 1926–2014
*Past performance is no guarantee of future results. This chart is for illustrative purposes only and does not represent actual or futureperformance of any investment option. Returns include the reinvestment of dividends and other earnings. Stocks are represented by theStandard & Poor’s 500 Index (S&P 500® Index). The S&P 500® Index is a registered service mark of The McGraw-Hill Companies, Inc.,and has been licensed for use by Fidelity Distributors Corporation and its affiliates. It is an unmanaged index of common stock prices of500 widely held U.S. stocks. Bonds are represented by the 20-year U.S. government bond. Inflation is represented by the ConsumerPrice Index (CPI), which is a widely recognized measure of inflation, calculated by the U.S. government. Please note that indexes areunmanaged and are not illustrative of any particular investment. It is not possible to invest directly in an index.
Morningstar Inc. All rights reserved. 3/1/2015. See Appendix A for more information.
10.1%
5.7%
8.1%
3.6%
Stocks after
taxes
Stocks Bonds after
taxes
Bonds
Ave
rag
e A
nnu
al R
etu
rn %
Taxes and
your Portfolio

13
CREATING A MORE EFFICIENT INVESTING STRATEGY
REDUCE REDUCE FUTURE TAXES
WITH INVESTMENTS AND
STRATEGIES INCLUDING:
• Roth IRAs
• Municipal bonds
• 529 college savings
accounts
• Charitable giving
DEFER
DEFER PAYING TAXES WITH TAX-ADVANTAGED
ACCOUNTS SUCH AS:
• 401(k)s
• 403(b)s
• IRAs
• Deferred annuities
MANAGE
MANAGE THE TAXES YOU
PAY BY EMPLOYING
STRATEGIES INCLUDING:
• Asset location
• Tax-loss harvesting
• Tax-efficient fund selection
• Managing mutual fund distributions
• Managing capital gains
Taxes and
your Portfolio

DEFER PAYING TAXES WITH
TAX-ADVANTAGED ACCOUNTS

15
TAX-ADVANTAGED ACCOUNTS
*For a traditional IRA, full deductibility of a contribution is available to active participants whose 2015 Modified Adjusted Gross Income (MAGI) is $98,000 or less (joint) and$61,000 or less (single); partial deductibility for MAGI up to $118,000 (joint) and $71,000 (single). In addition, full deductibility of a contribution is available for working ornonworking spouses who are not covered by an employer-sponsored plan whose MAGI is less than $183,000 for 2015; partial deductibility for MAGI up to $193,000.
†Roth IRA income requirements: For single filers: For 2015, single filers with Modified Adjusted Gross Income (MAGI) up to $116,000 are eligibleto make a full contribution; a partial contribution can be made for MAGI of $116,000–$131,000. Married filing jointly: For 2015, MAGI up to$183,000 for a full contribution; partial contribution for MAGI of $183,000–$193,000.
‡Issuing insurance companies reserve the right to limit contributions.
Are you taking full advantage of your
employer-sponsored plans? Q
2015 Annual
Contribution Limits
Minimum Required
Distribution Rules
Contribution
Treatment
Employer-Sponsored
Plans
[401(k)s, 403(b)s]
• $18,000 per year per
employee
If age 50 or above,
$24,000 per year
• Mandatory withdrawals
starting in the year you turn
70½ (except for Roth)
• Pre-tax
IRAs
(Traditional* and Roth†)
• $5,500 per year
If age 50 or above,
$6,500 per year
• Mandatory withdrawals
starting in the year you turn
70½ (except for Roth)
• Pre-tax or After-tax
Tax-Deferred Annuities • No contribution limit‡ • Not subject to minimum
required distribution rules
for nonqualified assets
• After-tax
Taxes and
your Portfolio

MANAGE THE TAXES ON YOUR
INVESTMENTS

17
DO YOU WANT TO KEEP MORE OF WHAT YOU EARN? Taxes and
your Portfolio

18
REDUCING CAPITAL GAINS TAXES
$10,000 Hypothetical Pre-tax Gain*
$5,660
After-tax
gain
$4,340
Taxes
An investor keeps
$7,620
After-tax
gain 43.4% taxes paid
An investor keeps
23.8% taxes paid
Short term Long term vs.
1 YEAR
$2,380
Taxes
For this example, we assume the investor is subject to the top capital gains rate and is paying 43.4% on short-term gains and 23.8% on long-term gains. Tax savings will depend on an individual’s actual capital gains and tax rate, and may be more or less than this example. This is a hypothetical example for illustrative purposes only and is not intended to represent the performance of any investment.
*The taxes saved by waiting until a short-term investment gain (<1 year) becomes a long-term gain (>1 year) can be calculated as follows:(gain $) x (short-term rate – long-term rate) = tax savings.
Taxes and
your Portfolio

19
TAX-LOSS HARVESTING CAN MAKE A DIFFERENCE
Which lot should I sell?
GAIN
TAX LOT 2
50 Shares at $50/Share
50 Shares at $75/Share
SELL at $60/Share
LOSS
JAN. 2013 JAN. 2014 TODAY
TAX LOT 1
Generally, among asset classes, stocks are more volatile than bonds or short-term instruments and can decline significantly in response to adverse issuer, political, regulatory, market, or economic developments. Although the bond market is also volatile, lower-quality debt securities, including leveraged loans, generally offer higher yields compared with investment-grade securities, but also involve greater risk of default or price changes. Foreign markets can be more volatile than U.S. markets due to increased risks of adverse issuer, political, market, or economic developments, all of which are magnified in emerging markets.
The tax information contained herein is general in nature, is provided for informational purposes only, and should not be construed as legal or tax advice. Fidelity does not provide legal or tax advice.
For illustrative purposes only.
Taxes and
your Portfolio
20
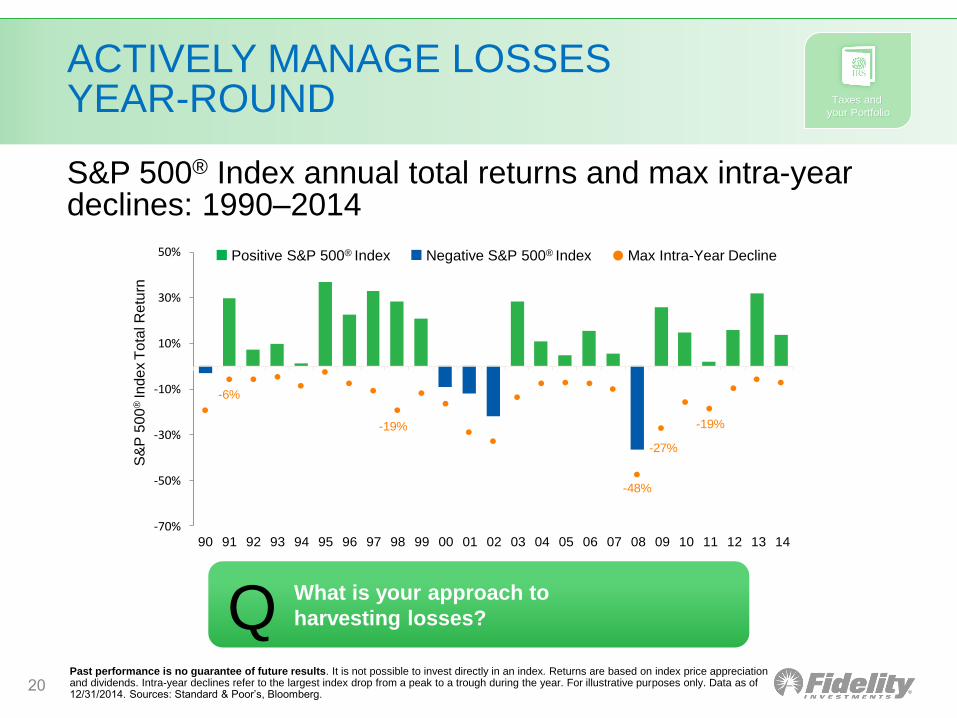
-6%
-19%
-48%
-27%
-19%
-70%
-50%
-30%
-10%
10%
30%
50%
90 91 92 93 94 95 96 97 98 99 00 01 02 03 04 05 06 07 08 09 10 11 12 13 14
S&
P 5
00
® In
de
x T
ota
l R
etu
rn
Positive S&P 500® Index Negative S&P 500® Index Max Intra-Year Decline
ACTIVELY MANAGE LOSSES YEAR-ROUND
S&P 500® Index annual total returns and max intra-year declines: 1990–2014
What is your approach to
harvesting losses? QPast performance is no guarantee of future results. It is not possible to invest directly in an index. Returns are based on index price appreciation and dividends. Intra-year declines refer to the largest index drop from a peak to a trough during the year. For illustrative purposes only. Data as of 12/31/2014. Sources: Standard & Poor’s, Bloomberg.
Taxes and
your Portfolio

21
TAKING CONTROL
What strategies are you using to control
your tax impact? Q
Beyond your control
The FUND SELLS a holding
for a capital gain or receives
dividends or interest.
Current taxes are owed on the
fund’s taxable distributions
received by shareholders.
Within your control
INVESTOR SELLS
shares of a fund for a capital
gain/loss or to rebalance.
Current taxes are owed
on realized capital gains.
Taxes and
your Portfolio

22
MATCH THE RIGHT ACCOUNT WITH THE RIGHT INVESTMENT
The relative tax efficiency of these investments are generalizations and are not universally accurate. Each investment should be considered individually for the benefits of being held in a taxable or tax-deferred account.
1Equity Income Funds typically distribute most of their income in the form of Qualified Dividends, which for many taxpayers are taxed relatively lightly, allowing most Equity Income Funds and ETFs to be considered High Tax Efficiency investments when compared with other investment options that generate taxable income. However, for higher income taxpayers, Qualified Dividends may be subject to both a higher tax rate and also the Medicare surtax on investment income, which may make them less efficient for those investors.
2Applies to investors who are subject to high rates of state/local tax on investment income; for other investors, these bond funds should be considered Lower Tax Efficiency.
Consider for Taxable Accounts Consider for Tax-Deferred Accounts
MORE TAX EFFICIENT LESS TAX EFFICIENT
Have you matched your investments and
your accounts effectively? Q
Lower Tax Efficiency High Tax Efficiency Medium Tax Efficiency
Bond Funds with Large U.S.
Treasuries Allocations2
Typical Actively Managed Equity
Funds
Equity Index Funds (other than REITs)
Equity Index ETFs (other than REITs)
Equity Income Funds1
Equity Income ETFs1
Tax-Managed Equity Funds
Equity Separately Managed Accounts
High-Turnover Equity Funds
Mortgage Bond Funds
Corporate Bond Funds
Leveraged Loan / Floating
Rate Bond Funds
U.S. High Yield Bond Funds
Emerging Market Bond Funds
REIT Funds
Taxes and
your Portfolio

23
VALUE OF TAX-SENSITIVE INVESTMENT MANAGEMENT
Hypothetical cumulative value of tax-sensitive investment management—growth strategy*
$0.8
$1.0
$1.2
$1.4
$1.6
$1.8
$2.0
$2.2
2002
Po
rtfo
lio V
alu
e (
$M
)
2003 2004 2005 2006 2007 2008 2009 2010 2011 2012 2013 2014
$2.09M
$1.84M
Hypothetical Account Value with Tax-Sensitive Investment Management
Hypothetical Account Value without Tax-Sensitive Investment Management
A potential increase of $256,039 from
tax-sensitive investment management
*Based on strategy composites. (See Appendix B for information on the composites.) These results are hypothetical and do not represent actualvalue added to client accounts. Returns for individual clients will vary. Performance shown represents past performance, which is not a guarantee of future results. Investment returns and principal value will fluctuate, and you may lose money.
For illustrative purposes only.
Taxes and
your Portfolio

HELP REDUCE TAXES NOW
OR IN THE FUTURE

25
HELP REDUCE TAXES NOW OR IN THE FUTURE
What strategies are you employing to
reduce current and future taxes? Q
Charitable
Giving
529 College
Savings
Accounts
Municipal
Bonds
Self-Directed
or Managed
Roth
Accounts
Roth IRA
Conversion
Taxes and
your Portfolio

26
• Expect higher taxes in the future
• Have a long investment time frame
• Can afford to pay taxes on the conversion from taxable accounts
• Want greater flexibility managing withdrawals
• Plan to pass most of your retirement assets to your beneficiaries
• Have IRA assets consisting entirely of nondeductible contributions
• Expect to have lower taxable income than usual this year
• Expect additional investment income in future years
• Have retirement accounts you expect to increase in the future
ROTH ACCOUNTS OR ROTH IRA CONVERSION
You might want to consider a ROTH conversion if you:
Taxes and
your Portfolio

27
When would you prefer to pay taxes?
How can you diversify your tax risk?
How would you prefer to manage your investments?
When do you need to access your money?
KEY CONSIDERATIONS Taxes and
your Portfolio
When would you prefer to pay taxes?
How can you diversify your tax risk?
How would you prefer to manage your investments?
When do you need to access your money?

28
1. Meet with a Fidelity Investment Professional.
2. Understand how taxes impact your investments.
3. Choose investment accounts and strategies to help meet your goals:
4. Set up regular check-ins.
5. Learn more at Fidelity.com/TEI.
HOW FIDELITY CAN HELP
Reduce Defer Manage
• Asset location
• Tax-loss harvesting
• Tax-efficient fund selection
• Managing mutual fund
distributions
• Managing capital gains
• 401(k)s
• 403(b)s
• IRAs
• Deferred annuities
• Roth IRAs
• Municipal bonds
• 529 college savings
accounts
• Charitable giving
Taxes and
your Portfolio

29
LEARN MORE AT FIDELITY.COM/TEI
For illustrative purposes only.
Taxes and
your Portfolio

30
QUESTIONS AND ANSWERS
JOIN THE CONVERSATION: @Fidelity │ @SweeneyFidelity │ #SomedayEvent

31
IMPORTANT INFORMATION: APPENDIX A
Taxes Can Significantly Reduce Returns data, Morningstar, Inc., 2015. Federal income tax is calculated using the
historical marginal and capital gains tax rates for a single taxpayer earning $110,000 in 2010 dollars every year.
This annual income is adjusted using the Consumer Price Index in order to obtain the corresponding income level
for each year. Income is taxed at the appropriate federal income tax rate as it occurs. When realized, capital gains
are calculated assuming the appropriate capital gains rates. The holding period for capital gains tax calculation is
assumed to be five years for stocks, while government bonds are held until replaced in the index. No state income
taxes are included. Stock values fluctuate in response to the activities of individual companies and general market
and economic conditions. Generally, among asset classes stocks are more volatile than bonds or short-term
instruments. Government bonds and corporate bonds have more moderate short-term price fluctuations than
stocks, but provide lower potential long-term returns. U.S. Treasury bills maintain a stable value if held to maturity,
but returns are generally only slightly above the inflation rate. Although bonds generally present less short-term risk
and volatility than stocks, bonds do entail interest rate risk (as interest rates rise, bond prices usually fall, and vice
versa), issuer credit risk, and the risk of default, or the risk that an issuer will be unable to make income or principal
payments. The effect of interest rate changes is usually more pronounced for longer-term securities. Additionally,
bonds and short-term investments entail greater inflation risk, or the risk that the return of an investment will not
keep up with increases in the prices of goods and services, than stocks.
Taxes and
your Portfolio

32
IMPORTANT INFORMATION: APPENDIX B Taxes and
your Portfolio

33
IMPORTANT INFORMATION: APPENDIX B (CONTINUED)
Performance shown represents past performance, which is no guarantee of future results. Investment return and principal value of
investments will fluctuate over time. A client’s underlying investments may differ from those of the composite portfolio. Returns for
individual clients may differ significantly from the composite returns and may be negative. Current performance may be higher or
lower than returns shown. Composite and after-tax benchmark returns are asset weighted because both are based on individual
client accounts. Pre-tax benchmarks are not asset weighted, because they are based on market indexes. Returns include changes
in share price and reinvestment of dividends and capital gains. The index performance includes the reinvestment of dividends and
interest income. An investment cannot be made in an index. Securities indexes are not subject to fees and expenses typically
associated with managed accounts or investment funds. The underlying funds in each composite portfolio may not hold all the
component securities included in, or in the same proportion as represented in, its corresponding customized benchmark. Only
Fidelity® Personalized Portfolios that are all stock or include national and state-specific municipal bond funds are included.
Availability of state-specific funds depends on client’s state of residence. Fidelity Personalized Portfolios (“FPP”) launched July
2010; performance before such date reflects only Fidelity Private Portfolio Service (“PPS”) accounts. See endnote 11 for more
information on how these returns and benchmarks are calculated.
The results in Appendix B represent average annual composite returns (net of fees) for FPP client accounts managed by Strategic Advisers
that use an all-stock strategy or a strategy with municipal bond funds. N on-fee-paying accounts may be included in composites. This may
increase the overall composite performance with respect to the net-of-fees performance. The pre-tax benchmarks consist of market indexes.
The after-tax benchmarks consist of mutual funds, because an investable asset with known tax characteristics is needed to calculate after-tax
benchmark returns for comparison.
Composite portfolio excess returns are the difference between composite portfolio returns and their applicable composite portfolio benchmark
returns. Both the pre-tax and after-tax composite portfolio benchmark returns are blended from either representative market indexes (for pre-
tax benchmarks) or representative mutual funds (for after-tax benchmarks) in weightings based on the long-term asset allocation of each
strategy. The benchmark returns are calculated monthly based on the long-term asset allocation of the strategies at that time so the
benchmarks reflect historical changes to the asset allocation of each strategy. The benchmark long-term allocation weightings may vary
slightly from individual client accounts due to individual account investments and activity. The tables on the next page detail the current
composition of the benchmarks for each of the investment strategies that are all stock or with a municipal bond fund component mentioned in
this webinar.
11 Based on strategy composites. (See Appendix C for information on the composites.) These results and slide 22 are hypothetical and do not
represent actual value added to client accounts. Returns for individual clients will vary. Performance shown represents past performance,
which is not a guarantee of future results. Investment returns and principal value will fluctuate, and you may lose money.
Taxes and
your Portfolio

34
IMPORTANT INFORMATION: APPENDIX C Taxes and
your Portfolio

35
IMPORTANT INFORMATION
Fidelity Brokerage Services LLC, Member NYSE, SIPC, 900 Salem Street, Smithfield, RI 02917
© 2015 FMR LLC. All rights reserved.
740973.1.0
Before investing, consider the funds' investment objectives, risks, charges, and expenses. Contact Fidelityfor a prospectus or, if available, a summary prospectus containing this information. Read it carefully.
Keep in mind that investing involves risk. The value of your investment will fluctuate over time and you may gain orlose money.
Past performance is no guarantee of future results.
Diversification and asset allocation do not ensure a profit or guarantee against a loss.
In general, the bond market is volatile, and fixed income securities carry interest rate risk. (As interest rates rise, bondprices usually fall, and vice versa. This effect is usually more pronounced for longer-term securities.) Fixed incomesecurities also carry inflation risk, liquidity risk, call risk, and credit and default risks for both issuers andcounterparties. Unlike individual bonds, most bond funds do not have a maturity date, so holding them until maturity toavoid losses caused by price volatility is not possible.
The municipal market can be affected by adverse tax, legislative, or political changes, and by the financial condition ofthe issuers of municipal securities.
Fidelity does not provide legal or tax advice. The information herein is general and educational in nature and shouldnot be considered legal, tax, or estate planning advice. Tax laws and regulations are complex and subject to change,which can materially impact investment results. Fidelity cannot guarantee that the information herein is accurate,complete, or timely. Fidelity makes no warranties with regard to such information or results obtained by its use, anddisclaims any liability arising out of your use of, or any tax position taken in reliance on, such information. Consult anattorney or tax professional regarding your specific situation.
Taxes and
your Portfolio