TAX RATIOS ON LABOUR AND CAPITAL INCOME AND ON … · assessing tax burdens on labour and capital,...
46
OECD Economic Studies No. 35, 2002/2 129 © OECD 2002 TAX RATIOS ON LABOUR AND CAPITAL INCOME AND ON CONSUMPTION David Carey and Josette Rabesona TABLE OF CONTENTS Introduction ................................................................................................................................. 130 Methodology................................................................................................................................ 131 General approach, underlying assumptions and data problems ..................................... 131 Household income tax ratio, τ h ............................................................................................. 132 Labour income tax ratio, τ L .................................................................................................... 136 Consumption tax ratio, τ c ........................................................................................................ 137 Labour and consumption tax ratio combined, τ LC .............................................................. 137 Capital income tax ratio, τ k ..................................................................................................... 138 Results .......................................................................................................................................... 138 Revised approach ................................................................................................................... 138 Differences from the Mendoza approach............................................................................. 141 Relations with variables of interest ...................................................................................... 142 Effects of modifying certain assumptions ................................................................................ 145 Dividing self-employed income into capital and labour components ............................ 145 Separating self-employed income from labour- and capital income ............................... 146 Excluding tax on government interest (transfer) payments .............................................. 148 Excluding direct taxes and social security contributions on government benefit (transfer) payments ................................................................................................... 150 Allowing for preferential tax treatment of household capital income .............................. 153 Conclusion.................................................................................................................................... 161 Annex .......................................................................................................................................... 171 Bibliography ................................................................................................................................ 174 The authors would like to thank Christopher Heady, Willi Leibfritz, Carlos Martinez Mongay, Steven Clark, Kathryn Gordon, Jeffrey Owens, Paul Atkinson, Chiara Bronchi, Jørgen Elmeskov, Andreas Woergoetter and members of the Working Party on Tax Policy Analysis and Tax Statistics of the OECD Committee on Fiscal Affairs as well as other OECD colleagues for drafting suggestions and/or comments on an earlier draft of this paper. The authors would also like to thank Lyn Urmston for technical support. All errors and omissions, of course, are the authors.
Transcript of TAX RATIOS ON LABOUR AND CAPITAL INCOME AND ON … · assessing tax burdens on labour and capital,...

OECD Economic Studies No. 35, 2002/2
129
© OECD 2002
TAX RATIOS ON LABOUR AND CAPITAL INCOME AND ON CONSUMPTION
David Carey and Josette Rabesona
TABLE OF CONTENTS
Introduction ................................................................................................................................. 130
Methodology................................................................................................................................ 131General approach, underlying assumptions and data problems ..................................... 131Household income tax ratio, τh ............................................................................................. 132Labour income tax ratio, τL .................................................................................................... 136Consumption tax ratio, τc........................................................................................................ 137Labour and consumption tax ratio combined, τLC .............................................................. 137Capital income tax ratio, τk..................................................................................................... 138
Results .......................................................................................................................................... 138Revised approach ................................................................................................................... 138Differences from the Mendoza approach............................................................................. 141Relations with variables of interest ...................................................................................... 142
Effects of modifying certain assumptions ................................................................................ 145Dividing self-employed income into capital and labour components ............................ 145Separating self-employed income from labour- and capital income............................... 146Excluding tax on government interest (transfer) payments .............................................. 148Excluding direct taxes and social security contributions on government benefit (transfer) payments ................................................................................................... 150Allowing for preferential tax treatment of household capital income.............................. 153
Conclusion.................................................................................................................................... 161
Annex .......................................................................................................................................... 171
Bibliography ................................................................................................................................ 174
The authors would like to thank Christopher Heady, Willi Leibfritz, Carlos Martinez Mongay, Steven Clark,Kathryn Gordon, Jeffrey Owens, Paul Atkinson, Chiara Bronchi, Jørgen Elmeskov, Andreas Woergoetter andmembers of the Working Party on Tax Policy Analysis and Tax Statistics of the OECD Committee on FiscalAffairs as well as other OECD colleagues for drafting suggestions and/or comments on an earlier draft ofthis paper. The authors would also like to thank Lyn Urmston for technical support. All errors andomissions, of course, are the authors.

130
© OECD 2002
INTRODUCTION
In order to assess the effects of taxation on labour markets, investment, sav-ings and redistribution, it is necessary to construct measures that take account ofstatutory tax rates, rules that determine the tax base and credits. One approach isto calculate effective tax rates for particular household types or investment/sourceof finance combinations based on information about these tax factors. Thisapproach, which is used in OECD Taxing Wages to calculate average effective taxrates on labour and in Devereux and Griffith (1998) to calculate average effectivetax rates on capital, requires a great deal of detailed information and the combina-tion of many individual cases to obtain representative aggregate estimates.Another approach, pioneered by Mendoza et al. (1994), is to calculate tax ratios,1
which relate realised tax revenues directly to the relevant macroeconomic vari-ables in the national accounts. This approach is relatively simple, captures theoverall effects of deductions, credits and taxpayer behaviour. However, it relies ona number of limiting assumptions, most of which are needed to allow the availabledata to be used to form estimates of the value of revenue streams and the rele-vant macroeconomic variables. Moreover, the estimates are backward looking and,in the case of capital tax ratios, may not be well adapted to assessing the effects oftaxation on both investment and saving in the presence of cross-border capitalflows. Despite these limitations, tax ratios may provide a useful starting point forassessing tax burdens on labour and capital, notably to respond to claims that glo-balisation has resulted in a shift in the tax burden from capital to labour, and foranalysing the effects of taxation on labour markets. However, this should be com-plimented by a broader approach when examining the economic effects of taxa-tion that also considers average and marginal effective tax rates and, if possible,the effects of tax shifting on final tax incidence.
Tax ratio estimates could be improved by relaxing some of the unrealisticassumptions made by Mendoza et al. (1994). This paper proposes a number ofchanges to make the underlying assumptions more realistic. These changesreduce the increase in labour income tax ratios and raise the increase in capitalincome tax ratios compared with the Mendoza estimates, overturning the conclu-sion that there has been a relative shift in the tax burden from capital to labour inrecent decades. The two data sets are, however, highly correlated in most coun-tries. Even these revised tax ratio estimates are based on a number of unrealistic

Tax Ratios on Labour and Capital Income and on Consumption
131
© OECD 2002
assumptions that could not be systematically relaxed owing to a lack of data for cer-tain countries and/or periods. Relaxing these assumptions where possible some-times results in large changes in tax ratios, especially when assumptions concerningthe treatment of self-employed income and personal capital income are modified.These results reinforce the view that caution is required when using tax ratios tosupport a given policy stance or to advocate a particular direction for reform.2 Theyshould be used in conjunction with more broadly based analyses and with other taxindicators and information that can corroborate the story they tell.
The methodology and underlying assumptions used to calculate tax ratios areoutlined in the next section along with some of the data problems that areencountered. Revised tax ratios are presented in the following section, togetherwith the main differences from tax ratios calculated using the Mendoza equationsand simple regressions relating the revised ratios to the major macroeconomicvariables of interest. Finally, the results of the sensitivity analysis to relaxation ofsome of the remaining assumptions that appear to be unrealistic are presented.
METHODOLOGY
General approach, underlying assumptions and data problems
The Mendoza et al. (1994) methodology involves relating realised tax revenuesto estimates of the associated tax bases. Tax shifting is not taken into account: theinitial impact of taxes is assumed to be the final incidence. Hence the tax burdenscalculated using this methodology will not correspond to the burdens impacting oneconomic incentives if, as is likely, there is tax shifting. The tax treatment of losses,cross-border flows and tax planning are also ignored, further reducing the relevanceof some tax ratios (notably, capital income tax ratios) as an input to analyses of theeffects of taxes on relevant macroeconomic variables. Tax revenue data come fromOECD Revenue Statistics. This contains time series on revenue streams from varioustypes of tax – on personal incomes, corporate profits, sales, property, etc. – asreported by member countries. Estimates of the value of the associated tax basescome from national accounts. As such data do not readily fit with the tax revenuedata, a number of assumptions – some of them very restrictive – are required toalign the two data sets. One particular problem of fit concerns data on householdtaxes. These data do not distinguish between taxes paid on labour- and capitalincome. Mendoza et al. (1994) deal with this problem by assuming households paythe same effective tax rates on capital and labour incomes (i.e. they assume that thelabour component of the household income tax is proportional to labour’s share inhousehold income). OECD data on statutory tax arrangements show that this assump-tion is unlikely to be a good one for many OECD countries (OECD, 1994). Some havedual income systems that treat capital income differently from labour income and/or

OECD Economic Studies No. 35, 2002/2
132
© OECD 2002
provide relief from double taxation of dividends. There are also special arrangementsfor pensions, owner-occupied housing and individual share ownership.
Another problem is that no distinction is made in national accounts betweenthe labour and capital components of self employed income. As noted above, Men-doza et al. (1994) assign all self-employed income to capital. Alternative approaches,presented in the section on results, are to assign part of this income flow to labourand part to capital or to exclude taxes paid on this income from estimates of the taxratios on labour and capital. The former entails making an estimate of labour incomeof the self-employed, which is an inherently difficult task that could be approachedin a variety of ways, while the latter approach “gets around the problem” by settingit aside. Other problems that arise from using national accounts data are that:
• The definitions of national accounts data categories (e.g. the definition ofthe corporate and quasi-corporate sector) may not be fully comparable toanalogous tax revenue data categories (e.g. corporate income taxes paid);
• The procedures for estimating the consumption of fixed capital, which is usedin calculating net operating surplus, are not comparable across countries (andthis has an important influence on the estimates);
• National accounts data may reflect avoidance and evasion incentives cre-ated by national tax systems. For example, if a country’s tax policies favourcapital income over labour income, then there would be an incentive to dis-guise labour income as capital income.3 The potential for switching reducesthe reliability and comparability of estimates of the tax bases associatedwith capital and labour; and
• It also should be borne in mind that there are differences between the con-cepts of a comprehensive tax base in national accounts and in tax codes,especially for capital income. For instance, capital gains would be includedin comprehensive income in a tax code but not in the national accounts(because there is no value added). Similarly, the payment of dividendsincreases the tax base in countries with a classical system for taxing corpo-rate earnings (i.e. there is double taxation of dividends) but does notincrease capital income in the national accounts (paying dividends doesnot create value added). Another problem is that Revenue Statistics are on acash basis4 whereas national accounts are on an accrual basis. This meansthat the timing of the two data sets does not correspond.
Household income tax ratio, τh
Mendoza method
In order to calculate the labour (τl) or capital (τk) income tax ratios, it is neces-sary to calculate the household income tax ratio (τh). This is used to allocate per-

Tax Ratios on Labour and Capital Income and on Consumption
133
© OECD 2002
sonal income tax to capital and labour under the assumption that the average taxrate paid by each factor of production is the same (i.e. τh). (The results of sensitiv-ity analysis exploring the importance of this assumption for the estimated labourand capital tax ratios are reported in the section on results.) The householdincome tax ratio is equal to personal income tax receipts divided by householdincome (Table 1). Note that in some countries,5 enterprise taxes are included inpersonal income tax (1100); symbols and mnemonics are described in Box 1.Household income comprises operating surplus of the private unincorporatedsector (OSPUE),6 property and entrepreneurial income (PEI)7 and dependentwage income (W). Note that imputed rentals on owner-occupied housing areincluded in OSPUE and that pension fund and life insurance earnings, which areimputed to households in the national accounts, are included in PEI.
Table 1. Mendoza and revised tax ratios
Mendoza method
Revised method
Social security contributions not deductible
Social security contributions deductible
Tax ratio for total household income, τh
τh= 1100/(OSPUE + PEI + W) Same as Mendoza τh = 1100/(OSPUE + PEI + W – 2100 – 2300 – 2400)
Tax ratio on labour income, τ l
τ l = (τh * W + 2000 + 3000)/(W + 2200)
τ l = (τh * W + 2100 + 2200 + α * 2400 + 3000)/(WSSS + 3000)
τ l = (τh * (W – 2100 – α * 2400) + 2100 + 2200 + α * 2400 + 3000)/(WSSS + 3000)
α = W/(OSPUE + PEI + W) = share of labour income in household income
α = (W – 2100)/(OSPUE + PEI +W – 2100 – 2300)
β = 1 – α = share of capital income in household income
Same as not deductible
Tax ratio on consumption, τc
τc = (5110 + 5121)/(CP + CG – CGW – 5110 – 5121)
τc = (5110 + 5121 + 5122 + 5123 + 5126 + 5128 + 5200 – 5212)/(CP + CG – CGW)
Same as not deductible
Tax ratio on labour income and consumption combined, τLC
τLC = τl + (1 – τ l ) * τc Same as not deductible
Tax ratio on capital income, τk
τk = [τh *(OSPUE + PEI)+ 1200 + 4100 + 4400]/OS
τk = [τh * (OSPUE + PEI) + 2300 + β*2400 + 1200 + 4000 + 5125 + 5212 + 6100]/(OS – 3000)
τk = [τh * (OSPUE + PEI –2300 – β * 2400) + 2300 + β * 2400 + 1200 + 4000 + 5125 + 5212 + 6100]/(OS – 3000)

OECD Economic Studies No. 35, 2002/2
134
© OECD 2002
Box 1. Variable names and symbols used
The tax revenue data are identified using the OECD system (OECD RevenueStatistics):
• 1100 Taxes on income, profits and capital gains of individuals or households.
• 1200 Taxes on income, profits and capital gains of corporations.
• 1300 Unallocated taxes on income, profits and capital gains.
• 2000 Total social security contributions (2100 is paid by employees; 2200 byemployers; 2300 by the self-employed and persons outside of the labourforce; 2400 is unallocated).
• 3000 Taxes on payroll and workforce.
• 4000 Taxes on property.
• 4100 Recurrent taxes in immovable property.
• 4400 Taxes on financial and capital transactions.
• 5110 General taxes on goods and services (5111 VAT).
• 5120 Taxes on specific goods and services (5121 excise taxes; 5122 profits offiscal monopolies; 5123 customs and import duties; 5125 taxes on investmentgoods; 5126 taxes on specific services; 5128 other taxes).
• 5200 Taxes on use of goods and performances [5212 taxes on motor vehiclespaid by others (i.e. other than households)].
• 6100 Other taxes paid solely by businesses.
The variables from National Accounts are:
• CP Private final consumption expenditure.
• D Household dividend receipts.
• EE Dependent employment.
• ES Self-employment.
• CG Government final consumption expenditure.
• CGW Government final wage consumption expenditure.
• IG Investment by general government.
• INT Household interest receipts;
• IP Investment by private sector.
• IROOHN Imputed rental income on owner occupied housing net ofexpenses.
• OS Net operating surplus of the overall economy.1
• OSPUE Unincorporated business net income (including imputed rentals onowner-occupied housing).2
• PEI Interest, dividends and investment receipts.3

Tax Ratios on Labour and Capital Income and on Consumption
135
© OECD 2002
Revisions to Mendoza method
Mendoza et al. (1994) assume that households are not able to deduct socialsecurity contributions from their taxable income. While this is true in the UnitedStates, it is not so in most other countries.8 The household tax ratio equationsshould allow for this possibility, as they do in the third column of Table 1.
Some reallocation of tax data is also needed to make the estimates more realis-tic. In particular, business taxes, which are levied on unincorporated enterprises,should be removed from household tax and allocated directly to capital.9 This treat-ment would be in line with that accorded to corporate taxes. Business tax revenuesin the countries concerned (Japan, Germany, and Austria) are shown in Table A1.Moreover, taxes on income, profits and capital gains that had not been allocated tohouseholds or companies (1300) should be allocated to one or the other on thebasis of what seems most appropriate; Mendoza et al. (1994) ignored these taxes.The allocations of 1300 made for the revised calculations are as follows:
• Canada, non-resident withholding tax is added to 1200;
• Austria, tax on interest is added to 1100;10
• Denmark, almost all of this category represents a tax on pension fund earningsand, as a tax on capital income, is added to 1200;
• Greece, this category (impôts extraordinaires) is allocated to households (1100)and companies (1200) according to the relative weights of each in taxes onincome, profits and capital gains (1000);
Box 1. Variable names and symbols used (cont.)
• PIAPH Property income attributable to policy holders (life insurance andpension funds, excluding capital gains).
• W Wages and salaries of dependent employment.
• WSSS Compensation of employees (including private employers’ contributionsto social security and to pension funds).
• YPEPG Government interest payments.
1. This normally includes the statistical discrepancy.2. The mnemonics for this variable reflect the definition in SNA68/ESA79, “Operating surplus
of private unincorporated enterprises”.3. The mnemonics for this variable reflect the definition in SNA68/ESA79, “property and
entrepreneurial income”.

OECD Economic Studies No. 35, 2002/2
136
© OECD 2002
• Hungary, withholding taxes on dividends and interest are added to 1100;
• New Zealand, taxes on interest and dividends are added to 1100 while theremainder of 1300 is added to 1200; and
• Portugal, professional tax (impôt professionnel), supplementary personal tax(impôt complémentaire personnes singulières et collectives), and capital gains tax(impôt sur plus-values) are allocated to 1100, and industrial tax (impôt industriel),land tax (impôt foncier rural et urbain), agriculture tax (impôt industrie agricole),local direct taxes (impôts directs perçus par les administrations locales) and intereston late payments (intérêts payés en retard) are added to 1200.
Labour income tax ratio, τL
Mendoza method
The labour tax ratio relates labour’s share of household income taxes (τh * W)and taxes levied directly on labour income to labour income (see Table 1). Theterm for allocating household income taxes to labour (τh * W) does this in line withlabour’s share in household income. All social security charges (2000) and payrolltaxes (3000) are also allocated to labour, through the other terms in the numerator.Labour income, which appears in the denominator of labour tax ratio equation, con-sists of compensation from dependent employment, including employers’ socialsecurity contributions (2200) (but excluding employers’ contributions to privatepension funds).
Revisions to Mendoza method
Private employers’ contributions to pension funds and payroll taxes should beadded to the labour income base, as they are elements of wage compensation.11
These items can be included in the labour income base by replacing the denomina-tor of the labour income tax ratio with “compensation of employees” (WSSS) plus“taxes on payroll and workforce” (3000),12 as in columns 2 and 3 of Table 1.
Social security contributions of the self-employed (2300) should be allocatedto capital, not labour, as self-employed income is treated as capital income in theMendoza methodology. On the other hand, unallocated social security contribu-tions (2400)13 should be allocated to capital and labour, not just labour, as they arepaid out of both labour and capital incomes. Incorporating these changes entailsdisaggregating total social security contributions so that employees’ (2100) andemployers’ (2200) contributions can be allocated to labour along with its share (α)of unallocated contributions (2400) and allocating self-employed contributionsand the remaining unallocated contributions to capital.

Tax Ratios on Labour and Capital Income and on Consumption
137
© OECD 2002
Consumption tax ratio, τc
Mendoza method
The consumption tax ratio (τc) is calculated as the sum of general consump-tion taxes on goods and services (5110) and excise taxes (5121) divided by thesum of private consumption (CP) and government non-wage consumption (CG-CGW) net of these indirect taxes (see Table 1). Value added tax, which is by far thelargest indirect tax in most countries, is included in the 5110 category. The denom-inator is considerably wider than the tax base normally subject to indirect taxationas government non-wage consumption expenditure and many goods and services(e.g. basic food in some countries, financial services, medical services) in final pri-vate consumption expenditure generally are not subject to indirect taxes. Thiswider tax base is retained on the grounds that indirect tax (notably VAT) is gener-ally paid on inputs to produce such goods and services. Hence, contrary to theassumption made for calculating the other tax ratios, it is implicitly assumed thatthe tax burden on the inputs for such goods and services is passed through intohigher output prices. Government wages (CGW) are excluded from the tax basebecause no indirect tax is levied on purchases of labour. Indirect taxes arededucted in the denominator to reflect the tradition of expressing indirect taxrates as a percentage of the price excluding the tax. For example, a 20 per centVAT adds 20 per cent to the pre-tax price but represents 16.7 per cent of the totalprice including VAT. This adjustment ensures that the theoretical τc for this tax is20 per cent, not 16.7 per cent.
Revisions to Mendoza method14
A number of other indirect taxes should also be taken into account in the con-sumption tax ratio. These are taxes on profits of fiscal monopolies (5122), customsand import duties15 (5123), taxes on specific services (5126), other taxes on spe-cific goods and services (5128)16 and taxes on the use of goods and performanceactivities (5200) except motor vehicle charges paid by others (5212).17 It wouldalso be preferable to express the consumption tax base in gross terms(i.e. including indirect taxes) to improve comparability with the tax ratios on labourand capital income and to facilitate calculating a combined tax ratio on labourincome and consumption.
Labour and consumption tax ratio combined, τLC
The labour and consumption tax ratio combined is of interest because thismeasures the relevant tax burden for choices between supplying labour orenjoying leisure. Assuming that all net labour income is consumed (now or inthe future), it can easily be calculated by adding to the labour tax ratio the

OECD Economic Studies No. 35, 2002/2
138
© OECD 2002
consumption tax ratio adjusted for the share of net labour income in gross labourincome: workers cannot spend income that has been taxed away. Mendoza et al.(1994) did not calculate a combined labour and consumption tax ratio.
Capital income tax ratio, τk
Mendoza method
The capital income tax ratio relates the share of household income tax pertain-ing to capital income [τh * (OSPUE + PEI)] and taxes paid directly out of capitalincome or wealth to capital income (see Table 1). Once again, household incometaxes are allocated in line with the productive factor’s share in household income,where household capital income comprises unincorporated business net income(OSPUE, which includes self-employed income and imputed rentals on owner occu-pied housing) and interest, dividends and investment receipts (PEI). The taxes paiddirectly out of capital income are corporate income taxes (1200),18 recurrent taxes onimmovable property (4100) and taxes on financial and capital transactions (4400) tocapital. While 4100 and 4400 are taxes on stocks of capital and capital transactions,respectively, they nevertheless represent a tax cost levied on capital investmentthat can be expressed as a percentage of income from capital.
Revisions to Mendoza method
All property taxes (4000) should be included in the capital tax ratio as theycan be considered as surcharges on capital income.19 There is also a number ofother taxes paid by business that should be included, including taxes on invest-ment goods (5125),20 motor vehicle charges paid by others21 (5212) and other taxespaid solely by businesses (6100).
RESULTS
Revised approach
The tax ratio on capital income (based on net operating surplus) increased by6.4 percentage points between 1975-80 and 1990-2000 for OECD countries withcomplete data sets,22 to 46.3 per cent (Table 2, Figure 1); see Table A2 for taxratios for individual countries. This increase was greater than that in the labour taxratio, which rose by 5.3 percentage points to 32.3 per cent, and in the consump-tion tax ratio, which increased by 1.1 percentage point to 15.7 per cent. Hence,there was a relative shift in the tax burden from labour to capital income, includingwhen the labour tax burden is assessed using the combined labour and consump-tion tax ratio.23 The relative shift in the tax burden towards capital was particularly

Tax R
atio
s on L
abo
ur and
Cap
ital Inco
me
and
on C
onsu
mp
tion
139
© O
EC
D 2002
Table 2. Tax ratiosPer cent
1. Simple averages of the countries with data in 1975. These countries are Austria, Belgium, Finland, France, Germany, Italy, Spain, Sweden and the United Kingdom.2. Simple averages of the countries with data in 1975. In addition to the EU countries listed above, these countries are Australia, Canada, Japan, Korea, Norway,
Switzerland and the United States.Source: OECD, Revenue Statistics and National Accounts.
Capital based on net operating surplus
Capital based on gross operating surplus
Labour ConsumptionCombined labour and
consumption
1975-80
1980-90
1990-2000
Change between 1975-80
and 1990-2000
1975-80
1980-90
1990-2000
Change between 1975-80
and 1990-2000
1975-80
1980-90
1990-2000
Change between 1975-80
and 1990-2000
1975-80
1980-90
1990-2000
Change between 1975-80
and 1990-2000
1975-80
1980-90
1990-2000
Change between 1975-80
and 1990-2000
Revised approachUnited States 42.2 37.9 39.5 –2.7 29.2 25.8 27.3 –1.9 20.4 22.1 23.4 3.1 6.7 6.6 6.4 –0.4 25.7 27.3 28.3 2.6Japan 35.4 47.6 50.0 14.6 24.4 31.1 27.9 3.5 17.3 21.7 24.1 6.8 6.0 5.8 6.4 0.4 22.9 26.8 29.4 6.5EU-151
Average 42.4 46.0 47.5 5.2 24.6 27.0 28.7 4.1 32.0 35.1 38.0 6.0 15.9 17.3 17.8 1.9 42.6 46.3 48.9 6.3Standard deviation 19.7 17.4 13.0 –6.7 9.4 8.4 6.2 –3.2 6.6 7.0 8.0 1.4 4.3 3.3 2.0 –2.4 8.1 7.4 7.6 –0.5
OECD2
Average 39.9 43.9 46.3 6.4 24.4 26.6 28.1 3.7 27.0 29.6 32.3 5.3 14.6 15.6 15.7 1.1 37.3 40.4 42.6 5.3Standard deviation 15.9 15.0 12.7 –3.3 8.0 7.4 5.8 –2.2 9.7 10.0 10.3 0.6 5.2 5.5 5.3 0.1 10.8 10.4 10.8 0.0
Mendoza approachUnited States 39.3 35.3 36.4 –2.8 27.2 24.1 25.2 –2.0 23.2 25.6 27.1 3.9 5.4 5.3 5.2 –0.2 27.3 29.5 30.9 3.6Japan 31.4 41.9 42.5 11.1 21.7 27.4 23.8 2.2 19.7 25.1 27.6 7.9 4.6 4.9 6.1 1.6 23.4 28.7 32.0 8.7EU-151
Average 33.0 36.6 37.4 4.4 20.1 22.1 23.1 3.1 35.5 39.2 42.5 7.0 16.4 18.1 18.8 2.4 45.7 49.9 53.1 7.4Standard deviation 15.6 15.6 11.7 –3.9 8.4 8.4 6.5 –1.8 8.6 8.1 8.7 5.1 5.5 4.6 3.0 –2.5 11.4 10.0 9.7 –1.7
OECD2
Average 31.9 35.7 37.2 5.3 19.5 21.1 22.1 2.6 29.7 32.8 35.6 5.9 14.0 15.5 16.0 2.0 39.0 42.7 45.4 6.4Standard deviation 12.8 12.6 10.6 –2.2 6.7 6.7 5.6 –1.0 11.4 11.5 11.9 0.5 7.3 7.9 7.5 0.2 14.0 13.3 13.1 –0.9

OECD Economic Studies No. 35, 2002/2
140
© OECD 2002
marked in Japan, where the percentage point increase in the capital income tax ratiowas twice that in the labour income tax ratio. By contrast, the tax burden shifted fromcapital to labour in the United States in absolute terms and in EU countries in relativeterms, with the shift in the United States being particularly marked.
A problem with using capital income tax ratios based on net operating surplusto make cross-country comparisons is that charges for depreciation of fixed assets incountries’ national accounts vary a great deal from one country to another. This vari-ation is mainly attributable to assumed differences in service lives, which are oftenbased on very old studies of tax lives24 and are implausibly large. One way of cir-cumventing this problem is to focus on capital income tax ratios based on grossoperating surplus for such purposes. On this basis, the increase in the capitalincome tax ratio in OECD countries was 3.7 percentage points, similar to theincreases in the EU and Japan but much higher than in the United States, where thecapital income tax ratio fell. These movements brought the capital income tax ratios(based on gross operating surplus) more or less into line in the United States, Japanand the EU at 27-29 per cent. The distribution of capital income tax ratios alsonarrowed for the group of OECD countries for which full data sets are available.
Figure 1. Tax ratios on labour and capital income and on consumptionOECD average,1 per cent
1. Simple averages of the countries with data in 1975.These countries are: Austria, Australia, Belgium, Canada,Finland, France, Germany, Italy, Japan, Korea, Norway, Spain, Sweden, Switzerland, the United Kingdom and theUnited States.
Source: OECD, Revenue Statistics and National Accounts.
55
1976 1978 1980 1982 1984 1986 1988 1990 1992 1994 1996 1998 200010
50
45
40
35
30
25
20
15
55
10
50
45
40
35
30
25
20
15
Labour
Combined labour and consumption Consumption
Capital based on net operating surplus
Per cent Per cent55
1976 1978 1980 1982 1984 1986 1988 1990 1992 1994 1996 1998 200010
50
45
40
35
30
25
20
15
55
10
50
45
40
35
30
25
20
15
Labour
Combined labour and consumption Consumption
Capital based on net operating surplus
Per cent Per cent

Tax Ratios on Labour and Capital Income and on Consumption
141
© OECD 2002
Labour income and consumption tax ratios are well below the OECD averagein the United States and Japan and higher in the EU. The distribution of labourincome and consumption tax ratios in OECD countries for which full data sets areavailable has remained broadly unchanged over the past quarter century. In EUcountries, by contrast, the distribution of labour income tax ratios has widenedand that of consumption tax ratios has narrowed.
There are a number of caveats to bear in mind when comparing tax ratiosacross countries. One is that estimates of labour income tax ratios are influencedby the extent to which countries rely on private rather than public arrangementsfor the provision of retirement income. This is because contributions to privateschemes, even if they are compulsory, are (rightly) not considered to be taxeswhereas contributions to public schemes are considered to be taxes. Similarly,predominantly private health insurance arrangements (as in the United States)tend to reduce the labour income tax ratio compared with countries with predomi-nantly social health insurance arrangements. As for the retirement income financ-ing arrangements, this does not mean, however, that cross-country comparisonsare false. It just means that readers should be aware that differences in labourincome tax ratios may reflect to a considerable extent differences in social insur-ance coverage. By contrast, cross-country comparisons of capital income tax ratioswill be distorted if public enterprises are subject to corporate tax in some coun-tries but not in others (the government taking its share of earnings in the form ofhigher dividends).25 It should also be noted that tax ratios on both labour and cap-ital income are somewhat overstated in countries that levy taxes and/or socialsecurity contributions on most social security benefits. Such levies are particularlyhigh in Denmark, Finland, the Netherlands and Sweden (Adema, 2001, pp. 27-28);this increases the numerator of the household income tax ratio without affectingthe denominator. The effect on the estimates of adjusting for this factor in 1997(the only year for which data are available) are examined below.
Differences from the Mendoza approach
Capital income tax ratios are higher in the revised approach than in the Men-doza approach. This is especially so in the EU, where this difference (based on netoperating surplus) reaches 10 percentage points in 1990-2000. The differencereflects the wider range of taxes taken into account in the revised estimates,including social security contributions of the self-employed (which are larger in EUcountries), and, in EU countries, the deduction of payroll taxes from operating sur-plus in the denominator.26 These differences are considerably smaller when thetax base is gross operating surplus – as the tax base is bigger, differences in taxrevenues are less amplified. The distribution of capital income tax ratios (basedon both gross and net operating surplus) has narrowed more using the revisedapproach than the Mendoza approach, especially for EU countries.

OECD Economic Studies No. 35, 2002/2
142
© OECD 2002
Labour income tax ratios based on the revised approach are somewhat lowerthan in the Mendoza approach. This reflects the facts that part of social securitycontributions (2300 and part of 2400) is no longer allocated to labour and that thetax base is wider, including employer contributions to private pension schemesand payroll taxes. These changes do not, however, affect the ranking of labourincome tax ratios – they remain much higher in EU countries than in the UnitedStates or Japan. While there is no change in the distribution of labour tax ratios forOECD countries in both sets of estimates, there is a widening in the distributionfor EU countries in the revised estimates that is not present in the estimatesbased on the Mendoza approach.
Consumption tax ratios are lower in the revised method, despite a widerrange of indirect taxes being included. This is because the base is expressed ingross terms (i.e. including indirect taxes). Consumption taxes continue to be muchhigher in the EU than in the US or Japan, although the difference is somewhat lessmarked than in the Mendoza approach.
Whereas there is a relative shift in the tax burden in OECD countries fromlabour to capital (based on net operating surplus) in the revised approach, theopposite occurs in the Mendoza approach. The relative shift in the tax burdenfrom labour to capital in Japan is much stronger in the revised approach than inthe Mendoza approach but somewhat weaker in EU countries. In the UnitedStates, the absolute shift in the tax burden from capital to labour is somewhatweaker in the revised approach than in the Mendoza approach.
Despite these differences, tax ratios in the revised approach are highly corre-lated with those based on the Mendoza approach in the majority of cases, sug-gesting that many empirical results would not be affected by the choice ofapproach (Table 3). There are, however, a number of exceptions to this rule:approximately 10 per cent of the correlation coefficients are less than 0.8.
Relations with variables of interest
The revised labour tax ratios are inversely correlated across countries withhours worked per member of the working age population (Figure 2). Results aresimilar when the tax burden on labour is measured using the combined tax ratioon labour income and consumption expenditures.27 Denmark, Finland and Sweden,which have the highest labour income tax ratios, stand out for having higher hoursworked per member of the working-age population than would be predicted onthe basis of this relationship. This may reflect favourable childcare arrangements,which would help to compensate for the effects of high labour taxation by facilitat-ing female labour force participation. By contrast, neither labour income nor com-bined labour and consumption tax ratios are significantly related to structuralunemployment.28 This is what would be expected if real wage rates are flexible in the

Tax Ratios on Labour and Capital Income and on Consumption
143
© OECD 2002
long run. Similarly, capital income tax ratios are not significantly related to eitherinvestment rates (business sector investment/GDP) or private saving rates (pri-vate saving/GDP).29 This could reflect high international capital mobility in OECDcountries, which weakens the link between domestic saving and investment. Inthese circumstances, taxes that discourage household saving may not have mucheffect on investment because the decline in household saving would tend to raisegross investment returns, attracting foreign capital and so driving rates of returnback towards the level in world capital markets. Similarly, taxes that discourage
Table 3. Correlation between Mendoza and revised approaches1
1975-20002
1. Correlation coefficients less than 0.8 are bolded.2. Czech Republic: 1993-2000; Denmark: 1998-2000; Ireland: 1977-2000; Greece: 1990-2000; Hungary: 1995-2000;
Poland: 1991-2000; Netherlands: 1990-2000; New Zealand and Portugal: 1990-2000.3. West Germany before 1991.4. It is assumed that the tax ratio on capital in 2000 is the same as in 1999.5. It is assumed that the tax ratios on capital in 1999 and 2000 are the same as in 1998.Source: OECD, Revenue Statistics and National Accounts.
Capital based on net operating
surplus
Capital based on gross operating
surplusLabour Consumption
Combined labour and consumption
United States 0.99 0.99 0.98 0.94 0.98Japan 0.98 0.99 1.00 0.82 1.00Germany3 0.96 0.96 0.98 0.97 0.99France 0.92 0.92 1.00 0.95 1.00Italy 0.98 0.98 0.99 0.99 0.99United Kingdom 0.97 0.98 0.98 0.98 0.98Canada 0.99 0.99 1.00 0.09 0.98
Australia 0.98 0.99 1.00 0.94 0.98Austria 0.77 0.87 0.99 0.95 0.98Belgium 0.99 0.98 1.00 0.88 0.99Czech Republic4 0.99 0.99 0.49 0.81 0.69
Denmark 0.98 0.97 1.00 1.00 0.99Finland 1.00 0.99 1.00 1.00 0.99Greece 1.00 1.00 0.99 0.86 1.00Hungary .. 0.93 .. –0.78 ..
Ireland 0.97 .. 1.00 0.97 0.99Korea 1.00 1.00 1.00 0.31 0.96Netherlands 0.79 0.70 0.97 0.98 0.96New Zealand 0.96 .. 0.98 0.93 0.99
Norway 0.90 0.95 0.91 0.98 0.96Poland .. 0.93 .. 0.80 ..Portugal5 0.98 0.96 0.42 0.92 0.95Spain 0.98 0.98 0.94 0.98 0.98Sweden 0.92 0.91 0.97 0.96 0.98
Switzerland 0.97 0.90 –0.18 0.96 0.17

OECD Economic Studies No. 35, 2002/2
144
© OECD 2002
Figure 2. Labour tax ratios and hours worked1
Per cent
1. Hours worked per member of the working age population.Source: OECD, Revenue Statistics and National Accounts.
10 20 30 40 50 60
10 20 30 40 6050
USA
JPN
DEUFRA
ITA
GBRCAN
AUS
BEL
DNK FIN
IRL
KOR
NLD
NZL NOR
PRT
ESP
SWE
CHE
USA
JPN
DEU
FRAITA
GBR CANAUS
BEL
DNK FIN
IRL
KOR
NLD
NZLNOR
PRT
ESP
SWE
CHE
Combined labour and consumption tax ratios
Hours worked Hours worked
1 800
Labour tax ratios
Combined labour and consumption tax ratios, average 1990-2000Hours worked (i) = 1 582.73 + (-10.55)* combined labour and consumption tax ratio (i) + E(i)t-value (11.31) (-3.31)R2 = 0.38, R2 adjusted = 0.34
Hours workedHours worked
800
1 000
1 200
1 400
1 600
1 800
800
1 000
1 200
1 400
1 600
800
1 800
1 000
1 200
1 400
1 600
800
1 800
1 000
1 200
1 400
1 600
Labour tax ratios, average 1990-2000Hours worked (i) = 1 479.28 + (-11.03)* labour tax ratio (i) + E(i)t-value (12.97) (-3.17)R2 = 0.36, R2 adjusted = 0.32
Tax Ratios on Labour and Capital Income and on Consumption
145
© OECD 2002
domestic investment need not reduce domestic saving if gross rates of return aredetermined in world capital markets. Capital income tax ratios that distinguishedbetween taxes on returns from domestic savings and on returns from domesticinvestment would be more suited to assessing the effects of taxation on invest-ment and savings decisions.
EFFECTS OF MODIFYING CERTAIN ASSUMPTIONS
There are a number of other adjustments to the tax ratio equations that couldbe made to obtain more realistic estimates. These relate to accounting for self-employed income (it is not all capital income, as assumed above), taxes on gov-ernment transfer payments and preferential tax treatment for household capitalincome. Unfortunately, such changes cannot be made systematically owing to alack of data for certain countries and/or periods. This section assesses the extent towhich the inability to make these adjustments in most cases matters by estimating theimpact on the revised estimates, henceforth referred to as the baseline, of makingthese adjustments whenever possible.
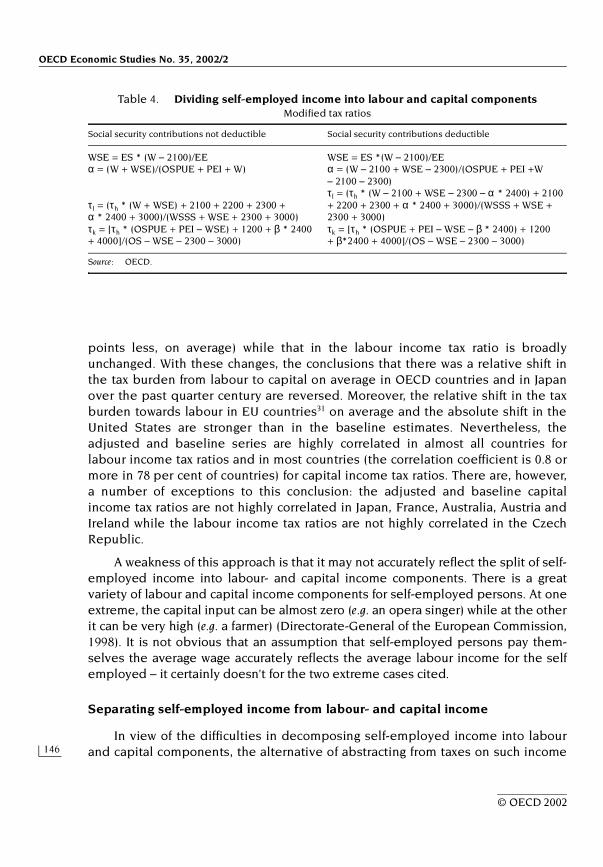
Dividing self-employed income into capital and labour components
Self-employed income does not fit neatly into either of the availablecategories – labour or capital income – in the above estimates. It does not entirelyconsist of capital income, as assumed above, but rather contains elements of bothlabour- and capital income. Unfortunately, SNA data do not provide a breakdownof self-employed income into these two categories. One approach to making such abreakdown is to assign this income flow to both labour and capital. Making such anassignment is inherently difficult and could be done in a number of ways. Theapproach adopted here is to assume that the self-employed “pay themselves” thesame annual salary net of social security contributions (WSE) as that earned by theaverage employee [wages and salaries of dependent employment (W) minusemployees’ social security contributions (2100), all divided by dependent employ-ment (EE)] (Table 4).30 The product of this imputed wage rate and the number ofself-employed (ES) gives the imputed “wage bill” for the self-employed (WSE),excluding social security payments. This estimate of self-employed labour income isthen used to calculate a labour income tax ratio that includes self-employed labourincome and a capital income tax ratio that excludes such income.
This adjustment substantially raises the capital income tax ratio (the averageincrease is 15 percentage points in OECD countries) and slightly reduces thelabour income tax ratio (the average reduction is 1 percentage point) in mostcountries (Table 5). The increase in the capital income tax ratio between 1975-80and 1990-2000 is smaller than in the baseline in most countries (2 percentage
OECD Economic Studies No. 35, 2002/2
146
© OECD 2002
points less, on average) while that in the labour income tax ratio is broadlyunchanged. With these changes, the conclusions that there was a relative shift inthe tax burden from labour to capital on average in OECD countries and in Japanover the past quarter century are reversed. Moreover, the relative shift in the taxburden towards labour in EU countries31 on average and the absolute shift in theUnited States are stronger than in the baseline estimates. Nevertheless, theadjusted and baseline series are highly correlated in almost all countries forlabour income tax ratios and in most countries (the correlation coefficient is 0.8 ormore in 78 per cent of countries) for capital income tax ratios. There are, however,a number of exceptions to this conclusion: the adjusted and baseline capitalincome tax ratios are not highly correlated in Japan, France, Australia, Austria andIreland while the labour income tax ratios are not highly correlated in the CzechRepublic.
A weakness of this approach is that it may not accurately reflect the split of self-employed income into labour- and capital income components. There is a greatvariety of labour and capital income components for self-employed persons. At oneextreme, the capital input can be almost zero (e.g. an opera singer) while at the otherit can be very high (e.g. a farmer) (Directorate-General of the European Commission,1998). It is not obvious that an assumption that self-employed persons pay them-selves the average wage accurately reflects the average labour income for the selfemployed – it certainly doesn’t for the two extreme cases cited.
Separating self-employed income from labour- and capital income
In view of the difficulties in decomposing self-employed income into labourand capital components, the alternative of abstracting from taxes on such income
Table 4. Dividing self-employed income into labour and capital componentsModified tax ratios
Source: OECD.
Social security contributions not deductible Social security contributions deductible
WSE = ES * (W – 2100)/EE WSE = ES *(W – 2100)/EEα = (W + WSE)/(OSPUE + PEI + W) α = (W – 2100 + WSE – 2300)/(OSPUE + PEI +W
– 2100 – 2300)
τl = (τh * (W + WSE) + 2100 + 2200 + 2300 + α * 2400 + 3000)/(WSSS + WSE + 2300 + 3000)
τl = (τh * (W – 2100 + WSE – 2300 – α * 2400) + 2100 + 2200 + 2300 + α * 2400 + 3000)/(WSSS + WSE + 2300 + 3000)
τk = [τh * (OSPUE + PEI – WSE) + 1200 + β * 2400 + 4000]/(OS – WSE – 2300 – 3000)
τk = [τh * (OSPUE + PEI – WSE – β * 2400) + 1200 + β*2400 + 4000]/(OS – WSE – 2300 – 3000)

Tax Ratios on Labour and Capital Income and on Consumption
147
© OECD 2002
altogether in the labour and capital income tax ratios has been followed in somestudies (Directorate-General of the European Commission, 1998; Volkerink andde Haan, 2001). As no data are available in OECD Revenue Statistics on householdincome taxes paid on self-employed income, they must be estimated. Following thegeneral approach above, this can be done by assuming that taxes are paid on suchincome in proportion to its share in household income. Putting this adjustment into
Table 5. Effect of dividing self-employed income into labour- and capital components1975-2000
1. Based on net operating surplus.2. Compared with the revised approach baseline, percentage points.3. Correlation coefficients less than 0.8 are bolded.4. It is assumed that the capital income tax ratio in 2000 is the same as in 1999.5. It is assumed that the capital income tax ratios in 1999 and 2000 are the same as in 1998.6. Simple average.Source: OECD, Revenue Statistics and National Accounts.
Labour income tax ratio Capital income tax ratio1
Change in average level2
Difference in change between
1975-80 and 1990-2000
Correlation coefficient3
Change in average level2
Difference in change between
1975-80 and 1990-2000
Correlation coefficient3
United States –0.19 0.16 1.00 4.82 –3.39 0.94Japan –1.36 0.58 1.00 50.30 –33.03 –0.48Germany –1.01 0.76 0.99 4.46 –4.98 0.93France –1.17 1.28 1.00 2.11 –12.30 0.58Italy –3.45 –0.16 1.00 12.75 1.38 0.90United Kingdom –0.67 –0.32 1.00 21.86 2.21 0.94Canada –0.75 –0.50 1.00 17.32 17.49 0.98Australia –0.44 –0.11 1.00 21.84 –9.70 0.65Austria –2.63 .. 1.00 51.76 .. –0.27Belgium –1.28 –0.51 1.00 13.29 –4.19 0.88Czech Republic4 –0.87 .. 0.77 2.78 .. 1.00Denmark 0.00 .. 1.00 21.61 .. 0.97Finland –1.00 –0.07 1.00 12.07 4.55 0.93Greece –9.09 .. 0.99 4.09 .. 1.00Hungary .. .. .. .. .. ..Ireland –1.65 .. 1.00 8.57 .. 0.72Korea .. .. .. .. .. ..Netherlands 0.96 .. 1.00 2.21 .. 0.96New Zealand 0.18 .. 1.00 9.43 .. 0.96Norway –1.08 0.71 0.94 0.05 1.92 0.98Poland .. .. .. .. .. ..Portugal5 –2.39 .. 0.98 21.52 .. 0.97Spain –3.70 2.41 0.96 9.87 –3.80 0.93Sweden –0.70 –0.25 1.00 16.84 –21.50 0.88Switzerland –0.36 –1.43 0.98 20.34 39.67 0.89
Average6 –1.48 0.18 14.99 –1.83

OECD Economic Studies No. 35, 2002/2
148
© OECD 2002
effect entails only allocating to capital the share of household income taxes relat-ing to “interest, dividends and investment receipts” (PEI) (Table 6). The share ofPEI in household income (γ) must also be calculated so as to allocate unallocatedsocial security contributions (2400) to labour and (pure) capital income.
This adjustment, which can only be made for most countries in the 1990s, doesnot affect the labour income tax ratio but has a large positive effect (28 percentagepoints, on average) on the capital income tax ratio in many countries (Table 7). Dif-ferences from the baseline capital income tax ratios tend to be greater than for theprevious adjustment. Of the countries for which data are available to make theadjustment since 1975, it reinforces the shift in the tax burden from capital to labourin the United States and Norway between 1975-80 and 1990-2000 and strengthensthe opposite (relative) shift in Finland and Korea. The adjustment also reverses therelative shift in the tax burden (from labour to capital) in Australia. The adjusted andbaseline capital income tax ratios are highly correlated in most countries (the corre-lation coefficient is 0.8 or more in 78 per cent of countries); the exceptions areFrance, Australia, Austria, Ireland and Switzerland.
Excluding tax on government interest (transfer) payments
Government interest payments are transfers, not distributions of earnings onthe factor of production capital. As such, taxes on government interest paymentsshould be excluded from the calculations.32 This can done by deducting an esti-mate of residents’ government interest receipts (YPEPG) from household capitalincome in the numerator of the capital income tax ratio: in this way, the part ofhousehold income taxes relating to government interest receipts is not allocated(Table 8). It is also necessary to deduct non-resident withholding taxes on govern-ment interest payments from corporate tax receipts (1200) in the numerator of thecapital income tax ratio.33 The non-resident withholding tax rate (tNRW) used in
Table 6. Separating self employed income from labour and capital incomeModified tax ratios
Source: OECD.
Social security contributions not deductible Social security contributions deductible
γ = PEI/(OSPUE + PEI + W) γ = PEI/(OSPUE + PEI + W – 2100 – 2300)δ = 1 – α – γ δ = 1 – α – γτk = [τh * PEI + 1200 + γ * 2400 + 4000 + 5125 + 5212 + 6100]/(OS – 3000 – OSPUE)
τk = [τh * (PEI – γ * 2400 ) + 1200 + γ * 2400 + 4000 + 5125 + 5212 + 6100]/(OS – 3000 – OSPUE)
τs = [τh *OSPUE + 2300 + δ * 2400]/OSPUE τs = [τh * (OSPUE – 2300 – δ * 2400) + 2300 + δ * 2400]/OSPUE

Tax Ratios on Labour and Capital Income and on Consumption
149
© OECD 2002
each country to make this calculation is the modal rate.34 A difficulty in making thisadjustment is that there are no data in most countries on non-residents’ share of gov-ernment interest payments. Based on such evidence for Australia and New Zealand, itis assumed that the non-resident share of government bond holdings is one-third.
This adjustment does not affect the labour income tax ratio and in generalonly reduces capital income tax ratios by a small amount (3 percentage points, on
Table 7. Effect of separating self-employment income from labour and capital income
1975-2000
1. Based on net operating surplus.2. Compared with the revised approach baseline, percentage points.3. Correlation coefficients less than 0.8 are bolded.4. It is assumed that the capital income tax ratio in 2000 is the same as in 1999.5. It is assumed that the capital income tax ratio in 1999 and 2000 are the same as in 1998.6. Simple average.Source: OECD, Revenue Statistics and National Accounts.
Capital income tax ratio1
Change in average level2
Difference in change between 1975-80
and 1990-2000
Correlation coefficient3
United States 8.98 –4.68 0.95Japan 28.14 16.54 0.82Germany 22.60 .. 0.90France 110.92 .. 0.21Italy 20.98 .. 0.98United Kingdom 29.98 .. 0.89Canada 13.48 .. 0.99Australia 39.55 –12.83 0.58Austria 27.41 .. 0.69Belgium 30.48 .. 0.87Czech Republic4 14.77 .. 1.00Denmark 44.68 .. 0.95Finland 23.56 2.65 0.89Greece 41.50 .. 0.99Hungary .. .. ..Ireland 8.97 .. 0.66Korea 24.16 6.67 0.92Netherlands 7.13 .. 0.93New Zealand 12.10 .. 0.96Norway 16.83 –12.23 0.92Poland .. .. ..Portugal5 24.81 .. 1.00Spain 23.93 .. 0.97Sweden 48.64 .. 0.98Switzerland 28.29 .. 0.62
Average6 28.34 –0.64

OECD Economic Studies No. 35, 2002/2
150
© OECD 2002
average) (Table 9). However, the adjustment has a quite a large effect on capitalincome tax ratios in Denmark, Sweden and Belgium, where government interestpayments have been substantial. The adjustment reinforces the relative shift in thetax burden from capital to labour in EU countries35 between 1975-80 and 1990-2000but reverses the relative shift (from labour to capital) in OECD countries.36 Never-theless, the correlation between this and the baseline series is high for all countries;even in Belgium and Ireland, where there have been large changes in public debtinterest payments over the past quarter century, the correlation coefficient isover 0.80.
Excluding direct taxes and social security contributions on government benefit (transfer) payments
Government benefit payments are also transfers, not factor incomes. Accord-ingly, direct taxes and social security contributions paid on them should also beexcluded from the tax ratio calculations. This can be done by deducting directtaxes on social security benefits (DTB) from household income taxes (1100) in thenumerator of the household income tax ratio and by deducting social security contri-butions levied on social security benefits (SSCB) from the numerator of the labourincome tax ratio (Table 10). Estimates of these taxes and social security contributionscome from Adema (2001) and are only available for 1997.37 The modified equationsare as follows:38
Adjusting for direct taxes and social security contributions on governmentbenefit payments reduces both labour and capital income tax ratios, with thedecline in the former (3 percentage points, on average) being greater than that inthe latter (1 percentage point, on average) (Table 11). The decline in labourincome tax ratios is particularly large in the Netherlands, Denmark, Finland andSweden where such tax revenues are important. (Indeed, taking this factor intoaccount, the labour income tax ratio in the Netherlands is actually well below theOECD average, not above it). The effect of the adjustment on the capital income
Table 8. Excluding tax on government interest paymentsModified tax ratios
Source: OECD.
Social security contributions not deductible Social security contributions deductible
τk = [τh * (OSPUE + PEI – 0.67 * YPEPG) + 1200 + 2300 + β * 2400 – 0.33 * YPEPG * tNRW + 4000 + 5125 + 5212 + 6100]/(OS – 3000)
τk = [τh * (OSPUE + PEI – 2300 – β * 2400 – 0.67 * YPEPG) + 1200 + 2300 + β * 2400 – 0.33 * YPEPG * tNRW + 4000 + 5125 + 5212 + 6100]/(OS – 3000)

Tax Ratios on Labour and Capital Income and on Consumption
151
© OECD 2002
tax ratio is much smaller than on the labour income tax ratio in countries, such asthe Netherlands, where most taxes on social security benefits take the form ofsocial security contributions. Unfortunately, no data are available to calculate theeffect of this adjustment over time. There is a risk that such taxes and contribu-tions have increased over time, exaggerating the increase in tax ratios, notably forlabour income, in the countries where these taxes had a large impact in 1997.
Table 9. Effect of excluding tax on government interest payments1975-2000
1. Based on net operating surplus.2. Compared with the revised approach baseline, percentage points.3. It is assumed that the capital income tax ratio in 2000 is the same as in 1999.4. It is assumed that the capital income tax ratios in 1999 and 2000 are the same as in
1998.5. Simple average.Source: OECD, Revenue Statistics and National Accounts.
Capital income tax ratio1
Change in average level2
Difference in change between 1975-80 and
1990-2000
Correlation coefficient
United States –1.78 –0.79 0.99Japan –1.41 –1.08 1.00Germany –1.35 –0.75 0.99France –0.97 –1.02 1.00Italy –3.23 –3.40 1.00United Kingdom –2.32 1.67 1.00Canada –6.73 –5.81 0.97Australia –2.52 –0.31 0.99Austria –2.23 –1.38 0.99Belgium –8.18 –3.52 0.87Czech Republic3 –0.43 .. 1.00Denmark –10.67 .. 0.99Finland –2.30 –3.04 0.99Greece –0.96 .. 1.00Hungary .. .. ..Ireland –2.51 .. 0.86Korea –0.09 –0.05 1.00Netherlands –2.77 .. 0.91New Zealand –3.40 .. 0.87Norway –1.89 0.06 1.00Poland .. .. ..Portugal4 –2.65 .. 0.99Spain –0.95 –1.56 1.00Sweden –9.06 –3.48 0.99Switzerland –1.48 –0.39 1.00
Average5 –3.04 –1.55

OECD Economic Studies No. 35, 2002/2
152
© OECD 2002
Table 10. Excluding direct tax and social security contributions on public social benefits
Modified tax ratios
Source: OECD.
Social security contributions not deductible Social security contributions deductible
τh = (1100 – DTB)/(OSPUE + PEI + W) τh = (1100 – DTB)/(OSPUE + PEI + W – 2100 – 2300 – 2400)
τl = (τh * W + 2100 + 2200 + α * 2400 + 3000 – SSCB)/(WSSS + 3000)
τl = (τh * (W – 2100 – α * 2400) + 2100 + 2200 + α * 2400 + 3000 – SSCB)/(WSSS + 3000)
Table 11. Effect of excluding direct tax and social security contributions
on public social benefits, 1997Per cent
1. Compared with the revised approach baseline, percentage points.2. Based on net operating surplus.3. Simple average.Source: OECD, Revenue Statistics and National Accounts and Adema (2001).
Tax ratios Change in level1
Labour Capital2 Labour Capital2
United States 23.7 38.5 –0.54 –0.26Japan 24.2 49.7 –0.33 –0.10Germany 33.5 32.5 –2.03 –0.36Italy 38.0 40.8 –4.05 –2.63United Kingdom 21.3 50.8 –0.53 –0.34Canada 27.9 59.4 –2.45 –1.33Australia 21.9 47.5 –0.41 –0.33Austria 38.0 46.3 –3.89 –0.45Belgium 39.4 52.5 –2.41 –1.67Czech Republic 41.2 34.2 0.00 0.00Denmark 34.6 64.8 –6.79 –4.44Finland 39.8 40.1 –6.20 –3.48Ireland 25.7 23.0 –0.47 –0.17Korea 11.6 23.0 0.00 0.00Netherlands 27.7 51.0 –7.44 –0.63New Zealand 21.8 40.4 –2.52 –2.21Norway 32.5 38.1 –4.06 –1.41Sweden 46.1 57.1 –5.46 –5.12
Average3 30.5 43.9 –2.75 –1.39

Tax Ratios on Labour and Capital Income and on Consumption
153
© OECD 2002
Allowing for preferential tax treatment of household capital income39
Households pay lower tax rates on many forms of capital income than onlabour income, contrary to the assumption underlying the standard tax ratio meth-odology that all household income is taxed at the same rate. Earnings on invest-ments of pension funds and life insurance and imputed rentals on owner-occupied dwellings are usually not taxed at all, there is widespread relief from thedouble taxation of dividends and interest receipts are often taxed at a low rate.Each of these cases is examined in the remainder of this section for 1994-2000,40
along with the effects of allowing for all of them at once.
Excluding property income attributable to members of pension funds and life insurance policy holders from household income
Earnings (excluding capital gains, which are not income in the SNA) on the invest-ments of pension funds and life insurance polices (PIAPH) are imputed to their bene-ficial owners in SNA. They are included in the category of household income entitled“interest, dividends and investment income” (PEI). However, households do not paytax on such earnings;41 in the rare cases42 where tax is levied on such earnings, it ispaid by the pension fund or insurance company and as such, is included in corpo-rate taxes (1200).43 Accordingly, PIAPH should be deducted from the householdincome series used to allocate personal income taxes and unallocated socialsecurity contributions to labour and capital income (Table 12).
This adjustment results in a small decline in the capital income tax ratio(2 percentage points, on average) and a small increase (1 percentage point, on aver-age) in the labour income tax ratio (Table 13). Although it is not possible to calculatethe adjusted series before 1994, owing to a lack of information on tax systems, theimpact of the adjustment over 1994-2000 generally seems to be too small to havemuch effect on shifts in the tax burden over the past quarter century. In addition,
Table 12. Excluding pension fund and life insurance earnings from household incomeModified tax ratios
Source: OECD.
Social security contributions not deductible Social security contributions deductible
α = W/(OSPUE + PEI – PIAPH + W) α = (W – 2100)/(OSPUE + PEI – PIAPH + W – 2100 – 2300)
τh = 1100/(OSPUE + PEI – PIAPH + W) τh = 1100/(OSPUE + PEI – PIAPH + W – 2100 – 2300 – 2400)
τk = [τh * (OSPUE + PEI – PIAPH) + 1200 + 2300 + β * 2400 + 4000 + 5125 + 5212 + 6100]/(OS – 3000)
τk = [τh * (OSPUE + PEI – PIAPH – 2300 – β * 2400) + 1200 + 2300 + β * 2400 + 4000 + 5125 + 5212 + 6100]/(OS – 3000)

OECD Economic Studies No. 35, 2002/2
154
© OECD 2002
adjusted and baseline labour and capital income tax ratios are highly correlatedfor all countries. These results suggest that not making this adjustment is unlikelyto matter for empirical results in most countries.
Non-taxation of imputed rentals on owner-occupied housing
Another form of household income that is often not taxed is imputed rentalincome on owner occupied housing net of expenses (IROOHN). In countries whereIROOHN is not taxed,44 it should be removed from the household income seriesused to allocate personal income taxes and unallocated social security contributionsto labour and capital income (Table 14).45
Adjusting for the non-taxation of imputed rentals on owner-occupied housingreduces the capital income tax ratio (by 4 percentage points, on average) andcauses a small increase in the labour income tax ratio (by 1 percentage point, onaverage) (Table 15). The effect of this adjustment is quite large on capital incometax ratios in Finland, Canada and Australia. It could alter conclusions about shiftsin the tax burden in these countries if the effect of the adjustment had been very
Table 13. Effect of excluding pension fund and life insurance earnings from household income1
1994-2000
1. This adjustment is required for all countries but can only be made for the countriesshown owing to data availability.
2. Based on net operating surplus.3. Compared with the revised approach baseline, percentage points.4. Simple average.Source: OECD, Revenue Statistics and National Accounts.
Labour income tax ratio Capital income tax ratio2
Change in average level3
Correlation coefficient
Change in average level3
Correlation coefficient
United States 0.69 1.00 –1.66 1.00Japan 0.32 1.00 –0.90 1.00Germany 0.33 1.00 –0.87 1.00France 0.33 0.87 –0.93 1.00Italy 0.15 1.00 –0.19 1.00United Kingdom 1.16 1.00 –2.96 1.00Austria 0.27 1.00 –0.85 1.00Belgium 0.46 0.99 –1.06 1.00Denmark 1.97 1.00 –6.59 1.00Finland 0.39 1.00 –0.87 1.00Netherlands 1.61 1.00 –3.53 0.97Portugal 0.09 1.00 –0.19 1.00Spain 0.17 1.00 –0.31 1.00Sweden 1.23 1.00 –4.73 1.00
Average4 0.66 –1.83

Tax Ratios on Labour and Capital Income and on Consumption
155
© OECD 2002
Table 14. Non-taxation of imputed rentals on owner-occupied housing
Source: OECD.
Deductibility of social security contributions/Countries Modified tax ratios
Not deductibleAustralia, Canada, Portugal, α = W/(OSPUE + PEI +W – IROOHN)United Kingdom, United States τh = 1100/(OSPUE + PEI + W – IROOHN)
τk = [τh * (OSPUE + PEI – IROOHN) + 2300 + β * 2400 + 1200 + 4000 + 5125 + 5212 + 6100]/(OS – 3000)
DeductibleAustria, Finland, France, Germany, Italy (1995-98),
α = (W –2100)/(OSPUE + PEI + W – 2100 – 2300 – IROOHN)
Spain (1999-2000) τh = 1100/(OSPUE + PEI + W – 2100 – 2300 – IROOHN)τk = [τh * (OSPUE + PEI – 2300 – IROOHN) + 2300 + β * 2400 + 1200 + 4000 + 5125 + 5212 + 6100]/(OS – 3000)
Table 15. Effect of adjusting for non-taxation of imputed rental on owner occupied housing1
1994-2000
1. This adjustment cannot be made in the Czech Republic (1998-2000), Hungary, Iceland(1999-2000), Ireland, Luxembourg (1994-97), Mexico and New Zealand owing to a lackof data.
2. Based on net operating surplus.3. Compared with the revised approach baseline, percentage points.4. Correlation coefficients less than 0.8 are bolded.5. Simple average.Source: OECD, Revenue Statistics and National Accounts.
Labour income tax ratio Capital income tax ratio2
Change in average level3
Correlation coefficient4
Change in average level3
Correlation coefficient4
United States 0.29 1.00 –0.70 1.00Germany 0.86 1.00 –2.28 1.00France 1.11 0.30 –3.11 1.00Italy 1.15 1.00 –1.48 1.00United Kingdom 1.01 1.00 –2.59 1.00Canada 2.99 0.99 –7.77 0.99Australia 2.35 1.00 –5.08 1.00Austria 1.04 0.99 –3.30 0.99Finland 4.01 1.00 –9.08 0.96Portugal 0.46 0.88 –0.83 1.00Spain 0.93 .. –2.43 ..
Average5 1.47 –3.51
OECD Economic Studies No. 35, 2002/2
156
© OECD 2002
small in the late 1970s. The correlation coefficient for the adjusted and baselinetax ratios is high in all cases except for the labour income tax ratio in France. Theseresults may be influenced by different methods of assessing imputed rentals inthe national accounts in different countries. For example, the methods adopted inSpain, the United Kingdom and Italy appear to yield lower imputed rentals(adjusted for the proportion of households that are owner-occupiers) than do themethods followed in Canada, France and Germany.
These estimates understate the effect on tax ratios of not taxing imputedrentals in countries where owner-occupiers’ housing-related interest expenses arenevertheless deductible.46 This is because gross (as opposed to net) imputedrentals would need to be deducted from household property income in the equa-tions to allocate household taxes (1100) and unallocated social security contribu-tions (2400) in these countries. Such an adjustment would increase labour incometax ratios and reduce capital income tax ratios by more than in the above calcula-tions. Unfortunately, such an adjustment cannot be made owing to a lack of dataon owner-occupiers’ housing related interest expenses.
Relief from double taxation of dividends received by resident individuals
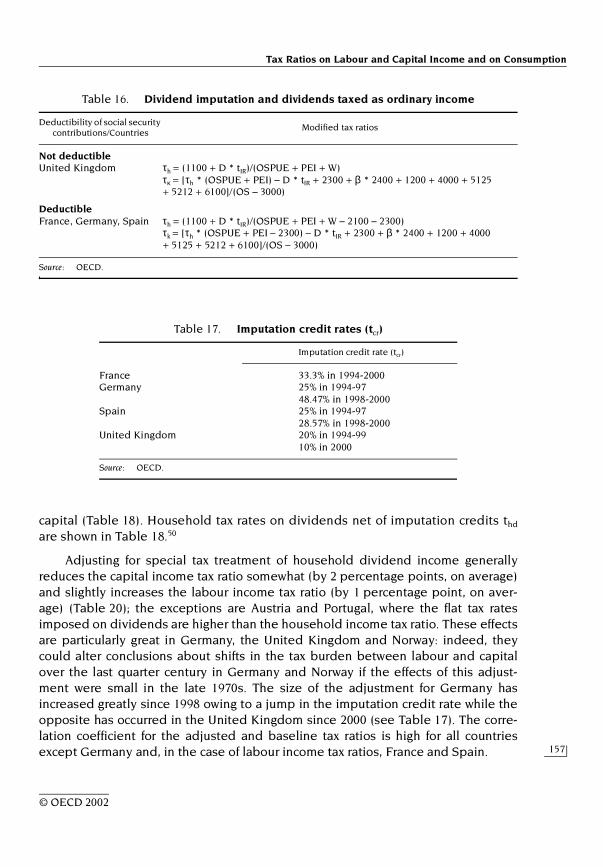
Another form of household income that is often taxed at low rates is divi-dends (D). Most countries provide relief to residents from double taxation ofdividends, either through dividend imputation and/or low flat rate tax systems.47
In countries with global income tax systems, this can be adjusted for by addingback the tax saving from the imputation-related rate reduction (tIR) to householdincome tax receipts in the household income tax ratio and by deducting this taxsaving from capital income taxes in the capital income tax ratio (Table 16).48
The imputation-related rate reduction (tIR) is calculated as the differencebetween the normal household tax ratio (τh*) and the actual tax rate paid by house-holds on dividends (td). The latter (td) is calculated as the difference between thenormal household tax ratio and the imputation credit rate (tcr), all grossed up (by tcr,the rate used to gross up dividends). This gives the following equations:49
td = (τh* – tcr)/(1 – tcr) (1)
tIR = (τh* – td) (2)
Countries’ imputation credit rates (tcr) are shown in Table 17.
In countries with scheduler tax systems, dividends are taxed at a different (gen-erally lower) rate than other household income. This can be adjusted for by remov-ing dividend income (D) from household income and by deducting household taxespaid on dividends (D* thd, where thd is the household tax rate on dividends net ofimputation credits) from household taxes and adding them directly to taxes on
Tax Ratios on Labour and Capital Income and on Consumption
157
© OECD 2002
capital (Table 18). Household tax rates on dividends net of imputation credits thd
are shown in Table 18.50
Adjusting for special tax treatment of household dividend income generallyreduces the capital income tax ratio somewhat (by 2 percentage points, on average)and slightly increases the labour income tax ratio (by 1 percentage point, on aver-age) (Table 20); the exceptions are Austria and Portugal, where the flat tax ratesimposed on dividends are higher than the household income tax ratio. These effectsare particularly great in Germany, the United Kingdom and Norway: indeed, theycould alter conclusions about shifts in the tax burden between labour and capitalover the last quarter century in Germany and Norway if the effects of this adjust-ment were small in the late 1970s. The size of the adjustment for Germany hasincreased greatly since 1998 owing to a jump in the imputation credit rate while theopposite has occurred in the United Kingdom since 2000 (see Table 17). The corre-lation coefficient for the adjusted and baseline tax ratios is high for all countriesexcept Germany and, in the case of labour income tax ratios, France and Spain.
Table 16. Dividend imputation and dividends taxed as ordinary income
Source: OECD.
Deductibility of social security contributions/Countries
Modified tax ratios
Not deductibleUnited Kingdom τh = (1100 + D * tIR)/(OSPUE + PEI + W)
τκ = [τh * (OSPUE + PEI) – D * tIR + 2300 + β * 2400 + 1200 + 4000 + 5125 + 5212 + 6100]/(OS – 3000)
DeductibleFrance, Germany, Spain τh = (1100 + D * tIR)/(OSPUE + PEI + W – 2100 – 2300)
τk = [τh * (OSPUE + PEI – 2300) – D * tIR + 2300 + β * 2400 + 1200 + 4000 + 5125 + 5212 + 6100]/(OS – 3000)
Table 17. Imputation credit rates (tcr)
Source: OECD.
Imputation credit rate (tcr)
France 33.3% in 1994-2000Germany 25% in 1994-97
48.47% in 1998-2000Spain 25% in 1994-97
28.57% in 1998-2000United Kingdom 20% in 1994-99
10% in 2000

OECD Economic Studies No. 35, 2002/2
158
© OECD 2002
Interest taxed at flat rates
Many countries offer taxpayers the option of paying a flat tax rate (tint) on inter-est income (INT) that is lower than the taxpayer’s marginal rate.51 This departurefrom the assumption that all personal income is taxed at the same rate can betaken into account by excluding interest income from household income and byimputing tax on interest income directly to capital (Table 21).52 Flat tax rates onpersonal interest income (tint) are shown in Table 22.
While these flat tax rates may be considerably lower than top marginal incometax rates, they are often higher than the household income tax ratio. This is so in
Table 18. Dividends taxed separately at flat rates
Source: OECD.
Deductibility of social security contributions/Countries
Modified tax ratios
Not deductiblePortugal α = W/(OSPUE + PEI – D + W)
τh = (1100 – D * thd )/(OSPUE + PEI – D + W)τk = [τh * (OSPUE + PEI – D) + D * thd + 2300 + β * 2400 + 1200 + 4000 + 5125 + 5212 + 6100]/(OS – 3000)
DeductibleAustria, Belgium, Denmark, α = (W – 2100)/(OSPUE + PEI – D + W – 2100 – 2300)Finland, Greece, Italy, τh = (1100 – D * thd)/(OSPUE + PEI – D + W – 2100 – 2300)Norway, Sweden τk = [τh * (OSPUE + PEI – D – 2300) + D * thd + 2300 + β * 2400 + 1200
+ 4000 + 5125 + 5212 + 6100]/(OS – 3000)
Table 19. Household dividend tax rates net of imputation creditsPer cent
Source: OECD.
Austria 22% in 1994-9625% in 1997-2000
Belgium 25% in 1994-9515% in 1996-2000
Denmark 30% in 1994-9525% in 1996-2000
Finland 0% in 1994-2000Greece 0% in 1994-2000Italy 12.5% in 1995-2000Norway 0% in 1994-2000Portugal 25% in 1994-2000Sweden 0% in 1994-97
30% in 1998-2000

Tax Ratios on Labour and Capital Income and on Consumption
159
© OECD 2002
Austria, France, Italy, Japan and Portugal – half of the countries for which thisadjustment is necessary and with data available to make it. In such cases, thisadjustment increases the capital income tax ratio and reduces the labour income
Table 20. Effect of adjusting for relief from double taxation of dividends1
1994-2000
1. This adjustment cannot be made in Australia, Canada, the Czech Republic, Hungary, Ireland (1994-98), Korea, NewZealand and Poland owing to a lack of data.
2. Based on net operating surplus.3. Compared with the revised approach baseline, percentage points.4. Correlation coefficients less than 0.8 are bolded.5. Simple average.Source: OECD, Revenue Statistics and National Accounts.
Labour income tax ratio Capital income tax ratio2
Change in average level3
Correlation coefficient4 Change in average level3
Correlation coefficient4
Germany 4.43 –0.39 –11.54 –0.11France 0.80 0.72 –2.22 1.00Italy 0.35 1.00 –0.46 0.98United Kingdom 2.11 0.84 –5.35 0.99Austria –0.45 0.99 1.40 1.00Belgium 0.24 0.90 –0.56 0.98Denmark 0.44 1.00 –1.52 0.99Finland 0.52 0.99 –1.11 1.00Greece 0.14 1.00 –0.10 1.00Norway 2.45 0.97 –4.76 0.97Portugal –0.32 0.80 0.40 1.00Spain 1.03 0.70 –1.89 1.00Sweden 0.63 0.99 –2.12 1.00
Average5 0.95 –2.29
Table 21. Interest taxed at flat rates
Source: OECD.
Deductibility of social security contributions/Countries
Modified tax ratios
Not deductiblePortugal α = W/(OSPUE + PEI – INT + W)
τh = (1100 – INT * tint)/(OSPUE + PEI – INT + W)τk = [τh * (OSPUE + PEI – INT) + INT * tint + 2300 + β * 2400 + 1200 + 4000 + 5125 + 5212 + 6100]/(OS – 3000)
DeductibleAustria, Belgium, Finland, France, Italy, Japan and Sweden
α = (W – 2100)/(OSPUE + PEI – INT + W – 2100 – 2300)
τh = (1100 – INT * tint)/(OSPUE + PEI – INT + W – 2100 – 2300)τk = [τh * (OSPUE + PEI – INT – 2300) + INT * tint + 2300 +β * 2400 + 1200 + 4000 + 5125 + 5212 + 6100]/(OS – 3000)

OECD Economic Studies No. 35, 2002/2
160
© OECD 2002
tax ratio (Table 23). For the remaining countries, the adjustment has the oppositeeffect. This adjustment has a very small effect on tax ratios in all countries exceptBelgium and Portugal, where the effect on the capital income tax ratio neverthe-less remains modest (2 percentage points). The adjusted and baseline tax ratiosare highly correlated in virtually all cases (the only exception is the labour incometax ratio in Portugal).
The combined effect of the above preferential arrangements for capital income taxation
Bringing together the four cases of reduced capital income taxation for house-holds, which concern pension fund and life insurance earnings, imputed rentals onowner occupied housing, relief from double taxation of dividends and flat tax rateson interest receipts gives the modifications to the tax ratios shown in Table 24.
Only five countries – France, Germany, the Netherlands, Spain, the UnitedKingdom and the United States – have data available to make all the necessaryadjustments for preferential tax treatment of personal capital income. Takentogether, these adjustments substantially reduce the capital income tax ratio inthese countries (by 8 percentage points, on average) and significantly increase thelabour income tax ratio (by 4 percentage points, on average) (Table 25). Theseeffects are especially large in Germany and the United Kingdom. The correlation
Table 22. Flat tax rates on interest incomePer cent
1. These rates comprise a final withholding tax of 35 per cent in 1994 and 15 per centthereafter and a variety of surcharge taxes, the most important of which is the generalsocial contribution (CSG). These surcharge taxes were 4.4 per cent in 1994-95, 5.9 percent in 1996 and 10 per cent thereafter.
2. There are no data for 1994.Source: OECD.
Austria 22% in 1994-9625% in 1997-2000
Belgium 13% in 199415% in 1995-2000
Finland 25% in 1994-9528% in 1996-9929% in 2000
France1 39.4% in 199419.4% in 199520.9% in 199625% in 1997-2000
Italy2 30% in 1995-9628% in 199727% in 1998-2000
Japan 20% in 1994-2000Portugal 20% in 1994-2000Sweden 30% in 1994-2000

Tax Ratios on Labour and Capital Income and on Consumption
161
© OECD 2002
coefficient between the adjusted and baseline tax ratios is low (less than 0.8) in allcases except for the labour income tax ratio in the United States and capitalincome tax ratios in the United Kingdom and Spain. These results suggest thatmany empirical results could be affected by using tax ratios that do not make suchadjustments for preferential treatment of household capital income.
CONCLUSION
Tax ratios have been widely used in empirical economic analyses to approxi-mate the taxes that distort key economic decisions, notably in the areas ofemployment, saving and investment. This paper proposes some modifications tothe well-known methodology developed by Mendoza et al. (1994) for calculatingtax ratios. While these modifications do not deal with many of the criticisms thathave been addressed to this methodology, they do make the underlying assump-tions more realistic. The main changes are that deductibility of social security con-tributions is taken into account, labour income is enlarged to include employercontributions to pension funds and the definition of capital taxes is widened toinclude a number of property taxes. This and the other changes made increasecapital income tax ratios relative to the Mendoza approach and reduce somewhatlabour income and consumption tax ratios. The revised estimates suggest that
Table 23. Effect of adjusting for flat tax rates on interest income1994-2000
1. Based on net operating surplus.2. Compared with the revised approach baseline, percentage points.3. Correlation coefficients less than 0.8 are bolded.4. Simple average.Source: OECD, Revenue Statistics and National Accounts.
Labour income tax ratio Capital income tax ratio1
Change in average level2
Correlation coefficient3
Change in average level2
Correlation coefficient3
Japan –0.38 0.99 1.07 1.00France –0.45 0.94 1.26 1.00Italy –1.28 0.98 1.63 0.98Austria –0.17 1.00 0.55 1.00Belgium 0.94 0.90 –2.16 1.00Finland 0.06 1.00 –0.14 1.00Portugal –1.02 0.78 2.13 1.00Sweden 0.06 1.00 –0.23 1.00
Average4 –0.28 0.51

OECD Economic Studies No. 35, 2002/2
162
© OECD 2002
OECD countries have focused the increase in the tax burden during the past quar-ter century slightly more on capital than on labour, whereas the opposite conclu-sion is reached using the Mendoza approach. Nevertheless, even thoughdifferences between tax ratios in the revised and Mendoza approaches are some-times quite large, the two sets of tax ratios are in most cases highly correlated,
Table 24. Combined effect of preferential tax arrangements for household capital income
1. Only countries for which all necessary adjustments can be made are shown.2. IROOHN (net imputed rentals on owner occupied housing) is set to zero in Spain before 1999, when imputed rentals
were taxed.Source: OECD.
System/Countries1 AETR equations
Global personal income, social security contributions not deductibleUnited States τh = 1100/(OSPUE + PEI – PIAPH + W – IROOHN)
τk = [τh * (OSPUE + PEI – PIAPH – IROOHN) + 1200 + 2300 + 4000 + 5125 + 5212 + 6100]/(OS – 3000)
Global personal income, social security contributions deductibleNetherlands τh = 1100/(OSPUE + PEI – PIAPH + W – 2100 – 2300)
τk = [τh * (OSPUE + PEI – PIAPH – 2300) + 1200 + 2300 + 4000 + 5125 + 5212 + 6100]/(OS – 3000)
Dividend imputation, global personal income, social security contributions not deductibleUnited Kingdom α = W/(OSPUE + PEI – PIAPH + W – IROOHN)
τh = (1100 + D * tIR)/(OSPUE + PEI – PIAPH + W – IROOHN)τk = [τh * (OSPUE + PEI – PIAPH – IROOHN) – D * tIR + 1200 + 2300 + β * 2400 + 4000 + 5125 + 5212 + 6100]/(OS – 3000)
Dividend imputation, global personal income, social security contributions deductibleGermany and Spain2 τh = (1100 + D * tIR)/(OSPUE + PEI – PIAPH + W
– IROOHN – 2100 – 2300)τk = [τh * (OSPUE + PEI – PIAPH – IROOHN – 2300) – D * tIR + 1200 + 2300 + 4000 + 5125 + 5212 + 6100]/(OS – 3000)
Dividend imputation, dividends taxed as ordinary income, flat rate on interest income, social security contributions deductibleFrance τh = (1100 + D * tIR – INT * tint)/(OSPUE + PEI
– PIAPH – INT + W – IROOHN – 2100 – 2300)τk = [τh * (OSPUE + PEI – PIAPH – INT – IROOHN – 2300) + INT * tint – D * tIR + 1200 + 2300 + 4000 + 5125 + 5212 + 6100]/(OS – 3000)

Tax Ratios on Labour and Capital Income and on Consumption
163
© OECD 2002
suggesting that many empirical results would not be affected by the choice ofapproach. Relating the revised tax ratios to macroeconomic variables of interest, itis found that labour income (and combined labour income and consumption) taxratios are inversely related across countries to hours worked per member of theworking age population but are not related to structural unemployment. More-over, the revised capital income tax ratios are not related to either investment orprivate savings rates.
There are still a number of unrealistic assumptions underlying the revisedestimates that could not be systematically relaxed owing to a lack of data for cer-tain countries and/or periods. These are that all unincorporated business netincome is capital income, households do not receive government interest (trans-fer) payments and do not pay tax on social security benefits and that householdcapital income is taxed at the same rates as other income. Relaxing these assump-tions where possible sometimes results in tax ratio estimates that differ substan-tially from the baseline estimates and/or are not highly correlated with thebaseline. In the case of adjustments concerning self-employed income (dividing itinto labour and capital components or separating it from labour and capitalincome), capital income tax ratios generally rise substantially. However, theseadjustments have little or no effect on labour income tax ratios and yield tax ratioseries that are highly correlated with the baseline series in most cases (but not forcapital income tax ratios in a significant minority of countries). While the variety ofadjustments made to account for preferential tax treatment of household capitalincome individually have only small effects, taken together they markedly reduce
Table 25. Combined effect of preferential arrangements for household capital income
1994-2000
1. Based on net operating surplus.2. Compared with the revised approach baseline, percentage points.3. Correlation coefficients less than 0.8 are bolded.4. Simple average.Source: OECD, Revenue Statistics and National Accounts.
Labour income tax ratio Capital income tax ratio1
Change in average level2
Correlation coefficient3
Change in average level2
Correlation coefficient3
United States 1.28 0.98 –2.49 –0.14Germany 6.68 –0.37 –17.50 0.61United Kingdom 5.08 0.26 –11.74 0.82Netherlands 4.13 0.60 –5.86 0.15Spain 2.23 –0.27 –4.28 0.89
Average4 3.88 –8.37

OECD Economic Studies No. 35, 2002/2
164
© OECD 2002
capital income tax ratios, increase labour income tax ratios and mostly yield seriesthat are not highly correlated with the baseline. These results reinforce the viewthat caution is required when using tax ratios to support a given policy stance or toadvocate a particular direction for reform. Tax ratio estimates need to be corrobo-rated by a significant volume of other information before conclusions can reason-ably be drawn. This applies both to conclusions about a country’s tax system andto the relative shifts in the tax burden suggested by the estimates in this paper.

Tax Ratios on Labour and Capital Income and on Consumption
165
© OECD 2002
NOTES
1. This is the terminology used in Volkerink and de Haan (2001), which we follow. Taxratios are also known as effective tax rates, implicit tax rates and average tax ratios.
2. The OECD takes the view that further work relying on micro-data is required to assessthe magnitude of potential biases to tax ratio estimates. In a recent OECD study(Volkerink and de Haan, 2001), the authors conclude that “… average tax rates measuredusing aggregate data will in a number of cases generate misleading indicators of the taxburdens on taxpayers, on factors of production, and on consumption. At the same time,it is recognised that an examination of such ratios is a useful exercise, if only to identifythe substantial shortcomings of these measures. The message of this study is that poli-cymakers should be aware of the measurement problems underlying average tax ratebased on aggregate data, should they be fielded to shape public policy debates”. InOECD (2000), it is noted that while average tax rates represent a more informative indi-cator of the burden and impact of tax systems than a simple reliance on nominal (statu-tory) tax rates or tax revenue as a share of GDP, their calculation raises severalpotentially significant methodological problems. The Working Party No. 2 on Tax PolicyAnalysis and Tax Statistics of the OECD Committee on Fiscal Affairs takes the view thataverage tax rate results relying on aggregate tax and national accounts data are poten-tially highly misleading indicators of relative tax burdens and tax trends. Work is cur-rently under way by Working Party No. 2 Delegates using micro-data to assess themagnitude of potential biases to average tax rate figures derived from aggregate data.
3. The ease with which such a switch could be effected would depend on legal andlabour market practices in the country concerned.
4. This can result in tax data in a given year including revenue from a tax that no longerexists, as occurred in Austria following the abolition of the business tax (Gewerbesteuer)at the end of 1993.
5. These countries are Japan, Germany, Italy, Austria and Greece.
6. For ease of comparison with Mendoza et al. (1994) and other studies in this field, weretain the variable names based on the definitions in SNA68/ESA79, even though thevariables used are in fact from SNA93/ESA95. OSPUE corresponds to “unincorporatedbusiness net income” in the new system.
7. PEI corresponds to “interest, dividends and investment receipts” in SNA93/ESA95.
8. The other countries in which employees’ social security contributions are not deductibleare: Australia, Canada, Hungary, Mexico, Portugal and the United Kingdom. Such contri-butions are low by OECD standards in all of these countries except Hungary and Portu-gal. In Germany, Ireland, Poland and Turkey deductions are for a flat amount. Treatingemployees’ social security contribution as not deductible when they are results in toomuch household tax being allocated to labour (overstating the labour income tax ratio)
OECD Economic Studies No. 35, 2002/2
166
© OECD 2002
and not enough household tax being allocated to capital (understating the capitalincome tax ratio).
9. As data on unincorporated business income including imputed rentals on owner-occupiedhousing are not available in all of these countries, such income was not deducted fromhousehold income for the purposes of allocating the remaining household taxes to labourand capital. This tends to overstate the capital income tax ratio (too much of householdtaxation is allocated to capital) and understate the labour income tax ratio.
10. Insofar as this tax is paid by households, such a treatment would be consistent withthat in countries such as Germany that have resident withholding taxes.
11. With this change, the denominators of the labour and capital income tax ratios sum to GDP,ensuring that taxes are entirely allocated to one or other of the factors of production.
12. The inclusion of 3000 in the denominator of the labour income tax ratio follows thesuggestion made in Volkerink and de Haan (2001).
13. There are unallocated social security contributions (2400) in the following countries:Greece (until 1987); Hungary; Mexico; Portugal (1985-87); the Slovak Republic; Switzerland;and the United Kingdom. Note that it is not necessary to include 2400 data for Austria toensure that the sum of the other components of social security contributions (2100, 2200and 2300) equals total contributions (2000).
14. A problem with the consumption tax ratio that cannot be resolved owing to data limita-tions is that it includes indirect taxes on investment goods in the numerator. In the caseof VAT, this occurs for VAT-exempt industries that supply inputs to produce investmentgoods. Neither the purchasers of these inputs nor the tax-exempt suppliers themselvesare able to claim back the VAT paid on the VAT-exempt industries’ inputs. This problemmainly concerns the finance industry, which is generally VAT-exempt owing to the diffi-culty of measuring value added; by contrast, the problem does not affect government orthe not-for-profit sector, as their outputs are classified as final consumption in thenational accounts. For general indirect taxes other than VAT (such as sales tax and turn-over tax), which are only levied in a few countries [the United States, Canada, Australia(until 2000), Hungary, Iceland, Switzerland (until 1995) and Turkey] the problem is moredirect, in that such taxes may apply to investment expenditures more generally. Data arenot generally available on VAT paid by tax-exempt sectors that supply inputs to produceinvestment goods or on the proportion of their outputs that are inputs to produceinvestment goods. With respect to other general indirect taxes, data are not readilyavailable on the proportion of such taxes that relate to consumption goods. Hence, theconsumption tax ratio will be overstated because indirect taxes on investment areincluded in the numerator. However, the degree of overstatement is unlikely to be great,especially as countries tend to have either a VAT or other general indirect taxes, but notboth (the exceptions are Canada, Hungary, Iceland and Turkey).
15. Mendoza et al. (1994) excluded customs and import duties on the grounds that theywere not significant in G7 countries but noted that these duties should be taken intoaccount in extending the study to other countries.
16. In other words, we include all taxes on specific goods and services except taxes onexports (5124), taxes on investment goods (5125) and other taxes on internationaltrade and transactions (5127).
17. This tax has already been allocated to capital.
18. The inclusion of 1200 in the numerator of the equation for the capital income tax ratiopresupposes that this item relates entirely to capital. In fact, there are many small

Tax Ratios on Labour and Capital Income and on Consumption
167
© OECD 2002
corporations in some countries that are more comparable to small-unincorporatedenterprises, which are considered to pay taxes on both labour and capital income. Itwould be consistent to treat these corporations in the same way as unincorporatedenterprises. However, this cannot be done owing to the lack of aggregate data. In theabsence of this adjustment, capital tax ratios tend to be overstated, although thedegree of the distortion is unlikely to be great because such companies pay only asmall share of total corporate taxes.
19. It is implicitly assumed that all such taxes relate to the income flows appearing in thedenominator of the equation for the capital income tax ratio. While this is true for mostproperty taxes (4000), it is not true for taxes on wealth in the form of art, racehorses orforeign property. Accordingly, the revised estimates tend to overstate the capitalincome tax ratio.
20. Only Norway levies such a tax.
21. I.e. other than households.
22. See notes to Table 2 for a list of the countries with full data sets. This includescountries for which other household income (YPE plus OSPUE) was estimated forperiods before which SNA93/ESA95 data are available.
23. This does not necessarily mean that international tax competition has not caused arelative shift in the tax burden towards the least mobile factor of production, labour.Capital income tax ratios do not adequately capture the effects of international taxcompetition because both the numerator and denominator are reduced by it.
24. The methodologies are sometimes based on a variety of sources (lives of capitalassets used for tax purposes, lives based on estimates made using company accountsor using survey data). These give rise to very different average lives. For example, esti-mates of capital consumption allowances are based on an assumed average economiclife for equipment of 7 years in Switzerland, 11 years in Japan and 26 years in theUnited Kingdom (OECD, 1992).
25. Changes in the tax treatment of public enterprises, including through privatisation, willalso distort trends in capital income tax ratios. For example, when the Austrian centralbank was made taxable in 1994, this increased corporate tax revenue by more than10 per cent.
26. There are no payroll taxes (Revenue Statistics category 3000) in the United States andJapan.
27. Using a growth accounting model, Prescott (2002) also finds that labour and con-sumption taxes have a very important negative effect on labour inputs. For example,he finds that the 30 per cent shortfall of output per member of the working age pop-ulation in France relative to the United States is accounted for by lower labourinputs in France, which in turn can be explained by higher labour and consumptiontaxes.
28. This is based on the following OLS regressions (with t-values in brackets) based onaverage values for each country over 1990-2000:
NAIRUi = 5.43 + 0.05 * τ l i + ui and
(2.07) (0.62) R2 adjusted = –0.04
NAIRUi = 4.13 + 0.07 * τlci + u i(1.34) (0.96) R2 adjusted = 0.0

OECD Economic Studies No. 35, 2002/2
168
© OECD 2002
where:
NAIRU = non-accelerating inflation rate of unemployment;
τ l = labour income tax ratio; and
τ lc = combined labour income and consumption tax ratio.
29. This is based on the following OLS regressions (with t-values in brackets) based onaverage values for each country over 1990-2000:
(INVB/GDP)i = 12.64 – 0.0 * τki + ui and
(3.84) (–0.02) R2 adjusted = –0.06
(PSAV/GDP)i = 21.95 – 0.05 * τki + ui
(5.55) (–0.66) R2 adjusted = –0.03
where:
INVB = gross business investment expenditures;
PSAV = private sector saving; and
τk = capital income tax ratio.
30. Only baseline equations that change when an assumption is modified appear in thisand the following sections.
31. EU countries with data available from 1975 onwards are: Germany, France, Italy, theUnited Kingdom, Belgium, Finland, Spain and Sweden.
32. This also ensures that two otherwise identical countries with the same governmentinterest payments net of tax will have the same tax ratios on labour and capital, even ifone does not tax such payments at all while the other imposes a very high tax on them.Without this adjustment, the standard tax ratio methodology wrongly suggests that theburden of taxation (on capital) is higher in the country that taxes government interestpayments.
33. No adjustment to corporate income tax receipts (1200) is made in respect of residentsbecause government bonds held directly by residents other than households aremainly in the hands of pensions funds and life insurance companies, who generally donot pay tax on earnings. Moreover, insofar as bonds are held by domestic financialintermediaries, the other major holder, tax is effectively shifted back to the householdsector as intermediaries borrow from it to finance their bond holdings: interest on suchloans is deductible for intermediaries but taxable for households.
34. This rate is 15 per cent in Belgium, Canada and Portugal. It is 10 per cent in Australia, Italy,Japan, Korea, New Zealand, Poland, Spain, and Switzerland and 0 in other countries.
35. EU countries with data available from 1975 onwards are: Germany, France, Italy, theUnited Kingdom, Austria, Belgium, Finland, Spain and Sweden.
36. The average increases in the baseline capital income tax ratio (based on net operatingsurplus) between 1975-80 and 1999-2000 in EU and OECD countries for which data wereavailable to make the adjustment were 5.2 and 6.3 percentage points, respectively.
37. Adema (2001) contains combined estimates of direct taxes and social security contribu-tions on government benefits (Table 7, pp. 27-28). These had to be divided into directtax- and social security components to adjust for this factor in the tax ratio estimates. Todo this, direct tax and social security contributions for three household types (single, nochildren, earning 67 per cent of average production wages (APW); single, two children,earning 67 per cent of APW; and married, two children, household head earns 100 per
Tax Ratios on Labour and Capital Income and on Consumption
169
© OECD 2002
cent of APW, spouse earns nothing) were calculated using the OECD Taxing Wages data-base. The average proportion of each component in total direct tax and social securitycontributions for the three household types was then used to allocate Adema’s series toits direct tax- and social security contributions components.
38. These modifications also ensure that two otherwise identical countries with the samenet government benefit payments will have the same labour and capital tax ratios,even if one does not tax such payments at all while the other imposes a very high taxon them. Without this adjustment, the standard approach to calculating tax ratioswrongly suggests that the burden of taxation (on capital and especially on labour) ishigher in the country that taxes government benefit payments.
39. Tables in this section listing the necessary adjustments to allow for preferential taxtreatment of household income only cover countries for which data are available tomake these adjustments.
40. Information on the tax treatment of each of these forms of household capital incomecomes from the OECD Tax Database, which only starts in 1994.
41. The tax on pension benefits that households pay in schemes subject to exempt-exempt-tax (EET) rules is effectively levied on deferred labour income, not the earn-ings of the pension scheme. The fact that earnings are not taxed when benefits aretaxed can be seen by considering the case of a contributor to a scheme subject to tax-exempt-exempt (TEE) rules. If tax rates and gross investment returns are the same,this contributor will get exactly the same net return on pension contributions as thecontributor subject to EET rules, despite the fact that pension benefits are not taxed.
42. Such tax is levied only in Australia, Denmark, New Zealand and Sweden.
43. The distinction between corporate income taxes and individual income taxes in OECDRevenue Statistics is that corporate income taxes are levied on the corporation as an entity,not on the individuals who own it, and without regard to the personal circumstances ofthese individuals. Following this logic, “Taxes paid on … the income of institutions, suchas life insurance or pension funds, are classified as corporate taxes (1200) if they arecharged on … the institution as an entity without regard to the personal circumstances ofthe owners” OECD Revenue Statistics (2001, p. 266).
44. These countries are: Australia, Austria, Canada, Czech Republic (1998-2000), Finland,France, Germany, Hungary (1997-2000), Iceland (1999-2000), Ireland, Italy (1994-98),Japan, Luxembourg (1994-97), Mexico, New Zealand, Portugal, Spain (1999-2000), theUnited Kingdom and the United States.
45. This does not mean that there is no preferential treatment of imputed rentals in coun-tries where they are taxed. As imputed rentals tend to be assessed at less than marketvalues, they still receive favourable treatment. In fact, taxation of imputed rentals canbe more favourable to the owner-occupier than tax exemption if he/she is able to off-set tax losses (usually owing to high mortgage interest charges) against other income.This is the case in the Netherlands and Switzerland.
46. These countries are the Czech Republic (1998-2000), Finland, Italy (1994-98), Mexico(1994, 2000), Portugal (1994-98), and the United States. Countries with small cappeddeductions for interest expenses (so that they are mostly not deductible) are notincluded in this category.
47. The exceptions, which operate a classical corporate income tax system and a global per-sonal income tax system, as assumed in the standard tax ratio methodology, are: Irelandin 2000; Japan; Luxembourg; the Netherlands; Switzerland; and the United States.

OECD Economic Studies No. 35, 2002/2
170
© OECD 2002
48. Countries with dividend imputation systems and that tax dividends as ordinaryincome but are not included in Table 16 owing to a lack of data are: Australia, Canada,Ireland (1994-99), Korea (1997), Mexico (1996-2000) and New Zealand.
49. As an example of calculating tIR, consider the case of an Australian resident in 2000subject to the top marginal tax rate (48.5 per cent). The imputation credit rate is 36 percent (the corporate tax rate) and the dividend must be grossed up to its pre-corporatetax value for inclusion in the individual’s global income subject to tax. Hence,
td= (0.485 – 0.36)/(1 – 0.36)
= 0.195
In other words, the individual only has to pay a tax rate of 19.5 per cent on dividendincome. Hence, the tax saving from the imputation credit (tIR) is 29 per cent, the differ-ence between his marginal income tax rate (48.5 per cent) and the tax rate actuallypaid on dividend income (19.5 per cent).
50. Countries that tax dividends separately at flat rates but that are not included inTable 18 owing to a lack of data are: Hungary, Mexico (1994-95), the Czech Republic,Iceland, Korea (1998-2000) and Poland.
51. Countries that tax interest receipts separately at flat rates but that are not included inTable 21 owing to a lack of data are: the Czech Republic, Hungary, Iceland, Ireland,Korea, Mexico, and Poland.
52. These adjustments mirror those for dividends in a scheduler household income taxsystem.
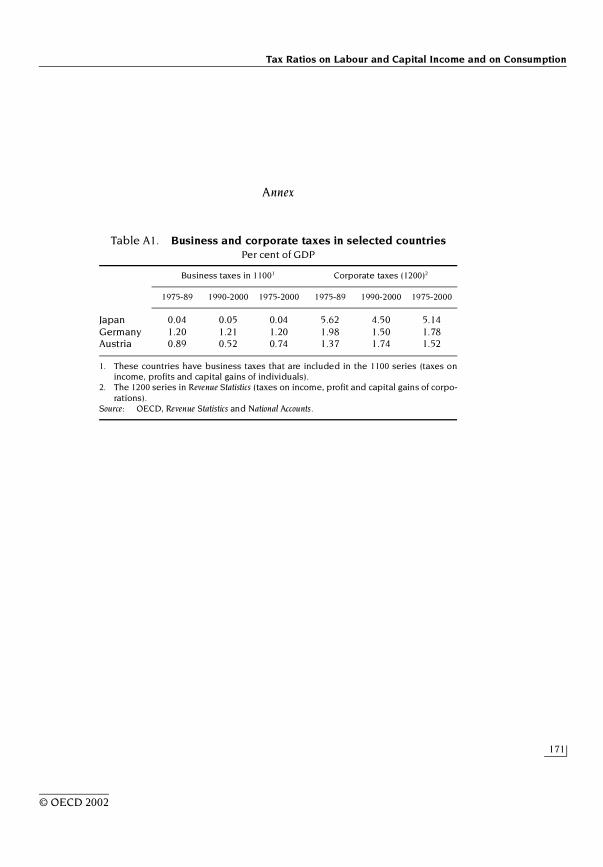
Tax Ratios on Labour and Capital Income and on Consumption
171
© OECD 2002
Annex
Table A1. Business and corporate taxes in selected countriesPer cent of GDP
1. These countries have business taxes that are included in the 1100 series (taxes onincome, profits and capital gains of individuals).
2. The 1200 series in Revenue Statistics (taxes on income, profit and capital gains of corpo-rations).
Source: OECD, Revenue Statistics and National Accounts.
Business taxes in 11001 Corporate taxes (1200)2
1975-89 1990-2000 1975-2000 1975-89 1990-2000 1975-2000
Japan 0.04 0.05 0.04 5.62 4.50 5.14Germany 1.20 1.21 1.20 1.98 1.50 1.78Austria 0.89 0.52 0.74 1.37 1.74 1.52

OE
CD
Econ
om
ic Stud
ies N
o. 35, 2
002/2
172
© O
EC
D 2002
Table A2. Tax ratios – revised approachPer cent
Capital based on net operating surplus
Capital based on gross operating surplus
Labour ConsumptionCombined
labour and consumption
1975-80
1980-90
1990-2000
Change between 1975-80
and 1990-2000
1975-80
1980-90
1990-2000
Change between 1975-80
and 1990-2000
1975-80
1980-90
1990-2000
Change between 1975-80
and 1990-2000
1975-80
1980-90
1990-2000
Change between 1975-80
and 1990-2000
1975-80
1980-90
1990-2000
Change between 1975-80
and 1990-2000
United States1 42.2 37.9 39.5 –2.7 29.2 25.8 27.3 –1.9 20.4 22.1 23.4 3.1 6.7 6.6 6.4 –0.4 25.7 27.3 28.3 2.6Japan 35.4 47.6 50.0 14.6 24.4 31.1 27.9 3.5 17.3 21.7 24.1 6.8 6.0 5.8 6.4 0.4 22.9 26.8 29.4 6.5Germany2 37.5 38.7 34.9 –2.6 23.6 23.1 21.2 –2.4 32.8 33.2 35.0 2.3 12.5 12.6 13.4 0.9 42.5 42.8 44.9 2.4France 42.0 51.9 55.9 14.0 25.3 30.0 33.2 7.9 32.7 37.9 40.5 7.8 15.7 15.7 15.1 –0.6 45.3 49.6 51.3 6.0Italy 21.7 32.7 42.7 21.0 15.2 23.6 31.0 15.8 25.8 32.1 37.7 11.9 10.6 11.7 13.9 3.3 35.0 41.5 47.9 12.9United Kingdom1 64.2 69.9 53.2 –11.1 37.2 40.5 34.0 –3.2 25.5 24.4 22.6 –2.8 13.4 16.0 15.7 2.3 35.4 36.5 34.8 –0.7Canada1 45.2 46.2 59.5 14.2 30.8 31.0 36.8 6.0 21.2 25.0 29.6 8.4 16.0 16.3 13.9 –2.0 33.8 37.2 39.4 5.6Australia1 44.5 46.2 49.4 4.9 27.3 28.4 30.7 3.5 18.8 20.6 20.9 2.1 12.8 13.9 12.1 –0.7 29.2 31.6 30.5 1.3
Austria 45.1 40.3 42.2 –2.9 23.7 22.3 24.3 0.6 33.1 36.0 39.6 6.5 16.8 17.2 16.2 –0.5 46.4 49.1 51.2 4.9Belgium 49.6 50.0 51.4 1.8 31.5 31.3 32.7 1.3 35.5 39.6 41.3 5.7 14.9 14.3 15.0 0.1 47.1 49.9 51.7 4.6Czech Republic3 .. .. 40.7 .. .. .. 21.6 .. .. .. 41.5 .. .. .. 13.0 .. .. .. 47.2 ..Denmark .. 87.3 71.9 .. .. 46.1 39.5 .. .. 36.1 39.9 .. 19.4 20.9 20.6 1.2 .. 53.8 56.0 ..
Finland 36.5 40.2 48.9 12.4 21.5 22.7 26.0 4.5 33.4 35.2 45.0 11.6 17.2 18.7 18.7 1.5 47.4 50.3 58.0 10.5Greece .. .. 15.1 .. .. .. 12.9 .. .. .. 34.9 .. 13.6 14.4 15.5 1.9 .. .. 46.5 ..Hungary1 .. .. .. .. .. .. 14.7 .. .. .. .. .. .. .. 22.2 .. .. .. .. ..Ireland .. 25.1 24.1 .. .. .. .. .. .. 25.0 26.3 .. 17.6 21.4 21.2 3.6 .. 41.0 41.9 ..
Korea 9.7 13.2 22.5 12.8 8.3 10.5 16.7 8.4 3.4 4.5 9.9 6.6 13.7 16.3 15.8 0.8 17.9 20.0 24.2 6.3Netherlands .. .. 52.8 .. .. .. 32.7 .. .. .. 36.4 .. 16.3 16.8 18.0 1.6 .. .. 47.9 ..New Zealand .. .. 43.8 .. .. .. .. .. .. .. 25.1 .. 11.7 15.0 18.5 6.8 .. .. 38.9 ..Norway 42.4 50.3 39.4 –3.0 24.6 29.3 24.7 0.1 35.7 35.6 36.2 0.5 23.8 25.7 25.7 1.8 51.0 52.1 52.5 1.5
Poland .. .. .. .. .. .. 20.9 .. .. .. .. .. .. .. 17.1 .. .. .. .. ..Portugal1, 4 .. .. 28.1 .. .. .. 17.6 .. .. .. 23.9 .. 13.3 17.8 19.9 6.7 .. .. 39.0 ..Spain 12.8 20.5 28.8 15.9 9.1 14.2 20.0 11.0 24.7 30.0 30.7 6.0 5.2 11.5 14.5 7.6 29.9 38.0 40.8 10.8Sweden 71.8 70.3 69.9 –1.9 34.1 35.3 35.7 1.6 44.6 47.9 49.6 5.0 18.3 20.6 19.8 1.5 54.7 58.6 59.6 4.8Switzerland 38.4 47.0 53.2 14.8 24.4 26.5 27.1 2.7 26.9 27.7 30.9 4.0 8.8 9.0 9.3 0.5 33.3 34.2 37.3 4.1
EU-155
Average 42.4 46.0 47.5 5.2 24.6 27.0 28.7 4.1 32.0 35.1 38.0 6.0 15.9 17.3 17.8 1.9 42.6 46.3 48.9 6.3Standard
deviation 19.7 17.4 13.0 –6.7 9.4 8.4 6.2 –3.2 6.6 7.0 8.0 1.4 4.3 3.3 2.0 –2.4 8.1 7.4 7.6 –0.5

Tax R
atio
s on L
abo
ur and
Cap
ital Inco
me
and
on C
onsu
mp
tion
173
© O
EC
D 2002
Table A2. Tax ratios – revised approach (cont.)Per cent
1. Social security contributions are not deductible.2. West Germany before 1991.3. it is assumed that the capital income tax ratio for the Czech Republic in 2000 is the same as in 1999.4. It is assumed that the capital income tax ratio for Portugal in 1999 and 2000 are the same as in 1998.5. Simple averages of the above countries with data in 1975.Source: OECD, Revenue Statistics and National Accounts.
Capital based on net operating surplus
Capital based on gross operating surplus
Labour ConsumptionCombined
labour and consumption
1975-80
1980-90
1990-2000
Change between 1975-80
and 1990-2000
1975
-80
1980-90
1990-2000
Change between 1975-80
and 1990-2000
1975-80
1980-90
1990-2000
Change between 1975-80
and 1990-2000
1975-80
1980-90
1990-2000
Change between 1975-80
and 1990-2000
1975-80
1980-90
1990-2000
Change between 1975-80
and 1990-2000
OECD5
Average 39.9 43.9 46.3 6.4 24.4 26.6 28.1 3.7 27.0 29.6 32.3 5.3 14.6 15.6 15.7 1.1 37.3 40.4 42.6 5.3Standard
deviation 15.9 15.0 12.7 –3.3 8.0 7.4 5.8 –2.2 9.7 10.0 10.3 0.6 5.2 5.5 5.3 0.1 10.8 10.4 10.8 0.0

OECD Economic Studies No. 35, 2002/2
174
© OECD 2002
BIBLIOGRAPHY
ADEMA, W. (2001), Net Social Expenditure, 2nd Edition, OECD Labour Market and Social Policy OccasionalPaper No. 52, Paris.
DEVEREUX, M.P. and R. GRIFFITH (1998), “The Taxation of Discrete Investment Choices”, Institute for Fiscal Studies Working Paper 98/16.
DIRECTORATE-GENERAL of the EUROPEAN COMMISSION (1998), “How to Measure the Burden of Taxation: Implicit Tax Rates According to the (Primary)Functional Incidence Approach”, mimeo.
EUROPEAN COMMISSION (1997), “Effective Taxation and Tax Convergence in the EU and the OECD”, Background paper.
MENDOZA, E.G., A. RAZIN and L.L. TESAR (1994), “Effective Tax Rates in Macroeconomics: Cross-Country Estimates of Tax Rates on FactorIncomes and Consumption”, NBER Working Paper, No. 4864, September.
OECD (1992), Methods Used by OECD Countries to Measure Stock of Capital, December.
OECD (1994), The Taxation of Household Savings, Paris.
OECD (2000), “Tax Burdens: Alternative Measures”, OECD Tax Policy Studies, No. 2., Paris.
PRESCOTT, Edward C. (2002), “Prosperity and Depression”, The American Economic Review, Vol. 92 No. 2, May.
VOLKERINK, B. and J. de HAAN (2001), Tax Ratios: A Critical Survey, OECD Tax Policy Studies, No. 5.