Tax Motivated Income Shifting and Korean Business...
44
Tax Motivated Income Shifting and Korean Business Groups (Chaebol) Kooyul Jung * Boyoung Kim Byungmo Kim Korea Advanced Institute of Science and Technology December 2005 * Corresponding author, Korea Advanced Institute of Science and Technology 3938 Cross Bend Dr. Arlington, Texas, 76016 Tel.: 817-572-3788, Email: [email protected]
Transcript of Tax Motivated Income Shifting and Korean Business...
Tax Motivated Income Shifting and Korean Business Groups (Chaebol)
Kooyul Jung* Boyoung Kim Byungmo Kim
Korea Advanced Institute of Science and Technology
December 2005 * Corresponding author, Korea Advanced Institute of Science and Technology
3938 Cross Bend Dr. Arlington, Texas, 76016
Tel.: 817-572-3788, Email: [email protected]

1
Abstract
This paper examines tax-induced income shifting behavior among the affiliated firms in the
Korean business groups (chaebol). Korean corporate income tax law does not require consolidated
tax returns, and business groups with a large number of affiliated member firms have incentives to shift income across member firms to reduce overall taxes of the group. Korean chaebols provide a
good experimental setting to explore within-jurisdictional income shifting because, under the
peculiar governance structure of chaebol firms, business decisions for each affiliated firm are
coordinated by the controlling owner-manager of the group, so a coordinated strategy among the affiliated firms can be utilized to reduce overall tax burdens for the group as a whole.
For a large number of Korean companies that are subject to external audits, we perform
univariate and multivariate regression analyses on income shifting behavior of chaebol firms
compared with non-chaebol control firms. Our evidence supports tax-motivated income shifting activities of chaebol firms. The extent of income shifting is found to depend on its effect on nontax
cost factors such as earnings, leverage, and cash flow rights of the controlling shareholders. We also
find that income shifting occurs mainly through operating rather than nonoperating income,
suggesting that transfer pricing could be a likely channel for income shifting. Further, the income shifting becomes less intensive when the statutory corporate tax rate decreases, confirming that our
findings of income shifting are tax related rather than motivated by income management. In
addition, we find that the income shifting is weaker for the post-Asian financial crisis period than
the pre-crisis period. Our study provides some insights on the within-jurisdictional income shifting activities where research is limited.
1
I. Introduction
This paper examines tax-induced income shifting behavior among the affiliated firms in the
Korean business groups (chaebol). Korean corporate income tax law does not require consolidated tax returns, and business groups with a large number of affiliated member firms have incentives to
shift income across member firms to reduce overall taxes of the group by taking advantage of
differential tax rates of the member firms. Prior tax research has focused primarily on income
shifting between jurisdictions rather than between differentially taxed entities within the same jurisdictions.1 Although the heterogeneous tax systems in international or interstate settings provide
a good research opportunity for income shifting, they incur other nontax jurisdictional factors that
might introduce correlated omitted variables and measurement error problems (Shackelford and
Shevlin, 2001). A within-jurisdiction study does not suffer much from these heterogeneous nontax cost factors.
However, research on within-jurisdictional income shifting is limited since it does not
provide much variation in tax rates, and the effect of income shifting is mitigated under the
consolidated tax reporting systems required in many countries including the U.S. For Japanese keiretsu affiliated firms, Gramlich et al. (2004) provide evidence of income shifting among member
firms in order to reduce overall tax burdens of the group. Our study extends prior research by
examining the cross-sectional income shifting within the same jurisdiction for the Korean
chaebols.2 Korean chaebols provide a good experimental setting for exploring within-jurisdictional
income shifting. First, each member firm of the chaebol group is legally independent and separately
traded in the capital market. Also, since controlled member firms’ taxes are not consolidated,
income shifting from high-tax to low tax member firms can reduce the total tax liability. Further, under the peculiar governance structure of chaebol firms as explained later, business decisions for
each affiliated firm are coordinated by the controlling owner-manager of the group, and are aimed
1 As further described in Section II, examples of between jurisdiction studies include Collins et al. (1998), Harris (1993), Harris et al. (1993), Jacob (1996), Klassen et al. (1993), and Mills and Newberry (2004). These studies provide evidence on multinational or multistate income shifting behavior (see Shakelford and Shevlin (2001) for the survey on this area). 2 Paralleling with the cross-sectional income shifting, evidence on intertemporal income shifting is also documented by some studies (Scholes et al. (2002), Guenther (1994a), and Maydew (1997)).
2
at increasing the group value as a whole as well as the individual firm value. In addition, for tax planning, a coordinated strategy among the affiliated firms is utilized to reduce overall tax burdens
for the group as a whole.
Using detailed data for a large number of Korean companies that are subject to external
audits, including unlisted privately held firms, we perform univariate and multivariate regression analyses on income shifting behaviors of chaebol firms compared with non-chaebol control firms.
Our evidence documents tax-motivated income shifting activities of chaebol firms. Furthermore,
the extent of income shifting is found to depend on its effect on nontax cost factors such as earnings,
leverage, and cash flow rights of the controlling shareholders. The results imply that chaebol groups adopt an effective tax planning strategy for the group as a whole. We also find that income
shifting occurs mainly through operating rather than nonoperating income, suggesting that transfer
pricing among the affiliated firms is a likely channel for income shifting. Further, income shifting
becomes less intensive as the statutory corporate tax rate decreases, confirming that our findings on income shifting are tax related rather than motivated by income management. In addition, we find
that income shifting is weaker for the post-Asian financial crisis period than the pre-crisis period,
suggesting that improved corporate governance and accounting transparency after the crisis could
have discouraged such tax avoiding income shifting behavior. This study has some policy implications. First, a stronger control mechanism is in order to
discourage such tax avoiding income shifting activities. This protects the minority shareholders
because the tax saving strategy, although reducing the total tax costs of the group as a whole, often
benefits the controlling owners of the chaebol group at the expense of minority shareholders. Second, adoption of a consolidated tax return system should be seriously considered. This will
reduce inequity in taxation that arises from separate taxation of the group firms in a chaebol. This
issue is beyond the scope of this paper and not addressed in this study.3
The remainder of the paper is organized as follows. Section II reviews prior literature and develops hypotheses related to the income shifting behavior. Section III describes the data and
samples used in the study. Section IV reports empirical results, and Section V presents the results of
additional tests. Section VI concludes the paper with a summary.
3 The Korean tax authority plans to allow consolidated tax returns in the near future. This issue is under discussion now, but at this time, no decision has been made about the timing of its adoption.
3
II. Related Research and Hypothesis Development
2.1. Related Research
Research on income shifting has been among the most active areas in tax research. However, prior tax research has primarily focused between jurisdictions rather than between differently taxed
entities within the same jurisdiction. If corporate income is taxed at different rates in different
jurisdictions, then, firms will take advantage of the differences in the tax rates among related
entities in different jurisdictions to reduce combined taxes. Harris (1993) and Klassen et al. (1993) are one of the early studies concerning income
shifting between jurisdictions. They report that multinational corporations shift a substantial
amount of income into the U.S. as a result of the Tax Reform Act of 1986 (TRA 86). Using
international intrafirm sales as a proxy for income shifting, Jacob (1996) shows that multinationals use transfer pricing to save taxes, and their ability to do so substantially varies across companies.
Also, Collins et al. (1998) examine whether the shifted earnings from foreign jurisdictions into the
U.S. is differentially evaluated in stock markets. Furthermore, Newberry and Dhaliwal (2001) in
their study on bond offering in different tax jurisdictions, show that U.S. multinationals strategically locate their interest deductions worldwide for tax purposes.
However, Shackelford and Shevlin (2001) point out that, in these international settings of
income shifting research, there are concerns on measurement errors and correlated omitted variable
problems arising from heterogeneous nontax factors across countries. Thus, in an attempt to control for the unobservable sources of heterogeneity, studies on multi-state income shifting have been
recently growing. For example, Klassen and Shackelford (1998) show that income reported in the
U.S. states and Canadian provinces are inversely correlated with their tax rates, indicating that
corporations strategically avoid state income taxes. Beatty and Harris (2001) provide evidence that interstate realization of security gains and losses by multi-bank holding companies is influenced by
their tax incentives.
Nevertheless, the interstate setting does not sufficiently separate tax effects from
heterogeneous nontax factors, and there are some suggestions for the income shifting studies between entities within the same jurisdictions (Scholes et al., 2002). Gramlich et al. (2004), who
investigate the tax-induced income shifting activities among Japanese keiretsu group member firms,
provide one of the few studies concerning tax motivated income shifting within the same
jurisdictions. They provide evidence that Japanese keiretsu firms strategically shift financially

4
reported income among affiliates in order to reduce overall effective tax rates. They show that the positive relation between pre-tax return on firm value and marginal tax rate status is significantly
mitigated by keiretsu membership. However, their study still suffers from the nontax cost problem,
because the income shifting could cause problems related to the managerial incentive compensation
or financial contracting to the shifting companies. Some Korean studies also examine income shifting behavior of Korean companies. Ko
(2000) provides evidence that Korean multinational corporations engage in tax-motivated income
shifting through transfer pricing between the domestic and foreign jurisdictions. Lee (2002) reports
that Korean companies are likely to accelerate the recognition of earnings from the intra-transactions among their subsidiaries when they face relatively low tax rates and/or low pretax
income. His study, however, does not particularly examine chaebol firms.
2.2. Hypothesis Development
Like keiretsu in Japan, Korean business groups (chaebols) are well suited for within-
jurisdictional income shifting research. Korean chaebol firms have unique ownership structures
which are characterized as the extensively inter-woven, i.e., pyramidal and/or cross-shareholding, ownership structure among affiliated firms (Bae, Kang, and Kim, 2002; Baek, Kang, and Park,
2004). The peculiar ownership structure enables the controlling shareholders to have almost
complete control over all of the affiliated firms within the group without considering their minority
shareholders (Claessens et al., 2000). Under such a governance structure, business decision making for each affiliated firm is coordinated at the group level and aimed to increase the overall group
value, often at the expense of the value of individual affiliated firms. The ineffective market
monitoring mechanisms in Korea partly contribute to such decision making which expropriates the
minority shareholders. In their survey, Kook et al. (1997) show that financial decisions of Korea chaebol groups are
made for size maximization of the group as a whole. The Korea Development Institute (2003)
reports a similar finding that the owner-managers of chaebols influence each affiliated firms’
decisions on personnel matters and financial projects as well as the overall business directions of the group. The existence of internal capital markets within chaebols (Shin and Park, 1999; Kim,
Jung, and Kim, 2005) and tunneling evidence on intra-group acquisitions (Bae, Kang, and Kim,
2002) also reflect the fact that the financial decisions of chaebol firms are interrelated with each
other and made in the direction of increasing overall group value and the controlling shareholders’
5
private benefits. In spite of their close economic connections, chaebol-affiliated firms are legally independent
of each other and separately traded in financial markets, as contrasted with the subsidiaries of the
U.S. business conglomerates. It enables us to identify the individual tax rates of affiliated firms
from their individual financial statements.4 Further, consolidated tax returns are not required yet, and each member firm is individually taxed as a separate entity, which provides opportunities for
the chaebol firms to shift income to other affiliated firms to reduce the total taxes of the group as a
whole. Corporate taxes can be saved by shifting income from the high-tax member firms to the
low tax firms.5 This leads to the following hypothesis.
H1: Chaebol firms reduce their combined group tax liabilities by shifting income among the
affiliated firms.
This hypothesis is tested by comparing the profitability-tax rate relationship between chaebol
and non-chaebol firms, as further explained in Section IV. Our second hypothesis relates to the
effect of nontax costs on the income shifting activities. Tax planning does not simply mean tax
minimization (Scholes et al., 2002). Effective tax planning should consider not only tax costs but also other nontax costs that may occur in relation to the tax costs in the planning process. Income
shifting may reduce the present value of tax payments, but if these savings incur greater nontax
costs in relation to, for instance, managerial incentive compensation and financial contracting, it
would not represent efficient tax planning when overall costs are considered. Some studies therefore attempt to examine the coordination of tax and nontax cost factors in
4 Consolidated financial statements are also required for the controlled subsidiaries in Korea as well as individual financial statements. However, the consolidated financial statements are filed one month after individual firm’s financial statements are filed, and not considered as principal financial statements. The Korean Financial Supervisory Service is planning to require consolidated financial statements as principal financial statements from 2007. 5 Although there is no empirical evidence yet, anecdotal evidence is replete that chaebol firms avoid taxes through income shifting among the member firms. In order to discourage such tax avoidance behaviors among the affiliated firms, Article 52 of the Korean Corporate Income Tax Law stipulates that certain tax reducing activities between specially related parties (including member firms) are denied for tax purposes. Examples include:
1) The transfer of assets in excess of or below the fair value, 2) Purchase of under-performing assets, 3) Purchase of uncollectible receivables 4) Lending (borrowing) cash, or provision (receipt) of other assets or services at below market rate,
and 5) Sale or purchase of stocks for above or below the market price in connection with M&A, etc.
6
business decisions. Scholes et al. (1990) examine whether banks strategically recognize their security gains or losses to manage their earnings and regulatory capital as well as taxes. Bartov
(1993) reports that the timing of asset sales is affected by both income smoothing and tax
incentives, and Klassen (1997) argues that firms with low inside ownership face more capital
market pressure and are less willing to realize losses for tax purposes in asset divestitures than high inside ownership firms.
Amongst income shifting research, Guenther (1994) shows that when companies shift income
to save taxes intertemporally around the tax rate reduction in TRA 86, firms with low leverage
ratios (and thus having fewer financial contracting problems) are likely to report lower income. Maydew (1997) reports that NOL carrybacks to the period before 1986 are less for high than low
leveraged firms, probably due to debt covenant problems. These results indicate that high nontax
costs imposed on high leverage ratios discourage firms from lowering their earnings for tax
purposes. In cross-sectional income shifting settings, Beatty and Harris (2001) show that multibank holding companies trade off taxes, earnings, and regulatory capital and coordinate the choice of the
security gains and losses among subsidiary banks. Krull (2004) also examines the trade-off effects
among managers’ tax, investment, and earnings management incentives when U.S. multinational
corporations designate foreign subsidiary earnings as permanently reinvested earnings (PREs). From such an efficient tax planning perspective, we consider the trade-off effects between tax
and nontax factors on income shifting for tax purposes among affiliated firms in business groups. If
nontax costs related to the change in earnings resulting from income shifting are greater than the
decrease in tax costs, the net effect of the income shifting on the overall group value will be negative. This suggests that the controlling shareholders’ motivation to engage in intra-group
income shifting will be weaker for the firms facing high nontax costs, compared with those facing
low nontax costs. The second hypothesis investigates the interacting effects of nontax costs on tax-
induced income shifting:
H2: The income shifting behaviors among chaebol-affiliated firms to lower overall taxes are
less common for the firms with high nontax costs.
7
III. Sample and Data
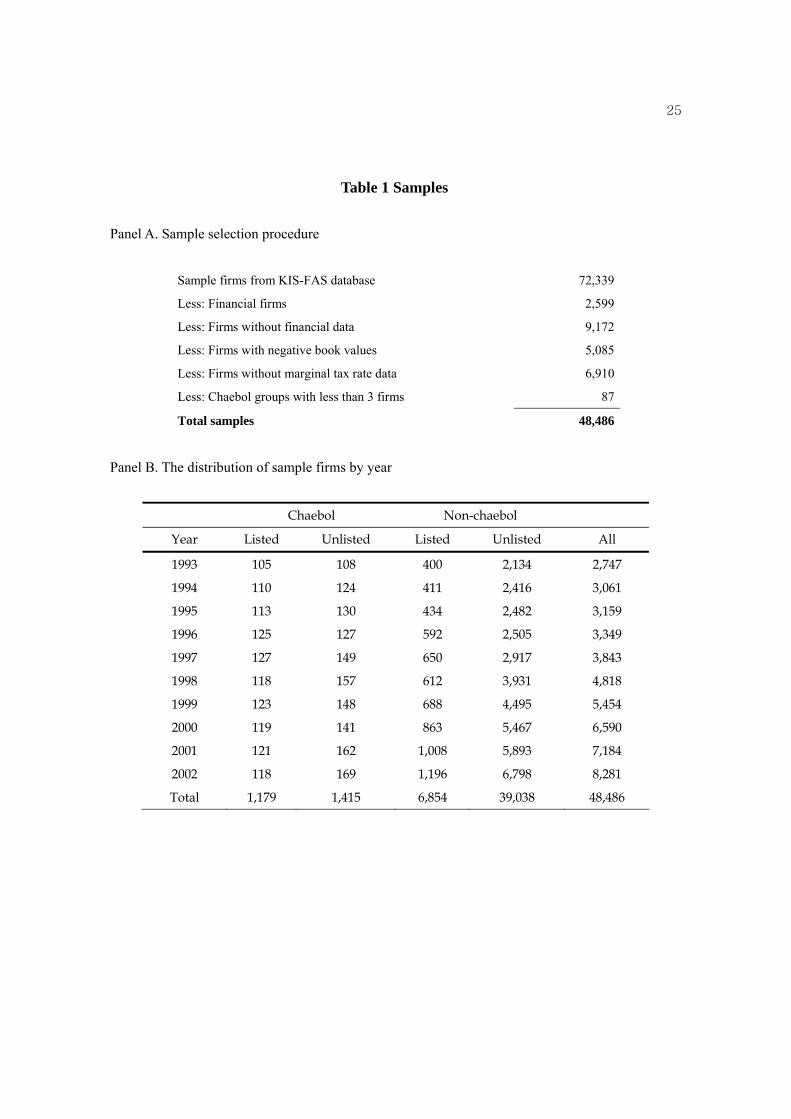
Sample firms are obtained from the KIS-FAS database. It includes all the firms whose
assets are greater than 7 billion Korean won which are subject to external audit according the
Regulation on the External Audits.6 As reported in Panel A of Table 1, we started from all the firms in the database and excluded non-financial firms, and those whose financial information is not
available for the 10 year period from 1993 through 2002. Then, firms with no financial data,
negative book values, and those whose marginal tax rates cannot be calculated are further
eliminated. Also, firms with less than 3 affiliated firms in the same business groups are excluded because our purpose is to examine income shifting among the affiliated firms. This results in
48,486 firms for the 10 year period.
As explained later, calculation of marginal tax rate requires nine financial statement items
including tax credit, and it caused a substantial reduction in the number of sample firms. For chaebol firms, we use the 30 largest chaebol groups, which are announced each year by the Korea
Fair Trade Commission based on the total asset size. 7
The taxable income data, which we use as an alternate measure for income shifting, is
collected from the annual reports in the Korea Listed Company Association database until 1997, and from 1998, the data is obtained from the electronic disclosure system of the Financial
Supervisory Service. Taxable income data is available only for 3,860 companies that are listed in
the exchange.
Panel B of Table 1 presents the distribution of sample firms by year, chaebol and non-chaebol, and listing status. It shows that the total sample of 48,486 firms consists of 2,594 chaebol
firms and 45,892 non-chaebol firms. Among the 2,594 chaebol firms, 1,179 (45%) are listed, and
1,415 (55%) are unlisted while 6,854 (14.9%) of the non-chaebol firms are listed, and 39,038
(85.1%) are unlisted respectively. Substantially more chaebol firms are listed than non-chaebol firms.
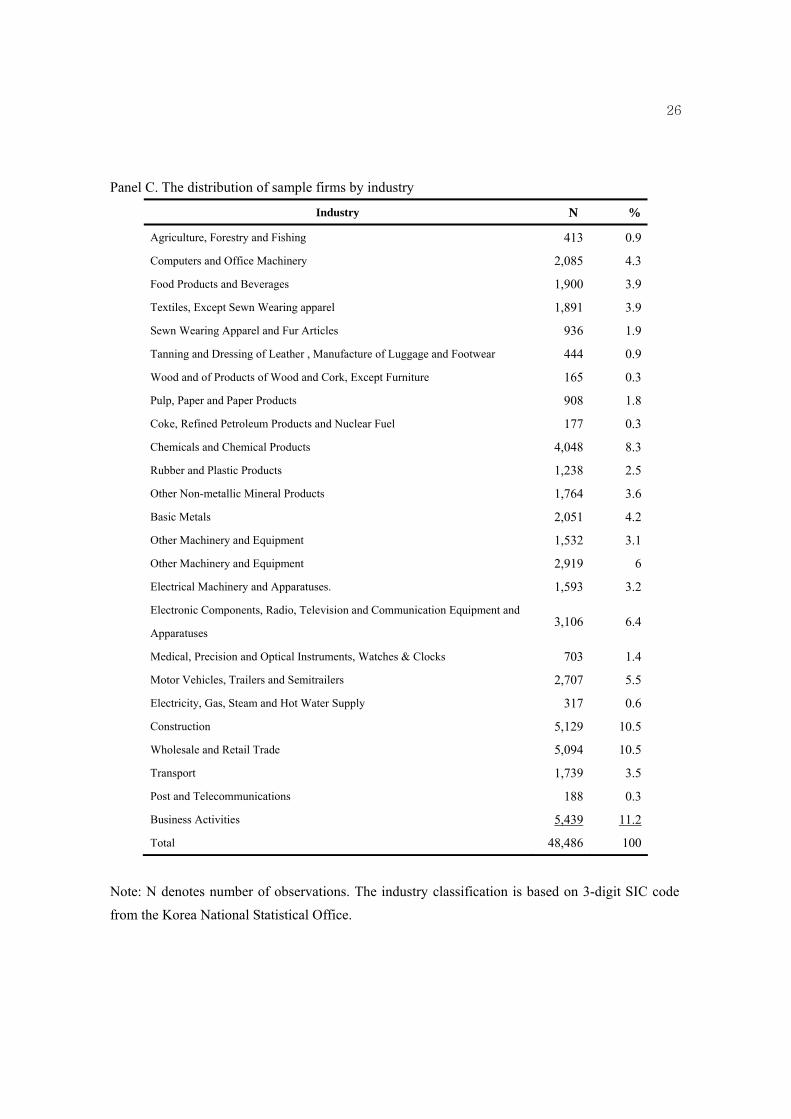
Panel C of Table 1 describes the industry distribution of our sample firms according to the
Korea National Statistical Office’s 3-digit industry classification code. We find that there are more
firms in chemicals (8.35%), manufacturing of electronic devices (6.41%), construction (10.58%), and retail industries (10.51%). However, firms are relatively evenly distributed across all industries,
6 7 billion Korean won is about 6.72 million U.S. dollars as of November 27, 2005. 7 After 2001, the Korean Fair Trade Commission classifies all conglomerates as a chaebol whose total assets are over 2 trillion Korean won. Therefore in 2002, the 43 largest conglomerates were announced as the largest chaebol groups.
8
suggesting that the industry effect would have little influence on our results.
IV. Empirical Results
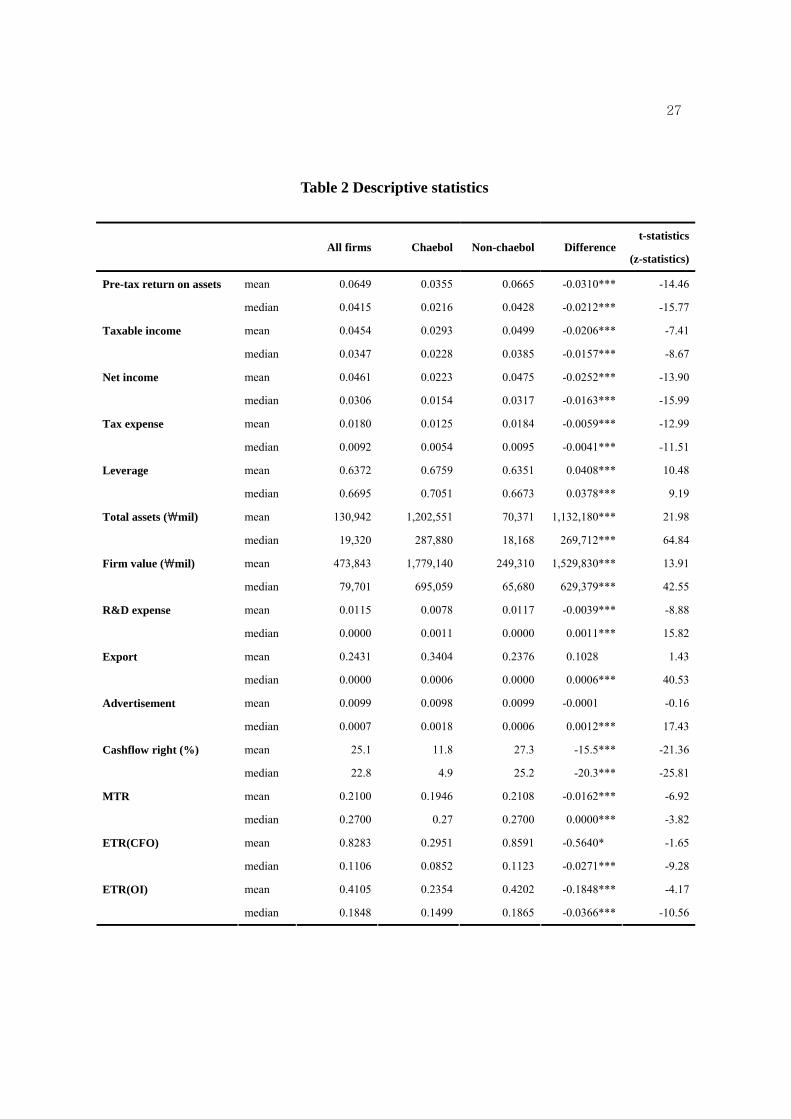
4.1. Descriptive statistics
Table 2 shows mean and median statistics of pre-tax return on assets, net income, tax expense,
leverage ratio, total assets, firm size and other variables for chaebol firms and non-chaebol firms.
Pre-tax return on assets is calculated by the pretax income divided by the total assets at the beginning of the year. Net income and taxable income are also deflated by total assets at the
beginning of the year. R&D, exports, advertising and tax expenses are standardized by sales.
Leverage is the ratio of total debt to total assets. Firm value is defined as the sum of the market
value of equity and the book value of total debt (available for listed firms only). Cash flow rights represent the controlling shareholders’ cash flow ownership, including the ownership of their
family members. It is available for 7,111 firms only. The last two columns of the table show the
differences of mean (median) values between chaebol and non-chaebol firms (chaebol minus
nonchaebol) and their t-statistics (z-statistics). Chaebol firms show lower profitability and income than non-chaebol firms similar to Joh
(2003). Tax expense is lower for chaebol firms consistent with lower profitability. Chaebol firms
are much larger than non-chaebol firms. The mean total assets for chaebol firms (1.2 trillion won)
is much larger than for non-chaebol firms (70 million won), while their difference is smaller in median values. Leverage is higher for chaebol firms than non-chaebol firms, probably due to their
large collateral values and their preferential access to external loan and bond markets. The
controlling shareholders’ cash flow rights are more concentrated for non-chaebol firms than
chaebol firms (11.8% versus 27.3% in mean values). This reflects the fact that the controlling shareholders of chaebol firms control the affiliated firms with a very small equity stake using cross-
shareholding and a pyramidal ownership structure, which is consistent with prior literature.
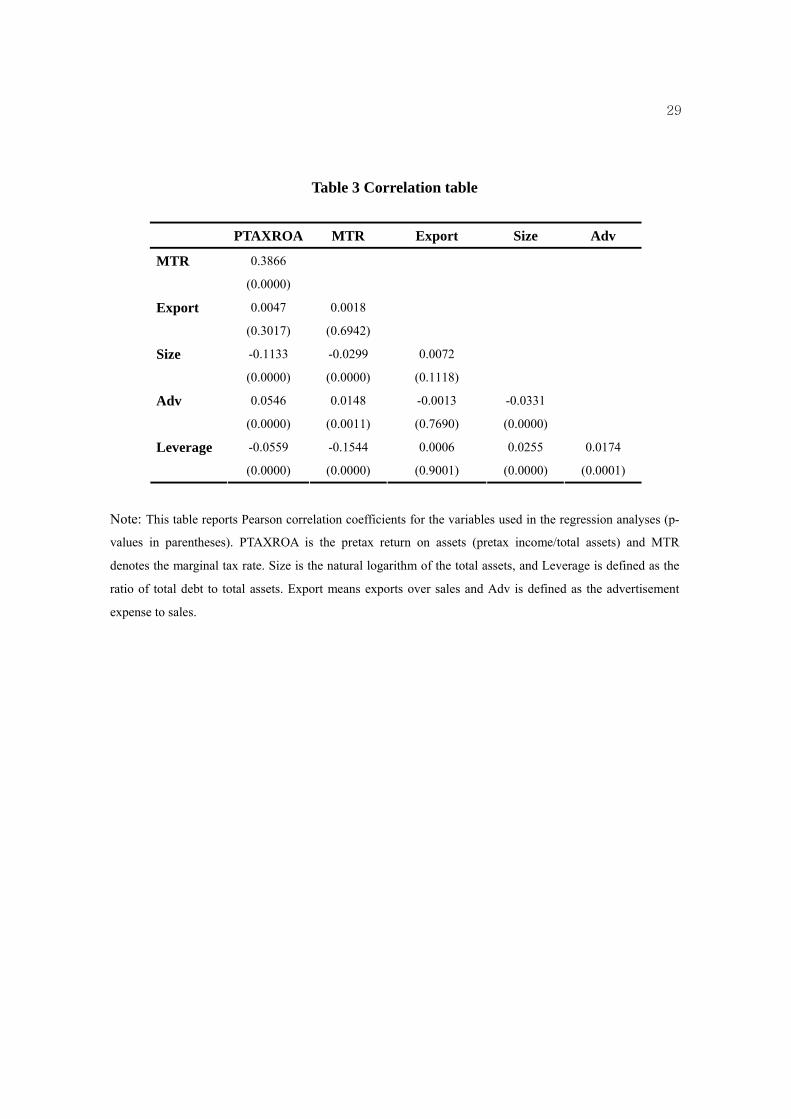
Table 3 shows Pearson correlations for the variables used in the regression analyses. The
correlation between a firm’s marginal tax rate and profitability, pre-tax return on assets (PTAXROV), is fairly high (38.66%) and statistically significant. Some other correlations between
the variables used as independent variables in the regressions are also significant. They are -15.44%
between the marginal tax rate and leverage, -11.33% between size and PTAXROV, and -5.59%
between leverage and PTAXROV, respectively. However, none of them seem to be high enough to
9
cause multicollinearity problems.
4.2. Univariate analysis
4.2.1. Profitability and the tax rate
Firms facing high tax rates can save taxes by reporting a low income. Particularly, chaebol
group firms can shift income among affiliated member firms and reduce overall combined tax
liability. If chaebol firms with high tax rates shift income to other affiliated member firms with low tax rates in the group, the combined taxes of the group will decrease. In order to examine this
behavior, we first compare the firm profitability-tax rate relationship between chaebol and non-
chaebol firms on a univariate basis.
For a measure of tax rate, we use a simulated marginal tax rate which is calculated following Graham (1996a).8, 9 We use the marginal tax rate because a firms’ tax planning decision relies on
the marginal, not average, tax rate. The marginal tax rate better reflects the change in tax costs
associated with additional income earned and is more appropriate for tax planning purposes than
the effective tax rate (Scholes et al., 2002; Shakelford and Shevlin, 2001; Plesko, 2003). The firm profitability, PTAXROA, represents the pretax return on assets and is measured as the ratio of pre-
tax income to total assets as explained earlier (Gramlich et al., 2004; Collins et al. 1998).
We first sort all the sample firms (chaebol and non-chaebol) in ascending order of PTAXROA
for each year and then by industry, and divide them in quartiles. Therefore, the first quartile includes the group of firms with the lowest profitability for each industry and in each year. This
way, chaebol and non-chaebol firms can be compared with the industry and year effects controlled.
The results presented in panel A of Table 4 show that, among less profitable firms (those in
the 1st and 2nd quartiles), chaebol firms face higher marginal tax rates than non-chaebol firms do.
8 Plesko (2003) reports that, amongst the proxies for marginal tax rate, e.g., a simple binary dummy variable and a trichotomous variable, those based on simulation method perform better in estimating current year tax rate. 9 The marginal tax rate is obtained from Ko (2003). Following the method of Graham (1996a), Ko estimates marginal tax rate using simulation method with financial statement information of Korean companies. He first simulates future 5 year earnings and then adjusts the effect of possible net operating loss (NOL) on the estimated income string. The Korean tax code regulates that the loss carryforwards are deductible for corporate income up to 5 years. He however ignores the effect of loss carrybacks because it is permitted to small and medium business entities only and income-deductible for one year. He further considers various tax credits and the Alternative Minimum Tax (AMT). He next calculates the difference in tax liability incurred by the increase in one currency unit and then repeats the simulation procedure 50 times. Averaging over the 50 estimates, he finally defines current year marginal tax rate.

10
This trend is reversed for the more profitable firms (the 3rd and 4th quartiles). The tax rate becomes slightly greater for non-chaebol firms from the 3rd quartile, and finally in the 4th quartile, the highest
profitable group, the non-chaebol firms’ tax rate becomes significantly greater than that of chaebol
firms.10 These results are consistent with the tax-induced income shifting behavior. That is, if
profitable chaebol firms with high marginal tax rates shift income to the affiliated firms which are less profitable and therefore have low marginal tax rates, then the chaebol firms’ tax rate in the less
profitable group will be greater compared with non-chaebol control firms, while the reverse is true
for the more profitable group. This is consistent with pattern reported in panel A of Table 2.
The third and fourth rows of each quartile of panel A provide analysis based on the frequency. They show the number (percentage in parenthesis) of firms whose marginal tax rate is the
maximum statutory rate. The total number of firms to which the maximum statutory tax rate is
applied is 1,464 for chaebol firms (56.4% of total chaebol firms) while it is 28,295 for non-chaebol
firms (61.7% of total non-chaebol firms). More non-chaebol firms are subject to the maximum statutory rates than chaebol firms are. Breaking down into quartiles, in the least profitable 1st
quartile, chaebol firms have more firms with the maximum tax rates than non-chaebol firms (11.5%
versus 5.0%). This trend is reversed from the 3rd quartile, and finally in the most profitable 4th
group, the non-chaebol group has substantially more firms with the maximum statutory marginal tax rates than chaebol firms – consistent with the results in the profitability analysis above.
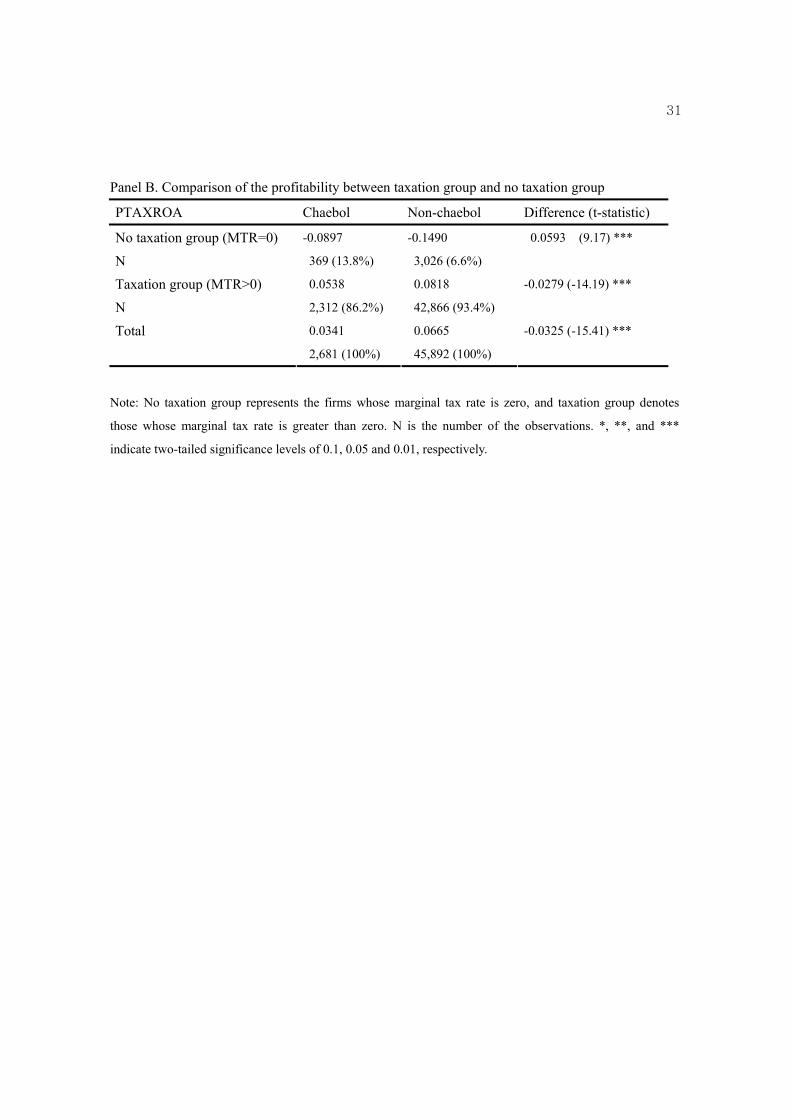
Panel B of Table 4 presents the result from a slightly different perspective. We divide the
sample firms into two groups, taxation and non-taxation groups, depending on whether a firm’s
marginal tax rate is positive or 0 and compare the firm profitability between chaebol and non-chaebol firms for each group. If chaebol firms engage in income shifting, they will show higher
profitability in the no-taxation group than they do in the taxation group. The results reported in
Panel B of Table 4 show that the average firm profitability is lower for chaebol firms than non-
chaebol firms in the taxation group (0.0538 versus 0.0818) while it is higher for chaebol firms in the no-taxation group (-0.0897 versus -0.1490) consistent with the above results.
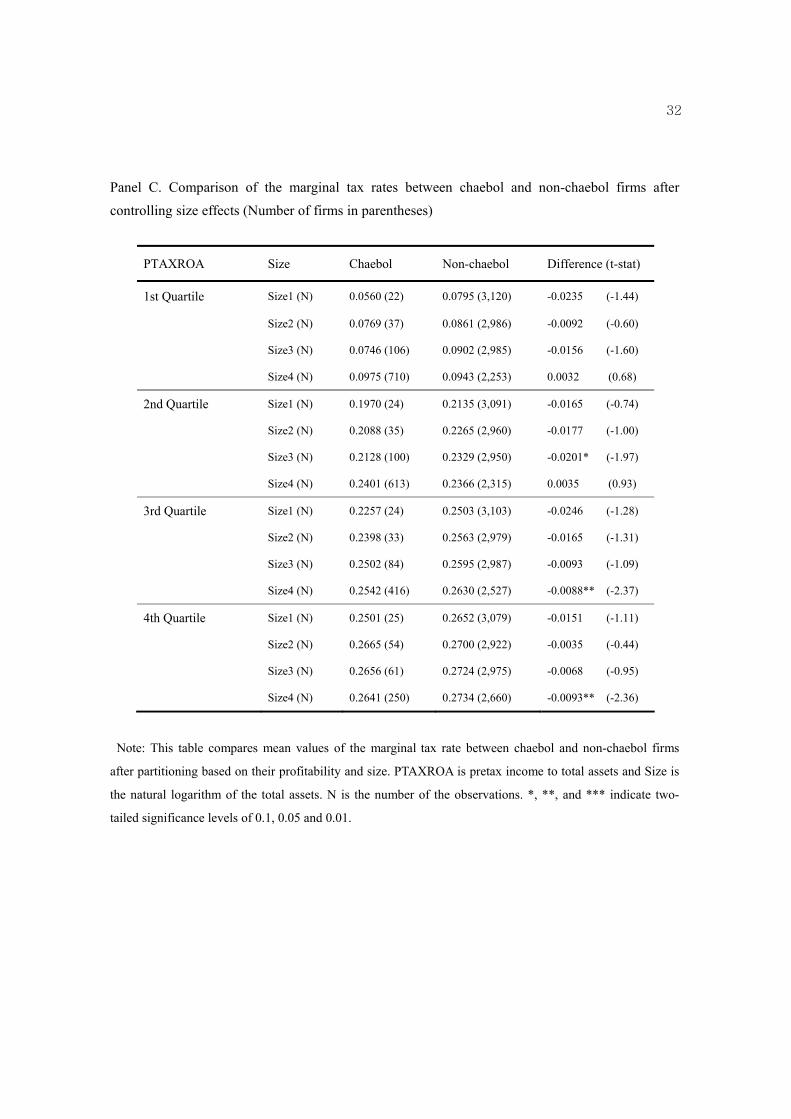
4.2.2. Firm size and tax rate
Theoretically, the tax rate is related to the firm size, and the evidence reported above is
possibly influenced by the size difference between chaebol and non-chaebol firms. The relationship
between the tax rate and firms size is inconsistent across studies. Siegfried (1972) and Porcano
10 The similar trend is also found when we compared median values of marginal tax rates.
11
(1986) find a significantly negative association between the effective tax rate and firm size. They argue that larger firms have greater resources to influence the political process, to develop expertise
in tax planning, and to organize their activities in tax-saving ways. In contrast, Zimmerman (1983)
and Omer, Molly, and Ziebart (1993) document a significantly positive relation between the
effective tax rate and firm size and explain it by the political cost hypothesis that larger firms pay more political costs through tax payments. Meanwhile, Jacob (1996), Gupta and Newberry (1997),
and Mills et al. (1998) do not find any significant relation between the size and the tax rate.
Using the marginal tax rate, Graham (1996a) reports a positive correlation between the
marginal tax rate and firm size. Using Korean data, Cheon (1997) shows that the firms in the largest deciles have significantly low effective tax rates, a result similar to Siegfried (1972) and Porcano
(1986). His results are consistent with the lower marginal tax rate of chaebol firms which are much
larger than non-chaebols firms, as we reported in panel A of table 4.
In order to examine the effect of firm size on the relation between the firm profitability and the marginal tax rate, we compare the marginal tax rates between chaebol and non-chaebol firms
after partitioning each quartile based on the profitability into 4 groups, based on their firm size.
For each quartile, we find that marginal tax rates are higher for the larger size groups. This seems to
suggest that there is a positive relationship between firm size and marginal tax rate after the profitability is controlled for. However the relation is not consistent for some groups, indicating that
the relation between firm size and the marginal tax rates are weak. Further, this relationship is
similar for both the chaebol and non-chaebol groups, suggesting that the firm size does not
differentially influence the relation between the marginal tax rate and the firm profitability for either chaebol and non-chaebol groups.
4.3. Multivariate analysis
The previous section shows the income shifting evidence on univariate basis. This section
performs multivariate regression analyses to examine the relation between the firm profitability and
the tax rate with other relevant variables controlled. If chaebol firms shift income from the high tax
firms to the low tax affiliated firms, this will lower the sensitivity of their profitability to the tax rates (termed as tax response coefficient) of chaebol firms relative to non-chaebol firms. Collins et
al.(1998) and Gramlich et al.(2004) show that intra-group transfer prices or asset sales that shift
income away from high taxed affiliated firms result in low reported profits for a given tax rate for
the income shifting firms. We examine the profitability – the tax rate relationship by regressing the

12
firm profitability on the marginal tax rates, chaebol dummy, and other control variables such as firm size, etc., following Gramlich et al. (2004) and Collins et al. (1998).
ti
tititi
tititititititi
DummiesYearDummiesIndustryIPTAXROVExportAdv
LeverageSizeCHCHMTRMTRPTAXROA
,
,8,7,6
,5,4,3,,2,10,
)(
εβββ
ββββββ
++
++++
+++×++=
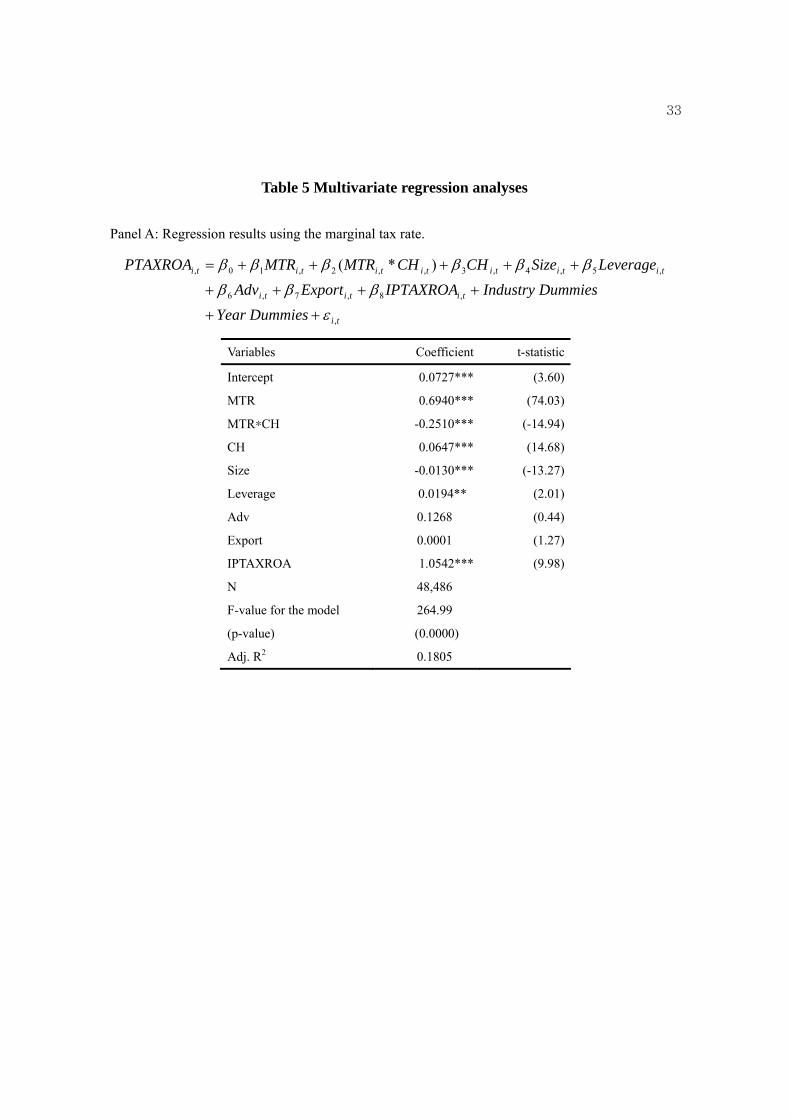
The dependent variable (PTAXROA) measures firm profitability and is calculated as a ratio of pretax income to total assets as defined in the previous section. MTR denotes a marginal tax rate.
CH is a dummy variable which takes 1 if a firm is a chaebol affiliated member firm and otherwise 0.
Size is a natural logarithm of the total assets, and Leverage is defined as the ratio of total debt to the
total assets. The leverage variable is included to control for its potential effect on the marginal tax rate and profitability. As other control variables, we include Export and Adv variables, defined as
exports over sales and advertising expense to sales, respectively (Joh, 2003). IPTAXROA is
industry-median pretax income to total assets calculated based on the Korea National Statistical
Office’s 3-digit industry classification code and included to control for the industry effect on the firm profitability.11 The industry and calendar year dummies are also included to control for
general industry effects and time-fixed effects.
Table 5 reports the results. Panel A reports the results using the marginal tax rate. The
coefficient of the marginal tax rate, β1, represents the sensitivity of the tax rate on the profitability (tax response coefficient) and is expected to be positive because the tax rate will be the higher, as
profitability increases. It is positive (0.694) and highly significant with a t-value of 74.03. Our
hypothesis predicts that the sensitivity of firm profitability to the marginal tax rate is lower (i.e.,
less positive) for chaebol firms than non-chaebol firms, and therefore, β2, the coefficient estimate on the interaction term of marginal tax rate with a chaebol dummy, is expected to be negative. The
result shows that β2 is negative (-0.251) and highly significant (t-statistic=-14.94), indicating that
the tax response coefficient is 36.2% (0.251/0.694) lower for chaebol than non-chaebol firms. This
result is consistent with the tax-induced income shifting hypothesis for chaebol firms that they will show lower profitability than non-chaebol firms for a given tax rate.
The estimated coefficient on firm size is negative and significant, suggesting that the larger a
firm is, the lower its profitability. The leverage variable, Leverage, shows a positive relation with
11 The results do not change qualitatively even when IPTAXROA is excluded from the equation.
13
firm profitability – a different result from Joh (2003). Her sample period is before the Asian financial crisis and different from ours which includes much of the post-crisis period. It might be
due to favorable financial leverage effects of debt after the financial crisis, resulting from the
improved disciplinary role of debt that caused a reduction in inefficient investment problems of
highly leveraged firms. Both the advertising expenses and exports show positive coefficient estimates. They are not statistically significant, however. The industry average profitability variable,
IPAXROA, shows a positive coefficient as expected.
Panel B of Table 5 repeats the same regression analyses using the effective tax rate. The
effective tax rate is less meaningful from a decision planning perspective because it represents the average tax costs imposed on the earnings from historical investments (Scholes et al., 2002). We
add the test using the effective tax rate in order to reconcile our results with prior literature that
used the effective tax rate (Collins et al.,1998), and also to compensate for the possible estimation
errors on the marginal tax rate. The effective tax rate is defined as current taxes payable divided by pre-tax income.12 The results are reported in Panel B and qualitatively not much different from
those of the marginal tax rate although adjusted R2 and the significance of the most variables
decreased to some extent. The estimated coefficient on our main variable, the interaction term
between the marginal tax rate and the chaebol dummy (ETR*CH) is still negative and significant. We also used alternative measures of the effective tax rate including the ratios of tax
expenses to operating income or gross margin. The results do not change much and are not reported.
The results based on both the marginal tax rate and the alternative measures of the effective tax rate
consistently support the tax-induced income shifting behavior among chaebol firms.
4.4. Tax income versus financial income
The analyses reported in the previous sections were performed using financial income. To the extent that financial income conforms to the tax income (book-tax conformity), the income shifting
behavior may be analyzed using either financial or tax income. Although firms have incentives to
minimize their book-tax reporting differences because a large discrepancy between the two could
lead to a potential audit, Mills and Newberry (2001) and Phillips et al. (2003) argue that temporary
12 In Korea, before 1998, the tax expense on the income statements is reported based on the current tax payable. After 1998 when the deferred tax was introduced, the tax expense represents the sum of current and deferred taxes, and we calculate the current taxes payable by adjusting the deferred tax and use it as our measure of tax expense. This maintains the consistency with prior 1998 period. The effective tax rates that are negative or greater than one are truncated.
14
book-tax differences arise because Generally Accepted Accounting Principles (GAAP) allow managers’ discretion in determining the amounts of income and expense more than does the tax
system. Examples include choices of accounting for depreciation, investment tax credits, and bad-
debts (Klassen, 1997).
When financial and tax reporting generate differing incentives, managers are able to choose preferential accounting procedures (Watts and Zimmerman, 1986; Mills and Newberry, 2001),
resulting in the discrepancy between the book and the tax income. This suggests that analyses based
on the tax income are necessary as well to examine the income shifting behavior. We repeat the
previous analyses using tax income in place of financial income. We only analyze the listed firms because tax income data is not available for the unlisted firms.13
Table 6 shows that the results do not qualitatively differ from those previously reported using
financial income. The marginal tax rate shows positive and significant coefficient estimates. The
estimated coefficient on the interaction between the marginal tax rate and the chaebol dummy (MTR*CH) is negative (-0.1508) and significant (t-value =-6.15). Other control variables show
patterns similar to those reported in Table 5. These results are expected because book and tax
income are highly correlated. Also, the results could reflect the fact that, as Plesko (2003) argues,
financial reporting of taxes can respond to the tax-motivated behavior even if the financial reporting is weakly associated with tax reports.
4.5. Nontax costs
The analyses performed in the previous sections only consider tax costs in investigating the
income shifting. As previously explained however, with efficient tax planning, firms consider both
tax and nontax costs and arrive at the most appropriate tax planning strategy in which the two types
of costs are balanced. This means that the chaebol firms with high nontax costs will be reluctant to actively engage in income shifting for tax purposes compared with those whose nontax costs are
not significant. This section examines the effects of nontax costs on income shifting decisions and
tests whether the income shifting behavior is more common for the firms with low nontax costs, as
proposed in the hypothesis 2. We use three measures of nontax costs - leverage ratio, the change in income, and cash-flow
rights of the controlling shareholders. Highly leveraged firms are subject to greater monitoring by 13 As reported later in section 5.3, the results using financial income do not differ between listed and unlisted firms. Therefore, we believe that the results using the tax income for listed firms can be generalized for the unlisted firms as well.
15
lenders and have greater incentives to increase their accounting income than those with low leverage ratios (Watts and Zimmerman, 1986). Guenther (1994a) and Maydew (1997) find that, in
intertemporal tax motivated income shifting around the Tax Reform Act of 1986 (TRA 86), firms
with low leverage ratios report lower income than high leveraged firms, suggesting that the
leverage ratio is a proxy for financial reporting costs associated with a possible debt covenant violation.
Second, the change in income, calculated as a change in pre-tax income from the previous
year scaled by the beginning total assets, is another nontax cost. The income shifting decreases the
income and could cause unfavorable stock price effects for the shifting company. Therefore, managers have incentives to maintain a consistent increase in earnings because of the capital
market pressure and/or its effect on their incentive compensation. Numerous studies document such
evidence. For an instance, Burgstahler and Dichev (1997) report that managers are likely to avoid
earnings decreases and losses because doing so increases the costs arising from transactions with stakeholders. Further, Bartov (1993) documents that the timing of asset sales is affected by both
income smoothing and tax incentives, suggesting that the income smoothing (change) is an
important nontax cost to be considered in tax-related business planning.
The third nontax cost we consider is the controlling shareholders’ cash flow rights. Klassen (1997) suggests that ownership concentration measures the degree of market monitoring. Usually,
managers with diffused ownership rely more on the reported financial income and market valuation,
being reluctant to engage in income shifting. On the other hand, the increase in ownership holdings
of the largest shareholder will reduce the incentive to accelerate the reported income numbers. From this perspective, the increase (decrease) in cash flow rights of the controlling shareholders
decreases (increases) a firm’s nontax costs and therefore, increases the incentive for the income
shifting behavior – a positive relationship between their cashflow rights and income shifting
activity.14 Based on these nontax costs, we define two types of dummy variables related to the nontax
costs – NTC1 and NTC2. NTC1 includes the two of the nontax costs explained above – the
leverage, and the income change. NTC2 uses all three nontax cost factors including the cash flow
rights of the controlling shareholders as well. We exclude the cashflow rights in NTC1 because
14 However, we conjecture that the effect of a firm’s ownership type on the income shifting behavior would not be always unambiguous. Under a certain circumstance, the controlling shareholders could be more subject to the market pressure and sensitive to the change in income, avoiding income shifting. This reasoning is in a sense along the line similar to the non-monotonous relationship between the ownership of the controlling shareholders and firm value documented in the literature represented by McConell et al (1990).
16
inclusion of the variable results in a substantial reduction in sample size. The NTC variables are set to be one when the nontax cost is likely to be high (i.e., when a firm’s leverage ratio is above the
median value of sample firms, the change in income is negative, and cash flow rights are below the
median value), and otherwise zero.
The hypothesis 2 proposes that the tax induced income shifting behavior will be the stronger, the lower the nontax costs. That is, we expect that the coefficient on the interaction variable
between the marginal tax rate and the chaebol dummy variable (a measure of the income shifting
behavior for chaebol firms), which has a negative expected sign, will be less negative (i.e., greater)
for the firms with high nontax costs (NTC=1) than those with low nontax cost (NTC=0). Therefore, we expect a positive coefficient on the interaction variable among the marginal tax rate, chaebol
dummy variable and NTC variable (i.e., β4 in Table 7).
The results are reported in Table 7. Panel A reports the results with the two nontax cost
factors (NTC1). The results show patterns similar to those reported in Table 5. The coefficient estimates on the marginal tax rates, MTR, are positive and significant as in Table 5. The interaction
terms between the marginal tax rate and the chaebol dummy variable (MTR*CH) also show
negative and significant coefficients. Further, the interaction variable among the marginal tax rate,
chaebol dummy variable and NTC1 variable (β4) shows a positive and significant coefficient, as expected. This result shows that the nontax costs influence the firms’ tax planning strategies and
that the tax-induced income shifting behavior is more prevalent when nontax costs are low than
when they are high, supporting hypothesis 2. The results using all three nontax cost factors reported
in Panel B show a similar pattern, confirming hypothesis 2 and support the perspective that the increase in cash flow rights of the controlling shareholders lowers the firm’s nontax costs and
therefore, increases the incentive for income shifting
As an additional test for the nontax costs, we examine the relationship between the firms’
loss avoidance incentive and the tax-induced income shifting behavior. Managers have a strong incentive to avoid reporting a loss and manage earnings for such a purpose. Burgstahler and Dichev
(1997) and Phillips et al. (2003) provide evidence of loss avoidance that there is an unusually high
frequency of firm observations in the zero and slightly positive earnings interval compared to the
slightly negative earnings interval. If managers manage earnings to avoid losses, the income shifting behavior found in the previous section could be to avoid losses for financial reporting
purposes rather than tax purposes. Especially, since loss firms usually have a low marginal tax rate
and/or negative income change, our prior results might reflect income shifting to avoid losses rather
than to lower taxes (or both).

17
In order to investigate the loss avoidance motive, we partition the firms into two groups - the firms with positive pretax income and those with negative pretax income and perform separate
regression analyses for each group. The results reported in Table 8 are not in general much different
from those reported in Table 5. The interaction variables between chaebol and the marginal tax rate
are negative and significant for both groups although it is a little more negative for the profit firms. Since the coefficient of the interaction variable with the marginal tax rate is still negative and
significant for the loss firms, we conclude that our income shifting evidence is not mainly driven by
managers’ loss avoidance incentive (although it may be for both loss avoidance and tax incentives).
4.6. Decomposition of earnings
The results so far support the tax-induced income shifting behavior among chaebol firms.
However, we do not provide direct evidence of how the income shifting is implemented. Anecdotal evidence suggests that income shifting is performed through transfer pricing or asset sales to the
affiliated member firms, to name a few. Analysis of these transactions requires proprietary internal
data that is not easily available. In an attempt to shed some lights on this issue, we decompose our
profit measure into two components: operating and nonoperating income (Bertrand, Mehta and Mullainathan, 2002) and examine what kind of income firms use for income shifting.
Table 9 compares the results between the regressions using operating and non-operating
income as dependent variables, respectively. The regression for the operating income shows much
smaller (more negative) coefficient on the MTR*CH variable than that based on nonoperating profits, suggesting that the income shifting behavior by the chaebol firms is mainly due to the
operating rather than non-operating income components. This suggests a possibility that transfer
pricing could be a likely channel for tax motivated income shifting. However, these results are not
consistent with Bertrand, Mehta and Mullainathan (2002) who report that tunneling of earnings among Indian business group firms prevalently occurs on nonoperating rather than operating profits.
Another interpretation for the small estimated coefficient on the marginal tax rate on
nonoperating profits is that, when estimating marginal tax rate, future earnings are simulated based
on the parameters estimated by a series of past earnings, and therefore, the marginal tax rate could be more closely related to an operating income measure which is a more persistent part of income.
V. Additional tests
5.1. The change in statutory tax rate and income shifting

18
Firms will have stronger incentives for tax-motivated income shifting, the higher the
statutory tax rate. Therefore, income shifting behavior to reduce tax liability will change if the
statutory tax rate changes. This section examines the effect of the tax rate changes on the income
shifting behavior by comparing the income shifting for the periods before and after the tax rate changes. During our sample period, the statutory corporate tax rate changed three times. It was
reduced to 30% from 32% effective from 1994, further reduced to 28% from 1995 to 2000, and to
27% effective from 2001. We partition the sample firms into 3 groups according to the tax rate
changes, defining the first sub-period for 1993 and 1994, the second period 1994 through 2000, and the third period 2000 through 2002, respectively. Then we define a dummy variable, TR, which
takes 1 for the post rate change period and 0 otherwise. For instance, for the first sub-period up to
1994, TR takes 1 for 1994 and 0 for 1993, and it is similarly defined for other periods.
We perform separate regression analyses for each sub-period to examine the effect of tax rate changes on income shifting. We expect that the coefficient on the interaction variables between the
chaebol dummies and the marginal tax rates, the measure of income shifting behavior, will become
less negative for the post-period in which the tax rate is reduced, i.e., a positive coefficient on the
MTR*CH*TR variable. The results reported in Panel A of Table 10 show that the coefficients on the MTR*CH*TR
variables are positive but not significant for all periods. The positive sign suggests that the income
shifting behavior of chaebol firms declines for the post period when the statutory tax rate is lowered.
Although the coefficient is insignificant, the positive sign provides an indication that income shifting activities previously reported are likely to be tax-motivated.
5.2. Asian Financial Crisis
The weak corporate governance systems and the lack of accounting transparency, among
others, are cited as main sources of problem for the Asian crisis, and a substantial amount of efforts
has been made to remedy these problems. Especially, chaebol firms became a major target because
of their unique ownership structure in which affiliated firms are connected through an extensive arrangement of pyramidal and reciprocal shareholdings which leads to a large discrepancy between
cash flow rights and control rights. These peculiar governance systems enabled the owner-mangers
of the chaebol firms to enjoy the private benefits of control such as group level decision making
ignoring the minority shareholders, intra-group transactions, and tunneling behavior to their own
19
benefits. These behaviors are now under close monitoring by outsider shareholders. It is plausible that such close monitoring and the trend of weakening chaebol affiliations could discourage the
income shifting behavior after the Asian crisis.
This section compares the tax induced income shifting behavior before and after the Asian
financial crisis. If the income shifting activities decreased after the financial crisis, the interaction term between the marginal tax rate and chaebol dummy (MTR*CH) should become larger (i.e., less
negative) for the post-crisis period. We define the Asian financial crisis period as 1997 to 1998, and
set the POST variable (post-crisis period) to 1 if sample periods are from 1999 to 2002, and
otherwise 0.15 That is, the estimated coefficient on the interaction variable among the marginal tax rate, chaebol, and financial crisis dummy variables (MTR*CH*POST) would be positive.16 The
results reported in Panel B of Table 10 are consistent with our prediction. The interaction term
variable is positive and significant; indicating that, the group-level tax planning through income
shifting among affiliated firms has become less common after the financial crisis.
5.3. Listed versus unlisted firms
Listed firms are in general more subject to public monitoring compared with unlisted firms. Therefore, it is possible that income shifting is more easily performed using unlisted group
firms rather than listed firms. We test this possibility by performing an additional regression
analysis for the listed and unlisted firms separately. If the income shifting is more common for the
unlisted companies, the MTR*CH variable will be more negative for the unlisted firms. The results reported in Table 11 show that the MTR*CH variables are negative and
significant both for listed and unlisted firms. However, they are more negative for listed firms
although the difference is not statistically significant, and does not support our expectation.
VI. Conclusion
Given that Korean chaebol firms are connected under the control of the controlling owners 15 We define the Asian crisis period as 1997 to 1998, following Mitton (2002), and Johnson et al. (2002). The devaluation of Thailand Baht started on July 2, 1997, and the Korean government gave up defending its currency on November 17, 1997. During the period, the Korean stock market continued to drop and started to rebound on September 1998. 16 The results do not change when we compare the pre-crisis period and post-crisis period excluding the observations belonging to the crisis period of 1997 and 1998.
20
of the group, this paper examines whether they take advantage of the differential tax rates among affiliated entities to reduce overall tax costs for the group as a whole. We find evidence that there is
a relatively weak positive relationship between the marginal tax rate and firm profitability for
chaebol firms compared to non-chaebol firms. This evidence is consistent with income shifting
from high-tax to low-tax affiliated firms in business groups, and indicates that chaebol groups benefit from their unique tax-saving opportunities by reducing overall tax expenses. This evidence
is consistent whether we use taxable income or financial income as dependent variables.
We also find evidence that income shifting is less common among the firms with higher
nontax costs than those with low nontax costs. This evidence implies that chaebol firms, adopting an effective tax-planning strategy, trade off tax-saving benefits and potential nontax costs incurred
by the income shifting. Further, we find evidence that income shifting is mainly performed through
operating income rather than non-operating income, suggesting that transfer pricing could be a
prominent channel for income shifting. In addition, we find that the decrease in the statutory corporate tax rate reduces the income
shifting behavior, confirming that our evidence is most likely to be tax-motivated rather than
income management motive. Also, the income shifting activities decreased after the Asian financial
crisis, reflecting that improved corporate governance and accounting transparency of Korean companies after the Asian crisis may have discouraged income shifting activities. We believe that
our results provide some evidence on within-jurisdictional income shifting behavior and raise some
policy implications concerning the protection of minority shareholders of chaebol firms.

21
References
Bae, K., Kang, J., Kim,J., 2002. Tunneling or value added? Evidence from mergers by Korean
business groups. Journal of Finance 57: 2695-2740.
Baek, J., Kang, J., and Park, K., 2004. Corporate governance and firm value: Evidence from the Korean financial crisis. Journal of Financial Economics 71, 265-313.
Bartov, E., 1993. The timing of asset sales and earnings manipulation. Accounting Review 68: 840-
855.
Beatty, A., Harris, D.G., 2001. Intra-group, interstate strategic income management for tax, financial
reporting, and regulatory purposes. Accounting Review 76: 515–536. Bertrand, M., Mehta, P., Mullainathan, S., 2002. Ferreting Out Tunneling: An Application to Indian
Business Groups. Quarterly Journal of Economics 117(1): 121-148.
Burgstahler, D., Dichev, I., 1997. Earnings management to avoid earnings decreases and losses. Journal of Accounting & Economics 24: 99 – 126.
Cheon, K.A., 1997. The effect of firm characteristics on the tax burden, Korean Accounting Review
22: 23-60
Claessens, S., Djankov, S., and Lang, L., 2000. The separation of ownership and control in East Asian corporation. Journal of Financial Economics 58, 81-112.
Collins, J., Shackelford, D. A., 1992. Foreign tax credit limitations and preferred stock issuances.
Journal of Accounting Research 30: 103-124.
Collins, J., Shackelford, D. A., 1997. Global organizations and taxes: An analysis of the dividend, interest, royalty, and management fee payments between U.S. multinationals' foreign
affiliates. Journal of Accounting & Economics 24: 151 -173.
Collins, J., Kemsley, D., Lang, M., 1998. Cross-jurisdictional income shifting and earnings
valuation. Journal of Accounting Research 36: 209–229. DeFond, Mark L, Jiambalvo, James, 1994. Debt covenant violation and manipulation of accruals.
Journal of Accounting & Economics 17: 145-176.
DeFond, Mark L, Park, Chul W., 1997. Smoothing income in anticipation of future earnings.
Journal of Accounting & Economics 23: 115-139.
Graham, J.R., 1996a. Debt and the marginal tax rate. Journal of Financial Economics 41, 41–73. Gramlich J. D., Limpaphayomb, P., Ghon Rhee,S., 2004. Taxes, keiretsu affiliation, and income
shifting. Journal of Accounting and Economics 37: 203–228 Guenther, D. A.,1994. Earnings management in response to corporate tax rate changes: Evidence
22
from the 1986 Tax Reform Act. Accounting Review 69: 230-243. Gupta, S., Newberry, K., 1997. Determinants of the variability in corporate effective tax rates:
evidence from longitudinal data. Journal of Accounting and Public Policy 16, 1–34.
Harris, D.G., 1993. The impact of US tax law revision on multinational corporations’ capital
location and income-shifting decisions. Journal of Accounting Research 31: 111–140. Harris, D., Morck, R., Slemrod, J., Yeung, B., 1993. Income shifting in U. S. multinational
corporations. In: Giovannini, A., Hubbard, R. G., Slemrod, J. (Eds.). Studies in
International Taxation. University of Chicago Press, Chicago.
Healy, P. 1985. The effect of bonus schemes on accounting decisions. Journal of Accounting and Economics 7: 85-107.
Jacob, J., 1996. Taxes and transfer pricing: income shifting and the volume of intrafirm transfers.
Journal of Accounting Research 34: 301–312. Joh, S., 2003. Corporate governance and firm profitability: evidence from Korea before the
economic crisis. Journal of Financial Economics 68: 287-322.
Johnson, V. E., Khurana, I.K., Reynolds, J.K., 2002. Audit-firm tenure and the quality of financial
reports. Contemporary Accounting Research 19: 637-660.
Kern, B.B., Morris, M.H., 1992. Taxes and firm size: the effect of tax legislation during the 1980s.
Journal of the American Taxation Association 14: 80–96. Kim, B., Jung, K., Kim, I., 2005. Internal funds allocation and the ownership structure: Evidence
from Korean business groups. Review of Quantitative Finance and Accounting 25: 33-53.
Klassen, K., Lang, M., Wolfson, M., 1993. Geographic income shifting by multinational corporations in response to tax rate changes. Journal of Accounting Research 31 (Suppl.):
140–173. Klassen, K., 1997. The impact of inside ownership concentration on the trade-off between financial
and tax reporting. Accounting Review 72: 455-474. Klassen, Kenneth J, Shackelford, D. A., 1998. State and provincial corporate tax planning: Income
shifting and sales apportionment factor management. Journal of Accounting & Economics
25: 385-406.
Ko, J., 2000. Income shifting and minimizing tax liabilities through transfer pricing of Korean multinational corporations. Korean Accounting Review 25: 51-77
Ko, J., 2003. Marginal tax rate and debt issuance decision. Korean Accounting Review 28: 49-77
Kook, C., Park, Y., Lee, J., 1997. Investment decision and cost of capital of Korean conglomerates.
The Korean Journal of Finance 13: 101-130.
23
Korea Development Institute, 2003. Development of performance index and measurement for the market reform. Korea Fair Trade Commission Press, Seoul, Korea.
Krull, L.K., 2004. Permanently reinvested foreign earnings, taxes, and earnings management.
Accounting Review 79: 745 – 767.
Lee, K., 2002. Early Evidence on the Economic Consequences of Consolidated Tax Return System. Studies in Management 31: 1211-1228
Maydew, E.L., 1997. Tax-induced earnings management by firms with net operating losses. Journal
of Accounting Research 35: 83-96.
McConell, J., Servaes,H., 1990. Additional evidence on equity ownership and corporate value. Journal of Financial Economic 27, 595-612.
Mills, L., Erickson. M., Maydew, E., 1998. Investments in tax planning. Journal of the American
Taxation Association 20 (Spring): 1-20.
Mills, L., Newberry, K., 2001. The influence of tax and nontax costs on book-tax reporting differences: public and private firms. Journal of the American Taxation Association
(Spring): 1-19.
Mills, L., Newberry, K.J., 2004. Do worldwide tax incentives affect the income reporting and debt
policy of foreign-controlled U.S. corporations? National Tax Journal 57: 89-107. Mitton, T., 2002. A cross-firm analysis of the impact of corporate governance on the East Asian
financial crisis. Journal of Financial Economics 64 : 215-241.
Newberry, K., Dhaliwal, D., 2001. Cross-jurisdictional income shifting by U.S. multinationals:
evidence from international bond offerings. Journal of Accounting Research 39, 629–648. Omer, T.C., Molloy, K.H., Ziebart, D.A., 1993. An investigation of the firm size-effective tax rate
relation in the 1980s. Journal of Accounting, Auditing & Finance 8: 167–182. Petroni, K.R., Shackelford, D. A., 1999. Managing annual accounting reports to avoid state taxes:
An analysis of property-casualty insurers. Accounting Review 74: 371-393. Phillips, J., Pincus, M., Rego, S.O., 2003. Earnings management: New evidence based on deferred
tax expense. Accounting Review 78: 491-521.
Plesko, G. A., 2003. An evaluation of alternative measures of corporate tax rates. Journal of
Accounting and Economics 35: 201–226. Porcano, T.M., 1986. Corporate tax rates: progressive, proportional, or regressive. Journal of the
American Tax Association, Vol.8, No.1:17-31.
Rego, S.O., 2003. Tax avoidance activities of US multinational corporations. Contemporary
Accounting Research 20: 805-833.
24
Siegfried, J.J., 1972. The relationship between economic structure and the effect of political influence: Empirical evidence from the corporation income tax program. PhD. dissertation,
University of Wisconsin, reported in Stickney and McGee (1982).
Shackelford, D., Shevlin, T., 2001. Empirical tax research in accounting. Journal of Accounting and
Economics 31: 321-387. Shin, H., Park, Y., 1999. Financing constraints and internal capital markets: Evidence from Korean
chaebols. Journal of Corporate Finance 5, 169-191.
Scholes, M., Wilson, P., Wolfson, M., 1990. Tax planning, regulatory capital planning and financial
reporting strategy for commercial banks. Review of Financial Studies 3: 625-50. Sholes, M.S., Wilson, G.P., Wolfson, M.A., 1992. Firms' responses to anticipated reductions in tax
rates: The Tax Reforms Act of 1986. Journal of Accounting Research 30 (Supplement):
161-185.
Scholes, M.S., Wolfson, M.A., Erickson, M., Maydew, E.L., Shevlin, T., 2002. Taxes and Business Strategy: a Planning Approach, 2nd Edition. Prentice-Hall, Upper Saddle River, NJ.
Watts, R., Zimmerman, J., 1986. Positive accounting theory. Prentice Hall: Engelwood Cliffs, NJ.
Zimmerman, J., 1983. Taxes and firm size. Journal of Accounting and Economics 5, 119–149
25
Table 1 Samples
Panel A. Sample selection procedure
Sample firms from KIS-FAS database 72,339
Less: Financial firms 2,599
Less: Firms without financial data 9,172
Less: Firms with negative book values 5,085
Less: Firms without marginal tax rate data 6,910
Less: Chaebol groups with less than 3 firms 87
Total samples 48,486
Panel B. The distribution of sample firms by year
Chaebol Non-chaebol
Year Listed Unlisted Listed Unlisted All
1993 105 108 400 2,134 2,747
1994 110 124 411 2,416 3,061
1995 113 130 434 2,482 3,159
1996 125 127 592 2,505 3,349
1997 127 149 650 2,917 3,843
1998 118 157 612 3,931 4,818
1999 123 148 688 4,495 5,454
2000 119 141 863 5,467 6,590
2001 121 162 1,008 5,893 7,184
2002 118 169 1,196 6,798 8,281
Total 1,179 1,415 6,854 39,038 48,486
26
Panel C. The distribution of sample firms by industry
Industry N %
Agriculture, Forestry and Fishing 413 0.9
Computers and Office Machinery 2,085 4.3
Food Products and Beverages 1,900 3.9
Textiles, Except Sewn Wearing apparel 1,891 3.9
Sewn Wearing Apparel and Fur Articles 936 1.9
Tanning and Dressing of Leather , Manufacture of Luggage and Footwear 444 0.9
Wood and of Products of Wood and Cork, Except Furniture 165 0.3
Pulp, Paper and Paper Products 908 1.8
Coke, Refined Petroleum Products and Nuclear Fuel 177 0.3
Chemicals and Chemical Products 4,048 8.3
Rubber and Plastic Products 1,238 2.5
Other Non-metallic Mineral Products 1,764 3.6
Basic Metals 2,051 4.2
Other Machinery and Equipment 1,532 3.1
Other Machinery and Equipment 2,919 6
Electrical Machinery and Apparatuses. 1,593 3.2
Electronic Components, Radio, Television and Communication Equipment and
Apparatuses 3,106 6.4
Medical, Precision and Optical Instruments, Watches & Clocks 703 1.4
Motor Vehicles, Trailers and Semitrailers 2,707 5.5
Electricity, Gas, Steam and Hot Water Supply 317 0.6
Construction 5,129 10.5
Wholesale and Retail Trade 5,094 10.5
Transport 1,739 3.5
Post and Telecommunications 188 0.3
Business Activities 5,439 11.2
Total 48,486 100
Note: N denotes number of observations. The industry classification is based on 3-digit SIC code
from the Korea National Statistical Office.
27
Table 2 Descriptive statistics
All firms Chaebol Non-chaebol Difference t-statistics
(z-statistics)
mean 0.0649 0.0355 0.0665 -0.0310*** -14.46Pre-tax return on assets
median 0.0415 0.0216 0.0428 -0.0212*** -15.77
mean 0.0454 0.0293 0.0499 -0.0206*** -7.41Taxable income
median 0.0347 0.0228 0.0385 -0.0157*** -8.67
mean 0.0461 0.0223 0.0475 -0.0252*** -13.90Net income
median 0.0306 0.0154 0.0317 -0.0163*** -15.99
mean 0.0180 0.0125 0.0184 -0.0059*** -12.99Tax expense
median 0.0092 0.0054 0.0095 -0.0041*** -11.51
mean 0.6372 0.6759 0.6351 0.0408*** 10.48Leverage
median 0.6695 0.7051 0.6673 0.0378*** 9.19
mean 130,942 1,202,551 70,371 1,132,180*** 21.98Total assets (₩mil)
median 19,320 287,880 18,168 269,712*** 64.84
mean 473,843 1,779,140 249,310 1,529,830*** 13.91Firm value (₩mil)
median 79,701 695,059 65,680 629,379*** 42.55
mean 0.0115 0.0078 0.0117 -0.0039*** -8.88R&D expense
median 0.0000 0.0011 0.0000 0.0011*** 15.82
mean 0.2431 0.3404 0.2376 0.1028 1.43Export
median 0.0000 0.0006 0.0000 0.0006*** 40.53
mean 0.0099 0.0098 0.0099 -0.0001 -0.16Advertisement
median 0.0007 0.0018 0.0006 0.0012*** 17.43
mean 25.1 11.8 27.3 -15.5*** -21.36Cashflow right (%)
median 22.8 4.9 25.2 -20.3*** -25.81
mean 0.2100 0.1946 0.2108 -0.0162*** -6.92MTR
median 0.2700 0.27 0.2700 0.0000*** -3.82
mean 0.8283 0.2951 0.8591 -0.5640* -1.65ETR(CFO)
median 0.1106 0.0852 0.1123 -0.0271*** -9.28
mean 0.4105 0.2354 0.4202 -0.1848*** -4.17ETR(OI)
median 0.1848 0.1499 0.1865 -0.0366*** -10.56
28
Note: This table shows mean (median) values of descriptive statistics of selected variables, presented by total
sample, chaebol, and non-chaebol firms, respectively. Taxable income and net income are deflated by total
asset of the beginning of the year, and tax expense, R&D expense, exports, advertising expenses are deflated
by sales. Tax expense denotes tax payments (the tax expense on the income statement before 1998. It is
adjusted by the change of deferred tax liabilities after 1998 when deferred tax was introduced. Leverage is the
ratio of total liabilities to total assets. Total asset reflects effects of inflation by using the Consumer Price
Index (CPI). Firm value is the sum of market value of equity and debt. Cash flow rights represent the
controlling shareholders’ cash flow ownership, including the ownership of their relatives (family members).
MTR is the marginal tax rate, and ETR denotes the effective tax rate. ETR (CFO) is the tax expense deflated
by operating cash flows (the sum of operating income, depreciation expense, change of current assets and
current liabilities) and ETR (OI) is the tax expense deflated by operating income. *, **, and *** indicate two-
tailed significance levels of 0.1, 0.05 and 0.01, respectively, using t-tests for the mean and z-tests for the
median.
29
Table 3 Correlation table
PTAXROA MTR Export Size Adv
0.3866 MTR (0.0000)
0.0047 0.0018 Export (0.3017) (0.6942)
-0.1133 -0.0299 0.0072 Size (0.0000) (0.0000) (0.1118)
0.0546 0.0148 -0.0013 -0.0331 Adv (0.0000) (0.0011) (0.7690) (0.0000)
-0.0559 -0.1544 0.0006 0.0255 0.0174 Leverage (0.0000) (0.0000) (0.9001) (0.0000) (0.0001)
Note: This table reports Pearson correlation coefficients for the variables used in the regression analyses (p-
values in parentheses). PTAXROA is the pretax return on assets (pretax income/total assets) and MTR
denotes the marginal tax rate. Size is the natural logarithm of the total assets, and Leverage is defined as the
ratio of total debt to total assets. Export means exports over sales and Adv is defined as the advertisement
expense to sales.

30
Table 4 Univariate analysis Panel A. Comparison of the marginal tax rates between chaebol firms and non-chaebol firms.
PTAXROA Chaebol Non-chaebol Difference (t-stat)
MTR 0.0929 0.0870 0.0059 (1.52)
N 875 11,344
1st quartile
Max MTR
(Max ratio)
169
(11.5%)
1,404
(5.0%)
MTR 0.2338 0.2267 0.0072 (2.13) **
N 772 11,316
2nd quartile
Max MTR
(Max ratio)
524
(35.8%)
7,140
(25.2%)
MTR 0.2515 0.2570 -0.0055 (-1.73) *
N 557 11,596
3rd quartile
Max MTR
(Max ratio)
438
(29.9%)
9,394
(33.2%)
MTR 0.2638 0.2701 -0.0063 (-2.07) **
N 390 11,636
4th quartile
Max MTR
(Max ratio)
333
(22.7%)
10,357
(36.6%)
MTR 0.1946 0.2108 -0.0162 (-6.92) ***
N 2,594 45,892
Total
Max MTR
(Max ratio)
1,464
(56.4%)
28,295
(61.7%)
Note: PTAXROA is pretax income to total assets and MTR denotes the marginal tax rate. N is the number of
the observations, and Max MTR is the number of the observations whose MTR is the maximum statutory tax
rate each year. Max ratio is the percentage of Max MTR. *, **, and *** indicate two-tailed significance
levels of 0.1, 0.05 and 0.01, respectively.
31
Panel B. Comparison of the profitability between taxation group and no taxation group
PTAXROA Chaebol Non-chaebol Difference (t-statistic)
-0.0897 -0.1490 0.0593 (9.17) *** No taxation group (MTR=0)
N 369 (13.8%) 3,026 (6.6%)
0.0538 0.0818 -0.0279 (-14.19) *** Taxation group (MTR>0)
N 2,312 (86.2%) 42,866 (93.4%)
0.0341 0.0665 -0.0325 (-15.41) *** Total 2,681 (100%) 45,892 (100%)
Note: No taxation group represents the firms whose marginal tax rate is zero, and taxation group denotes
those whose marginal tax rate is greater than zero. N is the number of the observations. *, **, and ***
indicate two-tailed significance levels of 0.1, 0.05 and 0.01, respectively.
32
Panel C. Comparison of the marginal tax rates between chaebol and non-chaebol firms after controlling size effects (Number of firms in parentheses)
PTAXROA Size Chaebol Non-chaebol Difference (t-stat)
1st Quartile Size1 (N) 0.0560 (22) 0.0795 (3,120) -0.0235 (-1.44)
Size2 (N) 0.0769 (37) 0.0861 (2,986) -0.0092 (-0.60)
Size3 (N) 0.0746 (106) 0.0902 (2,985) -0.0156 (-1.60)
Size4 (N) 0.0975 (710) 0.0943 (2,253) 0.0032 (0.68)
2nd Quartile Size1 (N) 0.1970 (24) 0.2135 (3,091) -0.0165 (-0.74)
Size2 (N) 0.2088 (35) 0.2265 (2,960) -0.0177 (-1.00)
Size3 (N) 0.2128 (100) 0.2329 (2,950) -0.0201* (-1.97)
Size4 (N) 0.2401 (613) 0.2366 (2,315) 0.0035 (0.93)
3rd Quartile Size1 (N) 0.2257 (24) 0.2503 (3,103) -0.0246 (-1.28)
Size2 (N) 0.2398 (33) 0.2563 (2,979) -0.0165 (-1.31)
Size3 (N) 0.2502 (84) 0.2595 (2,987) -0.0093 (-1.09)
Size4 (N) 0.2542 (416) 0.2630 (2,527) -0.0088** (-2.37)
4th Quartile Size1 (N) 0.2501 (25) 0.2652 (3,079) -0.0151 (-1.11)
Size2 (N) 0.2665 (54) 0.2700 (2,922) -0.0035 (-0.44)
Size3 (N) 0.2656 (61) 0.2724 (2,975) -0.0068 (-0.95)
Size4 (N) 0.2641 (250) 0.2734 (2,660) -0.0093** (-2.36)
Note: This table compares mean values of the marginal tax rate between chaebol and non-chaebol firms
after partitioning based on their profitability and size. PTAXROA is pretax income to total assets and Size is
the natural logarithm of the total assets. N is the number of the observations. *, **, and *** indicate two-
tailed significance levels of 0.1, 0.05 and 0.01.
33
Table 5 Multivariate regression analyses
Panel A: Regression results using the marginal tax rate.
ti
tititi
tititititititi
DummiesYearDummiesIndustryIPTAXROAExportAdv
LeverageSizeCHCHMTRMTRPTAXROA
,
,8,7,6
,5,4,3,,2,10,
)*(
εβββ
ββββββ
++
++++
+++++=
Variables Coefficient t-statistic
Intercept 0.0727*** (3.60)
MTR 0.6940*** (74.03)
MTR*CH -0.2510*** (-14.94)
CH 0.0647*** (14.68)
Size -0.0130*** (-13.27)
Leverage 0.0194** (2.01)
Adv 0.1268 (0.44)
Export 0.0001 (1.27)
IPTAXROA 1.0542*** (9.98)
N 48,486
F-value for the model 264.99
(p-value) (0.0000)
Adj. R2 0.1805
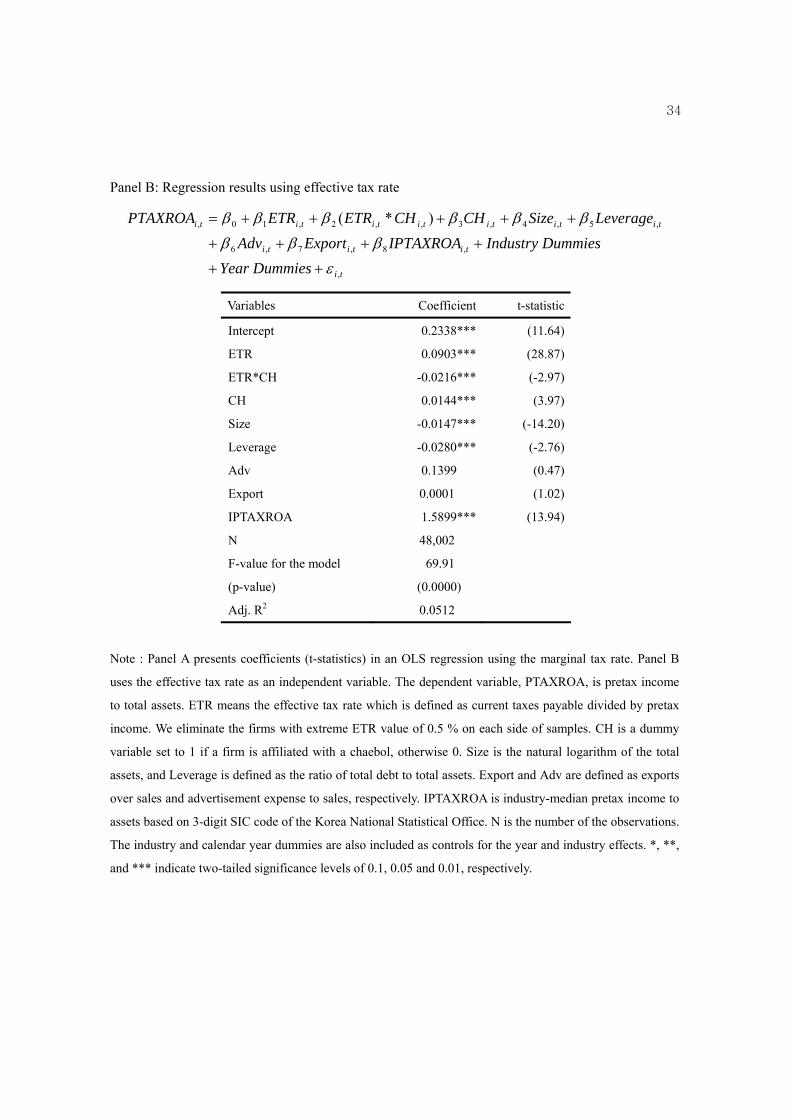
34
Panel B: Regression results using effective tax rate
ti
tititi
tititititititi
DummiesYearDummiesIndustryIPTAXROAExportAdv
LeverageSizeCHCHETRETRPTAXROA
,
,8,7,6
,5,4,3,,2,10,
)*(
εβββ
ββββββ
++
++++
+++++=
Variables Coefficient t-statistic
Intercept 0.2338*** (11.64)
ETR 0.0903*** (28.87)
ETR*CH -0.0216*** (-2.97)
CH 0.0144*** (3.97)
Size -0.0147*** (-14.20)
Leverage -0.0280*** (-2.76)
Adv 0.1399 (0.47)
Export 0.0001 (1.02)
IPTAXROA 1.5899*** (13.94)
N 48,002
F-value for the model 69.91
(p-value) (0.0000)
Adj. R2 0.0512
Note : Panel A presents coefficients (t-statistics) in an OLS regression using the marginal tax rate. Panel B
uses the effective tax rate as an independent variable. The dependent variable, PTAXROA, is pretax income
to total assets. ETR means the effective tax rate which is defined as current taxes payable divided by pretax
income. We eliminate the firms with extreme ETR value of 0.5 % on each side of samples. CH is a dummy
variable set to 1 if a firm is affiliated with a chaebol, otherwise 0. Size is the natural logarithm of the total
assets, and Leverage is defined as the ratio of total debt to total assets. Export and Adv are defined as exports
over sales and advertisement expense to sales, respectively. IPTAXROA is industry-median pretax income to
assets based on 3-digit SIC code of the Korea National Statistical Office. N is the number of the observations.
The industry and calendar year dummies are also included as controls for the year and industry effects. *, **,
and *** indicate two-tailed significance levels of 0.1, 0.05 and 0.01, respectively.
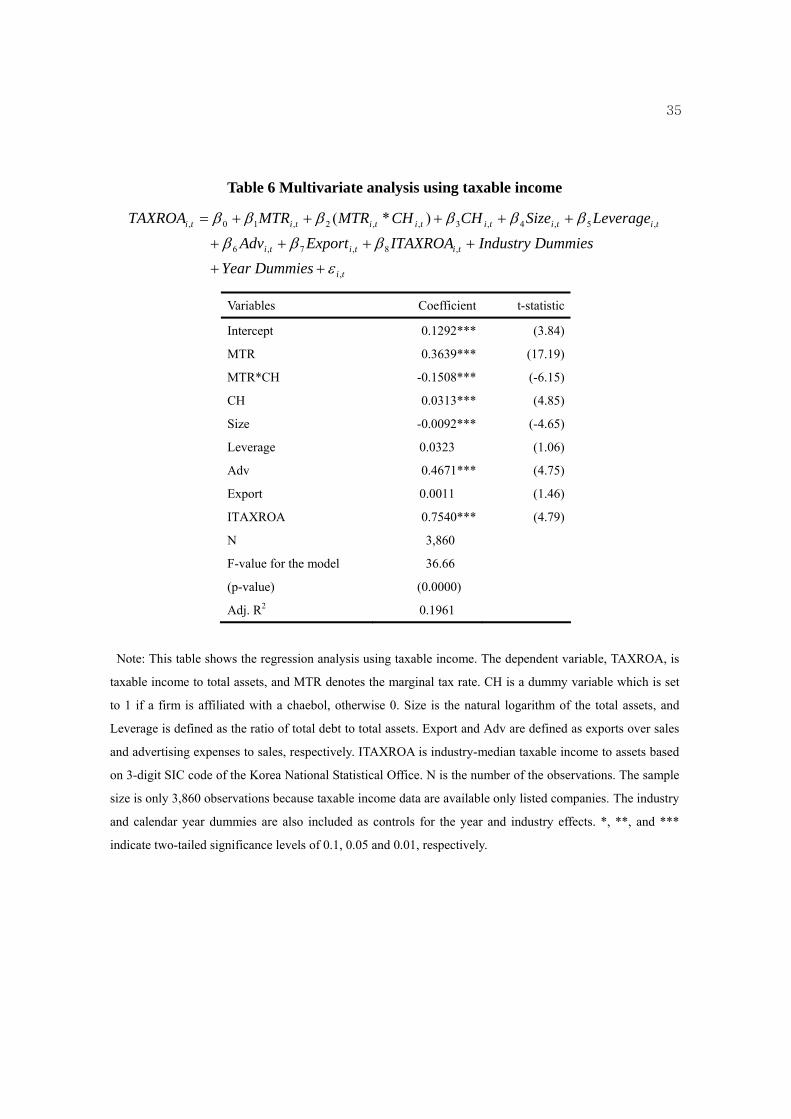
35
Table 6 Multivariate analysis using taxable income
ti
tititi
tititititititi
DummiesYearDummiesIndustryITAXROAExportAdv
LeverageSizeCHCHMTRMTRTAXROA
,
,8,7,6
,5,4,3,,2,10,
)*(
εβββ
ββββββ
++
++++
+++++=
Variables Coefficient t-statistic
Intercept 0.1292*** (3.84)
MTR 0.3639*** (17.19)
MTR*CH -0.1508*** (-6.15)
CH 0.0313*** (4.85)
Size -0.0092*** (-4.65)
Leverage 0.0323 (1.06)
Adv 0.4671*** (4.75)
Export 0.0011 (1.46)
ITAXROA 0.7540*** (4.79)
N 3,860
F-value for the model 36.66
(p-value) (0.0000)
Adj. R2 0.1961
Note: This table shows the regression analysis using taxable income. The dependent variable, TAXROA, is
taxable income to total assets, and MTR denotes the marginal tax rate. CH is a dummy variable which is set
to 1 if a firm is affiliated with a chaebol, otherwise 0. Size is the natural logarithm of the total assets, and
Leverage is defined as the ratio of total debt to total assets. Export and Adv are defined as exports over sales
and advertising expenses to sales, respectively. ITAXROA is industry-median taxable income to assets based
on 3-digit SIC code of the Korea National Statistical Office. N is the number of the observations. The sample
size is only 3,860 observations because taxable income data are available only listed companies. The industry
and calendar year dummies are also included as controls for the year and industry effects. *, **, and ***
indicate two-tailed significance levels of 0.1, 0.05 and 0.01, respectively.
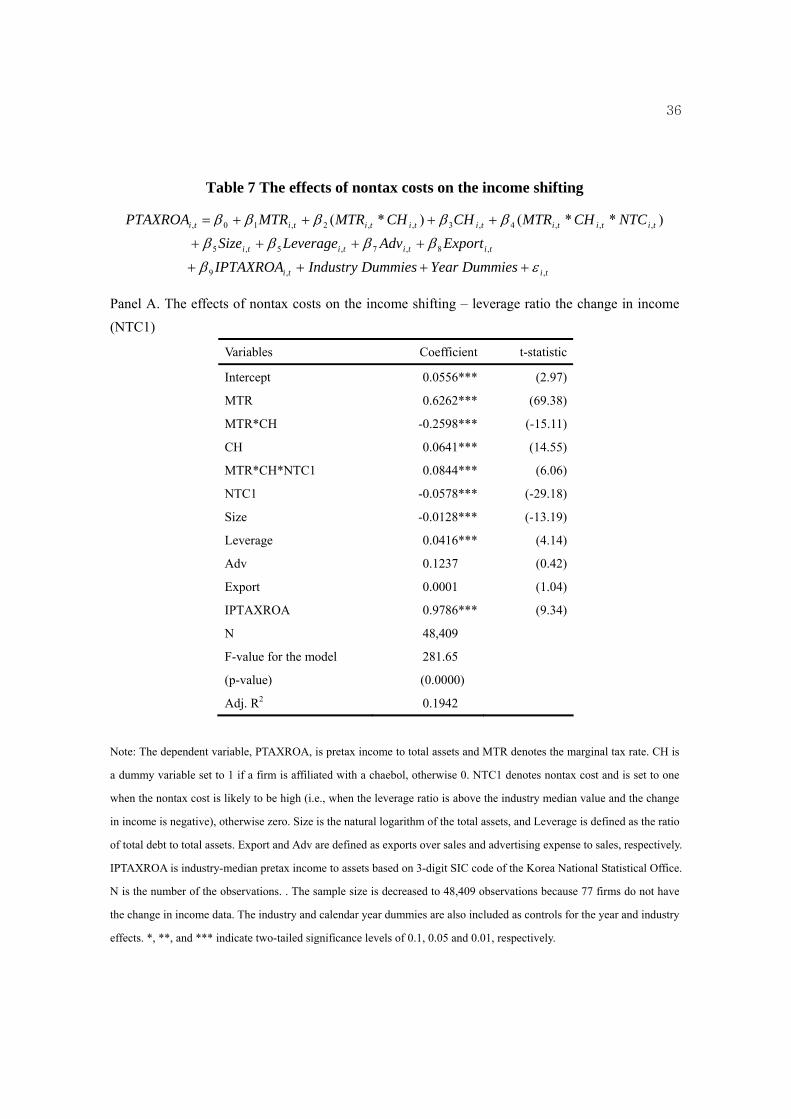
36
Table 7 The effects of nontax costs on the income shifting
titi
titititi
titititititititi
DummiesYearDummiesIndustryIPTAXROAExportAdvLeverageSize
NTCCHMTRCHCHMTRMTRPTAXROA
,,9
,8,7,5,5
,,,4,3,,2,10,
)**( )*(
εβββββ
βββββ
++++
++++
++++=
Panel A. The effects of nontax costs on the income shifting – leverage ratio the change in income
(NTC1)
Variables Coefficient t-statistic
Intercept 0.0556*** (2.97)
MTR 0.6262*** (69.38)
MTR*CH -0.2598*** (-15.11)
CH 0.0641*** (14.55)
MTR*CH*NTC1 0.0844*** (6.06)
NTC1 -0.0578*** (-29.18)
Size -0.0128*** (-13.19)
Leverage 0.0416*** (4.14)
Adv 0.1237 (0.42)
Export 0.0001 (1.04)
IPTAXROA 0.9786*** (9.34)
N 48,409
F-value for the model 281.65
(p-value) (0.0000)
Adj. R2 0.1942
Note: The dependent variable, PTAXROA, is pretax income to total assets and MTR denotes the marginal tax rate. CH is
a dummy variable set to 1 if a firm is affiliated with a chaebol, otherwise 0. NTC1 denotes nontax cost and is set to one
when the nontax cost is likely to be high (i.e., when the leverage ratio is above the industry median value and the change
in income is negative), otherwise zero. Size is the natural logarithm of the total assets, and Leverage is defined as the ratio
of total debt to total assets. Export and Adv are defined as exports over sales and advertising expense to sales, respectively.
IPTAXROA is industry-median pretax income to assets based on 3-digit SIC code of the Korea National Statistical Office.
N is the number of the observations. . The sample size is decreased to 48,409 observations because 77 firms do not have
the change in income data. The industry and calendar year dummies are also included as controls for the year and industry
effects. *, **, and *** indicate two-tailed significance levels of 0.1, 0.05 and 0.01, respectively.

37
Panel B. The effects of nontax costs on the income shifting - leverage ratio, the change in income, and cash-flow rights of the controlling shareholders (NTC2)
Variables Coefficient t-statistic
Intercept 0.1666*** (4.32)
MTR 0.7135*** (28.24)
MTR*CH -0.4396*** (-11.22)
CH 0.1024*** (11.21)
MTR*CH*NTC2 0.1294*** (4.25)
NTC2 -0.0619*** (-14.10)
Size -0.0224*** (-10.77)
Leverage 0.1774*** (7.03)
Adv 1.1720 (1.39)
Export 0.0055** (2.42)
IPTAXROA 1.1264*** (6.42)
N 7,110
F-value for the model 54.90
(p-value) (0.0000)
Adj. R2 0.3344
Note: The dependent variable, PTAXROA, is pretax income to total assets and MTR denotes the marginal
tax rate. CH is a dummy variable set to 1 if a firm is affiliated with a chaebol, otherwise 0. NTC2 is set to one
when the nontax cost is likely to be high (i.e., when the leverage ratio is above the industry median value, the
change in income is negative, and cash flow rights are below the median value of sample firms), otherwise
zero. Size is the natural logarithm of the total assets, and Leverage is defined as the ratio of total debt to total
assets. Export and Adv are defined as exports over sales and advertisement expense to sales, respectively.
IPTAXROA is industry-median pretax income to assets based on 3-digit SIC code of the Korea National
Statistical Office. N is the number of the observations. The sample size is 7,110 observations because only
7,110 firms have the cash flow right data. The industry and calendar year dummies are also included as
controls for the year and industry effects. *, **, and *** indicate two-tailed significance levels of 0.1, 0.05
and 0.01, respectively.

38
Table 8 Multivariate for the profit and loss firms
ti
tititi
tititititititi
DummiesYearDummiesIndustryIPTAXROAExportAdv
LeverageSizeCHCHMTRMTRPTAXROA
,
,8,7,6
,5,4,3,,2,10,
)*(
εβββ
ββββββ
++
++++
+++++=
Profit firms Loss firms Variables
Coefficient t-value Coefficient t-value
Intercept 0.2109*** (10.91) - 0.3392*** (-7.18)
MTR 0.3708*** (34.08) 0.9932*** (31.63)
MTR*CH - 0.2089*** (-10.16) - 0.1992** (-2.55)
CH 0.0661*** (11.60) - 0.0165** (-2.28)
Size - 0.0173*** (-17.57) 0.0154*** (5.87)
Leverage - 0.0053 (-0.50) 0.0246 (1.16)
Adv 0.7133*** (4.41) - 0.8673*** (-14.98)
Export 0.0001 (1.19) 0.0001 (1.24)
IPTAXROA 0.8302*** (7.15) 0.5098*** (2.76)
N 40,545 7,941
F-statistic for the model 89.22 42.38
(p-value) (0.0000) (0.0000)
Adj. R2 0.1243 0.3252
Note : This table shows OLS regression for the profit and loss firms, separately. The dependent variable,
PTAXROA, is pretax income to total assets and MTR denotes the marginal tax rate. CH is a dummy variable
which is set to 1 if a firm is affiliated with a chaebol, otherwise 0. Size is the natural logarithm of the total
assets, and Leverage is defined as the ratio of total debt to total assets. Export and Adv are defined as exports
over sales and advertising expense to sales, respectively. IPTAXROA is industry-median pretax income to
assets based on 3-digit SIC code of the Korea National Statistical Office. N is the number of the observations.
The industry and calendar year dummies are also included as controls for the year and industry effects. *, **,
and *** indicate two-tailed significance levels of 0.1, 0.05 and 0.01, respectively.
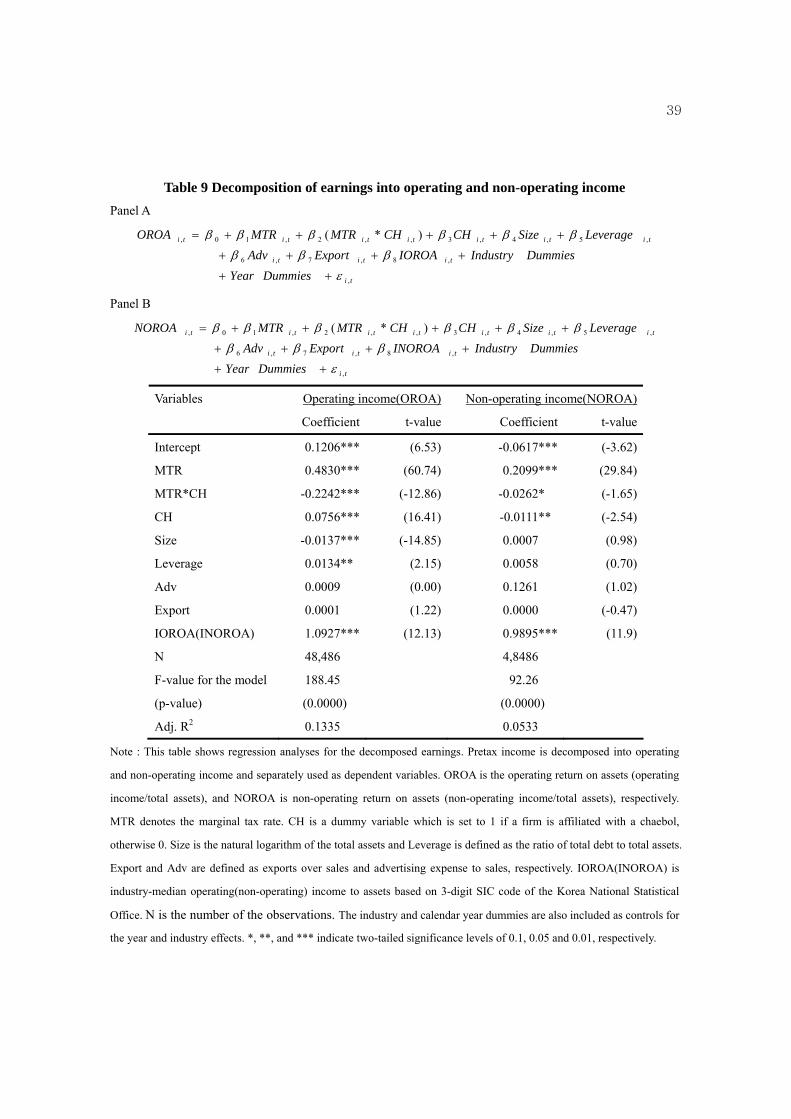
39
Table 9 Decomposition of earnings into operating and non-operating income Panel A
ti
tititi
tititititititi
DummiesYearDummiesIndustryIOROAExportAdv
LeverageSizeCHCHMTRMTROROA
,
,8,7,6
,5,4,3,,2,10,
)*(
εβββ
ββββββ
++
++++
+++++=
Panel B
ti
tititi
tititititititi
DummiesYearDummiesIndustryINOROAExportAdv
LeverageSizeCHCHMTRMTRNOROA
,
,8,7,6
,5,4,3,,2,10,
)*(
εβββ
ββββββ
++
++++
+++++=
Operating income(OROA) Non-operating income(NOROA) Variables
Coefficient t-value Coefficient t-value
Intercept 0.1206*** (6.53) -0.0617*** (-3.62)
MTR 0.4830*** (60.74) 0.2099*** (29.84)
MTR*CH -0.2242*** (-12.86) -0.0262* (-1.65)
CH 0.0756*** (16.41) -0.0111** (-2.54)
Size -0.0137*** (-14.85) 0.0007 (0.98)
Leverage 0.0134** (2.15) 0.0058 (0.70)
Adv 0.0009 (0.00) 0.1261 (1.02)
Export 0.0001 (1.22) 0.0000 (-0.47)
IOROA(INOROA) 1.0927*** (12.13) 0.9895*** (11.9)
N 48,486 4,8486
F-value for the model 188.45 92.26
(p-value) (0.0000) (0.0000)
Adj. R2 0.1335 0.0533
Note : This table shows regression analyses for the decomposed earnings. Pretax income is decomposed into operating
and non-operating income and separately used as dependent variables. OROA is the operating return on assets (operating
income/total assets), and NOROA is non-operating return on assets (non-operating income/total assets), respectively.
MTR denotes the marginal tax rate. CH is a dummy variable which is set to 1 if a firm is affiliated with a chaebol,
otherwise 0. Size is the natural logarithm of the total assets and Leverage is defined as the ratio of total debt to total assets.
Export and Adv are defined as exports over sales and advertising expense to sales, respectively. IOROA(INOROA) is
industry-median operating(non-operating) income to assets based on 3-digit SIC code of the Korea National Statistical
Office. N is the number of the observations. The industry and calendar year dummies are also included as controls for
the year and industry effects. *, **, and *** indicate two-tailed significance levels of 0.1, 0.05 and 0.01, respectively.
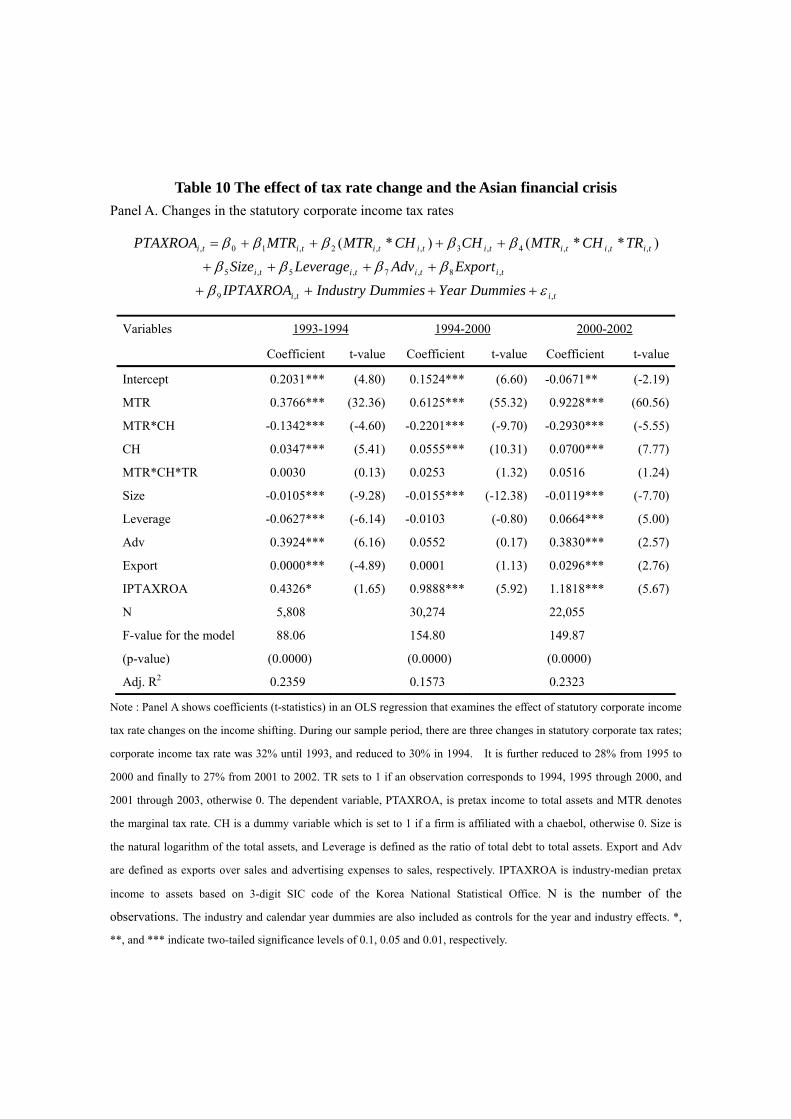
Table 10 The effect of tax rate change and the Asian financial crisis Panel A. Changes in the statutory corporate income tax rates
titi
titititi
titititititititi
DummiesYearDummiesIndustryIPTAXROAExportAdvLeverageSize
TRCHMTRCHCHMTRMTRPTAXROA
,,9
,8,7,5,5
,,,4,3,,2,10,
)**()*(
εβββββ
βββββ
++++
++++
++++=
1993-1994 1994-2000 2000-2002 Variables
Coefficient t-value Coefficient t-value Coefficient t-value
Intercept 0.2031*** (4.80) 0.1524*** (6.60) -0.0671** (-2.19)
MTR 0.3766*** (32.36) 0.6125*** (55.32) 0.9228*** (60.56)
MTR*CH -0.1342*** (-4.60) -0.2201*** (-9.70) -0.2930*** (-5.55)
CH 0.0347*** (5.41) 0.0555*** (10.31) 0.0700*** (7.77)
MTR*CH*TR 0.0030 (0.13) 0.0253 (1.32) 0.0516 (1.24)
Size -0.0105*** (-9.28) -0.0155*** (-12.38) -0.0119*** (-7.70)
Leverage -0.0627*** (-6.14) -0.0103 (-0.80) 0.0664*** (5.00)
Adv 0.3924*** (6.16) 0.0552 (0.17) 0.3830*** (2.57)
Export 0.0000*** (-4.89) 0.0001 (1.13) 0.0296*** (2.76)
IPTAXROA 0.4326* (1.65) 0.9888*** (5.92) 1.1818*** (5.67)
N 5,808 30,274 22,055
F-value for the model 88.06 154.80 149.87
(p-value) (0.0000) (0.0000) (0.0000)
Adj. R2 0.2359 0.1573 0.2323
Note : Panel A shows coefficients (t-statistics) in an OLS regression that examines the effect of statutory corporate income
tax rate changes on the income shifting. During our sample period, there are three changes in statutory corporate tax rates;
corporate income tax rate was 32% until 1993, and reduced to 30% in 1994. It is further reduced to 28% from 1995 to
2000 and finally to 27% from 2001 to 2002. TR sets to 1 if an observation corresponds to 1994, 1995 through 2000, and
2001 through 2003, otherwise 0. The dependent variable, PTAXROA, is pretax income to total assets and MTR denotes
the marginal tax rate. CH is a dummy variable which is set to 1 if a firm is affiliated with a chaebol, otherwise 0. Size is
the natural logarithm of the total assets, and Leverage is defined as the ratio of total debt to total assets. Export and Adv
are defined as exports over sales and advertising expenses to sales, respectively. IPTAXROA is industry-median pretax
income to assets based on 3-digit SIC code of the Korea National Statistical Office. N is the number of the
observations. The industry and calendar year dummies are also included as controls for the year and industry effects. *,
**, and *** indicate two-tailed significance levels of 0.1, 0.05 and 0.01, respectively.
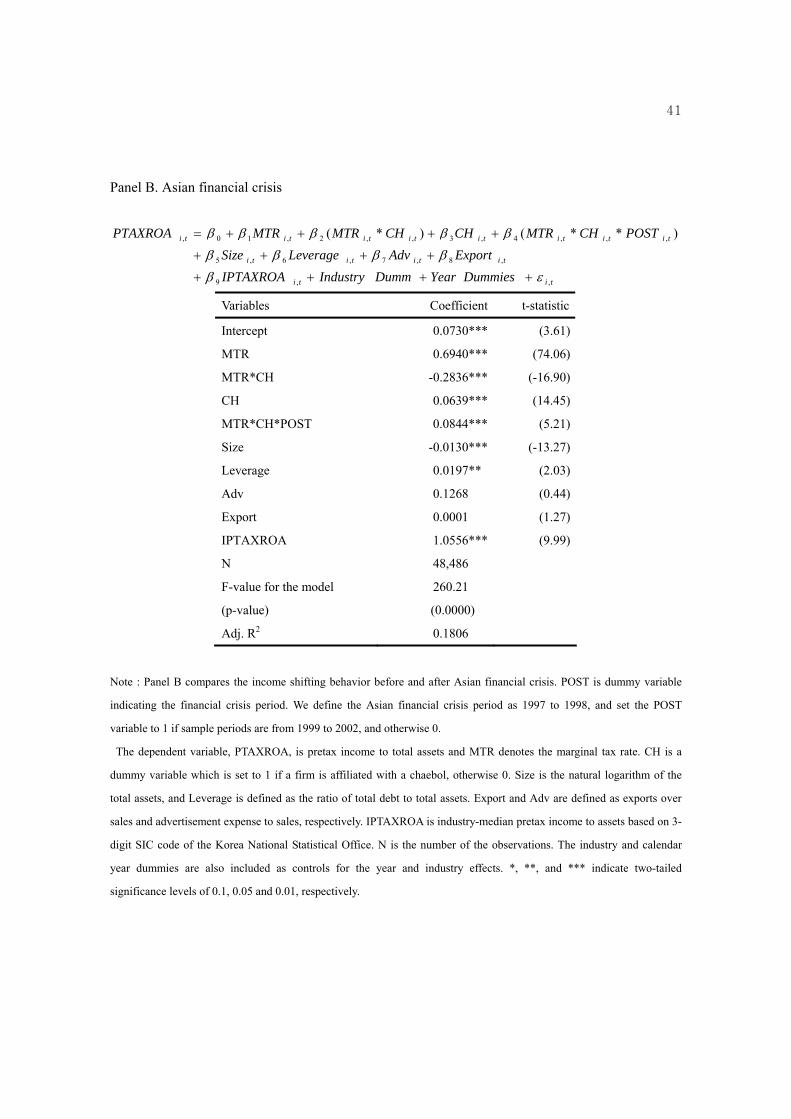
41
Panel B. Asian financial crisis
titi
titititi
titititititititi
DummiesYearDummIndustryIPTAXROAExportAdvLeverageSize
POSTCHMTRCHCHMTRMTRPTAXROA
,,9
,8,7,6,5
,,,4,3,,2,10,
)**()*(
εβββββ
βββββ
++++
++++
++++=
Variables Coefficient t-statistic
Intercept 0.0730*** (3.61)
MTR 0.6940*** (74.06)
MTR*CH -0.2836*** (-16.90)
CH 0.0639*** (14.45)
MTR*CH*POST 0.0844*** (5.21)
Size -0.0130*** (-13.27)
Leverage 0.0197** (2.03)
Adv 0.1268 (0.44)
Export 0.0001 (1.27)
IPTAXROA 1.0556*** (9.99)
N 48,486
F-value for the model 260.21
(p-value) (0.0000)
Adj. R2 0.1806
Note : Panel B compares the income shifting behavior before and after Asian financial crisis. POST is dummy variable
indicating the financial crisis period. We define the Asian financial crisis period as 1997 to 1998, and set the POST
variable to 1 if sample periods are from 1999 to 2002, and otherwise 0.
The dependent variable, PTAXROA, is pretax income to total assets and MTR denotes the marginal tax rate. CH is a
dummy variable which is set to 1 if a firm is affiliated with a chaebol, otherwise 0. Size is the natural logarithm of the
total assets, and Leverage is defined as the ratio of total debt to total assets. Export and Adv are defined as exports over
sales and advertisement expense to sales, respectively. IPTAXROA is industry-median pretax income to assets based on 3-
digit SIC code of the Korea National Statistical Office. N is the number of the observations. The industry and calendar
year dummies are also included as controls for the year and industry effects. *, **, and *** indicate two-tailed
significance levels of 0.1, 0.05 and 0.01, respectively.
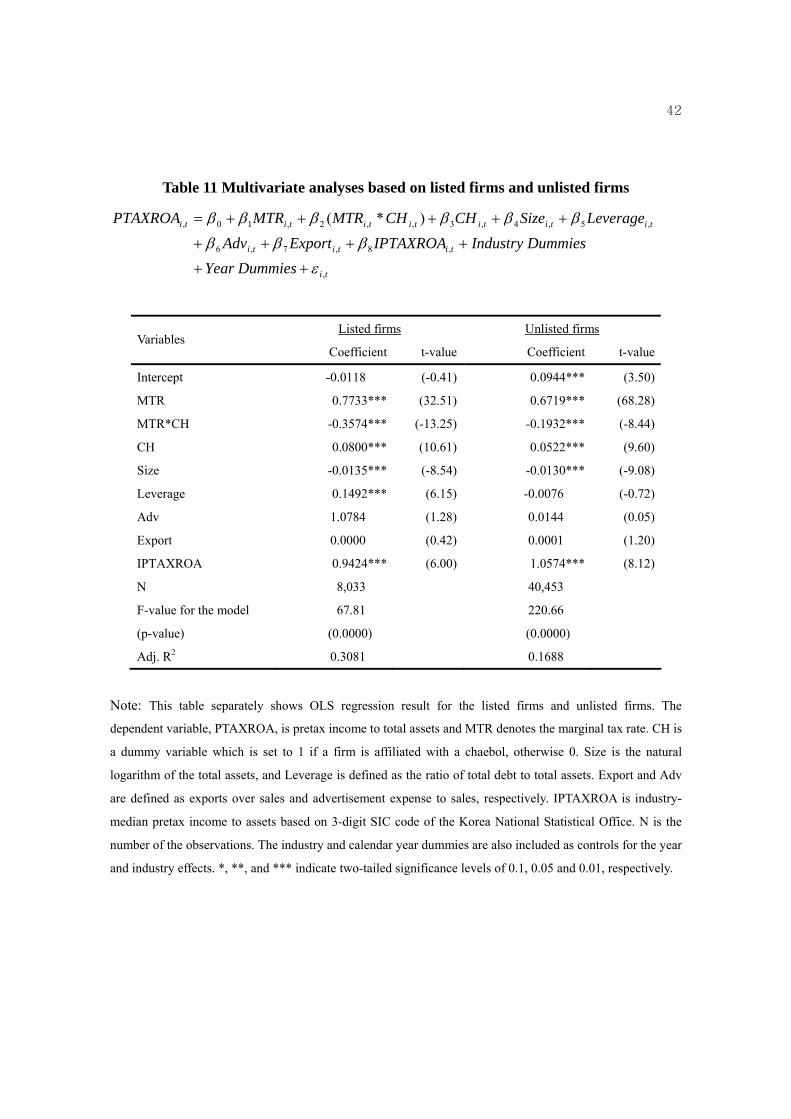
42
Table 11 Multivariate analyses based on listed firms and unlisted firms
ti
tititi
tititititititi
DummiesYearDummiesIndustryIPTAXROAExportAdv
LeverageSizeCHCHMTRMTRPTAXROA
,
,8,7,6
,5,4,3,,2,10,
)*(
εβββ
ββββββ
++
++++
+++++=
Listed firms Unlisted firms Variables
Coefficient t-value Coefficient t-value
Intercept -0.0118 (-0.41) 0.0944*** (3.50)
MTR 0.7733*** (32.51) 0.6719*** (68.28)
MTR*CH -0.3574*** (-13.25) -0.1932*** (-8.44)
CH 0.0800*** (10.61) 0.0522*** (9.60)
Size -0.0135*** (-8.54) -0.0130*** (-9.08)
Leverage 0.1492*** (6.15) -0.0076 (-0.72)
Adv 1.0784 (1.28) 0.0144 (0.05)
Export 0.0000 (0.42) 0.0001 (1.20)
IPTAXROA 0.9424*** (6.00) 1.0574*** (8.12)
N 8,033 40,453
F-value for the model 67.81 220.66
(p-value) (0.0000) (0.0000)
Adj. R2 0.3081 0.1688
Note: This table separately shows OLS regression result for the listed firms and unlisted firms. The
dependent variable, PTAXROA, is pretax income to total assets and MTR denotes the marginal tax rate. CH is
a dummy variable which is set to 1 if a firm is affiliated with a chaebol, otherwise 0. Size is the natural
logarithm of the total assets, and Leverage is defined as the ratio of total debt to total assets. Export and Adv
are defined as exports over sales and advertisement expense to sales, respectively. IPTAXROA is industry-
median pretax income to assets based on 3-digit SIC code of the Korea National Statistical Office. N is the
number of the observations. The industry and calendar year dummies are also included as controls for the year
and industry effects. *, **, and *** indicate two-tailed significance levels of 0.1, 0.05 and 0.01, respectively.