Tax Increment Financing (TIF) Funding and Affordable … · Tax Increment Financing (TIF) Funding...
18
Tax Increment Financing (TIF) Funding and Affordable Housing An analysis of current TIF resources and City of Chicago TIF-funded Housing 1995-2008 June, 2009
-
Upload
trinhquynh -
Category
Documents
-
view
217 -
download
0
Transcript of Tax Increment Financing (TIF) Funding and Affordable … · Tax Increment Financing (TIF) Funding...
Tax Increment Financing (TIF) Funding and Affordable Housing
An analysis of current TIF resources and City of Chicago TIF-funded Housing 1995-2008
June, 2009
Sweet Home Chicago Coalition
Action NOWAlbany Park Neighborhood CouncilBickerdike Redevelopment CorporationChicago Coalition for the HomelessJane Addams Senior CaucusKenwood Oakland Community OrganizationLakeview Action CoalitionLogan Square Neighborhood AssociationOrganization of the NortheastSEIU-Healthcare Illinois/IndianaSEIU Local 1United Food and Commercial Workers Local 881
Report Prepared by Chicago Coalition for the Homeless on behalf of the Sweet Home Chicago CoalitionReport Author: Julie Dworkin, Director of Policy, Chicago Coalition for the HomelessResearchers: Stephanie Procyk and Jim Picchetti
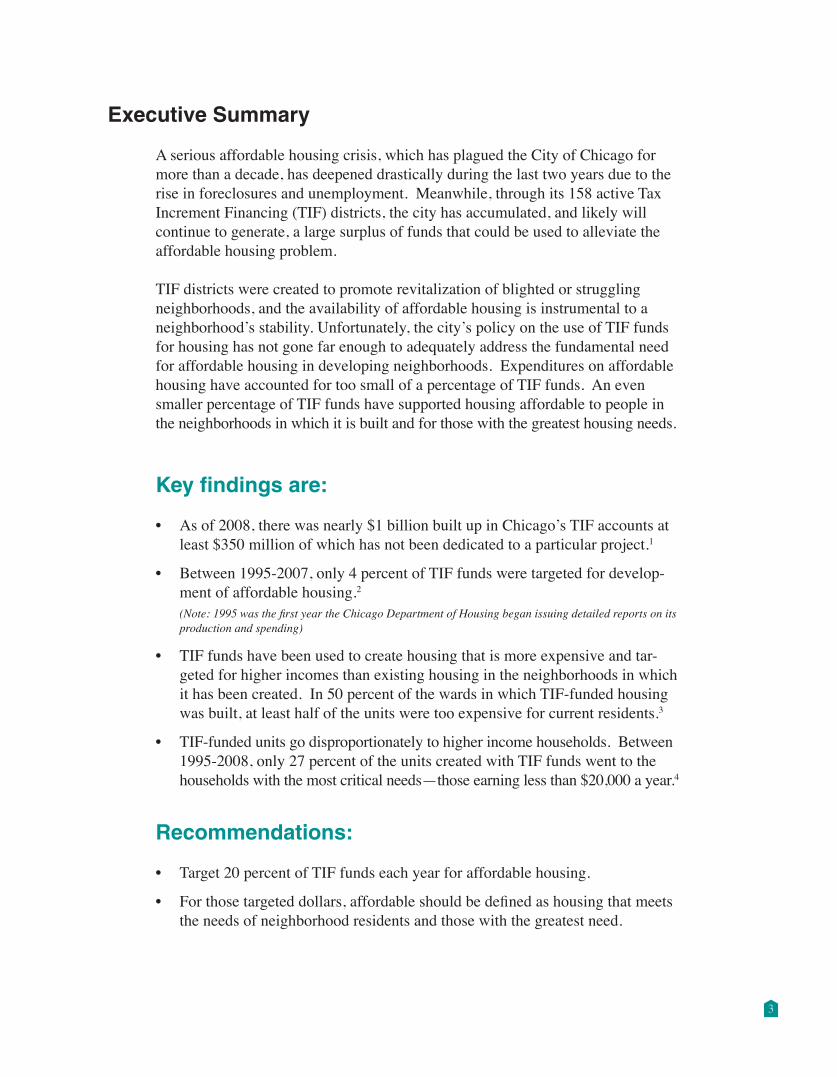
Executive Summary
A serious affordable housing crisis, which has plagued the City of Chicago for more than a decade, has deepened drastically during the last two years due to the rise in foreclosures and unemployment. Meanwhile, through its 158 active Tax Increment Financing (TIF) districts, the city has accumulated, and likely will continue to generate, a large surplus of funds that could be used to alleviate the affordable housing problem.
TIF districts were created to promote revitalization of blighted or struggling neighborhoods, and the availability of affordable housing is instrumental to a neighborhood’s stability. Unfortunately, the city’s policy on the use of TIF funds for housing has not gone far enough to adequately address the fundamental need for affordable housing in developing neighborhoods. Expenditures on affordable housing have accounted for too small of a percentage of TIF funds. An even smaller percentage of TIF funds have supported housing affordable to people in the neighborhoods in which it is built and for those with the greatest housing needs.
Key findings are:
As of 2008, there was nearly $1 billion built up in Chicago’s TIF accounts at •least $350 million of which has not been dedicated to a particular project.1
Between 1995-2007, only 4 percent of TIF funds were targeted for develop-•ment of affordable housing.2 (Note: 1995 was the first year the Chicago Department of Housing began issuing detailed reports on its production and spending)
TIF funds have been used to create housing that is more expensive and tar-•geted for higher incomes than existing housing in the neighborhoods in which it has been created. In 50 percent of the wards in which TIF-funded housing was built, at least half of the units were too expensive for current residents.3
TIF-funded units go disproportionately to higher income households. Between •1995-2008, only 27 percent of the units created with TIF funds went to the households with the most critical needs—those earning less than $20,000 a year.4
Recommendations:
Target 20 percent of TIF funds each year for affordable housing. •
Forthosetargeteddollars,affordableshouldbedefinedashousingthatmeets•the needs of neighborhood residents and those with the greatest need.
3
Chicago’s Housing Crisis Chicago is experiencing a housing crisis, but this is not a new problem. Certainly the foreclosure crisis is in the forefront of everyone’s mind when they think about housing needs in Chicago. In 2008, 20,592 foreclosureswerefiledinChicago,a48percentincreasefrom2007.Ofthose,6,589weretwo-sixunitbuildings--meaning up to 39,000 renters potentially faced eviction due to foreclosure.5 Foreclosures have exacerbated the housing crisis by increasing demand and decreasing the supply of affordable housing. But even before this spike in foreclosures, Chicago’s housing needs were great:
In Chicago in 2007, 50% of renters and 43% of homeowners paid more than 30% of •their income for housing.6 This is considered unaffordable and puts people at risk of homelessness or foreclosure.
In 2007, 42,281 households were on the public housing waiting list in Chicago.• 7
In 2008, when CHA opened the waiting list for Section 8 vouchers more than 200,000 •people vied for 40,000 slots on the waiting list.8
By 2011, approximately 17,000 units of federally subsidized housing in Chicago •could be lost due to expiring subsidies.9
The Chicago Housing Authority’s Plan for Transformation will result in a net loss of •13,000 public housing units in Chicago.10
Inthe2008-2009schoolyear,arecord12,525studentswereidentifiedashomelessin•the Chicago Public Schools. This number represents an 18% increase over the number identifiedthepreviousschoolyear.11
Tax Increment Financing: A city resource to address housing needs
Tax Increment Financing (TIF) is a tool the city uses to spur economic development in a specificgeographicareathatisconsidered“blighted.”TheareaisdesignatedaTIFdistrictand then when development takes place and property taxes rise, any increase in property tax revenues go into a fund that must be spent on redevelopment projects in the TIF.
State law dictates what TIF funding can be spent on. Allowable uses include: public improvements such as streets, streetscaping and sewers; redevelopment costs such as acquiringandrehabbingpropertiesordemolitionofexistingproperties;financingandadministrative costs associated with development. Construction of affordable housing is specificallyspelledoutinstatelawasanallowableuse.Infact,upto50percentofthecostof construction for a particular affordable housing project can be paid for out of TIF funds.
4
TIFs in Chicago
The city of Chicago has used TIFs widely in its efforts to redevelop neighborhoods in Chicago. There are now 158 TIF districts in Chicago covering 30 percent of the land in the city. The TIFs in Chicago are collectively generating a large amount of money. In 2007 they generated $555 million.12 Each year more money is generated than is spent on projects so the TIF accounts continue to grow over time.
Amount of available TIF funds
An analysis of the 2007 audits of all TIF accounts found that at the end of 2007 there was nearly $1 billion in the TIF accounts available for redevelopment projects including affordable housing. The audits showed that 57 TIFs (35 percent) had fund balances in excess of $5 million and 27 had fund balances in excess of $10 million (seeappendicesforspecificTIFbalancesandlocationoflargerbalances).13 A more recent document released by the Chicago Department of Community Development says that unaudited 2008 balances still total $1 billion. The same document also says thatthecityplanstospend$478-$643millionofthatbalancein2009,14 leaving at least $350 million in the accounts plus whatever is collected in 2009.
There are clearly available funds that could be dedicated for affordable housing, and now seems to be a critical time to use them. Needs are higher due to the recession, and other resources for affordable housing are declining. The Illinois Affordable Housing Trust Fund, the state’s primary source of capital funds for housing development is funded through the state’s Real Estate Transfer Tax. The transfer tax has seen a severe loss of revenue due to the collapse of the real estate market.Atitspeakin2006,theTrustFundsaw$71millioninrevenue.In2009,it is expected to receive just $42 million, a 42% decrease. The low-income housing tax credit, the primary federal source of funding for affordable housing is expected in 2009 to generate only 30% of the capital it has in recent years.
5
City of Chicago’s use of TIF funds for affordable housing
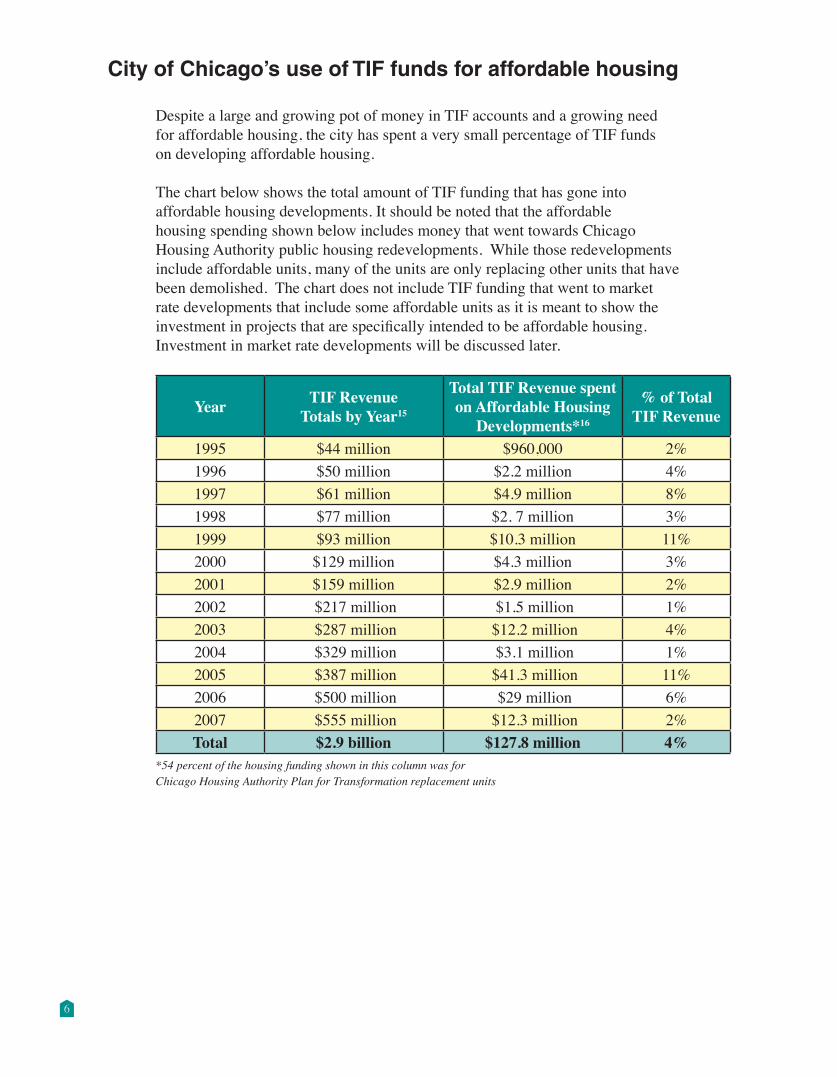
Despite a large and growing pot of money in TIF accounts and a growing need for affordable housing, the city has spent a very small percentage of TIF funds on developing affordable housing.
The chart below shows the total amount of TIF funding that has gone into affordable housing developments. It should be noted that the affordable housing spending shown below includes money that went towards Chicago Housing Authority public housing redevelopments. While those redevelopments include affordable units, many of the units are only replacing other units that have been demolished. The chart does not include TIF funding that went to market rate developments that include some affordable units as it is meant to show the investmentinprojectsthatarespecificallyintendedtobeaffordablehousing. Investment in market rate developments will be discussed later.
Year TIF Revenue Totals by Year15
Total TIF Revenue spent on Affordable Housing
Developments*16
% of Total TIF Revenue
1995 $44 million $960,000 2%1996 $50 million $2.2 million 4%1997 $61million $4.9 million 8%1998 $77 million $2. 7 million 3%1999 $93 million $10.3 million 11%2000 $129 million $4.3 million 3%2001 $159 million $2.9 million 2%2002 $217 million $1.5 million 1%2003 $287 million $12.2 million 4%2004 $329 million $3.1 million 1%2005 $387 million $41.3 million 11%2006 $500 million $29 million 6%2007 $555 million $12.3 million 2%Total $2.9 billion $127.8 million 4%
*54 percent of the housing funding shown in this column was for Chicago Housing Authority Plan for Transformation replacement units
6
Housing created with TIF funds too expensive for Chicago residents
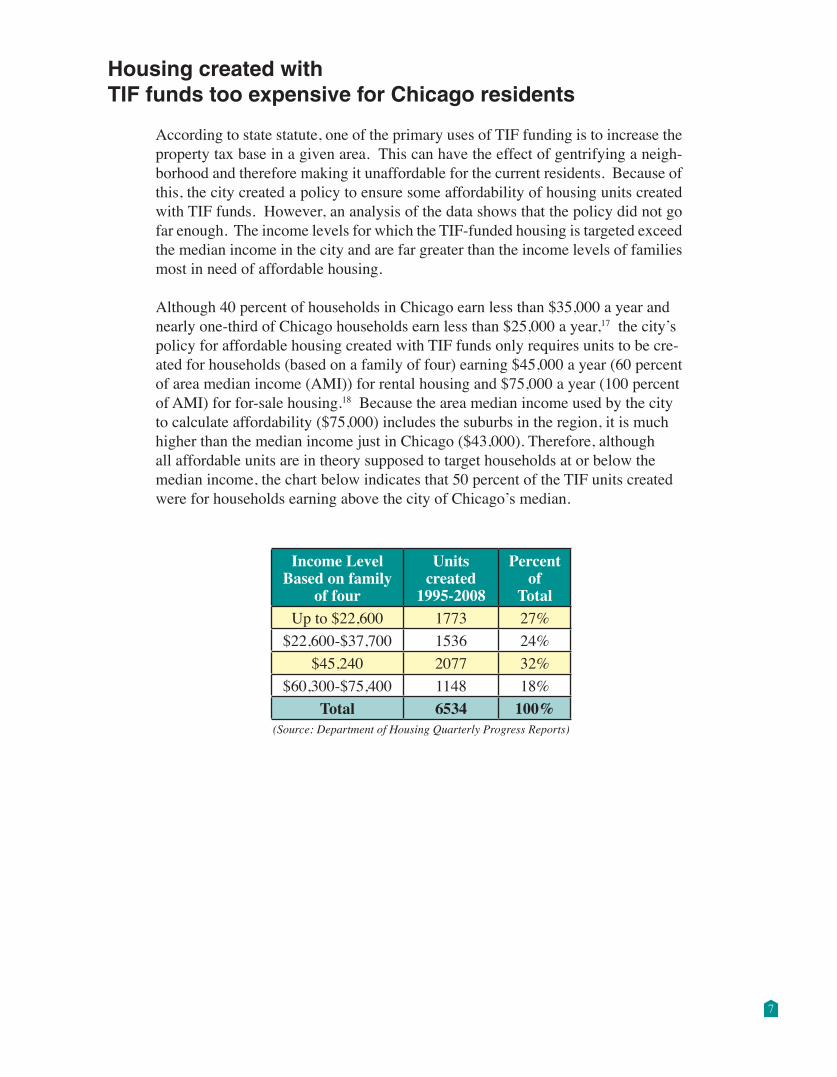
According to state statute, one of the primary uses of TIF funding is to increase the property tax base in a given area. This can have the effect of gentrifying a neigh-borhood and therefore making it unaffordable for the current residents. Because of this, the city created a policy to ensure some affordability of housing units created with TIF funds. However, an analysis of the data shows that the policy did not go far enough. The income levels for which the TIF-funded housing is targeted exceed the median income in the city and are far greater than the income levels of families most in need of affordable housing.
Although 40 percent of households in Chicago earn less than $35,000 a year and nearly one-third of Chicago households earn less than $25,000 a year,17 the city’s policy for affordable housing created with TIF funds only requires units to be cre-atedforhouseholds(basedonafamilyoffour)earning$45,000ayear(60percentof area median income (AMI)) for rental housing and $75,000 a year (100 percent of AMI) for for-sale housing.18 Because the area median income used by the city to calculate affordability ($75,000) includes the suburbs in the region, it is much higher than the median income just in Chicago ($43,000). Therefore, although all affordable units are in theory supposed to target households at or below the median income, the chart below indicates that 50 percent of the TIF units created were for households earning above the city of Chicago’s median.
7
Income LevelBased on family
of four
Units created
1995-2008
Percent of
TotalUpto$22,600 1773 27%$22,600-$37,700 1536 24%
$45,240 2077 32%$60,300-$75,400 1148 18%
Total 6534 100%(Source: Department of Housing Quarterly Progress Reports)
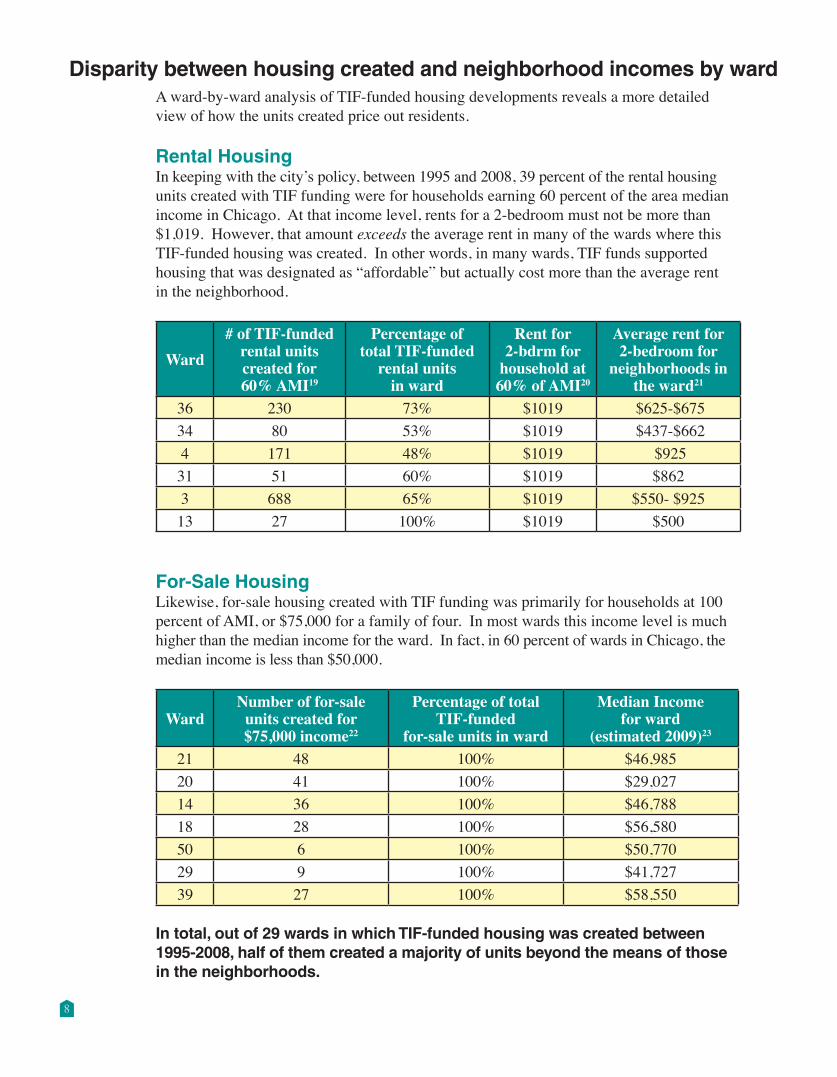
Disparity between housing created and neighborhood incomes by wardA ward-by-ward analysis of TIF-funded housing developments reveals a more detailed view of how the units created price out residents.
Rental Housing In keeping with the city’s policy, between 1995 and 2008, 39 percent of the rental housing unitscreatedwithTIFfundingwereforhouseholdsearning60percentoftheareamedianincome in Chicago. At that income level, rents for a 2-bedroom must not be more than $1,019. However, that amount exceeds the average rent in many of the wards where this TIF-funded housing was created. In other words, in many wards, TIF funds supported housingthatwasdesignatedas“affordable”butactuallycostmorethantheaveragerentin the neighborhood.
Ward# of TIF-funded
rental units created for 60% AMI19
Percentage of total TIF-funded
rental units in ward
Rent for 2-bdrm for
household at 60% of AMI20
Average rent for 2-bedroom for
neighborhoods in the ward21
36 230 73% $1019 $625-$67534 80 53% $1019 $437-$6624 171 48% $1019 $925 31 51 60% $1019 $8623 688 65% $1019 $550- $925 13 27 100% $1019 $500
For-Sale HousingLikewise, for-sale housing created with TIF funding was primarily for households at 100 percent of AMI, or $75,000 for a family of four. In most wards this income level is much higherthanthemedianincomefortheward.Infact,in60percentofwardsinChicago,themedian income is less than $50,000.
WardNumber of for-sale
units created for $75,000 income22
Percentage of total TIF-funded
for-sale units in ward
Median Income for ward
(estimated 2009)23
21 48 100% $46,98520 41 100% $29,02714 36 100% $46,78818 28 100% $56,58050 6 100% $50,77029 9 100% $41,72739 27 100% $58,550
In total, out of 29 wards in which TIF-funded housing was created between 1995-2008, half of them created a majority of units beyond the means of those in the neighborhoods.
8
(Source: Department of Housing Quarterly Progress Reports)
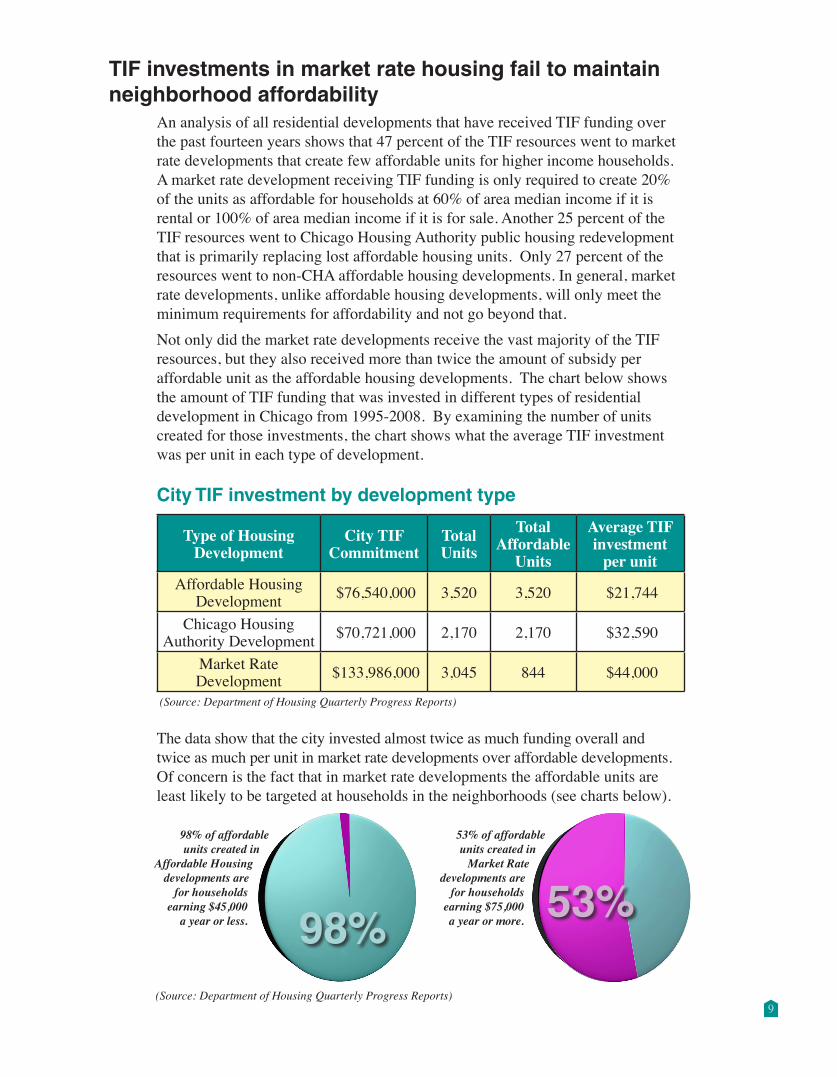
98%53%
98% of affordable units created in
Affordable Housing developments are
for households earning $45,000
a year or less.
53% of affordable units created in
Market Rate developments are
for households earning $75,000 a year or more.
TIF investments in market rate housing fail to maintain neighborhood affordability
An analysis of all residential developments that have received TIF funding over the past fourteen years shows that 47 percent of the TIF resources went to market rate developments that create few affordable units for higher income households. A market rate development receiving TIF funding is only required to create 20% oftheunitsasaffordableforhouseholdsat60%ofareamedianincomeifitisrental or 100% of area median income if it is for sale. Another 25 percent of the TIF resources went to Chicago Housing Authority public housing redevelopment that is primarily replacing lost affordable housing units. Only 27 percent of the resources went to non-CHA affordable housing developments. In general, market rate developments, unlike affordable housing developments, will only meet the minimum requirements for affordability and not go beyond that.Not only did the market rate developments receive the vast majority of the TIF resources, but they also received more than twice the amount of subsidy per affordable unit as the affordable housing developments. The chart below shows the amount of TIF funding that was invested in different types of residential development in Chicago from 1995-2008. By examining the number of units created for those investments, the chart shows what the average TIF investment was per unit in each type of development.
City TIF investment by development type
Type of Housing Development
City TIF Commitment
Total Units
Total Affordable
Units
Average TIF investment
per unitAffordable Housing
Development $76,540,000 3,520 3,520 $21,744
Chicago Housing Authority Development $70,721,000 2,170 2,170 $32,590
Market Rate Development $133,986,000 3,045 844 $44,000
(Source: Department of Housing Quarterly Progress Reports)
The data show that the city invested almost twice as much funding overall and twice as much per unit in market rate developments over affordable developments. Of concern is the fact that in market rate developments the affordable units are least likely to be targeted at households in the neighborhoods (see charts below).
9
TIF funding could go farther towards addressing critical housing needs for the lowest income households
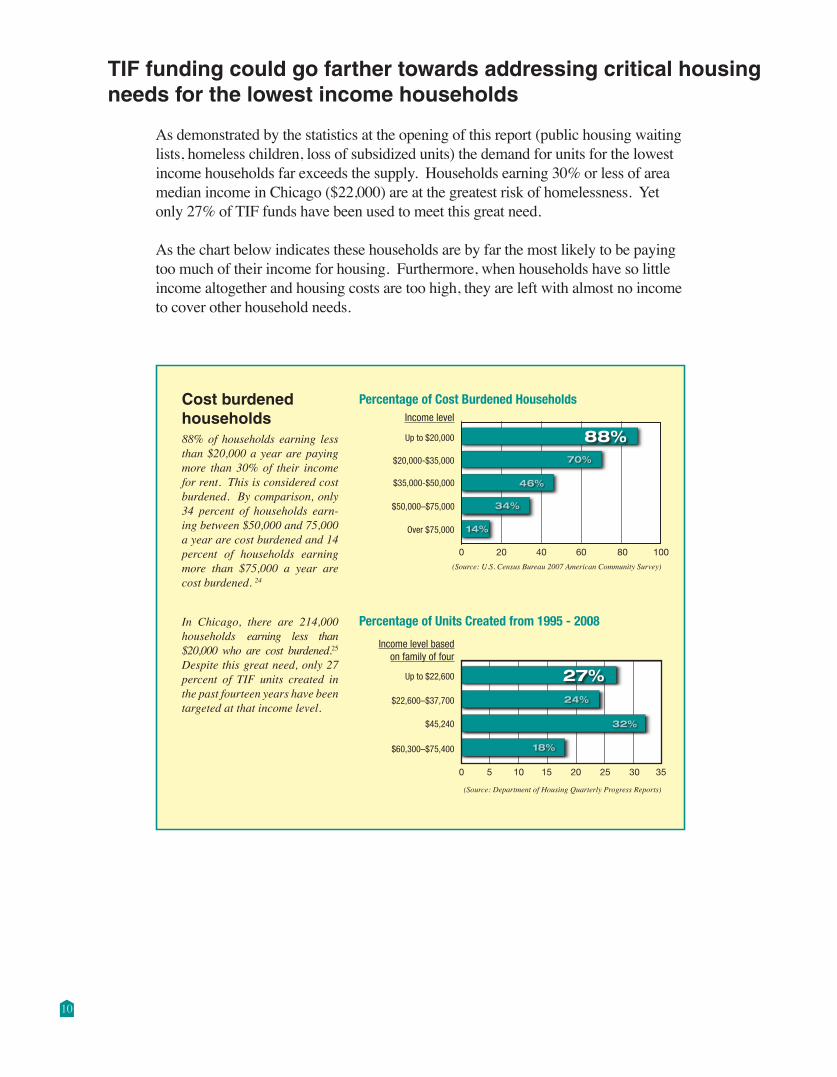
As demonstrated by the statistics at the opening of this report (public housing waiting lists, homeless children, loss of subsidized units) the demand for units for the lowest income households far exceeds the supply. Households earning 30% or less of area median income in Chicago ($22,000) are at the greatest risk of homelessness. Yet only 27% of TIF funds have been used to meet this great need.
As the chart below indicates these households are by far the most likely to be paying too much of their income for housing. Furthermore, when households have so little income altogether and housing costs are too high, they are left with almost no income to cover other household needs.
10
Income level based on family of four
Up to $22,600
$22,600–$37,700
$45,240
$60,300–$75,400
(Source: Department of Housing Quarterly Progress Reports)
Up to $20,000
$20,000-$35,000
$35,000-$50,000
$50,000–$75,000
Over $75,000
Percentage of Cost Burdened Households
Percentage of Units Created from 1995 - 2008
Income level
0 20 40 60 80 100
0 5 10 15 20 25 30 350 5 10 15 20 25 30 35
0 20 40 60 80 100
(Source: U.S. Census Bureau 2007 American Community Survey)
88%70%
46%
34%
14%
27%24%
32%
18%
In Chicago, there are 214,000 households earning less than $20,000 who are cost burdened.25 Despite this great need, only 27 percent of TIF units created in the past fourteen years have been targeted at that income level.
Cost burdened households88% of households earning less than $20,000 a year are paying more than 30% of their income for rent. This is considered cost burdened. By comparison, only 34 percent of households earn-ing between $50,000 and 75,000 a year are cost burdened and 14 percent of households earning more than $75,000 a year are cost burdened. 24
Policy Recommendations:
The city’s current policy and practices for TIF-funded housing development end up pricing people out of neighborhoods rather than maintaining affordable housing as the policy was meant to do. They also do not go far enough towards addressing critical housing needs for the lowest income households at time when those needs are at their greatest and other resources are diminishing.
In order to address those shortfalls, the city should dedicate a much larger per-centage of TIF funding in each year towards housing and target it towards lower income families. The effect of this would be that more of the resources would go towards affordable housing developments that are designed to reach lower income families. Because each affordable housing development would have the potential toseemoreTIFresourcesinitsfinancingpackage,moreofthosedevelopmentswould actually reach their full funding and come to fruition.
In addition, it would mean that the units in those deals would be able to reach even lower income households than currently. As seen earlier, the current average investment per unit in an affordable housing development is only $21,744. State law allows up to 50% of the cost of constructing a unit to be covered and an aver-ageaffordableunitinChicagocosts$261,000.26 If more of the cost were covered by TIF funding, then projects could have less private debt and therefore less an-nual costs, allowing them to charge lower rents.
The overall effect would be that residents would be less likely to be priced out of theirneighborhoodsandcouldenjoythebenefitsastheirneighborhoodsimprove.It also would mean those at greatest risk of homelessness would have more access to housing affordable to them.
Specifically, the city should:
Designate 20% of TIF funding for affordable housingThe city should make a commitment to spending 20 percent of TIF funding generated each year on affordable housing. Just as the city budgets for other priorities, the city could commit to spending a dedicated amount of TIF funds on affordable housing and thenacceptproposalsfromdevelopersforprojectsinspecificTIFs.
Target Designated TIF funds for lower income householdsIn order to ensure that TIF affordable housing funds meet the need of people in Chicago neighborhoods, they should have more stringent affordability require-ments than are currently required for developments receiving TIF funds.
…continued on page 12.
11
12
Proposed affordability requirements for designated affordable housing TIF funds:• Atleast50percentoftheunitsinthedevelopmentwouldhavetobe affordablewith“affordable”definedasfollows:
For rental housing:• Housingmustbeaffordabletohouseholdsearninglessthan$37,700fora family of four (50% of AMI)—Maximum rent $848.
• Inaddition,citywide,40%ofthetotalunitscreatedwiththedesignatedfunds mustservehouseholdsearninglessthan$22,600ayearforafamilyoffour (30% of AMI)—Maximum rent $509. Developers could receive more TIF funds if they target the housing to this income level.
For for-sale housing:• Housingmustbeaffordabletohouseholdsearninglessthan$60,300fora family of four (80% of AMI).
Conclusion
Duringthisverydifficulteconomictime,thecityofChicagohastheresourcesavailable to create housing for families most in need. Using these resources to address the needs of the most vulnerable families living in a TIF both provides tremendous opportunities to those families and creates more stable neighborhoods furthering the goals of the TIF itself. Now is the time for the city to examine its policies on TIF spending and target resources towards housing for struggling families.
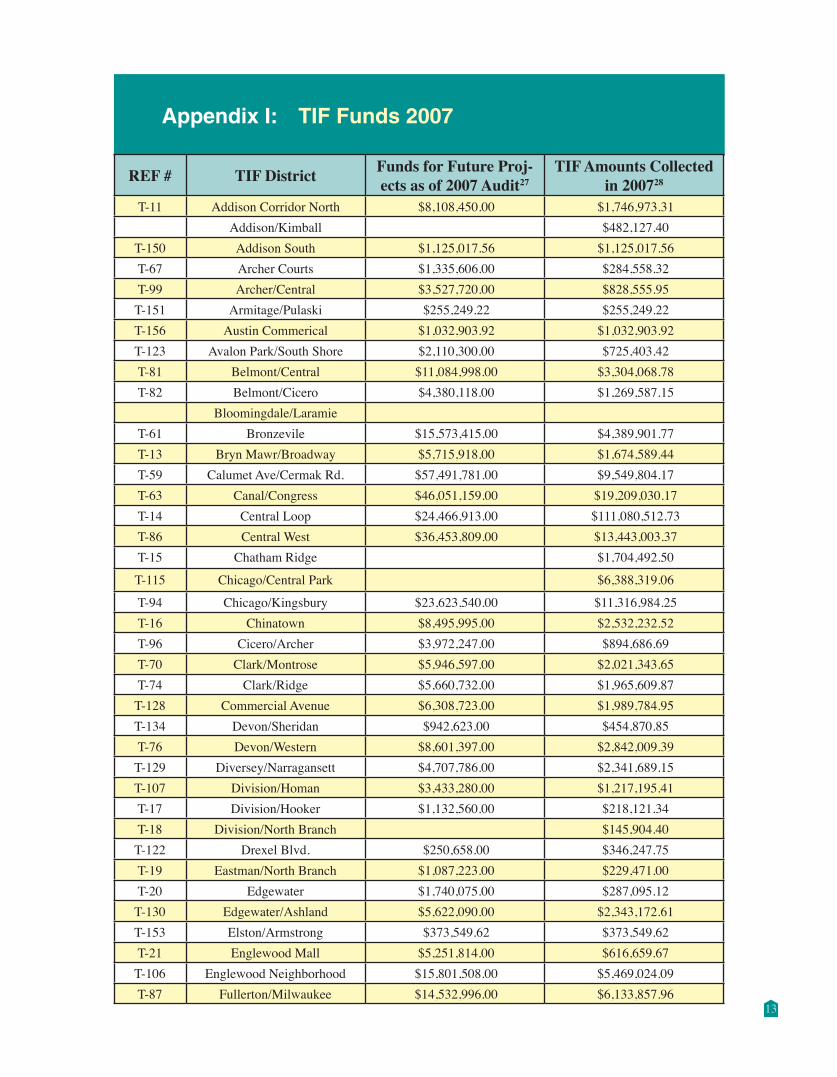
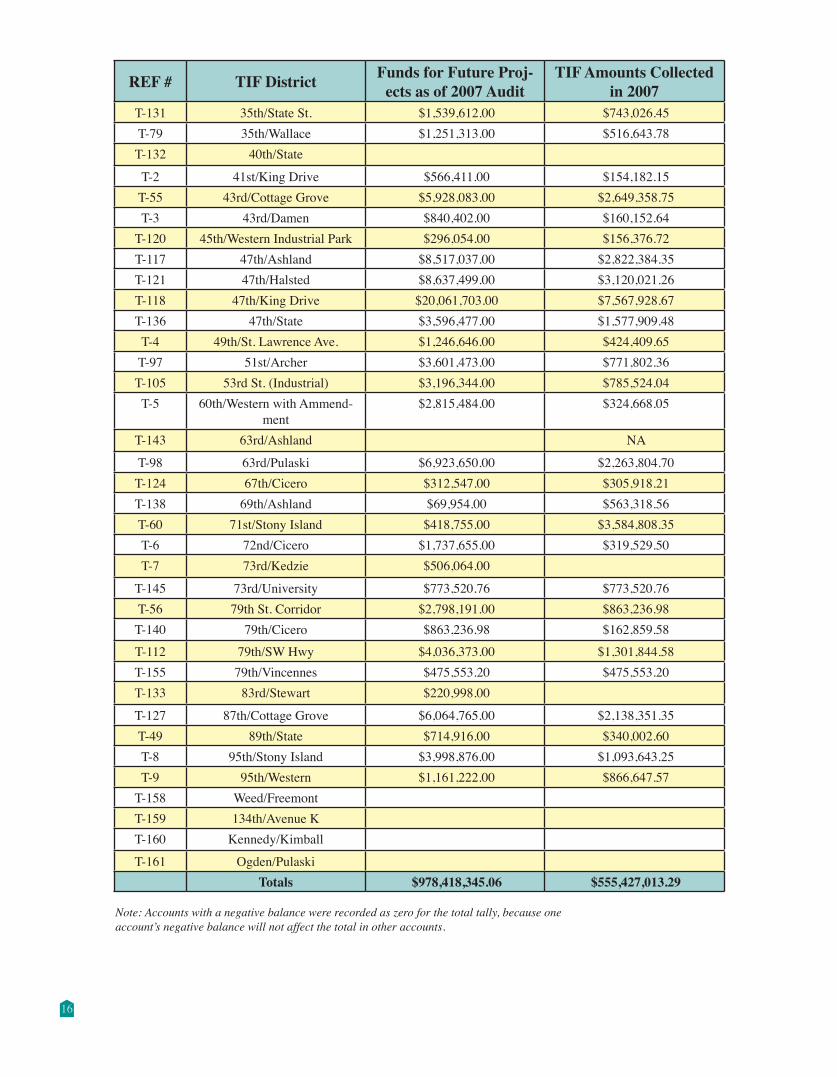
Appendix I: TIF Funds 2007
REF # TIF District Funds for Future Proj-ects as of 2007 Audit27
TIF Amounts Collected in 200728
T-11 Addison Corridor North $8,108,450.00 $1,746,973.31 Addison/Kimball $482,127.40
T-150 Addison South $1,125,017.56 $1,125,017.56T-67 Archer Courts $1,335,606.00 $284,558.32 T-99 Archer/Central $3,527,720.00 $828,555.95 T-151 Armitage/Pulaski $255,249.22 $255,249.22 T-156 Austin Commerical $1,032,903.92 $1,032,903.92 T-123 Avalon Park/South Shore $2,110,300.00 $725,403.42 T-81 Belmont/Central $11,084,998.00 $3,304,068.78T-82 Belmont/Cicero $4,380,118.00 $1,269,587.15
Bloomingdale/Laramie T-61 Bronzevile $15,573,415.00 $4,389,901.77 T-13 Bryn Mawr/Broadway $5,715,918.00 $1,674,589.44T-59 Calumet Ave/Cermak Rd. $57,491,781.00 $9,549,804.17 T-63 Canal/Congress $46,051,159.00 $19,209,030.17 T-14 Central Loop $24,466,913.00 $111,080,512.73 T-86 Central West $36,453,809.00 $13,443,003.37 T-15 Chatham Ridge $1,704,492.50
T-115 Chicago/Central Park $6,388,319.06
T-94 Chicago/Kingsbury $23,623,540.00 $11,316,984.25T-16 Chinatown $8,495,995.00 $2,532,232.52 T-96 Cicero/Archer $3,972,247.00 $894,686.69T-70 Clark/Montrose $5,946,597.00 $2,021,343.65T-74 Clark/Ridge $5,660,732.00 $1,965,609.87
T-128 Commercial Avenue $6,308,723.00 $1,989,784.95 T-134 Devon/Sheridan $942,623.00 $454,870.85 T-76 Devon/Western $8,601,397.00 $2,842,009.39 T-129 Diversey/Narragansett $4,707,786.00 $2,341,689.15T-107 Division/Homan $3,433,280.00 $1,217,195.41 T-17 Division/Hooker $1,132,560.00 $218,121.34 T-18 Division/North Branch $145,904.40 T-122 Drexel Blvd. $250,658.00 $346,247.75T-19 Eastman/North Branch $1,087,223.00 $229,471.00 T-20 Edgewater $1,740,075.00 $287,095.12 T-130 Edgewater/Ashland $5,622,090.00 $2,343,172.61T-153 Elston/Armstrong $373,549.62 $373,549.62T-21 Englewood Mall $5,251,814.00 $616,659.67T-106 Englewood Neighborhood $15,801,508.00 $5,469,024.09T-87 Fullerton/Milwaukee $14,532,996.00 $6,133,857.96
13
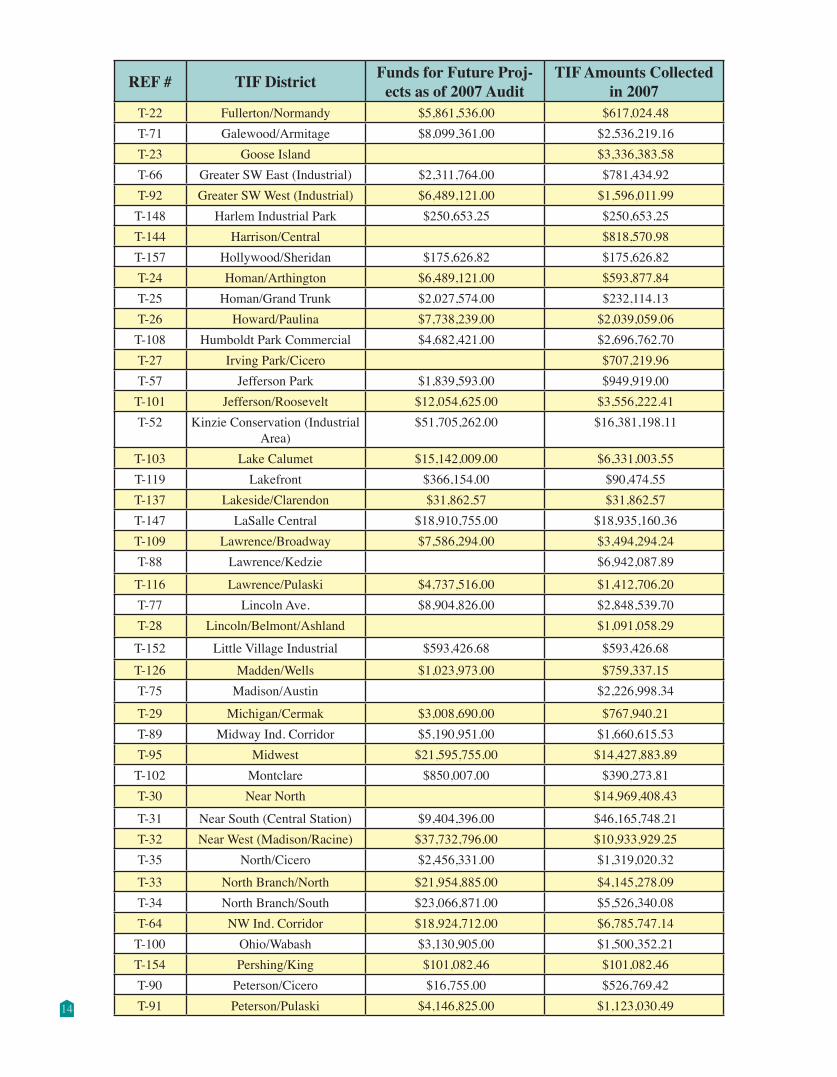
REF # TIF District Funds for Future Proj-ects as of 2007 Audit
TIF Amounts Collected in 2007
T-22 Fullerton/Normandy $5,861,536.00 $617,024.48T-71 Galewood/Armitage $8,099,361.00 $2,536,219.16T-23 Goose Island $3,336,383.58T-66 Greater SW East (Industrial) $2,311,764.00 $781,434.92 T-92 Greater SW West (Industrial) $6,489,121.00 $1,596,011.99
T-148 Harlem Industrial Park $250,653.25 $250,653.25T-144 Harrison/Central $818,570.98 T-157 Hollywood/Sheridan $175,626.82 $175,626.82T-24 Homan/Arthington $6,489,121.00 $593,877.84 T-25 Homan/Grand Trunk $2,027,574.00 $232,114.13 T-26 Howard/Paulina $7,738,239.00 $2,039,059.06
T-108 Humboldt Park Commercial $4,682,421.00 $2,696,762.70T-27 Irving Park/Cicero $707,219.96T-57 Jefferson Park $1,839,593.00 $949,919.00
T-101 Jefferson/Roosevelt $12,054,625.00 $3,556,222.41T-52 Kinzie Conservation (Industrial
Area)$51,705,262.00 $16,381,198.11
T-103 Lake Calumet $15,142,009.00 $6,331,003.55T-119 Lakefront $366,154.00 $90,474.55 T-137 Lakeside/Clarendon $31,862.57 $31,862.57T-147 LaSalle Central $18,910,755.00 $18,935,160.36T-109 Lawrence/Broadway $7,586,294.00 $3,494,294.24 T-88 Lawrence/Kedzie $6,942,087.89
T-116 Lawrence/Pulaski $4,737,516.00 $1,412,706.20T-77 Lincoln Ave. $8,904,826.00 $2,848,539.70 T-28 Lincoln/Belmont/Ashland $1,091,058.29
T-152 Little Village Industrial $593,426.68 $593,426.68
T-126 Madden/Wells $1,023,973.00 $759,337.15 T-75 Madison/Austin $2,226,998.34
T-29 Michigan/Cermak $3,008,690.00 $767,940.21T-89 Midway Ind. Corridor $5,190,951.00 $1,660,615.53T-95 Midwest $21,595,755.00 $14,427,883.89 T-102 Montclare $850,007.00 $390,273.81 T-30 Near North $14,969,408.43
T-31 Near South (Central Station) $9,404,396.00 $46,165,748.21T-32 Near West (Madison/Racine) $37,732,796.00 $10,933,929.25 T-35 North/Cicero $2,456,331.00 $1,319,020.32
T-33 North Branch/North $21,954,885.00 $4,145,278.09 T-34 North Branch/South $23,066,871.00 $5,526,340.08T-64 NW Ind. Corridor $18,924,712.00 $6,785,747.14T-100 Ohio/Wabash $3,130,905.00 $1,500,352.21 T-154 Pershing/King $101,082.46 $101,082.46T-90 Peterson/Cicero $16,755.00 $526,769.42T-91 Peterson/Pulaski $4,146,825.00 $1,123,030.49 14
REF # TIF District Funds for Future Proj-ects as of 2007 Audit
TIF Amounts Collected in 2007
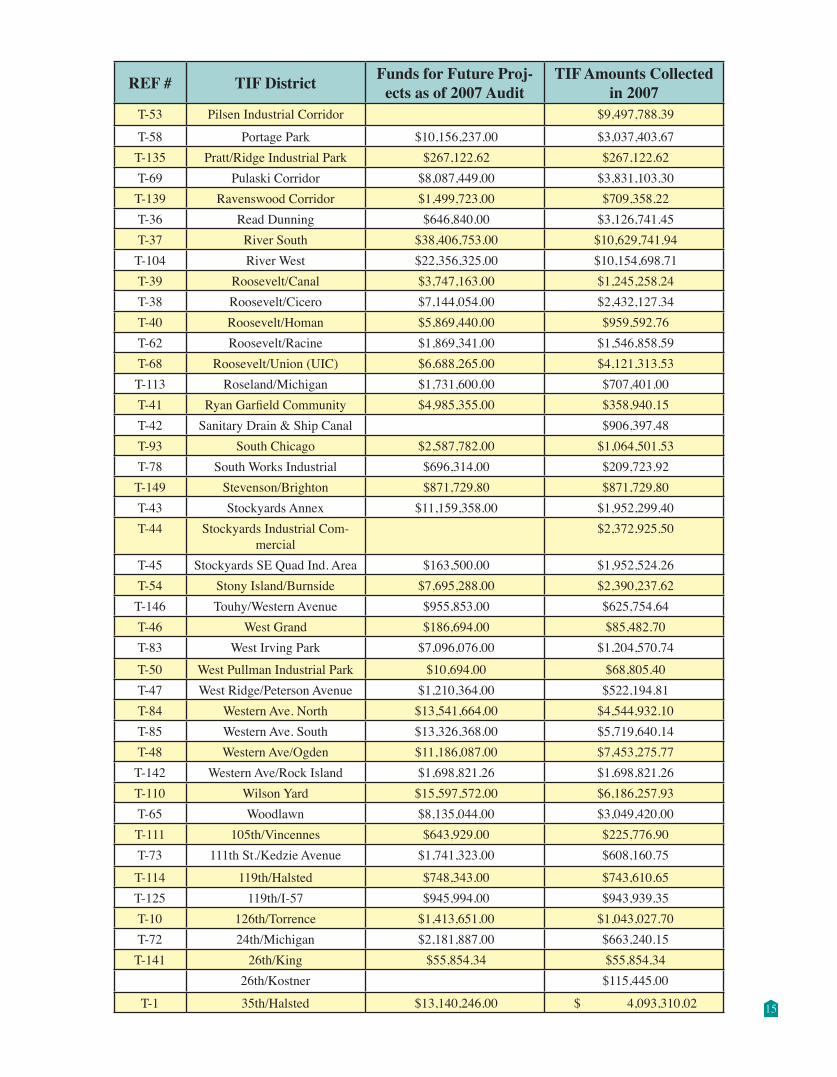
T-53 Pilsen Industrial Corridor $9,497,788.39
T-58 Portage Park $10,156,237.00 $3,037,403.67T-135 Pratt/Ridge Industrial Park $267,122.62 $267,122.62T-69 Pulaski Corridor $8,087,449.00 $3,831,103.30
T-139 Ravenswood Corridor $1,499,723.00 $709,358.22 T-36 Read Dunning $646,840.00 $3,126,741.45T-37 River South $38,406,753.00 $10,629,741.94T-104 River West $22,356,325.00 $10,154,698.71T-39 Roosevelt/Canal $3,747,163.00 $1,245,258.24 T-38 Roosevelt/Cicero $7,144,054.00 $2,432,127.34 T-40 Roosevelt/Homan $5,869,440.00 $959,592.76T-62 Roosevelt/Racine $1,869,341.00 $1,546,858.59T-68 Roosevelt/Union (UIC) $6,688,265.00 $4,121,313.53 T-113 Roseland/Michigan $1,731,600.00 $707,401.00 T-41 RyanGarfieldCommunity $4,985,355.00 $358,940.15 T-42 Sanitary Drain & Ship Canal $906,397.48T-93 South Chicago $2,587,782.00 $1,064,501.53T-78 South Works Industrial $696,314.00 $209,723.92 T-149 Stevenson/Brighton $871,729.80 $871,729.80 T-43 Stockyards Annex $11,159,358.00 $1,952,299.40 T-44 Stockyards Industrial Com-
mercial $2,372,925.50
T-45 Stockyards SE Quad Ind. Area $163,500.00 $1,952,524.26T-54 Stony Island/Burnside $7,695,288.00 $2,390,237.62T-146 Touhy/Western Avenue $955,853.00 $625,754.64T-46 West Grand $186,694.00 $85,482.70 T-83 West Irving Park $7,096,076.00 $1,204,570.74
T-50 West Pullman Industrial Park $10,694.00 $68,805.40T-47 West Ridge/Peterson Avenue $1,210,364.00 $522,194.81 T-84 Western Ave. North $13,541,664.00 $4,544,932.10 T-85 Western Ave. South $13,326,368.00 $5,719,640.14T-48 Western Ave/Ogden $11,186,087.00 $7,453,275.77 T-142 Western Ave/Rock Island $1,698,821.26 $1,698,821.26T-110 Wilson Yard $15,597,572.00 $6,186,257.93T-65 Woodlawn $8,135,044.00 $3,049,420.00 T-111 105th/Vincennes $643,929.00 $225,776.90T-73 111th St./Kedzie Avenue $1,741,323.00 $608,160.75
T-114 119th/Halsted $748,343.00 $743,610.65T-125 119th/I-57 $945,994.00 $943,939.35 T-10 126th/Torrence $1,413,651.00 $1,043,027.70 T-72 24th/Michigan $2,181,887.00 $663,240.15
T-141 26th/King $55,854.34 $55,854.34 26th/Kostner $115,445.00
T-1 35th/Halsted $13,140,246.00 $ 4,093,310.02 15
REF # TIF District Funds for Future Proj-ects as of 2007 Audit
TIF Amounts Collected in 2007
T-131 35th/State St. $1,539,612.00 $743,026.45T-79 35th/Wallace $1,251,313.00 $516,643.78
T-132 40th/State
T-2 41st/King Drive $566,411.00 $154,182.15 T-55 43rd/Cottage Grove $5,928,083.00 $2,649,358.75T-3 43rd/Damen $840,402.00 $160,152.64
T-120 45th/Western Industrial Park $296,054.00 $156,376.72T-117 47th/Ashland $8,517,037.00 $2,822,384.35 T-121 47th/Halsted $8,637,499.00 $3,120,021.26T-118 47th/King Drive $20,061,703.00 $7,567,928.67T-136 47th/State $3,596,477.00 $1,577,909.48
T-4 49th/St. Lawrence Ave. $1,246,646.00 $424,409.65T-97 51st/Archer $3,601,473.00 $771,802.36
T-105 53rd St. (Industrial) $3,196,344.00 $785,524.04 T-5 60th/WesternwithAmmend-
ment $2,815,484.00 $324,668.05
T-143 63rd/Ashland NA
T-98 63rd/Pulaski $6,923,650.00 $2,263,804.70T-124 67th/Cicero $312,547.00 $305,918.21 T-138 69th/Ashland $69,954.00 $563,318.56T-60 71st/Stony Island $418,755.00 $3,584,808.35 T-6 72nd/Cicero $1,737,655.00 $319,529.50 T-7 73rd/Kedzie $506,064.00
T-145 73rd/University $773,520.76 $773,520.76T-56 79th St. Corridor $2,798,191.00 $863,236.98T-140 79th/Cicero $863,236.98 $162,859.58
T-112 79th/SW Hwy $4,036,373.00 $1,301,844.58 T-155 79th/Vincennes $475,553.20 $475,553.20 T-133 83rd/Stewart $220,998.00
T-127 87th/Cottage Grove $6,064,765.00 $2,138,351.35 T-49 89th/State $714,916.00 $340,002.60T-8 95th/Stony Island $3,998,876.00 $1,093,643.25T-9 95th/Western $1,161,222.00 $866,647.57
T-158 Weed/Freemont T-159 134th/Avenue K T-160 Kennedy/Kimball
T-161 Ogden/Pulaski Totals $978,418,345.06 $555,427,013.29
Note: Accounts with a negative balance were recorded as zero for the total tally, because one account’s negative balance will not affect the total in other accounts.
16
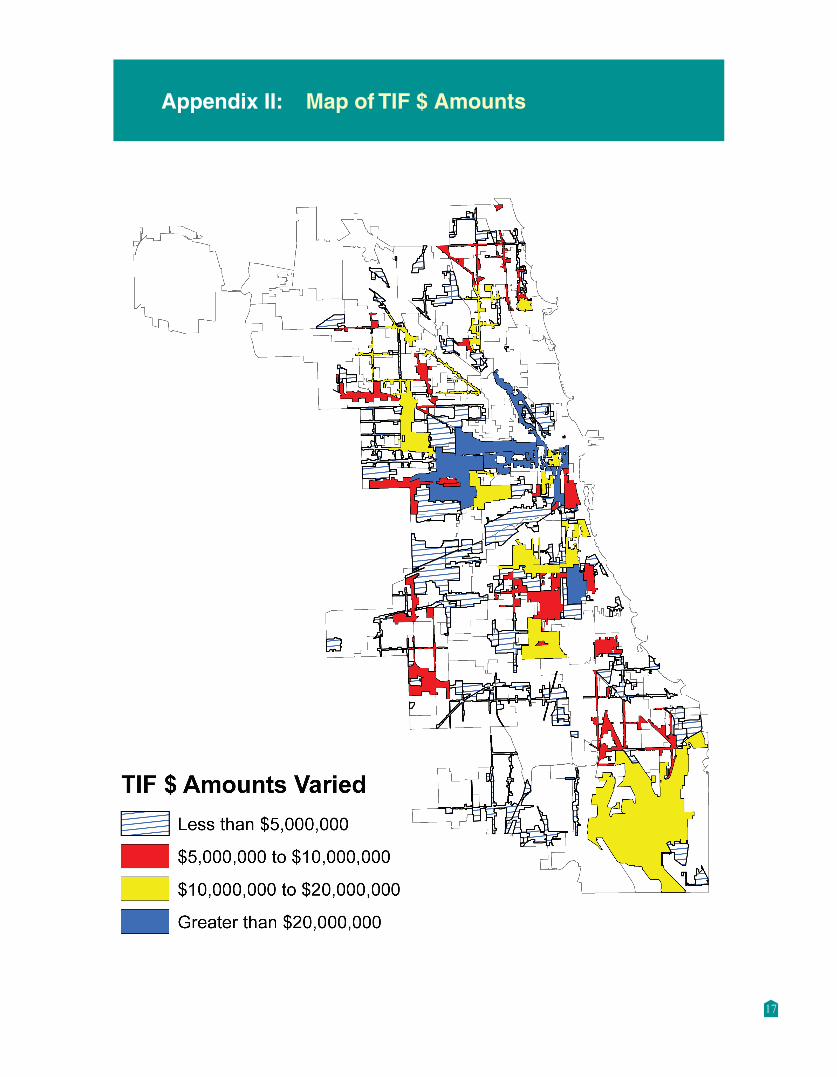
Appendix II: Map of TIF $ Amounts
17
Endnotes1 Department of Community Development, Tax Increment Financing Overview, May 20092 Cook County Clerk Website; Department of Housing (DOH) Affordable Housing Plan Quarterly Progress Reports, 1995-2008.3 Department of Housing Quarterly Progress Reports, 1995-20084 Department of Housing Quarterly Progress Reports, 1995-20085 Woodstock Insititute, The Chicago Region’s Foreclosure Problem Continued to Grow in 2008, Geoff Smith and Sarah Duda, January 28, 20096 U.S. Census Bureau, 2007 American Community Survey7 Not Even a Place in Line, Mid-American Institute on Poverty of the Heartland Alliance for Human Needs and Human Rights, 20078 Chicago Housing Authority9 Chicago Rehab Network, City of Chicago, Housing Fact Sheet10JanetL.Smith.“TheChicagoHousingAuthority’sPlanforTransformation”:WhereArePoorPeopleto Live.M.E.Sharpe,2006.11 Chicago Public Schools, Homeless Education Program12 Cook County Clerk Website13 2007 TIF Annual Reports14 Department of Community Development, Tax Increment Financing Overview, May 200915 Cook County Clerk Website16 DOH Quarterly Progress Reports17 U.S. Census Bureau, 2007 American Community Survey18 City of Chicago website, Affordable Requirements Ordinance19 DOH Quarterly Reports20 2008 Department of Housing Quarterly Progress Report21http://www.cityofchicago.org/webportal/COCWebPortal/COC_EDITORIAL/Housing0607.pdf22 DOH Quarterly Progress Reports23 Estimates based on data from Onboard Informatics24 U.S. Census Bureau, 2007 American Community Survey25 U.S. Census Bureau, 2007 American Community Survey26 Estimate based on total costs of 2009 pending low-income tax credit developments in Chicago.27 2007 TIF Annual Reports28 Cook County Clerk Website
June, 2009