TAX INCENTIVES FOR HOUSEHOLD SAVING AND...
46
Chapter 4 TAX INCENTIVES FOR HOUSEHOLD SAVING AND BORROWING Tullio Jappelli & Luigi Pistaferri We thank Patrick Honohan, Alberto Musalem and seminar participants at the World Bank Conference of April 8-9, 2002, for useful comments and Tea Trumbic for research assistance.
Transcript of TAX INCENTIVES FOR HOUSEHOLD SAVING AND...
Chapter 4
TAX INCENTIVES FOR HOUSEHOLD SAVING AND BORROWING
Tullio Jappelli &
Luigi Pistaferri We thank Patrick Honohan, Alberto Musalem and seminar participants at the World Bank Conference of April 8-9, 2002, for useful comments and Tea Trumbic for research assistance.
1
Introduction
Modern theories of intertemporal consumption choice emphasize that individuals may save
for variety of motives: to smooth life-cycle fluctuations in income (the retirement, or life-cycle
motive), to face emergencies arising from income or health risks (the precautionary motive), to
purchase durable goods and housing, and to accumulate resources for one's heir (the bequest
motive) (cf. Browning and Lusardi, 1996).
Individual choice may be affected by the government policies that, in virtually all countries,
target private saving. Government targeting is selective, and tends to affect not only the overall
level of saving, but also the allocation of saving among its many different forms.
Raising the overall level of saving is often viewed as an effective way to raise investment
and growth. Many forms of government intervention thus aim at increasing saving tout court, but
leave the ultimate decision about the allocation of saving to the individual. But in other cases
government intervention mandates individuals to save in specific forms, or for specific purposes.
For instance, in almost all countries governments promote retirement saving, because having
insufficient resources during retirement entails a high burden not only for the elderly lacking
these resources, but also for the society as a whole. Promoting saving for housing and other
goods to which policy makers assign high priority (education, health, or life protection) is also a
popular goal. The chapter reviews the literature on these tax incentives, with special focus on
long-term saving, housing, and household liabilities.
In very poor countries households rely on informal markets for credit transactions, so
government intervention has a limited role in shaping household saving and portfolio allocations.
The chapter therefore places special emphasis on the importance of tax incentives and saving
instruments available in middle-income countries with relatively developed financial markets (as
several Latin America and East-Asian countries). It is precisely in middle-income countries that
mandatory saving instruments are more widespread, and often the only effective way of raising
the overall level of saving and shaping household portfolios. In this area, the most developed
countries have accumulated a wide experience in designing and implementing various tax
incentives schemes. This experience can be used to evaluate the effectiveness of tax incentives
and to draw lessons for middle-income countries.
2
A careful review of the international tax codes reveals that in most middle-income countries
the tax system targets long-term, retirement saving instruments. This is hardly surprising given
the role of retirement saving as the most important and widely available household financial
asset. The tax features of pension funds are of special interest, given the recent wave of reforms
of the social security system in Latin America and East Asia. Almost invariably, mandated
contributions to pension funds are tax exempt, and very often voluntary contributions to long-
term saving instruments are also heavily favored by the tax code. The chapter therefore
concentrates mainly on mandated contributions to pension funds, although it devotes some space
also to the tax treatment of other, more "sophisticated" assets, available in industrialized
countries. The second area of widespread government intervention in middle-income countries is
incentives to save for housing accumulation plans. These programs are absent in industrialized
countries, but quite common in several middle-income countries.
The chapter is divided in five parts, each addressing a particular saving instrument and area
of policy intervention. It starts out in Section 1 by reviewing the interest rate effect on personal
saving. The specific question addressed is whether public policies affecting the real rate of
interest impact the overall level of saving. Section 2 turns to examine the effect of tax incentives
on long-term mandatory saving programs. In the absence of tax incentives, mandated assets are a
substitute for private accumulation and should not affect national savings. However, the tax
deductibility of mandated contributions that we encounter in almost all countries can be an
effective way of influencing not only the composition of wealth, but also the overall level of
saving. On this front, we present international evidence based on regression analysis showing a
positive association between the national saving rate and the stock of mandated assets in
household portfolios.
Section 3 examines government programs that target saving for home purchase. Direct
subsidies to home mortgages, deductibility of mortgage interest payments, reduced loan rates, are
just a few examples of government intervention in this area. But the most striking instruments are
mandatory contributions to provident funds designed to accumulate resources for a down
payment against home purchase. The interplay between saving for retirement and saving for
housing accumulation is also of special interest in this area. Section 4 explores government
3
programs that target saving for health and education, while section 5 analyzes the effect of tax
incentives to borrow, rather than to save.
For each of these five important issues, the chapter examines empirical evidence on the
main characteristics of government programs, with a special focus on middle-income countries. It
also addresses a number of issues that should be of interest to policy-makers. First of all, on
which grounds government policy should target some assets rather than others. Second, if tax-
sheltered assets and liabilities lead to substitution away from more heavily taxed savings
instruments or if they affect the overall level of saving. And finally, if there is any lesson that can
be drawn from the experience of developed countries for the design of saving and borrowing
incentives in middle-income countries. Using simple models, three Appendices summarize the
effect on saving of the interest rate, mandated pension contributions and tax incentives to borrow.
1. Incentives to voluntary retirement saving
The interest rate effect on personal saving has attracted a long tradition of research, both
theoretically and empirically. The specific question that this literature addresses is whether public
policies affecting the real rate of interest affect the overall level of saving. Although taxing the
return to saving can have a strong effect on household asset selection and allocation, theoretical
models, such as the standard two-period model of intertemporal choice presented in Appendix A1
are ambivalent regarding the effect on the overall level of saving, even when one considers
models with uncertainty and precautionary saving (Bernheim, 2000).1 Nor has the empirical
literature been able to pin down this effect.
1 The aggregate tax elasticity of saving depends not only on preference parameters, but also on the distribution of wealth. Cagetti (2001) shows that life-cycle models of wealth accumulation in which the precautionary motive is quantitatively relevant also imply extremely low intertemporal elasticities, in contrast to models without uncertainty (Summers, 1981). Such models thus imply small effects for tax-favored saving instruments on the saving of the median household. But if the richest 5 per cent of the population behaves differently (for example being less risk averse, or being more affected, as entrepreneurs, by capital income taxation), aggregate wealth may still exhibit a large interest rate elasticity. Thus, the distribution of wealth is a crucial parameter to evaluate the impact of tax incentives. This is particularly relevant in developing countries where wealth inequality tends to be higher than in most industrialized nations.
4
The empirical literature on saving and taxation has grown tremendously in recent years.
Bernheim (2000), Besley and Meghir (2001), Honohan (2000) and Poterba (2000) provide
surveys of the most recent developments, and we refer the interested readers to these excellent
contributions. Here we limit ourselves at summarizing the main empirical strategies that have
been used to test the interest rate effect on saving. They can be broadly divided in three groups:
estimation of saving function with time series or cross-country data; Euler equation estimates of
the intertemporal elasticity of substitution; analysis of specific tax reforms.
The earliest approach consists of specifying a saving function and estimating the interest
rate elasticity controlling for other determinants of saving. Many such studies have been
performed with time series data from individual countries, and with cross-country or panel data
from both the industrialized and developing countries. Honohan (2000) reviews several studies
based on individual country time series or cross-country data and concludes that "more studies
have found a positive interest rate elasticity than a negative one, but the coefficients have
generally been small and often insignificant" (p. 83). Possible reasons why this approach has
been inconclusive stem from aggregation problems (some investors might have a positive
elasticity of saving, others a negative one) and endogeneity of interest rates and other variables
introduced in saving regressions.
The Euler equation for consumption states that consumption growth depends on the
difference between the real rate of interest and the intertemporal rate of time preference. The
sensitivity of consumption growth with respect to the real interest rate is the elasticity of
intertemporal substitution in consumption. Since Hall's (1978) seminal contribution, the
possibility of estimating structural preference parameters with the Euler equation has attracted
enormous interest among applied economists. More recently, the approach has shifted attention
from studies using aggregate data to analyses based on household panel data, which allow
rigorous treatment of aggregation issues. After more than two decades of empirical studies,
however, one must recognize that the approach has also been largely inconclusive, at least as far
as pinning down the interest rate elasticity is concerned.
5
First of all, it is now clear that estimation of Euler equations poses extremely difficult
econometric problems, particularly in the presence of short panel data, omitted variables due to
precautionary saving and liquidity constraints, non-separabilities between consumption and
leisure (Browning and Lusardi, 1996). Second, the sensitivity of consumption growth to the real
interest rate is hard to estimate with panel data on households, because at any given point in time
households face the same real rate of interest. Researchers must therefore rely on the variability
of marginal tax rates affecting the after-tax return to saving. Third, most empirical studies find
that the elasticity of substitution is positive and generally less that one, but estimates vary
considerably over this range (Bernheim, 2001). Finally, even high values of the elasticity do not
necessarily imply a positive interest rate elasticity of saving. Even though a high value of the
elasticity makes it more likely that the substitution effect dominates the income effect, the Euler
equation delivers information about the shape of the consumption profile, not about the level of
consumption and saving.
A third generation of studies has approached the issue at hand studying the portfolio and
saving effect of specific tax reforms. Table 1, drawn from Poterba (2001), reports information on
saving incentives for major industrial nations' voluntary retirement plans. With the exception of
France and Japan, these programs are widely available in industrialized countries. The specific
tax provision and generosity of saving incentives vary considerably, but the basic features are
common. Households can contribute up to a specific limit to retirement saving accounts (such as
Individual Retirement Accounts and 401(k) plans in the US, Individual Saving Accounts in the
United Kingdom, and life insurance plans in Italy), using pre-tax dollars. These plans have
provided the ground for empirical research trying to assess to what extent contributions to tax
deferred saving accounts represent "new saving", or merely a substitution between tax favored
and other assets. The advantage of this approach is that it is based on clear experiments, and on
rigorous econometric methods.
At the theoretical level, however, it is not clear whether tax deferred saving accounts should
increase the overall level of saving, even in situations in which the interest effect on saving is

6
positive (that is, the substitution effect dominates the income and wealth effects), adding a further
element of ambiguity in the picture.2
This point is made most clearly by Besley and Meghir (2001). Following their example,
assume that individuals can invest in only two assets both of which have a gross rate of return r
and one of which is tax-free up to a certain level of investment L. An individual can invest up to
L in the tax-favored asset, yielding r. Any savings above L yield a net of tax return r(1−θ).
In the absence of uncertainty, the effect of the tax incentive on the allocation of wealth is
clear: investors put as much wealth as they can in the tax-favored asset, up to the limit L. The
effect on the level of saving, however, is ambiguous. If desired saving is less than L, all wealth is
allocated in the tax-favored asset and, under the assumptions of Appendix A.1, an increase in r
increases saving. If instead desired saving is higher than L, individuals would have saved more
than L even in the absence of incentives. In such a situation, the effect is reversed. Besley and
Meghir show that the effect of the tax incentive depends on the relation between investors' wealth
and the limit L, and on the intertemporal elasticity of substitution. In practice, then, the same
incentive can generate a wide range of heterogeneity of individual responses.
Engen, Gale and Scholz (1996) point out another feature of tax deferred saving accounts,
i.e., that they are less liquid than conventional saving. The saving incentive might reduce saving
of those who do not behave according to the intertemporal choice model, but have a have a fixed
saving target. For these individuals, the incentive and the higher return on saving will make it
easier to reach the target, because they must give up fewer resources for the same target. A
further criticism of the approach based on the analysis of tax reform is that none of the studies is
able to estimate the interest rate elasticity of saving and thus provide information valuable to
policy makers. Finally, tax incentives reduce tax revenues and therefore public saving. In order to
conclude that tax incentives increase capital accumulation one must therefore consider not only
the effect of tax incentives on private saving, but also the revenue loss associated with the
incentives. Most of the studies in this area, however, adopt a partial equilibrium framework.
2 Behavioral theories suggest that people do not optimize in the neoclassical sense and fail to provide adequately for their retirement due of lack of self-control (Thaler and Shefrin, 1981; Thaler, 1990). Targeted saving instruments may therefore serve as focal point for inconstant people to actually accomplish their savings goals. For recent evidence on this point, see Madrian and Shea (2001).
7
As mentioned, the main question addressed by the literature is whether tax deferred saving
accounts such as 401(k) and IRAs − introduced in the United States in 1978 and 1986,
respectively − represent "new saving", or a substitution between tax favored and conventional
assets. Despite these "clean" tax experiments, a consensus has yet to emerge. On the one hand,
Poterba, Venti and Wise (1996) argue that IRA and 401(k) increase saving.3 Engen, Gale and
Scholz (1996) conclude instead that they produce mainly a reallocation effect of household
portfolios, and little effect on intertemporal choice.
If a scheme does have a total saving effect, then one would expect the saving of the
participants to be higher than that of non-participants, as indeed it is on average. But participants
are also on average wealthier and nearer to retirement than non-contributors. So perhaps the
preferences of participants are different as well, for instance that the wealthy contribute to IRA
because they have a higher taste for saving than non-contributors. In short, cross-sectional studies
suffer from an identification problem caused by unobserved heterogeneity and self-selection
issues. Panel data, tracking the behavior of investors over time, can help the researcher to
control, at least to some extent, for fixed individual heterogeneity. In principle, one can establish
if investors have chosen to save more or less after the introduction of a tax-advantaged scheme.
But even in this case it is difficult to attribute the decision to increase saving to the introduction
of the scheme. An investor might choose to save more for reasons that are totally unrelated to the
existence of the scheme (for instance, because the investor is reaching retirement age, or because
he would like to purchase a home).
To summarize, of the many studies that have analyzed the interest rate effect on saving,
none has found convincing evidence of a systematic relation between the two variables, so that
the emerging consensus is that rate-of-return effects on saving are at best small. Time series data
suffer from aggregation problems. After the initial enthusiasm, researchers have realized how
difficult it is to tackle the econometric and identification issues in structural Euler equations for
consumption. The analysis of tax reform, and particularly of the incentives provided by IRAs and
401(k) in the US, has delivered conflicting and inconclusive evidence, despite the great number
3 They estimate that about half of the contributions to IRAs represent new saving, 30 percent is financed
by the tax saving allowed by the same IRAs, and the remaining 20 percent is a pure portfolio effect.
8
of high-quality empirical investigations spurred by two major US tax reforms. Our reading of this
literature, as summarized by Poterba, Venti and Wise (1996), Engen, Gale and Scholz (1996),
Bernheim (2000) and Besley and Meghir (2000), is that there is broad consensus that (at least in
the US) tax deferred saving accounts have induced massive portfolio shifts towards tax-favored
assets, but much less consensus on whether saving incentives have actually increased saving.
2. Promoting mandatory saving
Besides creating a fiscal wedge between pre- and after-tax returns, governments affect
household saving and borrowing in a variety of ways. As we shall see, the most important
programs in middle-income countries promote saving through mandated contributions to pension
funds and housing saving accounts. These contributions are mandatory, and crowd out almost
automatically conventional saving. However, contributions are generally granted preferential
treatment by the tax code, and might therefore be a far more effective way of promoting the
overall level of saving than tax-deferred saving accounts based on voluntary contributions.
There are several reasons for setting up mandatory saving programs. First, policy makers
often target domestic saving, on the assumption that increasing domestic saving promotes
investment, job creation and growth. Another reason is that mandatory saving programs might be
the only effective way of providing the elderly with adequate resources to be spent during
retirement, particularly when people are myopic or do not have enough information to plan for
relatively long horizons. Moreover, if saving for retirement were left only to the discretion of the
individual, free-riding behavior might impose a high burden to the society as a whole. After all,
the wide implementation of these programs and the fact that a considerable portion of household
wealth is locked in mandatory saving programs indicates the social approval of schemes designed
to ensure people with adequate reserves to be spent during retirement.
Apart from the effect on domestic saving and capital stock, a further motivation for
promoting pension funds and other institutional investors is the desire to encourage so-called
popular capitalism through mandatory or voluntary contributions to saving accounts earmarked
for retirement. The development of the contractual saving industry is widely thought to have a
favorable impact on the deepening and diversification of the financial system. Moreover,

9
individuals might have greater incentives to perform on the job when they have a direct stake in
the performance of the economy through the holding of risky assets.4
This section describes the characteristics of these programs, particularly in Latin American
and East Asian countries. Appendix A.2 shows, in the context of a simple model of the impact of
mandated contributions on private and national saving, that the existence of tax concessions on
mandatory savings can result in higher overall savings. We present empirical evidence based on
cross-country data showing that reserves of mandatory pension systems and private pension fund
assets do indeed increase national saving, as predicted by the model. The focus is mainly on
pension funds, although several remarks apply to unfunded plans as well.
2.1 Portfolio effects of mandatory contributions
In the simple model outlined in Appendix A.2 mandatory contributions displace private
accumulation one-for-one. In more realistic cases, this needs not be the case. A first important
issue is how to measure mandatory saving and pension wealth. Then one needs to distinguish
between the portfolio effect of mandatory assets and their effect on national saving. The first two
issues are analyzed in this section, while in the next section we provide empirical evidence on the
impact of mandatory retirement saving on national saving.
In general, individual pension assets are defined as the difference between the present
discounted value of future pensions and the present discounted value of contributions. Clearly,
these depend on legislation (the contribution rate and the pension award formula), expected
inflation, expected retirement age, expected rates of return, and mortality. Computation of
pension wealth is therefore difficult, for both defined benefits and defined contribution plans.
Individual expectations are usually hard to measure. In the case of social security wealth,
the problem is exacerbated by the fact that expectations depend on long run phenomena (for
instance, income growth and rates of return many years from now) and on the possibility of
pension reforms changing individual retirement options and pension award formulae. For this
reason pension wealth can be estimated only with a high degree of approximation.
4 For instance, Moskowitz and Vissing-Jorgensen (2001) find that in the United States households with private equity ownership invest on average almost two thirds of their private holdings in a single company in which they have an active management interest.
10
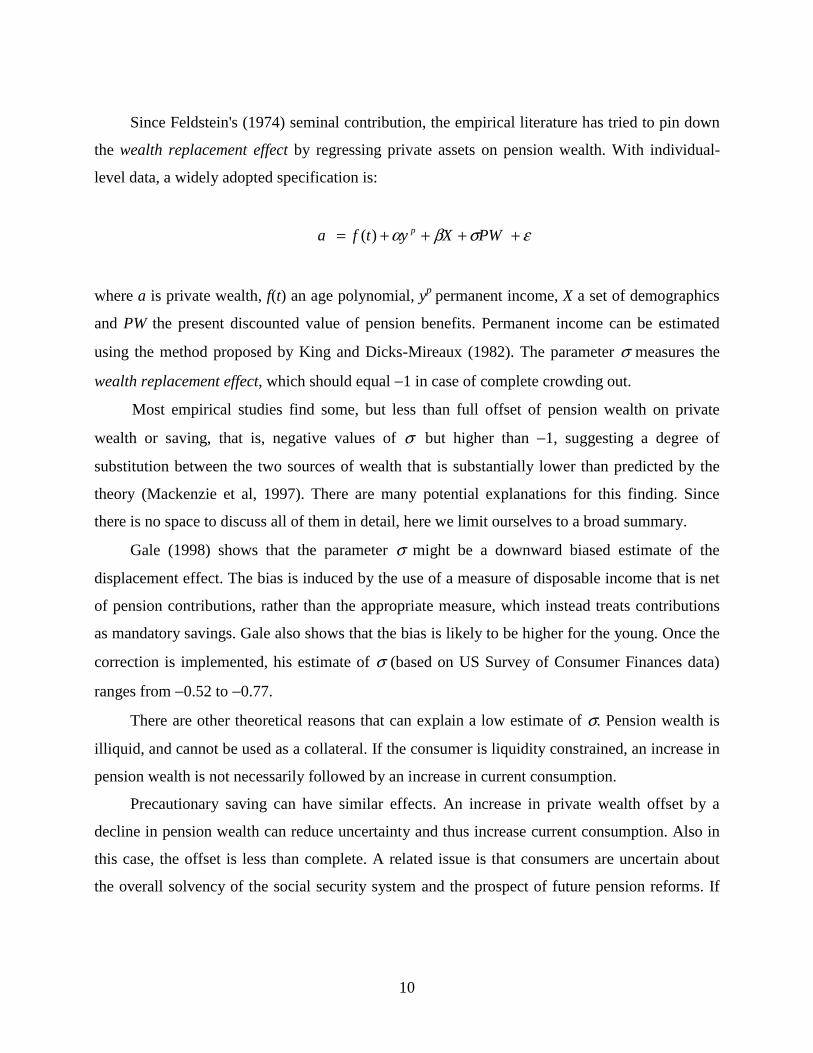
Since Feldstein's (1974) seminal contribution, the empirical literature has tried to pin down
the wealth replacement effect by regressing private assets on pension wealth. With individual-
level data, a widely adopted specification is:
εσβα ++++= PWXytfa p)(
where a is private wealth, f(t) an age polynomial, yp permanent income, X a set of demographics
and PW the present discounted value of pension benefits. Permanent income can be estimated
using the method proposed by King and Dicks-Mireaux (1982). The parameter σ measures the
wealth replacement effect, which should equal −1 in case of complete crowding out.
Most empirical studies find some, but less than full offset of pension wealth on private
wealth or saving, that is, negative values of σ but higher than −1, suggesting a degree of
substitution between the two sources of wealth that is substantially lower than predicted by the
theory (Mackenzie et al, 1997). There are many potential explanations for this finding. Since
there is no space to discuss all of them in detail, here we limit ourselves to a broad summary.
Gale (1998) shows that the parameter σ might be a downward biased estimate of the
displacement effect. The bias is induced by the use of a measure of disposable income that is net
of pension contributions, rather than the appropriate measure, which instead treats contributions
as mandatory savings. Gale also shows that the bias is likely to be higher for the young. Once the
correction is implemented, his estimate of σ (based on US Survey of Consumer Finances data)
ranges from −0.52 to −0.77.
There are other theoretical reasons that can explain a low estimate of σ. Pension wealth is
illiquid, and cannot be used as a collateral. If the consumer is liquidity constrained, an increase in
pension wealth is not necessarily followed by an increase in current consumption.
Precautionary saving can have similar effects. An increase in private wealth offset by a
decline in pension wealth can reduce uncertainty and thus increase current consumption. Also in
this case, the offset is less than complete. A related issue is that consumers are uncertain about
the overall solvency of the social security system and the prospect of future pension reforms. If
11
this is the case, they may revise their social security wealth expectations downward and save
more in the current period.
Another factor that may have a bearing on the wealth replacement effect is the extent of
financial education of the household. Many households have short-run horizons, either because of
liquidity constraints or myopia. They will therefore prefer one dollar of financial wealth rather
than one dollar of pension wealth. Indeed, Gale shows that the displacement effect is stronger for
individuals who contribute to IRAs and for college graduate.
We have neglected so far the possibility that consumers respond to an increase in pension
wealth by retiring earlier (a fact that cannot be captured in the simple two-period model of
Appendix A.2). But according to the life cycle hypothesis saving and wealth increase with the
length of retirement. Feldstein (1977) shows that this induced retirement effect can potentially
invert the sign of the relationship between private and pension wealth (the estimate of σ could be
smaller in absolute value or even turn positive).5
2.2 The effect of mandatory saving on national saving
Tax incentives for pension funds exist in virtually all countries. Most tax codes allow
contributions to pension funds to be made out of pre-tax income, or to attract a tax rebate.
Investment income of pension funds is often allowed to accumulate free of tax. Many countries
even allow some part of the benefits to be paid out tax-free or at a concessionary tax rate.
A regime in which contributions and returns are exempt is a classical example of an
expenditure tax, treating saving as any other form of consumption. On the other hand, a regime in
which contributions are taxed and benefits are exempt corresponds to a regime in which accruals
to both earnings and saving are taxed. In practice, the various tax regimes can have different
effects, depending on the marginal tax rate during the working span and the marginal tax rate at
retirement.
Whitehouse (2000) provides a description of the tax treatment of pensions in the OECD
countries. With the exception of Australia, Iceland, Japan and France, pension contributions are
5 Feldstein notices that such effect tends to be particularly relevant just after the introduction of a pay-as-you-go system, when contributions bear little relation to annuities and workers revise their expectations concerning the age of retirement.

12
made out of pre-tax income or attract a tax rebate. There is always a limit on deductibility of
contributions. In the majority of OECD countries income accruing in the pension fund
accumulates tax free, but there are exceptions. Australia, Denmark, and Sweden tax, partially or
totally, the real return of the fund. On the other hand, all countries except New Zealand tax
withdrawals, although at different degrees. For instance, some countries allow withdrawal of a
tax-free lump sum, while others apply tax penalties to early withdrawals.
Outside the OECD, the tax treatment of pension funds follows similar principles:
contributions and returns are usually exempt, while benefits are taxed. Table 2 describes the main
features of the tax treatment of mandatory contributions to pension funds for a selected group of
Latin American and East Asian countries that have recently reformed their pension systems. In
Argentina, Chile, Colombia, Costa Rica, Mexico and Uruguay contributions and investment
income are exempt, while benefits are taxed. In Latin America the exception is Peru, where
contributions and benefits are taxed but investment income is exempt.
The situation is more heterogeneous in East Asia, where all countries listed in Table 2
feature exempt contributions. In Malaysia, the Philippines and Thailand also pension benefits are
tax-free, while investment income is taxed in the Philippines, Thailand and partly in Indonesia.
Malaysia and Singapore operate a national, public managed, provident fund system, while
Indonesia has a private management structure.
Figure 1 plots histograms of the GDP share of the sum of reserves of mandatory pension
systems and private pension fund assets in selected countries of Latin America, Asia and Africa.
Chile, Malaysia, Singapore and South Africa stand out, with a GDP share of 50 percent or higher.
Pension fund assets are positively associated with the ratio of national saving to GDP, as shown
in Figure 2. One possible interpretation of the positive correlation is that the tax provisions
attached to mandatory saving programs are associated with higher national saving, as in Section
2.1.
Since the positive relation between pension fund assets and national saving might be driven
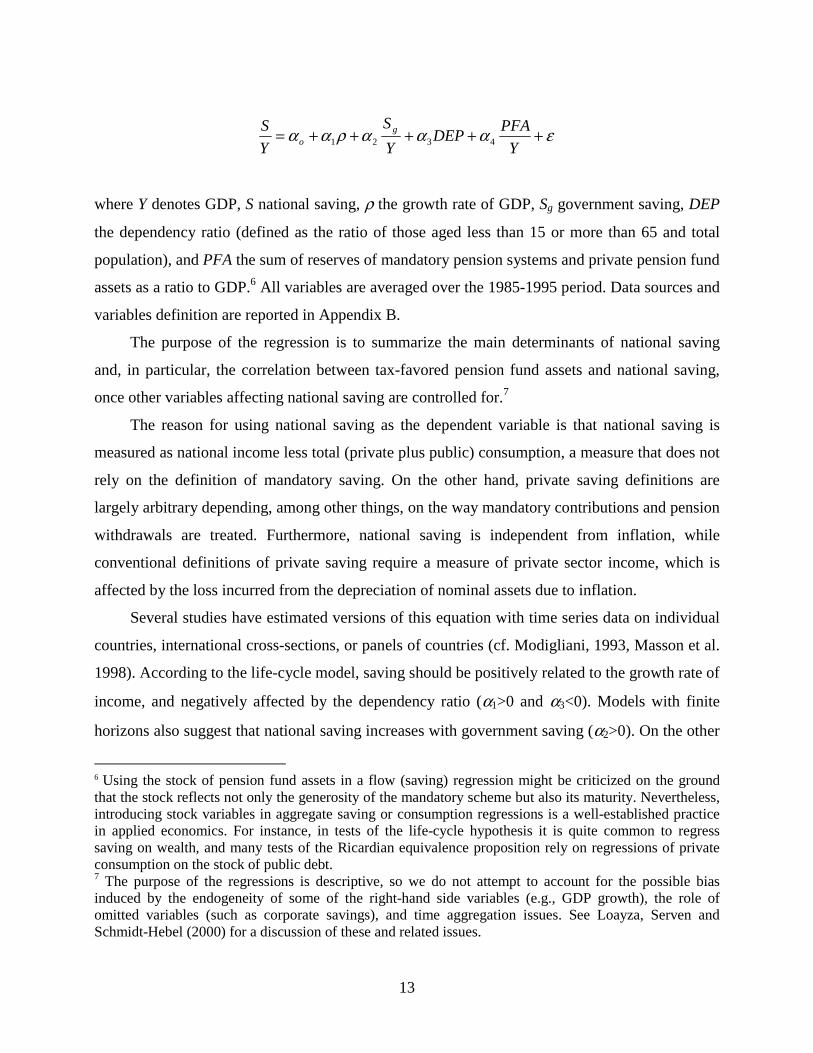
by other variables, we turn to regression analysis and estimate the following reduced form for
national saving:
13
εαααραα +++++=Y
PFADEP
Y
S
Y
S go 4321
where Y denotes GDP, S national saving, ρ the growth rate of GDP, Sg government saving, DEP
the dependency ratio (defined as the ratio of those aged less than 15 or more than 65 and total
population), and PFA the sum of reserves of mandatory pension systems and private pension fund
assets as a ratio to GDP.6 All variables are averaged over the 1985-1995 period. Data sources and
variables definition are reported in Appendix B.
The purpose of the regression is to summarize the main determinants of national saving
and, in particular, the correlation between tax-favored pension fund assets and national saving,
once other variables affecting national saving are controlled for.7
The reason for using national saving as the dependent variable is that national saving is
measured as national income less total (private plus public) consumption, a measure that does not
rely on the definition of mandatory saving. On the other hand, private saving definitions are
largely arbitrary depending, among other things, on the way mandatory contributions and pension
withdrawals are treated. Furthermore, national saving is independent from inflation, while
conventional definitions of private saving require a measure of private sector income, which is
affected by the loss incurred from the depreciation of nominal assets due to inflation.
Several studies have estimated versions of this equation with time series data on individual
countries, international cross-sections, or panels of countries (cf. Modigliani, 1993, Masson et al.
1998). According to the life-cycle model, saving should be positively related to the growth rate of
income, and negatively affected by the dependency ratio (α1>0 and α3<0). Models with finite
horizons also suggest that national saving increases with government saving (α2>0). On the other
6 Using the stock of pension fund assets in a flow (saving) regression might be criticized on the ground that the stock reflects not only the generosity of the mandatory scheme but also its maturity. Nevertheless, introducing stock variables in aggregate saving or consumption regressions is a well-established practice in applied economics. For instance, in tests of the life-cycle hypothesis it is quite common to regress saving on wealth, and many tests of the Ricardian equivalence proposition rely on regressions of private consumption on the stock of public debt. 7 The purpose of the regressions is descriptive, so we do not attempt to account for the possible bias induced by the endogeneity of some of the right-hand side variables (e.g., GDP growth), the role of omitted variables (such as corporate savings), and time aggregation issues. See Loayza, Serven and Schmidt-Hebel (2000) for a discussion of these and related issues.
14
hand, according to the Ricardian equivalence proposition, public and private saving are perfect
substitutes, so that an increase in government saving should not affect national savings (α2=0).
The proposed specification can be used to assess the impact of mandatory and contractual
saving on the national saving rate. The discussion in Section 2.1 highlights that in the absence of
tax incentives pension fund assets are a substitute for private accumulation and should not affect
national saving (α4=0). If instead contributions are favored by the tax code there should be a
positive effect on national saving (α4>0).
Table 3 reports the regression results. The first regression relies on a cross-section of 60
countries for which we could find complete records. The GDP growth rate and the government
saving rate are associated with higher national saving, while an increase in the dependency ratio
reduces national saving. All coefficients are statistically different from zero at the 1 percent level.
These findings are in agreement with previous studies and provide strong evidence for the life-
cycle model. The effect of pension fund assets is positive and statically different from zero in the
LDC countries.8
To check the robustness of our results, we performed a sensitivity analysis allowing for
changes in the estimation method, the definition of government saving, the sample used, and the
omission of other variables potentially affecting national saving. The second specification re-
estimates equation (1) using a robust method to control for the impact of influential values.9 The
third and fourth regressions rely on a definition of inflation-adjusted government saving which is
available for a subset of the countries in our sample.
The last two regressions report OLS and robust estimates based on the 38 LDC countries in
our sample. In no case is the general pattern of results affected. In particular, the coefficient of
pension fund assets ranges from 0.14 to 0.18 percent, and is statistically different from zero at the
1 percent level in all specifications, providing support for the proposition that tax-favored
pension contributions raise national saving, at least in LDC countries. In the sample of LDC
8 Bailliu and Reisen (1997) also find that mandatory funded pensions promote national saving in developing economies. Their findings are consistent with a model based on mandatory contributions and credit constraints faced by low income workers. 9 The robust estimation method performs an initial OLS regression, calculates the Cook's distance, eliminates the gross outliers for which the Cook's distance exceeds 1, and then performs iterations based on Huber weights followed by iterations based on a biweight function (a routine programmed in the STATA econometric software).

15
countries the first quartile of the distribution of pension fund assets is 1.6 percent, and in the third
quartile is 11.2 percent. Our estimates indicate that the thought experiment of increasing pension
fund assets from the first to the third quartile is associated with an increase in national saving by
1.3 to 1.7 percentage points of GDP.
We also include in the baseline specifications a number of additional variables that could
potentially affect the national saving rate: the real interest rate (measured as the difference
between the nominal interest rate on government bills and the actual inflation rate), per capita
income, the Gini coefficient of income inequality, the GDP ratio of social security expenditures
(taken from Palacios and Pallarès-Miralles, 2000), and continental dummies. The coefficients of
these variables are not statistically different from zero.
3. Fostering accumulation of housing
When governments incentive retirement saving, they change household portfolio
allocations, but not necessarily the intertemporal allocation of consumption. If instead the tax
code targets specific goods, such as housing, education or health, it changes not only the margins
of intertemporal choice, but also consumption allocations between different goods. This section
reviews government intervention in the promotion of saving targeted to housing, while Section 4
examines tax incentives to save for education, health and other merit goods.
Programs whose aim is to foster the accumulation of housing take various forms, ranging
from direct government investment, subsidies and contributions to households or firms, and
indirect support for housing accumulation through tax incentives. One rational for government
intervention in this area is the notion that housing is an investment good, hence tax-deductible
capital costs are in principle offset by imputed rental values. In practice the offset is modest, as
the market value on which imputed rents are computed is underestimated (Duebel, 2000). So the
main reason is to shift the portfolio allocation of wealth towards goods to which society assigns
an important weight in alleviating poverty and in raising living conditions, much like targeting
retirement saving is a remedy to household myopia and potential free-riding problems.
This chapter aims at a broad description of tax incentives to save and to borrow, so we do
not discuss direct government intervention in the housing market, but focus on instruments

16
designed to raise household saving for housing finance: mandatory contributions to specially
designed housing funds, contractual saving for housing, subsidies to financial intermediaries
providing housing funds and, in Section 5, mortgage interest rate relief schemes.
In some industrialized countries (notably Austria, Germany, and France), housing finance
has traditionally relied on contractual saving (Impavido, Musalem and Tressel, 2002). According
to these contracts, households save an agreed amount over an extended period at pre-specified
terms. At the end of this period, households are eligible for a loan to purchase or renovate an
owner-occupied house. The saving schemes are characterized by fixed, below-market rates on
savings and subsequent loans. The advantages of contract saving for housing are threefold. First,
they provide adequate information to potential borrowers. Second, they make available funds for
down payment. Finally, they offer protection against volatile financial markets (Lee and Renaud,
1995). The government has a relevant role in these programs, by providing saving premiums and
tax benefits.
The rationale for these programs is that they allow poor households to access mortgage
loans for home purchase that would be otherwise unavailable. This might be even more important
in less developed countries, where many households lack the income to qualify for a loan and/or
financial institutions tend to screen out these households because mortgages require regular
payments over the long run and income stability, conditions that are unlikely to be met by poor
households. Limited competition among financial institutions amplifies these market failures.
In the German Bauspar scheme, the principle is one of reciprocity. Contractual deposits are
mobilized by specialized institutions and only available to make loans to participants. Savers
fulfilling the terms of the contract receive a government interest premium proportional to the
amount saved (up to a maximum).
The French system is traditionally more integrated with capital markets and contractual
saving for housing works similarly to an account with subsidized return. In contrast to the
German model, savers can keep their saving in the housing fund without obtaining the loan if
they find the deposit yield attractive. Deposit institutions can use the deposits to finance housing
loans or purchase bonds in the secondary mortgage market. As in Germany, French savers enjoy
a government interest premium on contractual saving over the banks’ deposit rate. Lee and
Renaud (1995) provide a thorough discussion of pros and cons of contractual saving schemes for

17
housing, and conclude that the success of these programs critically depends on financial and price
stability, two conditions that are seldom met in LDC countries.
Housing banks enjoy a wide range of subsidies, including direct tax-based funding, direct
deposits with tax or regulation preferred status or government guarantees, exemption from
income taxation, stamp duties and lien registration costs. They play a prominent role in several
developing countries, such as Korea, Thailand, Brazil, Argentina, Venezuela, Jordan, India and
Indonesia (Duebel, 2000).
But the most striking programs to foster the accumulation of housing are mandatory
contributions to housing funds, widespread in several Latin American and Eastern Asian
countries. Table 4 reports the main features of these programs. They differ quite widely in the
amount of contributions, eligibility and loan characteristics. Contributions to housing funds are
usually based on payroll tax, with one notable exception: in Argentina, contributions are no
longer from income payroll tax but from the fuel consumption tax.
Many of these programs were not originally earmarked towards housing, but have evolved
to allow contributors to withdraw funds for home purchase. For instance, in Brazil the FGTS
(Fundo de Garantia de Tempo de Serviço) was established in 1967 as a severance pay fund in the
case of termination without just cause. It requires employers to deposit a (tax-deductible) 8.3
percent of the worker’s pay in a restricted saving account in this Fund, managed by the National
Housing Bank, in the names of their employees. The account earns interest of 3 percent per year
in addition to a monthly adjustment to compensate for inflation.10 Employees may withdraw the
balances in these bank accounts if they have been dismissed without just cause, if the firm is
liquidated, at retirement, or to purchase a personal residence under a government-approved
housing financing scheme. In case of dismissal without just cause the employer has been obliged
to pay to the employee an additional amount equivalent to 40 percent of the accumulated balance
in the employee’s FGTS bank account.11
10 In the early 1970s the Brazilian government introduced also a housing saving account that was exempt from income tax and indexed to inflation. 11 At the time of writing, the Brazilian Parliament is discussing reducing the contribution rate to FGTS from the present 8.3 percent to a 2 percent level. Moreover, in case of lay-offs the employer will not have to give severance pay or pay the 40 percent penalty to the FGTS.
18
Mandatory saving is sometimes targeted to both retirement and housing. Table 5 lists some
selected examples around the world. In Malaysia, for instance, accumulated Employees Provident
Funds can be used to serve retirement purposes (60 percent), home purchase (30 percent), and
even medical expenses (10 percent). Similar provisions, subject to limits, exist in Colombia and
other Asian countries.
The stated targets of most mandatory savings programs for housing are low-income
households. However, experts have lamented that most of the social/public housing projects have
in practice favored middle-income rather than poor households. In Venezuela only 8 percent of
households contributing to the Ahorro Habitaçional fund have actually received a housing unit
(under the Ley of Politica Habitaçional). In Mexico, INFONAVIT has assisted little more than
11 percent of households contributing to the fund. In Peru, the FONAVI fund has been in effect
no more than an additional payroll tax imposed on employers.12 Experts have also noted that
mandatory contributions to housing funds tend distort credit markets and inhibit their
development.
4. Targeting merit goods: education, health, and life protection
Virtually all industrialized countries provide some form of tax incentives for saving toward
education, tax deductibility of educational expenses, health and life insurance premiums, and out-
of-pocket medical expenses. Education, health, and life protection can be regarded as merit goods
and, in the case of education and health, long-term growth enhancing factors. These programs are
absent or of negligible importance in less developed countries. Table 6 describes the features of
some of these programs and tax provisions for selected countries.
A striking addition to the wide range of tax concessions and other government interventions
already influencing the college tuition motive for saving in the United States (cf. Feldstein, 1995,
Souleles, 2000), is the Education IRA, introduced by the Taxpayer Relief Act of 1997. Under
12 In the late 1990s the Fujimori government transformed the housing fund into an "Emergency Solidarity Tax" and, after January 2000, the new government phased out the mandatory contribution scheme because of its unpopularity.
19
this scheme an annual, non-deductible contribution of up to $500 per year per child (tapered for
high-income households), may be invested until the child reaches age 18. Withdrawals to pay for
college expenses for the child are tax-free.
In most European countries schools are public and higher education funded by general
taxation with limited tuition fee expenses, and accordingly a lower need to save to meet this
capital outlay. Nevertheless, in some countries private education expenses receive some limited
tax advantage (as in Germany and Italy).
The tax code also influences the demand for health insurance. Major health expenses are
tax deductible in a handful of countries, particularly where the government-provided healthcare
system is absent or deemed to be of poor quality. In the US, out-of-pocket medical expenditures
above a threshold (currently 7.5 percent of adjusted gross income) can be deducted from adjusted
gross income; but this excluded health insurance premiums paid by employees. In Italy both
private health insurance premiums and a limited amount of out-of-pocket medical expenses are
tax deductible. Among developing countries, Argentina, India and Taiwan offer tax deductibility
of private long-term health insurance subject to some limits.
Finally, several countries’ tax systems contain provisions to incentive life insurance
contributions.13 Many life insurance contracts are structured to embody a significant element of
saving with only a modest insurance component. Typically, the tax advantages are granted only
if the investors commit to long-term contracts, which can be seen as a substitute for retirement
saving.14 Tax deductibility tends to be operative on the financial component of the contract,
rather than on the pure insurance component – though Canada provides an exception in this
respect.
In the United States accumulated reserves in life insurance contracts are relatively
unimportant because returns tend to be lower than the pretax return on the assets that back the
policies because of administrative costs. In Italy, life insurance premiums were partly tax-
deductible between 1987 and 2000, but the tax system did not discriminate between the saving
and the insurance component. The 2000 tax reform maintains incentives only for the financial
13 See Poterba (1994) for an overview of saving through insurance contracts in G7 countries. 14 For instance, in Italy, France and Japan tax deductibility of premiums is available only for contracts 5 years or longer.
20
component.15 In developing countries (such as Argentina, India, Singapore and Taiwan) tax
systems feature partial tax deductibility of contributions to life insurance policies.16
From a public policy perspective it would be interesting to know how the schemes
discussed above compare with non-financial based incentives that achieve the same broad goals;
for instance, comparing the effectiveness of tax incentives for education with direct subsidies, or
tax deductibility of health-related expenses with deductibility of health insurance premiums.
Which types of scheme are most effective in enhancing education or improving health standards;
which are prone to abuse; and what are the redistributive impact and macroeconomic
consequences of the different incentive regimes. So far the evidence is scant, particularly in
developing countries, preventing clear-cut policy advice in this area.
5. Incentives to borrow
In many developed countries tax incentives to save co-exist with tax incentives to borrow in
the form of tax deductibility of interest payments. Such allowances may have important
implications for the structure of household portfolios and for the overall level of saving. For
instance, in almost all EU countries and in the US a portion of mortgage interest rate payments is
tax deductible (Maclennan, Muellbauer and Stephens, 1998). One the other hand, few countries
offer tax incentives for consumer credit and educational loans (see also Section 4 for details on
education).
Table 7, drawn from Poterba (2001), summarizes the type of borrowing incentives for
house purchase and consumer credit that exist in nine major OECD countries. Due to the low
level of development of credit markets, such programs are seldom present in less developed
countries.
15 Jappelli and Pistaferri (2002) find that there is little responsiveness of contributors’ decision to invest to changes in the return of the policy induced by changes in the tax deductibility of the premiums. 16 Many countries tax bequests. Among developing countries, Brazil, Chile and Singapore do; India, Indonesia and Mexico don’t; Argentina levies a transfer fee on the beneficiary. Critics of the estate tax claim that it has an adverse effect on investment and saving, as it raises the cost of capital and it makes it harder for family businesses to survive the deaths of their founders.
21
Only one of the nine nations, the Netherlands, currently allows tax deduction for consumer
credit, subject to a limit (in Sweden tax deductibility of consumer credit was phased out in 1991).
Households can deduct mortgage interest payments in five out of nine nations. In the United
Kingdom the tax deduction has been phased out in April 2000 (see below). In Japan taxpayers
are not allowed to deduct mortgage interest payments, but enjoy a special tax credit for first-time
home purchase, subject to a time limit. Three countries, the United States, the Netherlands, and
France, allow relatively unrestricted deductions for mortgage interest, and a fourth, Italy, allows
mortgage interest deductions for first-time homeowners only. In the United States, households
cannot deduct interest on more than $1,000,000 of mortgage debt, and in practice this constraint
rarely binds. In light of this cross-sectional heterogeneity in tax rules, one should expect
households to allocate a greater share of their portfolios to housing assets in the U.S., France, and
the Netherlands, and to rely more on mortgage debt in these countries, than in other nations.
Tax deductibility of loan payments reduces the after-tax interest rate paid on the loan.
Theoretically, for net borrowers the effect and substitution effects discussed in Appendix A.1 go
in the same direction: an increase in the interest rate increases interest payments (the income
effect) as well as the relative price of current consumption with respect to future consumption
(the substitution effect). For both reasons, borrowing and current consumption decline. Thus, on
theoretical grounds the removal of tax incentives to borrow should be accompanied by a fall in
debt (i.e., an increase in saving). Yet, tax incentives to borrowing have been the subject of much
less investigations than incentives to save. Ideally, such investigation should be carried out at the
microeconomic level, exploiting the variability induced by tax reforms that change incentives to
borrow for different household groups.
A good example in this respect is the UK MIRAS (Mortgage Interest Relief at Source)
experiment. Before then, there were two sources of potential cross-sectional variability.
Mortgagers received tax relief on the interest on the first £30,000 of a mortgage; the tax relief
was increasing with the marginal tax rate. Moreover, until 1988 the £30,000 limit applied on
single mortgagers rather than the property, i.e. unmarried people could each receive relief on
loans up to £30,000, including more than one on the same property. In 1988 the government
eliminated such distortion. According to Hills (1990) this tax change, advertised five months in
advance, was a contributory factor to the overheating of the UK housing market in 1988.
22
The model in Appendix A.3 shows that quantity constraints on borrowing generally distort
the intertemporal consumption profile. In practice, policy makers might still want to discourage
household borrowing, because they might target saving and investment at the expenses of
consumption. The experience of several developed countries is consistent with argument. For
instance, in South Korea and Taiwan selective credit ceilings have been placed on mortgage loans
with the explicit aim of fostering industrial investment.17
Conclusions
We began this survey with the consideration that there are good reasons for encouraging
household saving. First of all, there is considerable evidence that even in closed economies or
economies with imperfect capital mobility, higher saving leads to more productive investment
and ultimately wider economic development. A second compelling argument for promoting
pension funds and the life insurance industry is that the contractual savings industry can have a
favorable impact on the diversity and efficiency of the financial system, contributing to the
establishment of so-called popular capitalism, enhancing the incentives to perform of individuals
with a direct stake in the holding of risky financial assets.
While the arguments in favor of promoting saving are widely accepted and theoretically
compelling, there is less consensus on the ways to achieve this goal and on the interpretation of
the empirical evidence. A first issue is whether governments should rely on tax incentives to
retirement saving −but leave the ultimate decision to the individual consumers− or on mandatory
retirement programs.
Tax incentives to save can be justified on the ground that they do not distort the
intertemporal choice between consumption and saving: a regime in which contributions and
17 This is witnessed by country studies. Park (1991) argues: "One advantage of the repressive financial system in Korea, and to a lesser degree in Taiwan, may have been its ability to supply long-term finance. [...] Without government intervention the profit-oriented behavior of the commercial banks would have resulted in the dearth of long-term finance" (p. 41).
23
returns are tax-exempt treats saving as any other form of consumption. However, in practice this
is not the case, as shown in Section 2, because in most countries the tax code does not achieve
neutrality. And there is considerable empirical debate as to the effectiveness of tax incentives in
promoting saving: most studies conclude that tax incentives affect the allocation of household
portfolios, but the effect on the amount saved is less clear-cut. Tax incentives raise also serious
distributional issues, particularly in developing countries, as only individuals in the upper tail of
the income distribution have the resources and the financial information required to take
advantage of the incentives. Finally, tax incentives have a cost in terms of revenue losses. To the
extent that losses are shared more equally than gains, tax incentives to save might affect
adversely the distribution of resources in the economy. For these reasons, promoting voluntary
saving might not be the right instrument in achieving the goals outlined above.
On the other hand, mandatory saving programs avoid the free-riding problems that would
arise if individuals were free to choose the amount of saving; they force even myopic individuals
to set aside resources to be spent during retirement. If the policy goal is to increase investment
and growth and promote popular capitalism, mandatory saving programs are more likely to
succeed than voluntary saving schemes, even at the cost of distorting the intertemporal allocation
of resources that households would choose otherwise.
Besides retirement saving, there is a wide range of instruments that governments apply to
promote saving for specific goods (housing, education and health). The widest area of
intervention is housing, where the most striking instruments are mandatory contributions to
provident funds designed to accumulate resources for a down payment against home purchase.
Several countries also encourage saving for education and medical expenditures, while still others
encourage (or discourage) borrowing. At the moment, the interplay between these different
saving instruments, their distortionary impact on household portfolios and, ultimately, their
effectiveness in achieving sectoral and macroeconomic goals have been subject to much less
empirical studies. A priori, one can expect considerable portfolio effects from these programs,
but in the absence of detailed studies it is difficult to evaluate their overall effectiveness. For
instance, mandatory saving programs for housing clearly raise the share of wealth allocated to
housing. However, the effectiveness in raising the overall homeownership and saving rates can be
24
undermined by displacement effects on other forms of wealth, bureaucratic costs in managing the
provident funds, government revenue costs and the associated distributional impacts.
There is ample ground for detailed studies on these and related issues, but at the moment
the evidence is scant, particularly in developing countries, preventing clear-cut policy advice in
this area. The studies would require microeconomic surveys to sort out individuals affected and
not affected by the tax incentives, and detailed data on the composition of household portfolios to
track the response of the individual wealth components to the presence of incentives to housing,
health, education and borrowing.
While the discussion above applies to developed and developing countries alike, we would
like to conclude singling out two issues that are likely to be of particular importance in
developing countries. The evidence for developing countries indicates that pension coverage is
far from complete. Extending pension coverage, and the associated tax benefits, might be far
more important than introducing sophisticated saving incentives. Besides affecting national
saving, pension coverage can have a number of other effects, for instance in raising the
attachment of workers to firms and labor productivity. Needless to say, financial transaction costs
are high in many developing countries.18 These costs are compounded by judicial and
bureaucratic costs, which in many countries represent a hidden tax on business and financial
transactions (Djankov et al. 2002). This implies that the return and incentive to save can be
increased by making the environment more competitive and efficient without resorting to explicit
tax instruments.
18 One example are migrants’ remittances, an important source of saving for developing countries. IADB (2002) presents evidence that a typical Latin-American migrant in the US remits 15 percent of her wages; however, transfer costs (which include transfer fee, exchange rate commission, check cashing fees, and other charges at the point of receipt) absorb about 15 percent of any sum transferred.
25
Appendix A: Analytical framework for assessing the impact of tax incentives on saving
This Appendix sets out a simple model of saving and examines the impact of tax incentives.
A.1. Two period-model of saving
To provide a background to some of the issues analized in Section 2, it is useful to
consider the effect of changes in the after-tax return to saving in the simplest intertemporal choice
model. Consider the standard two-period consumption model, where the individual maximizes
utility
),( max 21 ccu
subject to an intertemporal budget constraint:
112
1121
1 )1(1)1(1ha
r
yya
r
cc +=
−+++=
−++
θθ
where c1 and c2 denote, respectively, first and second period consumption, a1 indicates
beginning-of-period wealth, and h1 human capital, i.e., the present discounted value of current
and future (after-tax) income. The individual receives r(1−θ) on resources carried on from the
first period to the second, where r is the real rate of interest and θ the tax rate on asset income.
The standard assumption is that the utility function is concave, and that the marginal utility
of consumption is positive and decreasing, that is 0/(.) >∂∂ jcu , 0/(.) 22 <∂∂ jcu , for j=1,2. The
first order condition of the maximization problem is:
)1(1/(.)
/(.)
2
1 θ−+=∂∂∂∂
rcu
cu
26
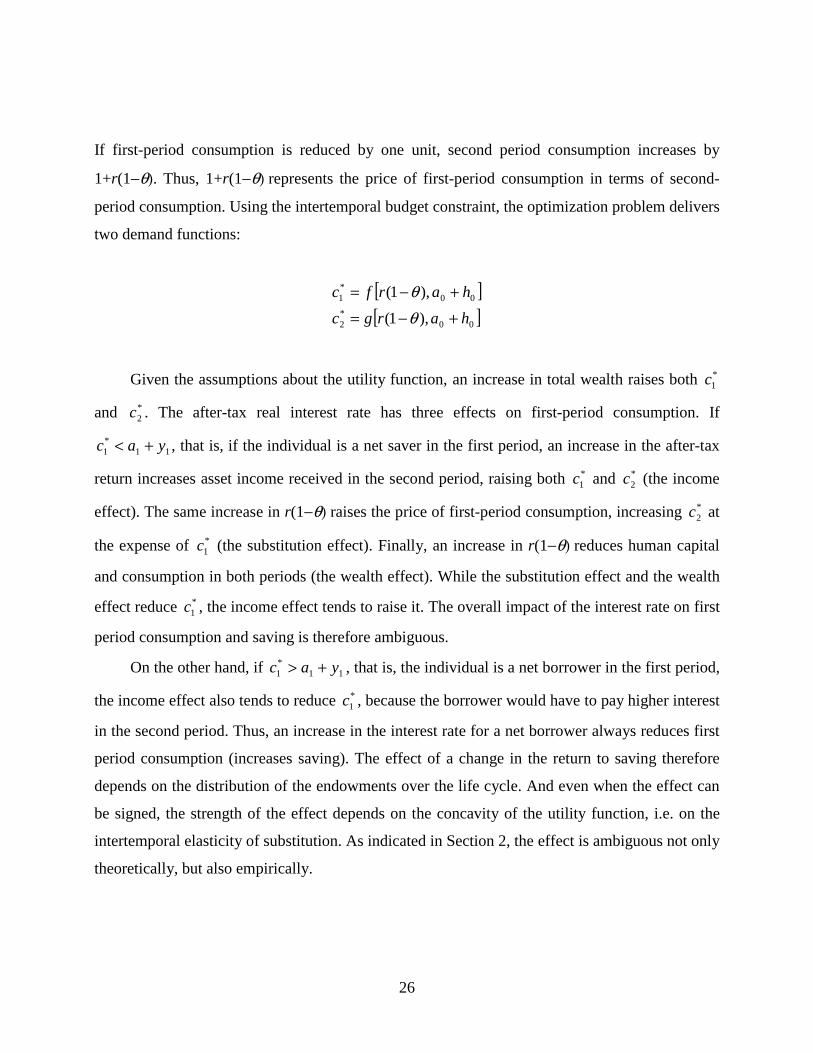
If first-period consumption is reduced by one unit, second period consumption increases by
1+r(1−θ). Thus, 1+r(1−θ) represents the price of first-period consumption in terms of second-
period consumption. Using the intertemporal budget constraint, the optimization problem delivers
two demand functions:
[ ][ ]00
*2
00*1
),1(
),1(
hargc
harfc
+−=
+−=
θθ
Given the assumptions about the utility function, an increase in total wealth raises both *1c
and *2c . The after-tax real interest rate has three effects on first-period consumption. If
11*1 yac +< , that is, if the individual is a net saver in the first period, an increase in the after-tax
return increases asset income received in the second period, raising both *1c and *
2c (the income
effect). The same increase in r(1−θ) raises the price of first-period consumption, increasing *2c at
the expense of *1c (the substitution effect). Finally, an increase in r(1−θ) reduces human capital
and consumption in both periods (the wealth effect). While the substitution effect and the wealth
effect reduce *1c , the income effect tends to raise it. The overall impact of the interest rate on first
period consumption and saving is therefore ambiguous.
On the other hand, if 11*1 yac +> , that is, the individual is a net borrower in the first period,
the income effect also tends to reduce *1c , because the borrower would have to pay higher interest
in the second period. Thus, an increase in the interest rate for a net borrower always reduces first
period consumption (increases saving). The effect of a change in the return to saving therefore
depends on the distribution of the endowments over the life cycle. And even when the effect can
be signed, the strength of the effect depends on the concavity of the utility function, i.e. on the
intertemporal elasticity of substitution. As indicated in Section 2, the effect is ambiguous not only
theoretically, but also empirically.

27
A.2. The tax treatment of mandatory contributions
In this Appendix we study the effect of deductibility of mandated contributions on the
composition of household wealth and on the overall level of saving. We consider a standard
overlapping generations model, where households maximize utility and are subject to a general
income tax rate τ and to a mandatory contribution to a fully funded pension fund µ. In the first
period income taxes and mandated contributions are a fixed proportion of wages. In the second
period, capital income and pension benefits are taxed at the same general income tax rate τ. We
analyze two cases. In a first scenario, pension contributions are levied on first-period income and
are not tax deductible. In the second scenario, contributions are fully tax-deductible.19 We assume
throughout that the contribution rate does not exceed the propensity to save that would prevail in
the absence of pensions.
The effect of mandated pension contributions on national saving arises from the tax
treatment of contributions, and does not require that saving responds positively to changes in
interest rates. In fact, we consider the log-utility case in which income and substitution effects
cancel each other out. Since second period income is zero by assumption, there is no wealth
effect. Consumers solve the problem:
max lnct,t +βln ct,t+1
In the first scenario, with a mandated pension fund yielding the same return as private savings,
the budget constraints in the two periods are:
[ ]( ) ( )[ ]µττµµτ
tp
ttttptt
ot
tp
tyt
wsrwrsrc
wsc
+−+=−+++=
−−=+
++++ 1)1(1)1()1(
)1(
1111
The intertemporal budget constraint is:
19 We do not examine a situation in which contributions are not tax deductible but benefits are tax exempt, because it is rarely observed in practice.
28
( ) ( )ττ
−=−+
++
+ 11)1( 1
1t
t
oty
t wr
cc
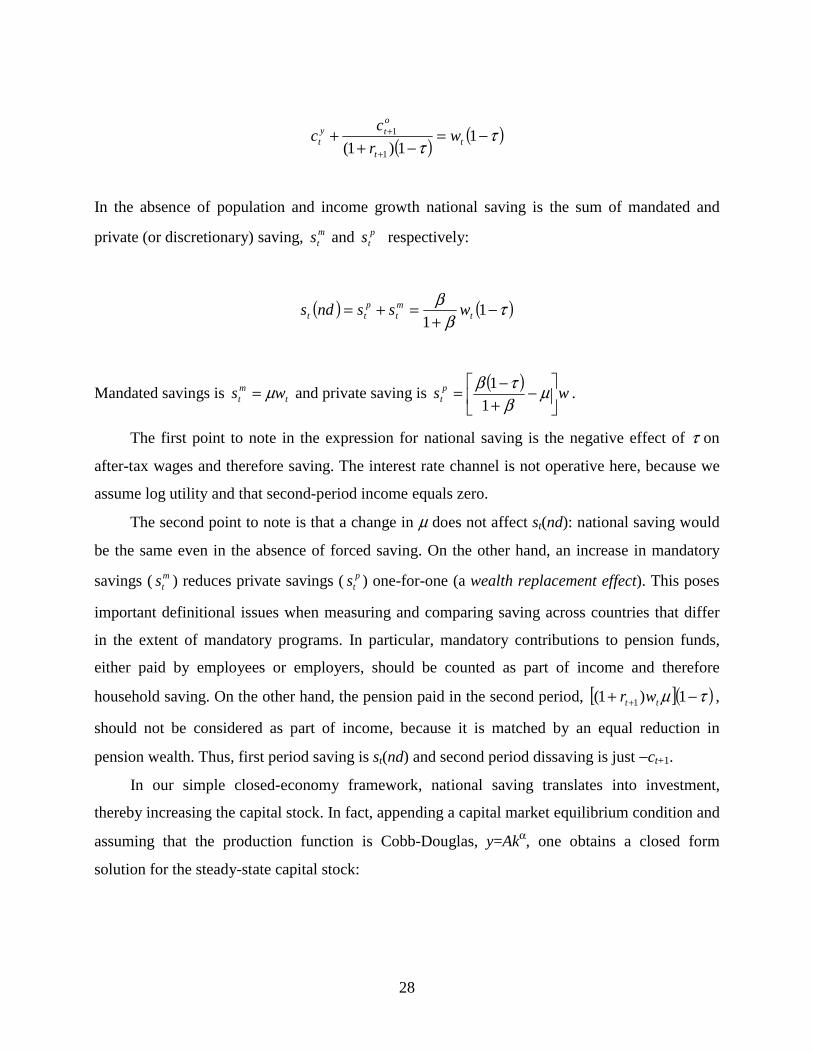
In the absence of population and income growth national saving is the sum of mandated and
private (or discretionary) saving, mts and p
ts respectively:
( ) ( )τβ
β −+
=+= 11 t
mt
ptt wssnds
Mandated savings is tmt ws µ= and private saving is
( )ws p
t
−
+−= µβτβ
1
1.
The first point to note in the expression for national saving is the negative effect of τ on
after-tax wages and therefore saving. The interest rate channel is not operative here, because we
assume log utility and that second-period income equals zero.
The second point to note is that a change in µ does not affect st(nd): national saving would
be the same even in the absence of forced saving. On the other hand, an increase in mandatory
savings ( mts ) reduces private savings ( p
ts ) one-for-one (a wealth replacement effect). This poses
important definitional issues when measuring and comparing saving across countries that differ
in the extent of mandatory programs. In particular, mandatory contributions to pension funds,
either paid by employees or employers, should be counted as part of income and therefore
household saving. On the other hand, the pension paid in the second period, [ ]( )τµ −+ + 1)1( 1 tt wr ,
should not be considered as part of income, because it is matched by an equal reduction in
pension wealth. Thus, first period saving is st(nd) and second period dissaving is just −ct+1.
In our simple closed-economy framework, national saving translates into investment,
thereby increasing the capital stock. In fact, appending a capital market equilibrium condition and
assuming that the production function is Cobb-Douglas, y=Akα, one obtains a closed form
solution for the steady-state capital stock:

29
α
βατβ −
+
−−=1
1
1
)1)(1()(
Andk
As with the national saving, the steady-state capital stock is decreasing in τ and unaffected by the
contribution rate µ.
Consider now a situation in which contributions to mandatory pension funds are tax-
exempt, so that the income tax is computed on income net of the contribution. As we shall see,
this is the standard case in most industrialized and developing countries. The budget constraints
in the two periods are:
( )( ) ( )( )µττµ −−=−−=+ 111 tttp
tyt wwwsc
( )( )µτ tp
ttot wsrc +−+= ++ 1)1( 11
and the resulting intertemporal budget constraint is:
( ) ( )[ ]τµττ
+−=−+
++
+ 11)1( 1
1t
t
ot
t wr
cc
National saving is then:
( ) ( )[ ]τµτβ
β +−+
= 11 tt wds
By comparing the two expressions for national saving one sees that saving is higher in the
economy where contributions are tax deductible:
( ) ( ) ttt wndsds µτβ
β+
=−1

30
The difference in national saving depends on the contribution rate and on the tax rate. For
reasonable values of µ and τ, saving can be substantially higher in an economy with tax-
deductible contributions. By appending a capital market equilibrium condition one can also
derive the steady-state capital stock:
[ ] α
βατµτβ −
+
−+−=1
1
1
)1()1()(
Adk
which is clearly higher in the economy with tax-deductible contributions.
Often only a fraction of the workforce contributes to pension funds. Denoting this fraction
by λ, national saving is a weighted average of the saving of contributors and non-contributors.
While the fraction does not affect national saving in the economy with no deductions, when
contributions are tax-deductible national saving increases with pension fund coverage:
( ) ( )[ ]{ }λτµτλτβ
β +−+−−+
= 1)1(11 ttt wws
One can extend this simple framework in several directions. In endogenous growth models
(for instance, models where output is a linear function of the capital stock), the growth rate of the
capital stock and of national income, rather than the levels of the two variables, increases with
pension coverage and with the mandatory contribution rate.
We have implicitly assumed that the tax rate finances government consumption that is
simply wasted. But in more realistic setups government expenditure might impact the
productivity of the private sector. If the government budget is balanced, one can show that in an
economy with tax-deductible contributions the required tax rate is lower than in an economy
without deductions. Equivalently, that for given tax rate, the capital stock is higher in the
economy with deductions. However, during the transition to a tax-favored regime, even though
the tax treatment of mandatory contributions promotes pension saving, it might defer government
revenues. Finally, we have considered only dynamic efficient economies. In dynamically

31
inefficient situations eliminating tax deductions is one way to approach the golden rule of capital
accumulation.
A.3. The effect on national saving of tax incentives for borrowing
To see the implications on national saving of changes in incentives to borrow, consider a
simple overlapping generations model with two types of individuals: a fraction λ with
endowments in the first period and nothing in the second (net savers), and a fraction (1-λ) with
endowments only in the second period (net borrowers). Assume for simplicity that the proportion
of the two types in the population is exogenous. Net borrowers borrow from net savers in the first
period, and repay their debt in the second period. This framework requires only minimal change
in assumptions and notation with respect to the model in Appendix A.2.
Net borrowers face an interest rate on borrowing given by (1+rb)=(1+r)(1+φ−θ), where φ is
the cost of financial intermediation (assumed exogenous) and θ is the tax incentives (say,
deductibility of consumer credit or mortgage interest); for simplicity, we assume that φ is wasted
during the intermediation process. Net savers face an interest rate on lending equal to r. Assume
also that rb>r (that is, φ>θ ). First period saving of the "net savers" is:
tlt ws
ββ+
=1
First period saving of "net borrowers" is negative:
)1)(1(1
1 1
θφβ −+++−= +
r
ws tb
t
Clearly, raising the incentive θ will reduce the interest rate on borrowing, increase debt and
therefore reduce saving. Note that 21 )1( uru i+= β where for a net borrower ri is the lending rate
and for a net saver it is the lending rate; thus, the Euler equation implies that individual
consumption growth is higher for net borrowers than for net savers.
Aggregate wealth in period t is the sum of the saving of the savers, and the dissaving of the
borrowers:
32
)1)(1(
)1(
1
1
1)1( 1
τφλ
βλ
ββλλ
−++−
+−
+=−+ +
r
NwNwsNsN tt
ttbtt
ltt
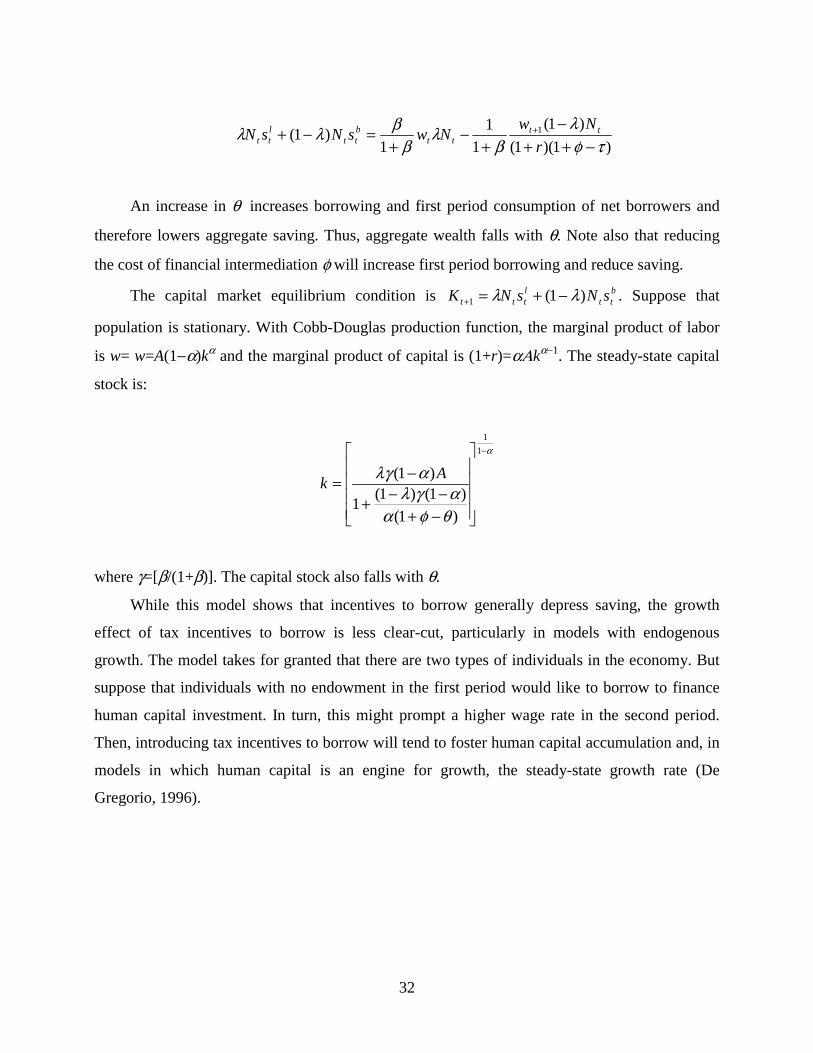
An increase in θ increases borrowing and first period consumption of net borrowers and
therefore lowers aggregate saving. Thus, aggregate wealth falls with θ. Note also that reducing
the cost of financial intermediation φ will increase first period borrowing and reduce saving.
The capital market equilibrium condition is btt
lttt sNsNK )1(1 λλ −+=+ . Suppose that
population is stationary. With Cobb-Douglas production function, the marginal product of labor
is w= w=A(1−α)kα and the marginal product of capital is (1+r)=αΑkα−1. The steady-state capital
stock is:
α
θφααγλ
αλγ−
−+−−+
−=
1
1
)1(
)1()1(1
)1( Ak
where γ=[β/(1+β)]. The capital stock also falls with θ.
While this model shows that incentives to borrow generally depress saving, the growth
effect of tax incentives to borrow is less clear-cut, particularly in models with endogenous
growth. The model takes for granted that there are two types of individuals in the economy. But
suppose that individuals with no endowment in the first period would like to borrow to finance
human capital investment. In turn, this might prompt a higher wage rate in the second period.
Then, introducing tax incentives to borrow will tend to foster human capital accumulation and, in
models in which human capital is an engine for growth, the steady-state growth rate (De
Gregorio, 1996).

33
Appendix B: Data used in the estimation Data used in the regressions for national saving can be downloaded from ftp://monarch/worldbank.org/pub/prddr/outbox. National Saving is defined inclusive of all external transfers. Public sector data refer to central government. The definition of the public sector is that of consolidated central government, i.e. budgetary central government plus extra-budgetary central government plus social security agencies. This definition thus excludes local and regional governments. A detailed description of the data set can be found in Schmidt-Hebbel and Servén (1999). The original database includes 150 countries and spans the years 1960 to 1995. For each country, we take the 1985-1995 average. Each series consists of an Excel file; the files we have used are given in the table below. Data for pension fund assets and public expenditure on pensions are drawn from Palacios and Pallarès-Miralles (2000).
Variable File Gross national saving as a share of GDP FORMU333.XLS Government saving as a share of GDP FORMU342.XLS GDP at current prices FORMU16.XLS GDP at 1987 prices FORMU17.XLS Total population CONST263.XLS Population younger than 15 CONST264.XLS Population older than 65 CONST265.XLS Dependency ratio (CONST264.XLS+ CONST265.XLS)/ CONST263.XLS Pension fund assets as a share of GDP Sum of reserves of mandatory pension systems and private
pension fund assets as a share of GDP. Source: Palacios and Pallarès-Miralles (2000).
Public expenditure on pensions as a share of GDP
Includes all government expenditures on cash transfers to the elderly, the disabled, and survivors and the administrative costs of these programs. Source: Palacios and Pallarès-Miralles (2000).
Countries used in estimation for national saving Argentina, Australia, Austria, Belgium, Belize, Bolivia, Brazil, Canada, Chad, Chile, Colombia, Costa Rica, Denmark, Ecuador, Egypt, El Salvador, Ethiopia, Finland, France, Gambia, Germany, Ghana, Greece, Honduras, India, Indonesia, Ireland, Italy, Jamaica, Jan, Jordan, Kenya, Luxembourg, Malaysia, Mauritius, Mexico, Morocco, Namibia, Nepal, Netherlands, Norway, Paraguay, Peru, Philippines, Portugal, South Africa, Senegal, Singapore, Spain, Sri Lanka, Swaziland, Sweden, Switzerland, Tanzania, Tunisia, UK, USA, Uganda, Uruguay, Zambia.
34
References
Alessie, Rob, Stefan Hochguertel and Arthur van Soest (1997), "Saving Accounts versus Stocks
and Bonds in Household Portfolio Allocation," Scandinavian Journal of Economics 99, 81-97.
Bailliu, Jeanine and Helmut Reisen (1997), “Do funded pensions contribute to higher savings? A
cross-country analysis”, OECD Development Center Technical Papers 130. Bernheim, Douglas B. (2000), "Taxation and Saving," in Handbook of Public Economics, Alan J.
Auerbach and Martin Feldstein eds. Amsterdam: Elsevier Science Publisher. Besley, Timothy, and Costas Meghir (1999), "Tax Based Saving Incentives." London: London
School of Economics, mimeo. Cagetti (2001), "Interest Elasticity in a Life-Cycle Model with Precautionary Saving," American
Economic Review Papers and Proceedings 91, 418-21. De Gregorio, Josè (1996), "Borrowing Constraints, Human Capital Accumulation and Growth,"
Journal of Monetary Economics 32, 79-104. Djankov, Simeon, Rafael La Porta, Florencio Lopez-de-Silanes, and Andrei Schleifer (2002),
"Courts: the Lex Mundi Project." NBER Working Paper 8890. Duebel, Achim (2000), "Separating Homeownership Subsidies from Finance." Washington: The
World Bank, mimeo. Engelhardt, Gary V. (1996), "Tax Subsidies and Household Saving," Quarterly Journal of
Economics 111, 1237-68. Engen, Eric M., William G. Gale and John Karl Scholz (1996), "The Illusory Effects of Saving
Incentives on Saving," Journal of Economic Perspectives 10 (Fall), 113-38. Feldstein, Martin S. (1976), "Personal Taxation and Portfolio Composition: An Econometric
Analysis,'' Econometrica 44, 631-649. Feldstein, Martin (1995), "College Scholarship Rules and Private Saving", American Economic
Review 85. Hills, John (1990), Unraveling Housing Finance. Oxford: Clarendon Press. Holzmann, Robert, Ian W. Mac Arthur and Yvonne Sin (2000), "Pension Systems in East Asia
and the Pacific: Challenges and Opportunities." The World Bank, mimeo.
35
Honohan, Patrick (2000), "Financial Policies and Household Saving," in The Economics of
Saving and Growth, Klaus Schmidt-Hebbel and Luis Servén, eds. Cambridge: Cambridge University Press.
Impavido, Gregorio, Alberto R. Musalem and Thierry Tressel (2002), “Contractual Savings,
Capital Markets and Firms’ Financing Choices”, forthcoming in S. Devarajan and H. Rogers (Eds.), Economist Forum 2001, The World Bank.
Jappelli, Tullio, and Marco Pagano (1994), "Saving, Growth and Liquidity Constraints,"
Quarterly Journal of Economics 106, 83-109. Jappelli, Tullio, and Luigi Pistaferri (2002), "Tax Incentives and the Demand for Life Insurance:
Evidence from Italy," Journal of Public Economics, forthcoming. King, Mervin A., and Jonathan I. Leape (1998), "Wealth and Portfolio Composition: Theory and
Evidence," Journal of Public Economics 69, 155-193. Lee, Michael J., and Bertrand Renaud (1995), "Contract Saving for Housing: How Suitable are
they for Transitional Economies?" Washington: The World Bank, mimeo. Loayza, Norman, Luis Serven, and Klaus Schmidt-Hebel (2000), “What drives private saving
across the world?”, The Review of Economics and Statistics 82, 165-81. Mackenzie, George A., Philip Gerson, and Alfred Cuevas (1997), "Pension Regimes and
Saving," Occasional Paper n. 153. Washington: International Monetary Fund. Maclennan D., John Muellbauer, and M. Stephens (1999), "Asymmetries in Housing and
Financial Market Institutions and EMU," CEPR Discussion Paper n. 2062. Madrian, Brigitte and Dennis F. Shea (2001), “The power of suggestion: Inertia in 401(k)
participation and savings behavior”, Quarterly Journal of Economics 116, 1149-87. Masson, Paul R. Tamim Bayoumi and Hossein Samiei (1998), "International Evidence on the
Determinants of Saving," World Bank Economic Review 12, 483-501. Modigliani, Franco (1993), "Recent Declines in the Savings Rate: A Life Cycle Perspective," in
World Saving, Prosperity and Growth, Mario Baldassarri ed. New York: St. Martin Press. Moscowitz, T.J. and A. Vissing-Jorgensen (2001), “The private equity premium puzzle'”, mimeo,
University of Chicago. Interamerican Development Bank, Multilateral Investment Fund (2002), “Remittances to Latin
America and the Caribbean”, Washington: Interamerican Development Bank, mimeo.
36
Palacios, Robert and Pallarès-Miralles (2000), "International Patterns of Pension Provision," World Bank, mimeo.
Park, Yung Chul, "The Role of Finance in Economic Development in South Korea and Taiwan,"
presented to the CEPR Conference on Finance and Development in Europe, Santiago de Compostela, December 1991.
Poterba, James M. (1994), Public Policies and Household Saving. Chicago: University of
Chicago Press, 1994. Poterba, James M. (2000), "Taxation, Risk-Taking, and Household Portfolio Behavior," in
Handbook of Public Economics, Alan Auerbach and Martin Feldstein, eds. Amsterdam: Elsevier Science Publisher.
Poterba, James M. (2001), "Taxation and Portfolio Structure: Issues and Implications," in
Household Portfolios, Luigi Guiso, Michalis Haliassos and Tullio Jappelli eds. Cambridge: MIT Press.
Poterba, James M., and Andrew A. Samwick, (1999), "Taxation and Household Portfolio
Composition: U.S. Evidence From the 1980s and 1990s," NBER Working Paper n. 7392. Poterba, James M., Steven F. Venti and David A. Wise (1996), "How Retirement Saving
Programs Increase Saving," Journal of Economic Perspectives 10 (Fall), 91-112. Schmidt-Hebbel, Klaus, and Servén, Luis (1999), "Aggregate Saving and Income Distribution,"
in The Economics of Saving and Growth, Klaus Schmidt-Hebbel and Luis Servén, eds. Cambridge: Cambridge University Press.
Souleles, Nicholas (2000), "College Tuition and Household Savings and Consumption," Journal
of Public Economics 77. Thaler, Richard H. (1990), “Saving, fungibility and mental accounts”, Journal of Economic
Perspectives 4, 193-205. Thaler, Richard H., and H.M. Shefrin (1981), “An economic theory of self-control”, Journal of
Political Economy 89, 392-406. Whitehouse, Edward (2000), "The Tax Treatment of Funded Pensions." London: Axia
Economics, mimeo.

37
Table 1 Saving Incentives in Voluntary Retirement Funds in Major Industrial Nations
Country Retirement Saving
Accounts?
Contribution Limit Contributions
Deductible?
Special Notes
Canada Yes $9400 ($15,500 Canadian), Indexed
Yes Limits on foreign stock; carry forward unused contributions
France No __ __
Germany Yes Vermogensbildungsgesetz Limit $2200
Yes Investment in "long term funds"; other programs to accumulate housing down payments
Italy
Yes 2% of wages or $1414 Yes
Japan No ___ ___ Universal maruyu postal saving accounts were phased out in 1986
Netherlands Yes 1700 Guilders, or approximately $850 per year for employee saving scheme
Yes "Employee saving scheme" and "Premium saving scheme"; four year vesting period before withdrawal
United Kingdom
Yes Personal pensions, contributions of 17.5 - 40 percent of earnings; Individual Saving Accounts (ISAs), limit of £5000/year contribution starting in 2000
Yes ISAs face restrictions on investment choices; total contribution limits were higher in years before 2000
United States Yes $2000 for Individual Retirement Accounts, $10,500 for 401(k) plans
Yes Other variants include Roth IRAs and 403(b) Plans
Source: Poterba (2001).

38
Table 2 Tax Treatment of Mandatory Retirement Funds in Latin America and East Asia
Latin America Year
implemented
Contributions Investment income Benefits
Argentina 1994 Exempt Exempt Taxed Bolivia 1997 n.a. n.a. n.a. Chile 1981 Exempt Exempt Taxed Colombia 1994 Exempt Exempt Exempt up to a
ceiling Costa Rica Exempt Exempt Taxed El Salvador 1998 n.a. n.a. n.a. Mexico 1997 Exempt Exempt Taxed Peru 1993 Taxed Exempt Taxed Uruguay 1996 Up to 20% of
earnings are exempt Exempt Taxed
East-Asia
Brunei Exempt Exempt Exempt Indonesia 1997 Exempt Funds bank deposits and
returns on listed local securities are exempt. Returns on open-ended mutual funds, unlisted securities and property are taxed.
Taxed
Malaysia 1991 Exempt Exempt Exempt Philippines 1998 Employees’
contributions are taxed. Employers’ contributions are exempt to tax for qualified occupational plans.
Taxed Exempt
Singapore Exempt Exempt Exempt Thailand 1998 Exempt Exempt Exempt Source: Whitehouse (2000), Holzman et al. (2000).
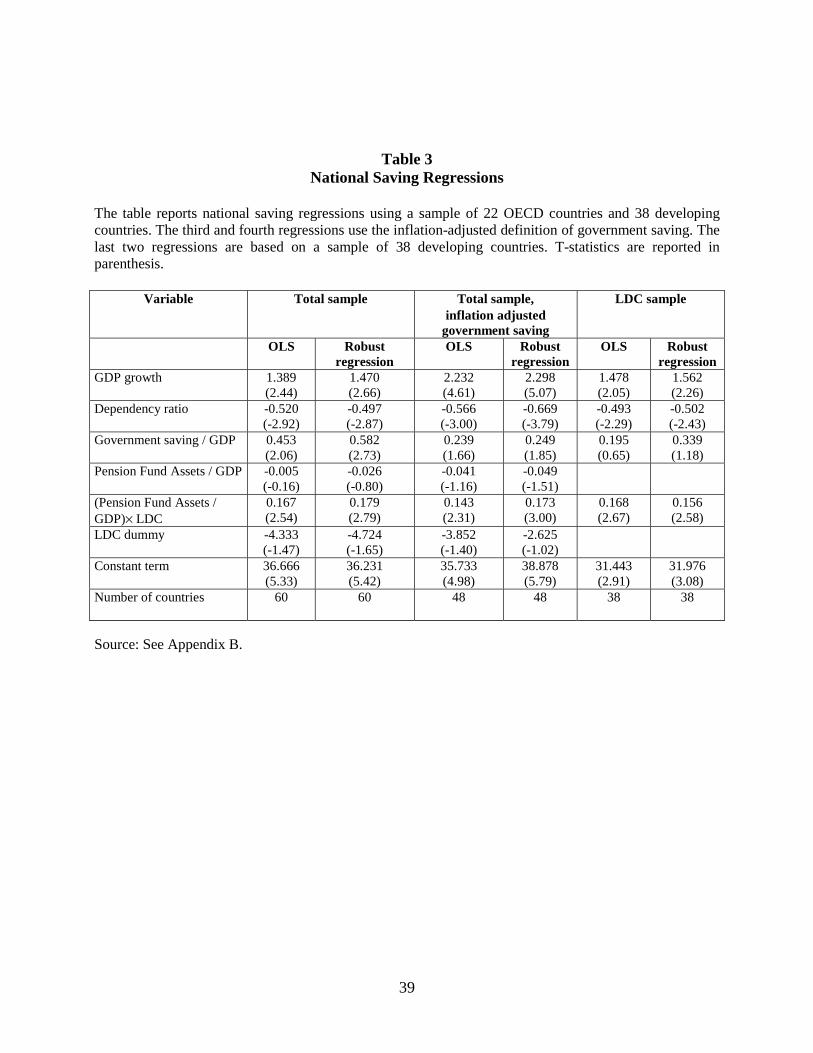
39
Table 3 National Saving Regressions
The table reports national saving regressions using a sample of 22 OECD countries and 38 developing countries. The third and fourth regressions use the inflation-adjusted definition of government saving. The last two regressions are based on a sample of 38 developing countries. T-statistics are reported in parenthesis.
Variable Total sample Total sample, inflation adjusted
government saving
LDC sample
OLS
Robust regression
OLS Robust regression
OLS Robust regression
GDP growth 1.389 (2.44)
1.470 (2.66)
2.232 (4.61)
2.298 (5.07)
1.478 (2.05)
1.562 (2.26)
Dependency ratio -0.520 (-2.92)
-0.497 (-2.87)
-0.566 (-3.00)
-0.669 (-3.79)
-0.493 (-2.29)
-0.502 (-2.43)
Government saving / GDP
0.453 (2.06)
0.582 (2.73)
0.239 (1.66)
0.249 (1.85)
0.195 (0.65)
0.339 (1.18)
Pension Fund Assets / GDP -0.005 (-0.16)
-0.026 (-0.80)
-0.041 (-1.16)
-0.049 (-1.51)
(Pension Fund Assets / GDP)× LDC
0.167 (2.54)
0.179 (2.79)
0.143 (2.31)
0.173 (3.00)
0.168 (2.67)
0.156 (2.58)
LDC dummy
-4.333 (-1.47)
-4.724 (-1.65)
-3.852 (-1.40)
-2.625 (-1.02)
Constant term 36.666 (5.33)
36.231 (5.42)
35.733 (4.98)
38.878 (5.79)
31.443 (2.91)
31.976 (3.08)
Number of countries
60 60 48 48 38 38
Source: See Appendix B.

40
Table 4 Mandatory Housing Funds
Country Program Main features
Argentina FONAVI Prior to 1991 mandatory contributions are 5 percent of the wage tax. Since
1991, 40 percent of the fuel consumption tax. To qualify for a loan, household monthly income must range between $500 and $1,000. The household assigns then 25 percent of income to monthly repayment installments. Terms are up to 25 years.
Bolivia FONVIS (phased out in 1998)
The program featured public sector salary deductions earmarked for social housing improvement and construction. The current system is based on tax incentives for long-term saving.
Brazil FGTS The fund is made up of mandatory monthly deposits by employers into accounts held in the names of their employees at the Federal Savings Bank. The contribution rate is 8 percent. Loans with FGTS funds are targeted to low-income families, with monthly income of up to 12 minimum wages (approximately US$933). Average loans amount to approximately R$20,000 (US$11,500).
Colombia CAV Mandatory contributions amount to one-month wages. Withdrawal is allowed to go back to school in case of quit or dismissal, and for home purchase.
Jamaica National Housing Trust
Established in 1976. It is funded by statutory deductions from employers, employees and self-employed individuals. Contributors must earn more than the minimum wage. The contribution rate is 5 percent (2 percent from employees, 3 percent from employers). Self-employed contribute 3 percent. Funds are available for first home purchasing after a minimum of 3.5 years of contributions for a maximum amount of JA$800,000 (per contributor).
Mexico INFONAVIT Mexican employers contribute 5 percent of their payroll to the fund, up to a maximum of 10 times the statutory minimum wage. The contributions accumulate into the national housing fund, used by INFONAVIT to award 30-year mortgage loans, with an average interest rate of 6 percent plus an adjustment for the annual increase in the minimum wage.
Peru FONAVI (phased out in 2000)
Peruvian employers contribute 5 percent of total wages (salary plus bonuses) to the housing fund. The scheme (converted to an “Emergency solidarity tax”) has been phased out in January 2000.
Philippines PAG-IBIG Home Development Mutual Fund
Mandatory contributions are 1 percent for employees earning not more than 1.5 million pesos per month, 2 percent for those earning more than 1.5 million. All employers contribute 2 percent of the monthly compensation for all employees covered by the Social Security System and the Government Service Insurance System.
Venezuela AHORRO HABITAÇIONAL
Mandatory contributions for public and private employees are 1 percent of wages for employees and 2 percent for employers. The self-employed can participate to the program on a voluntary basis with a contribution rate of 3 percent. Homeowners and individuals over 60 are exempt from the contribution.
Source: Duebel (2000).

41
Table 5 The Interaction Between Mandatory Pension Funds and Housing Finance
Country
Program Main features
Colombia CAV Mandatory contributions equal to one-month wages are made to the CAV. If the pension fund exceeds 110 percent of minimum wages, it can be used for home purchase.
Malaysia Employees Provident Fund (EPF)
Contributions to the EPF are apportioned into three accounts: 60 percent is for retirement, 30 percent for housing or pre-retirement plans (to be eligible for pre-retirement withdrawal the account holder must be over 50 years old), and 10 percent for medical expenses. The withdrawal can be used to buy or build a house, or to pay off a housing loan. A member is eligible to apply for withdrawal if he has not made any previous withdrawal to buy or build a house and has not attained the age of 55 at the time of application.
Philippines Reserve funds of the social security system
Borrowing for housing against a share of the accumulated pension fund is possible.
Singapore
Central Provident Fund (CPF)
Borrowing for housing against a share of the accumulated pension fund in CPF is possible. In fact, over half of withdrawals in recent years are for housing purposes.
Sri Lanka Employees Provident Fund (EPF)
The EPF is the largest mandatory saving program in Sri Lanka. The contribution rate is 12 percent for employers and 8 percent for employees. Contributions are taxed (i.e. they are paid out of after-tax income), but income from accumulated funds and benefits are exempt. It is possible to withdraw funds from retirement accounts for purchasing a home.
Source: Whitehouse (2000), Holzman et al. (2000).

42
Table 6 Tax Incentives for Education, Health, and Life Protection
Education
Main features
United States Education IRA, introduced in 1997. An annual, non-deductible contribution of up to $500 per year, per child may be invested until the child reaches age 18. Withdrawals to pay for college expenses for the child are tax-free. Single taxpayers earning an adjusted gross income above $95,000, ($150,000 on a joint return) are not eligible.
United States Tax deductibility of up to $ 2,500 on qualified student loans; tax credits of up to $ 1,500 of undergraduate education and up to $ 1,000 for any post-high school education..
Germany Tax deductibility of 30 percent of tuition fees of government-approved private schools. Health
United States Major out-of-pocket health expenses deductible (excluding private health insurance premiums).
Italy Major out-of-pocket health expenses deductible (including private health insurance premiums).
Argentina Private long-term health insurance tax deductible, subject to limits. Taiwan Private long-term health insurance tax deductible. Germany Private long-term health insurance tax deductible, subject to limits. India Private long-term health insurance tax deductible up to a cap. Japan Private long-term health insurance tax deductible up to a cap. Life protection
United States Investment income is not taxed but withdrawals and contributions are. Employer-provided group term policies up to $ 50,000 not taxed.
Canada Investment income and withdrawals are tax free if they provide only an insurance, rather than an investment element.
United Kingdom Withdrawals are tax free, but returns are taxed. Tax relief on premiums phased out in 1984. Germany Contributions are tax-deductible subject to a cap; returns are not subject to tax. Italy Contributions are tax-deductible subject to a cap and a time limit for life insurance products
specifically designed to supplement social security pensions; withdrawals are taxed. Japan Contributions are tax-deductible subject to a cap and a time limit; withdrawals are partially
tax-exempt. France Contributions are tax-deductible subject to a cap and a time limit; withdrawals are taxed. Argentina Contributions are tax-deductible subject to a cap; returns are tax-free. India Contributions are tax deductible; returns are taxed. Singapore Contributions are tax-deductible subject to a cap; returns are taxed. Taiwan Contributions are tax-deductible subject to a cap; returns are taxed.

43
Table 7 Tax Treatment of Borrowing, Selected OECD Countries
Country
Is Mortgage Interest Deductible? Tax Treatment of Consumer
Borrowing
Canada No Not deductible France Yes Not deductible Germany No Not deductible Italy Only for first-time homebuyers Not deductible Japan No, but new homebuyers enjoy tax credit for up to
six years Not deductible
Netherlands Yes Deductible subject to a cap Sweden Yes Fully deductible until 1991. Not
deductible afterwards. United Kingdom No (effective April 2000) Not deductible United States Yes, subject to rarely-binding limit Not deductible. Home equity
loans up to $100,000 tax deductible.
Source: Poterba (2001).
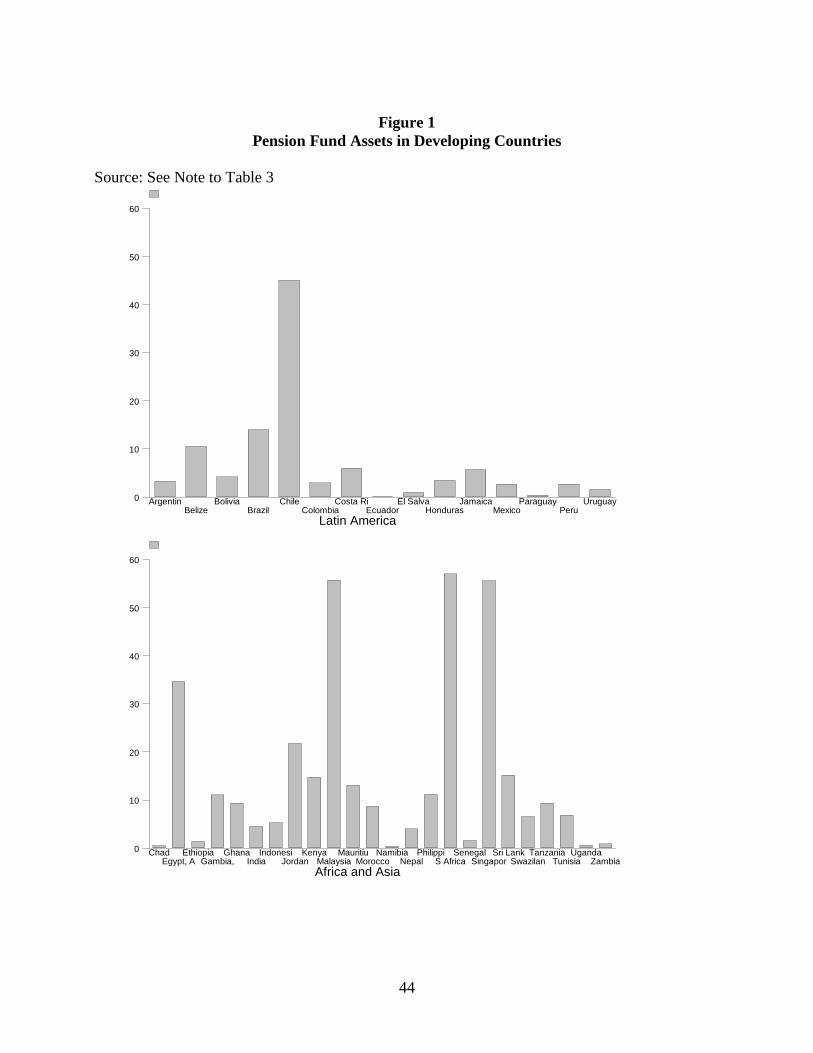
44
Figure 1 Pension Fund Assets in Developing Countries
Source: See Note to Table 3
Latin America
0
10
20
30
40
50
60
ArgentinBelize
BoliviaBrazil
ChileColombia
Costa RiEcuador
El SalvaHonduras
JamaicaMexico
ParaguayPeru
Uruguay
Africa and Asia
0
10
20
30
40
50
60
ChadEgypt, A
EthiopiaGambia,
GhanaIndia
IndonesiJordan
KenyaMalaysia
MauritiuMorocco
NamibiaNepal
PhilippiS Africa
SenegalSingapor
Sri LankSwazilan
TanzaniaTunisia
UgandaZambia
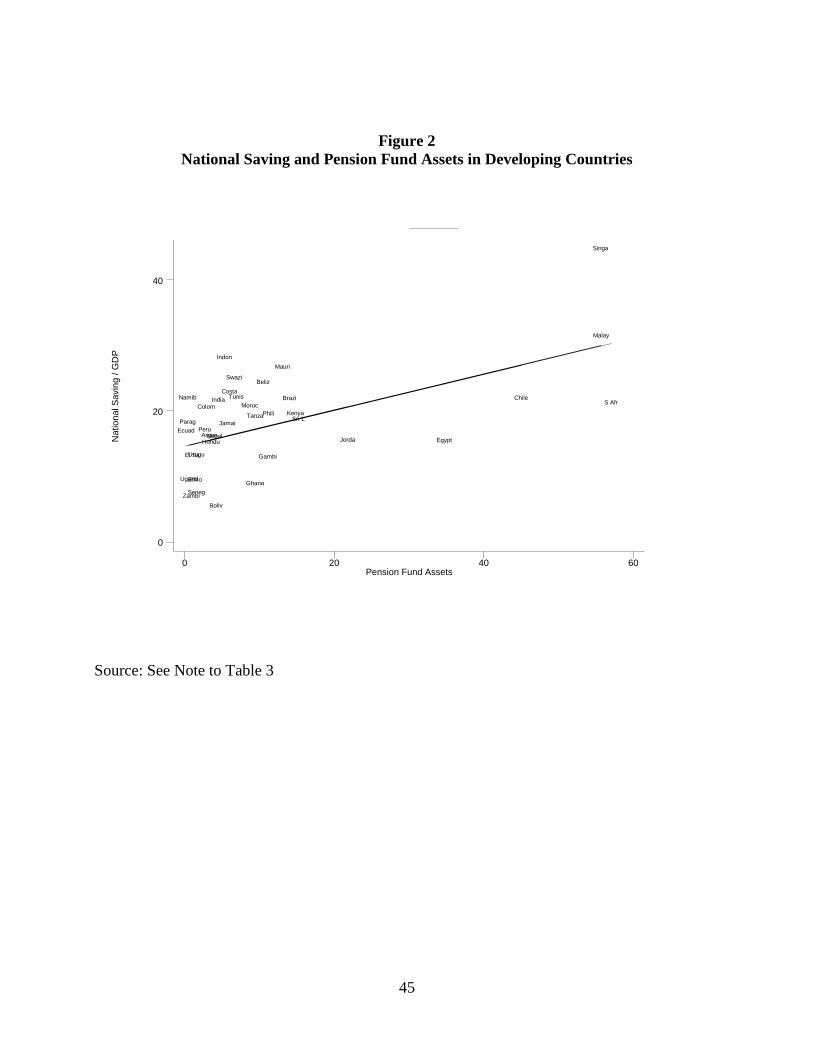
45
Figure 2
National Saving and Pension Fund Assets in Developing Countries
Source: See Note to Table 3
Nat
iona
l Sav
ing
/ GD
P
Pension Fund Assets
0 20 40 60
0
20
40
Argen
Beliz
Boliv
Brazi Chile
Colom
Costa
Ecuad
Egypt
El Sa
Ethio
Gambi
Ghana
Hondu
India
Indon
Jamai
Jorda
Kenya
Malay
Mauri
MorocNamib
Nepal
ParagPeru
Phili
S Afr
Seneg
Singa
Sri L
Swazi
Tanza
Tunis
Ugand
Urugu
Zambi