Tax Evasion, Corruption, and the Social Contract in...
34
Tax Evasion, Corruption, and the Social Contract in Transition* Eric M. Uslaner Department of Government and Politics University of Maryland–College Park College Park, MD 20742 [email protected] For James Alm, Jorge Martinez-Vazquez, and Benno Torgler (eds.), Tax Compliance and Tax Evasion (London: Routledge).
Transcript of Tax Evasion, Corruption, and the Social Contract in...

Tax Evasion, Corruption, and the Social Contract in Transition*
Eric M. Uslaner
Department of Government and Politics
University of Maryland–College Park
College Park, MD 20742
For James Alm, Jorge Martinez-Vazquez, and Benno Torgler (eds.), Tax Compliance and Tax
Evasion (London: Routledge).
1
In 1997 a Russian civil servant asked the Swedish political scientist Bo Rothstein, how the
Russians could solve the widespread problem of tax evasion. Almost all Swedes were honest in
reporting and paying their taxes, while Russians regularly cheated the state (Rothstein, 2001,
477):
First, [Russian citizens] rightly did not believe that all “the other” taxpayers where
paying their taxes properly, so it was really no point in being “the only one” who
acted honestly. The goods (public, semi-public or private) that the government
was going to use the money to produce, would simply not be produced because
there were too little taxes paid in the first place. Secondly, they believed that the
tax authorities were corrupted, so that even if they paid their taxes, a significant
part of the money would never reach the hospitals or schools, etc. Instead, the
money would fill the pockets of the tax bureaucrats.
Tax evasion is an endemic problem in Russia–and most other transition countries, especially in
comparison with the West. Easter (2007, 234-239), Hanousek and Palda (2007, 332), Ott (2007,
292-293), and Owsiak (2007) detail the extent of tax evasion in Russia, the Czech Republic,
Croatia, and Poland, respectively–and the figures are distressingly high, often as great as 40
percent of the total economy.
Tax evasion is part of a more general syndrome of corruption, impotent legal systems, shaky
economies, and especially inefficient governments that fail to provide essential services. New

2
democratic institutions did not ensure smoothly functioning states and reduced corruption.
Parliamentary elections and promises of the rule of law did not turn Romania or Russia into
Sweden (Uslaner and Badescu, 2004). When people believe that public officials steal their tax
payments–and especially when they believe that they don’t get high quality services for their
taxes (Hanousek and Palda, 2004), they are more likely to evade paying their taxes.
Tax compliance is thus a social contract between ordinary citizens and the government rather
than a contract among people based upon trust, as Rothstein (2001) argued. Scholz (2007) and
Smith (1992) argue that there is a basic expectation of reciprocity: If you don’t believe that others
will pay their taxes, then you too will withhold your tax payments. Yet, an explanation based
upon reciprocity--you pay your taxes because you believe that others will also pay their
taxes–doesn’t explain why others pay their taxes (Uslaner, 2007).
People obey the law–generally and more specifically by paying their taxes–when they believe
that they will be treated fairly and equitably. A fair judicial system is more important than an
efficient one (Tyler, 1990; Uslaner, 2008, chs. 2, 4). Throughout transition countries, people
believe that the law is not fair–and that the rich and powerful can get away with corruption and
tax evasion (Uslaner, 2008, ch. 4). Wealthy people can pay off the courts and avoid prosecution.
If they are indicted nevertheless, they can pay off the judges to fix their trials. If they are
somehow convicted, they can appeal and ensure that they never serve time in jail. In 2003, the
Russian government of Vladimir Putin arrested billionaire Mikhail Khodorkovsky for tax
evasion and extortion and argued that no one, no matter how rich, was above the law (even

3
though most viewed Khodorkovsky’s arrest and ultimate jailing as a move to quash his political
aspirations).
I argue, with Hanousek and Palda (2004), that the quality of government services is a key factor
in tax compliance. Corruption also matters. When people believe that their taxes will go toward
public services and not into the pockets of politicians, they will be more likely to pay their fair
share. Where there is widespread corruption and an unfair (as well as weak) legal system, tax
compliance will be lower. Belief in the honesty of officials is a key component in why people
trust government in both the West and in transition countries (Uslaner, 2008, ch. 5).
Performance, however, is just as critical. In the West, evaluations of how well the government
manages the economy is the key to understanding why people trust government (Citrin, 1974).
In transition countries, the provision of basic services seems to be more critical than simple
economic performance (Uslaner, 2008, ch. 5). This is not such a critical concern in the West,
where routine services are routinely provided. Trust in government is a key factor in explaining
tax compliance in Romania (Uslaner, 2007), but the surveys of businesspeople (described below)
that I employ have no direct question on trust in government. I can only establish a direct linkage
from the quality of services to tax compliance rather than a causal chain from service provision
to trust in government to paying taxes.
There is mixed support for the claim that enforcement matters. Beron, Tauchen, and Witte
(1992), Smith (1992), and Scholz (2007) find that the likelihood of detection is a key factor in
tax compliance in the United States, while Hanousek and Palda (2004) find it insignificant in the

4
Czech Republic as do Feld and Frey (2007) in Switzerland.
I provide support for the claims that tax compliance in transition countries reflects perceptions of
the quality of services and the level of corruption, both in the tax administration offices and
throughout the government and society, using the 2002 and 2005 surveys of businesspeople, the
BEEPS (Business Enterprise and Enviroment Performance Surveys), conducted for the World
Bank and the European Bank for Reconstruction and Development. BEEPS 2002 and 2005
encompassed 28 and 27 transition countries, respectively. Turkemenistan was not included in the
2005 survey and I excluded respondents from Turkey (which is not a transition country) in both
years.
The BEEPS surveys do not tell us anything about compliance by ordinary citizens. However,
they have an excellent set of questions on both tax compliance and levels of corruption (as
reflected in gift payments to officials), the fairness of the legal system, the structure of firms, and
expectations of audits. Approximately 7500 respondents were surveyed in 2002 and 9500 in
2005, with samples stratified by location, sector, size, whether the firms were exporters, and
locus of control (domestic versus foreign). Businesspeople are different from ordinary citizens.
They are considerably less likely to see corruption and unfairness than the mass public (Uslaner,
2008, chs. 5, 6). So the results I present here may even underestimate the importance of
corruption and the quality of services. This may be less of an issue than it first seems, since
businesses depend even more than the mass public for government services. In countries with

5
unfair legal systems and many “grabbing hands,” businesspeople are more likely to be personally
affected by corruption than are ordinary citizens.
The 2002 BEEPS survey has respondents from 6,667 firms and the 2005 survey has respondents
from 9655 firms, in 27 nations–including Turkey. The 2005 BEEPS survey had respondents from
6442 firms in 28 countries. Both surveys include respondents from Turkey. I focus on formerly1
Communist nations so I exclude Turkish respondents. I use the surveys to estimate models of:
(1) the perceived share of income reported by firms for tax purposes for the 2002 BEEPS; (2) gift
payments to tax collectors in the 2005 BEEPS; (3) taxes reported in the 2005 BEEPS; (4)
reported taxes in the 2005 BEEPS, with gift payments to tax collectors as endogenous using
instrumental variables; and (5) income reported for taxes across the countries in the 2005 BEEPS
(in an aggregate model). Overall, I find strong support for the claim that the quality of
government services and the level of corruption matter mightily. Clearly, other factors also
matter, including the size and ownership of the firm, the fairness of the legal system, the level of
competition, the tax rate, the quality of the bureaucracy, and the expectation of audits. The
quality of services and the level of corruption stand out as critical factors shaping tax
compliance.
TAXES, SERVICES, CORRUPTION AND TRANSITION
Rothstein is correct: Tax compliance in transition countries is essentially the same problem as it
is elsewhere. Torgler and his associates (Alm, Martinez-Vazquez, and Torgler, 2004; Torgler,

6
2003, 2007; Torgler and Schneider, 2006) argue that trust in government and trust in the legal
system are the key factors in explaining “tax morale” in both transition and Western European
countries. Tax morale is the belief that people ought not to cheat on their taxes. It is a good
surrogate for tax compliance since asking people directly whether they have paid their taxes may
not elicit truthful information.
While the dynamics of compliance (and evasion) may be the same in the West and the transition
countries, there is likely to be far less obedience to the law in the formerly Communist countries.
Tax morale in transition nations is rather low–in the former Soviet Union less than half the
public (an average of 42.6 percent) held that tax evasion is never justifiable in the 1995-97 World
Values Survey and barely more than half (54.2 percent) made the same judgment in Central and
Eastern Europe (Torgler, 2003, 362). Over 60 percent in the West held that tax cheating was
never acceptable. The tax morale question is a scale from 1 (never acceptable) to 10 (always
acceptable). The mean score in the 1995-97 World Values Survey was 3.06 for respondents from
countries with a legacy of Communism and 2.13 for people from other nations (t = 48.90, p <
.00001). Clearly tax morale is weaker in the former Communist nations.
Torgler (2007, 159-160), echoing Rothstein and Hanousek and Palda, argues, “Taxes can be seen
as a pride paid for government’s positive actions....If the government tries to generate trust with
well functioning institutions, co-operation can be initiated or increased....when taxpayers are
satisfied with the way they are treated, the cooperation is enhanced. If the outcome received from
the government is judged to be fair in relation to the taxes paid, no distress arises.”

7
Corruption both robs the treasury of available resources for public projects and destroys people’s
faith in governing authorities (Torgler, 2007, 161; Uslaner, 2008, chs. 2, 4). Highly corrupt
governments such as Zaire (now the Congo) and Haiti are often called “kleptocracies.” Transfer
payments, social insurance, and health spending are lower where corruption is high (Mauro,
2002, 349)–all reinforcing inequality. Not only is there less money to spend on social programs
such as health and education, but where corruption is rampant, the poor will likely have to make
extra “gift” payments to receive routine services–thus imposing extra costs on people who are
least able to afford them (Gupta, Davoodi, and Tiongson, 2002, 255). Corruption and weak legal
systems have deleterious effects on perceived service delivery for water supply, phone service,
and power outages (Uslaner, 2008, ch. 4). This forms a vicious circle: Poor service delivery and
corruption make people less willing to pay taxes. When government cannot provide essential
services, people rely upon the informal sector–and this means that the state is robbed of taxes on
hidden income (Torgler, 2007, 157-158; Uslaner, 2008, ch. 4). The greater the share of the
economy beyond the reach of the state, the more difficult it will be for a government to marshall
the resources to gain public confidence that the state can provide essential services.
Not only is tax morale lower in transition countries than in other nations, especially the West, but
the shadow economy is also much greater, twice as large as in the West according to estimates by
the World Bank (2004). Even the best performing economies, Slovakia and the Czech Republic,
had almost 20 percent of their revenue off the books (using data from Schneider, 2003). Three
countries had a majority of their revenue in the informal sector (Ukraine, Azerbaijan, and
Georgia) and 15 of 21 countries for which there are data have at least a third of their income in

8
the shadow economy. Even more distressing is that 16 of the 18 countries for which there are
data experienced increases in the shadow economy from 1989 (the time of transition) to 2000 of
between 10 and 42 percent; only one country (Hungary) had a (very slight) decrease while
another (Slovenia) experienced no change. Overall, the average share of the shadow economy
more than doubled from 1989 to 1999-2000 (from 17 percent to 38 percent).
Corruption is also far worse in the transition countries than in the West. The Transparency
International Corruption Perceptions Index ranges from 1 (completely corrupt) to 10 (completely
honest). The transition countries in 2006 averaged 3.45, while the Western nations averaged
7.94. The legal system is also largely viewed as unfair. A measure of legal fairness from the
Economist Intelligence Unit ranges from 1 (unfair) to 5 (completely fair, see Uslaner, 2008, ch. 3
for a discussion of the index). Western nations average 4.30, compare to 2.39 for transition
nations. Barely more than a quarter of respondents in the 2005 BEEPS survey argue that the
courts are uncorrupt and that they are fair.
Rothstein suggested that Russians could reduce corruption and build trust by creating a stronger
legal system, but the Russians have seemingly paid him little heed. In 2005 over 1400 “takeover
artists” seized control of Russian private businesses, owned by locals and foreigners alike, by
forging sales agreements, voting out the rightful owners, and often using violence to take over
factories. By either bribing authorities or stealing the ownership documents, these con men are
outside the reach of the law (Kramer, 2006). Starbucks, Kodak, Forbes, Audi, and the H&M
clothing chain have all been the targets of trademark “squatters,” who have registered the

9
company names and extort up to $60,000 from the rightful owners to reclaim their brands as the
courts stand idly by. The Starbucks brand name was far more coveted, with an asking price of
$600,000 (Kramer, 2004, C1, C4).
This lawlessness–as reflected in the power of organized crime–made doing business hazardous.
In the BEEPS 2005 survey, 41 percent of respondents said that the Mafia was an obstacle to
doing business, ranging from 15 percent in prosperous Slovenia–which long had access to
Western markets even when it was part of the Soviet Union–to 83 percent in Albania. Street
crime is also an obstacle to business–slightly greater at 45 percent and prominent in the same
countries. Eighty-three percent of respondents who said that the Mafia was an obstacle to
business also worried about street crime (phi = .662, Yule’s Q = .924). In countries where there is
little respect for the rule of law, paying taxes for protection one doesn’t receive or even paying
taxes at all may seem fruitless.
Ordinary people often face a justice system biased against them. A Russian court convicted a
railway worker in a closed trial in 2006 after his car was hit from behind by a vehicle carrying
one of the country’s most prominent politicians, causing an accident that ended in the death of
the official. The court ruled that the worker should have seen the leader’s car coming and
sentenced the worker to four years hard labor, provoking widespread protests (Finn, 2006).
The public in transition countries sees corruption as a long-term, insoluble problem: In a 2005
survey, just eight percent of Russians held that corruption can be eliminated “if dishonest leaders

10
are replaced with honest ones,” while 26 percent hold that “Russia has always been characterized
by bribery and embezzlement, and nothing can be done about it” (Popov, 2006; cf. Karklins,
2005, 59 for a more general statement on transition countries).
Under Communism, people had to resort to informal connections–petty corruption–to get by in
daily life–to stand in line for food, to help run errands, or to use a friend or relative to cut through
the bureaucracy--was common practice under Communism (Flap and Voelker, 2003; Ledeneva,
1998). This system persists as people must make “gift payments” for many routine services such
as seeing a doctor, avoiding traffic fines, to get decent grades in school–or acceptance into good
schools or universities. Barely more than a third of Hungarians see a moral problem when
doctors demand “gratitude payments” for medical services (Kornai 2000: 3, 7, 9). This system of
“gift giving” is so widespread that almost all doctors accept “gratitude money”; 62 percent of
physicians’ total income came off the books. A majority of public officials in the Czech
Republic, Slovakia, Bulgaria, and Ukraine in 1997-98 found it acceptable to receive extra
payments from clients. Between 11 and 39 percent of citizens of those countries (in that order)
reported offering a “small present” to officials and between 6 and 24 percent offered “money or
an expensive present” (Miller et al., 2001, 217, 241).
Two-thirds of respondents to a Polish survey said that giving gift payments was inevitable, more
than half said that such extra charges were simply signs of respect, and little more than a third
would refuse to give a bribe. However, over two-thirds say that both giving and receiving such
payments was morally reprehensible (Kolarska-Bobinska, 2002, 323-324). State Department
11
surveys of attitudes toward corruption in Bulgaria, the Czech Republic, Hungary, Poland,
Romania, and Slovakia found that between 75 and 86 percent of their publics said that “accepting
a bribe in the course of a person’s duties” was never justified–comparable to, or even greater,
than corresponding shares of the public in Britain, France, Germany, and Italy (Office of
Research, 1999, 9). This strong disapproval of corruption together with the pervasiveness of
malfeasance in transition countries makes people less trusting of their public officials–and thus
less more likely to evade paying taxes.
It is hardly surprising that businesspeople in transition countries rate the quality of basic services
poorly. In the 2005 BEEPS, only 24 percent of entrepreneurs said that government was run
efficiently. The judiciary fared worse (19 percent) and survey respondents were generally2
negative about the legislature (16 percent favorable), roads and public works (18 percent), public
health (20 percent), the police (25 percent), and education (30 percent). Some other services and
institutions fared better, with banks and the military at 40 percent and water, telephone, postal,
and electric gaining positive ratings from 45 percent to 51 percent of respondents. No basic
service received substantial support from the businesspeople. These entrepreneurs do not see that
they are getting much value for their tax payments.
There are other reasons for tax evasion in transition countries. Under socialism’s command
economy, most people didn’t pay taxes. Taxes came largely from the large state enterprises. After
transition, many entrepreneurs were able to hide their income in a barter (underground) economy
that escaped state control. Moreover, the tax administration left over from the socialist systems
12
were as inefficient as other public bureaucracies (Easter, 2007; Alm, Martinez-Vazquez, and
Torgler, 2004, 9; Torgler, 2003, 359).
Tax compliance may be enhanced by several factors related to firm structure and practices.
Large firms will find it more difficult to hide assets and thus should be more likely to comply
with tax laws (Gehlbach, 2006). Firms that have substantial state or foreign ownership should
also be more likely to pay their taxes. State ownership, like size, will make it difficult to hide
assets. Foreign owned firms may face greater scrutiny by tax authorities. Their foreign
investors/owners may also have greater “tax morality” if, as is likely, tax evasion is viewed less
favorably in their home countries. Firms that have a larger number of competitors will also be
more likely to pay taxes, since they may worry that tax authorities would have a ready basis for
comparison of firm assets and profits. More frequent audits should also lead to greater
compliance–though “gift payments” to tax collectors might work to enhance evasion.
My account has paid scant attention to an issue that has become central to transition economies:
Growing economic inequality. Elsewhere I have focused on how inequality has grown in these
nations. The Rosser, Rossser, and Ahmed (2000) data on income distribution show an increase in
economic inequality from 1989 to the mid-1990s for every transition country save one
(Slovakia). The more recent WIDER estimates indicate substantial increases in inequality–an3
average change of 78 percent from 1989 to 1999–for each of 21 countries. In Uslaner (2008, chs.
2, 4, 5, 6) I argue that corruption rests upon a foundation of economic inequality and leads in turn
to greater wealth disparities–forming an “inequality trap” that is difficult to escape. Even though

13
the transition countries have historically had lower levels of inequality, the transition to a market
economy has led to growing divisions between the new rich and the new poor.
In transition countries (as well as others), growing inequality is linked to the rise in the shadow
economy (greater in 2000 than in 1989 in every country except Hungary), greater corruption,
unfair legal systems, and state failure more generally, including poor public services. Inequality
lies at the heart of transition problems, especially growing corruption and declining generalized
trust, yet there is no evidence that it leads to greater tax evasion (cf. Hanousek and Palda, 2004,
246). No other measure of inequality had significant country-level effects on tax reporting in the
individual-level analysis or in the aggregate model. Inequality, specifically the change in the
unequal distribution of income from 1989 to the present as estimated by WIDER, the World
Institute for Development Economics Research of the United Nations University (see n. 3), is an
important determinant of how often businesspeople make gift payments to tax collectors.
TAX COMPLIANCE IN TRANSITION
What drives tax compliance in transition countries? I use the 2002 and 2005 BEEPS to examine
the share of sales firms believe that “the typical firm in your area of business reports for tax
purposes.” While this is not the same question as the share of sales the respondent’s firm
reported, asking about “typical” behavior is an acceptable surrogate for illicit behavior (Tavits,
2005). Most respondents report great compliance with the law among themselves and their peers.
The mean share of revenue expected to be reported is 89.4 percent, ranging from three quarters in

14
Albania and Macedonia to 97 percent in Estonia, which has the least corrupt government among
all transition countries in the Transparency International rankings (a rating of 6.7 on the 10 point
scale). Armenia and Uzbekistan also have very high means, 95 and 97 percent, respectively
–which may either reflect idiosyncratic survey results or dynamics other than those I consider
here.
I use both the 2002 and 2005 BEEPS to show that similar dynamics apply over time–and as a
source of replication. I estimate regression models for the perceived share of income reported in
both surveys as well as a model for how common (on a six point scale) it is to give “gifts” to tax
collectors–and then an instrumental variables regression of the expected share of sales reported
for tax purposes with gifts to tax collectors as endogenous. In Tables 3 and 4, I include aggregate
measures as additional predictors, clustering the standard errors at the country level. For the 2002
BEEPS, no country-level effects were significant. Finally, I use aggregated data from BEEPS
2005 to examine variations across countries of the share of sales reported. The analyses strongly
confirm the expectations I have laid out above.
I begin with summaries of the dependent variables–the share of a firm’s sales reported for
taxes–and one of the central independent variables, the share of a firm’s sales that are paid in
extra “gift” payments in 2002 and 2005 (see Table 1). Three things stand out in this table. First,
the rates of reporting appear rather high for countries with high levels of corruption, if not by the
standards of Western market economies: In 2002, the average share of income reported was 82
percent, rising to 89 percent in 2005. By 2005 only Albania and Macedonia had average rates of

15
reporting below 80 percent. Some figures seem anomalously high, such as the 95.4 percent for
Azerbaijan and 97 percent for Uzbekistan in 2005. Second, most businesspeople report only
small shares of sales paid as “gift” payments–an average of 3.2 percent in 2002 and 1.7 percent in
2005. Third, tax compliance became more common and gift payments less frequent in the three
year period between 2002 and 2005. Whether this was due to the maturation of the transition or
to variations in the samples is difficult to tell. The samples show very large gains in tax
compliance for Serbia (14 percent) Bosnia (21 percent), and Georgia (24 percent), which seems
implausible. Outside of these three countries, the average increase in tax compliance is 4.8
percent, which is just outside sampling error.
________________
Table 1 about here
While these data are thus far from perfect, they do offer the opportunity to examine tax
compliance cross-nationally in countries with weak legal systems and a great deal of economic
uncertainty. Before transition, service delivery was not a high priority for Communist
regimes–and infrastructure is still lacking. Many of these countries have been marked by
political instability–with governments falling regularly and no coherent party system for voters to
hold regimes accountable. What, then, drives tax compliance in these systems? I first estimate
a regression analysis of the 2002 BEEPS (see Table 2). The three most powerful factors (as
determined by the t-ratios) all reflect structural aspects of the firm: the size of the firm, which
Gehlbach (2006) found to be the strongest predictor of hidden taxes in the 1999 BEEPS, the

16
share of the firm owned by foreigners, and the size of the tax bill. The share owned by the state is
also a significant predictor of the share of income respondents believe that most firms report, as
are the number of competitors. Each of these structural factors promotes tax compliance, though
there is no additional impact from the total sales of a firm or whether a firm sells to customers
abroad.
_______________
Table 2 about here
Surprisingly, neither how common gift payments to tax collectors are nor the overall share of a
firm’s income goes to gift payments is significant in this estimation. Both are highly significant in
the 2005 estimation, however. Firms that believe they have influence on ministries will be less
likely to estimate high shares of revenue reported. Only one measure of services–the quality of
education–is significant, but since education is such a fundamental function of government, this
result is reassuring.
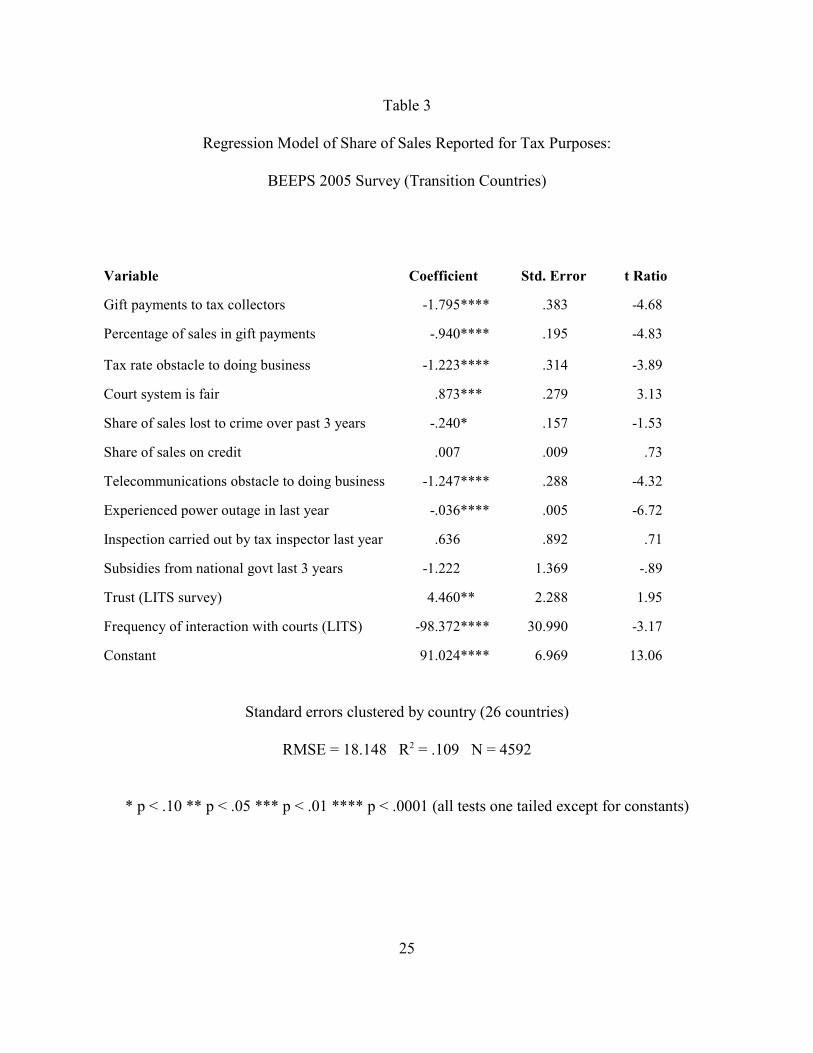
The model for the 2005 BEEPS is more in accord with my theoretical expectations (see Table 3).
There is no measure of firm size in the 2005 BEEPS so I cannot control for firm size (or
ownership). There is no simple question on tax rates, but the perception that the tax rate is an
obstacle to doing business has a strong (negative) impact on expectations for reporting income.
Government subsidies are not significant, nor is auditing (inspections carried out). There are
strong effects for gift payments–both how common these extra payments are to tax collectors and

17
the overall share of sales spent on gift payments (in sharp contrast to the 2002 results). The more
firms have to pay extra for routine services–and to tax collectors, the less they believe is reported
for taxes. The payments to tax collectors are likely made so that firms do not have to report their
full income, as investments in lower taxes.
Equally strong or even stronger are effects of the quality of government service on perceived tax
compliance. Respondents whose firms see telecommunications as an obstacle to doing business
or have experienced power outages in the past year are substantially less likely to perceive strong
tax compliance. Telecommunications and reliable power are essential to any firm doing business,
so failure in either of these arenas may lead firms to underpay their taxes.
The legal environment and the political culture are also critical to tax compliance. Respondents
who believe that the legal system is fair are substantially more likely to believe that most income
is reported, but those who say that they have lost significant business to crime are slightly less
prone to say that firms report their fair share. However, in countries where people have frequent
interaction with the courts, tax compliance is lower. Raiser, Rousso, and Steves (2004) argue that
the share of sales on credit is a good proxy for trust in economies where people have long had
little faith in strangers–and just as little experience in extending credit. Firms that give a
substantial share of their business on credit are no more likely to say that revenue is reported
accurately. However, an aggregate measure of trust from the Life in Transition Survey of the
European Bank for Reconstruction and Development is significant: Businesspeople living in4
countries with higher shares of trusting citizens report a larger share of their sales for tax

18
purposes. People rely on the courts when trust is lacking, not when it is strong (Uslaner, 2002,
43-46), so the contrary effects of trust and interaction with the courts on tax compliance make
sense.
________________
Table 3 about here
The frequency of gift payments to tax collectors is a major factor shaping tax compliance and
bears examination in its own right. I thus estimate a model for gift payments to tax collectors in
Table 4. The story of gift payments is straightforward: They do not reflect service quality and
there is little reason to expect them to do so (as reflected in the insignificant effect for power
outages). They do reflect a variety of measures of (dis)honesty in government and on the street as
well as corruption-based quality of government institutions. A key determinant of the frequency
of gift payments to tax collectors is the overall share of sales going to all gift payments. Beyond
that are two measures of judicial corruption: whether courts are uncorrupt and whether the
judiciary is an obstacle to doing business. The expectation that contracts will be enforced is not
significant. As with corruption more generally, what matters most is the fairness of the judicial
system rather than its efficiency (Uslaner, 2008, ch. 3). When firms cannot rely upon the courts,
they depend upon bribery. When the Mafia and street crime are obstacles to doing business and
when businesses must spend a large share of their revenue on security, respondents have lower
expectations of tax compliance.
_______________
Table 4 about here

19
The three country-level measures in the model confirm the findings at the individual level. The
greater the degree of corruption, as measured by the World Bank control of corruption measure
for 2004 (Kaufmann, Kraay, and Mastruzzi, 2005), the more common gift payments to tax
collectors are. And firms are more likely to make extra payments when the economy is fragile, as
represented by the Failed States 2006 indicator of sharp economic decline in a country. Sharp
economic decline makes people worry about the future and thus more concerned with protecting
their assets and keeping assets away from the grip of the state. Gift payments are also more
common in countries where the level of economic inequality has increased since transition. Tax
collection was simpler under Communism since there was little private income. In the new
market economies the wealthy become the target of tax collectors because they have greater
resources–and also because they are perceived as more likely to avoid taxation. As inequality
grows, the wealthy will be more likely to be targeted because of public pressure–but they will
also be better situated to avoid taxation by making gift payments to tax collectors. Gift payments
to tax collectors depend upon a shaky legal environment and high levels of corruption both in
high places and on the street.
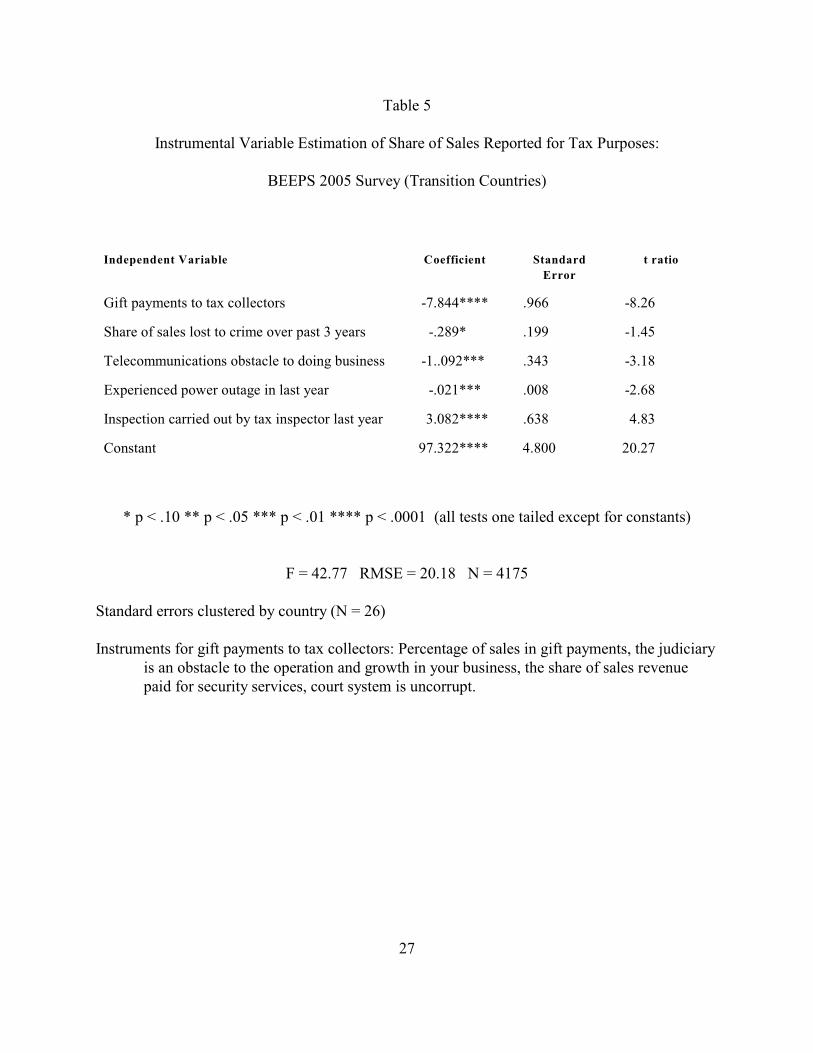
Gift payments to tax collectors are clearly endogenous, so I estimate an instrumental variables
regression (two-stage least squares) of the share of sales reported. The instruments I use for gift
payments to tax collectors are the percentage of all sales in gift payments, whether the judiciary
is an obstacle to business, the share of sales devoted to security services, and whether the court
system is uncorrupt (as in the hierarchical linear model in Table 5). I present the instrumental
variables regression in Table 5. The story is much the same as in Table 4: The instrument for gift

20
payments to tax collectors has by far the highest t ratio and there is a modest additional effect for
the share of sales lost to crime in the past three years. There are also strong effects, as in Table 4,
for whether telecommunications is an obstacle to business and whether the respondent’s firm
experienced power outages in the last year. As in the previous estimation, the (dis)honesty of
officials, street-level crime, and the quality of government services shape the expected share of
sales reported for tax purposes. So, in this estimation, does the strong arm of the law: In contrast
to previous estimations, there is now a powerful effect for whether tax inspectors carried out an
audit in the previous year.
_______________
Table 5 about here
Finally, I estimate an aggregate model across the 26 countries for the expected share of sales
reported for tax purposes in the 2005 BEEPS. The results largely confirm the individual-level
analyses (see Table 6). One key difference is that the greatest effect comes from an estimate of
the time respondents spend with public officials interpreting laws in the past year. The greater the
time spent with officials, the lower the expected rate of reporting–suggesting that this variable
may be tapping something beyond bureaucratic meetings. Where meetings consume the most
time, respondents expect 11.5 percent less of revenues to be reported than when the fewest
meetings occur.
_______________

21
Table 6 about here
Gift payments overall also matter: Where they are most prevalent, respondents believe that
revenue will be unreported by five additional percent (and their effect is slightly stronger at 5.7
percent when I exclude Armenia and Uzbekistan). The quality of electricity services also matters
strongly: Expected revenue reporting is almost 9 percent greater where public utilities are
evaluated most positively than when they are viewed most negatively. All of these are significant
effects since the mean expectation of reported revenue is almost 90 percent. And overall, both the
quality of services and the honesty of officials shape tax compliance more than any other factor
(save firm size in the 2002 BEEPS).
REPRISE
Transition countries are marked by high levels of corruption and weak government services.
People pay taxes and expect that the money they give to the state will go for public purposes and
not into the pockets of public officials. When corruption is widespread and public services,
especially those critical for business, are poor, people will be more likely to evade taxes. While
there are sporadic effects of enforcement in the models I estimated, the problem with tax
enforcement in transition countries is that the bureaucrats who enforce the laws may well be
corrupt themselves. The arm of the law seems to be bent rather than strong–as reflected in in the
powerful negative effect of time spent with bureaucrats on expected tax compliance in the
aggregate results.

22
Business elites see far less corruption than do ordinary citizens, so the results I have presented
likely underestimate tax avoidance. My findings are similar to those of Hanousek and Palda
(2004; cf. Uslaner, 2007) for the Czech Republic using more direct measures of tax compliance
for the general public. So the lesson seems clear: People pay taxes when they believe that they
are getting something for their money. The social contract underlying tax collection is not among
citizens, but between citizens and the state.
I cannot estimate a more complex model incorporating both firm structure, corruption, and the
quality of government services. The 2002 BEEPS has good measures of firm structure and the
2005 BEEPS has better indicators of corruption and the quality of services. The models I have
estimated suggest that all three sets of factors matter. Potential reformers who wish to get greater
compliance with tax laws should promote policies that foster both greater liberalization, more
transparency, and especially better provision of government services. Foreign investment clearly
leads to greater tax compliance. Larger firms pay larger shares in taxes, so economic policies that
promote the establishment of large firms with substantial foreign investment will lead to greater
tax compliance. So will less corruption–though how to make the polity more honest is not so
straightforward (Uslaner, 2008, esp. ch. 7). Perhaps the best advice that one can give a reformer
is: Make the government work. It’s not just that people get what they pay for. They pay for what
they get.

23
Table 1
Descriptive Data from the BEEPS Surveys by Country
Sales Reported to TaxAuthorities 2002
Share of Sales in GiftPayments 2002
Sales Reported to TaxAuthorities 2005
Share of Sales in GiftPayments 2005
Albania 77.5 3.1 77.0 6.2
Armenia 90.8 3.6 95.4 0.9
Azerbaijan 86.9 3.8 84.4 4.3
Belarus 91.9 2.7 92.8 1.0
Bosnia 67.5 3.1 88.2 .5
Bulgaria 82.8 3.0 86.5 3.3
Croatia 87.3 2.6 92.4 .7
Czech Republic 90.2 3.2 86.9 1.8
Estonia 92.7 2.9 96.9 .5
Georgia 64.3 4.2 89.1 .6
Hungary 88.5 2.8 88.1 2.5
Kazakhstan 82.7 3.2 93.5 1.7
Kyrgyzstan 73.9 3.5 85.4 2.2
Latvia 87.4 2.6 92.9 1.7
Lithuania 85.3 3.1 89.7 2.0
Macedonia 63.8 3.1 76.5 1.8
Moldova 79.5 3.5 88.2 .6
Poland 90.2 2.7 89.5 1.0
Romania 86.6 3.2 93.7 .7
Russia 82.0 3.2 84.5 2.0
Serbia 74.0 2.5 87.7 1.4
Slovakia 86.9 3.1 95.5 1.9
Slovenia 82.0 2.9 92.8 .5
Tajikistan 72.2 -- 91.0 1.1
Ukraine 85.4 3.7 89.3 1.8
Uzbekistan 89.5 3.6 97.0 1.4

24
Table 2
Regression Model of Perceived Share of Income Reported by Firms for Tax Purposes:
BEEPS 2002 Survey (Transition Countries)
Variable Coefficient Std. Error t Ratio
Size of tax bill 3.193**** .761 4.20
Gift payments to tax collectors .486 .598 .81
Percent of income in gift payments .195 .656 .30
Quality of education 2.147**** .606 3.54
How much influence firm has on ministry -1.526** .812 -1.88
Size of firm (employees) 9.068**** 1.209 7.50
Total sales of firm -.431 .331 -1.30
Number of competitors 3.659*** 1.379 2.65
Share owned by state .130*** .043 3.00
Share owned by foreigners .149**** .029 5.23
Firm sells to customers abroad .709 1.743 .41
Constant 16.427* 7.487 2.19
RMSE = 28.901 R = .107 N = 14112
** p < .05 **** p < .0001 (all tests one tailed except for constants)
Model estimated with robust standard errors
25
Table 3
Regression Model of Share of Sales Reported for Tax Purposes:
BEEPS 2005 Survey (Transition Countries)
Variable Coefficient Std. Error t Ratio
Gift payments to tax collectors -1.795**** .383 -4.68
Percentage of sales in gift payments -.940**** .195 -4.83
Tax rate obstacle to doing business -1.223**** .314 -3.89
Court system is fair .873*** .279 3.13
Share of sales lost to crime over past 3 years -.240* .157 -1.53
Share of sales on credit .007 .009 .73
Telecommunications obstacle to doing business -1.247**** .288 -4.32
Experienced power outage in last year -.036**** .005 -6.72
Inspection carried out by tax inspector last year .636 .892 .71
Subsidies from national govt last 3 years -1.222 1.369 -.89
Trust (LITS survey) 4.460** 2.288 1.95
Frequency of interaction with courts (LITS) -98.372**** 30.990 -3.17
Constant 91.024**** 6.969 13.06
Standard errors clustered by country (26 countries)
RMSE = 18.148 R = .109 N = 45922
* p < .10 ** p < .05 *** p < .01 **** p < .0001 (all tests one tailed except for constants)

26
Table 4
Regression Model of Gift Payments to Tax Collectors:
BEEPS 2005 Survey (Transition Countries)
Variable Coefficient Std. Error t Ratio
Percentage of sales in gift payments .090**** .019 4.78
Contracts will be enforced -.034 .029 -1.15
Courts uncorrupt -.068**** .013 -5.04
Judiciary an obstacle to doing business .077**** .019 4.02
Street crime an obstacle to doing business .060** .028 2.19
Mafia an obstacle to doing business .070** .028 1.73
Share of sales pay for security services .036*** .013 2.76
Service interruption: Power outage .001 .002 .62
World Bank Corruption Control (2004) -.300**** .087 -3.44
Sharp economic decline (Failed States) -.098*** .030 -3.24
WIDER Change in Gini 1989-present .484*** .170 2.84
Constant 1.233** .333 3.71
Standard errors clustered by country (19 countries)
RMSE = 1.129 R = .151 N = 31072
* p < .10 ** p < .05 *** p < .01 **** p < .0001 (all tests one tailed except for constants)
27
Table 5
Instrumental Variable Estimation of Share of Sales Reported for Tax Purposes:
BEEPS 2005 Survey (Transition Countries)
Independent Variable Coefficient Standard
Error
t ratio
Gift payments to tax collectors -7.844**** .966 -8.26
Share of sales lost to crime over past 3 years -.289* .199 -1.45
Telecommunications obstacle to doing business -1..092*** .343 -3.18
Experienced power outage in last year -.021*** .008 -2.68
Inspection carried out by tax inspector last year 3.082**** .638 4.83
Constant 97.322**** 4.800 20.27
* p < .10 ** p < .05 *** p < .01 **** p < .0001 (all tests one tailed except for constants)
F = 42.77 RMSE = 20.18 N = 4175
Standard errors clustered by country (N = 26)
Instruments for gift payments to tax collectors: Percentage of sales in gift payments, the judiciaryis an obstacle to the operation and growth in your business, the share of sales revenuepaid for security services, court system is uncorrupt.

28
Table 6
Aggregate Regression: Share of Sales Reported for Tax Purposes:
BEEPS 2005 Survey (Transition Countries)
Variable Coefficient Std.Error
t Ratio
Percentage of sales in gift payments -1.867** 1.017 -1.84
Electricity obstacle to doing business -11.631**** 3.178 -3.66
Time with public officials interpreting laws last year -1.178**** .267 -4.41
Constant 114.325**** 4.540 25.18
RMSE = 2.870 R = .733 N= 262
** p < .05 **** p < .0001 (all tests one tailed except for constants)

29
REFERENCES
Alm, J., Martinez-Vazquez, J. and Torgler, B. (2004) ‘Russian attitudes toward paying
taxes–before, during, and after the transition,’ Unpublished paper, Andrew Young
School of Public Policy, Georgia State University.
Beron, K.., Tauchen, H.V. and Witte, A.D. (1992) “The effect of audits on reporting behavior,”
in J. Slemrod, (ed), Why People Pay Taxes, Ann Arbor: University of Michigan Press.
Citrin, J. (1974) “Comment: The Political Relevance of Trust in Government,” American
Political Science Review, 68 (September):973-88.
Easter, G.M. (2007) “Taxation and state re-formation in russia: policy, capacity, compliance,.” in
N. Hayoz and S. Hug, (eds), Tax Evasion, Trust, and State Capacities, Bern: Peter Lang.
Feld, L. P. and Frey, B.S. (2007) “Tax evasion in switzerland: the roles of deterrence and tax
morale,” in N. Hayoz and S. Hug, (eds), Tax Evasion, Trust, and State Capacities, Bern:
Peter Lang.
Flap, H. and Volker, B. (2003) “Communist societies, the velvet revolution, and weak ties: the
case of East Germany,” in G. Badescu and E.M. Uslaner (eds), Social Capital and the
Transition to Democracy, London: Routledge.
Gehlbach, S. (2006) “The consequences of collective action; an incomplete-contracts approach,”
American Journal of Political Science, 50: 802-23.
Gupta, S., Davoodi, H.R., and Tiongson, E.R. (2002) “Corruption and the provision of health
care and education services,” in G.T. Abed and S. Gupta., (eds), Corruption and
Economic Performance, Washington: International Monetary Fund.
Hanousek, J. and Palda, F. (2004) “Quality of government services and the civic duty to pay

30
taxes in the Czech and Slovak republics, and other transition countries,” Kyklos, 57:237-
52.
_________________________. (2007) “The evolution of tax evasion in the Czech republic: a
markov chain analysis,” in N. Hayoz and S. Hug, (eds), Tax Evasion, Trust, and State
Capacities, Bern: Peter Lang.
Karklins, R. (2005) The System made me do it: corruption in post-communist societies, Armonk,
New York: M.E. Sharpe.
Kaufmann, D., Kray, A. and Mastruzzi, M. (2005) “Governance Matters IV: Governance
Indicators for 1996-2004,” Washington: World Bank, at
http://www.worldbank.org/wbi/governance/pubs/govmatters4.html .
Kolarska-Bobinska, L. (2002) “The impact of corruption on legitimacy of authority in new
democracies,” In S.Kotkin and A. Sajo, eds., Political Corruption in Transition: A
Skeptic’s Handbook, Budapest: CEU Press.
Kornai, J. (2000) “Hidden in an envelope: gratitude payments to medical doctors in Hungary,” at
http://www.colbud.hu/honesty-trust/kornai/pub01.PDF
Kramer, A. (2004) “He doesn’t make coffee, but he controls ‘Starbucks’ in Russia,” New York
Times Washington edition (October 12):C1, C4.
_____________. (2006) “From Russia with dread: american faces a truly hostile takeover
attempt at his factory,” New York Times Washington edition (May 16):C1, C4.
Kramer, J.M. (1977) “Political corruption in the U.S.S.R.,” Western Political Quarterly, 30:213-
224.
Ledeneva, A. (1998) Russia’s Economy of Favours, Cambridge: Cambridge University Press.

31
Mauro, P. (2002) “The effects of corruption on growth and public expenditure.” In A.
Heidenheimer and M. Johnston, eds. Political Corruption, third ed., New Brunswick, NJ:
Transaction.
Miller, W. L., Grodeland, A.B. and Koshechkina, T.Y. (2001) A Culture of Corruption: Coping
with Government in Post-Communist Europe, Budapest: CEU Press.
Office of Research. (1999) “On the take: central and east European attitudes toward corruption,”
Washington: Department of State.
Ott, K.. (2007) “What do state capacity and trust have to do with the evolution of the informal
economy and tax evasion in Croatia?” in N. Hayoz and S. Hug, (eds), Tax Evasion,
Trust, and State Capacities, Bern: Peter Lang.
Owsiak, S. (2007) “Taxes in Post-Communist Countries–Old and New Challenges,” in N. Hayoz
and S. Hug, (eds), Tax Evasion, Trust, and State Capacities, Bern: Peter Lang.
Popov, Nikolai. (2006). “T o Give and Take,” available at
http://www.indem.ru/en/publicat/Popov/Give&Take.htm
Rosser, J. B., Rosser, M.V. and Ahmed, E. (2000) “Income inequality and the informal economy
in transition countries,” Journal of Comparative Economics, 28: 156-171.
Rothstein, B. (2001) “Trust, social dilemmas, and collective memories: on the rise and decline
of the Swedish model,” Journal of Theoretical Politics, 12:477-499.
Scholz, J.T. (2007) “Contractual compliance: tax institutions and tax morale in the U.S,” in N.
Hayoz and S. Hug, (eds), Tax Evasion, Trust, and State Capacities, Bern: Peter Lang.
Smith, K.W. (1992) “Reciprocity and fairness: positive incentives for taxpayer compliance,” in J.
Slemrod (ed)., Why People Pay Taxes, Ann Arbor: University of Michigan Press.
32
Tavits, M. “Causes of corruption: testing competing hypotheses,” paper presented at the Joint
Sessions of Workshops, European Consortium for Political Research, Nicosia, Cyprus,
April, 2005 at
http://www.nuffield.ox.ac.uk/Politics/papers/2005/Tavits%20Nuffield%20WP.pdf.
Torgler, B. (2003) “Tax morale in transition countries,” Post-Communist Economies, 15: 357-81.
____________. (2007) “Tax morale in central and eastern European countries,” in N. Hayoz and
S. Hug (eds), Tax Evasion, Trust, and State Capacities, Bern: Peter Lang
Torgler, B.and Schneider, F. (2006) “What shapes attitudes toward paying taxes? Evidence form
multicultural European countries,” Institute for the Study of Labor, IZA DP No. 2117,
Bonn, Germany.
Uslaner, E.M. (2002). The Moral Foundations of Trust, New York: Cambridge University Press.
_____________. (2007). “Tax evasion, trust, and the strong arm of the law,” in N. Hayoz and S.
Hug, (eds), Tax Evasion, Trust, and State Capacities, Bern: Peter Lang.
____________. (2008). Corruption, Inequality, and the Rule of Law: The Bulging Pocket Makes
the Easy Life. New York: Cambridge University Press.
Uslaner, E.M. and G. Badescu. (2004) “Honesty, trust, and legal norms in the transition to
democracy: why Bo Rothstein is better able to explain Sweden than Romania,” In J.
Kornai, S. Rose-Ackerman, and B. Rothstein (eds), Creating Social Trust: Problems of
Post-Socialist Transition, New York: Palgrave.
World Bank. (2004) Doing Business in 2004: Understanding Regulation, Washington: World
Bank at http://www.doingbusiness.org/Documents/DB2004-full-report.pdf .

33
1. On the BEEPS surveys, see
http://www.ebrd.com/country/sector/econo/surveys/beeps.htm. For the sampling in 2002
and 2005, respectively, see
http://www.ebrd.com/country/sector/econo/surveys/beeps02r.pdf and
http://www.ebrd.com/country/sector/econo/surveys/beeps05r.pdf.
2. These figures are based on ratings of 1 or 2 on a six point scale.
3. The WIDER data are available at http://www.wider.unu.edu/wiid/wiid.htm .
4. The trust measure is a six point scale of the standard question, “Generally speaking, do
you believe that most people can be trusted or can’t you be too careful in dealing with
people?” I am grateful to Franklin Steves of EBRD for making the data available to me.
Details of the EBRD survey are at http://www.ebrd.com/pubs/econo/lits.pdf .
NOTES
* This paper draws on Uslaner (2007a) and especially Uslaner (2007b). I am grateful for
the sustained comments on my research from Bo Rothstein, Gabriel Badescu, Mark
Lichbach, and Jong-sung You. I am also grateful to the General Research Board of the
University of Maryland–College Park for generous released time.


![[Click here and type Syllabus Title] - Tripod.comcrim74.tripod.com/sitebuildercontent/sitebuilderfiles/GCEsyllabus.pdf · The use of tables is prohibited in SC/O level Mathematics](https://static.fdocuments.in/doc/165x107/5abc83c17f8b9a567c8de7e9/click-here-and-type-syllabus-title-use-of-tables-is-prohibited-in-sco-level.jpg)