Tax and social policy reform: Some lessons from new EU member states
22
Tax and social Tax and social policy reform: policy reform: Some lessons from Some lessons from new EU member new EU member states states Ben Slay Ben Slay Senior economist Senior economist UNDP Bureau for Europe and CIS UNDP Bureau for Europe and CIS 12 January 2000 12 January 2000
-
Upload
heremon-ivers -
Category
Documents
-
view
24 -
download
2
description
Tax and social policy reform: Some lessons from new EU member states. Ben Slay Senior economist UNDP Bureau for Europe and CIS 12 January 2000. Presentation topics. Tax reform and: EU accession Links to social policy, labour market reform - PowerPoint PPT Presentation
Transcript of Tax and social policy reform: Some lessons from new EU member states
Tax and social Tax and social policy reform: policy reform: Some lessons Some lessons from new EU from new EU
member statesmember states
Ben SlayBen SlaySenior economistSenior economist
UNDP Bureau for Europe and CISUNDP Bureau for Europe and CIS12 January 200012 January 2000

Presentation topicsPresentation topics
Tax reform and:Tax reform and:– EU accessionEU accession– Links to social policy, labour market reformLinks to social policy, labour market reform
Initial lessons from 5 new member Initial lessons from 5 new member states that have:states that have:– Combined these reformsCombined these reforms– Introduced flat taxesIntroduced flat taxes
Tentative conclusions: Tentative conclusions: – Reforms have been successfulReforms have been successful– Useful experience for Turkey?Useful experience for Turkey?

GDP in the EU NMS: GDP in the EU NMS: How does Turkey How does Turkey
compare?compare?91 90
71 68 63 6256 56
44 39 42
0
100
2008 per-capita GDP (in PPS terms, EU average = 100), Eurostat data

Which countries?Which countries?
Estonia

What’s a flat tax?What’s a flat tax?
Key feature: A single, proportionate Key feature: A single, proportionate tax ratetax rate
Other common features:Other common features:– Fewer exemptions, deductionsFewer exemptions, deductions– Same rate for different taxes (PIT, CIT, Same rate for different taxes (PIT, CIT,
VAT . . . )VAT . . . )– Attempt to align Attempt to align de jure de jure tax systems tax systems
with with de facto de facto capacity capacity
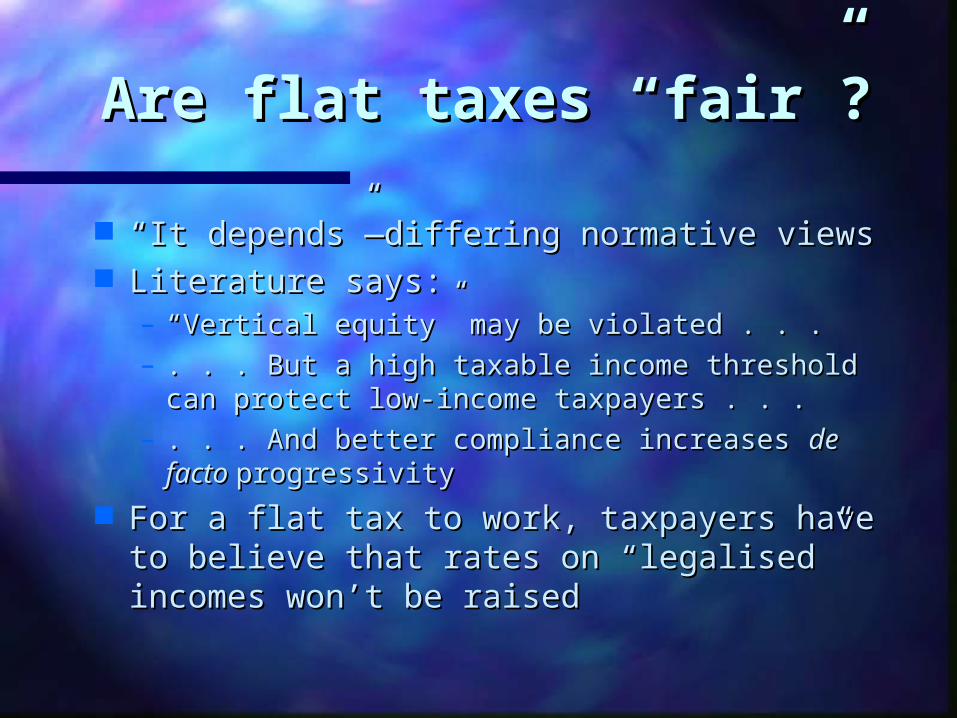
Are flat taxes “fair”?Are flat taxes “fair”?
““It depends”—differing normative viewsIt depends”—differing normative views Literature says:Literature says:
– ““Vertical equity” may be violated . . .Vertical equity” may be violated . . .– . . . But a high taxable income threshold can . . . But a high taxable income threshold can
protect low-income taxpayers . . .protect low-income taxpayers . . .– . . . And better compliance increases . . . And better compliance increases de de
facto facto progressivityprogressivity For a flat tax to work, taxpayers have to For a flat tax to work, taxpayers have to
believe that rates on “legalised” believe that rates on “legalised” incomes won’t be raisedincomes won’t be raised
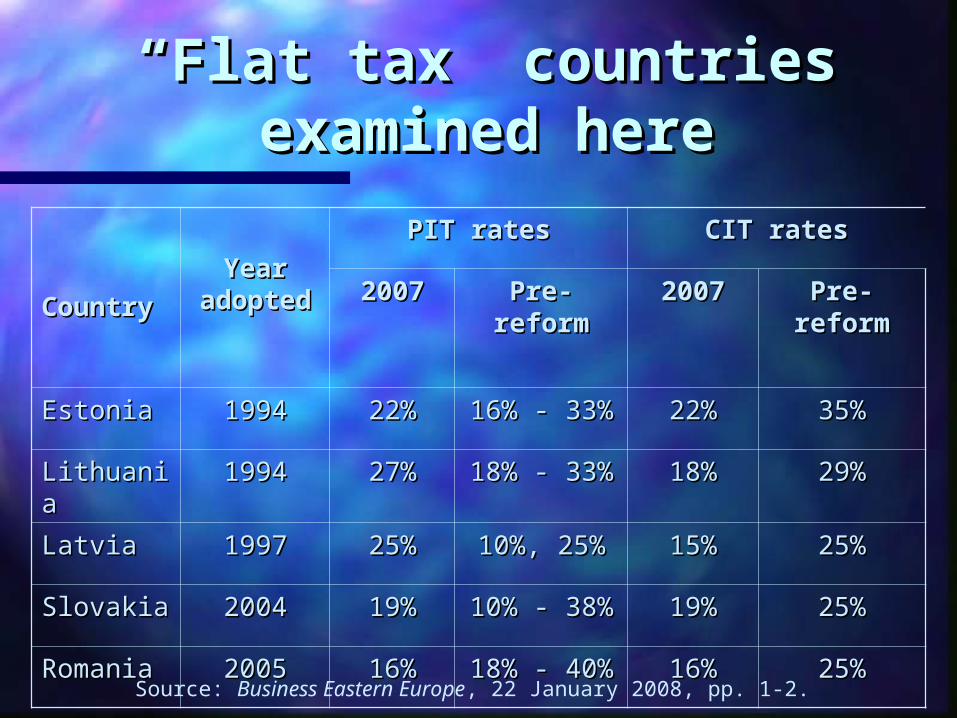
““Flat tax” countries Flat tax” countries examined hereexamined here
CountryCountryYear Year
adoptedadopted
PIT ratesPIT rates CIT ratesCIT rates
20072007 Pre-Pre-reformreform
20072007 Pre-Pre-reformreform
EstoniaEstonia 19941994 22%22% 16% - 33%16% - 33% 22%22% 35%35%
LithuaniaLithuania 19941994 27%27% 18% - 33%18% - 33% 18%18% 29%29%
LatviaLatvia 19971997 25%25% 10%, 25%10%, 25% 15%15% 25%25%
SlovakiaSlovakia 20042004 19%19% 10% - 38%10% - 38% 19%19% 25%25%
RomaniaRomania 20052005 16%16% 18% - 40%18% - 40% 16%16% 25%25%
Source: Business Eastern Europe, 22 January 2008, pp. 1-2.
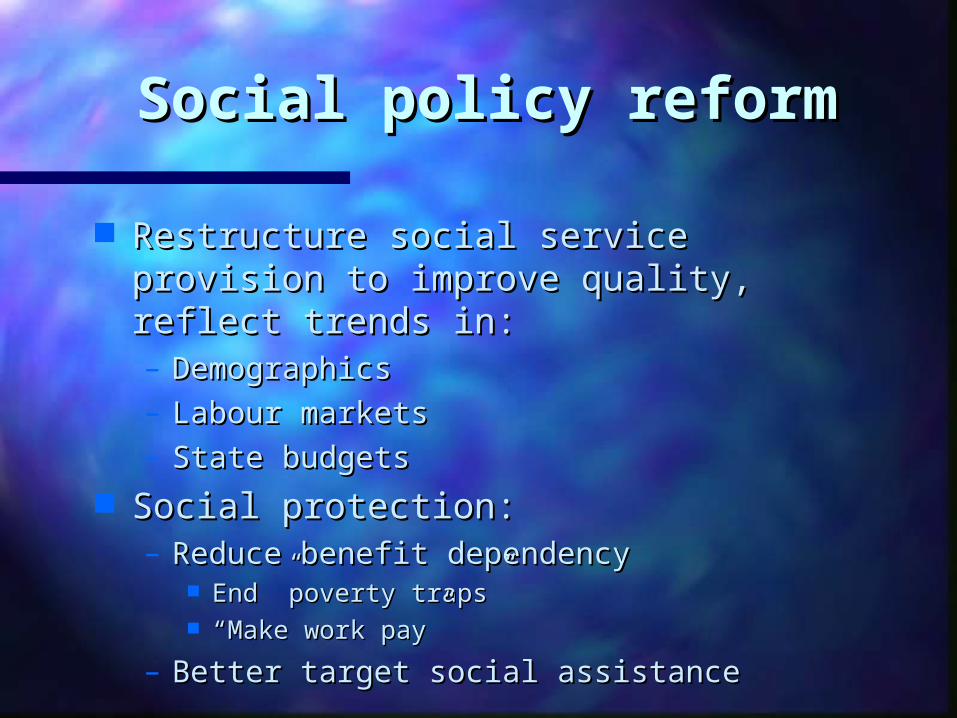
Social policy reformSocial policy reform
Restructure social service provision to Restructure social service provision to improve quality, reflect trends in:improve quality, reflect trends in:– DemographicsDemographics– Labour markets Labour markets – State budgetsState budgets
Social protection:Social protection:– Reduce benefit dependency Reduce benefit dependency
End ”poverty traps”End ”poverty traps” ““Make work pay”Make work pay”
– Better target social assistance Better target social assistance
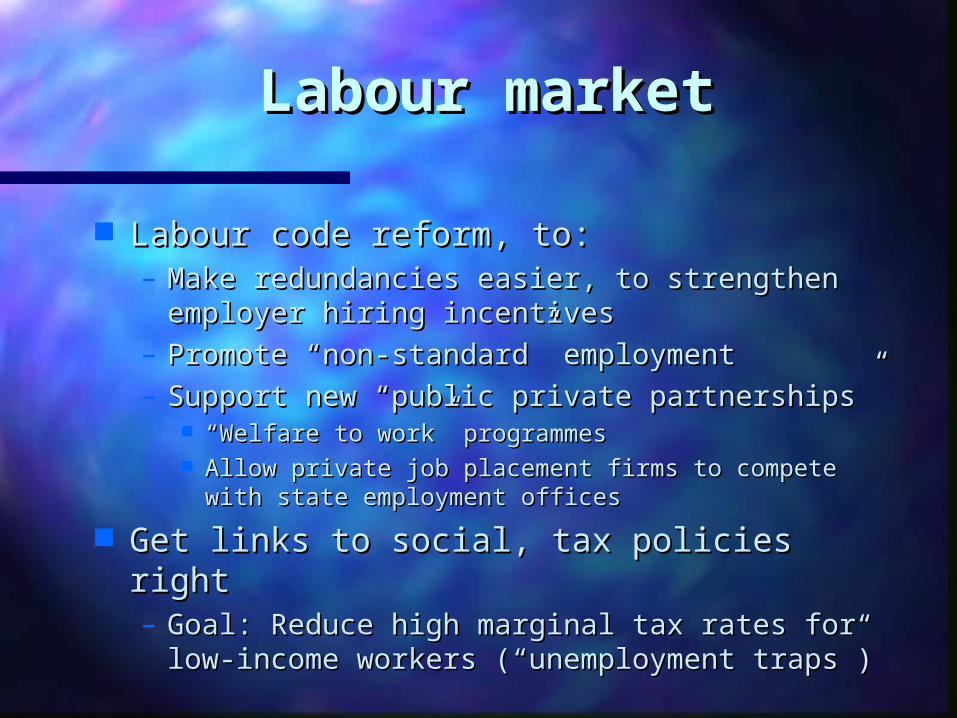
Labour marketLabour market
Labour code reform, to:Labour code reform, to:– Make redundancies easier, to strengthen Make redundancies easier, to strengthen
employer hiring incentivesemployer hiring incentives– Promote “non-standard” employmentPromote “non-standard” employment– Support new “public private partnerships”Support new “public private partnerships”
““Welfare to work” programmesWelfare to work” programmes Allow private job placement firms to compete Allow private job placement firms to compete
with state employment officeswith state employment offices
Get links to social, tax policies rightGet links to social, tax policies right– Goal: Reduce high marginal tax rates for Goal: Reduce high marginal tax rates for
low-income workers (“unemployment low-income workers (“unemployment traps”)traps”)

Performance criteria Performance criteria for assessing reforms’ for assessing reforms’
impactimpact
Output (GDP)Output (GDP) Labour market:Labour market:
– EmploymentEmployment– UnemploymentUnemployment
Fiscal trendsFiscal trends Poverty and Poverty and
inequalityinequality
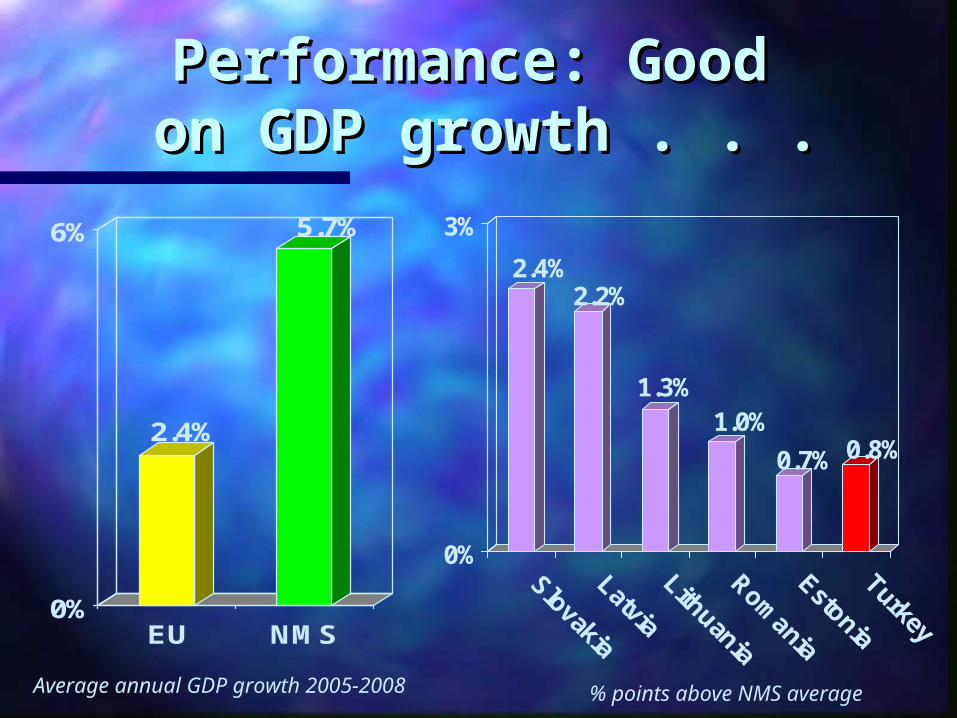
Performance: Good Performance: Good on GDP growth . . .on GDP growth . . .
2.4%
5.7%
0%
6%
EU NMS
2.4%2.2%
1.3%1.0%
0.7% 0.8%
0%
3%
Average annual GDP growth 2005-2008 % points above NMS average
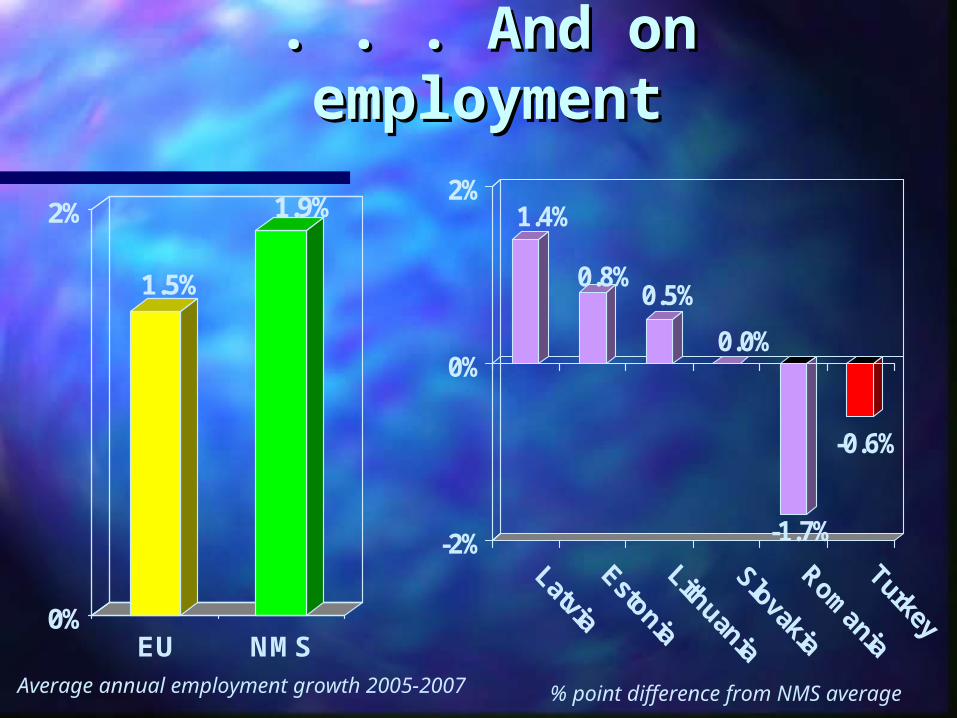
. . . And on . . . And on employmentemployment
1.5%
1.9%
0%
2%
EU NMS
1.4%
0.8%0.5%
0.0%
-1.7%
-0.6%
-2%
0%
2%
Average annual employment growth 2005-2007 % point difference from NMS average
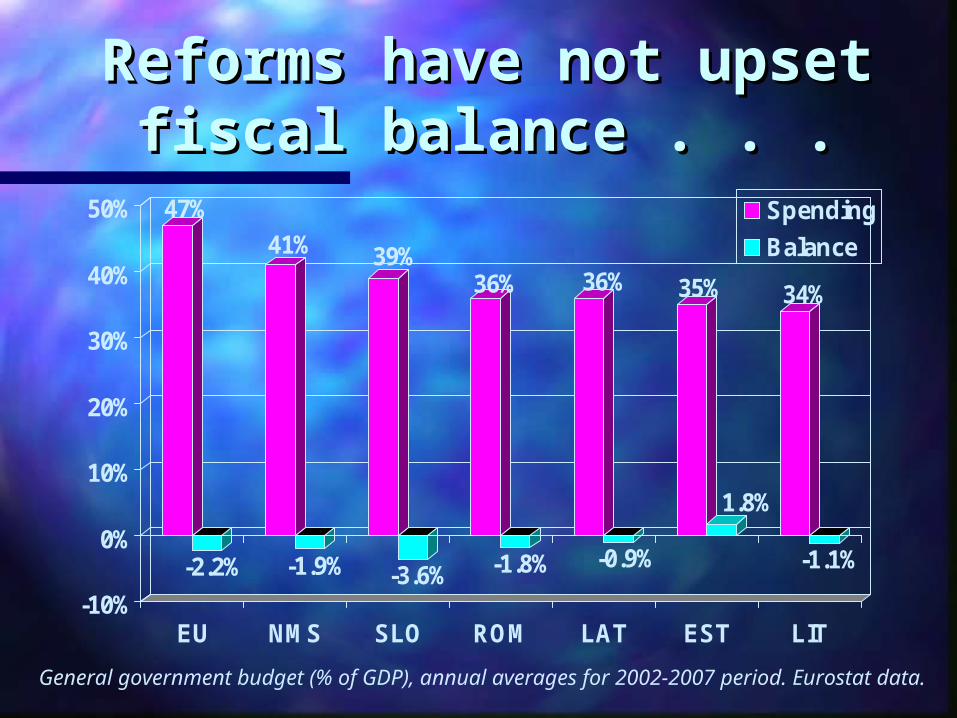
Reforms have not Reforms have not upset fiscal upset fiscal balance . . .balance . . .
47%
-2.2%
41%
-1.9%
39%
-3.6%
36%
-1.8%
36%
-0.9%
35%
1.8%
34%
-1.1%
-10%
0%
10%
20%
30%
40%
50%
EU NMS SLO ROM LAT EST LIT
Spending
Balance
General government budget (% of GDP), annual averages for 2002-2007 period. Eurostat data.

. . . Or produced large . . . Or produced large public debtspublic debts
59%
31% 29%
17%13%
10%
4%
39%
0%
60%
EU NMS SLO LIT ROM LAT EST TUR
General government debt, % of GDP, 2007
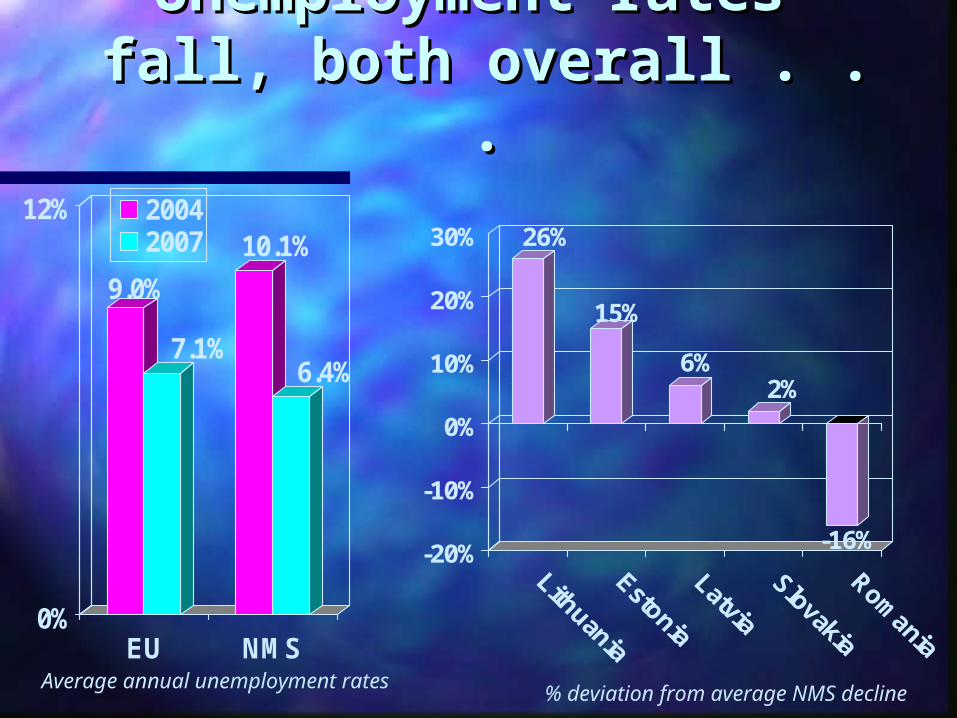
Unemployment rates Unemployment rates fall, both overall . . .fall, both overall . . .
26%
15%
6%2%
-16%-20%
-10%
0%
10%
20%
30%
Average annual unemployment rates% deviation from average NMS decline
9.0%
7.1%
10.1%
6.4%
0%
12%
EU NMS
20042007

. . . And for youth . . . And for youth unemploymentunemployment
28%
18%
5% 3%
-28%-30%
0%
30%
Average annual youth unemployment rates % deviation from average NMS decline
18.4%
15.3%
21.9%
14.1%
0%
24%
EU NMS
20042007
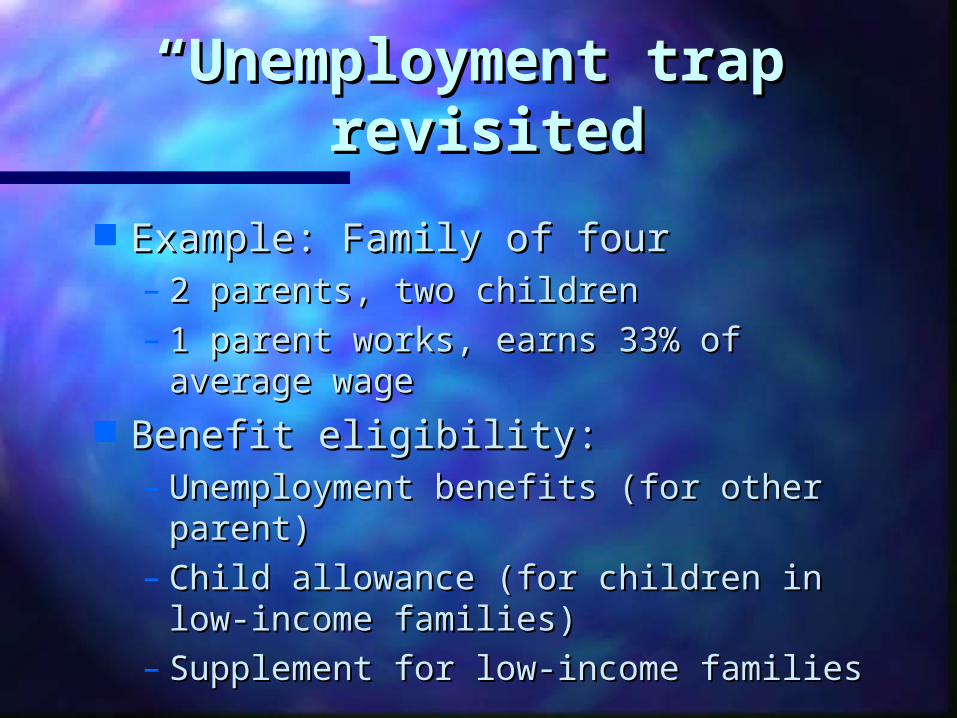
““Unemployment trap” Unemployment trap” revisitedrevisited
Example: Family of fourExample: Family of four– 2 parents, two children2 parents, two children– 1 parent works, earns 33% of average 1 parent works, earns 33% of average
wagewage Benefit eligibility:Benefit eligibility:
– Unemployment benefits (for other Unemployment benefits (for other parent)parent)
– Child allowance (for children in low-Child allowance (for children in low-income families)income families)
– Supplement for low-income familiesSupplement for low-income families

Question: Question: Do benefits fall as Do benefits fall as earned income rises?earned income rises?
Answer: Answer: Yes, a lotYes, a lot
40%
60%
80%
2001 2002 2003 2004 2005 2006 2007
EU NMS
Effective tax rate on additional earned income, in form of lost benefits
Q: Why take the work? (Unemployment trap)
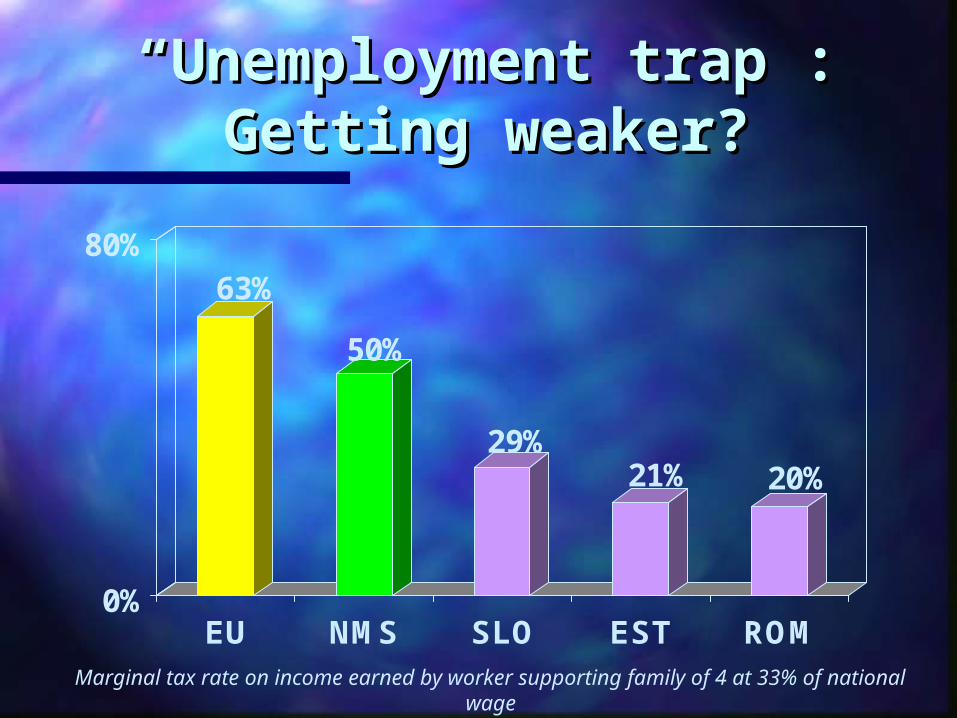
““Unemployment trap”: Unemployment trap”: Getting weaker?Getting weaker?
63%
50%
29%21% 20%
0%
80%
EU NMS SLO EST ROM
Marginal tax rate on income earned by worker supporting family of 4 at 33% of national wage
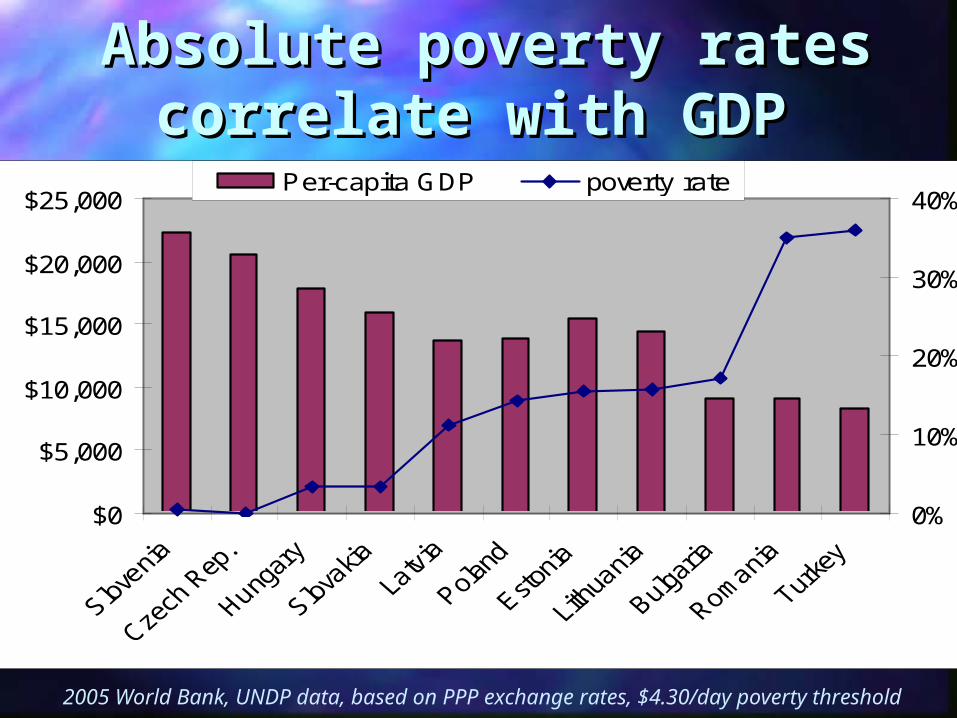
Absolute poverty rates Absolute poverty rates correlate with GDPcorrelate with GDP
2005 World Bank, UNDP data, based on PPP exchange rates, $4.30/day poverty threshold
$0
$5,000
$10,000
$15,000
$20,000
$25,000
0%
10%
20%
30%
40%Per-capita GDP poverty rate
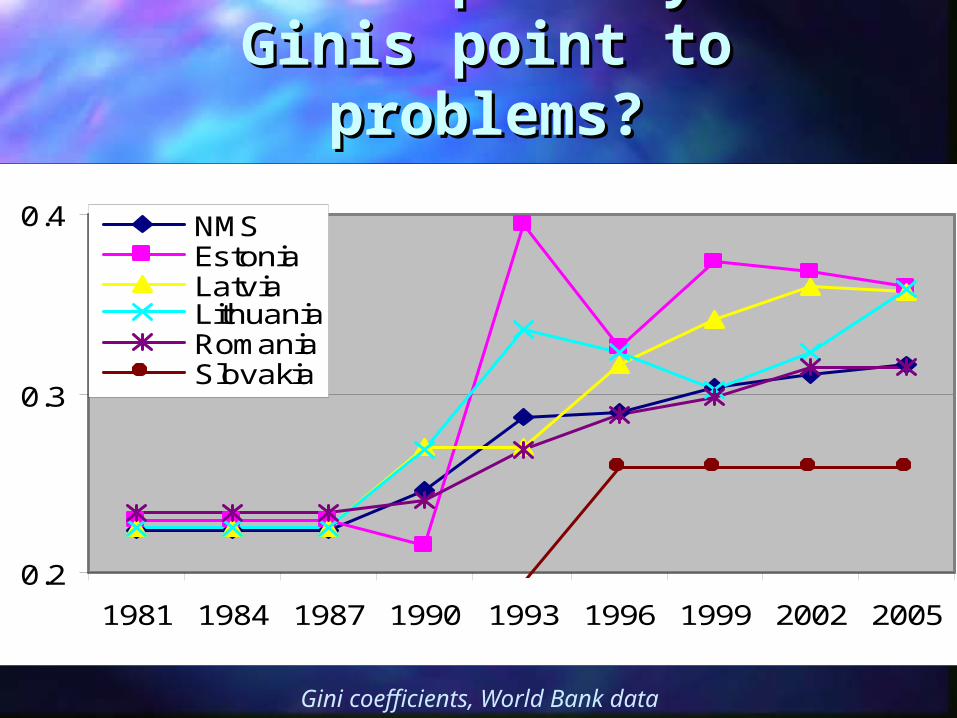
Relative poverty: Do Relative poverty: Do Ginis point to Ginis point to
problems?problems?
0.2
0.3
0.4
1981 1984 1987 1990 1993 1996 1999 2002 2005
NMSEstoniaLatviaLithuaniaRomaniaSlovakia
Gini coefficients, World Bank data
ConclusionsConclusions
Tax reform: Not only about growthTax reform: Not only about growth– It’s also about poverty reduction, social It’s also about poverty reduction, social
inclusioninclusion Key questions—Links between taxes and:Key questions—Links between taxes and:
– Labour, social policyLabour, social policy– Joint inclusion memorandum (in accession Joint inclusion memorandum (in accession
negotiations)negotiations) When “done right”, flat tax reform can: When “done right”, flat tax reform can:
– Reduce povertyReduce poverty– Support social solidaritySupport social solidarity– Perhaps at the cost of higher inequalityPerhaps at the cost of higher inequality