Taurus Mutual Fund · Taurus Mutual Fund Toll Free No.1800 108 1111 ... 3 Years 4.72 5.60 7.13 7.38...
28
ABRIDGED ANNUAL REPORT 2017 - 18 Taurus Mutual Fund Toll Free No.1800 108 1111 www.taurusmutualfund.com An expert team of professionals to drive your investment Taurus Mutual Fund Managing an AAUM of `566 Crs. (FY 2017 - 2018) Product Basket 7 Equity Funds 1 Liquid Fund 1 Equity Linked Saving Scheme Professional Service Providers: Registrar & Transfer Agent : Karvy Computershare Pvt. Ltd. Custodian: SBI-SG Global Securities Services Pvt. Ltd. Fund Accountant : SBI-SG Global Securities Services Pvt. Ltd. An Experienced and Professional Team across all Functions
Transcript of Taurus Mutual Fund · Taurus Mutual Fund Toll Free No.1800 108 1111 ... 3 Years 4.72 5.60 7.13 7.38...

ABRIDGED ANNUAL REPORT 2017 - 18
Taurus Mutual Fund
Toll Free No.1800 108 1111www.taurusmutualfund.com
An expert team of professionals to drive your investment
Taurus Mutual Fund
Managing an AAUM of `566 Crs. (FY 2017 - 2018)
Product Basket
7 Equity Funds
1 Liquid Fund
1 Equity Linked Saving Scheme
Professional Service Providers:
Registrar & Transfer Agent : Karvy Computershare Pvt. Ltd.
Custodian: SBI-SG Global Securities Services Pvt. Ltd.
Fund Accountant : SBI-SG Global Securities Services Pvt. Ltd.
An Experienced and Professional Team across all Functions
Please refer Common Scheme Information Document (CSID) / Common Key Information Memorandum (CKIM) for details on Product Labeling
SPONSOR : HB Portfolio Limited
TRUSTEE : Taurus Investment Trust Company Limited CIN: U65990MH1993PLC072984
ASSET MANAGEMENT COMPANY : Taurus Asset Management Company Limited CIN: U67190MH1993PLC073154
AUDITORS : M/s M.P. Chitale & Co.
CUSTODIAN : SBI-SG Global Securities Services Pvt. Ltd.
REGISTRAR & TRANSFER AGENT : Karvy Computershare Private Limited
FUND ACCOUNTANT : SBI-SG Global Securities Services Pvt. Ltd.
PRODUCT BASKET
Taurus Investment Trust Company Limited
Mr. G. N. Tandon
Mr. K. N. Goyal
Mr. Harbhajan Singh
Mr. Anil Goyal
Mr. Yash Kumar Sehgal
Taurus Asset Management Company Limited
Mr. J. P. Kundra
Mr. M. G. Gupta
Mr. Lalit Bhasin
Maharaj Jai Singh
Mr. R. K. Gupta, M. D.
Mr. Harbans Lal
BOARD OF DIRECTORS
Ground Floor, AML Centre-1, 8 Mahal Industrial Estate, Mahakali Caves Road, Andheri (E), Mumbai - 400 093.Email: [email protected] • Website: www.taurusmutualfund.com
ABRIDGED ANNUAL REPORT 2017 - 2018
Note : This Scheme stand merged with Taurus Liquid Fund w.e.f May 3, 2018.*
• Taurus Starshare (Multi Cap) Fund
• Taurus Largecap Equity Fund
• Taurus Discovery (Midcap) Fund
• Taurus Tax Shield
• Taurus Ethical Fund
• Taurus Infrastructure Fund
• Taurus Banking & Financial Services Fund
• Taurus Nifty Index Fund
• Taurus Liquid Fund
• *Taurus Ultra Short Term Bond Fund
• *Taurus Short Term Income Fund
• *Taurus Dynamic Income Fund

Ground Floor, AML Centre-1, 8 Mahal Industrial Estate, Mahakali Caves Road, Andheri (E), Mumbai - 400 093.Email: [email protected] • Website: www.taurusmutualfund.com
1
Dear Unit Holders,
Team Taurus thanks you for your continued patronage.
Financial year 2018 ended with the micro economics of India appearing to fall in place.
The Indian Equity markets turned out another good year of performance and the investor confidence remained intact. This was also due to the fact that the major global economies, led by the United States, continued to do well. The Geo Political tensions in the Middle East also seemed to be tapering down a bit with most of the terrorist organisations in Syria and Iraq on the run after having suffered fatal blows.
With the implementation of GST behind us and the teething problems associated with the implementation of the GST more or less over, the outlook appeared bright that the indirect tax collection is set to rise, however rising crude oil prices, globally, kept the Indian Markets in check.
Apart from GST, the actions and quick resolution of "bad debt" cases by the National Company Law Tribunal (NCLT) came as a breath of fresh air. The Central Government also merged the Railway Budget with the Central (General) Budget while contrary to expectations the interest rates rose marginally with the Monetary Policy Committee deciding on the interest rates.
Internationally, apart from the Middle east Geopolitical issues, we saw the Nuclear Test being conducted by North Korea and US President Trump walking out of the Iran Nuclear Deal signed by the Obama Government. The trade tariffs imposed by the US also did not go down well with the global equity markets with the markets initially being nervous, on the announcement of the tariffs, on the fear of retaliation from other developed countries. Fortunately this reaction was not severe and the global markets held on.
India remains one of the best placed domestic growth stories, though the lack of increase in the pace of generation of employment opportunities remains a concern. With the Central elections due in 2019 we need to watch out the steps which the government takes. This government has till now avoided most of the populist measures. Will the government hold its nerve and maintain the same stance from here to the 2019 Central elections will be watched keenly.
Either way, India remains strong and is expected to gain more strength. Given this expectation India remains a destination which will provide good returns to patient investors.
Thank you
Yours Truly
Waqar Abbas NaqviChief Executive
ABRIDGED ANNUAL REPORT 2017 - 2018
Returns (%)
Regular Plan - Direct Plan - S&P Additional Benchmark Duration Growth Option Growth Option BSE 500 Nifty 50 TRI (RP) (DP) TRI
6 Months 0.15 0.22 4.23 3.85
1 Year 8.44 8.58 13.21 11.76
3 Years 5.00 6.04 9.99 7.38
5 Years 14.01 14.78 16.40 13.73
Since inception (RP: N.A (RP) 10.13 (RP) Jan 29, 1994 and 10.43 11.60 13.96 (DP) 12.02 (DP)DP : Jan 01, 2013)
^ Benchmark changed from S&P BSE 200 TRI to S&P BSE 500 TRI effective March 23, 2018Note: Past performance may or may not be sustained in the future. Returns less than one year are absolute and more than or equal to one year are compounded on an annualised basis. Regular and Direct plan has a different expense structure.
TRUSTEES REPORT FOR THE FINANCIAL YEAR 2017-18
Ground Floor, AML Centre-1, 8 Mahal Industrial Estate, Mahakali Caves Road, Andheri (E), Mumbai - 400 093.Email: [email protected] • Website: www.taurusmutualfund.com
2
S. No. Earlier Scheme Name Revised / New Scheme Name
1. Taurus Starshare Fund Taurus Starshare (Multi Cap) Fund
2. Taurus Bonanza Fund Taurus Largecap Equity Fund
3. Taurus Discovery Fund Taurus Discovery (Midcap) Fund
Returns (%)
Regular Plan - Direct Plan - Nifty Free Additional Benchmark Duration Growth Option Growth Option Float Midcap Nifty 50 TRI (RP) (DP) 100 TRI
6 Months 7.76 7.94 4.00 3.85
1 Year 20.49 20.87 10.25 11.76
3 Years 13.32 13.94 14.39 7.38
5 Years 23.18 23.79 21.96 13.63
Since inception 10.63 (RP) 10.11 (RP)(RP: Sept 05, 1994 6.54 19.83 17.49 (DP) 12.02 (DP)and DP : Jan 01, 2013)
Note: Past performance may or may not be sustained in the future. Returns less than one year are absolute and more than or equal to one year are compounded on an annualised basis. Regular and Direct plan has a different expense structure.
The scheme has not only out-performed the benchmark but is also ranked among the top 10 schemes in the 1 Year peer-group ranking. Our exposure to mid-cap IT, auto and consumer segment helped in outperformance. Our endeavour is to be consistent in outperformance vis-à-vis benchmark and peer-group.
ABRIDGED ANNUAL REPORT 2017 - 2018
Ground Floor, AML Centre-1, 8 Mahal Industrial Estate, Mahakali Caves Road, Andheri (E), Mumbai - 400 093.Email: [email protected] • Website: www.taurusmutualfund.com
Returns (%)
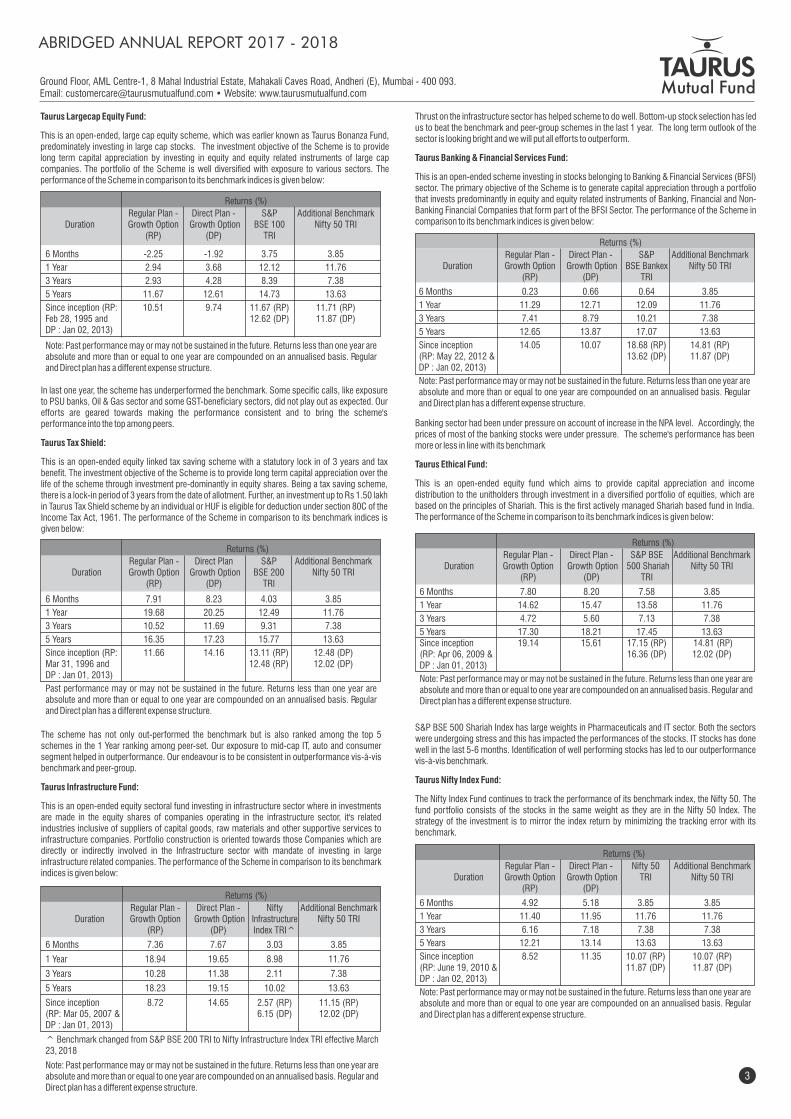
Regular Plan - Direct Plan - S&P BSE Additional Benchmark Duration Growth Option Growth Option 500 Shariah Nifty 50 TRI (RP) (DP) TRI
6 Months 7.80 8.20 7.58 3.85
1 Year 14.62 15.47 13.58 11.76
3 Years 4.72 5.60 7.13 7.38
5 Years 17.30 18.21 17.45 13.63Since inception 19.14 15.61 17.15 (RP) 14.81 (RP)(RP: Apr 06, 2009 & 16.36 (DP) 12.02 (DP) DP : Jan 01, 2013)
Note: Past performance may or may not be sustained in the future. Returns less than one year are absolute and more than or equal to one year are compounded on an annualised basis. Regular and Direct plan has a different expense structure.
Returns (%)
Regular Plan - Direct Plan S&P Additional Benchmark Duration Growth Option Growth Option BSE 200 Nifty 50 TRI (RP) (DP) TRI
6 Months 7.91 8.23 4.03 3.85
1 Year 19.68 20.25 12.49 11.76
3 Years 10.52 11.69 9.31 7.38
5 Years 16.35 17.23 15.77 13.63
Since inception (RP: 11.66 14.16 13.11 (RP) 12.48 (DP) Mar 31, 1996 and 12.48 (RP) 12.02 (DP)DP : Jan 01, 2013)
Past performance may or may not be sustained in the future. Returns less than one year are absolute and more than or equal to one year are compounded on an annualised basis. Regular and Direct plan has a different expense structure.
3
Returns (%)
Regular Plan - Direct Plan - S&P Additional Benchmark Duration Growth Option Growth Option BSE 100 Nifty 50 TRI (RP) (DP) TRI
6 Months -2.25 -1.92 3.75 3.85
1 Year 2.94 3.68 12.12 11.76
3 Years 2.93 4.28 8.39 7.38
5 Years 11.67 12.61 14.73 13.63
Since inception (RP: 10.51 9.74 11.67 (RP) 11.71 (RP)Feb 28, 1995 and 12.62 (DP) 11.87 (DP)DP : Jan 02, 2013)
Note: Past performance may or may not be sustained in the future. Returns less than one year are absolute and more than or equal to one year are compounded on an annualised basis. Regular and Direct plan has a different expense structure.
Returns (%)
Regular Plan - Direct Plan - Nifty Additional Benchmark Duration Growth Option Growth Option Infrastructure Nifty 50 TRI (RP) (DP) Index TRI^
6 Months 7.36 7.67 3.03 3.85
1 Year 18.94 19.65 8.98 11.76
3 Years 10.28 11.38 2.11 7.38
5 Years 18.23 19.15 10.02 13.63
Since inception 8.72 14.65 2.57 (RP) 11.15 (RP)(RP: Mar 05, 2007 & 6.15 (DP) 12.02 (DP)DP : Jan 01, 2013)
^ Benchmark changed from S&P BSE 200 TRI to Nifty Infrastructure Index TRI effective March 23, 2018
Note: Past performance may or may not be sustained in the future. Returns less than one year are absolute and more than or equal to one year are compounded on an annualised basis. Regular and Direct plan has a different expense structure.
Returns (%)
Regular Plan - Direct Plan - S&P Additional Benchmark Duration Growth Option Growth Option BSE Bankex Nifty 50 TRI (RP) (DP) TRI
6 Months 0.23 0.66 0.64 3.85
1 Year 11.29 12.71 12.09 11.76
3 Years 7.41 8.79 10.21 7.38
5 Years 12.65 13.87 17.07 13.63
Since inception 14.05 10.07 18.68 (RP) 14.81 (RP)(RP: May 22, 2012 & 13.62 (DP) 11.87 (DP)DP : Jan 02, 2013)
Note: Past performance may or may not be sustained in the future. Returns less than one year are absolute and more than or equal to one year are compounded on an annualised basis. Regular and Direct plan has a different expense structure.
Returns (%)
Regular Plan - Direct Plan - Nifty 50 Additional Benchmark Duration Growth Option Growth Option TRI Nifty 50 TRI (RP) (DP)
6 Months 4.92 5.18 3.85 3.85
1 Year 11.40 11.95 11.76 11.76
3 Years 6.16 7.18 7.38 7.38
5 Years 12.21 13.14 13.63 13.63
Since inception 8.52 11.35 10.07 (RP) 10.07 (RP) (RP: June 19, 2010 & 11.87 (DP) 11.87 (DP)DP : Jan 02, 2013)
Note: Past performance may or may not be sustained in the future. Returns less than one year are absolute and more than or equal to one year are compounded on an annualised basis. Regular and Direct plan has a different expense structure.
ABRIDGED ANNUAL REPORT 2017 - 2018

Ground Floor, AML Centre-1, 8 Mahal Industrial Estate, Mahakali Caves Road, Andheri (E), Mumbai - 400 093.Email: [email protected] • Website: www.taurusmutualfund.com
4
Returns (%)
Regular Super Direct Super Crisil Liquid Additional Benchmark Duration Institutional Plan Institutional Plan Fund Index CRISIL 1 Yr T-Bill Index Growth Option Growth Option (RP) (DP)
6 Months 2.35 2.68 3.39 3.03
1 Year 8.89 9.60 6.79 5.87
3 Years 3.39 4.43 7.33 6.91
5 Years 6.22 6.61 8.09 7.05
Since inception 7.03 6.75 7.49 (RP) 6.42 (RP)(RP: Dec 01, 2008 & 8.09 (DP) 7.13 (DP)DP : Jan 01, 2013)
Note: Past performance may or may not be sustained in the future. Returns less than one year are absolute and more than or equal to one year are compounded on an annualised basis. Regular and Direct plan has a different expense structure.
Returns (%)
Regular Plan - Direct Plan - CRISIL Additional Benchmark Duration Growth Option Growth Option Short Term CRISIL 1 yr (RP) (DP) Bond Fund Index T-Bill Index
6 Months 2.57 2.64 2.29 3.03
1 Year 9.12 9.31 6.11 5.87
3 Years 4.03 4.33 7.90 6.91
5 Years 6.35 6.58 8.56 7.05
Since inception 6.30 6.73 6.95 (RP) 6.09 (RP)(RP: Aug 18, 2001 & 8.55 (DP) 7.13 (DP) DP : Jan 01, 2013)
Note: Past performance may or may not be sustained in the future. Returns less than one year are absolute and more than or equal to one year are compounded on an annualised basis. Regular and Direct plan has a different expense structure.
Returns (%)
Regular Plan - Direct Plan - CRISIL Additional
Growth Option Growth Option Composite Bond Benchmark
Duration (RP) (DP) Fund Index CRISIL 10 yr Gilt Index
6 Months 2.29 2.67 0.62 -2.66
1 Year 8.78 9.59 5.06 -0.42
3 Years 2.76 3.54 8.12 6.36
5 Years 4.09 4.72 8.60 6.42
Since inception 5.82 4.79 8.60 (RP) 6.67 (RP)(RP: Feb 14, 2011 & 8.52 (DP) 6.47 (DP) DP : Jan 04, 2013)
Returns (%)
Regular Super Direct Super CRISIL Liquid Additional Benchmark Duration Institutional Institutional Fund Index CRISIL 1 Yr Growth Option Growth Option T-Bill Index (RP) (DP)
6 Months 2.66 2.72 3.44 3.08
1 Year 7.92 8.03 6.84 5.92
3 Years 5.17 5.26 7.33 6.91
5 Years 6.81 6.88 8.10 7.06
Since inception 6.12 6.98 7.54 (RP) 6.58 (RP)(RP: Aug 31, 2006 & 8.08 (DP) 7.13 (DP)DP : Dec 31, 2012)
Note: Past performance may or may not be sustained in the future. Returns less than one year are absolute and more than or equal to one year are compounded on an annualised basis. Regular and Direct plan has a different expense structure.
S.No. Name of the Director Status Date of change
1. Mr. Lalit Kumar Malhotra Independent Director Resigned with effect from August 23, 2017
ABRIDGED ANNUAL REPORT 2017 - 2018

Unclaimed Dividends Unclaimed Redemptions
Scheme Name No. of Amount No. of Amount Investors (Rs) Investors (Rs)
Taurus Largecap Equity Fund 1,281 3,082,307 154 868,051
Taurus Dynamic Fund 13 46,084 1 1,485
Taurus Discovery (Midcap) Fund 42 78,934 420 1,663,524
Taurus Ethical Fund 12 29,107 33 631,968
Taurus Infrastructure Fund 22 29,333 53 697,033
Taurus Short Term Income Fund 34 19,571 - -
Taurus Liquid Fund - - 5 45,438
Taurus Ultra Short Term Income Fund - - 4 225,836
Taurus Taxshield 561 1,448,487 111 1,511,930
Taurus Starshare (Multicap) Fund 108 518,945 931 7,028,448
Taurus Banking & Financial Services Fund 8 5,002 2 147,771
Taurus MIP Advantage # 62 80,271 29 1,426,858
Libra Leap # 1 1,010 102 655,887
Bonanza Equity Linked Savings Scheme # 240 294,260 1,322 3,672,624
Taurus Genshare # - - 184 2,591,565
Grand Total 2,384 5,633,312 3,351 21,168,418
Annexure 1
#Matured Schemes
Annexure 2
Ground Floor, AML Centre-1, 8 Mahal Industrial Estate, Mahakali Caves Road, Andheri (E), Mumbai - 400 093.Email: [email protected] • Website: www.taurusmutualfund.com
5
Details of Unclaimed Dividend and Redemptions as on March 31, 2018
Redressal of Complaints received against Mutual Funds (MFs) during 01 April 2017 to 31 March 2018 Name of Mutual Fund and total number of folios - Taurus Mutual Fund - 120732
Unit Holders who have not claimed redemption / dividend amounts may please note the following:
Unit holders who have not received/claimed or encashed the redemption amounts or dividend amounts are advised to approach the nearest AMC branch/Karvy Investor Service Centre with their folio number. You will be advised on the next steps and all requests found valid will be processed and the eligible amounts will be remitted to the bank account of the unit holders directly. For address of the branch/centre closest to you, please visit our website: www.taurusmutualfund.com => Locate Us.
# including against its authorized persons/ distributors/ employees. etc. *Non actionable means the complaint that are incomplete / outside the scope of the mutual fund** If others include a type of complaint which is more than 10% of overall complaint, provide that reason separately
IA Non receipt of Dividend on Units 0 2 2 0 0 0 0 0 0 0 0
IB Interest on delayed payment of Dividend 0 0 0 0 0 0 0 0 0 0
IC Non receipt of Redemption Proceeds 0 0 0 0 0 0 0 0 0 0 0
ID Interest on delayed payment of Redemption 0 0 0 0 0 0 0 0 0 0 0
IIA Non receipt of Statement of Account/ Unit Certificate 0 2 2 0 0 0 0 0 0 0 0
IIB Discrepancy in Statement of Account 0 0 0 0 0 0 0 0 0 0 0
IIC Non receipt of Annual Report/Abridged Summary 0 0 0 0 0 0 0 0 0 0 0
IIIA Wrong switch between Schemes 0 0 0 0 0 0 0 0 0 0 0
IIIB Unauthorized switch between Schemes 0 0 0 0 0 0 0 0 0 0 0
IIIC Deviation from Scheme attributes 4 7 11 0 0 0 0 0 0 0 0
IIID Wrong or excess charges/load 0 0 0 0 0 0 0 0 0 0 0
IIIE Non updation of changes viz. address, PAN, 0 0 0 0 0 0 0 0 0 0 0 bank details, nomination, etc
IV Others 0 0 0 0 0 0 0 0 0 0 0
TOTAL 4 11 15 0 0 0 0 0 0 0 0
ABRIDGED ANNUAL REPORT 2017 - 2018
Ground Floor, AML Centre-1, 8 Mahal Industrial Estate, Mahakali Caves Road, Andheri (E), Mumbai - 400 093.Email: [email protected] • Website: www.taurusmutualfund.com
6
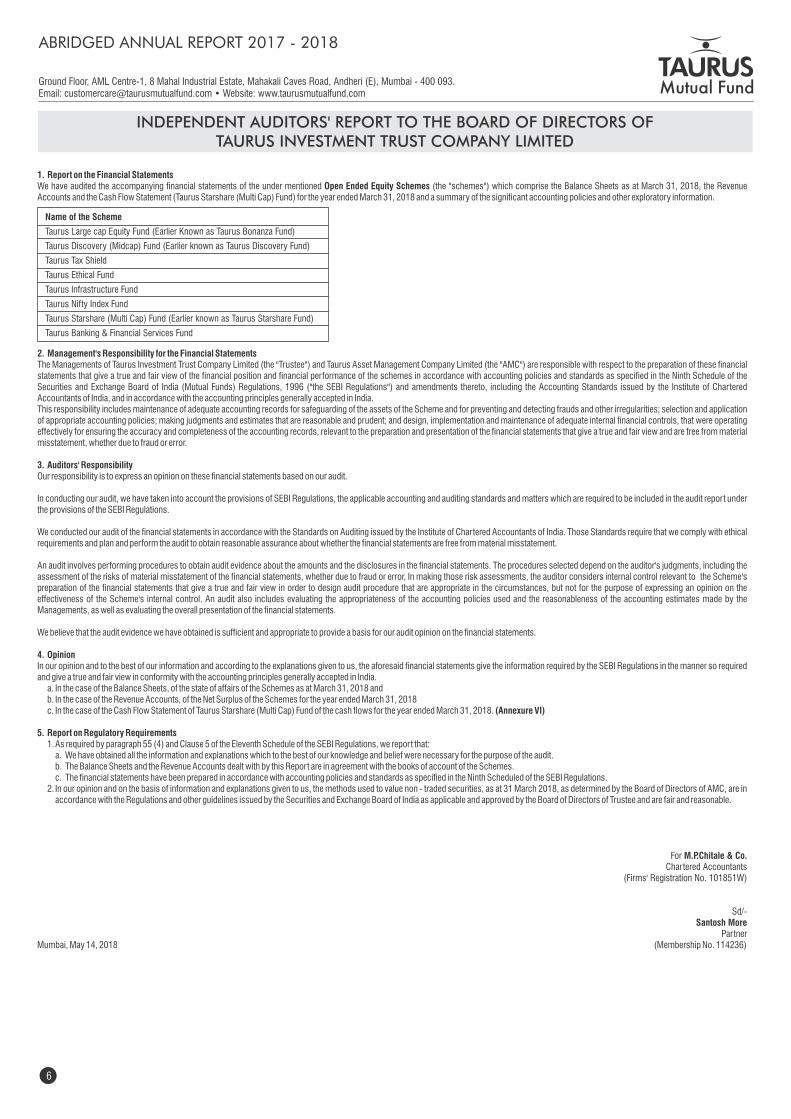
INDEPENDENT AUDITORS' REPORT TO THE BOARD OF DIRECTORS OFTAURUS INVESTMENT TRUST COMPANY LIMITED
1. Report on the Financial StatementsWe have audited the accompanying financial statements of the under mentioned Open Ended Equity Schemes (the "schemes") which comprise the Balance Sheets as at March 31, 2018, the RevenueAccounts and the Cash Flow Statement (Taurus Starshare (Multi Cap) Fund) for the year ended March 31, 2018 and a summary of the significant accounting policies and other exploratory information.
2. Management's Responsibility for the Financial StatementsThe Managements of Taurus Investment Trust Company Limited (the "Trustee") and Taurus Asset Management Company Limited (the "AMC") are responsible with respect to the preparation of these financial statements that give a true and fair view of the financial position and financial performance of the schemes in accordance with accounting policies and standards as specified in the Ninth Schedule of the Securities and Exchange Board of India (Mutual Funds) Regulations, 1996 ("the SEBI Regulations") and amendments thereto, including the Accounting Standards issued by the Institute of Chartered Accountants of India, and in accordance with the accounting principles generally accepted in India. This responsibility includes maintenance of adequate accounting records for safeguarding of the assets of the Scheme and for preventing and detecting frauds and other irregularities; selection and application of appropriate accounting policies; making judgments and estimates that are reasonable and prudent; and design, implementation and maintenance of adequate internal financial controls, that were operating effectively for ensuring the accuracy and completeness of the accounting records, relevant to the preparation and presentation of the financial statements that give a true and fair view and are free from material misstatement, whether due to fraud or error.
3. Auditors' ResponsibilityOur responsibility is to express an opinion on these financial statements based on our audit.
In conducting our audit, we have taken into account the provisions of SEBI Regulations, the applicable accounting and auditing standards and matters which are required to be included in the audit report under the provisions of the SEBI Regulations. We conducted our audit of the financial statements in accordance with the Standards on Auditing issued by the Institute of Chartered Accountants of India. Those Standards require that we comply with ethical requirements and plan and perform the audit to obtain reasonable assurance about whether the financial statements are free from material misstatement.
An audit involves performing procedures to obtain audit evidence about the amounts and the disclosures in the financial statements. The procedures selected depend on the auditor's judgments, including the assessment of the risks of material misstatement of the financial statements, whether due to fraud or error, In making those risk assessments, the auditor considers internal control relevant to the Scheme's preparation of the financial statements that give a true and fair view in order to design audit procedure that are appropriate in the circumstances, but not for the purpose of expressing an opinion on the effectiveness of the Scheme's internal control. An audit also includes evaluating the appropriateness of the accounting policies used and the reasonableness of the accounting estimates made by the Managements, as well as evaluating the overall presentation of the financial statements.
We believe that the audit evidence we have obtained is sufficient and appropriate to provide a basis for our audit opinion on the financial statements.
4. OpinionIn our opinion and to the best of our information and according to the explanations given to us, the aforesaid financial statements give the information required by the SEBI Regulations in the manner so required and give a true and fair view in conformity with the accounting principles generally accepted in India. a. In the case of the Balance Sheets, of the state of affairs of the Schemes as at March 31, 2018 and b. In the case of the Revenue Accounts, of the Net Surplus of the Schemes for the year ended March 31, 2018 c. In the case of the Cash Flow Statement of Taurus Starshare (Multi Cap) Fund of the cash flows for the year ended March 31, 2018. (Annexure VI)
5. Report on Regulatory Requirements 1. As required by paragraph 55 (4) and Clause 5 of the Eleventh Schedule of the SEBI Regulations, we report that: a. We have obtained all the information and explanations which to the best of our knowledge and belief were necessary for the purpose of the audit. b. The Balance Sheets and the Revenue Accounts dealt with by this Report are in agreement with the books of account of the Schemes. c. The financial statements have been prepared in accordance with accounting policies and standards as specified in the Ninth Scheduled of the SEBI Regulations. 2. In our opinion and on the basis of information and explanations given to us, the methods used to value non - traded securities, as at 31 March 2018, as determined by the Board of Directors of AMC, are in accordance with the Regulations and other guidelines issued by the Securities and Exchange Board of India as applicable and approved by the Board of Directors of Trustee and are fair and reasonable.
For M.P.Chitale & Co.Chartered Accountants
(Firms' Registration No. 101851W)
Sd/-Santosh More
PartnerMumbai, May 14, 2018 (Membership No. 114236)
Name of the Scheme
Taurus Large cap Equity Fund (Earlier Known as Taurus Bonanza Fund)
Taurus Discovery (Midcap) Fund (Earlier known as Taurus Discovery Fund)
Taurus Tax Shield
Taurus Ethical Fund
Taurus Infrastructure Fund
Taurus Nifty Index Fund
Taurus Starshare (Multi Cap) Fund (Earlier known as Taurus Starshare Fund)
Taurus Banking & Financial Services Fund
ABRIDGED ANNUAL REPORT 2017 - 2018
Ground Floor, AML Centre-1, 8 Mahal Industrial Estate, Mahakali Caves Road, Andheri (E), Mumbai - 400 093.Email: [email protected] • Website: www.taurusmutualfund.com
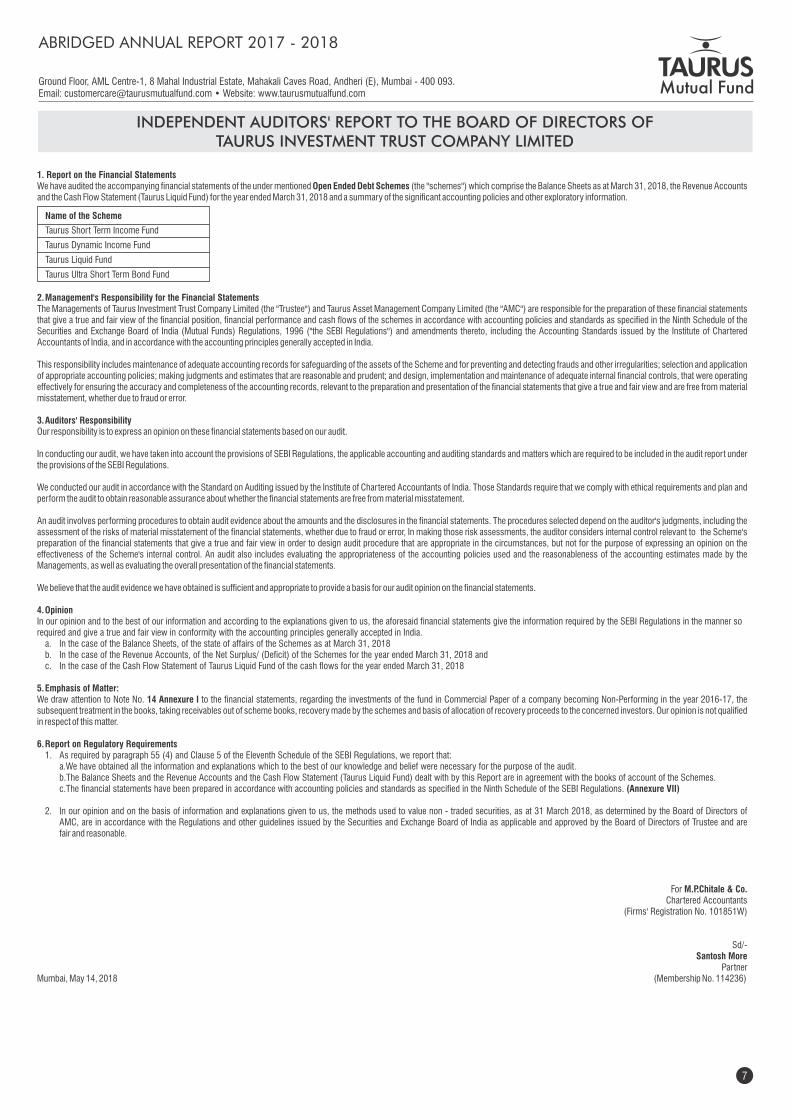
INDEPENDENT AUDITORS' REPORT TO THE BOARD OF DIRECTORS OFTAURUS INVESTMENT TRUST COMPANY LIMITED
1. Report on the Financial StatementsWe have audited the accompanying financial statements of the under mentioned Open Ended Debt Schemes (the "schemes") which comprise the Balance Sheets as at March 31, 2018, the Revenue Accounts and the Cash Flow Statement (Taurus Liquid Fund) for the year ended March 31, 2018 and a summary of the significant accounting policies and other exploratory information.
2. Management's Responsibility for the Financial StatementsThe Managements of Taurus Investment Trust Company Limited (the "Trustee") and Taurus Asset Management Company Limited (the "AMC") are responsible for the preparation of these financial statements that give a true and fair view of the financial position, financial performance and cash flows of the schemes in accordance with accounting policies and standards as specified in the Ninth Schedule of the Securities and Exchange Board of India (Mutual Funds) Regulations, 1996 ("the SEBI Regulations") and amendments thereto, including the Accounting Standards issued by the Institute of Chartered Accountants of India, and in accordance with the accounting principles generally accepted in India.
This responsibility includes maintenance of adequate accounting records for safeguarding of the assets of the Scheme and for preventing and detecting frauds and other irregularities; selection and application of appropriate accounting policies; making judgments and estimates that are reasonable and prudent; and design, implementation and maintenance of adequate internal financial controls, that were operating effectively for ensuring the accuracy and completeness of the accounting records, relevant to the preparation and presentation of the financial statements that give a true and fair view and are free from material misstatement, whether due to fraud or error. 3. Auditors' ResponsibilityOur responsibility is to express an opinion on these financial statements based on our audit.
In conducting our audit, we have taken into account the provisions of SEBI Regulations, the applicable accounting and auditing standards and matters which are required to be included in the audit report under the provisions of the SEBI Regulations.
We conducted our audit in accordance with the Standard on Auditing issued by the Institute of Chartered Accountants of India. Those Standards require that we comply with ethical requirements and plan and perform the audit to obtain reasonable assurance about whether the financial statements are free from material misstatement.
An audit involves performing procedures to obtain audit evidence about the amounts and the disclosures in the financial statements. The procedures selected depend on the auditor's judgments, including the assessment of the risks of material misstatement of the financial statements, whether due to fraud or error, In making those risk assessments, the auditor considers internal control relevant to the Scheme's preparation of the financial statements that give a true and fair view in order to design audit procedure that are appropriate in the circumstances, but not for the purpose of expressing an opinion on the effectiveness of the Scheme's internal control. An audit also includes evaluating the appropriateness of the accounting policies used and the reasonableness of the accounting estimates made by the Managements, as well as evaluating the overall presentation of the financial statements.
We believe that the audit evidence we have obtained is sufficient and appropriate to provide a basis for our audit opinion on the financial statements.
4. OpinionIn our opinion and to the best of our information and according to the explanations given to us, the aforesaid financial statements give the information required by the SEBI Regulations in the manner so required and give a true and fair view in conformity with the accounting principles generally accepted in India. a. In the case of the Balance Sheets, of the state of affairs of the Schemes as at March 31, 2018 b. In the case of the Revenue Accounts, of the Net Surplus/ (Deficit) of the Schemes for the year ended March 31, 2018 and c. In the case of the Cash Flow Statement of Taurus Liquid Fund of the cash flows for the year ended March 31, 2018
5. Emphasis of Matter:We draw attention to Note No. 14 Annexure I to the financial statements, regarding the investments of the fund in Commercial Paper of a company becoming Non-Performing in the year 2016-17, the subsequent treatment in the books, taking receivables out of scheme books, recovery made by the schemes and basis of allocation of recovery proceeds to the concerned investors. Our opinion is not qualified in respect of this matter.
6. Report on Regulatory Requirements 1. As required by paragraph 55 (4) and Clause 5 of the Eleventh Schedule of the SEBI Regulations, we report that: a. We have obtained all the information and explanations which to the best of our knowledge and belief were necessary for the purpose of the audit. b. The Balance Sheets and the Revenue Accounts and the Cash Flow Statement (Taurus Liquid Fund) dealt with by this Report are in agreement with the books of account of the Schemes. c. The financial statements have been prepared in accordance with accounting policies and standards as specified in the Ninth Schedule of the SEBI Regulations. (Annexure VII)
2. In our opinion and on the basis of information and explanations given to us, the methods used to value non - traded securities, as at 31 March 2018, as determined by the Board of Directors of AMC, are in accordance with the Regulations and other guidelines issued by the Securities and Exchange Board of India as applicable and approved by the Board of Directors of Trustee and are fair and reasonable.
For M.P.Chitale & Co.Chartered Accountants
(Firms' Registration No. 101851W)
Sd/-Santosh More
PartnerMumbai, May 14, 2018 (Membership No. 114236)
Name of the Scheme
Taurus Short Term Income Fund
Taurus Dynamic Income Fund
Taurus Liquid Fund
Taurus Ultra Short Term Bond Fund
7
ABRIDGED ANNUAL REPORT 2017 - 2018

Abr
idge
d B
alan
ce S
heet
as
at M
arch
31,
201
8
Not
es to
Acc
ount
s - A
nnex
ure
I
Ta
urus
Lar
geca
p Eq
uity
Fun
d Ta
urus
Dis
cove
ry (
Mid
cap)
Fun
d Ta
urus
Tax
Shi
eld
Taur
us E
thic
al F
und
Taur
us I
nfra
stru
ctur
e Fu
nd
Taur
us N
ifty
Ind
ex F
und
Taur
us S
tars
hare
(M
ulti
Cap
)
Taur
us B
anki
ng &
(E
arlie
r K
now
n A
s (E
arlie
r K
now
n A
s
Fu
nd(E
arlie
r K
now
n A
s Ta
urus
Fi
nanc
ial S
ervi
ces
Fund
Ta
urus
Bon
anza
Fun
d)
Taur
us D
isco
very
Fun
d
S
tars
hare
Fun
d)
LI
AB
ILIT
IES
1
Uni
t C
apit
al
769
.91
1
,513
.62
1
,137
.65
1
,111
.13
9
92.7
4
1,2
50.4
1
623
.91
8
03.9
3
208
.74
2
48.2
9
1,4
00.7
4
22.
07
1,9
59.2
1
2,0
35.5
5
262
.68
3
35.3
4
2
Res
erve
s &
Sur
plus
2.
1 U
nit P
rem
ium
Res
erve
s 9
90.1
9
2,5
33.0
7
78.
48
61.
96
(51
0.82
) (
388.
53)
37.
19
120
.15
(
50.6
6)
(43
.49)
(
609.
03)
(11
.66)
3
87.5
0
585
.12
(
127.
39)
(12
0.62
)
2.
2 U
nrea
lised
App
reci
atio
n R
eser
ve
-
3
24.8
0
-
6
86.9
2
329
.22
1
,210
.62
2
17.4
6
352
.23
2
6.41
9
9.55
-
3.2
0
654
.19
4
,161
.85
1
02.3
5
170
.51
2.
3 O
ther
Res
erve
s 1,
916.
96
3,6
58.5
8
3,82
7.71
2
,229
.15
4,
273.
42
3,2
39.9
8
1,82
6.09
1
,691
.78
33
3.46
2
14.4
4
904.
13
24.
10
18,1
71.3
2 1
3,67
7.86
31
7.41
2
46.4
6
3
Loan
s &
Bor
row
ings
-
-
-
-
-
-
-
-
-
-
-
-
-
-
-
-
4
Cur
rent
Lia
bilit
ies
& P
rovi
sion
s
4.
1 Pr
ovis
ion
for d
oubt
ful I
ncom
e/D
epos
its
-
5
4.95
-
-
-
-
-
-
-
-
-
-
-
144
.92
-
-
4.
2 O
ther
Cur
rent
Lia
bilit
ies
& P
rovi
sion
s 1
40.6
1
1,1
30.0
2
110
.96
3
4.30
1
14.4
6
80.
92
28.
20
28.
05
9.8
5
10.
11
85.
21
0.7
3
516
.90
1
44.8
4
6.3
7
6.0
1
TOTA
L 3,
817.
67
9,21
5.04
5,
154.
80
4,12
3.46
5,
199.
02
5,39
3.40
2,
732.
85
2,99
6.14
52
7.80
52
8.90
1,
781.
05
38.4
4 21
,689
.12
20,7
50.1
4 56
1.42
63
7.70
AS
SET
S
1
Inve
stm
ents
1.
1.
List
ed S
ecur
ities
:
1.1
.1
Equi
ty S
hare
s 3
,263
.30
6
,893
.83
4
,861
.55
3
,887
.16
4
,842
.04
5
,145
.81
2
,676
.12
2
,774
.00
4
99.7
2
506
.64
1
,596
.03
3
5.93
2
0,31
7.32
1
9,89
0.14
5
37.4
1
610
.17
1.1
.2
Pre
fere
nce
Sha
res
-
-
-
-
-
-
-
-
-
-
-
-
-
-
-
-
1.1
.3
Equi
ty L
inke
d D
eben
ture
s -
-
-
-
-
-
-
-
-
-
-
-
-
-
-
-
1.1
.4
Oth
er D
eben
ture
s &
Bon
ds
-
-
-
-
-
-
-
-
-
-
-
-
-
-
-
-
1.1
.5
Sec
uriti
sed
Deb
t sec
uriti
es
-
-
-
-
-
-
-
-
-
-
-
-
-
-
-
-
1.
2 S
ecur
itie
s A
wai
ted
List
ing:
1.2
.1
Equi
ty S
hare
s -
-
-
-
-
-
-
-
-
-
-
-
-
-
-
-
1.2
.2
Pre
fere
nce
Sha
res
-
-
-
-
-
-
-
-
-
-
-
-
-
-
-
-
1.2
.3
Equi
ty L
inke
d D
eben
ture
s -
-
-
-
-
-
-
-
-
-
-
-
-
-
-
-
1.2
.4
Oth
er D
eben
ture
s &
Bon
ds
-
-
-
-
-
-
-
-
-
-
-
-
-
-
-
-
1.2
.5
Sec
uriti
sed
Deb
t sec
uriti
es
-
-
-
-
-
-
-
-
-
-
-
-
-
-
-
-
1.
3 U
nlis
ted
Sec
urit
ies
1.3
.1
Equi
ty S
hare
s -
-
-
-
-
-
-
-
-
-
-
-
-
-
-
-
1.3
.2
Pre
fere
nce
Sha
res
-
-
-
-
-
-
-
-
-
-
-
-
-
-
-
-
1.3
.3
Equi
ty L
inke
d D
eben
ture
s -
-
-
-
-
-
-
-
-
-
-
-
-
-
-
-
1.3
.4
Oth
er D
eben
ture
s &
Bon
ds
-
-
-
-
-
-
-
-
-
-
-
-
-
-
-
-
1.3
.5
Sec
uriti
sed
Deb
t sec
uriti
es
-
-
-
-
-
-
-
-
-
-
-
-
-
-
-
-
1.
4 G
over
nmen
t Sec
uriti
es
-
-
-
-
-
-
-
-
-
-
-
-
-
-
-
-
1.
5 Tr
easu
ry B
ills
-
-
-
-
-
-
-
-
-
-
-
-
-
-
-
-
1.
6 C
omm
erci
al P
aper
-
-
-
-
-
-
-
-
-
-
-
-
-
-
-
-
1.
7 C
ertif
icat
e of
Dep
osits
-
-
-
-
-
-
-
-
-
-
-
-
-
-
-
-
1.
8 B
ill R
edis
coun
ting
-
-
-
-
-
-
-
-
-
-
-
-
-
-
-
-
1.
9 U
nits
of
Dom
estic
Mut
ual F
und
-
-
-
-
-
-
-
-
-
-
-
-
-
-
-
-
1.1
0 Fo
reig
n S
ecur
ities
-
-
-
-
-
-
-
-
-
-
-
-
-
-
-
-
Tota
l Inv
estm
ents
3,
263.
30
6,89
3.83
4,
861.
55
3,88
7.16
4,
842.
04
5,14
5.81
2,
676.
12
2,77
4.00
49
9.72
50
6.64
1,
596.
03
35.9
3 20
,317
.32
19,8
90.1
4 53
7.41
61
0.17
2
Dep
osit
s 2
.52
4
2.76
-
0.9
6
-
0
.95
-
-
-
1.0
0
-
0
.01
-
2.8
2
-
1
.00
3
Oth
er C
urre
nt A
sset
s
3.
1 C
ash
& B
ank
Bal
ance
2
94.7
4
1,6
65.7
9
80.
31
75.
79
67.
20
67.
25
24.
00
91.
11
13.
02
2.9
9
166
.54
2
.17
6
30.6
0
295
.35
1
5.94
9
.39
3.
2 C
BLO
/ R
ever
se R
epo
Lend
ing
-
5
00.1
8
-
-
-
-
-
-
-
-
-
-
-
-
-
-
3.
3 O
ther
s 2
57.1
1
112
.48
2
12.9
4
159
.55
2
89.7
8
179
.39
3
2.73
1
31.0
3
15.
06
18.
27
18.
48
0.3
3
741
.20
5
61.8
3
8.0
7
17.
14
4
Def
erre
d R
even
ue E
xpen
ditu
re
-
-
-
-
-
-
-
-
-
-
-
-
-
-
-
-
(to
the
exte
nt n
ot w
ritte
n of
f)
TOTA
L 3,
817.
67
9,21
5.04
5,
154.
80
4,12
3.46
5,
199.
02
5,39
3.40
2,
732.
85
2,99
6.14
52
7.80
52
8.90
1,
781.
05
38.4
4 21
,689
.12
20,7
50.1
4 56
1.42
63
7.70
As
at
Mar
ch 3
1,
2018
As
at
Mar
ch 3
1,
2017
As
at
Mar
ch 3
1,
2018
As
at
Mar
ch 3
1,
2017
As
at
Mar
ch 3
1,
2018
As
at
Mar
ch 3
1,
2017
As
at
Mar
ch 3
1,
2018
As
at
Mar
ch 3
1,
2017
As
at
Mar
ch 3
1,
2018
As
at
Mar
ch 3
1,
2017
As
at
Mar
ch 3
1,
2018
As
at
Mar
ch 3
1,
2017
As
at
Mar
ch 3
1,
2018
As
at
Mar
ch 3
1,
2017
As
at
Mar
ch 3
1,
2018
Ground Floor, AML Centre-1, 8 Mahal Industrial Estate, Mahakali Caves Road, Andheri (E), Mumbai - 400 093.Email: [email protected] • Website: www.taurusmutualfund.com
Rs.
in L
akhs
As
at
Mar
ch 3
1,
2017
ABRIDGED ANNUAL REPORT 2017 - 2018
8

Ground Floor, AML Centre-1, 8 Mahal Industrial Estate, Mahakali Caves Road, Andheri (E), Mumbai - 400 093.Email: [email protected] • Website: www.taurusmutualfund.com
9
Abr
idge
d R
even
ue A
ccou
nt f
or th
e Ye
ar e
nded
Mar
ch 3
1, 2
018
Not
es to
Acc
ount
s - A
nnex
ure
I
Ta
urus
Lar
geca
p Eq
uity
Fun
d Ta
urus
Dis
cove
ry (
Mid
cap)
Fun
d Ta
urus
Tax
Shi
eld
Ta
urus
Eth
ical
Fun
d
Taur
us I
nfra
stru
ctur
e Fu
nd
Taur
us N
ifty
Ind
ex F
und
Ta
urus
Sta
rsha
re (
Mul
ti C
ap)
Ta
urus
Ban
king
&
(E
arlie
r K
now
n A
s
(Ear
lier
Kno
wn
As
Fu
nd(E
arlie
r K
now
n A
s Ta
urus
Fi
nanc
ial S
ervi
ces
Fund
Ta
urus
Bon
anza
Fun
d)
Ta
urus
Dis
cove
ry F
und
S
tars
hare
Fun
d)
1
INC
OM
E
1.
1 D
ivid
end
122
.71
7
4.62
3
7.36
5
8.34
5
6.65
7
7.58
2
8.89
2
9.94
6
.00
9
.53
3
.48
0
.51
2
54.9
4
262
.60
4
.36
6
.97
1.
2 In
tere
st
52.
52
188
.75
0
.07
0
.68
0
.02
0
.36
-
-
0
.02
0
.02
3
.79
-
0.4
4
2.4
9
0.0
2
0.0
2
1.
3 R
ealis
ed G
ain
on F
orei
gn -
-
-
-
-
-
-
-
-
-
-
-
-
-
-
-
Exch
ange
Tra
nsac
tions
1.
4 R
ealis
ed G
ains
on
Inte
rsch
eme
-
-
-
-
-
-
-
-
-
-
-
-
-
-
-
-
sale
of
inve
stm
ents
1.
5 R
ealis
ed G
ains
on
Exte
rnal
sal
e /
1
,940
.23
1
,321
.60
2
,055
.41
8
93.7
5
2,3
65.7
7
990
.15
7
46.5
3
344
.18
1
88.8
1
102
.78
1
0.18
1
1.44
7
,580
.73
2
,368
.42
1
65.2
6
109
.93
rede
mpt
ion
of in
vest
men
ts
1.
6 R
ealis
ed G
ains
on
Der
ivat
ive
-
-
-
-
-
-
-
-
-
-
-
-
-
-
-
-
Tran
sact
ions
1.
7 O
ther
Inco
me
0.4
6
3.9
1
0.2
5
5.7
3
0.0
1
1.1
1
0.3
3
1.0
5
0.1
2
1.6
0
20.
31
0.0
2
0.9
9
1.5
7
0.1
2
0.5
3
( A
)
2,1
15.9
2
1,5
88.8
8
2,0
93.0
9
958
.50
2
,422
.45
1
,069
.20
7
75.7
5
375
.17
1
94.9
5
113
.93
3
7.76
1
1.97
7
,837
.10
2
,635
.08
1
69.7
6
117
.45
2
EXP
ENS
ES
2.
1 R
ealis
ed L
osse
s on
Ext
erna
l sal
e /
2
,372
.73
1
52.0
1
418
.31
2
42.8
3
407
.57
1
33.8
8
155
.69
1
02.0
7
18.
34
22.
79
41.
83
0.8
7
1,9
48.9
6
742
.32
1
2.39
9
.68
rede
mpt
ion
of in
vest
men
ts
2.
2 M
anag
emen
t fee
s (e
xclu
sive
of
2
13.9
6
141
.55
1
09.6
4
77.
71
112
.74
1
13.0
5
54.
49
51.
10
10.
49
8.7
8
2.1
9
0.2
6
540
.01
4
53.9
0
11.
16
10.
36
serv
ice
tax
/ G
ST
)
2.
3 S
ervi
ce ta
x /
GS
T (i
nclu
ding
rel
ated
3
7.43
2
1.19
1
8.99
1
1.61
1
9.39
1
6.89
9
.38
7
.63
1
.81
1
.31
0
.39
0
.04
9
3.44
6
7.77
1
.92
1
.55
cess
) o
n M
anag
emen
t fee
s
2.
4 Tr
ansf
er a
gent
s fe
es a
nd e
xpen
ses
-
1
.28
-
2.8
9
-
3
.71
-
2.9
5
-
0
.45
-
0.0
3
-
9
.83
-
0.8
0
2.
5 C
usto
dian
fee
s -
0.0
3
-
0
.06
-
0.0
8
-
0
.04
-
0.0
1
-
-
-
0
.27
-
0.0
1
2.
6 Tr
uste
eshi
p fe
es
1.1
5
1.1
5
1.1
5
1.1
5
1.1
5
1.1
5
1.1
5
1.1
5
1.1
5
1.1
5
-
-
1.1
5
1.1
5
1.1
5
1.1
5
2.
7 C
omm
issi
on to
Age
nts
44.
23
15.
61
15.
79
12.
69
25.
90
29.
48
19.
41
18.
60
2.4
4
2.4
6
0.8
3
0.1
5
8.9
7
7.5
3
4.8
5
3.9
0
2.
8 M
arke
ting
& D
istr
ibut
ion
expe
nses
-
0.0
9
-
0
.40
-
0.1
4
-
0
.03
-
0.0
2
-
-
-
0
.87
-
0.0
3
2.
9 A
udit
fees
1
.66
0
.13
0
.69
0
.13
0
.78
0
.25
0
.42
0
.13
0
.08
0
.06
0
.03
0
.06
3
.20
0
.95
0
.09
0
.13
2.1
0 O
ther
ope
ratin
g ex
pens
es (
Net
of
1
.33
(
2.64
) (
0.68
) 3
.82
0
.32
0
.48
(
0.41
) 0
.74
(
0.47
) 0
.14
(
0.25
) 0
.01
3
.52
1
1.47
(
0.67
) 0
.26
Expe
nditu
re in
exc
ess
of li
mit
to
be b
orne
by
AM
C )
(B)
2,6
72.4
9
330
.41
5
63.8
9
353
.29
5
67.8
5
299
.10
2
40.1
3
184
.44
3
3.84
3
7.17
4
5.02
1
.42
2
,599
.25
1
,296
.06
3
0.89
2
7.87
3
NET
REA
LIS
ED G
AIN
S /
(LO
SS
ES)
(5
56.5
7)
1,2
58.4
7
1,5
29.2
0
605
.21
1
,854
.60
7
70.1
0
535
.62
1
90.7
3
161
.11
7
6.76
(
7.26
) 1
0.55
5
,237
.85
1
,339
.02
1
38.8
7
89.
58
FOR
TH
E Y
EAR
(A
-B
= C
)
4
Cha
nge
in U
nrea
lised
Dep
reci
atio
n in
15
9.69
-
9.1
9
-
-
-
-
-
-
-
2
7.83
-
-
-
-
-
valu
e of
inve
stm
ents
(D
)
5
NET
GA
INS
/ (
LOS
SES
) FO
R T
HE
(
716.
26)
1,2
58.4
7
1,5
20.0
1
605
.21
1
,854
.60
7
70.1
0
535
.62
1
90.7
3
161
.11
7
6.76
(
35.0
9)
10.
55
5,2
37.8
5
1,3
39.0
2
138
.87
8
9.58
YEA
R (
E=(C
-D))
6
Cha
nge
in u
nrea
lised
app
reci
atio
n in
(3
24.8
0)
133
.98
(
686.
92)
436
.13
(
881.
40)
516
.24
(
134.
77)
169
.54
(
73.1
4)
62.
07
(3.
20)
(4.
38)
(3,
507.
66)
2,4
70.6
2
(68
.16)
8
0.68
the
valu
e of
inve
stm
ents
(F)
7
NET
SU
RP
LUS
/ (
DEF
ICIT
) FO
R T
HE
(1
,041
.06)
1
,392
.45
8
33.0
9
1,0
41.3
4
973
.20
1
,286
.34
4
00.8
5
360
.27
8
7.97
1
38.8
3
(38
.29)
6
.17
1
,730
.19
3
,809
.64
7
0.71
1
70.2
6
YEA
R (
E +
F =
G )
7.
1 A
dd: B
alan
ce tr
ansf
er fr
om U
nrea
lised
-
-
-
-
-
-
-
-
-
-
-
4.3
8
-
-
-
-
App
reci
atio
n R
eser
ve
7.
2 Le
ss: B
alan
ce tr
ansf
er to
Unr
ealis
ed
324
.80
(
133.
98)
686
.92
(
436.
13)
881
.40
(
516.
24)
134
.77
(
169.
54)
73.
14
(62
.07)
3
.20
-
3,5
07.6
6
(2,
470.
62)
68.
16
(80
.68)
App
reci
atio
n R
eser
ve
7.
3 A
dd /
(Le
ss):
Equ
alis
atio
n 2
4,22
4.73
6
0,70
5.74
7
8.54
2
14.3
1
(82
1.15
) (
1,00
0.40
) (
401.
30)
(25
.29)
(
42.0
8)
(35
.50)
4
,542
.65
(
1.41
) (
675.
30)
(65
3.68
) (
67.8
9)
(47
.79)
8
Tota
l 2
3,50
8.47
6
1,96
4.21
1
,598
.55
8
19.5
2
1,0
33.4
5
(23
0.30
) 1
34.3
2
165
.44
1
19.0
3
41.
26
4,5
07.5
6
9.1
4
4,5
62.5
5
685
.34
7
0.98
4
1.79
9
Div
iden
d ap
prop
riat
ion
9.
1 In
com
e D
istr
ibut
ed d
urin
g th
e ye
ar
(25
,250
.09)
(
59,9
03.3
2)
-
(
165.
01)
-
-
-
-
-
-
(3,
627.
52)
-
(
69.1
0)
-
-
-
9.
2 Ta
x on
inco
me
dist
ribut
ed
-
-
-
-
-
-
-
-
-
-
-
-
-
-
-
-
durin
g th
e ye
ar
10
R
etai
ned
Sur
plus
/ (
Def
icit
) ca
rrie
d
(1,
741.
62)
2,0
60.8
9
1,5
98.5
5
654
.51
1
,033
.45
(
230.
30)
134
.32
1
65.4
4
119
.03
4
1.26
8
80.0
4
9.1
4
4,4
93.4
5
685
.34
7
0.98
4
1.79
forw
ard
to B
alan
ce s
heet
Rs.
in L
akhs
Mar
ch 3
1,
2018
Mar
ch 3
1,
2017
Mar
ch 3
1,
2018
Mar
ch 3
1,
2017
Mar
ch 3
1,
2018
Mar
ch 3
1,
2017
Mar
ch 3
1,
2018
Mar
ch 3
1,
2017
Mar
ch 3
1,
2018
Mar
ch 3
1,
2017
Mar
ch 3
1,
2018
Mar
ch 3
1,
2017
Mar
ch 3
1,
2018
Mar
ch 3
1,
2017
Mar
ch 3
1,
2018
Mar
ch 3
1,
2017
ABRIDGED ANNUAL REPORT 2017 - 2018
9
Ground Floor, AML Centre-1, 8 Mahal Industrial Estate, Mahakali Caves Road, Andheri (E), Mumbai - 400 093.Email: [email protected] • Website: www.taurusmutualfund.com
9
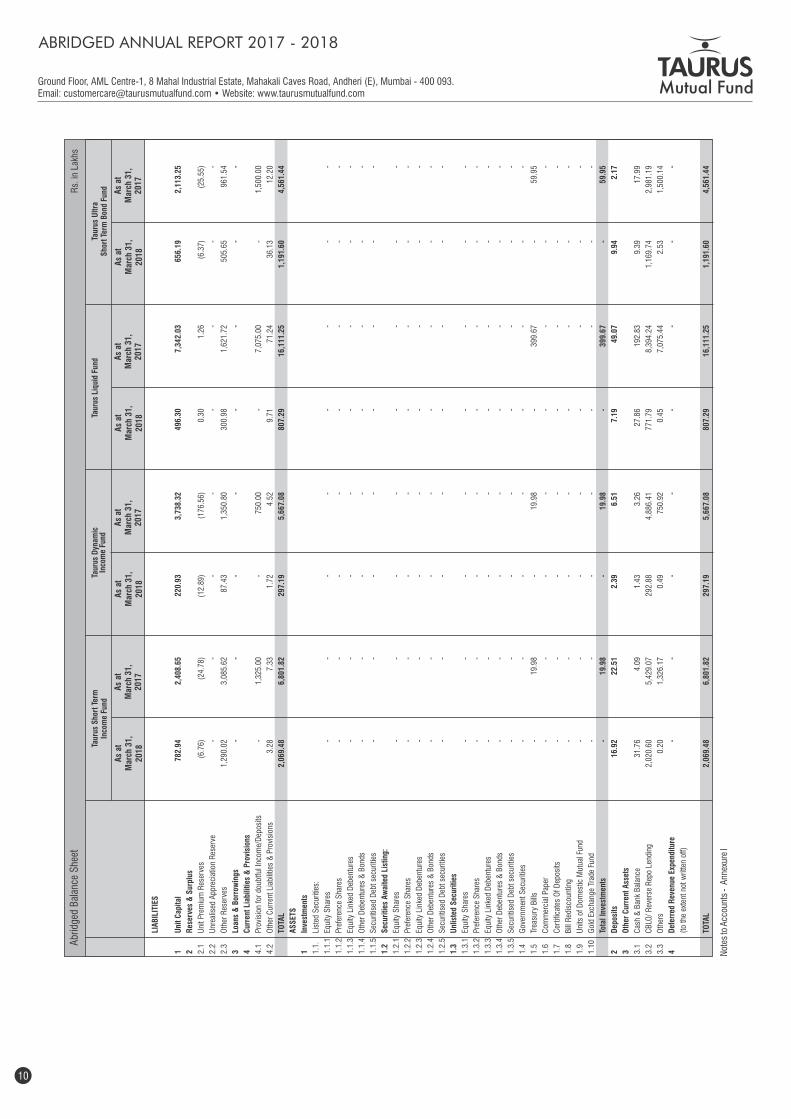
LI
AB
ILIT
IES
1 U
nit
Cap
ital
7
82.9
4
2,4
08.6
5
220
.93
3
,738
.32
4
96.3
0
7,3
42.0
3
656
.19
2
,113
.25
2 R
eser
ves
& S
urpl
us
2.1
Uni
t Pre
miu
m R
eser
ves
(6.
76)
(24
.78)
(
12.8
9)
(17
6.56
) 0
.30
1
.26
(
6.37
) (
25.5
5)
2.2
Unr
ealis
ed A
ppre
ciat
ion
Res
erve
-
-
-
-
-
-
-
-
2.3
Oth
er R
eser
ves
1,2
90.0
2
3,0
85.6
2
87.
43
1,3
50.8
0
300
.98
1
,621
.72
5
05.6
5
961
.54
3 Lo
ans
& B
orro
win
gs
-
-
-
-
-
-
-
-
4 C
urre
nt L
iabi
litie
s &
Pro
visi
ons
4.1
Pro
visi
on f
or d
oubt
ful I
ncom
e/D
epos
its
-
1
,325
.00
-
750
.00
-
7,0
75.0
0
-
1
,500
.00
4.2
Oth
er C
urre
nt L
iabi
litie
s &
Pro
visi
ons
3.2
8
7.3
3
1.7
2
4.5
2
9.7
1
71.
24
36.
13
12.
20
TO
TAL
2,0
69.4
8
6,8
01.8
2
297
.19
5
,667
.08
8
07.2
9
16,
111.
25
1,1
91.6
0
4,5
61.4
4
A
SS
ETS
1 In
vest
men
ts
1.1.
Li
sted
Sec
uriti
es:
1.1.
1 Eq
uity
Sha
res
-
-
-
-
-
-
-
-
1.1.
2 P
refe
renc
e S
hare
s -
-
-
-
-
-
-
-
1.1.
3 Eq
uity
Lin
ked
Deb
entu
res
-
-
-
-
-
-
-
-
1.1.
4 O
ther
Deb
entu
res
& B
onds
-
-
-
-
-
-
-
-
1.1.
5 S
ecur
itise
d D
ebt s
ecur
ities
-
-
-
-
-
-
-
-
1.2
Sec
urit
ies
Aw
aite
d Li
stin
g:
1.2.
1 Eq
uity
Sha
res
-
-
-
-
-
-
-
-
1.2.
2 P
refe
renc
e S
hare
s -
-
-
-
-
-
-
-
1.2.
3 Eq
uity
Lin
ked
Deb
entu
res
-
-
-
-
-
-
-
-
1.2.
4 O
ther
Deb
entu
res
& B
onds
-
-
-
-
-
-
-
-
1.2.
5 S
ecur
itise
d D
ebt s
ecur
ities
-
-
-
-
-
-
-
-
1.3
Unl
iste
d S
ecur
itie
s
1.3.
1 Eq
uity
Sha
res
-
-
-
-
-
-
-
-
1.3.
2 P
refe
renc
e S
hare
s -
-
-
-
-
-
-
-
1.3.
3 Eq
uity
Lin
ked
Deb
entu
res
-
-
-
-
-
-
-
-
1.3.
4 O
ther
Deb
entu
res
& B
onds
-
-
-
-
-
-
-
-
1.3.
5 S
ecur
itise
d D
ebt s
ecur
ities
-
-
-
-
-
-
-
-
1.4
Gov
ernm
ent S
ecur
ities
-
-
-
-
-
-
-
-
1.5
Trea
sury
Bill
s -
19.
98
-
1
9.98
-
399
.67
-
59.
95
1.6
Com
mer
cial
Pap
er
-
-
-
-
-
-
-
-
1.7
Cer
tific
ates
Of
Dep
osits
-
-
-
-
-
-
-
-
1.8
Bill
Red
isco
untin
g -
-
-
-
-
-
-
-
1.9
Uni
ts o
f D
omes
tic M
utua
l Fun
d -
-
-
-
-
-
-
-
1.10
G
old
Exch
ange
Tra
de F
und
-
-
-
-
-
-
-
-
To
tal I
nves
tmen
ts
-
1
9.98
-
19.
98
-
3
99.6
7
-
5
9.95
2 D
epos
its
16.
92
22.
51
2.3
9
6.5
1
7.1
9
49.
07
9.9
4
2.1
7
3 O
ther
Cur
rent
Ass
ets
3.1
Cas
h &
Ban
k B
alan
ce
31.
76
4.0
9
1.4
3
3.2
6
27.
86
192
.83
9
.39
1
7.99
3.2
CB
LO/
Rev
erse
Rep
o Le
ndin
g 2
,020
.60
5
,429
.07
2
92.8
8
4,8
86.4
1
771
.79
8
,394
.24
1
,169
.74
2
,981
.19
3.3
Oth
ers
0.2
0
1,3
26.1
7
0.4
9
750
.92
0
.45
7
,075
.44
2
.53
1
,500
.14
4 D
efer
red
Rev
enue
Exp
endi
ture
-
-
-
-
-
-
-
-
(t
o th
e ex
tent
not
writ
ten
off)
TO
TAL
2,0
69.4
8
6,8
01.8
2
297
.19
5
,667
.08
8
07.2
9
16,
111.
25
1,1
91.6
0
4,5
61.4
4
Abr
idge
d B
alan
ce S
heet
Taur
us S
hort
Ter
mIn
com
e Fu
nd
As
at
Mar
ch 3
1,
2018
As
at
Mar
ch 3
1,
2017
Taur
us D
ynam
icIn
com
e Fu
ndTa
urus
Liq
uid
Fund
Taur
us U
ltra
Sho
rt T
erm
Bon
d Fu
nd
Not
es to
Acc
ount
s -
Ann
exur
e I
Rs.
in L
akhs
As
at
Mar
ch 3
1,
2018
As
at
Mar
ch 3
1,
2017
As
at
Mar
ch 3
1,
2018
As
at
Mar
ch 3
1,
2017
As
at
Mar
ch 3
1,
2018
As
at
Mar
ch 3
1,
2017
ABRIDGED ANNUAL REPORT 2017 - 2018
10
Ground Floor, AML Centre-1, 8 Mahal Industrial Estate, Mahakali Caves Road, Andheri (E), Mumbai - 400 093.Email: [email protected] • Website: www.taurusmutualfund.com
Not
es to
Acc
ount
s -
Ann
exur
e I
# -R
efer
Not
e no
14
of N
otes
to A
ccou
nts
-Ann
exur
e I
9
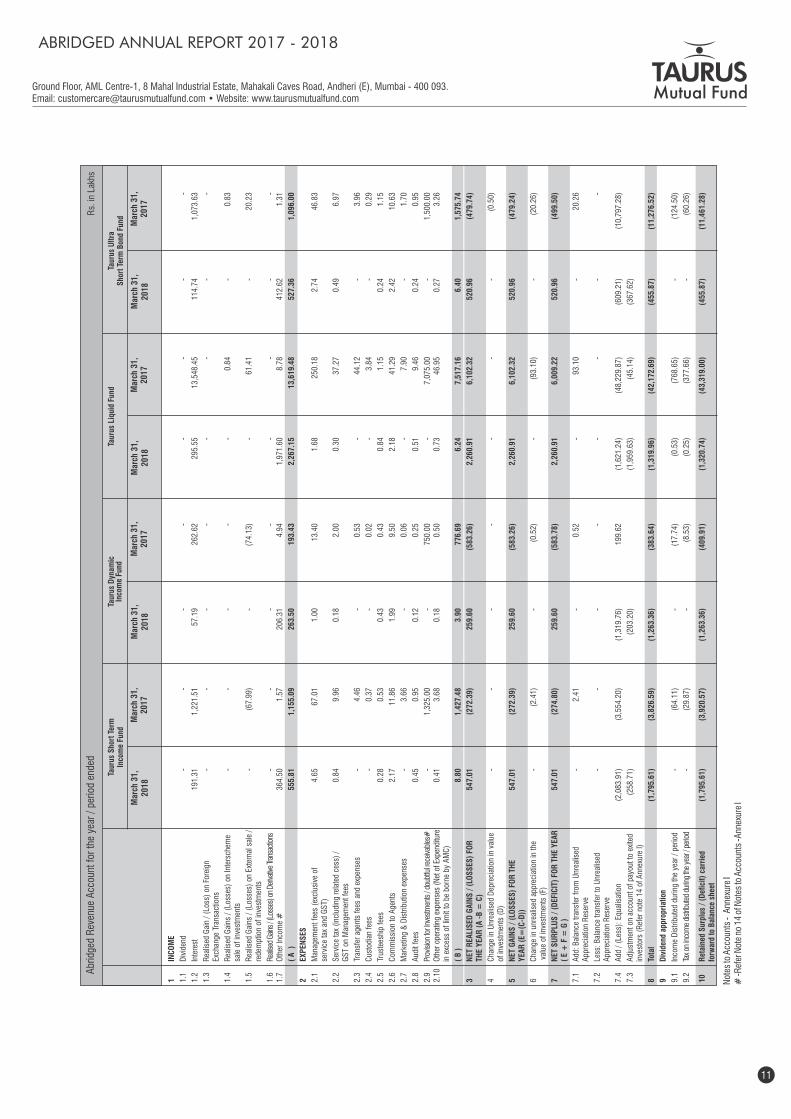
1 IN
CO
ME
1.1
Div
iden
d -
-
-
-
-
-
-
-
1.2
Inte
rest
1
91.3
1
1,2
21.5
1
57.
19
262
.62
2
95.5
5
13,
548.
45
114
.74
1
,073
.63
1.3
Rea
lised
Gai
n /
(Los
s) o
n Fo
reig
n
-
-
-
-
-
-
-
-
Exch
ange
Tra
nsac
tions
1.4
Rea
lised
Gai
ns /
(Lo
sses
) on
Inte
rsch
eme
-
-
-
-
-
0.8
4
-
0
.83
sa
le o
f in
vest
men
ts
1.5
Rea
lised
Gai
ns /
(Lo
sses
) on
Ext
erna
l sal
e /
-
(67
.99)
-
(74
.13)
-
61.
41
-
2
0.23
rede
mpt
ion
of in
vest
men
ts
1.6
Reali
sed
Gain
s / (
Loss
es) o
n D
eriva
tive
Tran
sact
ions
-
-
-
-
-
-
-
-
1.7
Oth
er In
com
e #
3
64.5
0
1.5
7
206
.31
4
.94
1
,971
.60
8
.78
4
12.6
2
1.3
1
(
A )
5
55.8
1
1,1
55.0
9
263
.50
1
93.4
3
2,2
67.1
5
13,
619.
48
527
.36
1
,096
.00
2 EX
PEN
SES
2.1
Man
agem
ent f
ees
(exc
lusi
ve o
f
4.6
5
67.
01
1.0
0
13.
40
1.6
8
250
.18
2
.74
4
6.83
serv
ice
tax
and
GS
T)
2.2
Ser
vice
tax
(inc
ludi
ng r
elat
ed c
ess)
/
0.8
4
9.9
6
0.1
8
2.0
0
0.3
0
37.
27
0.4
9
6.9
7
GS
T on
Man
agem
ent f
ees
2.3
Tran
sfer
age
nts
fees
and
exp
ense
s -
4.4
6
-
0
.53
-
44.
12
-
3
.96
2.4
Cus
todi
an f
ees
-
0
.37
-
0.0
2
-
3
.84
-
0.2
9
2.5
Trus
tees
hip
fees
0
.28
0
.53
0
.43
0
.43
0
.84
1
.15
0
.24
1
.15
2.6
Com
mis
sion
to A
gent
s 2
.17
1
1.86
1
.99
9
.50
2
.18
4
1.29
2
.42
1
0.63
2.7
Mar
ketin
g &
Dis
trib
utio
n ex
pens
es
-
3
.66
-
0.0
6
-
7
.90
-
1.7
0
2.8
Aud
it fe
es
0.4
5
0.9
5
0.1
2
0.2
5
0.5
1
9.4
6
0.2
4
0.9
5
2.9
Prov
isio
n fo
r Inv
estm
ents
/ do
ubtfu
l rec
eiva
bles
#
-
1
,325
.00
-
750
.00
-
7,0
75.0
0
-
1
,500
.00
2.10
O
ther
ope
ratin
g ex
pens
es (
Net
of E
xpen
ditu
re
0.4
1
3.6
8
0.1
8
0.5
0
0.7
3
46.
95
0.2
7
3.2
6
in e
xces
s of
lim
it to
be
born
e by
AM
C)
(
B )
8
.80
1
,427
.48
3
.90
7
76.6
9
6.2
4
7,5
17.1
6
6.4
0
1,5
75.7
4
3 N
ET R
EALI
SED
GA
INS
/ (
LOS
SES
) FO
R
547
.01
(
272.
39)
259
.60
(
583.
26)
2,2
60.9
1
6,1
02.3
2
520
.96
(
479.
74)
TH
E Y
EAR
(A
-B
= C
)
4 C
hang
e in
Unr
ealis
ed D
epre
ciat
ion
in v
alue
-
-
-
-
-
-
-
(0.
50)
of
inve
stm
ents
(D
)
5 N
ET G
AIN
S /
(LO
SS
ES)
FOR
TH
E
547
.01
(
272.
39)
259
.60
(
583.
26)
2,2
60.9
1
6,1
02.3
2
520
.96
(
479.
24)
Y
EAR
(E=
(C-D
))
6 C
hang
e in
unr
ealis
ed a
ppre
ciat
ion
in th
e -
(2.
41)
-
(
0.52
) -
(93
.10)
-
(20
.26)
v
alue
of
inve
stm
ents
(F)
7 N
ET S
UR
PLU
S /
(D
EFIC
IT)
FOR
TH
E Y
EAR
5
47.0
1
(27
4.80
) 2
59.6
0
(58
3.78
) 2
,260
.91
6
,009
.22
5
20.9
6
(49
9.50
)
( E
+ F
= G
)
7.1
Add
: Bal
ance
tran
sfer
fro
m U
nrea
lised
-
2.4
1
-
0
.52
-
93.
10
-
2
0.26
App
reci
atio
n R
eser
ve
7.2
Less
: Bal
ance
tran
sfer
to U
nrea
lised
-
-
-
-
-
-
-
-
A
ppre
ciat
ion
Res
erve
7.4
Add
/ (
Less
): E
qual
isat
ion
(2,
083.
91)
(3,
554.
20)
(1,
319.
76)
199
.62
(
1,62
1.24
) (
48,2
29.8
7)
(60
9.21
) (
10,7
97.2
8)
7.3
Adj
ustm
ent o
n ac
coun
t of
payo
ut to
exi
ted
(
258.
71)
(
203.
20)
(
1,95
9.63
) (
45.1
4)
(36
7.62
)
inve
stor
s (R
efer
not
e 14
of
Ann
exur
e I)
8 To
tal
(1,
795.
61)
(3,
826.
59)
(1,
263.
36)
(38
3.64
) (
1,31
9.96
) (
42,1
72.6
9)
(45
5.87
) (
11,2
76.5
2)
9 D
ivid
end
appr
opri
atio
n
9.1
Inco
me
Dis
trib
uted
dur
ing
the
year
/ p
erio
d
-
(
64.1
1)
-
(
17.7
4)
(0.
53)
(76
8.65
) -
(12
4.50
)
9.2
Tax
on in
com
e di
strib
uted
dur
ing
the
year
/ pe
riod
-
(
29.8
7)
-
(
8.53
) (
0.25
) (
377.
66)
-
(
60.2
6)
10
Ret
aine
d S
urpl
us /
(D
efic
it)
carr
ied
(1,
795.
61)
(3,
920.
57)
(1,
263.
36)
(40
9.91
) (
1,32
0.74
) (
43,3
19.0
0)
(45
5.87
) (
11,4
61.2
8)
forw
ard
to B
alan
ce s
heet
Abr
idge
d R
even
ue A
ccou
nt f
or th
e ye
ar /
per
iod
ende
d
Taur
us S
hort
Ter
mIn
com
e Fu
nd
Mar
ch 3
1,
2018
Mar
ch 3
1,
2017
Taur
us D
ynam
icIn
com
e Fu
ndTa
urus
Liq
uid
Fund
Taur
us U
ltra
Sho
rt T
erm
Bon
d Fu
nd
Rs.
in L
akhs
Mar
ch 3
1,
2018
Mar
ch 3
1,
2017
Mar
ch 3
1,
2018
Mar
ch 3
1,
2017
Mar
ch 3
1,
2018
Mar
ch 3
1,
2017
ABRIDGED ANNUAL REPORT 2017 - 2018
11
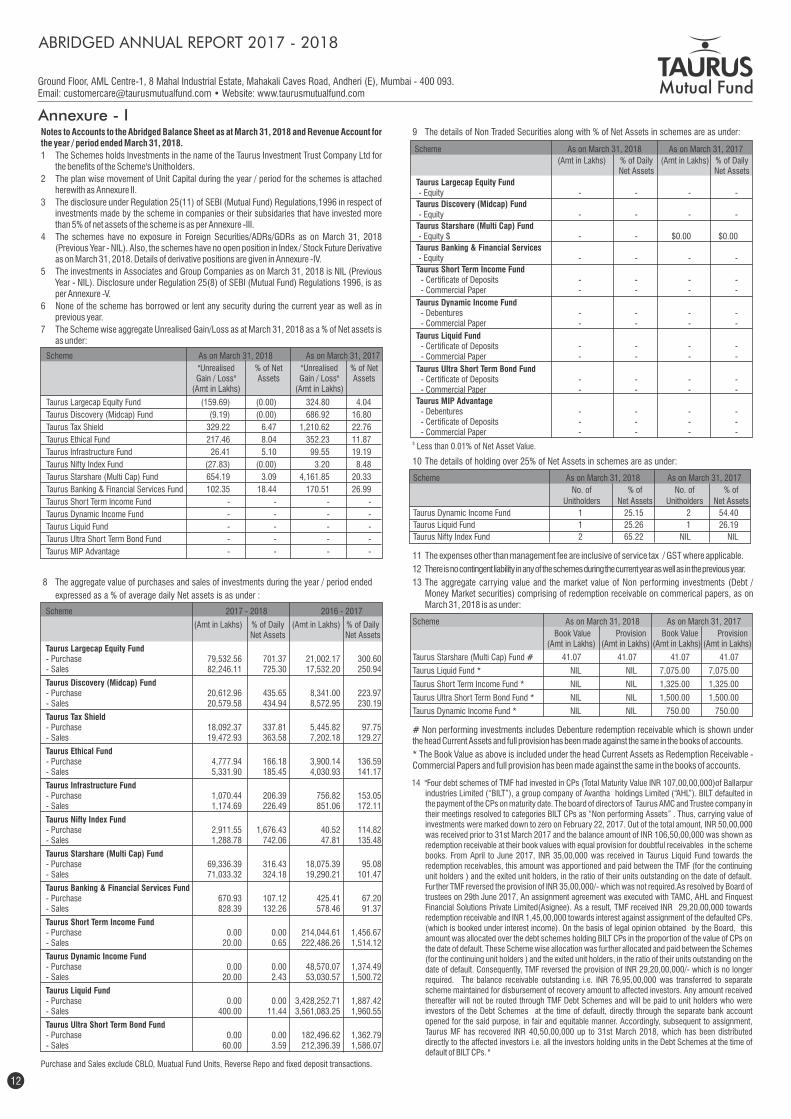
Ground Floor, AML Centre-1, 8 Mahal Industrial Estate, Mahakali Caves Road, Andheri (E), Mumbai - 400 093.Email: [email protected] • Website: www.taurusmutualfund.com
Notes to Accounts to the Abridged Balance Sheet as at March 31, 2018 and Revenue Account for the year / period ended March 31, 2018.
1 The Schemes holds Investments in the name of the Taurus Investment Trust Company Ltd for the benefits of the Scheme's Unitholders.
2 The plan wise movement of Unit Capital during the year / period for the schemes is attached herewith as Annexure II.
3 The disclosure under Regulation 25(11) of SEBI (Mutual Fund) Regulations,1996 in respect of investments made by the scheme in companies or their subsidaries that have invested more than 5% of net assets of the scheme is as per Annexure -III.
4 The schemes have no exposure in Foreign Securities/ADRs/GDRs as on March 31, 2018 (Previous Year - NIL). Also, the schemes have no open position in Index / Stock Future Derivative as on March 31, 2018. Details of derivative positions are given in Annexure -IV.
5 The investments in Associates and Group Companies as on March 31, 2018 is NIL (Previous Year - NIL). Disclosure under Regulation 25(8) of SEBI (Mutual Fund) Regulations 1996, is as per Annexure -V.
6 None of the scheme has borrowed or lent any security during the current year as well as in previous year.
7 The Scheme wise aggregate Unrealised Gain/Loss as at March 31, 2018 as a % of Net assets is as under:
Annexure - I
Scheme As on March 31, 2018 As on March 31, 2017
"Unrealised % of Net "Unrealised % of Net Gain / Loss" Assets Gain / Loss" Assets (Amt in Lakhs) (Amt in Lakhs)
Taurus Largecap Equity Fund (159.69) (0.00) 324.80 4.04
Taurus Discovery (Midcap) Fund (9.19) (0.00) 686.92 16.80
Taurus Tax Shield 329.22 6.47 1,210.62 22.76
Taurus Ethical Fund 217.46 8.04 352.23 11.87
Taurus Infrastructure Fund 26.41 5.10 99.55 19.19
Taurus Nifty Index Fund (27.83) (0.00) 3.20 8.48
Taurus Starshare (Multi Cap) Fund 654.19 3.09 4,161.85 20.33
Taurus Banking & Financial Services Fund 102.35 18.44 170.51 26.99
Taurus Short Term Income Fund - - - -
Taurus Dynamic Income Fund - - - -
Taurus Liquid Fund - - - -
Taurus Ultra Short Term Bond Fund - - - -
Taurus MIP Advantage - - - -
8 The aggregate value of purchases and sales of investments during the year / period ended
expressed as a % of average daily Net assets is as under :
Purchase and Sales exclude CBLO, Muatual Fund Units, Reverse Repo and fixed deposit transactions.
Scheme As on March 31, 2018 A s on March 31, 2017
(Amt in Lakhs) % of Daily (Amt in Lakhs) % of Daily Net Assets Net Assets
Taurus Largecap Equity Fund - Equity - - - -
Taurus Discovery (Midcap) Fund - Equity - - - -
Taurus Starshare (Multi Cap) Fund - Equity $ - - $0.00 $0.00
Taurus Banking & Financial Services - Equity - - - -
Taurus Short Term Income Fund - Certificate of Deposits - - - - - Commercial Paper - - - -
Taurus Dynamic Income Fund - Debentures - - - - - Commercial Paper - - - -
Taurus Liquid Fund - Certificate of Deposits - - - - - Commercial Paper - - - -
Taurus Ultra Short Term Bond Fund - Certificate of Deposits - - - - - Commercial Paper - - - -
Taurus MIP Advantage - Debentures - - - - - Certificate of Deposits - - - - - Commercial Paper - - - -
9 The details of Non Traded Securities along with % of Net Assets in schemes are as under:
$ Less than 0.01% of Net Asset Value.
Scheme As on March 31, 2018 A s on March 31, 2017
No. of % of No. of % of
Unitholders Net Assets Unitholders Net Assets
Taurus Dynamic Income Fund 1 25.15 2 54.40
Taurus Liquid Fund 1 25.26 1 26.19
Taurus Nifty Index Fund 2 65.22 NIL NIL
10 The details of holding over 25% of Net Assets in schemes are as under:
14 "Four debt schemes of TMF had invested in CPs (Total Maturity Value INR 107,00,00,000)of Ballarpur industries Limited (“BILT”), a group company of Avantha holdings Limited (“AHL”). BILT defaulted in the payment of the CPs on maturity date. The board of directors of Taurus AMC and Trustee company in their meetings resolved to categories BILT CPs as “Non performing Assets” . Thus, carrying value of investments were marked down to zero on February 22, 2017. Out of the total amount, INR 50,00,000 was received prior to 31st March 2017 and the balance amount of INR 106,50,00,000 was shown as redemption receivable at their book values with equal provision for doubtful receivables in the scheme books. From April to June 2017, INR 35,00,000 was received in Taurus Liquid Fund towards the redemption receivables, this amount was appor tioned and paid between the TMF (for the continuing unit holders ) and the exited unit holders, in the ratio of their units outstanding on the date of default. Further TMF reversed the provision of INR 35,00,000/- which was not required.As resolved by Board of trustees on 29th June 2017, An assignment agreement was executed with TAMC, AHL and Finquest Financial Solutions Private Limited(Asignee). As a result, TMF received INR 29,20,00,000 towards redemption receivable and INR 1,45,00,000 towards interest against assignment of the defaulted CPs. (which is booked under interest income). On the basis of legal opinion obtained by the Board, this amount was allocated over the debt schemes holding BILT CPs in the proportion of the value of CPs on the date of default. These Scheme wise allocation was further allocated and paid between the Schemes (for the continuing unit holders ) and the exited unit holders, in the ratio of their units outstanding on the date of default. Consequently, TMF reversed the provision of INR 29,20,00,000/- which is no longer required. The balance receivable outstanding i.e. INR 76,95,00,000 was transferred to separate scheme maintained for disbursement of recovery amount to affected investors. Any amount received thereafter will not be routed through TMF Debt Schemes and will be paid to unit holders who were investors of the Debt Schemes at the time of default, directly through the separate bank account opened for the said purpose, in fair and equitable manner. Accordingly, subsequent to assignment, Taurus MF has recovered INR 40,50,00,000 up to 31st March 2018, which has been distributed directly to the affected investors i.e. all the investors holding units in the Debt Schemes at the time of default of BILT CPs. "
Scheme As on March 31, 2018 A s on March 31, 2017
Book Value Provision Book Value Provision (Amt in Lakhs) (Amt in Lakhs) (Amt in Lakhs) (Amt in Lakhs)
Taurus Starshare (Multi Cap) Fund # 41.07 41.07 41.07 41.07
Taurus Liquid Fund * NIL NIL 7,075.00 7,075.00
Taurus Short Term Income Fund * NIL NIL 1,325.00 1,325.00
Taurus Ultra Short Term Bond Fund * NIL NIL 1,500.00 1,500.00
Taurus Dynamic Income Fund * NIL NIL 750.00 750.00
11 The expenses other than management fee are inclusive of service tax / GST where applicable.
12 There is no contingent liability in any of the schemes during the current year as well as in the previous year.
13 The aggregate carrying value and the market value of Non performing investments (Debt / Money Market securities) comprising of redemption receivable on commerical papers, as on March 31, 2018 is as under:
# Non performing investments includes Debenture redemption receivable which is shown under the head Current Assets and full provision has been made against the same in the books of accounts.
* The Book Value as above is included under the head Current Assets as Redemption Receivable -Commercial Papers and full provision has been made against the same in the books of accounts.
Scheme 2017 - 2018 2016 - 2017
(Amt in Lakhs) % of Daily (Amt in Lakhs) % of Daily Net Assets Net Assets
Taurus Largecap Equity Fund - Purchase 79,532.56 701.37 21,002.17 300.60 - Sales 82,246.11 725.30 17,532.20 250.94
Taurus Discovery (Midcap) Fund - Purchase 20,612.96 435.65 8,341.00 223.97 - Sales 20,579.58 434.94 8,572.95 230.19
Taurus Tax Shield - Purchase 18,092.37 337.81 5,445.82 97.75 - Sales 19,472.93 363.58 7,202.18 129.27
Taurus Ethical Fund - Purchase 4,777.94 166.18 3,900.14 136.59 - Sales 5,331.90 185.45 4,030.93 141.17
Taurus Infrastructure Fund - Purchase 1,070.44 206.39 756.82 153.05 - Sales 1,174.69 226.49 851.06 172.11
Taurus Nifty Index Fund - Purchase 2,911.55 1,676.43 40.52 114.82 - Sales 1,288.78 742.06 47.81 135.48
Taurus Starshare (Multi Cap) Fund - Purchase 69,336.39 316.43 18,075.39 95.08 - Sales 71,033.32 324.18 19,290.21 101.47
Taurus Banking & Financial Services Fund - Purchase 670.93 107.12 425.41 67.20 - Sales 828.39 132.26 578.46 91.37
Taurus Short Term Income Fund - Purchase 0.00 0.00 214,044.61 1,456.67 - Sales 20.00 0.65 222,486.26 1,514.12
Taurus Dynamic Income Fund - Purchase 0.00 0.00 48,570.07 1,374.49 - Sales 20.00 2.43 53,030.57 1,500.72
Taurus Liquid Fund - Purchase 0.00 0.00 3,428,252.71 1,887.42 - Sales 400.00 11.44 3,561,083.25 1,960.55
Taurus Ultra Short Term Bond Fund - Purchase 0.00 0.00 182,496.62 1,362.79 - Sales 60.00 3.59 212,396.39 1,586.07
ABRIDGED ANNUAL REPORT 2017 - 2018
12
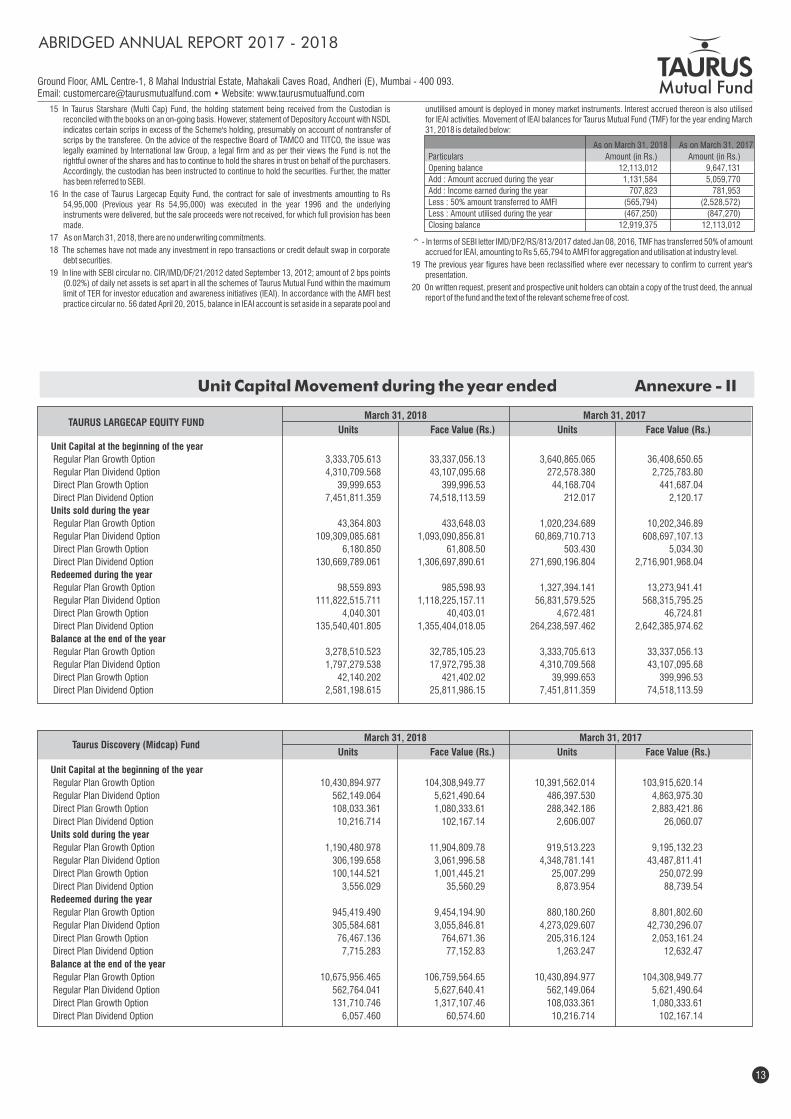
Ground Floor, AML Centre-1, 8 Mahal Industrial Estate, Mahakali Caves Road, Andheri (E), Mumbai - 400 093.Email: [email protected] • Website: www.taurusmutualfund.com
15 In Taurus Starshare (Multi Cap) Fund, the holding statement being received from the Custodian is reconciled with the books on an on-going basis. However, statement of Depository Account with NSDL indicates certain scrips in excess of the Scheme's holding, presumably on account of nontransfer of scrips by the transferee. On the advice of the respective Board of TAMCO and TITCO, the issue was legally examined by International law Group, a legal firm and as per their views the Fund is not the rightful owner of the shares and has to continue to hold the shares in trust on behalf of the purchasers. Accordingly, the custodian has been instructed to continue to hold the securities. Further, the matter has been referred to SEBI.
16 In the case of Taurus Largecap Equity Fund, the contract for sale of investments amounting to Rs 54,95,000 (Previous year Rs 54,95,000) was executed in the year 1996 and the underlying instruments were delivered, but the sale proceeds were not received, for which full provision has been made.
17 As on March 31, 2018, there are no underwriting commitments.
18 The schemes have not made any investment in repo transactions or credit default swap in corporate debt securities.
19 In line with SEBI circular no. CIR/IMD/DF/21/2012 dated September 13, 2012; amount of 2 bps points (0.02%) of daily net assets is set apart in all the schemes of Taurus Mutual Fund within the maximum limit of TER for investor education and awareness initiatives (IEAI). In accordance with the AMFI best practice circular no. 56 dated April 20, 2015, balance in IEAI account is set aside in a separate pool and
unutilised amount is deployed in money market instruments. Interest accrued thereon is also utilised for IEAI activities. Movement of IEAI balances for Taurus Mutual Fund (TMF) for the year ending March 31, 2018 is detailed below:
^ - In terms of SEBI letter IMD/DF2/RS/813/2017 dated Jan 08, 2016, TMF has transferred 50% of amount accrued for IEAI, amounting to Rs 5,65,794 to AMFI for aggregation and utilisation at industry level.
19 The previous year figures have been reclassified where ever necessary to confirm to current year's presentation.
20 On written request, present and prospective unit holders can obtain a copy of the trust deed, the annual report of the fund and the text of the relevant scheme free of cost.
Unit Capital at the beginning of the year
Regular Plan Growth Option 3,333,705.613 33,337,056.13 3,640,865.065 36,408,650.65
Regular Plan Dividend Option 4,310,709.568 43,107,095.68 272,578.380 2,725,783.80
Direct Plan Growth Option 39,999.653 399,996.53 44,168.704 441,687.04
Direct Plan Dividend Option 7,451,811.359 74,518,113.59 212.017 2,120.17
Units sold during the year
Regular Plan Growth Option 43,364.803 433,648.03 1,020,234.689 10,202,346.89
Regular Plan Dividend Option 109,309,085.681 1,093,090,856.81 60,869,710.713 608,697,107.13
Direct Plan Growth Option 6,180.850 61,808.50 503.430 5,034.30
Direct Plan Dividend Option 130,669,789.061 1,306,697,890.61 271,690,196.804 2,716,901,968.04
Redeemed during the year
Regular Plan Growth Option 98,559.893 985,598.93 1,327,394.141 13,273,941.41
Regular Plan Dividend Option 111,822,515.711 1,118,225,157.11 56,831,579.525 568,315,795.25
Direct Plan Growth Option 4,040.301 40,403.01 4,672.481 46,724.81
Direct Plan Dividend Option 135,540,401.805 1,355,404,018.05 264,238,597.462 2,642,385,974.62
Balance at the end of the year
Regular Plan Growth Option 3,278,510.523 32,785,105.23 3,333,705.613 33,337,056.13
Regular Plan Dividend Option 1,797,279.538 17,972,795.38 4,310,709.568 43,107,095.68
Direct Plan Growth Option 42,140.202 421,402.02 39,999.653 399,996.53
Direct Plan Dividend Option 2,581,198.615 25,811,986.15 7,451,811.359 74,518,113.59
March 31, 2018 March 31, 2017TAURUS LARGECAP EQUITY FUND
Units Face Value (Rs.) Units Face Value (Rs.)
Unit Capital Movement during the year ended Annexure - II
As on March 31, 2018 As on March 31, 2017
Particulars Amount (in Rs.) Amount (in Rs.)
Opening balance 12,113,012 9,647,131
Add : Amount accrued during the year 1,131,584 5,059,770
Add : Income earned during the year 707,823 781,953
Less : 50% amount transferred to AMFI (565,794) (2,528,572)
Less : Amount utilised during the year (467,250) (847,270)
Closing balance 12,919,375 12,113,012
ABRIDGED ANNUAL REPORT 2017 - 2018
13
Unit Capital at the beginning of the year
Regular Plan Growth Option 10,430,894.977 104,308,949.77 10,391,562.014 103,915,620.14
Regular Plan Dividend Option 562,149.064 5,621,490.64 486,397.530 4,863,975.30
Direct Plan Growth Option 108,033.361 1,080,333.61 288,342.186 2,883,421.86
Direct Plan Dividend Option 10,216.714 102,167.14 2,606.007 26,060.07
Units sold during the year
Regular Plan Growth Option 1,190,480.978 11,904,809.78 919,513.223 9,195,132.23
Regular Plan Dividend Option 306,199.658 3,061,996.58 4,348,781.141 43,487,811.41
Direct Plan Growth Option 100,144.521 1,001,445.21 25,007.299 250,072.99
Direct Plan Dividend Option 3,556.029 35,560.29 8,873.954 88,739.54
Redeemed during the year
Regular Plan Growth Option 945,419.490 9,454,194.90 880,180.260 8,801,802.60
Regular Plan Dividend Option 305,584.681 3,055,846.81 4,273,029.607 42,730,296.07
Direct Plan Growth Option 76,467.136 764,671.36 205,316.124 2,053,161.24
Direct Plan Dividend Option 7,715.283 77,152.83 1,263.247 12,632.47
Balance at the end of the year
Regular Plan Growth Option 10,675,956.465 106,759,564.65 10,430,894.977 104,308,949.77
Regular Plan Dividend Option 562,764.041 5,627,640.41 562,149.064 5,621,490.64
Direct Plan Growth Option 131,710.746 1,317,107.46 108,033.361 1,080,333.61
Direct Plan Dividend Option 6,057.460 60,574.60 10,216.714 102,167.14
March 31, 2018 March 31, 2017Taurus Discovery (Midcap) Fund
Units Face Value (Rs.) Units Face Value (Rs.)

Ground Floor, AML Centre-1, 8 Mahal Industrial Estate, Mahakali Caves Road, Andheri (E), Mumbai - 400 093.Email: [email protected] • Website: www.taurusmutualfund.com
Unit Capital at the beginning of the year
Regular Plan Growth Option 4,844,059.902 48,440,599.02 6,688,852.667 66,888,526.67
Regular Plan Dividend Option 7,469,070.685 74,690,706.85 9,549,106.305 95,491,063.05
Direct Plan Growth Option 152,099.184 1,520,991.84 152,705.826 1,527,058.26
Direct Plan Dividend Option 38,829.714 388,297.14 50,509.812 505,098.12
Units sold during the year
Regular Plan Growth Option 149,250.021 1,492,500.21 160,878.507 1,608,785.07
Regular Plan Dividend Option 57,892.083 578,920.83 114,135.921 1,141,359.21
Direct Plan Growth Option 12,769.567 127,695.67 10,271.267 102,712.67
Direct Plan Dividend Option 4,273.302 42,733.02 5,822.429 58,224.29
Redeemed during the year
Regular Plan Growth Option 1,088,477.467 10,884,774.67 2,005,671.272 20,056,712.72
Regular Plan Dividend Option 1,693,027.196 16,930,271.96 2,194,171.541 21,941,715.41
Direct Plan Growth Option 9,456.307 94,563.07 10,877.909 108,779.09
Direct Plan Dividend Option 9,859.553 98,595.53 17,502.527 175,025.27
Balance at the end of the year
Regular Plan Growth Option 3,904,832.456 39,048,324.56 4,844,059.902 48,440,599.02
Regular Plan Dividend Option 5,833,935.572 58,339,355.72 7,469,070.685 74,690,706.85
Direct Plan Growth Option 155,412.444 1,554,124.44 152,099.184 1,520,991.84
Direct Plan Dividend Option 33,243.463 332,434.63 38,829.714 388,297.14
March 31, 2018 March 31, 2017TAURUS TAX SHIELD
Units Face Value (Rs.) Units Face Value (Rs.)
ABRIDGED ANNUAL REPORT 2017 - 2018
14
March 31, 2018 March 31, 2017TAURUS ETHICAL FUND
Units Face Value (Rs.) Units Face Value (Rs.)
Unit Capital at the beginning of the year Regular Plan Growth Option 4,455,417.172 44,554,171.72 4,347,161.701 43,471,617.01 Regular Plan Dividend Option 2,949,344.546 29,493,445.46 3,304,048.106 33,040,481.06 Regular Plan Bonus Option 3,492.638 34,926.38 8,089.490 80,894.90 Direct Plan Growth Option 494,356.151 4,943,561.51 465,535.239 4,655,352.39 Direct Plan Dividend Option 133,723.803 1,337,238.03 127,835.839 1,278,358.39 Direct Plan Bonus Option 2,990.951 29,909.51 2,990.951 29,909.51 Units sold during the year Regular Plan Growth Option 958,450.079 9,584,500.79 1,128,779.990 11,287,799.90 Regular Plan Dividend Option 160,503.513 1,605,035.13 238,801.490 2,388,014.90 Regular Plan Bonus Option - - - Direct Plan Growth Option 97,727.997 977,279.97 107,293.046 1,072,930.46 Direct Plan Dividend Option 27,472.514 274,725.14 21,117.004 211,170.04 Direct Plan Bonus Option - - - - Redeemed during the year Regular Plan Growth Option 1,710,780.276 17,107,802.76 1,020,524.519 10,205,245.19 Regular Plan Dividend Option 1,223,425.910 12,234,259.10 593,505.050 5,935,050.50 Regular Plan Bonus Option 1,110.289 11,102.89 4,596.852 45,968.52 Direct Plan Growth Option 66,111.354 661,113.54 78,472.134 784,721.34 Direct Plan Dividend Option 42,544.965 425,449.65 15,229.040 152,290.40 Direct Plan Bonus Option 362.845 3,628.45 - - Balance at the end of the year Regular Plan Growth Option 3,703,086.975 37,030,869.75 4,455,417.172 44,554,171.72 Regular Plan Dividend Option 1,886,422.149 18,864,221.49 2,949,344.546 29,493,445.46 Regular Plan Bonus Option 2,382.349 23,823.49 3,492.638 34,926.38 Direct Plan Growth Option 525,972.794 5,259,727.94 494,356.151 4,943,561.51 Direct Plan Dividend Option 118,651.352 1,186,513.52 133,723.803 1,337,238.03 Direct Plan Bonus Option 2,628.106 26,281.06 2,990.951 29,909.51

Ground Floor, AML Centre-1, 8 Mahal Industrial Estate, Mahakali Caves Road, Andheri (E), Mumbai - 400 093.Email: [email protected] • Website: www.taurusmutualfund.com
Unit Capital at the beginning of the year
Regular Plan Growth Option 92,083.098 920,830.98 145,055.832 1,450,558.32
Regular Plan Dividend Option 88,215.892 882,158.92 103,315.734 1,033,157.34
Direct Plan Growth Option 38,191.008 381,910.08 9,208.451 92,084.51
Direct Plan Dividend Option 2,243.839 22,438.39 3,467.293 34,672.93
Units sold during the year
Regular Plan Growth Option 7,243.210 72,432.10 22,475.978 224,759.78
Regular Plan Dividend Option 54,475,101.115 544,751,011.15 198.451 1,984.51
Direct Plan Growth Option 8,116.535 81,165.35 33,730.298 337,302.98
Direct Plan Dividend Option 11,466.150 114,661.50 13,187.562 131,875.62
Redeemed during the year
Regular Plan Growth Option 31,817.655 318,176.55 75,448.712 754,487.12
Regular Plan Dividend Option 40,677,130.015 406,771,300.15 15,298.293 152,982.93
Direct Plan Growth Option 5,357.323 53,573.23 4,747.741 47,477.41
Direct Plan Dividend Option 996.803 9,968.03 14,411.016 144,110.16
Balance at the end of the year
Regular Plan Growth Option 67,508.653 675,086.53 92,083.098 920,830.98
Regular Plan Dividend Option 13,886,186.992 138,861,869.92 88,215.892 882,158.92
Direct Plan Growth Option 40,950.220 409,502.20 38,191.008 381,910.08
Direct Plan Dividend Option 12,713.186 127,131.86 2,243.839 22,438.39
March 31, 2018 March 31, 2017TAURUS NIFTY INDEX FUND
Units Face Value (Rs.) Units Face Value (Rs.)
ABRIDGED ANNUAL REPORT 2017 - 2018
15
Unit Capital at the beginning of the year
Regular Plan Growth Option 1,725,594.174 17,255,941.74 1,993,088.373 19,930,883.73
Regular Plan Dividend Option 681,932.927 6,819,329.27 904,387.350 9,043,873.50
Direct Plan Growth Option 66,211.212 662,112.12 66,793.399 667,933.99
Direct Plan Dividend Option 9,127.157 91,271.57 3,503.997 35,039.97
Units sold during the year
Regular Plan Growth Option 173,677.857 1,736,778.57 132,556.685 1,325,566.85
Regular Plan Dividend Option 225,492.862 2,254,928.62 57,320.129 573,201.29
Direct Plan Growth Option 21,818.853 218,188.53 16,334.680 163,346.80
Direct Plan Dividend Option 6,491.646 64,916.46 5,678.470 56,784.70
Redeemed during the year
Regular Plan Growth Option 504,222.948 5,042,229.48 400,050.884 4,000,508.84
Regular Plan Dividend Option 294,042.036 2,940,420.36 279,774.552 2,797,745.52
Direct Plan Growth Option 18,964.929 189,649.29 16,916.867 169,168.67
Direct Plan Dividend Option 5,738.048 57,380.48 55.310 553.10
Balance at the end of the year
Regular Plan Growth Option 1,395,049.083 13,950,490.83 1,725,594.174 17,255,941.74
Regular Plan Dividend Option 613,383.753 6,133,837.53 681,932.927 6,819,329.27
Direct Plan Growth Option 69,065.136 690,651.36 66,211.212 662,112.12
Direct Plan Dividend Option 9,880.755 98,807.55 9,127.157 91,271.57
March 31, 2018 March 31, 2016TAURUS INFRASTRUCTURE FUND
Units Face Value (Rs.) Units Face Value (Rs.)
Unit Capital at the beginning of the year
Regular Plan Growth Option 19,663,003.880 196,630,038.80 20,612,726.281 206,127,262.81
Regular Plan Dividend Option 619,888.342 6,198,883.42 693,578.352 6,935,783.52
Direct Plan Growth Option 68,147.805 681,478.05 65,678.059 656,780.59
Direct Plan Dividend Option 4,489.782 44,897.82 5,783.308 57,833.08
Units sold during the year
Regular Plan Growth Option 101,975.408 1,019,754.08 78,654.651 786,546.51
Regular Plan Dividend Option 375,754.515 3,757,545.15 17,787.230 177,872.30
Direct Plan Growth Option 5,575.374 55,753.74 3,839.632 38,396.32
Direct Plan Dividend Option 15,247.480 152,474.80 959.452 9,594.52
Redeemed during the year
Regular Plan Growth Option 1,138,760.917 11,387,609.17 1,028,377.052 10,283,770.52
Regular Plan Dividend Option 117,667.967 1,176,679.67 91,477.240 914,772.40
Direct Plan Growth Option 2,586.393 25,863.93 1,369.886 13,698.86
Direct Plan Dividend Option 2,954.101 29,541.01 2,252.978 22,529.78
Balance at the end of the year
Regular Plan Growth Option 18,626,218.371 186,262,183.71 19,663,003.880 196,630,038.80
Regular Plan Dividend Option 877,974.890 8,779,748.90 619,888.342 6,198,883.42
Direct Plan Growth Option 71,136.786 711,367.86 68,147.805 681,478.05
Direct Plan Dividend Option 16,783.161 167,831.61 4,489.782 44,897.82
March 31, 2018 March 31, 2017TAURUS STARSHARE (MULTI CAP) FUND
Units Face Value (Rs.) Units Face Value (Rs.)
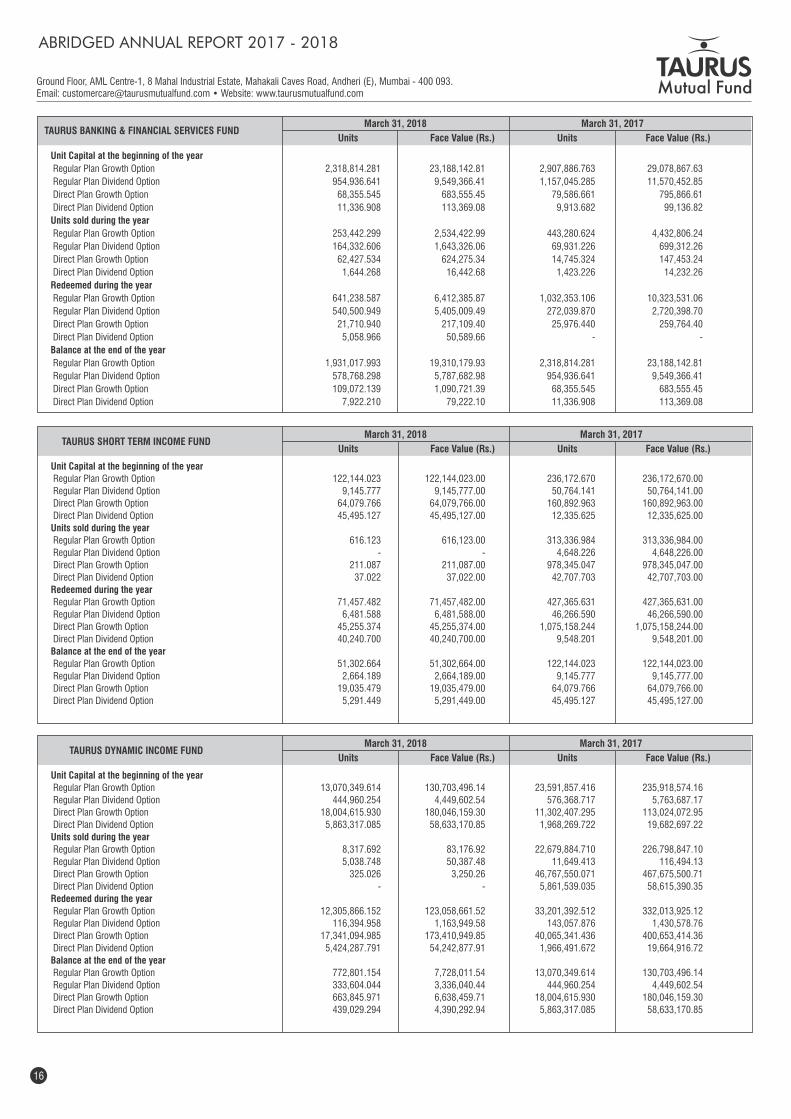
Ground Floor, AML Centre-1, 8 Mahal Industrial Estate, Mahakali Caves Road, Andheri (E), Mumbai - 400 093.Email: [email protected] • Website: www.taurusmutualfund.com
Unit Capital at the beginning of the year
Regular Plan Growth Option 2,318,814.281 23,188,142.81 2,907,886.763 29,078,867.63
Regular Plan Dividend Option 954,936.641 9,549,366.41 1,157,045.285 11,570,452.85
Direct Plan Growth Option 68,355.545 683,555.45 79,586.661 795,866.61
Direct Plan Dividend Option 11,336.908 113,369.08 9,913.682 99,136.82
Units sold during the year
Regular Plan Growth Option 253,442.299 2,534,422.99 443,280.624 4,432,806.24
Regular Plan Dividend Option 164,332.606 1,643,326.06 69,931.226 699,312.26
Direct Plan Growth Option 62,427.534 624,275.34 14,745.324 147,453.24
Direct Plan Dividend Option 1,644.268 16,442.68 1,423.226 14,232.26
Redeemed during the year
Regular Plan Growth Option 641,238.587 6,412,385.87 1,032,353.106 10,323,531.06
Regular Plan Dividend Option 540,500.949 5,405,009.49 272,039.870 2,720,398.70
Direct Plan Growth Option 21,710.940 217,109.40 25,976.440 259,764.40
Direct Plan Dividend Option 5,058.966 50,589.66 - -
Balance at the end of the year
Regular Plan Growth Option 1,931,017.993 19,310,179.93 2,318,814.281 23,188,142.81
Regular Plan Dividend Option 578,768.298 5,787,682.98 954,936.641 9,549,366.41
Direct Plan Growth Option 109,072.139 1,090,721.39 68,355.545 683,555.45
Direct Plan Dividend Option 7,922.210 79,222.10 11,336.908 113,369.08
March 31, 2018 March 31, 2017TAURUS BANKING & FINANCIAL SERVICES FUND
Units Face Value (Rs.) Units Face Value (Rs.)
Unit Capital at the beginning of the year
Regular Plan Growth Option 122,144.023 122,144,023.00 236,172.670 236,172,670.00
Regular Plan Dividend Option 9,145.777 9,145,777.00 50,764.141 50,764,141.00
Direct Plan Growth Option 64,079.766 64,079,766.00 160,892.963 160,892,963.00
Direct Plan Dividend Option 45,495.127 45,495,127.00 12,335.625 12,335,625.00
Units sold during the year
Regular Plan Growth Option 616.123 616,123.00 313,336.984 313,336,984.00
Regular Plan Dividend Option - - 4,648.226 4,648,226.00
Direct Plan Growth Option 211.087 211,087.00 978,345.047 978,345,047.00
Direct Plan Dividend Option 37.022 37,022.00 42,707.703 42,707,703.00
Redeemed during the year
Regular Plan Growth Option 71,457.482 71,457,482.00 427,365.631 427,365,631.00
Regular Plan Dividend Option 6,481.588 6,481,588.00 46,266.590 46,266,590.00
Direct Plan Growth Option 45,255.374 45,255,374.00 1,075,158.244 1,075,158,244.00
Direct Plan Dividend Option 40,240.700 40,240,700.00 9,548.201 9,548,201.00
Balance at the end of the year
Regular Plan Growth Option 51,302.664 51,302,664.00 122,144.023 122,144,023.00
Regular Plan Dividend Option 2,664.189 2,664,189.00 9,145.777 9,145,777.00
Direct Plan Growth Option 19,035.479 19,035,479.00 64,079.766 64,079,766.00
Direct Plan Dividend Option 5,291.449 5,291,449.00 45,495.127 45,495,127.00
March 31, 2018 March 31, 2017TAURUS SHORT TERM INCOME FUND
Units Face Value (Rs.) Units Face Value (Rs.)
ABRIDGED ANNUAL REPORT 2017 - 2018
16
Unit Capital at the beginning of the year
Regular Plan Growth Option 13,070,349.614 130,703,496.14 23,591,857.416 235,918,574.16
Regular Plan Dividend Option 444,960.254 4,449,602.54 576,368.717 5,763,687.17
Direct Plan Growth Option 18,004,615.930 180,046,159.30 11,302,407.295 113,024,072.95
Direct Plan Dividend Option 5,863,317.085 58,633,170.85 1,968,269.722 19,682,697.22
Units sold during the year
Regular Plan Growth Option 8,317.692 83,176.92 22,679,884.710 226,798,847.10
Regular Plan Dividend Option 5,038.748 50,387.48 11,649.413 116,494.13
Direct Plan Growth Option 325.026 3,250.26 46,767,550.071 467,675,500.71
Direct Plan Dividend Option - - 5,861,539.035 58,615,390.35
Redeemed during the year
Regular Plan Growth Option 12,305,866.152 123,058,661.52 33,201,392.512 332,013,925.12
Regular Plan Dividend Option 116,394.958 1,163,949.58 143,057.876 1,430,578.76
Direct Plan Growth Option 17,341,094.985 173,410,949.85 40,065,341.436 400,653,414.36
Direct Plan Dividend Option 5,424,287.791 54,242,877.91 1,966,491.672 19,664,916.72
Balance at the end of the year
Regular Plan Growth Option 772,801.154 7,728,011.54 13,070,349.614 130,703,496.14
Regular Plan Dividend Option 333,604.044 3,336,040.44 444,960.254 4,449,602.54
Direct Plan Growth Option 663,845.971 6,638,459.71 18,004,615.930 180,046,159.30
Direct Plan Dividend Option 439,029.294 4,390,292.94 5,863,317.085 58,633,170.85
March 31, 2018 March 31, 2017TAURUS DYNAMIC INCOME FUND
Units Face Value (Rs.) Units Face Value (Rs.)

Ground Floor, AML Centre-1, 8 Mahal Industrial Estate, Mahakali Caves Road, Andheri (E), Mumbai - 400 093.Email: [email protected] • Website: www.taurusmutualfund.com
Unit Capital at the beginning of the year Regular Plan Retail Growth Option 304.641 304,641.000 631.801 631,801.00 Regular Plan Retail Daily Dividend Option 82.385 82,385.000 82.041 82,041.00 Regular Plan Institutional Daily Dividend Option - - - - Regular Plan Institutional Growth Option 6,743.694 6,743,694.000 6,801.451 6,801,451.00 Regular Plan Super Insti Daily Dividend Option 180,382.203 180,382,203.000 606,104.679 606,104,679.00 Regular Plan Super Insti Growth Option 170,983.660 170,983,660.000 1,746,552.294 1,746,552,294.00 Regular Plan Super Insti Weekly Dividend Option 424.789 424,789.000 17,847.827 17,847,827.00 Direct Plan Super Insti Growth Option 122,902.503 122,902,503.000 5,268,134.432 5,268,134,432.00 Direct Plan Super Insti Daily Dividend Option 252,359.292 252,359,292.000 696,717.940 696,717,940.00 Direct Plan Super Insti Weekly Dividend Option 20.100 20,100.000 31.886 31,886.00 Unclaimed Redemption and Dividend Plan - - - - Units sold during the year Regular Plan Retail Growth Option - - - - Regular Plan Retail Daily Dividend Option 0.075 75.00 0.344 344.00 Regular Plan Institutional Daily Dividend Option - - - - Regular Plan Institutional Growth Option - - - - Regular Plan Super Insti Daily Dividend Option 821.341 821,341.00 8,540,269.618 8,540,269,618.00 Regular Plan Super Insti Growth Option 9,508.884 9,508,884.00 167,994,344.646 167,994,344,646.00 Regular Plan Super Insti Weekly Dividend Option 0.437 437.00 1,925,274.517 1,925,274,517.00 Direct Plan Super Insti Growth Option 5,821.932 5,821,932.00 250,050,765.880 250,050,765,880.00 Direct Plan Super Insti Daily Dividend Option 141.621 141,621.00 26,352,127.701 26,352,127,701.00 Direct Plan Super Insti Weekly Dividend Option 17.166 17,166.00 498.608 498,608.00 Unclaimed Redemption and Dividend Plan - - 72,803.707 72,803,707.00 Redeemed during the year Regular Plan Retail Growth Option 161.362 161,362.00 327.160 327,160.00 Regular Plan Retail Daily Dividend Option 30.414 30,414.00 - - Regular Plan Institutional Daily Dividend Option - - - - Regular Plan Institutional Growth Option 6,743.694 6,743,694.00 57.757 57,757.00 Regular Plan Super Insti Daily Dividend Option 179,029.157 179,029,157.00 8,965,992.094 8,965,992,094.00 Regular Plan Super Insti Growth Option 161,957.622 161,957,622.00 169,569,913.280 169,569,913,280.00 Regular Plan Super Insti Weekly Dividend Option 329.230 329,230.00 1,942,697.555 1,942,697,555.00 Direct Plan Super Insti Growth Option 107,979.205 107,979,205.00 255,195,997.809 255,195,997,809.00 Direct Plan Super Insti Daily Dividend Option 244,653.752 244,653,752.00 26,796,486.349 26,796,486,349.00 Direct Plan Super Insti Weekly Dividend Option - - 510.394 510,394.00 Unclaimed Redemption and Dividend Plan - 72,803.707 72,803,707.00 Balance at the end of the year Regular Plan Retail Growth Option 143.279 143,279.00 304.641 304,641.00 Regular Plan Retail Daily Dividend Option 52.046 52,046.00 82.385 82,385.00 Regular Plan Institutional Daily Dividend Option - - - - Regular Plan Institutional Growth Option (0.000) (0.00) 6,743.694 6,743,694.00 Regular Plan Super Insti Daily Dividend Option 2,174.387 2,174,387.00 180,382.203 180,382,203.00 Regular Plan Super Insti Growth Option 18,534.922 18,534,922.00 170,983.660 170,983,660.00 Regular Plan Super Insti Weekly Dividend Option 95.996 95,996.00 424.789 424,789.00 Direct Plan Super Insti Growth Option 20,745.230 20,745,230.00 122,902.503 122,902,503.00 Direct Plan Super Insti Daily Dividend Option 7,847.161 7,847,161.00 252,359.292 252,359,292.00 Direct Plan Super Insti Weekly Dividend Option 37.266 37,266.00 20.100 20,100.00 Unclaimed Redemption and Dividend Plan - - - -
March 31, 2018 March 31, 2017TAURUS LIQUID FUND
Units Face Value (Rs.) Units Face Value (Rs.)
ABRIDGED ANNUAL REPORT 2017 - 2018
17

Ground Floor, AML Centre-1, 8 Mahal Industrial Estate, Mahakali Caves Road, Andheri (E), Mumbai - 400 093.Email: [email protected] • Website: www.taurusmutualfund.com
March 31, 2018 March 31, 2017TAURUS ULTRA SHORT TERM BOND FUND
Units Face Value (Rs.) Units Face Value (Rs.)
Unit Capital at the beginning of the year Regular Plan Insti Daily Dividend Option 1,899.401 1,899,401.000 1,899.401 1,899,401.00 Regular Plan Retail Daily Dividend Option 3,067.762 3,067,762.000 12,388.443 12,388,443.00 Regular Plan Retail Growth Option 2,698.746 2,698,746.000 3,099.813 3,099,813.00 Regular Plan Retail Weekly Dividend Option 16.597 16,597.000 229.817 229,817.00 Regular Plan Super Insti Daily Dividend Option 4,626.208 4,626,208.000 192,533.405 192,533,405.00 Regular Plan Super Insti Growth Option 42,533.147 42,533,147.000 682,839.369 682,839,369.00 Regular Plan Super Insti Weekly Dividend Option 3,729.690 3,729,690.000 11,483.748 11,483,748.00 Direct Plan Super Insti Daily Dividend Option 61,057.392 61,057,392.000 181,790.377 181,790,377.00 Direct Plan Super Insti Weekly Dividend Option 45.510 45,510.000 1,080.625 1,080,625.00 Direct Plan Super Insti Growth Option 91,651.025 91,651,025.000 785,264.499 785,264,499.00 Units sold during the year Regular Plan Insti Daily Dividend Option - - - - Regular Plan Retail Daily Dividend Option - - - - Regular Plan Retail Growth Option - - - - Regular Plan Retail Weekly Dividend Option - - - - Regular Plan Super Insti Daily Dividend Option - - 301,802.808 301,802,808.00 Regular Plan Super Insti Growth Option 6,266.265 6,266,265.00 489,749.600 489,749,600.00 Regular Plan Super Insti Weekly Dividend Option - - 3,469.123 3,469,123.00 Direct Plan Super Insti Daily Dividend Option - - 632,003.565 632,003,565.00 Direct Plan Super Insti Weekly Dividend Option 25.686 25,686.00 152.372 152,372.00 Direct Plan Super Insti Growth Option 2,811.671 2,811,671.00 1,922,249.229 1,922,249,229.00 Redeemed during the year Regular Plan Insti Daily Dividend Option 1,899.40 1,899,401.00 - - Regular Plan Retail Daily Dividend Option 105.664 105,664.00 9,320.681 9,320,681.00 Regular Plan Retail Growth Option 810.125 810,125.00 401.067 401,067.00 Regular Plan Retail Weekly Dividend Option - - 213.220 213,220.00 Regular Plan Super Insti Daily Dividend Option 2,754.909 2,754,909.00 489,710.005 489,710,005.00 Regular Plan Super Insti Growth Option 26,670.981 26,670,981.00 1,130,055.822 1,130,055,822.00 Regular Plan Super Insti Weekly Dividend Option 3,620.743 3,620,743.00 11,223.181 11,223,181.00 Direct Plan Super Insti Daily Dividend Option 55,979.162 55,979,162.00 752,736.550 752,736,550.00 Direct Plan Super Insti Weekly Dividend Option 25.315 25,315.00 1,187.487 1,187,487.00 Direct Plan Super Insti Growth Option 62,943.413 62,943,413.00 2,615,862.703 2,615,862,703.00 Balance at the end of the year Regular Plan Insti Daily Dividend Option (0.000) (0.00) 1,899.401 1,899,401.00 Regular Plan Retail Daily Dividend Option 2,962.098 2,962,098.00 3,067.762 3,067,762.00 Regular Plan Retail Growth Option 1,888.621 1,888,621.00 2,698.746 2,698,746.00 Regular Plan Retail Weekly Dividend Option 16.597 16,597.00 16.597 16,597.00 Regular Plan Super Insti Daily Dividend Option 1,871.299 1,871,299.00 4,626.208 4,626,208.00 Regular Plan Super Insti Growth Option 22,128.431 22,128,431.00 42,533.147 42,533,147.00 Regular Plan Super Insti Weekly Dividend Option 108.947 108,947.00 3,729.690 3,729,690.00 Direct Plan Super Insti Daily Dividend Option 5,078.230 5,078,230.00 61,057.392 61,057,392.00 Direct Plan Super Insti Weekly Dividend Option 45.881 45,881.00 45.510 45,510.00 Direct Plan Super Insti Growth Option 31,519.283 31,519,283.000 91,651.025 91,651,025.00
ABRIDGED ANNUAL REPORT 2017 - 2018
18

Ground Floor, AML Centre-1, 8 Mahal Industrial Estate, Mahakali Caves Road, Andheri (E), Mumbai - 400 093.Email: [email protected] • Website: www.taurusmutualfund.com
Annexure - III
Name of the Company Scheme Invested by the Company Investments made by the Schemes of Taurus Mutual Fund in the Company or
its subsidiary
Outstanding as on March 31, 2018
(` in lakhs)
Aggregate cost of acquisition during the
period ended March 31, 2018 (` in lakhs)
AADHAR HOUSING FINANCE LTD. TAURUS DYNAMIC INCOME FUND TAURUS DYNAMIC INCOME FUND 690.62 -
TAURUS LIQUID FUND 7,204.42 -
TAURUS SHORT TERM INCOME FUND 1,476.98 -
TAURUS ULTRA SHORT TERM BOND FUND 1,478.33 -
CEAT LTD. TAURUS DYNAMIC INCOME FUND TAURUS DISCOVERY (MIDCAP) FUND 455.53 134.47
TAURUS ETHICAL FUND 220.37 120.14
TAURUS INFRASTRUCTURE FUND 3.01 -
TAURUS LARGECAP EQUITY FUND 359.10 71.24
TAURUS STARSHARE (MULTI CAP) FUND 898.33 548.14
TAURUS TAX SHIELD 282.77 126.90
Disclosure under Regulation 25 (11) of SEBI (Mutual Fund) Regulations, 1996
Investments made by the schemes of Taurus Mutual Fund in Companies or their subsidiaries that have invested more than 5% of the net assets of any scheme.
All companies transacted herewith are financially sound companies with proven track record. Moreover,the Fund Management team has undertaken detailed research in each of these companies and these companies are part of our investment universe with defined exposure norms. As a result, invesments in all these companies are independent investment decisions and do not relate, in any manner, to their investment in Taurus Mutual Fund's schemes.
ABRIDGED ANNUAL REPORT 2017 - 2018
19
Annexure IV
Portfolio disclosure for derivative positions.Portfolio disclosure for derivative positions pursuant to SEBI Circular Cir/ IMD/ DF/ 11/ 2010 dated August 18, 2010.
A. Hedging Positions through Futures as on March 31, 2018 - NIL
B. Other than Hedging Positions through Futures as on March 31, 2018 - NIL
C. Hedging Positions through Put Options as on March 31, 2018 - NIL
D. Other than Hedging Positions through Options as on March 31, 2018 - NIL
E. Hedging Positions through swaps as on March 31, 2018 - NIL
Annexure V
Details of payments to associate/group companies
Brokerage paid to associates/related parties/group companies of Sponsor/AMC for the year ended March 31, 2018 - NIL
Commission paid to associates/related parties/group companies of sponsor/AMC for the year ended March 31, 2018 - NIL
The Abridged Annual Report has been extracted from the Audited Balance Sheet, Revenue Account and Notes to Accounts, Full Annual Report is available on the website www.taurusmutualfund.com. Unitholders may refer to the full Annual Report displayed on the website w.r.t. general policies and procedures for exercising voting rights and the details of proxy votings exercised during the Financial Year 2017-2018. For Unitholders of the Scheme, full Annual Report is available for inspection at the Corporate Office/Central Service Office of the AMC and a copy thereof shall be made available to the Unitholder on request.

The above cash flow statement has been prepared in accordance with the indirect method set out in Accounting Standard (AS-3) issued by the Institute of Chartered Accountants of India.
April 1, 2017 toMarch 31, 2018
TAURUS STARSHARE (MUTLI CAP) FUND (EARLIER KNOWN AS TAURUS
STARSHARE FUND)
A. Cashflow from operating activities
Net Surplus for the year including Unrealised Appreciation in value of Investments 173,019,256 380,964,142
Add / (Less): Change in Unrealised Appreciation in value of Investments 350,766,285 (247,061,972)
Add / (Less): Change in Provision for depreciation in value of investments in securities - -
Add: Provision for doubtful receivables - -
Adjustment on account of provision for payout to exited investors - -
Operating Profit Before Working Capital Changes 523,785,541 133,902,170
Adjustments for:-
(Increase)/Decrease in investments (393,484,166) (41,128,131)
(Increase)/Decrease in other current assets (32,257,958) 4,071,196
Increase/(Decrease) in current liabilities 37,512,513 (29,303,160)
(Increase)/Decrease in deposits 282,400 (282,400)
Net cash used in operations ( A ) 135,838,330 67,259,675
B Cashflow from financing activities
Increase/(Decrease) in unit capital (7,634,166) (10,222,362)
Increase/(Decrease) in Unit Application Pending Allotment - -
Increase/(Decrease) in unit premium reserve (19,762,080) (18,038,287)
Increase/(Decrease) in Income Equalisation Reserve (67,530,155) (65,368,455)
Adjustments for:-
Increase/(Decrease) in redemption payable for units redeemed by investors" (292,629) 526,090
(Increase)/Decrease in subscription receivable for units issued to investors" 9,678 (16,000)
Increase/(Decrease) in Outstanding and accrued income - -
Increase/(Decrease) in Dividend Receivable (175,104) (41,547)
Dividend paid (including tax thereon) (6,909,519) -
Net cash generated from financing activities ( B ) (102,293,975) (93,160,561)
Net Increase/(Decrease) in cash and cash equivalents (A+B) 33,544,355 (25,900,886)
Cash and Cash Equivalents as at the beginning of the year 29,515,600 55,416,486
Cash and Cash Equivalents as at the close of the year 63,059,955 29,515,600
Component of cash and cash equivalents
Balances with Banks in Current Account 63,059,955 29,515,600
Collateralised Borrowing and Lending Obligation (CBLO) - -
63,059,955 29,515,600
April 1, 2016 toMarch 31, 2017
Ground Floor, AML Centre-1, 8 Mahal Industrial Estate, Mahakali Caves Road, Andheri (E), Mumbai - 400 093.Email: [email protected] • Website: www.taurusmutualfund.com
Annexure - VI
ABRIDGED ANNUAL REPORT 2017 - 2018
20

The above cash flow statement has been prepared in accordance with the indirect method set out in Accounting Standard (AS-3) issued by the Institute of Chartered Accountants of India.
April 1, 2017 toMarch 31, 2018
TAURUS LIQUID FUND
A. Cashflow from operating activities
Net Surplus for the year including Unrealised Appreciation in value of Investments 226,090,884 600,924,341
Add / (Less): Change in Unrealised Appreciation in value of Investments - 9,310,093
Add / (Less): Change in Provision for depreciation in value of investments in securities - -
Add: Provision for doubtful receivables - 707,500,000
Adjustment on account of provision for payout to exited investors (195,962,872) (4,514,304.00)
Operating Profit Before Working Capital Changes 30,128,012 1,313,220,130
Adjustments for:-
(Increase)/Decrease in investments 39,966,827 11,288,849,495
(Increase)/Decrease in other current assets (1,015) 2,139,832,876
Increase/(Decrease) in current liabilities (6,276,948) (1,408,662,430)
(Increase)/Decrease in deposits 4,188,600 (4,567,240)
Net cash used in operations ( A ) 68,005,476 13,328,672,831
B Cashflow from financing activities
Increase/(Decrease) in unit capital (684,572,980) (7,608,701,084)
Increase/(Decrease) in Unit Application Pending Allotment 125,000 (2,325,000)
Increase/(Decrease) in unit premium reserve (96,306) (4,012,342)
Increase/(Decrease) in Income Equalisation Reserve (162,123,810) (4,822,987,019)
Adjustments for:-
Increase/(Decrease) in redemption payable for units redeemed by investors" (1,259) 5,001
(Increase)/Decrease in subscription receivable for units issued to investors" - -
Increase/(Decrease) in Outstanding and accrued income - -
Increase/(Decrease) in Dividend Receivable - -
Dividend paid (including tax thereon) (77,956) (114,631,386)
Net cash generated from financing activities ( B ) (846,747,311) (12,552,651,830)
Net Increase/(Decrease) in cash and cash equivalents (A+B) (778,741,835) 776,021,001
Cash and Cash Equivalents as at the beginning of the year 858,706,900 82,685,899
Cash and Cash Equivalents as at the close of the year 79,965,065 858,706,900
Component of cash and cash equivalents
Balances with Banks in Current Account 2,786,137 19,282,780
Collateralised Borrowing and Lending Obligation (CBLO) 77,178,928 839,424,120
79,965,065 858,706,900
April 1, 2016 toMarch 31, 2017
Ground Floor, AML Centre-1, 8 Mahal Industrial Estate, Mahakali Caves Road, Andheri (E), Mumbai - 400 093.Email: [email protected] • Website: www.taurusmutualfund.com
Annexure - VII
ABRIDGED ANNUAL REPORT 2017 - 2018
21

Key Statistics for the year / period ended March 31, 2018
Taurus Largecap Taurus Discovery Taurus Tax Shield Taurus Ethical Fund Taurus Taurus Nifty Taurus Starshare Taurus Banking & Equity Fund (Earlier (Mid Cap) Fund (Earlier Infrastructure Fund Index Fund (Multi Cap) Fund Financial Services Fund Known As Taurus Known As Taurus (Earlier Known As Bonanza Fund) Discovery Fund) Taurus Starshare Fund)
March 31, March 31, March 31, March 31, March 31, March 31, March 31, March 31, March 31, March 31, March 31, March 31, March 31, March 31, March 31, March 31, 2018 2017 2018 2017 2018 2017 2018 2017 2018 2017 2018 2017 2018 2017 2018 2017
1. NAV per unit (Rs.):
Open
Regular Plan Growth Option 67.45 56.33 37.00 27.93 62.36 49.62 42.07 37.07 21.22 16.07 16.9657 14.3956 101.42 83.07 19.40 14.90 Regular Plan Dividend Option 48.18 56.33 32.97 27.92 29.21 23.25 28.42 25.04 19.96 15.12 16.9657 14.3956 71.40 58.48 17.35 13.33 Regular Plan Bonus Option NA NA NA NA NA NA 42.06 37.07 NA NA NA NA NA NA NA NA Direct Plan Growth Option 69.85 57.78 37.80 28.39 64.39 50.77 43.43 37.91 21.93 16.45 17.6158 14.6936 104.77 85.10 20.22 15.36 Direct Plan Dividend Option 49.34 57.04 33.59 28.30 29.68 23.49 29.14 25.47 20.43 15.37 17.4058 14.6853 71.51 58.69 20.07 15.29 Direct Plan Bonus Option NA NA NA NA NA NA 14.24 12.45 NA NA NA NA NA NA NA NA
High
Regular Plan Growth Option 77.59 67.45 47.61 37.00 79.30 62.36 51.35 42.90 27.77 21.22 20.3796 16.9716 120.75 101.42 23.93 19.49 Regular Plan Dividend Option 51.93 66.90 42.44 35.67 37.15 29.21 34.69 28.98 26.11 19.96 20.3796 16.9716 78.09 71.40 21.42 17.44 Regular Plan Bonus Option NA NA NA NA NA NA 51.35 42.90 NA NA NA NA NA NA NA NA Direct Plan Growth Option 80.84 69.85 48.77 37.80 82.20 64.39 53.34 44.12 28.83 21.93 21.2488 17.6217 124.87 104.77 25.23 20.32 Direct Plan Dividend Option 53.30 67.78 43.34 36.22 37.88 29.68 35.79 29.61 26.85 20.43 20.9951 17.4116 78.30 71.51 24.93 20.17 Direct Plan Bonus Option NA NA NA NA NA NA 17.49 14.47 NA NA NA NA NA NA NA NA
Low
Regular Plan Growth Option 67.34 54.85 37.37 27.79 62.86 49.07 42.10 36.82 21.41 15.71 16.8204 14.0312 102.41 81.08 19.55 14.39 Regular Plan Dividend Option 29.94 47.66 33.31 26.95 29.45 22.99 28.44 24.87 20.14 14.78 11.7796 14.0312 67.19 57.08 17.49 12.88 Regular Plan Bonus Option NA NA NA NA NA NA 42.09 36.82 NA NA NA NA NA NA NA NA Direct Plan Growth Option 69.76 56.29 38.18 28.25 64.90 50.22 43.51 37.66 22.12 16.09 17.4695 14.3235 105.79 83.09 20.39 14.84 Direct Plan Dividend Option 31.44 48.65 33.93 27.44 29.91 23.24 29.20 25.30 20.60 15.03 17.2612 14.3152 67.40 57.28 20.23 14.77 Direct Plan Bonus Option NA NA NA NA NA NA 14.27 12.36 NA NA NA NA NA NA NA NA
End
Regular Plan Growth Option 69.42 67.45 44.56 37.00 74.61 62.36 48.21 42.07 25.23 21.22 18.8962 16.9657 109.96 101.42 21.58 19.40 Regular Plan Dividend Option 30.41 48.18 39.73 32.97 34.95 29.21 32.57 28.42 23.70 19.96 12.0455 16.9657 68.25 71.40 19.30 17.35 Regular Plan Bonus Option NA NA NA NA NA NA 48.20 42.06 NA NA NA NA NA NA NA NA Direct Plan Growth Option 72.41 69.85 45.68 37.80 77.41 64.39 50.14 43.43 26.23 21.93 19.7185 17.6158 113.74 104.77 22.79 20.22 Direct Plan Dividend Option 31.93 49.34 40.60 33.59 35.68 29.68 33.65 29.14 24.43 20.43 18.4606 17.4058 68.47 71.51 22.52 20.07 Direct Plan Bonus Option NA NA NA NA NA NA 16.44 14.24 NA NA NA NA NA NA NA NA
2. Closing Assets Under Management (Rs. in Lakhs)
End 3,677.07 8,029.96 5,043.96 4,089.48 5,084.60 5,319.13 2,704.88 2,967.87 517.95 518.89 1,695.84 37.71 21,172.21 20,467.78 555.10 631.68
Average (AAuM) 11,339.64 6,986.71 4,731.58 3,724.22 5,355.84 5,571.33 2,875.11 2,855.39 518.65 494.48 173.68 35.29 21,911.74 19,010.00 626.32 633.10
3. Gross income as % of AAuM1 18.66 20.57 44.24 19.22 45.23 16.79 26.98 9.56 37.59 18.43 21.74 31.45 35.77 9.96 27.10 17.02
4. Expense Ratio:
"a. Total Expense as % of AAuM ( Inclusive of Service Tax / GST)"
- Regular Plan 2.92 2.71 3.08 2.97 3.00 2.98 3.01 2.94 3.01 2.92 1.86 1.56 2.97 2.91 2.98 2.89
- Direct Plan 2.25 2.33 2.74 2.63 2.51 2.44 2.26 2.23 2.52 2.41 1.36 1.09 2.93 2.87 2.18 2.26
"b. Management Fee as % of AAuM 1.89 2.03 2.32 2.09 2.10 2.03 1.90 1.79 2.02 1.78 1.26 0.74 2.46 2.39 1.78 1.64 ( excluding Service Tax / GST)"
5. Net Income as a percentage of (4.91) 18.01 32.32 16.25 34.63 13.82 18.63 6.68 31.06 15.52 (4.18) 29.89 23.90 7.04 22.17 14.15 AAuM2
6. Portfolio turnover ratio3 7.01 2.51 4.35 2.24 3.38 0.98 1.66 1.37 2.06 1.53 7.42 1.15 3.16 0.95 1.07 0.67
7. Total Dividend per unit distributed during the year
- Regular Plan Dividend Option 20.35 38.00 - 7.00 - - - - - - 6.70 - 9.25 - - -
- Direct Plan Dividend Option 20.35 38.00 - 7.00 - - - - - - 1.00 - 9.25 - - -
8. Returns:
a. Last One Year Scheme
Regular Plan Growth Option (%) 2.94 19.74 20.49 32.47 19.68 25.68 14.62 13.49 18.94 32.05 11.40 17.85 8.44 22.09 11.29 30.20
Direct Plan Growth Option (%) 3.68 20.89 20.87 33.15 20.25 26.83 15.47 14.56 19.65 33.31 11.95 19.89 8.58 23.11 12.71 31.64
Benchmark 12.12 21.17 10.25 34.85 12.49 22.47 13.58 11.73 8.98 22.47 11.76 18.55 13.21 22.47 12.09 32.78
Additional Benchmark 11.76 18.55 11.76 18.55 11.76 18.55 11.76 18.55 11.76 18.55 11.76 18.55 11.76 18.55 11.76 18.55
b. Since Inception Scheme
Regular Plan Growth Option (%) 10.51 10.87 6.54 5.96 11.66 11.29 19.14 19.70 8.72 7.75 8.52 8.10 10.43 10.51 14.05 14.60
Direct Plan Growth Option (%) 9.74 11.20 19.83 19.55 14.16 12.74 15.61 15.61 14.65 13.48 11.35 11.19 11.60 12.30 10.07 9.44
Benchmark 11.67 10.91 10.63 9.52 13.11 12.35 17.15 15.90 2.57 10.40 10.07 8.53 NIL 9.37 18.68 18.54
Benchmark (Direct) 12.62 11.10 17.49 17.72 13.59 12.22 16.36 15.24 6.15 12.22 11.87 10.55 13.96 12.22 13.62 12.71
Additional Benchmark 11.71 10.47 10.11 8.84 12.48 11.20 14.81 13.84 11.15 9.79 10.07 8.53 10.13 8.90 14.81 13.95
Additional Benchmark (Direct) 11.87 10.55 12.02 10.73 12.02 10.73 12.02 10.73 12.02 10.73 11.87 10.55 12.02 10.73 11.87 10.55
Benchmark S&P BSE 100 Nifty Midcap S&P BSE 200 S&P BSE 500 Shariah Nifty Infrastructure Nifty 50 TRI S&P BSE 500 TRI S&P BSE Bankex TRI TRI TRI TRI Index TRI TRI
Additional Benchmark Nifty 50 TRI Nifty 50 TRI Nifty 50 TRI Nifty 50 TRI Nifty 50 TRI Nifty 50 TRI Nifty 50 TRI Nifty 50 TRI
Note : Bonus option under Regular and Direct Plan has been discontinued with effect from June 15, 2015 for further subscription.
1. Gross income = amount against (A) in the Revenue account i.e. Income.
2. Net Income = Amount Against (C) In The Revenue Account i.e. Net Realised Gains / (Losses) for the year.
3. Portfolio Turnover = Lower of sales or purchase divided by the Average AuM for the year.
4. AAuM=Average daily net assets
Ground Floor, AML Centre-1, 8 Mahal Industrial Estate, Mahakali Caves Road, Andheri (E), Mumbai - 400 093.Email: [email protected] • Website: www.taurusmutualfund.com
ABRIDGED ANNUAL REPORT 2017 - 2018
22

Key Statistics for the year / period ended (Cont...)
Taurus Short Term Taurus Dynamic Taurus Liquid Fund Taurus Ultra Short Income Fun Income Fund Term Bond Fund
March 31, 2018 March 31, 2017 March 31, 2018 March 31, 2017 March 31, 2018 March 31, 2017 March 31, 2018 March 31, 2017
1. NAV per unit (Rs.):
Open
Regular Plan Growth Option 2,528.3793 2,664.2451 13.7521 14.7928 NA - NA - Regular Plan Dividend Option 1,364.1815 1,530.6696 9.1315 10.3269 NA - NA - Direct Plan Growth Option 2,552.5658 2,681.7468 14.0959 15.0406 NA - NA - Direct Plan Dividend Option 1,364.4954 1,530.8600 9.1512 10.3313 NA - NA - Regular Plan Retail Growth Option NA - NA - 1,914.2920 1,930.8475 1,664.4947 1,759.1383 Regular Plan Retail Daily Dividend Reinvestment Option NA - NA - 934.0166 1,001.2177 888.8725 1,002.0134 Regular Plan Retail Weekly Dividend Reinvestment Option NA - NA - NA - 889.4180 1,003.7084 Regular Plan Institutional Growth Option NA - NA - NA - 888.9672 1,002.0132 Regular Plan Institutional Daily Dividend Reinvestment Option NA - NA - 1,654.1521 1,664.5191 NA - Regular Plan Super Institutional Daily Dividend NA - NA - 933.7506 1,000.7253 888.5400 1,002.0133 Reinvestment Option Regular Plan Super Institutional Growth Option NA - NA - 1,630.4235 1,639.3820 1,731.1087 1,832.2004 Regular Plan Super Institutional Weekly Dividend NA - NA - 934.1068 1,001.5780 889.4138 1,004.1426 Reinvestment Option Direct Plan Super Institutional Growth Option NA - NA - 1,634.7675 1,642.4345 1,752.4512 1,842.7614 Direct Plan Super Institutional Daily Dividend NA - NA - 933.8283 1,000.7254 889.1573 1,002.0133 Reinvestment Option Direct Plan Super Institutional Weekly Dividend NA - NA - 934.6114 1,001.5860 890.0905 1,004.1632 Reinvestment Option Unclaimed Redemption and Dividend Option NA - NA - - - NA -
High
Regular Plan Growth Option 2,758.9698 2,833.9658 14.9599 15.6703 NA NA NA NA Regular Plan Dividend Option 1,488.6104 1,537.2898 9.9335 10.4970 NA NA NA NA Direct Plan Growth Option 2,790.1702 2,860.2606 15.4472 16.0446 NA NA NA NA Direct Plan Dividend Option 1,491.5091 1,537.7617 10.0280 10.5204 NA NA NA NA Regular Plan Retail Growth Option NA NA NA NA 2,062.7934 2,052.0295 1,818.8760 1,876.3615 Regular Plan Retail Daily Dividend Reinvestment Option NA NA NA NA 1,001.2228 1,001.4164 971.3150 1,002.4021 Regular Plan Retail Weekly Dividend Reinvestment Option NA NA NA NA NA NA 971.9757 1,003.5055 Regular Plan Institutional Growth Option NA NA NA NA NA NA 895.2542 1,002.4074 Regular Plan Institutional Daily Dividend NA NA NA NA 1,741.4606 1,772.9872 NA NA Reinvestment Option Regular Plan Super Institutional Daily Dividend NA NA NA NA 1,000.7587 1,000.9792 967.6264 1,002.3828 Reinvestment Option Regular Plan Super Institutional Growth Option NA NA NA NA 1,759.5355 1,747.4266 1,884.9630 1,952.1844 Regular Plan Super Institutional Weekly Dividend NA NA NA NA 1,001.7272 1,002.3294 968.5895 1,003.8371 Reinvestment Option Direct Plan Super Institutional Growth Option NA NA NA NA 1,765.9629 1,751.9362 1,920.6111 1,974.8804 Direct Plan Super Institutional Daily Dividend NA NA NA NA 1,000.7587 1,000.9814 974.4795 1,002.4185 Reinvestment Option Direct Plan Super Institutional Weekly Dividend NA NA NA NA 1,002.2203 1,002.3443 975.5921 1,003.9455 Reinvestment Option Unclaimed Redemption and Dividend Option NA NA NA NA NA 1,042.1976 NA NA
Low
Regular Plan Growth Option 2,529.5007 2,513.8777 13.7576 13.6608 NA NA NA NA Regular Plan Dividend Option 1,364.7865 1,356.3571 9.1351 9.0708 NA NA NA NA Direct Plan Growth Option 2,553.7399 2,537.4111 14.1024 13.9916 NA NA NA NA Direct Plan Dividend Option 1,365.1230 1,356.3943 9.1554 9.0835 NA NA NA NA Regular Plan Retail Growth Option NA NA NA NA 1,914.8490 1,903.9316 1,665.2196 1,655.2616 Regular Plan Retail Daily Dividend Reinvestment Option NA NA NA NA 934.2883 928.9616 889.2596 883.9418 Regular Plan Retail Weekly Dividend Reinvestment Option NA NA NA NA NA NA 889.8054 884.4924 Regular Plan Institutional Growth Option NA NA NA NA NA NA 889.3617 883.9465 Regular Plan Institutional Daily Dividend NA NA NA NA 1,654.6425 1,645.0328 NA NA Reinvestment Option Regular Plan Super Institutional Daily Dividend NA NA NA NA 934.0309 928.5369 888.9014 883.9248 Reinvestment Option Regular Plan Super Institutional Growth Option NA NA NA NA 1,630.9131 1,621.3199 1,731.8128 1,722.1170 Regular Plan Super Institutional Weekly Dividend NA NA NA NA 934.3874 928.8734 889.7755 884.7940 Reinvestment Option Direct Plan Super Institutional Growth Option NA NA NA NA 1,635.2655 1,625.5077 1,753.2577 1,742.2003 Direct Plan Super Institutional Daily Dividend NA NA NA NA 934.1128 928.5389 889.5665 883.9562 Reinvestment Option Direct Plan Super Institutional Weekly Dividend NA NA NA NA 934.8960 929.3158 890.4999 884.8822 Reinvestment Option Unclaimed Redemption and Dividend Option NA NA NA NA NA 1,000.0000 NA NA
End
Regular Plan Growth Option 2,760.3869 2,528.3793 14.9670 13.7521 NA - NA - Regular Plan Dividend Option 1,489.3750 1,364.1815 9.9382 9.1315 NA - NA - Direct Plan Growth Option 2,791.6378 2,552.5658 15.4554 14.0959 NA - NA - Direct Plan Dividend Option 1,492.2936 1,364.4954 10.0334 9.1512 NA - NA - Regular Plan Retail Growth Option NA - NA - 2,062.7934 1,914.2920 1,819.8306 1,664.4947 Regular Plan Retail Daily Dividend Reinvestment Option NA - NA - 1,001.2228 934.0166 971.8248 888.8725 Regular Plan Retail Weekly Dividend Reinvestment Option NA - NA - NA - 972.4854 889.4180 Regular Plan Institutional Growth Option NA - NA - NA - NA 888.9672 Regular Plan Institutional Daily Dividend NA - NA - NA 1,654.1521 NA - Reinvestment Option Regular Plan Super Institutional Daily Dividend NA - NA - 1,000.7587 933.7506 968.1064 888.5400 Reinvestment Option Regular Plan Super Institutional Growth Option NA - NA - 1,759.5355 1,630.4235 1,885.8980 1,731.1087 Regular Plan Super Institutional Weekly Dividend NA - NA - 1,001.7272 934.1068 969.0697 889.4138 Reinvestment Option Direct Plan Super Institutional Growth Option NA - NA - 1,765.9629 1,634.7675 1,921.6664 1,752.4512 Direct Plan Super Institutional Daily Dividend NA - NA - 1,000.7587 933.8283 975.0150 889.1573 Reinvestment Option Direct Plan Super Institutional Weekly Dividend NA - NA - 1,002.2203 934.6114 976.1289 890.0905 Reinvestment Option Unclaimed Redemption and Dividend Option NA - NA - NA - NA -
Ground Floor, AML Centre-1, 8 Mahal Industrial Estate, Mahakali Caves Road, Andheri (E), Mumbai - 400 093.Email: [email protected] • Website: www.taurusmutualfund.com
ABRIDGED ANNUAL REPORT 2017 - 2018
23

Key Statistics for the year / period ended (Cont...)
Ground Floor, AML Centre-1, 8 Mahal Industrial Estate, Mahakali Caves Road, Andheri (E), Mumbai - 400 093.Email: [email protected] • Website: www.taurusmutualfund.com
2. Closing Assets Under Management (Rs. in Lakhs)
End 2,066.20 5,469.81 295.47 4,913.42 797.57 8,960.21 1,155.47 3,049.35 Average (AAuM) 3,058.00 14,694.06 822.37 3,533.68 3,495.99 181,637.37 1,670.44 13,391.36
3. Gross income as % of AAuM1 18.18 7.86 32.04 5.47 64.85 7.50 31.57 8.18
4. Expense Ratio: a. Total Expense as % of AAuM ( Inclusive of Service tax / GST) - Regular Plan 0.32 0.78 0.82 1.23 - - - - - Direct Plan 0.22 0.62 0.23 0.49 - - - - - Regular Retail Plan - - - - 0.39 0.68 0.46 0.94 - Regular Institutional Plan - - - - 0.25 0.36 0.30 0.70 - Regular Super Institutional Plan - - - - 0.20 0.30 0.80 1.03 - Direct Plan Super Institutional - - - - 0.13 0.22 0.15 0.38 b. Management Fee as % of AAuM ( excluding Service tax / GST) - Regular Plan 0.15 0.46 0.12 0.38 - - - - - Direct Plan 0.15 0.46 0.12 0.38 - - - - - Regular Retail Plan - - - - 0.05 0.14 0.16 0.35 - Regular Institutional Plan - - - - 0.05 0.14 0.16 0.35 - Regular Super Institutional Plan - - - - 0.05 0.14 0.16 0.35 - Direct Plan Super Institutional - - - - 0.05 0.14 0.16 0.35
5. Net Income as a percentage of AAuM2 17.89 (1.85) 31.57 (16.51) 64.67 3.36 31.19 (3.58)
6. Portfolio turnover ratio4 - - - - - - - -
7. Total Dividend per unit distributed during the year
Regular Plan Dividend Option - 133.794918 - 0.723932 - - - - Direct Plan Dividend Option - 139.957865 - 0.821529 - - - - Regular Plan Retail Daily Dividend Option - - - - 3.782319 84.788059 - 89.963386 Regular Plan Retail Weekly Dividend Option - - - - - - - 91.362831 Regular Plan Institutional Daily Dividend Option - - - - - - - 92.319788 Regular Plan Institutional Weekly Dividend Option - - - - - - - - Regular Plan Super Institutional Daily Dividend Option - - - - 4.987137 88.841896 - 88.458407 Regular Plan Super Institutional Weekly Dividend Option - - - - 4.568299 89.515159 - 90.128937 Direct Plan Super Institutional Daily Dividend Option - - - - 5.763773 89.840047 - 96.371300 Direct Plan Super Institutional Weekly Dividend Option - - - - 5.395905 89.939499 - 98.051720
8. Returns:
a. Last One Year Scheme Regular Plan Growth Option(%) 9.12 (5.10) 8.78 (7.04) - - - Direct Plan Growth Option(%) 9.31 (4.82) 9.59 (6.28) - - - Regular Plan Retail Growth Option(%) - - - - 7.76 (0.86) 9.27 (5.38) Regular Plan Institutional Growth Option(%) - - - - (0.62) - - Regular Plan Super Institutional Growth Option(%) - - - - 7.92 (0.55) 8.89 (5.52) Direct Plan Super Institutional Growth Option(%) - - - - 8.03 (0.47) 9.60 (4.90) Benchmark Regular Plan Growth Option 6.11 9.10 5.06 11.09 - - - - Benchmark Direct Plan Growth Option 6.11 9.10 5.06 11.09 - - - - Benchmark Regular Plan Retail Growth Option - - - - 6.84 7.11 6.79 7.11 Benchmark Regular Plan Institutional Growth Option - - - - 7.11 - Benchmark Regular Plan Super Institutional Growth Option - - - - 6.84 7.11 6.79 7.11 Benchmark Direct Plan Super Institutional Growth Option - - - - 6.84 7.11 6.79 7.11 Additional Benchmark Regular Plan Growth Option 5.87 7.15 (0.42) 11.87 - - - - Additional Benchmark Direct Plan Growth Option 5.87 7.15 (0.42) 11.87 - - - - Additional Benchmark Regular Plan Retail Growth Option - - - - 5.92 7.15 5.87 7.15 Additional Benchmark Regular Plan Institutional - - - - - 7.15 - - Growth Option Additional Benchmark Regular Plan Super Institutional - - - - 5.92 7.15 5.87 7.15 Growth Option Additional Benchmark Direct Plan Super Institutional - - - - 5.92 7.15 5.87 7.15 Growth Option
b. Since Inception Scheme Regular Plan Growth Option(%) 6.30 6.11 5.82 5.33 - - - - Direct Plan Growth Option(%) 6.73 6.12 4.79 3.68 - - - - Regular Plan Retail Growth Option(%) - - - - 6.45 6.32 6.62 6.30 Regular Plan Institutional Growth Option(%) - - - - 6.09 - - Regular Plan Super Institutional Growth Option(%) - - - - 6.12 5.91 7.03 6.80 Direct Plan Super Institutional Growth Option(%) - - - - 6.98 6.74 6.75 6.08 Benchmark Regular Plan Growth Option 6.95 7.00 8.60 9.17 - - - - Benchmark Direct Plan Growth Option 8.55 9.12 8.52 9.34 - - - - Benchmark Regular Plan Retail Growth Option - - - - 7.51 7.57 7.49 7.57 Benchmark Regular Plan Institutional Growth Option - - - - 7.63 - - Benchmark Regular Plan Super Institutional Growth Option - - - - 7.54 7.63 7.49 7.57 Benchmark Direct Plan Super Institutional Growth Option - - - - 8.08 8.38 8.09 8.38
Additional Benchmark Regular Plan Growth Option 6.09 6.10 6.67 7.86 - - - - Additional Benchmark Direct Plan Growth Option 7.13 7.42 6.47 8.15 - - - - Additional Benchmark Regular Plan Retail Growth Option - - - - 6.32 6.36 6.42 6.48 Additional Benchmark Regular Plan Institutional - - - - 6.66 - - Growth Option Additional Benchmark Regular Plan Super Institutional - - - - 6.58 6.66 6.42 6.48 Growth Option Additional Benchmark Direct Plan Super Institutional - - - - 7.13 7.42 7.13 7.42 Growth Option
Benchmark CRISIL Short Term Bond CRISIL Composite CRISIL Liquid Fund Index CRISIL Liquid Fund Index Fund Index Bond Fund Index Additional Benchmark CRISIL 1 Year T-Bill Index CRISIL 10 year Gilt Index CRISIL 1 Year T-Bill Index CRISIL 1 Year T-Bill Index
Note : Regular Plan Retail & Regular Plan Institutional under both Taurus Liquid Fund and Taurus Ultra Short Term Bond Fund were discontinued with effect from October 01, 2012 for further subscription.
1. Gross income = amount against (A) in the Revenue account i.e. Income.
2. Net income = amount against (C) in the Revenue account i.e. NET REALISED GAINS / (LOSSES) FOR THE YEAR / PERIOD
3. Portfolio Turnover = Lower of sales or purchase divided by the Average AuM for the year/period.
4. AAuM=Average daily net assets
ABRIDGED ANNUAL REPORT 2017 - 2018
Taurus Short Term Taurus Dynamic Taurus Liquid Fund Taurus Ultra Short Income Fun Income Fund Term Bond Fund
March 31, 2018 March 31, 2017 March 31, 2018 March 31, 2017 March 31, 2018 March 31, 2017 March 31, 2018 March 31, 2017
24

THIS PAG
E IS IN
TENTIO
NAL
LY LEF
T BL
ANK

TAURUS ASSET MANAGEMENT COMPANY LIMITED CIN: U67190MH1993PLC073154
Head Office & Regd Offcie : Ground Floor, Centre-1, Mahal Industrial Estate, Mahakali Caves Road, Andheri East, Mumbai - 400 093. Tel.: +91 22 66242700 (Board) Fax: +91 22 6624 2777
Email: [email protected] Website: www.taurusmutualfund.com
If undelivered, please return to:
Mutual Fund investments are subject to market risks, read allscheme information documents carefully.
Book Post
The Abridged Annual Report has been extracted from the Audited Balance Sheet, Revenue Account and Notes to Accounts, Full Annual Report is available on the website www.taurusmutualfund.com. Unitholders may refer to the full Annual Report displayed on the website w.r.t. general policies and procedures for exercising voting rights and the details of proxy votings exercised during the Financial Year 2017-2018. For Unitholders of the Scheme, full Annual Report is available for inspection at the Corporate Office/Central Service Office of the AMC and a copy thereof shall be made available to the Unitholder on request.