Tau Introduction
38
Tau Introduction Lars Koesterke (& Kent Milfeld, Sameer Shende) Cornell University Ithaca, NY March 13, 2009
Transcript of Tau Introduction

TauIntroduction
Lars Koesterke(& Kent Milfeld, Sameer Shende)
Cornell UniversityIthaca, NY
March 13, 2009

Outline• General
– Measurements– Instrumentation & Control– Example: matmult
• Profiling and Tracing– Event Tracing– Steps for Performance Evaluation– Tau Architecture
• A look at a task-parallel MxM Implementation• Paraprof Interface
2
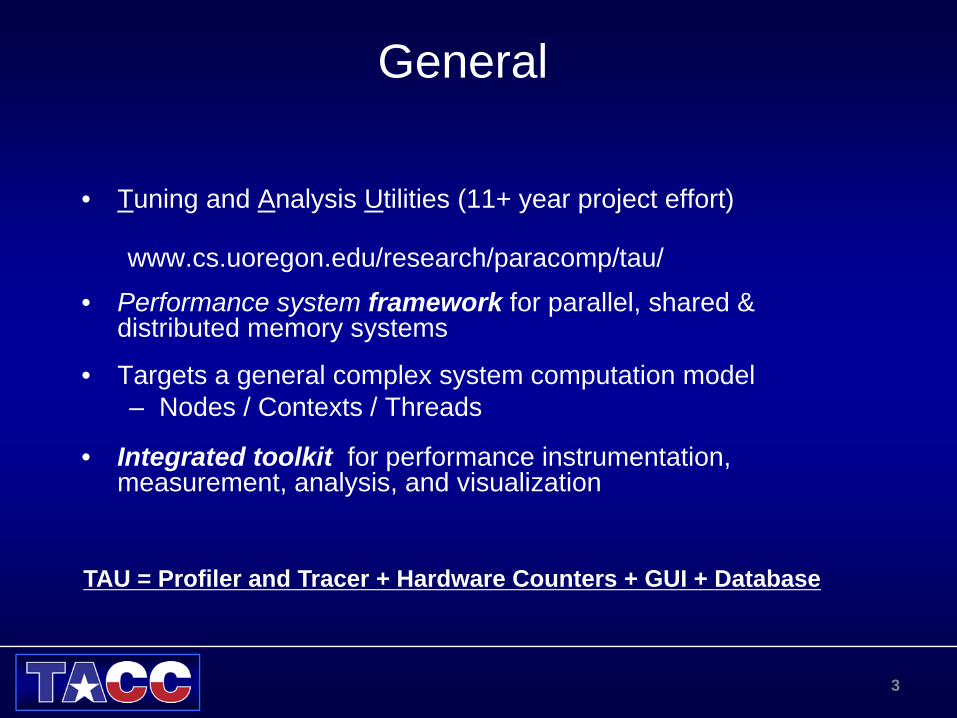
General
• Tuning and Analysis Utilities (11+ year project effort)
www.cs.uoregon.edu/research/paracomp/tau/
• Performance system framework for parallel, shared & distributed memory systems
• Targets a general complex system computation model– Nodes / Contexts / Threads
• Integrated toolkit for performance instrumentation, measurement, analysis, and visualization
TAU = Profiler and Tracer + Hardware Counters + GUI + Database
3

Tau: Measurements• Parallel profiling
– Function-level, block (loop)-level, statement-level– Supports user-defined events– TAU parallel profile data stored during execution– Hardware counter values– Support for multiple counters– Support for callgraph and callpath profiling
• Tracing– All profile-level events– Inter-process communication events– Trace merging and format conversion
4

PDT is used to instrument your code.
Replace mpicc and mpif90 in make files with tau_f90.sh and tau_cc.sh
It is necessary to specify all the components that will be used in the instrumentation (mpi, openmp, profiling, counters [PAPI], etc. However, these come in a limited number of combinations.)
Combinations: First determine what you want to do (profiling, PAPI counters, tracing, etc.) and the programming paradigm (mpi, openmp), and the compiler. PDT is a required component:
Tau: Instrumentation
PAPICallpath…
MPIOMP…
intelpgignu
PDTHand-code
Collectors Compiler:ParallelParadigmInstrumentation
5
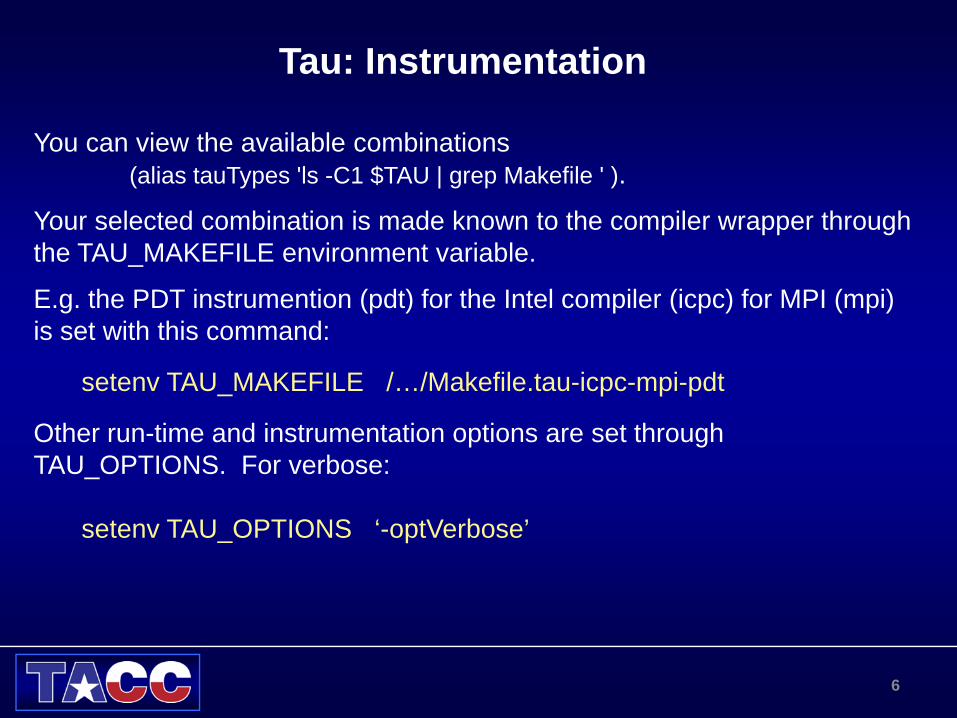
You can view the available combinations(alias tauTypes 'ls -C1 $TAU | grep Makefile ' ).
Your selected combination is made known to the compiler wrapper through the TAU_MAKEFILE environment variable.
E.g. the PDT instrumention (pdt) for the Intel compiler (icpc) for MPI (mpi) is set with this command:
setenv TAU_MAKEFILE /…/Makefile.tau-icpc-mpi-pdt
Other run-time and instrumentation options are set through TAU_OPTIONS. For verbose:
setenv TAU_OPTIONS ‘-optVerbose’
Tau: Instrumentation
6

% tar –xvf ~train00/tau.tar
% cd tau READ the Instructions file
% source sourceme.csh or% source sourceme.sh create env. (modules and TAU_MAKEFILE)
% make matmultf create executable(s)or% make matmultc
% qsub job submit job (edit and uncomment ibrun line)
% paraprof (for GUI) Analyze performance data:
Tau Example
7
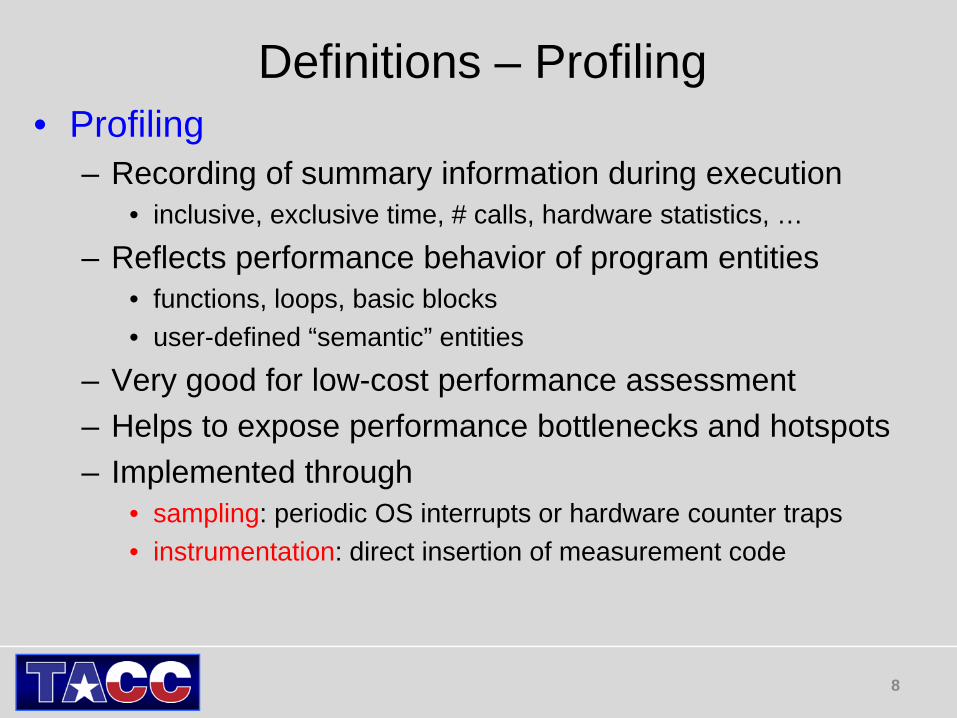
Definitions – Profiling• Profiling
– Recording of summary information during execution• inclusive, exclusive time, # calls, hardware statistics, …
– Reflects performance behavior of program entities• functions, loops, basic blocks• user-defined “semantic” entities
– Very good for low-cost performance assessment– Helps to expose performance bottlenecks and hotspots– Implemented through
• sampling: periodic OS interrupts or hardware counter traps• instrumentation: direct insertion of measurement code
8

Definitions – Tracing
TracingRecording of information about significant points (events) during program execution
entering/exiting code region (function, loop, block, …)thread/process interactions (e.g., send/receive message)
Save information in event recordtimestampCPU identifier, thread identifierEvent type and event-specific information
Event trace is a time-sequenced stream of event recordsCan be used to reconstruct dynamic program behaviorTypically requires code instrumentation
9

Event Tracing: Instrumentation, Monitor, Trace
1 master
2 worker
3 ...
void worker {trace(ENTER, 2);
...recv(A, tag, buf);trace(RECV, A);
...trace(EXIT, 2);
}
void master {trace(ENTER, 1);
...trace(SEND, B);
send(B, tag, buf);...
trace(EXIT, 1);}
MONITOR 58 A ENTER 1
60 B ENTER 2
62 A SEND B
64 A EXIT 1
68 B RECV A
...
69 B EXIT 2
...
CPU A:
CPU B:
Event definition
timestamp
10

Event Tracing: “Timeline” Visualization
1 master2 worker3 ...
58 A ENTER 160 B ENTER 262 A SEND B64 A EXIT 168 B RECV A
...
69 B EXIT 2
...
mainmasterworker
58 60 62 64 66 68 70
B
A
11

Steps of Performance Evaluation
Collect basic routine-level timing profile to determine where most time is being spentCollect routine-level hardware counter data to determine types of performance problemsCollect callpath profiles to determine sequence of events causing performance problemsConduct finer-grained profiling and/or tracing to pinpoint performance bottlenecks
Loop-level profiling with hardware countersTracing of communication operations
12

TAU Performance System Architecture
13
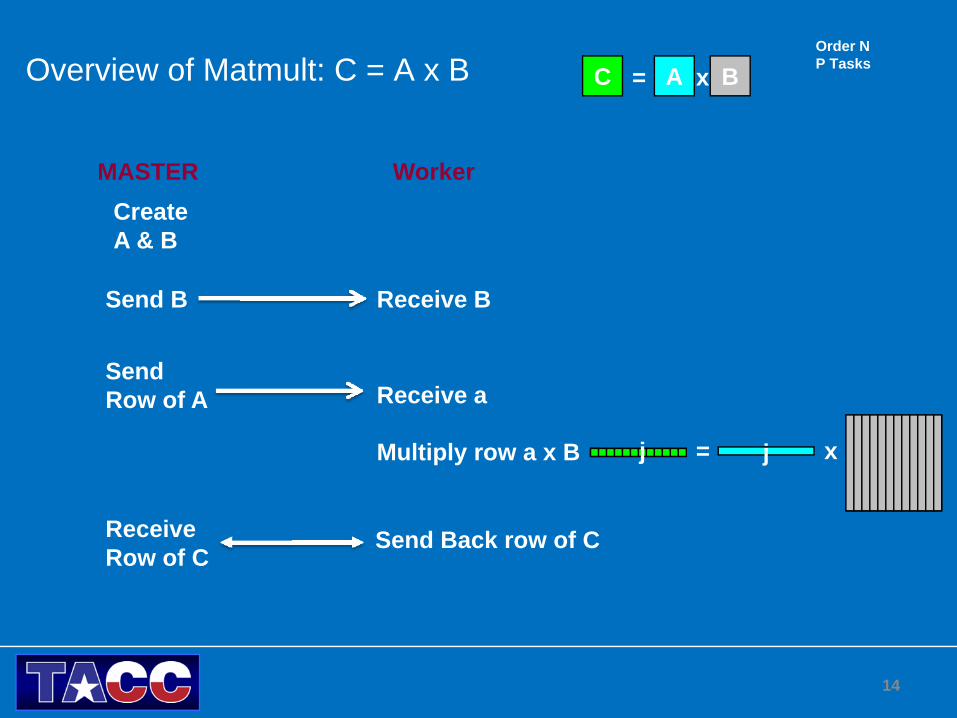
Overview of Matmult: C = A x B
CreateA & B
A BC = xOrder NP Tasks
MASTER Worker
Receive B
SendRow of A
Multiply row a x B
Send Back row of C
Receive a
ReceiveRow of C
Send B
jj x=
14

Preparation of Matmult: C = A x B
PE 0
CreateA
CreateB
GenerateA & B
BroadcastB to Allby columns
PE 0 PE x
MPI_Bcast( b(1,i)…
loop over i (i=1 n)
PE 0
A BC = xOrder NP Tasks
MASTER
15
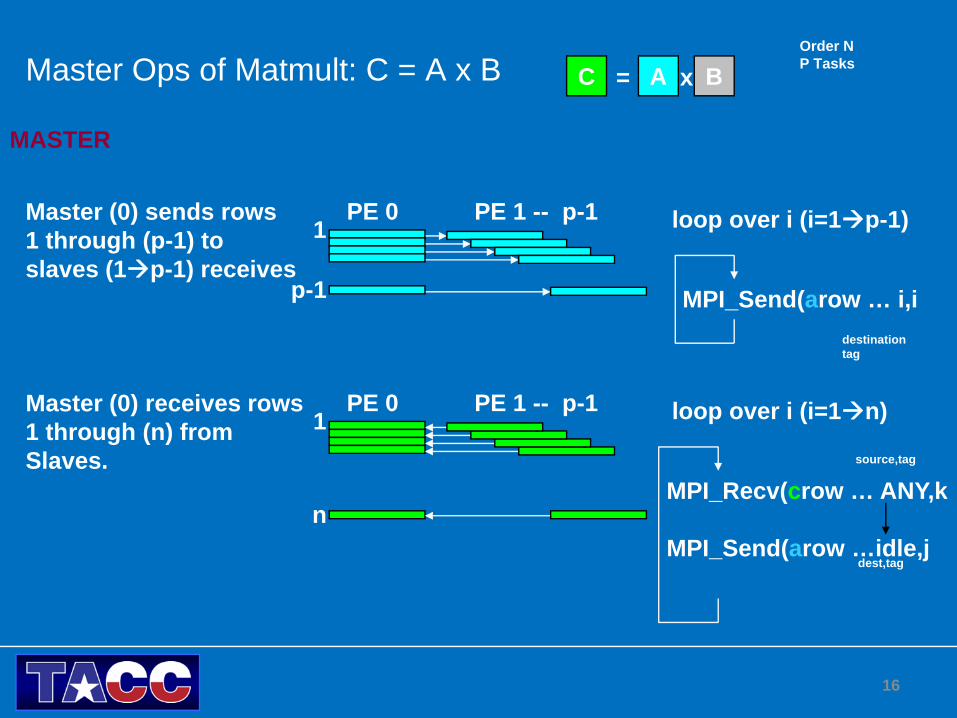
Master Ops of Matmult: C = A x B
Master (0) sends rows 1 through (p-1) toslaves (1 p-1) receives
1
p-1
PE 0 PE 1 -- p-1
MPI_Send(arow … i,i
loop over i (i=1 p-1)
destinationtag
Master (0) receives rows 1 through (n) fromSlaves.
1
n
PE 0 PE 1 -- p-1
MPI_Recv(crow … ANY,k
loop over i (i=1 n)
source,tag
MPI_Send(arow …idle,jdest,tag
A BC = xOrder NP Tasks
MASTER
16

Master Ops of Matmult: C = A x B
Slave(any) sends row j of C to master, PE 0
PE 0MPI_Send( crow … j
jrow j
Slaves multiply all Columns of B into A (row i) to form row i of Matrix C
x=
Pick up broadcast of B columns from PE 0
MPI_Recv( arow …ANY,j
loop over i (i=1 n)
Matrix * Vector
row j
A BC = xOrder NP Tasks
Worker
Slave receives anyA row from PE 0 j
j
17

Paraprof and Pprof
• Execute application and analyze performance data:• % qsub job
– Look for files: profile.<task_no>.– With Multiple counters, look for directories for each
counter.• % pprof (for text based profile display)• % paraprof (for GUI)
– pprof and paraprof will discover files/directories.– paraprof runs on PCs,Files/Directories can be downloaded
to laptop and analyzed there.
18
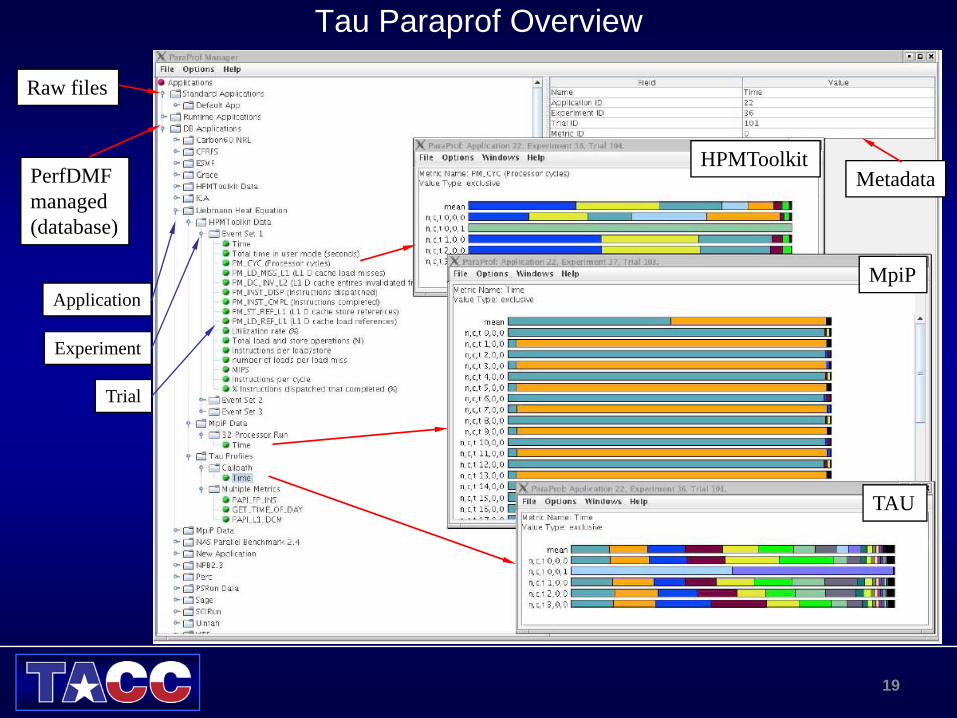
Tau Paraprof Overview
HPMToolkit
MpiP
TAU
Raw files
PerfDMFmanaged(database)
Metadata
Application
Experiment
Trial
19

Tau Paraprof Manager WindowProvides Machine DetailsOrganizes Runs as: Applications, Experiments and Trials.
20
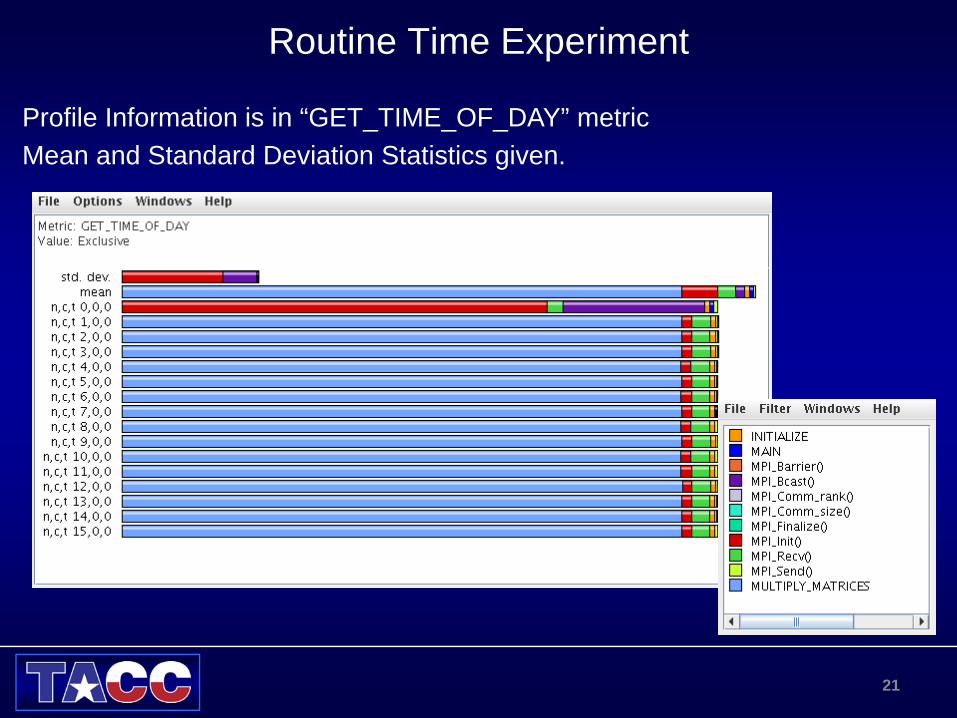
Routine Time Experiment
Profile Information is in “GET_TIME_OF_DAY” metricMean and Standard Deviation Statistics given.
21
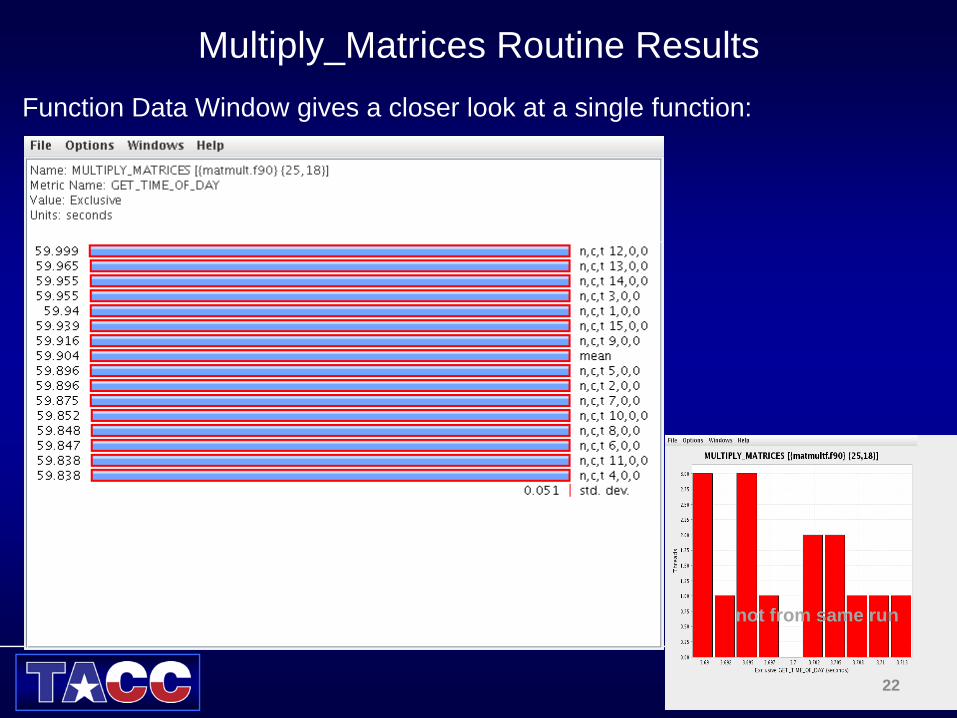
Multiply_Matrices Routine Results
not from same run
Function Data Window gives a closer look at a single function:
22

Float Point OPS trial
Hardware Counters provide Floating Point Operations (Function Data view).
23
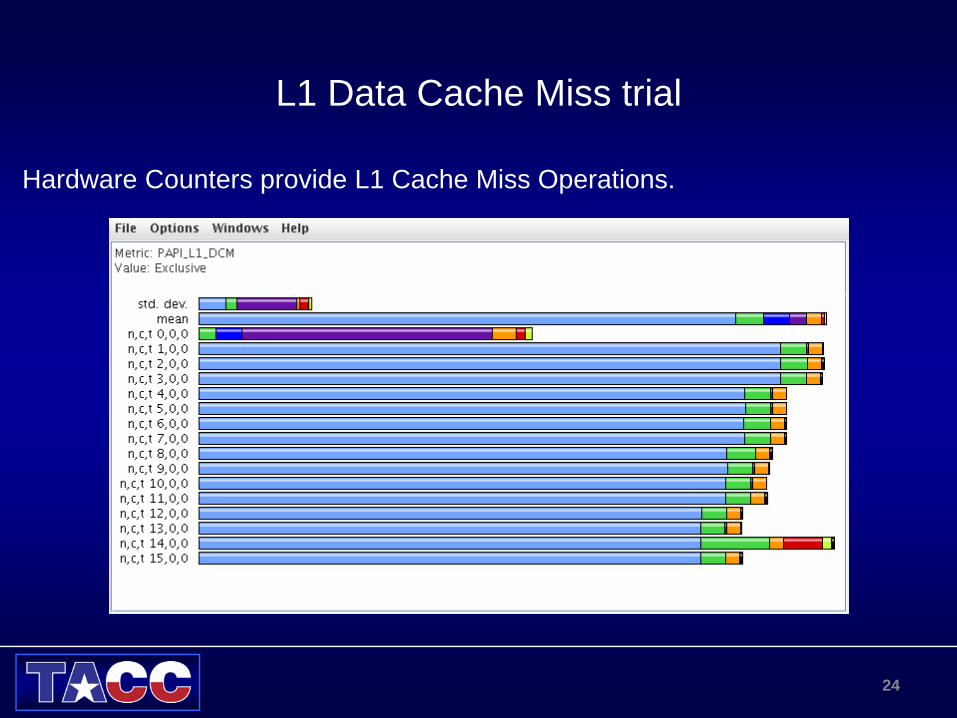
L1 Data Cache Miss trial
Hardware Counters provide L1 Cache Miss Operations.
24

Call Path
Call Graph Paths (Must select through “thread” menu.)
25

Call PathTAU_MAKEFILE = …Makefile.tau-callpath-icpc-mpi-pdt
26

Derived MetricsSelect Argument 1 (green ball); Select Argument 2 (green ball);Select Operation; then Apply. Derived Metric will appear as a new trial.
27

DerivedMetrics
Be careful even thoughratios are constant, coresmay do different amountsof work/operations per call.
Since FP/Missratios are constant– mustbe memoryaccess problem.
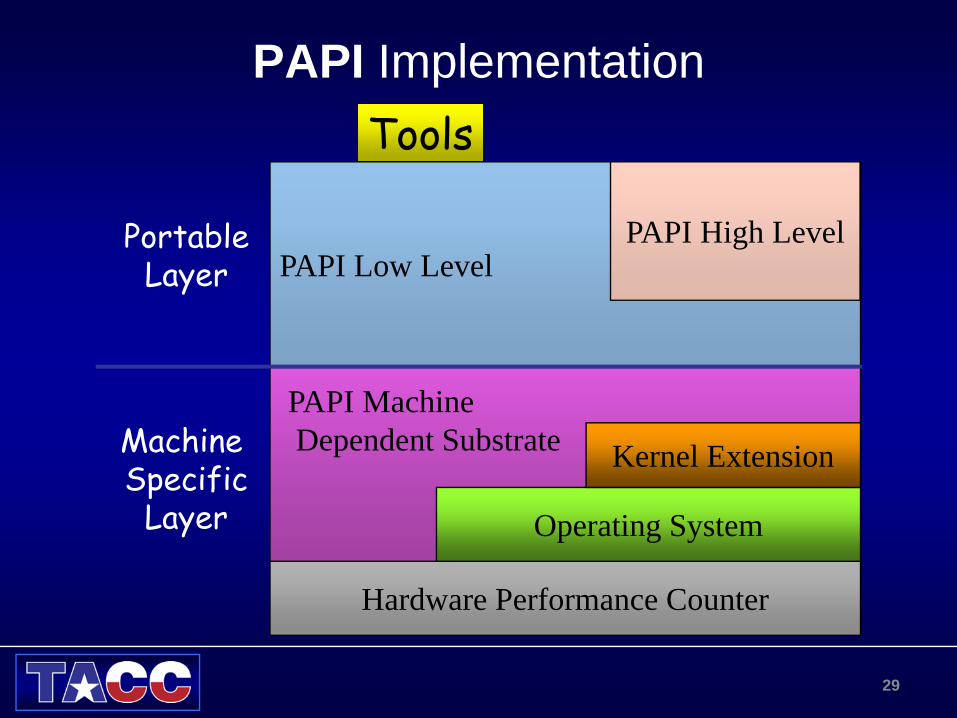
PAPI ImplementationTools
PAPI Low LevelPAPI High Level
Hardware Performance Counter
Operating System
Kernel Extension
PAPI MachineDependent SubstrateMachine
SpecificLayer
PortableLayer
29

PAPI Performance Monitor
• Provides high level counters for events:– Floating point instructions/operations, – Total instructions and cycles– Cache accesses and misses– Translation Lookaside Buffer (TLB) counts– Branch instructions taken, predicted, mispredicted
• PAPI_flops routine for basic performance analysis– Wall and processor times– Total floating point operations and MFLOPS
http://icl.cs.utk.edu/projects/papi
• Low level functions are thread-safe, high level are not
30
PAPI Preset Events
• Proposed standard set of events deemed most relevant for application performance tuning
• Defined in papiStdEventDefs.h• Mapped to native events on a given platform
– Run tests/avail to see list of PAPI preset events available on a platform

High-level Interface
• Meant for application programmers wanting coarse-grained measurements
• Not thread safe• Calls the lower level API• Allows only PAPI preset events• Easier to use and less setup (additional code)
than low-level
32

High-level API
• C interfacePAPI_start_countersPAPI_read_countersPAPI_stop_countersPAPI_accum_countersPAPI_num_countersPAPI_flips PAPI_ipc
• Fortran interfacePAPIF_start_countersPAPIF_read_countersPAPIF_stop_countersPAPIF_accum_countersPAPIF_num_countersPAPIF_flips PAPIF_ipc
33
Low-level Interface
• Increased efficiency and functionality over the high level PAPI interface
• About 40 functions• Obtain information about the executable and
the hardware• Thread-safe• Fully programmable• Callbacks on counter overflow
34
PAPI counters in Tau• Instead of one metric, profile or trace with more than one metric• Set environment variables COUNTER[1-25] to specify the metric
% setenv COUNTER1 GET_TIME_OF_DAY% setenv COUNTER2 PAPI_L2_DCM% setenv COUNTER3 PAPI_FP_OPS% setenv COUNTER4 PAPI_NATIVE_<native_event>
• % setenv COUNTER5 P_WALL_CLOCK_TIME …• When used with –TRACE option, the first counter must be GET_TIME_OF_DAY
% setenv COUNTER1 GET_TIME_OF_DAYProvides a globally synchronized real time clock for tracing
• -multiplecounters appears in the name of the stub Makefile• Often used with –papi=<dir> to measure hardware performance counters and time• papi_native_avail and papi_avail are two useful tools.
35

Important Environment Variables• Choose the measurement option and compile your code:• setenv TAU_MAKEFILE $TAU/Makefile.tau-icpc-mpi-pdt• setenv TAU_OPTIONS ‘-optVerbose -optKeepFiles -optPreProcess’• setenv TAU_THROTTLE 1 At runtime to keep instrumentation overhead in check
36

Fortran TAU Tips• If your Fortran code uses free format in .f files (fixed is default for .f), you may use:• % setenv TAU_OPTIONS ‘-optPdtF95Opts=“-R free” -optVerbose ’
• If it uses several module files, you may switch from the default Cleanscape Inc. parser in PDT to the GNU gfortran parser to generate PDB files:% setenv TAU_OPTIONS ‘-optPdtGnuFortranParser -optVerbose’
• If your Fortran code uses C preprocessor directives (#include, #ifdef, #endif):% setenv TAU_OPTIONS ‘-optPreProcess -optVerbose -optDetectMemoryLeaks’
• To use an instrumentation specification file:% setenv TAU_OPTIONS ‘-optTauSelectFile=mycmd.tau -optVerbose -optPreProcess’% cat mycmd.tau
BEGIN_INSTRUMENT_SECTIONmemory file=“foo.f90” routine=“#”# instruments all allocate/deallocate statements in all routines in foo.f90loops file=“*” routine=“#”io file=“abc.f90” routine=“FOO”END_INSTRUMENT_SECTION
37

References• Performance Research Laboratory, University of Oregon,
Eugene, [email protected]• http://www.cs.uoregon.edu/research/tau/about.php
38