TATA MOTORS LIMITED BUY - Myirisbreport.myiris.com/firstcall/TATENGLC_20140211.pdfRecommend BUY CMP...
15
Recommend BUY CMP 373.00 Target Price 410.00 ISIN: INE155A01022 FEBRUARY 11 th , 2014 TATA MOTORS LIMITED Result Update: Q3 FY14 STOCK DETAILS Sector Automobile BSE Code 500570 Face Value 2.00 52wk. High / Low (Rs.) 405.00/252.10 Volume (2wk. Avg ) 817000 Market Cap ( Rs in mn ) 1200649.70 Annual Estimated Results (A*: Actual / E*: Estimated) Years FY13A FY14E FY15E Net Sales 1888176.30 2390858.20 2725578.34 EBITDA 253588.30 358978.64 380979.42 Net Profit 98926.10 147253.06 165403.51 EPS 31.01 45.75 51.39 P/E 12.03 8.15 7.26 Shareholding Pattern (%) 1 Year Comparative Graph TATA MOTORS LTD BSE SENSEX SYNOPSIS Tata Motors is India's largest automobile company, with consolidated revenues of Rs. 188818 crores ($ 34.7 billion) in 2012-13. During the quarter, consolidated revenues of Rs. 638768.30 millions, a growth of 38.59% over Rs. 460895.00 millions in Q3 FY13. The company’s net profit jumps to Rs. 48048.00 million against Rs. 16275.00 million in Q3 FY13, an increase of 195.23%. During the quarter, JLR has reported revenues of GBP 5,328 million represented a growth of 40.1% over GBP 3,804 million in Q3 FY13. During the quarter, JLR wholesale and retail volumes grew by 22.7% and 26.5% over the corresponding period last year and stood at 116,357 units and 112,172 units, respectively. JLR, EBITDA stood at GBP 955 million in the quarter, up 79.2% as compared to GBP 533 million in Q3 FY13. For the quarter standalone sales (including exports) of commercial and passenger vehicles stood at 1,32,087 units, a decline of 35.7% as compared to the corresponding period last year. Tata Motors and Samsung Electronics have entered a partnership to offer innovative in-car connectivity applications in Tata Motors passenger vehicles. Tata Motors showcased an extensive range of 18 stunning vehicles and concepts at the Auto Expo 2014 to demonstrate its product strategy for Horizonext. Net Sales and PAT of the company are expected to grow at a CAGR of 18% and 7% over 2012 to 2015E respectively. PEER GROUPS CMP MARKET CAP EPS P/E (X) P/BV(X) DIVIDEND COMPANY NAME (Rs.) Rs. in Mn. (Rs.) Ratio Ratio (%) Tata Motors Ltd 373.00 1200649.70 31.01 12.03 3.17 100.00 Eicher Motors Ltd 4425.70 119625.40 90.90 48.67 19.02 200.00 Maruti Suzuki India Ltd 1674.50 507343.50 106.68 15.74 2.73 160.00 BEML LTD 196.65 8328.90 6.28 31.85 0.40 25.00
Transcript of TATA MOTORS LIMITED BUY - Myirisbreport.myiris.com/firstcall/TATENGLC_20140211.pdfRecommend BUY CMP...

Recommend BUY
CMP 373.00
Target Price 410.00
ISIN: INE155A01022 FEBRUARY 11th
, 2014
TATA MOTORS LIMITED Result Update: Q3 FY14
STOCK DETAILS
Sector Automobile
BSE Code 500570
Face Value 2.00
52wk. High / Low (Rs.) 405.00/252.10
Volume (2wk. Avg ) 817000
Market Cap ( Rs in mn ) 1200649.70
Annual Estimated Results (A*: Actual / E*: Estimated)
Years FY13A FY14E FY15E
Net Sales 1888176.30 2390858.20 2725578.34
EBITDA 253588.30 358978.64 380979.42
Net Profit 98926.10 147253.06 165403.51
EPS 31.01 45.75 51.39
P/E 12.03 8.15 7.26
Shareholding Pattern (%)
1 Year Comparative Graph
TATA MOTORS LTD BSE SENSEX
SYNOPSIS
Tata Motors is India's largest automobile company, with consolidated revenues of Rs. 188818 crores ($ 34.7 billion) in 2012-13.
During the quarter, consolidated revenues of Rs. 638768.30 millions, a growth of 38.59% over Rs. 460895.00 millions in Q3 FY13.
The company’s net profit jumps to Rs. 48048.00 million against Rs. 16275.00 million in Q3 FY13, an increase of 195.23%.
During the quarter, JLR has reported revenues of GBP 5,328 million represented a growth of 40.1% over GBP 3,804 million in Q3 FY13.
During the quarter, JLR wholesale and retail volumes grew by 22.7% and 26.5% over the corresponding period last year and stood at 116,357 units and 112,172 units, respectively.
JLR, EBITDA stood at GBP 955 million in the quarter, up 79.2% as compared to GBP 533 million in Q3 FY13.
For the quarter standalone sales (including exports) of commercial and passenger vehicles stood at 1,32,087 units, a decline of 35.7% as compared to the corresponding period last year.
Tata Motors and Samsung Electronics have entered a partnership to offer innovative in-car connectivity applications in Tata Motors passenger vehicles.
Tata Motors showcased an extensive range of 18 stunning vehicles and concepts at the Auto Expo 2014 to demonstrate its product strategy for Horizonext.
Net Sales and PAT of the company are expected to grow at a CAGR of 18% and 7% over 2012 to 2015E respectively.
PEER GROUPS CMP MARKET CAP EPS P/E (X) P/BV(X) DIVIDEND
COMPANY NAME (Rs.) Rs. in Mn. (Rs.) Ratio Ratio (%)
Tata Motors Ltd 373.00 1200649.70 31.01 12.03 3.17 100.00
Eicher Motors Ltd 4425.70 119625.40 90.90 48.67 19.02 200.00
Maruti Suzuki India Ltd 1674.50 507343.50 106.68 15.74 2.73 160.00
BEML LTD 196.65 8328.90 6.28 31.85 0.40 25.00
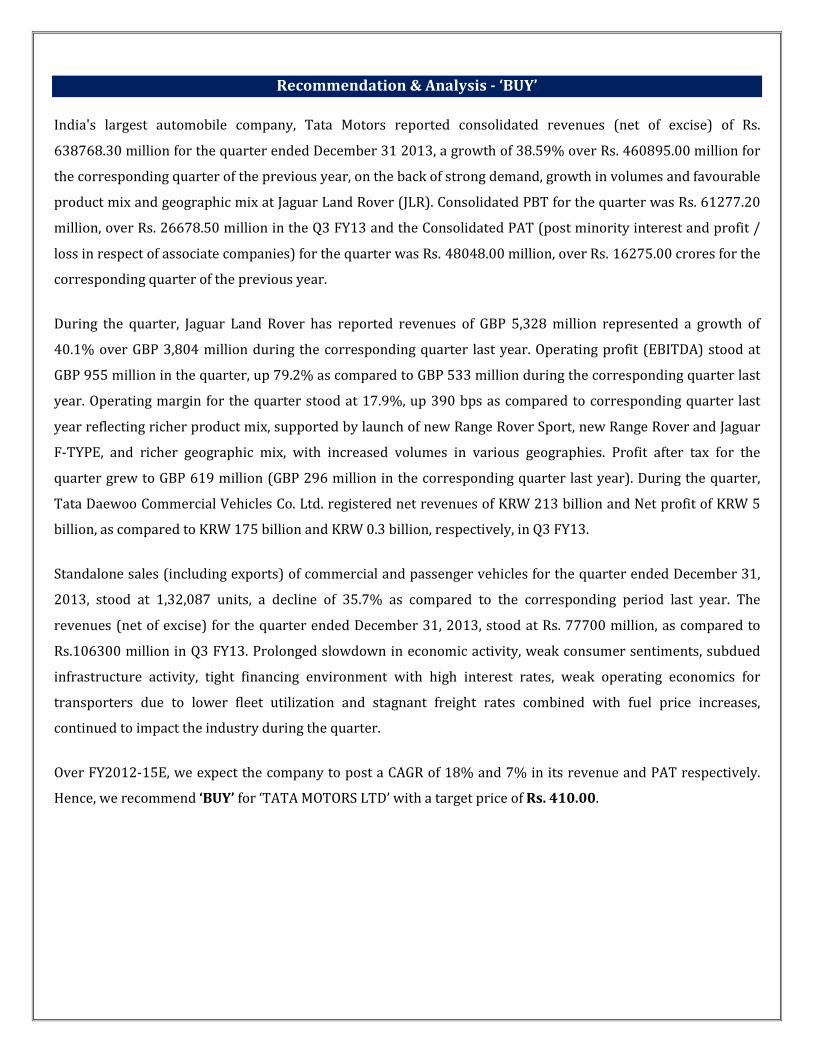
Recommendation & Analysis - ‘BUY’
India's largest automobile company, Tata Motors reported consolidated revenues (net of excise) of Rs.
638768.30 million for the quarter ended December 31 2013, a growth of 38.59% over Rs. 460895.00 million for
the corresponding quarter of the previous year, on the back of strong demand, growth in volumes and favourable
product mix and geographic mix at Jaguar Land Rover (JLR). Consolidated PBT for the quarter was Rs. 61277.20
million, over Rs. 26678.50 million in the Q3 FY13 and the Consolidated PAT (post minority interest and profit /
loss in respect of associate companies) for the quarter was Rs. 48048.00 million, over Rs. 16275.00 crores for the
corresponding quarter of the previous year.
During the quarter, Jaguar Land Rover has reported revenues of GBP 5,328 million represented a growth of
40.1% over GBP 3,804 million during the corresponding quarter last year. Operating profit (EBITDA) stood at
GBP 955 million in the quarter, up 79.2% as compared to GBP 533 million during the corresponding quarter last
year. Operating margin for the quarter stood at 17.9%, up 390 bps as compared to corresponding quarter last
year reflecting richer product mix, supported by launch of new Range Rover Sport, new Range Rover and Jaguar
F-TYPE, and richer geographic mix, with increased volumes in various geographies. Profit after tax for the
quarter grew to GBP 619 million (GBP 296 million in the corresponding quarter last year). During the quarter,
Tata Daewoo Commercial Vehicles Co. Ltd. registered net revenues of KRW 213 billion and Net profit of KRW 5
billion, as compared to KRW 175 billion and KRW 0.3 billion, respectively, in Q3 FY13.
Standalone sales (including exports) of commercial and passenger vehicles for the quarter ended December 31,
2013, stood at 1,32,087 units, a decline of 35.7% as compared to the corresponding period last year. The
revenues (net of excise) for the quarter ended December 31, 2013, stood at Rs. 77700 million, as compared to
Rs.106300 million in Q3 FY13. Prolonged slowdown in economic activity, weak consumer sentiments, subdued
infrastructure activity, tight financing environment with high interest rates, weak operating economics for
transporters due to lower fleet utilization and stagnant freight rates combined with fuel price increases,
continued to impact the industry during the quarter.
Over FY2012-15E, we expect the company to post a CAGR of 18% and 7% in its revenue and PAT respectively.
Hence, we recommend ‘BUY’ for ‘TATA MOTORS LTD’ with a target price of Rs. 410.00.

FINANCIAL HIGHLIGHTS (CONSOLIDATED)
Results updates- Q3 FY14,
Tata Motors Limited is India's largest automobile
company; it is the leader in commercial vehicles in
each segment, and among the top three in passenger
vehicles with winning products in the compact,
midsize car and utility vehicle segments world and
the largest in India, reported its financial results for
the quarter ended 31st Dec, 2013.
Months Dec-13 Dec-12 % Change
Net Sales 638768.30 460895.00 38.59
PAT 48048.00 16275.00 195.23
EPS 14.93 5.10 192.58
EBITDA 101059.60 58459.30 72.87
Consolidated revenues of Rs. 638768.30 millions for the quarter ended Dec 31, 2013, a growth of 38.59% over
Rs. 460895.00 millions for the corresponding quarter of the previous year. The company’s net profit jumps to Rs.
48048.00 million against Rs. 16275.00 million in the corresponding quarter ending of previous year, an increase
of 195.23%. Reported earnings per share of the company stood at Rs.14.93 a share during the quarter,
registering 192.58% increase over previous year period. Profit before interest, depreciation and tax stood at Rs.
101059.60 millions as against Rs. 58459.30 millions in the corresponding period of the previous year.
Expenditure :
Break up of Expenditure Rs in Millions
Q3 FY14 Q3 FY13
Cost of Material Consumed 374070.60 290437.00
Depreciation & Amortization
Expense 28526.90 20699.70
Product development /
Engineering expenses 6166.60 4865.00
Purchase of Products For Sale 19677.20 20626.70
Employee Benefit Expenses 58502.50 43529.10
Other Expenditure 110959.80 84539.10

Latest Updates
• Standalone sales (including exports) of commercial and passenger vehicles for the quarter ended December
31, 2013, stood at 1,32,087 units, a decline of 35.7% as compared to the corresponding period last year.
• Standalone revenues (net of excise) for the quarter ended December 31, 2013, stood at Rs.77700 million, as
compared to Rs.106300 million in Q3 FY13.
• Jaguar Land Rover wholesale and retail volumes for the quarter ended December 31, 2013 grew by 22.7%
and 26.5%, respectively, over the corresponding period last year and stood at 116,357 units and 112,172
units, respectively.
• Tata Motors and Samsung Electronics have entered a partnership agreement to offer innovative in-car
connectivity applications in Tata Motors passenger vehicles. Based on Samsung's 'Drive Link app' on
MirrorLink™ technology,
• Tata Motors showcased an extensive range of 18 stunning vehicles and concepts at the Auto Expo 2014 to
demonstrate its product strategy for Horizonext.
• Tata Motors' total sales (including exports) of Tata commercial and passenger vehicles in January 2014 were
40,481 vehicles. The company's domestic sales of Tata commercial and passenger vehicles for January 2014
were 36,657 nos. Cumulative sales (including exports) for the company for the fiscal were 475,560 nos.
• Tata Motors has launched new Vista VXTech, an advanced & dynamic car, delivering 75PS of raw power,
offering first-in-class high-tech features.
• Tata Motors has launched the REVOTRON Series, the next - generation Petrol engine family that will power
its future models in the passenger vehicle market.
• Tata Motors Limited has confirmed its long term commitment to advanced research and development in the
UK through the participation of its subsidiary, Tata Motors European Technical Centre (TMETC), in the
National Automotive Innovation Campus (NAIC).
• The Company formally announced the launch of two new additions to its CNG portfolio - Tata Indigo emax
and Tata Indica emax. These two variants have been introduced in 6 markets across India and will now be
available in Delhi, Maharashtra, Gujarat, Uttar Pradesh, Andhra Pradesh and Tripura.
Company Profile
Tata Motors is India's largest automobile company, with consolidated revenues of Rs. 1, 88,818 crores ($ 34.7
billion) in 2012-13. Through subsidiaries and associate companies, Tata Motors has operations in the UK, South
Korea, Thailand, South Africa and Indonesia. Among them is Jaguar Land Rover, the business comprising the two
iconic British brands. It also has an industrial joint venture with Fiat in India. With over 8 million Tata vehicles
plying in India, Tata Motors is the country's market leader in commercial vehicles and among the top in
passenger vehicles. It is also the world's fifth largest truck manufacturer and fourth largest bus manufacturer.
Tata cars, buses and trucks are being marketed in several countries in Europe, Africa, the Middle East, South
Asia, South East Asia, South America, CIS and Russia.
The Tata Motors Group's over 60,000 employees are guided by the mission "to be passionate in anticipating and
providing the best vehicles and experiences that excite their customers globally."
Established in 1945, Tata Motors' presence indeed cuts across the length and breadth of India. The company's
manufacturing base in India is spread across Jamshedpur (Jharkhand), Pune (Maharashtra), Lucknow (Uttar
Pradesh), Pantnagar (Uttarakhand), Sanand (Gujarat) and Dharwad (Karnataka). Following a strategic alliance
with Fiat in 2005, it has set up an industrial joint venture with Fiat Group Automobiles at Ranjangaon
(Maharashtra) to produce both Fiat and Tata cars and Fiat power trains. The company's dealership, sales,
services and spare parts network comprises over 6,600 touch points.
Tata Motors is also expanding its international footprint, established through exports since 1961. The
company's commercial and passenger vehicles are already being marketed in several countries in Europe,
Africa, the Middle East, South East Asia, South Asia and South America, CIS and Russia. It has franchisee/joint
venture assembly operations in Bangladesh, Ukraine and Senegal.
With over 4,500 engineers and scientists, the company's Engineering Research Centre, established in 1966, has
enabled pioneering technologies and products. The company today has R&D centres in Pune, Jamshedpur,
Lucknow, Dharwad in India, and in South Korea, Italy, Spain, and the UK.
Product range of the company includes:
• Passenger Cars:
� Indica Vista, Indica V2, indica V2 Turbo, Indica V2 Xeta, Indica V2 Dicor.
� Indigo XL, Indigo, Indigo Marina Indigo CS.
� Nano.
� Fiat Cars
� Tata Cars

� Jaguar
� Land Rover
• Utility Vehicles:
� Safari Dicor.
� Sumo Grande.
� Sumo.
� Xenon XT.
• Commercial Vehicles:
� Medium & Heavy Comm. Vehicles, Tata Novus.
� Intermediate Comm. Vehicles.
� Light Commercial Vehicles, TL 4×4,
� Small Commercial Vehicles.
• Commercial Passenger Carriers:
� Buses.
� Winger.
� Magic
• Defence Vehicles
� Logistics
� Tactical
� Armored
� Buses
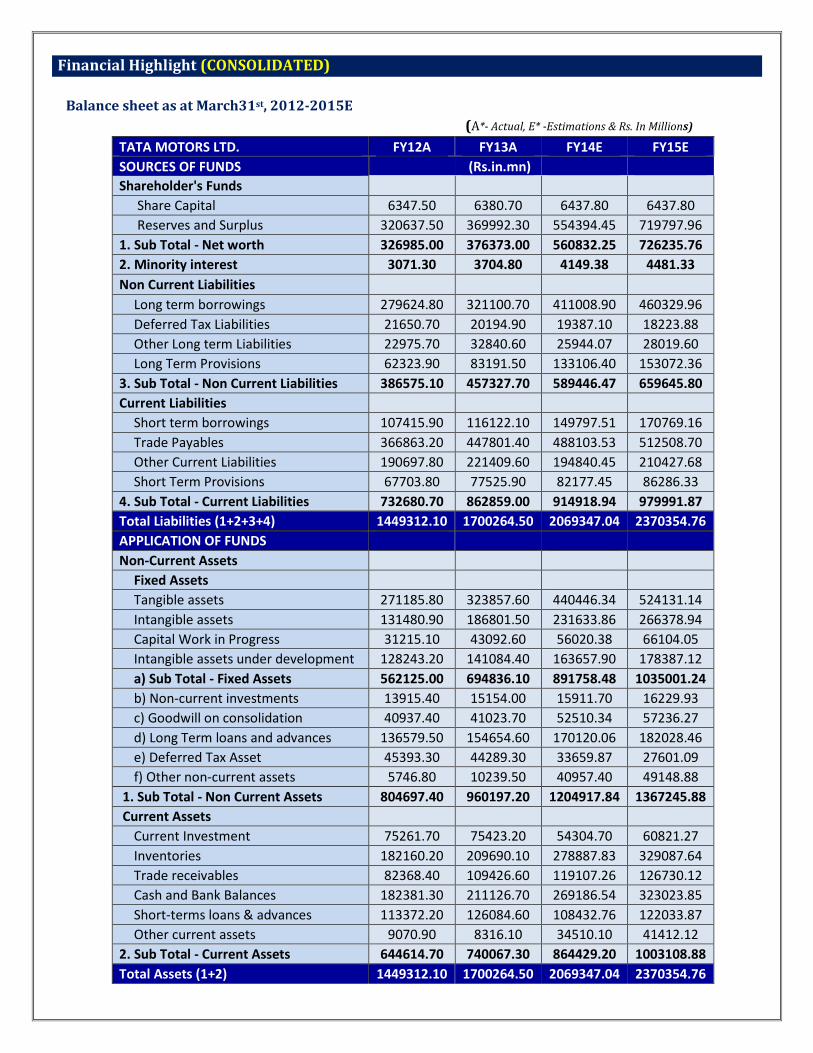
Financial Highlight (CONSOLIDATED)
Balance sheet as at March31st, 2012-2015E
(A*- Actual, E* -Estimations & Rs. In Millions)
TATA MOTORS LTD. FY12A FY13A FY14E FY15E
SOURCES OF FUNDS (Rs.in.mn)
Shareholder's Funds
Share Capital 6347.50 6380.70 6437.80 6437.80
Reserves and Surplus 320637.50 369992.30 554394.45 719797.96
1. Sub Total - Net worth 326985.00 376373.00 560832.25 726235.76
2. Minority interest 3071.30 3704.80 4149.38 4481.33
Non Current Liabilities
Long term borrowings 279624.80 321100.70 411008.90 460329.96
Deferred Tax Liabilities 21650.70 20194.90 19387.10 18223.88
Other Long term Liabilities 22975.70 32840.60 25944.07 28019.60
Long Term Provisions 62323.90 83191.50 133106.40 153072.36
3. Sub Total - Non Current Liabilities 386575.10 457327.70 589446.47 659645.80
Current Liabilities
Short term borrowings 107415.90 116122.10 149797.51 170769.16
Trade Payables 366863.20 447801.40 488103.53 512508.70
Other Current Liabilities 190697.80 221409.60 194840.45 210427.68
Short Term Provisions 67703.80 77525.90 82177.45 86286.33
4. Sub Total - Current Liabilities 732680.70 862859.00 914918.94 979991.87
Total Liabilities (1+2+3+4) 1449312.10 1700264.50 2069347.04 2370354.76
APPLICATION OF FUNDS
Non-Current Assets
Fixed Assets
Tangible assets 271185.80 323857.60 440446.34 524131.14
Intangible assets 131480.90 186801.50 231633.86 266378.94
Capital Work in Progress 31215.10 43092.60 56020.38 66104.05
Intangible assets under development 128243.20 141084.40 163657.90 178387.12
a) Sub Total - Fixed Assets 562125.00 694836.10 891758.48 1035001.24
b) Non-current investments 13915.40 15154.00 15911.70 16229.93
c) Goodwill on consolidation 40937.40 41023.70 52510.34 57236.27
d) Long Term loans and advances 136579.50 154654.60 170120.06 182028.46
e) Deferred Tax Asset 45393.30 44289.30 33659.87 27601.09
f) Other non-current assets 5746.80 10239.50 40957.40 49148.88
1. Sub Total - Non Current Assets 804697.40 960197.20 1204917.84 1367245.88
Current Assets
Current Investment 75261.70 75423.20 54304.70 60821.27
Inventories 182160.20 209690.10 278887.83 329087.64
Trade receivables 82368.40 109426.60 119107.26 126730.12
Cash and Bank Balances 182381.30 211126.70 269186.54 323023.85
Short-terms loans & advances 113372.20 126084.60 108432.76 122033.87
Other current assets 9070.90 8316.10 34510.10 41412.12
2. Sub Total - Current Assets 644614.70 740067.30 864429.20 1003108.88
Total Assets (1+2) 1449312.10 1700264.50 2069347.04 2370354.76
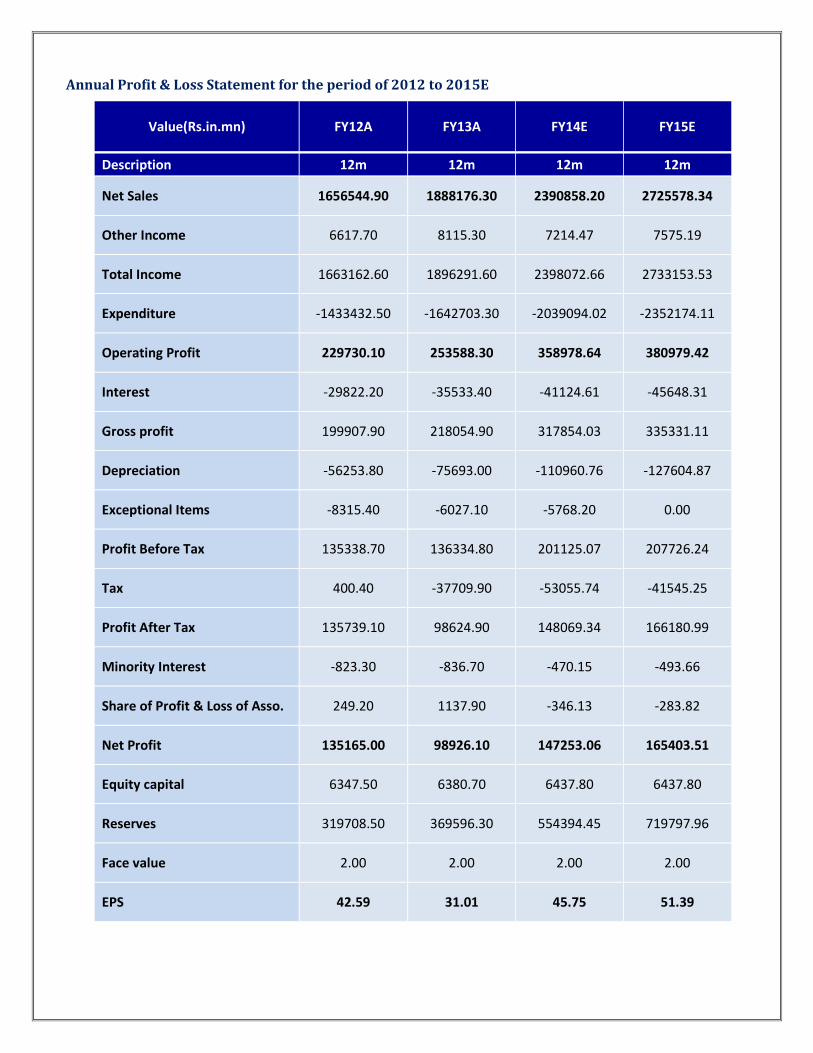
Annual Profit & Loss Statement for the period of 2012 to 2015E
Value(Rs.in.mn) FY12A FY13A FY14E FY15E
Description 12m 12m 12m 12m
Net Sales 1656544.90 1888176.30 2390858.20 2725578.34
Other Income 6617.70 8115.30 7214.47 7575.19
Total Income 1663162.60 1896291.60 2398072.66 2733153.53
Expenditure -1433432.50 -1642703.30 -2039094.02 -2352174.11
Operating Profit 229730.10 253588.30 358978.64 380979.42
Interest -29822.20 -35533.40 -41124.61 -45648.31
Gross profit 199907.90 218054.90 317854.03 335331.11
Depreciation -56253.80 -75693.00 -110960.76 -127604.87
Exceptional Items -8315.40 -6027.10 -5768.20 0.00
Profit Before Tax 135338.70 136334.80 201125.07 207726.24
Tax 400.40 -37709.90 -53055.74 -41545.25
Profit After Tax 135739.10 98624.90 148069.34 166180.99
Minority Interest -823.30 -836.70 -470.15 -493.66
Share of Profit & Loss of Asso. 249.20 1137.90 -346.13 -283.82
Net Profit 135165.00 98926.10 147253.06 165403.51
Equity capital 6347.50 6380.70 6437.80 6437.80
Reserves 319708.50 369596.30 554394.45 719797.96
Face value 2.00 2.00 2.00 2.00
EPS 42.59 31.01 45.75 51.39

Quarterly Profit & Loss Statement for the period of 30th June, 2013 to 31st March, 2014E
Value(Rs.in.mn) 30-Jun-13 30-Sep-13 31-Dec-13 31-Mar-14E
Description 3m 3m 3m 3m
Net sales 467846.60 568822.80 638768.30 715420.50
Other income 1822.90 2320.90 1574.70 1495.97
Total Income 469669.50 571143.70 640343.00 716916.46
Expenditure -405654.60 -482471.50 -539283.40 -611684.52
Operating profit 64014.90 88672.20 101059.60 105231.94
Interest -9482.40 -11117.40 -10012.10 -10512.71
Gross profit 54532.50 77554.80 91047.50 94719.23
Depreciation -23476.50 -27292.50 -28526.90 -31664.86
Exceptional Items -1786.40 -2738.40 -1243.40 0.00
Profit Before Tax 29269.60 47523.90 61277.20 63054.37
Tax -11641.50 -11934.30 -13085.80 -16394.14
Profit After Tax 17628.10 35589.60 48191.40 46660.24
Minority Interest -198.10 -106.30 -85.00 -80.75
Share of Profit & Loss of Asso. -169.30 -64.70 -58.40 -53.73
Net Profit 17260.70 35418.60 48048.00 46525.76
Equity capital 6437.80 6437.80 6437.80 6437.80
Face value 2.00 2.00 2.00 2.00
EPS 5.36 11.00 14.93 14.45
Ratio Analysis
Particulars FY12A FY13A FY14E FY15E
EPS (Rs.) 42.59 31.01 45.75 51.39
EBITDA Margin (%) 13.87% 13.43% 15.01% 13.98%
PBT Margin (%) 8.17% 7.22% 8.41% 7.62%
PAT Margin (%) 8.19% 5.22% 6.19% 6.10%
P/E Ratio (x) 8.76 12.03 8.15 7.26
ROE (%) 41.63% 26.23% 26.40% 22.88%
ROCE (%) 40.10% 40.49% 41.90% 37.47%
Debt Equity Ratio 1.19 1.16 1.00 0.87
EV/EBITDA (x) 6.04 5.58 4.16 3.96
Book Value (Rs.) 102.74 117.85 174.23 225.62
P/BV 3.63 3.17 2.14 1.65

Charts

Outlook and Conclusion
� At the current market price of Rs.373.00, the stock P/E ratio is at 8.15 x FY14E and 7.26 x FY15E
respectively.
� Earning per share (EPS) of the company for the earnings for FY14E and FY15E is seen at Rs.45.75 and
Rs.51.39 respectively.
� Net Sales and PAT of the company are expected to grow at a CAGR of 18% and 7% over 2012 to 2015E
respectively.
� On the basis of EV/EBITDA, the stock trades at 4.16 x for FY14E and 3.96 x for FY15E.
� Price to Book Value of the stock is expected to be at 2.14 x and 1.65 x respectively for FY14E and FY15E.
� We recommend ‘BUY’ in this particular scrip with a target price of Rs.410.00 for Medium to Long term
investment.
Industry Overview
India represents one of the world’s largest automobile industries. Easy availability of finance and rising income
levels are encouraging the middle class population to upgrade their two wheelers to a car. Besides, the growing
organised used car market has also been a positive growth factor in the used car market of the country. Driven by
the above factors, the used cars market is anticipated to grow at a compound annual growth rate (CAGR) of 16
per cent during 2013–17.
India is quietly becoming a production hub of high-end vehicles meant for export to China. The US-based
motorbike maker Harley Davidson, Austrian motorcycle manufacturer KTM and Mahindra & Mahindra have also
preferred to set up manufacturing facilities in India than in the relatively low-cost China and export the output.
Key Statistics
The passenger vehicles production in India touched 3.23 million units in 2012–13 and is expected to reach 10
million units by 2020–21. The industry is estimated to grow at a CAGR of 13 per cent during 2012–2021. In
addition, the industry recorded exports worth US$ 9.3 billion in 2012–13 and is projected to touch US$ 30 billion
by 2020–21, according to Automotive Component Manufacturers’ Association (ACMA).
The cumulative foreign direct investment (FDI) inflows into the Indian automobile industry during April 2000 to
October 2013 was recorded at US$ 9,079 million, amounting to 4 per cent of the total FDI inflows (in terms of
US$), as per Department of Industrial Policy and Promotion (DIPP), Ministry of Commerce, Government of India.
India is also expected to emerge as a centre for producing compact superbikes as Indian customers progress to
the next level of biking. Several global and Indian bike makers plan to utilise India's mass-production base of 16
million two-wheelers to roll out sports bikes in the 250 cc capacity.
More so, the demand for premium sports utility vehicles (SUVs) will continue to grow. The market size of
premium SUVs was estimated to be around 25,000 units annually in India.
Major Developments & Investments
• Tata Motors Ltd plans to invest about £30 million (US$ 49.17 million) in the National Automotive
Innovation Campus (NAIC) for research and development (R&D). The investment would be made through
its subsidiary Tata Motors European Technical Centre (TMETC) at the University of Warwick campus, UK.
• Volvo India Pvt Ltd plans to set up truck and bus manufacturing facility in Malur, Karnataka, with an
investment of Rs 974 crore (US$ 158.32 million). The facility is expected to give employment to about
2,125 people.
• Manufacturing companies in Japan continue to view India as the top destination for investments—over
China, Thailand, Vietnam, Brazil and Indonesia—in the next three years, according to Mr Masanori
Nakano, Consul General of Japan in Chennai.
• Tata Motors-owned Jaguar Land Rover (JLR) has entered into an agreement with the state of Rio de
Janeiro to build a manufacturing plant in Brazil with an investment of Rs 4,626 crore (US$ 751.95
million).
• JBM Auto has formed a joint venture (JV) with Italian bus maker BredaMenarinibus to manufacture
luxury buses in India. The Indo–Italian venture plans to set up a plant at Kosi, near Faridabad in Haryana,
and produce 2,000 buses every year initially, at an investment of Rs 500 crore (US$ 81.27 million).
• Mahindra & Mahindra (M&M) plans to develop the world's first hybrid technology that can be deployed
in vehicles with manual transmission and enhance fuel efficiency by almost 20 per cent.
• Amtek Auto has signed an agreement to buy Germany-based Kuepper Group of companies for about
€200 million (US$ 272.73 million) in its second big European acquisition in 2013.
• Honda Cars India will use the Ennore Port to export cars to South Africa. The infrastructure for car
exports at Ennore Port is attractive and cost effective.
Government Initiatives
The Government of India plans to introduce fuel-efficiency ratings for automobiles to encourage sale of cars that
consume less petrol or diesel, as per Mr Veerappa Moily, Union Minister for Petroleum and Natural Gas,
Government of India.

The Union Budget 2013–14 added some incentives to the industry.
• The period of concession available for specified part of electric and hybrid vehicles till April 2013 has
been extended up to March 31, 2015.
• The basic customs duty (BCD) on imported luxury goods such as high-end motor vehicles, motor cycles,
yachts and similar vessels was increased. The duty was raised from 75 per cent to 100 per cent on
cars/motor vehicles (irrespective of engine capacity) with CIF value more than US$ 40,000; from 60 per
cent to 75 per cent on motorcycles with engine capacity of 800 cc or more and on yachts and similar
vessels from 10 per cent to 25 per cent.
• In addition, an increase in excise duty from 27 to 30 per cent has been allowed for SUVs with engine
capacity exceeding 1,500 cc, while excise duty was decreased from 80 to 72 per cent, in case of SUVs
registered solely to be used for taxi purposes.
• An exemption from BCD will be provided to lithium ion automotive battery for manufacture of lithium
ion battery packs for supply to manufacturers of hybrid and electric vehicles.
• The excise duty on chassis of diesel motor vehicles for transport of goods reduced from 14 per cent to 13
per cent.
The Government of India allows 100 per cent FDI in the automotive industry through automatic route.
Road Ahead
The vision of Automotive Mission Plan (AMP) 2006–2016 expects India, “to emerge as the destination of choice
in the world for design and manufacture of automobiles and auto components with output reaching a level of US$
145 billion; accounting for more than 10 per cent of the gross domestic product (GDP) and providing additional
employment to 25 million people by 2016.”
With special focus on exports of small cars, multi-utility vehicles (MUVs), two and three wheelers and auto
components; the automotive sector’s contribution to the GDP is expected to double reaching a turnover worth
US$ 145 billion in 2016, according to the AMP 2006–2016.

Disclaimer:
This document prepared by our research analysts does not constitute an offer or solicitation for the purchase or sale
of any financial instrument or as an official confirmation of any transaction. The information contained herein is
from publicly available data or other sources believed to be reliable but do not represent that it is accurate or
complete and it should not be relied on as such. Firstcall India Equity Advisors Pvt. Ltd. or any of it’s affiliates shall
not be in any way responsible for any loss or damage that may arise to any person from any inadvertent error in the
information contained in this report. This document is provide for assistance only and is not intended to be and must
not alone be taken as the basis for an investment decision.

Firstcall India Equity Research: Email – [email protected]
C.V.S.L.Kameswari Pharma
U. Janaki Rao Capital Goods
B. Anil Kumar Auto, IT & FMCG
Suhani Adilabadkar Pharma & Banking
M. Vinayak Rao Diversified
Firstcall India also provides
Firstcall India Equity Advisors Pvt.Ltd focuses on, IPO’s, QIP’s, F.P.O’s,Takeover
Offers, Offer for Sale and Buy Back Offerings.
Corporate Finance Offerings include Foreign Currency Loan Syndications,
Placement of Equity / Debt with multilateral organizations, Short Term Funds
Management Debt & Equity, Working Capital Limits, Equity & Debt
Syndications and Structured Deals.
Corporate Advisory Offerings include Mergers & Acquisitions(domestic and
cross-border), divestitures, spin-offs, valuation of business, corporate
restructuring-Capital and Debt, Turnkey Corporate Revival – Planning &
Execution, Project Financing, Venture capital, Private Equity and Financial
Joint Ventures
Firstcall India also provides Financial Advisory services with respect to raising
of capital through FCCBs, GDRs, ADRs and listing of the same on International
Stock Exchanges namely AIMs, Luxembourg, Singapore Stock Exchanges and
other international stock exchanges.
For Further Details Contact:
3rd Floor,Sankalp,The Bureau,Dr.R.C.Marg,Chembur,Mumbai 400 071
Tel. : 022-2527 2510/2527 6077/25276089 Telefax : 022-25276089
E-mail: [email protected]
www.firstcallindiaequity.com