TASS Presentation 2012-09-14 - Partial Least …...2012/09/14 · TASS Presentation 2012-09-14 -...
37
The Souther Ontario Regional Associa4on (SORA) of the Sta4s4cal Society of Canada (SSC) Presents 20122013 SORA Business Analy4cs Seminar Series Speaker: Richard Boire, Boire Filler Group Title: Big Data and Analy<cs Hype Or Reality Date: Wednesday, September 26, 2012 Networking: 2:00 2:30 pm Seminar Time: 2:30 3:30 pm Discussion and Networking: 3:30 5:00 pm SAS Headquarters Office Suite 500, 280 King Street East, Toronto Please email [email protected] to register by sending your name and professional affilia4on. Admission is free! Coffee, tea and soda will be served!
Transcript of TASS Presentation 2012-09-14 - Partial Least …...2012/09/14 · TASS Presentation 2012-09-14 -...
The Souther Ontario Regional Associa4on (SORA) of the Sta4s4cal Society of Canada (SSC) Presents
2012-‐2013 SORA Business Analy4cs Seminar Series
Speaker: Richard Boire, Boire Filler Group Title: Big Data and Analy<cs -‐ Hype Or Reality Date: Wednesday, September 26, 2012
Networking: 2:00 -‐ 2:30 pm Seminar Time: 2:30 -‐ 3:30 pm Discussion and Networking: 3:30 -‐ 5:00 pm
SAS Headquarters Office Suite 500, 280 King Street East, Toronto
Please email [email protected] to register by sending your name and professional affilia4on.
Admission is free! Coffee, tea and soda will be served!
Overcoming Mul4collinearity and OverfiOng:
Par4al Least Squares Regression in JMP and SAS
Eric Cai Sta4s4cian
Copyright © 2012 Predictum Inc. All Rights Reserved www.predictum.com / [email protected]
Copyright © 2012 Predictum Inc. All Rights Reserved www.predictum.com / [email protected]
Outline • Limita<ons of linear least squares regression
• Par<al least squares (PLS) regression
• Variable selec<on in PLS regression
• How PLS regression works in JMP and SAS
Copyright © 2012 Predictum Inc. All Rights Reserved www.predictum.com / [email protected]
Copyright © 2012 Predictum Inc. All Rights Reserved www.predictum.com / [email protected]
Regression Modelling
• Goal: Given a set of inputs
X1, X2,…, Xp predict a response, Y.
Copyright © 2012 Predictum Inc. All Rights Reserved www.predictum.com / [email protected]

Normal Linear Regression Model
Copyright © 2012 Predictum Inc. All Rights Reserved www.predictum.com / [email protected]
Copyright © 2012 Predictum Inc. All Rights Reserved www.predictum.com / [email protected]
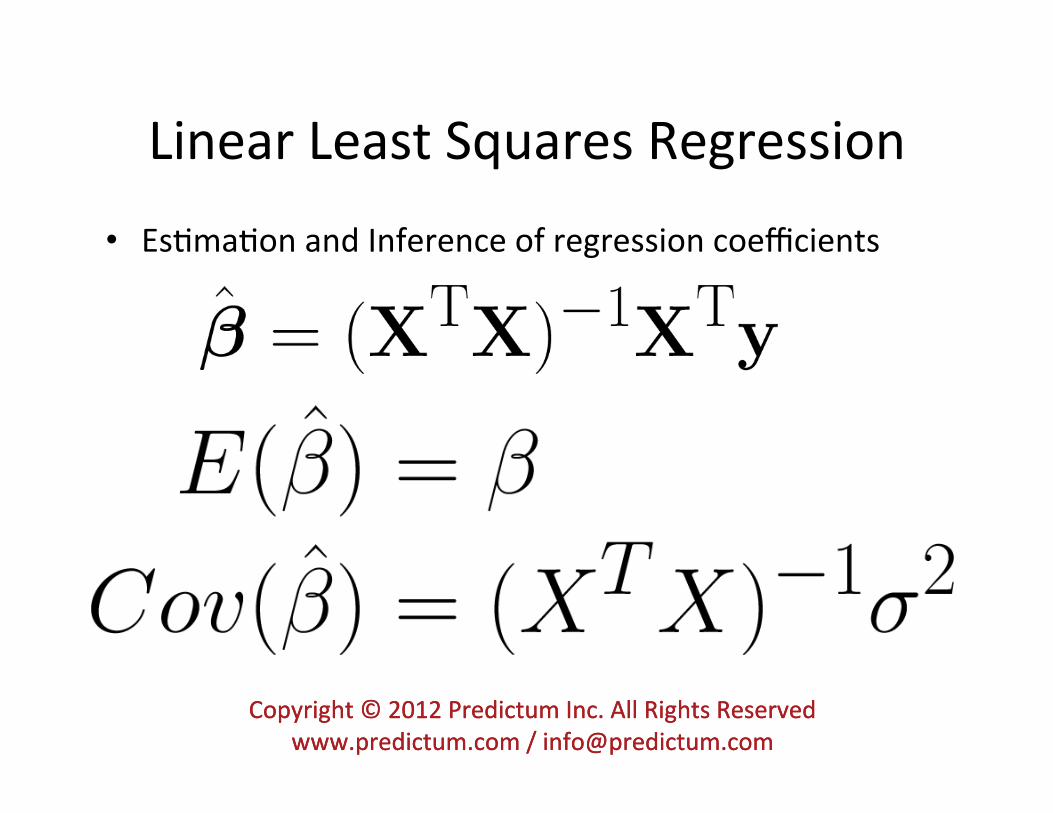
Linear Least Squares Regression
• Es<ma<on and Inference of regression coefficients
Copyright © 2012 Predictum Inc. All Rights Reserved www.predictum.com / [email protected]
Copyright © 2012 Predictum Inc. All Rights Reserved www.predictum.com / [email protected]
Limita<ons of Linear Least Squares Regression
• Mul<collinearity – 2 or more predictors are correlated
Copyright © 2012 Predictum Inc. All Rights Reserved www.predictum.com / [email protected]

Copyright © 2012 Predictum Inc. All Rights Reserved www.predictum.com / [email protected]
Mul<collinearity
• Regression coefficients (β0, β1,…, βp) have high sampling variability
Copyright © 2012 Predictum Inc. All Rights Reserved www.predictum.com / [email protected]

Copyright © 2012 Predictum Inc. All Rights Reserved www.predictum.com / [email protected]
Limita<ons of Linear Least Squares Regression
• Overfieng – Too many predictors • The model is too complex
– More predictors than observa<ons (p > n)
Copyright © 2012 Predictum Inc. All Rights Reserved www.predictum.com / [email protected]
Copyright © 2012 Predictum Inc. All Rights Reserved www.predictum.com / [email protected]
Overfieng
• The model predicts noise instead of the underlying rela<onship
• Low predic<ve accuracy on fresh data
Copyright © 2012 Predictum Inc. All Rights Reserved www.predictum.com / [email protected]

Copyright © 2012 Predictum Inc. All Rights Reserved www.predictum.com / [email protected]
Limita<ons of Linear Least Squares Regression
• Mul4collinearity and overfiOng are common limita<ons of linear least squares regression
Copyright © 2012 Predictum Inc. All Rights Reserved www.predictum.com / [email protected]
Par<al Least Squares Regression
• An alterna<ve regression technique
• Can overcome mul<collinearity and overfieng
• Can be done easily in JMP and SAS!
Copyright © 2012 Predictum Inc. All Rights Reserved www.predictum.com / [email protected]
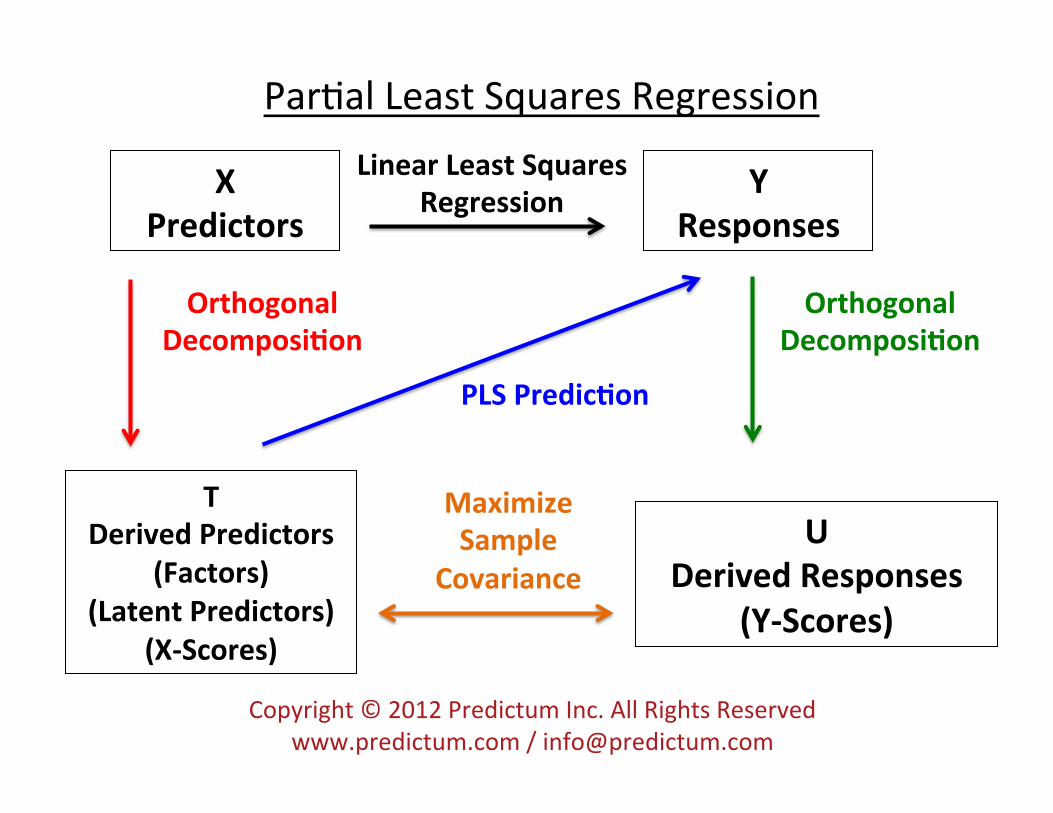
X Predictors
Y Responses
T Derived Predictors
(Factors) (Latent Predictors)
(X-‐Scores)
U Derived Responses
(Y-‐Scores)
Linear Least Squares Regression
Orthogonal Decomposi4on
Maximize Sample
Covariance
Orthogonal Decomposi4on
PLS Predic4on
Par<al Least Squares Regression

Copyright © 2012 Predictum Inc. All Rights Reserved www.predictum.com / [email protected]
…but what have I glossed over?

Copyright © 2012 Predictum Inc. All Rights Reserved www.predictum.com / [email protected]
…but what have I glossed over?
How to overcome overfiOng with PLS regression!
• Can’t use too many latent factors
• Need some way to test whether the model is overfieng not

Copyright © 2012 Predictum Inc. All Rights Reserved www.predictum.com / [email protected]
How many factors should you use?
• There’s no rule!
• Build different models with different numbers of latent factors – Pick the model that predicts most accurately!
Copyright © 2012 Predictum Inc. All Rights Reserved www.predictum.com / [email protected]
How many factors should you use?
• Use k-‐fold cross-‐valida4on to assess predic<ve accuracy!
Copyright © 2012 Predictum Inc. All Rights Reserved www.predictum.com / [email protected]
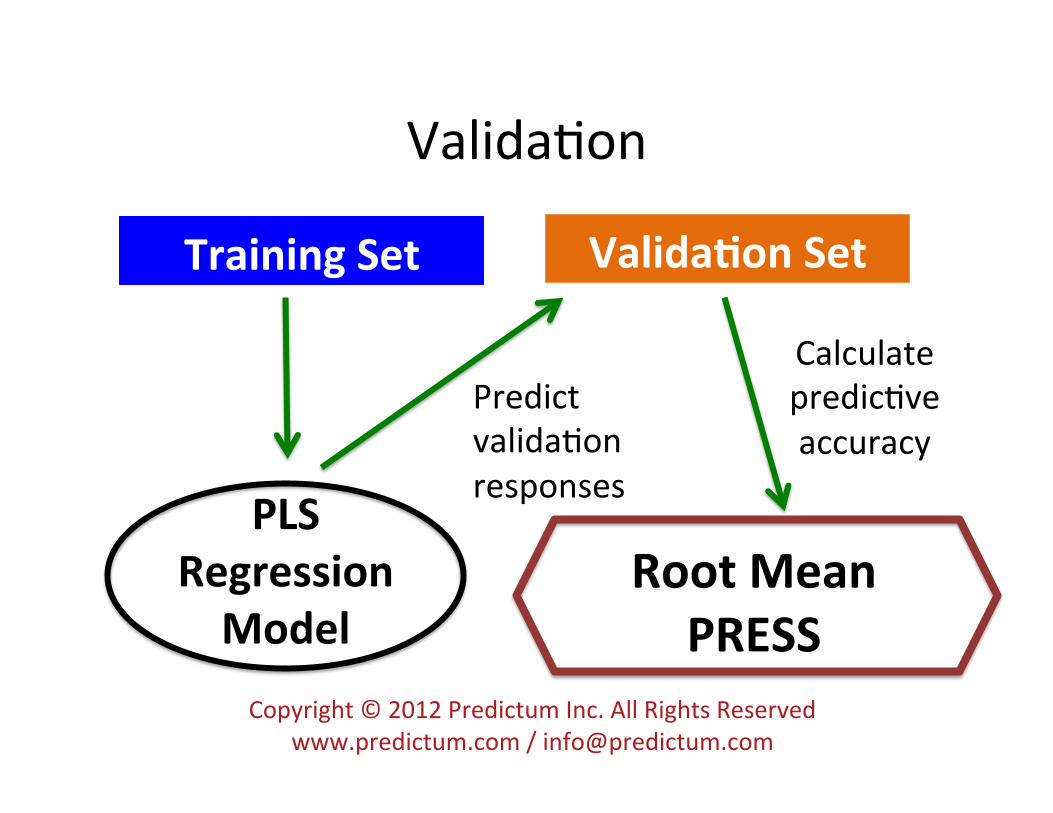
Valida<on
Training Set Valida4on Set
PLS Regression Model
Predict valida<on responses
Calculate predic<ve accuracy
Root Mean PRESS
Copyright © 2012 Predictum Inc. All Rights Reserved www.predictum.com / [email protected]
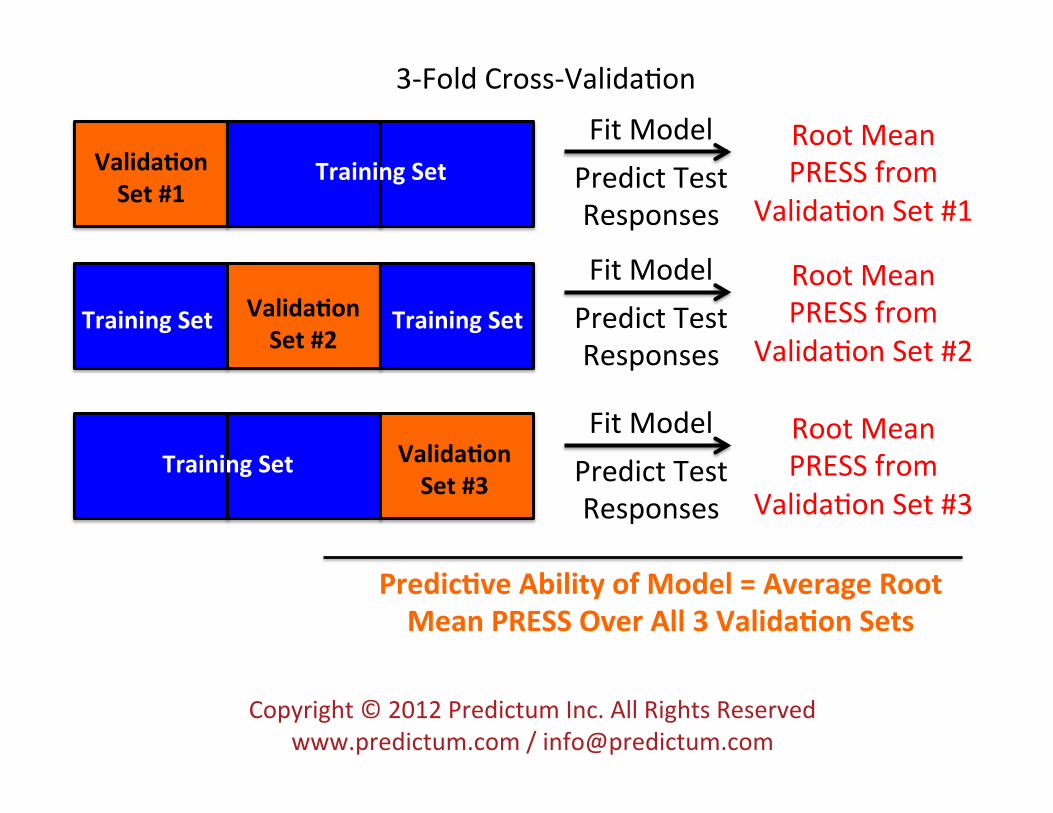
3-‐Fold Cross-‐Valida<on
Root Mean PRESS from
Valida<on Set #1
Valida4on Set #1
Training Set
Training Set Training Set
Training Set
Valida4on Set #2
Valida4on Set #3
Fit Model Predict Test Responses
Predic4ve Ability of Model = Average Root Mean PRESS Over All 3 Valida4on Sets
Root Mean PRESS from
Valida<on Set #2
Fit Model Predict Test Responses
Root Mean PRESS from
Valida<on Set #3
Fit Model Predict Test Responses
Copyright © 2012 Predictum Inc. All Rights Reserved www.predictum.com / [email protected]
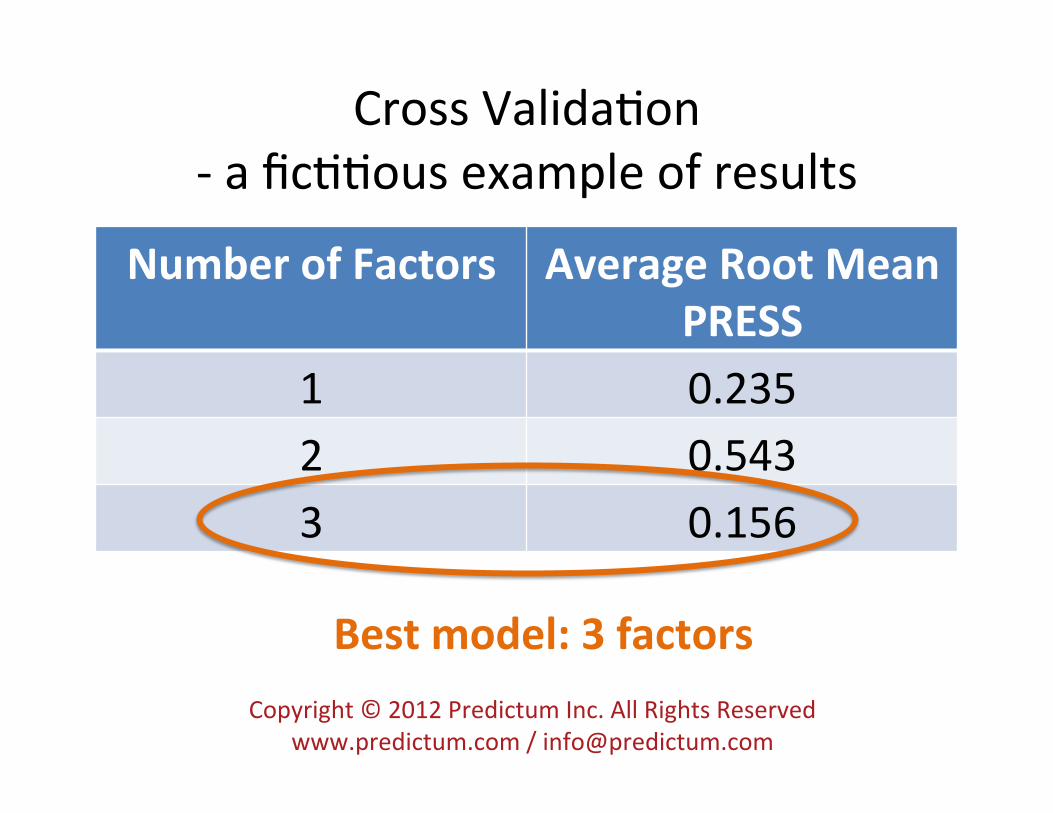
Cross Valida<on -‐ a fic<<ous example of results
Number of Factors Average Root Mean PRESS
1 0.235 2 0.543 3 0.156
Best model: 3 factors

Copyright © 2012 Predictum Inc. All Rights Reserved www.predictum.com / [email protected]
Other methods of valida<on
• Holdback or blocked valida<on – hold out successive blocks of observa<ons for valida<on
• Split-‐sample valida<on – Hold out successive groups of widely separated observa<ons for valida<on
• Random-‐sample valida<on – Randomly select data for valida<on

Copyright © 2012 Predictum Inc. All Rights Reserved www.predictum.com / [email protected]
Variable Selec<on in PLS Regression
• Variable selec4on: determine which predictors are most important for predic<ng the response
• This can be done in PLS regression!
Copyright © 2012 Predictum Inc. All Rights Reserved www.predictum.com / [email protected]
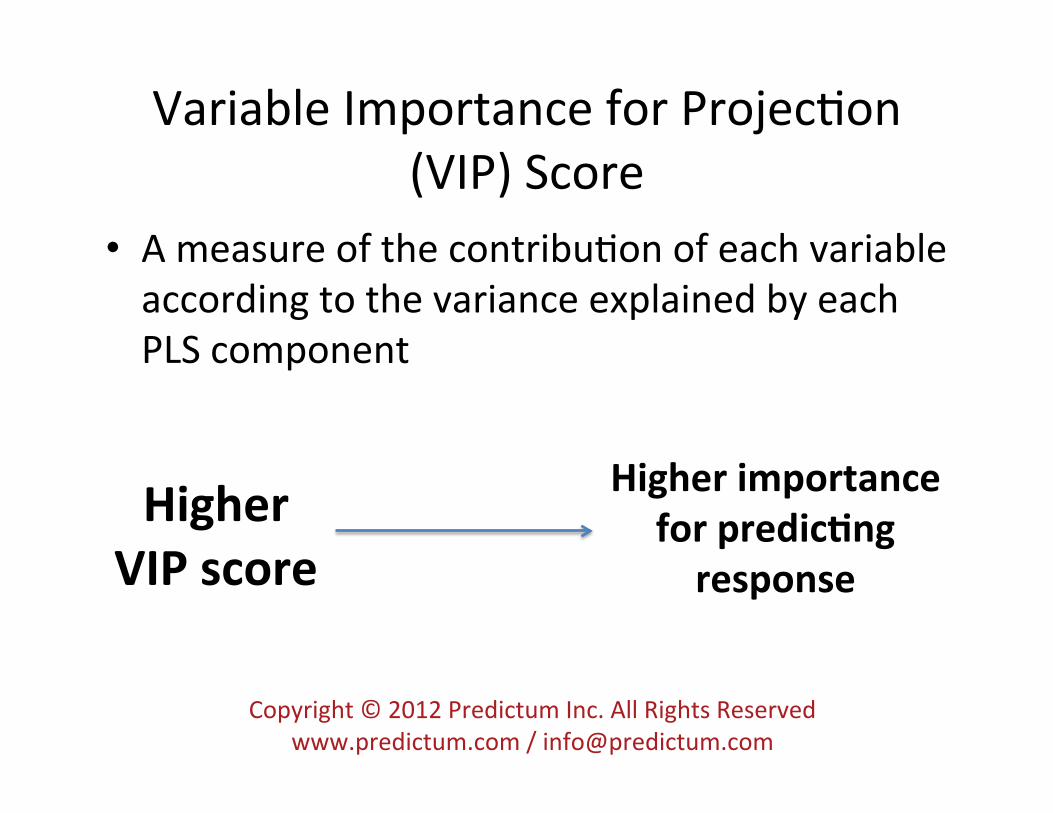
Variable Importance for Projec<on (VIP) Score
• A measure of the contribu<on of each variable according to the variance explained by each PLS component
Higher VIP score
Higher importance for predic4ng response

Copyright © 2012 Predictum Inc. All Rights Reserved www.predictum.com / [email protected]
Variable Selec<on Using VIP Score
• What cut-‐off for the VIP score should be used to select variables? – Different points of view
Source Cut-‐off
JMP 0.8
Chong and Jun (2005) 1.0
Jun et al. (2009) 1.5
Copyright © 2012 Predictum Inc. All Rights Reserved www.predictum.com / [email protected]
Variable Selec<on Using VIP Score
• Does it work well? – Liqle discussion found in the sta<s<cal community
– No consensus found
Copyright © 2012 Predictum Inc. All Rights Reserved www.predictum.com / [email protected]
Variable Selec<on Using VIP Score
• Excellent performance shown by two studies – Compared PLS-‐VIP with LASSO and stepwise selec<on on simulated and real data
• Chong and Jun (2005) • Jun et al. (2009)
Copyright © 2012 Predictum Inc. All Rights Reserved www.predictum.com / [email protected]
And now, a PLS Regression in JMP!
• JMP is a sister sorware of SAS
• JMP is a very good point-‐and-‐click interface for complex analy<cs and sta<s<cal modelling
• JMP generates very good reports and visualiza<on of data

Go to JMP demonstra<on
Copyright © 2012 Predictum Inc. All Rights Reserved www.predictum.com / [email protected]
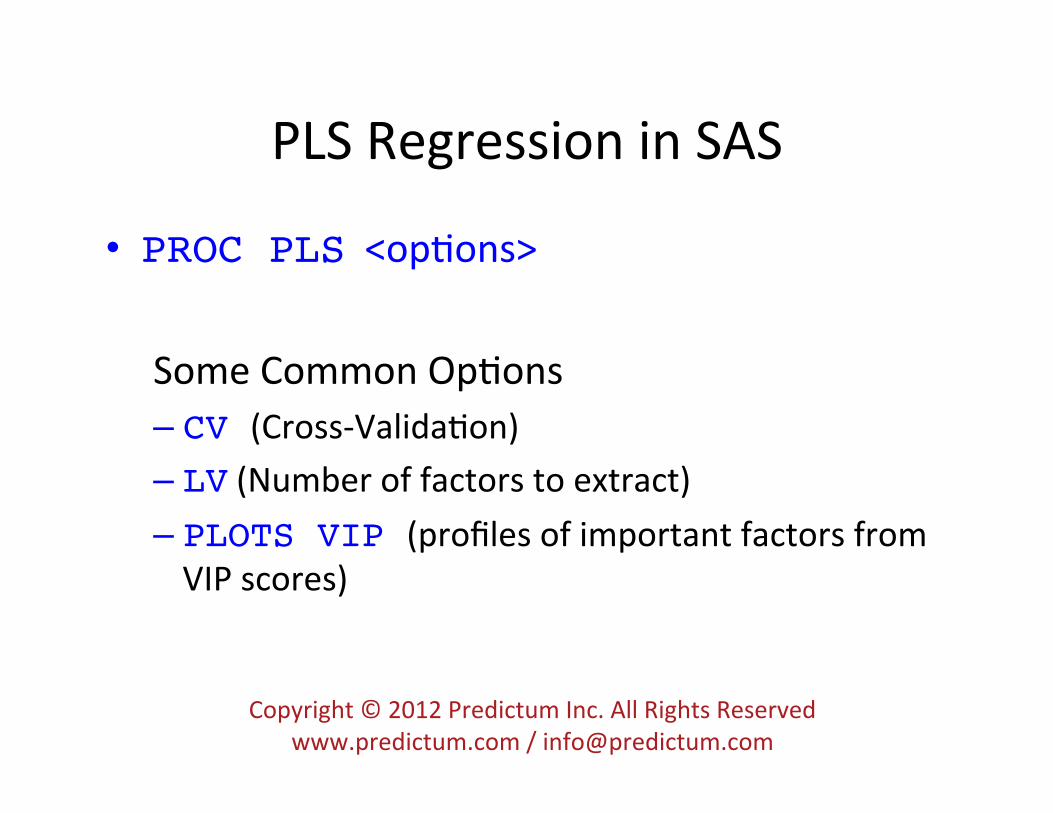
PLS Regression in SAS
• PROC PLS <op<ons> Some Common Op<ons – CV (Cross-‐Valida<on) – LV (Number of factors to extract) – PLOTS VIP (profiles of important factors from VIP scores)

Copyright © 2012 Predictum Inc. All Rights Reserved www.predictum.com / [email protected]
PLS Regression in SAS
• Use Model statement to list responses and predictors
• MODEL response = predictors!– Useful op<on: !SOLUTION (coefficients)

Copyright © 2012 Predictum Inc. All Rights Reserved www.predictum.com / [email protected]
PROC PLS!
Note on terminology: • SAS output refers to extracted factors as
latent variables!

Copyright © 2012 Predictum Inc. All Rights Reserved www.predictum.com / [email protected]
Summary
• Par<al least squares regression – a very large set of X variables and Y variables – X variables are highly correlated – fewer observa<ons than X variables
• Use variable importance for projec<on (VIP) scores for variable selec<on
Copyright © 2012 Predictum Inc. All Rights Reserved www.predictum.com / [email protected]
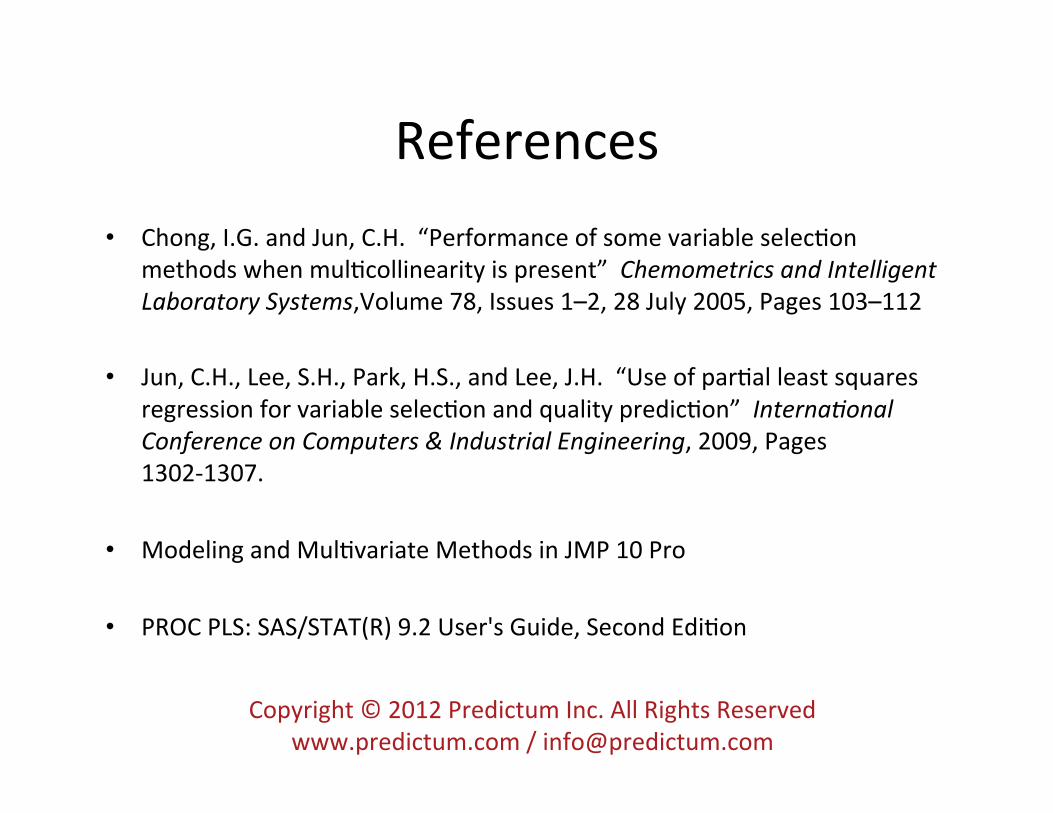
References • Chong, I.G. and Jun, C.H. “Performance of some variable selec<on
methods when mul<collinearity is present” Chemometrics and Intelligent Laboratory Systems,Volume 78, Issues 1–2, 28 July 2005, Pages 103–112
• Jun, C.H., Lee, S.H., Park, H.S., and Lee, J.H. “Use of par<al least squares regression for variable selec<on and quality predic<on” Interna;onal Conference on Computers & Industrial Engineering, 2009, Pages 1302-‐1307.
• Modeling and Mul<variate Methods in JMP 10 Pro
• PROC PLS: SAS/STAT(R) 9.2 User's Guide, Second Edi<on
Copyright © 2012 Predictum Inc. All Rights Reserved www.predictum.com / [email protected]
Acknowledgements
• JMP and SAS Technical Support – Jonathan Gatlin – Sue Walsh – Kathleen Kiernan – Chris Gotwalt – Duane Hayes
Copyright © 2012 Predictum Inc. All Rights Reserved www.predictum.com / [email protected]
Acknowledgements
• Diana Ballard – Senior Consul<ng Sta<s<cian

Copyright © 2012 Predictum Inc. All Rights Reserved www.predictum.com / [email protected]
Acknowledgements • Wayne Levin – President

Copyright © 2012 Predictum Inc. All Rights Reserved www.predictum.com / [email protected]
A JMP course on machine learning is available upon request. Please contact Predictum for further informa<on.
www.predictum.com [email protected]