Tasmania's Energy Sector – an Overview
106
Electricity Supply Industry Expert Panel Tasmania’s Energy Sector – an Overview Discussion Paper April 2011
Transcript of Tasmania's Energy Sector – an Overview

Electricity Supply Industry Expert Panel
Tasmania’s Energy Sector – an Overview
Discussion Paper
April 2011

Tasmania’s Energy Sector – an Overview
Discussion Paper
Electricity Industry Panel - Secretariat
GPO Box 123 Hobart TAS 7001 Telephone: (03) 6232 7123 Email: [email protected] http://www.electricity.tas.gov.au
April 2011
© Copyright State of Tasmania, 2011

Tasmania’s Energy Sector – an Overview
Table of Contents GLOSSARY ........................................................................................................................... 5
Foreword ..................................................................................................................................... 1
1. Highlights ............................................................................................................................. 3
2. Energy in Tasmania ............................................................................................................ 9
3. Tasmania’s demand for energy .................................................................................... 12
3.1. Electricity Demand ................................................................................................... 12
3.1.1. Residential demand ......................................................................................... 17
3.1.2. Commercial / Industrial demand................................................................... 21
3.1.3. Major industrial demand ................................................................................. 22
3.2. Natural Gas Demand .............................................................................................. 25
3.2.1. Residential demand ......................................................................................... 25
3.2.2. Commercial / Industrial demand................................................................... 26
3.2.3. Major industrial demand ................................................................................. 26
4. Tasmania’s supply of energy ......................................................................................... 28
4.1. Electricity Supply ....................................................................................................... 28
4.1.1. Generation ......................................................................................................... 30
4.1.2. Flows across Basslink ......................................................................................... 40
4.1.3. Transmission and Distribution ........................................................................... 43
4.1.4. Electricity Retailing ............................................................................................ 51
4.2. Natural Gas Supply .................................................................................................. 57
4.2.1. Production and processing ............................................................................. 57
4.2.2. Transmission and Distribution ........................................................................... 57
4.2.3. Natural Gas Retail ............................................................................................. 58
4.2.4. Market arrangements ...................................................................................... 60
5. Energy Pricing ................................................................................................................... 61
5.1. Composition of electricity bills................................................................................ 61
5.2. Comparative electricity pricing ............................................................................. 62
5.2.1. Comparative electricity costs - residential ................................................... 62
5.2.2. Comparative electricity costs – small business ............................................ 63

5.2.3. Comparative electricity costs – business & commercial customer ......... 63
5.2.4. Major industrial pricing ..................................................................................... 64
5.2.5. Aurora Pay As You Go ..................................................................................... 65
5.2.6. Price rises ............................................................................................................ 66
5.3. Natural Gas Pricing .................................................................................................. 67
5.3.1. Composition of natural gas bills ..................................................................... 68
5.3.2. Comparative gas pricing ................................................................................ 69
5.4. Concessions ............................................................................................................... 70
5.4.1. Pensioner discount ............................................................................................ 70
5.4.2. Life support discount ........................................................................................ 71
5.4.3. Financial hardship assistance ......................................................................... 72
5.4.4. Disconnections .................................................................................................. 73
6. Performance ..................................................................................................................... 76
6.1. Generation ................................................................................................................ 77
6.1.1. Availability .......................................................................................................... 77
6.1.2. Adequacy .......................................................................................................... 78
6.2. Transmission ............................................................................................................... 78
6.2.1. Transmission network reliability ........................................................................ 78
6.2.2. Transmission plant availability ......................................................................... 79
6.3. Distribution ................................................................................................................. 80
Appendix 1 ............................................................................................................................... 83
Appendix 2 ............................................................................................................................... 86
Appendix 3 ............................................................................................................................... 97

GLOSSARY TERM MEANING WITHIN THE CONTEXT OF THIS REPORT
ABARE Australian Bureau of Agricultural and Resource Economics
AEMC Australian Energy Market Commission
AEMO Australian Energy Market Operator
AER Australian Energy Regulator
AETV Aurora Energy Tamar Valley Pty Ltd
APAYG Aurora Pay As You Go
BBPS Bell Bay Power Station
BPL Basslink Pty Ltd
BSI Bass Strait Islands
CAIDI Customer Average Interruption Duration Index
CSAA Community Services Activity Agreement
CSO Community Service Obligation
ESI Energy Supply Industry
ESI Act Electricity Supply Industry Act 1995 (TAS)
ESI Regulations Electricity Supply Industry (Network Performance Requirements) Regulations 2007
FRC Full Retail Contestability
GJ Gigajoule
GWh Gigawatt hour (=1 thousand MWh or 1 million kWh)
HEC Hydro Electric Corporation / Commission / Department
kWh Kilowatt Hour (= 1kW used continuously for 1 hour)
LNG Liquefied Natural Gas
LOS Loss Of Supply

TERM MEANING WITHIN THE CONTEXT OF THIS REPORT
MJ Megajoule
MW Megawatt
MWh Megawatt Hour (= 1 thousand kWh)
MNSP Market Network Service Provider
N/A Not Available or Not Applicable
NECF National Energy Customer Framework
NEM National Electricity Market
NEMMCO National Electricity Market Management Company (now AEMO)
NER National Electricity Rules
OECD Organisation for Economic Co-operation and Development
OTTER Office of The Tasmanian Energy Regulator
RoLR Retailer of Last Resort
RRPGP Renewable Remote Power Generation Program
SAIDI System Average Interruption Duration Index
SAIFI System Average Interruption Frequency Index
SPS System Protection Scheme
TEC Tasmanian Electricity Code
TGN TasGas Networks
TGR TasGas Retail

1 | P a g e
Energy Sector Overview Foreword
Foreword In October 2010, the Tasmanian Parliament passed legislation (The Electricity Supply Industry Act 2010) to establish an independent expert panel to conduct an investigation into, and provide guidance to Parliament on, the current position and future development of Tasmania’s electricity industry. As part of the review process, the Panel is releasing a series of Discussion Papers that are intended to foster a shared understanding of the electricity industry’s past and present, as a precursor to considering the industry’s future.
The purpose of this Discussion Paper is to present a description of the contemporary energy market in Tasmania. The paper examines the demand and supply sides of the Tasmanian energy market and provides comparative information with other jurisdictions to place Tasmania’s energy sector into a wider context (see Appendix 1). The Paper also provides a brief overview of how the Tasmanian electricity industry now functions under the National Electricity Market arrangements (see Appendix 2). The paper focuses on mainland Tasmania. A high-level summary of arrangements on the Bass Strait Islands has been included in Appendix 4 for completeness.
Two additional Discussion Papers have also been released by the Panel. They explain:
the drivers behind changes in the price of electricity in Tasmania over the last decade; and
key structural and infrastructure investment decisions over the past 15 years and the policy intent behind these decisions, as a preview to the Panel examining the extent to which those objectives have, or are being, achieved.
The Panel’s intention in developing these three Discussion Papers is to provide an information base on which the Review can be founded. The Papers highlight some of the areas of investigation the Panel will be exploring during the Review, as well as providing a starting point for discussions with interested parties. Stakeholders are encouraged to engage with the Panel through lodging submissions by Friday 6th May 2011 on matters arising from information contained in the Discussion Papers, or on other issues they consider the Panel should address within its Terms of Reference.
2 | P a g e
Energy Sector Overview Foreword
At a later stage in the Review, the Panel anticipates releasing at least two further Discussion Papers that:
examine the efficiency and effectiveness of the Tasmania’s Government-owned electricity entities; and
explore the financial performance of those entities.
The Panel has a significant body of analytical work to progress with the Tasmanian electricity entities before these papers can be developed.
Of necessity, this Paper is aimed at a wide audience, including industry, government and the broader community. It draws together and condenses information from various sources into one easily accessible publication. For readers wishing to develop a more detailed understanding of the electricity industry, and Tasmania’s energy sector more generally, references are provided throughout this paper to a range of publically available documents that offer more detailed explanations than the information presented in this paper.
The Panel’s intention in releasing these Discussion Papers is to:
provide a backdrop to underpin the early work of the Panel; stimulate the discussion of issues that interest parties believe the Panel should be
considering in addressing its Terms of Reference; and to flag some of the themes that the Panel will be considering further through the
Review.
Accordingly, the Panel would welcome submissions on issues arising from the material contained in this Discussion Paper by 6 May 2011 – these will be of assistance in framing the Panel’s Issues Paper, which is expected to be released in May 2011.
John Pierce Chairman Electricity Supply Industry Expert Panel
3 | P a g e
Energy Sector Overview Highlights
1. Highlights This Discussion Paper presents a description of the contemporary energy market in Tasmania. It examines the demand and supply sides of the Tasmanian energy market and provides a brief overview of how the Tasmanian electricity industry now functions within the National Electricity Market (NEM). The paper also provides comparative information with other jurisdictions.
Energy Demand Highlights Twenty large industrial customers account for around 60 per cent of Tasmania’s
electricity consumption, including four major industrial users that, between them, use around half of the energy supplied by the Tasmanian power system. The balance of consumption is broadly shared equally between the rest of the commercial and industrial sector and the residential/small business sector. This is a significantly more concentrated demand profile than elsewhere in Australia.
With slow population growth, growth in the demand for energy trails other markets in Australia, with the Tasmanian economy becoming less energy intensive over time. This has consequences for the potential for expansion of the Tasmanian energy market.
Tasmania’s demand/supply balance could change markedly as a result of commercial decisions made by the State’s four major electricity users.
Tasmanian households typically use more electricity than their interstate counterparts. While increased take-up of natural gas may change this equation for customers with access to the gas reticulation network, for the majority of households this is unlikely to change without significant investment in the gas network. To date, the roll-out of the gas network has required Government funding support.
The take up of natural gas in Tasmania has been growing, but natural gas still supplies Tasmania with only around five per cent of the energy supplied by electricity and represents a relatively small proportion of total energy consumption. Like the electricity sector, a small number of large users account for a large share of total natural gas usage in Tasmania. Residential customers consume around 15 per cent of the total State use.

4 | P a g e
Energy Sector Overview Highlights
Electricity Generation Highlights Tasmania’s electricity generation continues to be dominated by hydro
electricity, which accounts for 81 per cent of the installed capacity in the State.
The annual demand for electricity in Tasmania consistently exceeds the level that the State’s existing hydro-generation system is able to meet sustainably, meaning that alternative sources of supply are required to meet Tasmania’s demand for electricity.
With the completion of the Tamar Valley Power Station by Aurora Energy in 2009, Tasmania now has access to large-scale gas-fired electricity, with a total capacity of 387MW.
All of the large-scale generators in Tasmania are owned by the State Government, although the large-scale wind farms do have part private investment. This is different from other regions in the NEM.
Tasmania’s ability to generate electricity is constrained by the availability of water, rather than the capacity of its power stations, as is the case interstate. The yield from the State’s water catchments and storages is subject to significant variability and unpredictability.
Despite investments by Hydro Tasmania in improving the efficiency of its generation assets, the sustainable production level of the hydro system has been downgraded materially over the past 15 years, most recently in 2007, when the system’s sustainable annual yield was downgraded by more than ten per cent.
Tasmania’s interconnection with the NEM enables interstate generators to supplement Tasmania’s generation, while providing opportunities for on-island generators to export electricity, particularly at times of peak demand (and prices) interstate. Tasmania’s seasonal load profile, which is different with other parts of the NEM, creates opportunities for trading electricity.
Basslink will trade in both directions throughout a year in response to instantaneous market outcomes in the Victorian and Tasmanian regions of the NEM. The principal driver of the net trade (to or from Tasmania ) over time is the on-island supply/demand balance. Changes in hydrological conditions are the primary drivers, but step changes in either demand (such as the loss of a major customer) or supply (such as the commissioning of new generation facilities) will also shift the net trading position of the link.
In addition to its hydro-electric schemes, Hydro Tasmania has an ownership interest in two wind farms, which represents a further five per cent of the State’s generation capacity. With a total ownership interest in 86 per cent of installed generation, this level of concentration of ownership is highly unusual in the NEM. The Panel is examining the impact of this concentration of ownership as a part of its Review.

5 | P a g e
Energy Sector Overview Highlights
The climate drives large changes in Hydro Tasmania’s production capability. Coupled with the small number of very large customers in Tasmania, the potential variability in supply and demand in Tasmania sets it apart from other NEM regions. This is likely to have implications for perceptions of risk in the Tasmanian market and could have an impact on the attractiveness of investment in the electricity sector in the State. This is a matter that the Panel is considering as a part of its Review.
Energy Networks Highlights The electricity transmission and distribution networks in Tasmania are substantial
business undertakings. Combined, they account for around $400 million in annual costs to Tasmanian electricity customers in 2009-10. Both are owned and operated by Tasmanian Government-owned companies, Transend Networks and Aurora Energy.
The State’s gas transmission and distribution networks are owned by the private sector, and were developed during the first decade of the 2000s.
By national standards, the electricity and gas networks are relatively small.
The economic regulation of the electricity transmission and distribution networks in Tasmania is the responsibility of the Australian Economic Regulator (AER). The AER undertakes 5-yearly comprehensive reviews of each network business and determines the allowable revenue that the network business are able to charge, which the businesses translate into network prices.
The gas network is unregulated from a pricing perspective.
There has been substantial investment in the electricity transmission and distribution networks since the network companies were established in 1998. The impact that this investment has had on electricity prices is the subject of further work by the Panel.
Basslink is owned and operated independently of the general transmission network. Unlike other regional interconnectors within the NEM, Basslink obtains its revenues from the operation of the NEM’s spot market, rather than regulated transmission charges. That revenue is accrued by Hydro Tasmania, in exchange for the payment of an annual facility fee to Basslink’s owners. Tasmanian electricity customers do not directly pay for Basslink.
Electricity Retailing Highlights Currently customers consuming more than 150 MWh per year can choose their
electricity retailer, and from 1 July 2011, this limit will be reduced to 50 MWh per year. Smaller business and residential customers will continue to be supplied exclusively by Aurora Energy under regulated tariffs.
6 | P a g e
Energy Sector Overview Highlights
There are five licensed electricity retailers in Tasmania. Currently only two – ERM Power and Aurora Energy - are active in the market for customers of less than 4 GWh per annum. The Panel is seeking to identify the strength of competition of various customer levels, and identify reforms that could enhance it.
Consumers of natural gas are able to choose their retailer, regardless of consumption levels. The retail price of natural gas is not subject to price regulation. There are currently two registered natural gas retailers – TasGas Pty Ltd and Aurora Energy.
The introduction of full retail contestability in electricity was assessed by OTTER in 2008. OTTER concluded that if implemented in a prudent manner, full retail contestability would offer sufficient long-term benefits to justify its implementation.
The Regulator concluded that the ability of new retailers to provide effective retail competition is partly a function of their ability to secure differing and competitive wholesale electricity arrangements. This is a key matter that the Panel is examining as a part of the Review.
The high proportion of households which are provided with subsidised electricity through pensioner concession potentially further reduces the size of the residential market likely to be targeted by new entrant retailers. The Panel will explore the factors that drive the attractiveness (or otherwise) of the Tasmanian retail market with retailers as a part of the Review.
Pricing Highlights Distribution and transmission charges represent nearly 50 per cent of the costs
embedded in the electricity bills paid by Tasmanian non-contestable customers, which is more than the wholesale cost of the electricity consumed.
As has been the case across Australia, electricity prices in Tasmania have increased significantly in recent years. The Panel has published more detailed information on the drivers of these price increases in its Discussion Paper “Tasmanian Electricity Pricing Trends”.
Residential tariffs in Tasmania have higher fixed daily charges and lower average energy rates than their equivalents interstate.
Residential customers typically incur per kWh electricity costs in the mid to low range of Australian prices, with the exception of low consumption residential customers, who incur an average per kWh cost for their electricity which is in the high range of that experienced across Australia.
Higher levels of electricity consumption in Tasmania also contribute to higher levels of expenditure on electricity for businesses and households in Tasmania relative to interstate counterparts.

7 | P a g e
Energy Sector Overview Highlights
The electricity concessions available in Tasmania are some of the most generous in Australia, with generally broader eligibility criteria.
Just over a third of residential customers in Tasmania receive the concession, resulting in effective prices for their electricity which are in the low range of that paid elsewhere in Australia, even though their total bills may still be relatively high as a result of the amount of electricity they consume.
The State Government funded electricity concessions have cost a total of $147 million over the last decade.
Small business customers with very low annual consumption incur electricity costs in the low to mid range of the rates available in other states and territories, while business customers with average to high consumption of electricity pay some of the highest electricity prices in Australia.
Larger business customers in Tasmania have access to prices in the mid range of those available across Australia.
Performance Highlights The performance of electricity systems is measured against a range of factors
including the reliability, quality and security of electricity supply.
Hydro-electric generation is inherently more reliable than other forms of generation, such as coal fired thermal technology, and Tasmania typically experiences less planned and unplanned generation outages than other states, and experiences levels of reliability which are comparable with major hydro schemes in the UK and North America.
Unlike thermal generation, the availability of hydro-electric generation is impacted on by the availability of ‘fuel’ (water).
Despite Hydro Tasmania derating its system, Tasmania’s total generation capacity is still considered by the Australian Energy Market Operator and Transend to be adequate until at least 2020, and possibly until late in the following decade.
Transmission network performance is measured in terms of loss of supply and availability of transmission plant. Transend Networks generally achieves its key performance targets for the transmission system; with the trend being a reduction in loss of supply events, although 2009-10 saw an increase in the number of these events.
Reliability of distribution is measured by looking at the number of interruptions, their average duration and the average total time every year that customers experience a lack of supply. Measures of reliability are susceptible to the impact of contingency events, such as extreme weather.

8 | P a g e
Energy Sector Overview Highlights
In 2009-10, the performance of the distribution network fell short of the required Tasmanian Electricity Code (TEC) standards at the compliance level of individual communities. The standards for frequency and/or duration of interruptions were not met for 35 of the 101 designated communities in the distribution system.
In 2009-10, Tasmania’s overall electricity reliability ranked fourth compared to other Australian jurisdictions. However, the Tasmanian Economic Regulator considers that Aurora’s performance is generally what would be expected given the relative area and topography of the State.

9 | P a g e
Energy Sector Overview Energy in Tasmania
2. Energy in Tasmania Tasmania began embracing the then new technology of electricity in the mid-1880s, ahead of most of the industrially developing western world and not long after Thomas Edison commissioned the first power station servicing central New York. The State’s first public hydro-electric scheme, the Launceston City Council’s Duck Reach Power Station, was switched on in December 1895 and by the late 1930s, most households on mainland Tasmania were connected to electricity1.
Since then, Tasmania’s energy needs, other than for transport, have predominantly been met by electricity. In 2011, electricity continues to provide more of the energy used by Tasmanian households and businesses than any other fuel.
On a per capita basis, Tasmania generates and uses more electricity than any other state or territory of Australia. In fact, were it a nation in its own right, Tasmania would rank amongst the top six countries in the world in terms of the amount of electricity it generates per capita. As shown in Chapter 3, Tasmanian households use electricity differently than their interstate counterparts, and Tasmania is still the only state or territory that generates its power primarily from renewable sources.
The electricity industry is also of fundamental importance to Tasmania and its economy. It makes a significant contribution to the economy in its own right through employment, investment and the payment of dividends, taxes and guarantee fees to the State Government. In 2009-10, the three major electricity supply industry entities operating in the State, Hydro Tasmania, Transend Networks and Aurora Energy, directly employed 2 521 people2, or 1.1 per cent of Tasmania’s labour force3 and contributed $49.3 million to the State Budget.
Historically, a number of major export-orientated industries have established themselves in Tasmania because of the availability of low-cost electricity. The price and reliability of the supply of electricity remain critical to the economic performance of the Tasmanian economy.
1 The companion to Tasmanian history – Electricity, Roger Lupton, 1999 2 Tasmanian Energy Supply Industry Performance Report 2009-10, OTTER 3 Labour Force, Australia, Cat No 6202.0., Australian Bureau of Statistics

10 | P a g e
Energy Sector Overview Energy in Tasmania
Tasmania’s energy sector has undergone significant change during the last two decades. The State’s previous monopoly electricity supplier, the Hydro Electric Commission (HEC), has been divided into three separate businesses, specialising in different sectors of the electricity industry, and the regulation of the energy sector is independent of the players in it and the Government. Tasmania has become connected to mainland energy markets by gas and electricity transmission facilities (the Tasmanian Natural Gas Project and Basslink respectively). The State has adopted the National Electricity Market (NEM) arrangements (see Appendix 2), thereby opening up competition in electricity generation. Competition at the retail level has been progressively implemented so that many business customers now have a choice in their retailer of electricity.
Some aspects of the energy sector have seen much less change. While the electricity supply industries in other states and territories have, to varying degrees, seen the emergence of private sector involvement, the Tasmanian electricity market, as it has been since the formation of the Hydro Electric Department in 1914, continues to be largely characterised by public ownership. Furthermore the dominance of the State’s electricity consumption by a handful of major industrial users is largely as it was five decades ago.
The story of electricity in Tasmania contrasts markedly with that of the State’s nascent natural gas industry.
Natural gas has only been available in Tasmania for a relatively short time, with Tasmania’s first commercial and residential consumers being connected in 2004. Since the rollout of gas to domestic and small to medium sized commercial customers in the State’s north, northwest and south began, just over 8 7004 customers have connected to the distribution system. Whereas 98 per cent5 of Tasmanian households are connected to the State’s electricity grid, the gas reticulation network runs past 43 000 properties with less than 20 per cent of those connected. And in 2009-10, the total amount of natural gas delivered to customers was the equivalent of around five per cent of the electricity consumed in Tasmania6.
4 TasGas Networks 5 Environmental Issues: Energy Use and Conservation, March 2008, Australian Bureau of
Statistics 6 Tasmanian Energy Supply Industry Performance Report 2009-10, OTTER

11 | P a g e
Energy Sector Overview Energy in Tasmania
The development of a natural gas supply for the State has, like the growth of Tasmania’s electricity supply industry, been underpinned by the demand for energy from a small number of large commercial and industrial enterprises. The introduction of natural gas in Tasmania, however, has charted a very different course than electricity, characterised by private sector involvement and funding, a joint public-private sector rollout of the distribution network, full retail contestability and the complete absence of pricing regulation.
The broad thrust of electricity reforms has been to increase competition and user choice, coupled with enhanced regulation to ensure customers face prices that reflect efficient business operations. Nonetheless, electricity prices increased steadily during the 2000’s and further pricing pressures remain, including grappling with ageing infrastructure, the emerging challenges of a carbon-constrained economy and the possibility of further pressure on the State’s hydroelectric generation systems as a result of the volatility of rainfall.
In this sense, while the major structural changes in the energy sector are no longer new, the sector remains in a state of flux. The Panel’s task is to review the path the sector has taken in recent years, examine the outcomes that are being delivered and what is driving those outcomes. The Panel will also make recommendations on the way forward to give greater confidence that the broad energy policy objectives for the sector are delivered.

12 | P a g e
Energy Sector Overview Tasmania’s demand for energy
3. Tasmania’s demand for energy
3.1. Electricity Demand
The total demand for electricity on mainland Tasmania is typically around 10 800 GWh per annum7. This represents 4.9 per cent8 of total electricity consumption in the NEM9. Of that, around 60 per cent (approximately 6 500 GWh) is attributable to a group of 20 large industrial customers, with the remainder being accounted for by approximately 45 00010 business and 227 000 residential customers.
Average electricity consumption per customer in Tasmania11 for the year ended 30 June 2010 was 38.7 MWh, a marginal decrease on the previous year’s 38.8 MWh average11. If large industrial customers are excluded, average electricity consumption in Tasmania falls to around 17 MWh per customer, comparable to the average levels in mainland states where consumption is not dominated by small number of large users.
The demand for electricity in Tasmania is seasonal, with peak demands ranging from around 1 300 MW in the middle of summer to just under 1 900 MW in winter. Of that, around 700 MW is attributable to the aforementioned major industrial users, meaning that Tasmania’s winter peak in demand is mainly due to the electricity used for space and water heating. In other states and territories peak demand occurs in summer.
Based on electricity consumption data compiled by the Australian Bureau of Agricultural and Resource Economics (ABARE), by 2008-09 Tasmania’s electricity consumption had increased by 51 per cent since 1980. While clearly not insignificant, Tasmania’s increase in demand is by far the least of any state or territory. Demand for electricity in every other state and territory at least doubled during the same period, with demand in Queensland and Western Australia quadrupling (see Figure 1)
7 Tasmanian Energy Supply Industry Performance Report 2009-10, OTTER 8 State of the Energy Market 2010, Australian Energy Regulator 9 South Australia, Tasmania, Victoria, New South Wales, Australian Capital Territory and
Queensland 10 Tasmanian Energy Supply Industry Performance Report 2009-10, OTTER 11 ibid

13 | P a g e
Energy Sector Overview Tasmania’s demand for energy
The increases experienced in most states are partly explained by population growth. Queensland’s population grew by 93 per cent and Western Australia’s increased by 77 per cent between 1980-81 to 2009-10 compared with 19 per cent for Tasmania. The full extent of the increases in demand for electricity, however, reflects wider national and international economic factors.
Figure 1- Growth in consumption of electricity by state
0
10 000
20 000
30 000
40 000
50 000
60 000
70 000
80 000
90 000
GWh
New South Wales
Victoria
Queensland
Western Australia
South Australia
Tasmania
Northern Territory
SOURCE: Australian Bureau of Agricultural and Resource Economics (ABARE)
As part of its forward planning processes Transend Networks, the operator of the State’s extra high voltage transmission network, prepares forecasts of Tasmania’s future electricity requirements and maximum demand, across low, medium and high growth scenarios.
Transend Networks’ most recent estimates for the period 2010 to 2024 project the following scenarios:
Low growth: an average of 0.47 per cent per annum reduction in consumption, based on a lower forecast for industrial customers and assumptions on major reductions in their future energy consumption, plus an average increase in winter maximum demand of 0.71 per cent per annum.
Medium growth: average annual growth in electrical energy sales of 0.82 per cent and a 1.71 per cent average increase in the level of maximum demand during winter.

14 | P a g e
Energy Sector Overview Tasmania’s demand for energy
High growth: average consumption growth of 2.11 per cent per annum and an increase in winter maximum demand of 2.74 per cent, due to more favourable economic conditions, along with a considerable increase in energy growth in 2019-20 due to assumptions regarding the connection of a new direct connect customer to the Tasmanian network in 2018.
All three scenarios assume that the State’s four major industrial users of electricity continue production in Tasmania. Projected scenarios are shown in Figure 2, below.
Figure 2 - Forecast of total Tasmanian electrical energy sales from 2010 to 2024
SOURCE: 2010 Annual Planning Report, Transend Networks
On this basis, Transend Networks formed the view that Tasmania’s existing generation capacity, together with Basslink southwards flows, will be sufficient to meet forecast maximum demand until 2028.
This contrasts with forecasts of the demand for electricity in other parts of Australia. The Australian Energy Market Operator (AEMO) has estimated that installed and committed generation capacity, excluding wind, across the NEM as a whole will be sufficient to meet projected peak demand and reliability requirements until only 2013-14. 12 Beyond that, AEMO’s assessment is that the ability of the market to meet reliability requirements may require some proposed generation projects to come online.
12 State of the energy market 2010, Australian Energy Regulator

15 | P a g e
Energy Sector Overview Tasmania’s demand for energy
Queensland was forecast to require new generation investment by 2013-14 in addition to that already committed, Victoria and South Australia by 2015-16, and New South Wales by 2016-7. AEMO expected Tasmania to have adequate capacity until at least 2019-20 (under low, medium and high economic growth scenarios). 13 Figure 3 illustrates the average growth forecasts developed by AEMO for each region within the National Electricity Market, and the NEM as a whole, between 2010 and 2020. The forecasts are those prepared under AEMO’s medium economic growth scenario, with the growth rate forecast for Tasmania’s energy consumption falling in between the low and medium growth forecasts developed by Transend Networks.
Figure 3 – Average annual growth in energy consumption and maximum demand until 2019-20
QLD NSW VIC SA TAS NEM TAS forecast*
Energy Consumption 3.90% 1.80% 1.00% 0.90% 0.60% 2.10% 0.82% Summer Max Demand 4.10% 2.60% 2.00% 1.40% 1.00% 2.60% 1.21% Winter Max Demand 4.20% 2.30% 1.30% 1.40% 1.00% 2.50% 1.71%
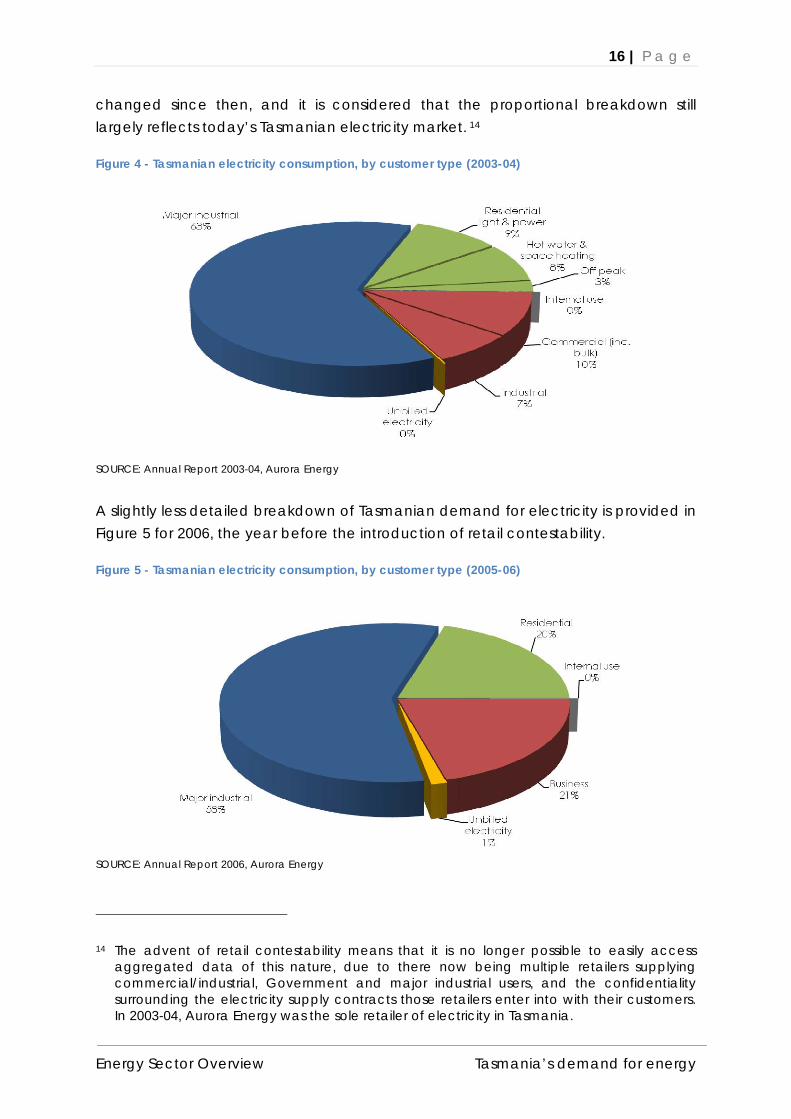
Source: Electricity Statement of Opportunities 2010, Australian Energy Market Operator *2010 Annual Planning Report, Transend Networks Note: Transend Networks’ forecasts are for the period 2010 - 2024 Figure 4 shows the proportion of electricity used in Tasmania across a number of customer categories. The breakdown is based on data from 2003-04, the most recent year for which such a summary has been published. It is understood that the portion of consumption between different customer categories for electricity has not
13 2010 electricity statement of opportunities for the National Electricity Market, Australian Energy Market Operator
16 | P a g e
Energy Sector Overview Tasmania’s demand for energy
changed since then, and it is considered that the proportional breakdown still largely reflects today’s Tasmanian electricity market. 14
Figure 4 - Tasmanian electricity consumption, by customer type (2003-04)
SOURCE: Annual Report 2003-04, Aurora Energy
A slightly less detailed breakdown of Tasmanian demand for electricity is provided in Figure 5 for 2006, the year before the introduction of retail contestability.
Figure 5 - Tasmanian electricity consumption, by customer type (2005-06)
SOURCE: Annual Report 2006, Aurora Energy
14 The advent of retail contestability means that it is no longer possible to easily access aggregated data of this nature, due to there now being multiple retailers supplying commercial/industrial, Government and major industrial users, and the confidentiality surrounding the electricity supply contracts those retailers enter into with their customers. In 2003-04, Aurora Energy was the sole retailer of electricity in Tasmania.
17 | P a g e
Energy Sector Overview Tasmania’s demand for energy
3.1.1. Residential demand While residential consumers represent just over 80 per cent of electricity customers in Tasmania (227 00015 households in 2009-10) they consume only around 20 per cent of the State’s electricity. 16
Households utilise electricity for a range of purposes such as cooking, heating and cooling, water heating, lighting and operating appliances. Average household energy consumption in Australia is increasing, driven by growth in the number of appliances per household and bigger homes.
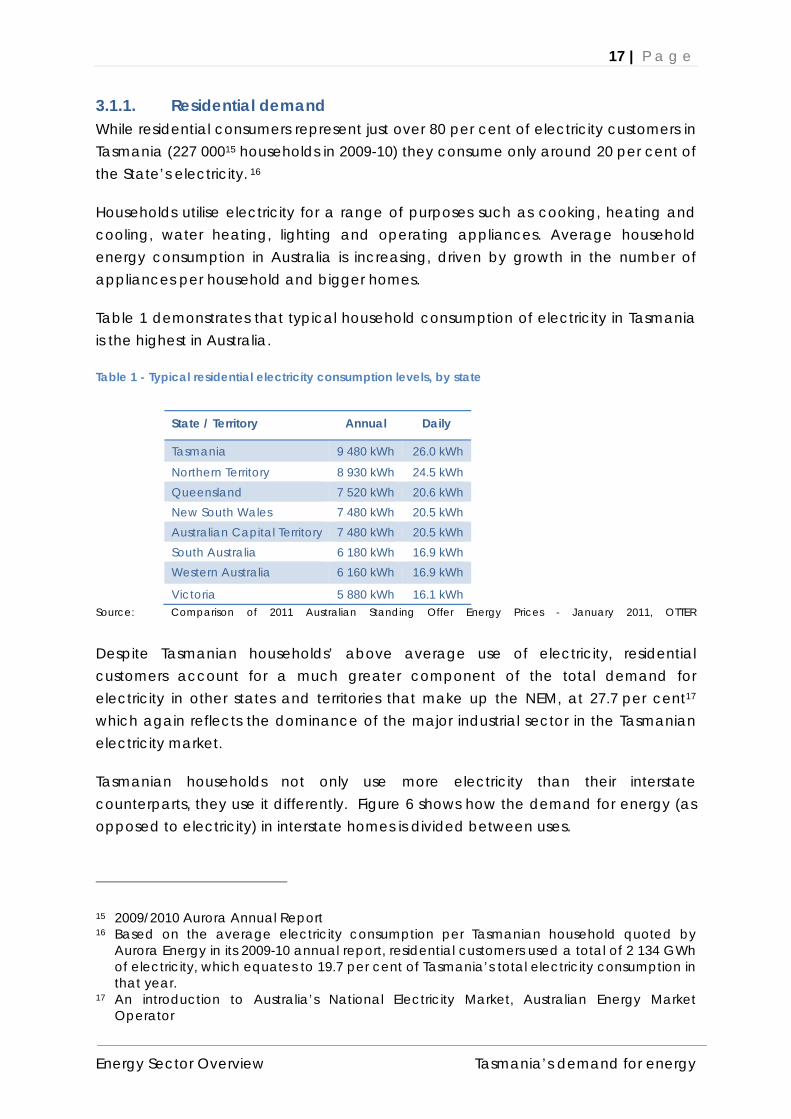
Table 1 demonstrates that typical household consumption of electricity in Tasmania is the highest in Australia.
Table 1 - Typical residential electricity consumption levels, by state
State / Territory Annual Daily
Tasmania 9 480 kWh 26.0 kWh
Northern Territory 8 930 kWh 24.5 kWh Queensland 7 520 kWh 20.6 kWh New South Wales 7 480 kWh 20.5 kWh Australian Capital Territory 7 480 kWh 20.5 kWh South Australia 6 180 kWh 16.9 kWh Western Australia 6 160 kWh 16.9 kWh
Victoria 5 880 kWh 16.1 kWh Source: Comparison of 2011 Australian Standing Offer Energy Prices - January 2011, OTTER Despite Tasmanian households’ above average use of electricity, residential customers account for a much greater component of the total demand for electricity in other states and territories that make up the NEM, at 27.7 per cent17 which again reflects the dominance of the major industrial sector in the Tasmanian electricity market.
Tasmanian households not only use more electricity than their interstate counterparts, they use it differently. Figure 6 shows how the demand for energy (as opposed to electricity) in interstate homes is divided between uses.
15 2009/2010 Aurora Annual Report 16 Based on the average electricity consumption per Tasmanian household quoted by
Aurora Energy in its 2009-10 annual report, residential customers used a total of 2 134 GWh of electricity, which equates to 19.7 per cent of Tasmania’s total electricity consumption in that year.
17 An introduction to Australia’s National Electricity Market, Australian Energy Market Operator

18 | P a g e
Energy Sector Overview Tasmania’s demand for energy
Figure 6- Household energy use, national
Source: Your home technical manual, Australian Greenhouse Office
In Tasmania, however, the breakdown of household electricity consumption18 is markedly different, with a greater emphasis on space heating. (See Figure 7)
Figure 7 - Household energy use, Tasmania
Source: The Power of Nature, Hydro Tasmania
Reflecting the dominance of electric hot water and space heating in Tasmania, around 80 per cent of Tasmanian residential customers are supplied under a combination of light and power, and hot water, tariffs. About six per cent of Tasmanian tariff customers take supply under a ‘light and power’ tariff only.
18 The power of nature – Tasmania’s renewable energy from water and wind, Hydro Tasmania

19 | P a g e
Energy Sector Overview Tasmania’s demand for energy
Approximately 15 per cent of customers are also supplied with off-peak electricity in addition to, or as a substitute for, Aurora Energy’s hot water tariff. 19 Tasmania’s higher than average household consumption of electricity is generally attributed to a number of factors, including the State’s colder climate and the limited availability and market penetration of natural gas for domestic cooking, space heating and water heating. As can be seen in Figure 8, while a significant proportion of households in other states with at least one heater in use, with the clear exception of Queensland, report using space heating for between three and six months of the year, Tasmania’s climate means that 38 per cent of households use heating for more than six months of the year.
Figure 8 - Residential space heating - months of use (per annum)
Source: Environmental Issues: Energy Use and Conservation, Mar 2008, Australian Bureau of Statistics
With space heating representing a major use of energy in Tasmanian households, electricity’s share of the residential energy market is also in no small part due to the efforts of the HEC and subsequently Aurora Energy to actively pursue the residential space heating market, which began in 1992 with the introduction of a combined hot-water and space heating tariff, originally marketed as HydroHeat.
At the time, the availability of a lower rate of electricity specifically for high output (3.5kW and above) wired-in space heating appliances created an almost unique market proposition for electricity in Australia, which saw Tasmania become the largest market in Australia for many heating appliances, with some manufacturers even designing heaters specifically for sale in Tasmania. Figure 9 shows the extent to which electricity dominates the space heating market in Tasmania, compared to other jurisdictions.
19 Tasmanian Energy Supply Industry Performance Report 2008-09, OTTER

20 | P a g e
Energy Sector Overview Tasmania’s demand for energy
Figure 9 - Primary source of energy of residential space heating
Source: Environmental Issues: Energy Use and Conservation, Mar 2008, Australian Bureau of Statistics Note: 58 per cent of Qld householders indicated that they used no heating at all.
Electricity is also the dominant energy source used for water heating in Tasmanian households (see Figure 10) and while the energy used for cooking makes a much smaller contribution to household energy demand than space and water heating, in Tasmania electricity’s share of the cooking market is even higher than it is for hot water.
Figure 10 - Primary source of residential hot water energy
Source: Australian Bureau of Statistics (ABS), Environmental Issues: Energy Use and Conservation, March 2008

21 | P a g e
Energy Sector Overview Tasmania’s demand for energy
3.1.2. Commercial / Industrial demand In 2009-10, Aurora Energy supplied electricity to just under 44 800 business installations20, which represents 16.5 per cent of the total customer installations at that point in time. Total Tasmanian consumption was 9 048 GWh, with the identified component of business installations therefore using 1 490 GWh of total usage.
There is a difference between installations and customers, as customers may have multiple sites. Breakdowns published by Aurora Energy in the years leading up to the phasing in of retail contestability for commercial customers (commencing in 2006) suggest that ‘business’ customers, not including major industrial users, are likely to account for 20 per cent of the final demand for electricity in Tasmania.
Assuming a market share of 20 per cent, it is estimated that commercial and industrial customers typically consume somewhere between 2 000 GWh and 2 500 GWh per annum.
The classification of ‘business’ customers is wide-ranging and includes major industrial, industrial as well as commercial customers, with the average Tasmanian consumption for commercial and industrial customers (excluding major industrials) at 86 kWh per day21.
Customers that are currently contestable are the largest business users of energy in the State, using more than 150 MWh or electricity a year, and include major industrial companies to small supermarkets and dairy farmers. As of 1 July 2011, Tasmanian businesses with electricity consumption between 50 MWh and 150 MWh per year are expected to become contestable. This includes approximately 2500 customers with nearly 4000 sites including bakeries, take-away food outlets, large restaurants, mechanical workshops and medium-sized offices
A customer using 86 kWh per day would only use just over 31 MWh per annum, meaning that the “average” business customer remains non-contestable and will remain for the foreseeable future.
20 2009-10 Aurora Annual Report, Aurora Energy 21 Ibid

22 | P a g e
Energy Sector Overview Tasmania’s demand for energy
3.1.3. Major industrial demand A small number of large industrial consumers dominate demand for electricity in Tasmania.
Between 1915 and the early 1960s, Tasmania experienced an influx of major new energy intensive industries, drawn to the State by, amongst other things, the availability of low cost, reliable electricity. The businesses which established themselves in Tasmania included the Electrolytic Zinc Company of Australasia (1918), Cadbury (1922), Patons and Baldwins Ltd – later Coats Patons Ltd (1923), Associated Pulp & Paper Mills (1938), Australian Newsprint Mills (1941), Wenden & Co Ovaltine factory (1943), Silk and Textiles (1947), Tioxide Australia – formerly Australian Titan Products Pty Ltd (1949), James Nelson Pty Ltd (1951), Comalco (1955) and the Tasmanian Electro Metallurgical Company Pty Ltd (1962).
While many of those enterprises, such as the titanium dioxide pigment plant at Heybridge and the Burnie pulp and paper mill, are no longer in operation, twenty large industrial customers engaged in manufacturing such as metal smelting, food, beverages, confectionery; and mining and forestry, including paper manufacture, still dominate Tasmania’s consumption of electricity. Information provided to the Panel indicates that the four largest electricity users, Norske Skog, Nystar, Rio Tinto Alcan and BHP Temco, collectively consume around 5800 GWh per annum.
The aggregate demand for major industrial customers is typically around 700 MW, which equates to about 40 per cent of the State’s maximum demand and 50 per cent of total electricity consumption.
The proportion of Tasmania’s electricity consumed by industrial users is unusual in the Australian context. It also explains why, since joining the NEM in May 2005, Tasmania has, on average, accounted for 4.9 per cent22 of electricity consumption in the NEM, despite being home to only 2.3 per cent of Australia’s total population.
In recent years, a number of significant industrial users of electricity have closed, including paper mills at Burnie and Wesley Vale, Simplot’s potato processing plant in Scottsdale, McCain Foods’ frozen vegetable factory at Smithton and Gunns’ Hampshire woodchip mill. Nonetheless, as long as the four major industrial processing plants continue to operate in Tasmania, the extent to which Tasmania’s demand for electricity is dominated by large industrial users is unlikely to change significantly.
22 State of the Energy Market 2010, Australian Energy Regulator

23 | P a g e
Energy Sector Overview Tasmania’s demand for energy
The high proportion of Tasmania’s demand for electricity attributable to such a small number of major electricity users means that there is the potential for the demand/supply balance in Tasmania’s electricity market to change drastically as a result of decisions taken by those businesses; decisions which are likely to be driven by wider economic, technological and commercial considerations.
Figure 11 provides a high-level breakdown of the proportion of electricity used by different sectors of the Australian economy.
Figure 11 - Electricity consumption by sector, national
Source: An introduction to Australia’s National Electricity Market, Australian Energy Market Operator
Figure 12 provides a high-level breakdown of the proportion of electricity used by different sectors of the Tasmanian economy in 2006-0723.
23 Aside from the closures of Gunns Limited’s Hampshire woodchip mill and the Australian Paper mill at Burnie, Tasmania has not undergone structural change in its economy over the intervening years that would substantially alter the underlying usage of electricity. Further, the modest load growth that has occurred since 2006-07 is understood to not be concentrated in any one sector. The introduction of retail contestability to progressively more (and smaller) customers since 2006-07, and the defection of Aurora Energy customers to other retailers, also means that a single source of disaggregated consumption data for Tasmania is no longer available.

24 | P a g e
Energy Sector Overview Tasmania’s demand for energy
Figure 12 - Electricity consumption by industry sector in Tasmania, 2006-07
Note: Excludes electricity consumed by Gunns Limited Hampshire woodchip mill and the Paper
Australia Pty Ltd mill at Burnie, which have both since ceased operations. Source: Aurora Energy By comparing Figure 11 and Figure 12 we can see that the proportion of electricity consumed for aluminium smelting in Tasmania is more than double that used nationally. When combined with the smelting of other metals, around 45 per cent of Tasmania’s electricity is used for the purposes of smelting, compared with 29 per cent nationally.
Possibly reflecting the composition of the State’s economy, the proportion of electricity used in Tasmanian agriculture is also double the national figure and would be even greater if not for the heavy use of electricity in Tasmania for smelting purposes, although the actual level of consumption is not large.
A feature of the major industrial consumers demand for electricity in the Tasmanian system is that they have almost constant load profiles. That is, their demand for electricity is not subject to significant peaks or troughs and typically does not vary much from their maximum demand. This means that the average utilisation of Tasmania’s transmission network is much higher than in some other jurisdictions, such as South Australia, which have a high proportion of seasonal air-conditioning load.24
Another advantage of Tasmania’s greater industrial load and less peaky load profile is that the State rarely has difficulty in meeting peak load requirements and is, therefore, less reliant on more expensive peaking plant. Accordingly, the flatter demand profile may be expected to lead to less variability in Tasmanian wholesale prices.
24 Tasmanian Energy Supply Industry Performance Report 2008-09, OTTER

25 | P a g e
Energy Sector Overview Tasmania’s demand for energy
3.2. Natural Gas Demand
In 2009-10, the total amount of natural gas delivered to customers was the equivalent of 554 GWh of electricity, or an average annual load of 63 MW. This compared to State-wide electricity usage of 10 923 GWh and an average load of 1 247 MW25. Despite the connection of additional customers to the network, the amount of gas supplied in 2009-10 was approximately nine per cent less than the amount delivered in 2008-09, following the closure of a large industrial gas customer.
As such, natural gas supplies Tasmania with only around five per cent of the energy supplied by electricity and represents a relatively small proportion of total energy consumption. Table 2 shows the total amount of natural gas distributed in Tasmania in each year since 2006-07.
Table 2 - Natural gas distribution
2006-07 2007-08 2008-09 2009-10
Distributed to customers (GJ) 989 395 1 872 547 2 192 576 1 995 904
Equivalent GWh 274.8 520.2 609.0 554.4
Source: Tasmanian Energy Supply Industry Performance Report 2009-10, OTTER
Total customer numbers for natural gas are shown in Table 3.
Table 3 - Natural gas customer base
2005-06 2006-07 2007-08 2008-09 2009-10
Total Customers 747 3 379 5 048 6 537 8 042
Year-on-year Growth 2 632 1 669 1 489 1 505
Source: Tasmanian Energy Supply Industry Performance Report 2009-10, OTTER
3.2.1. Residential demand The first residential natural gas consumer was connected on 27 August 2004 and since then, approximately 7 400 residential customers have connected to the natural gas network.
25 ibid

26 | P a g e
Energy Sector Overview Tasmania’s demand for energy
On average, Tasmanian residential customers consume around 40 GJ per annum26, a level of consumption in the mid-range of consumption in other states and territories. Based on an estimated residential customer base in 2009-10 between the two Tasmanian gas retailers of 7 400 customers, this equates to consumption of just under 300 000 MJ per annum, or 15 per cent of the total volume of gas consumed in Tasmania.
3.2.2. Commercial / Industrial demand The first commercial natural gas consumer was signed up in December 2003 and connected in May 2004. Approximately 600 commercial and industrial customers are estimated to be connected to the natural gas network.
No indicative consumption figures are available for business customers, but analysis suggests that in 2009-10, commercial/industrial customers – including major industrial customers – used 85 per cent of the natural gas consumed in Tasmania.
3.2.3. Major industrial demand Gas has been flowing to key industrial customers since September 2002 and natural gas is now being used by approximately 20 major industrial and commercial customers, including the Tamar Valley Power Station owned and operated by Aurora Energy.
Figure 13 shows the split in demand for gas between residential and business and industrial customers.
Figure 13 - Natural gas consumption, by market segment
Source: Tasmanian Energy Supply Industry Performance Report 2009-10, OTTER
26 Tasmanian Energy Supply Industry Performance Report 2009-10, OTTER

27 | P a g e
Energy Sector Overview Tasmania’s demand for energy
Summary: Energy Demand Tasmanian households typically use more electricity than their interstate counterparts.
While increased take-up of natural gas may change this equation for customers with access to the gas reticulation network, for the majority of households this is unlikely to change without significant investment in the gas network.
Twenty large industrial customers account for around 60 per cent of Tasmania’s electricity consumption, including four major industrial users that, between them, use around half of the energy supplied by the Tasmanian power system. The balance of consumption is broadly shared equally between the rest of the commercial and industrial sector and the residential/small business sector. This is a significantly more concentrated demand profile than elsewhere in Australia.
Tasmania’s demand/supply balance could change markedly as a result of commercial decisions made by the State’s major electricity users and therefore makes decisions to invest in the Tasmanian energy market relatively risky by comparison with other NEM jurisdictions, which can affect the attractiveness of making such an investment. This is a matter the Panel is keen to understand as a part of the Review.
With slow population growth, growth in the demand for electricity that trails other markets in Australia and the Tasmanian economy becoming less energy intensive over time. This has consequences for the potential for expansion of the Tasmanian energy market
Hydrology and Tasmania’s supply/demand balance drive net trades of electricity via Basslink.
Tasmania’s different seasonal load profile creates opportunities for trading between Tasmania and other states.
Tasmania’s less ‘peaky’ load profile means that the State rarely has difficulty in meeting peak load requirements and is less reliant on more expensive peaking plant than in other regions of the NEM.
The relatively constant industrial base load in the Tasmanian electricity market removes the peaks and troughs in demand which would otherwise create trading opportunities for generators.
The take up of natural gas in Tasmania has been growing, but natural gas still supplies Tasmania with only around five per cent of the energy supplied by electricity and represents a relatively small proportion of total energy consumption. Like the electricity sector, a small number of large users account for a large share of total natural gas usage in Tasmania. Residential customers consume around 15 per cent of the total State use.

28 | P a g e
Energy Sector Overview Tasmania’s supply of energy
4. Tasmania’s supply of energy
4.1. Electricity Supply
Tasmania generates more electricity per capita than any other state or territory. If Tasmania were a country in its own right, it would rank amongst the top six countries in the world in terms of electricity generated per capita, alongside Iceland, Norway, Canada, Sweden, Finland and the United Arab Emirates.
The electricity supply industry can be divided into four key industry functions – generation, transmission, distribution and retail. The electricity supply chain is illustrated in Figure 14.
.Figure 14 - The physical electricity supply chain
Generation Transmission Distribution Retail
Source: An introduction to the Australia’s National Electricity Market, Australian Energy Market Operator
Prior to 1998, the four functions were carried out in Tasmania by a ‘vertically integrated’ entity, the Hydro-Electric Commission (the HEC), which was owned by the State Government. Historically, vertical integration had been the norm in the operation of electricity supply authorities in Australia.
In 1998, the HEC was disaggregated and divided into three separate Government-owned businesses, essentially along the lines of the four key industry functions:
Hydro Tasmania retained ownership of Tasmania's dams and power stations and system control;

29 | P a g e
Energy Sector Overview Tasmania’s supply of energy
Transend Networks the extra high voltage network transmitting electricity from Tasmania’s power stations to the State’s largest industrial users of electricity and populations centres; and
Aurora Energy took on the distribution network within those population centres and the responsibility for retailing electricity.
The rationale for disaggregation is explained in the Panel’s Discussion Paper “The Evolution of Tasmania’s Energy Sector”.
This remains the basic industry structure that remains in place today, except that Hydro Tasmania is no longer the only generator in Tasmania, nor Aurora the sole retailer, as a result of other generators and retailers being allowed to enter the market. Figure 14 shows the roles of the main participants in Tasmania’s electricity supply chain.
The implementation of the NEM arrangements in Tasmania in 2005 fundamentally transformed the operation of the Tasmanian electricity system. The NEM operating arrangements are discussed in Appendix 2.
Figure 14 - The physical electricity supply chain in Tasmania

30 | P a g e
Energy Sector Overview Tasmania’s supply of energy
4.1.1. Generation The electricity supply chain begins with generation in power stations. Large scale generation (over 5 MW) of electricity can only be undertaken in Tasmania by an entity licensed to do so under the Electricity Supply Industry Act 1995 and registered with the NEM27.
As at 30 June 2010, there were ten generation licence holders in Tasmania, although several have ceased generating and a third is yet to construct the wind farm for which it has been granted a license. Together, Tasmania’s generators operate 32 power stations with an installed capacity of 2 802 MW. A handful of small generation plants provide a further 7 MW of capacity but are not classified as power stations.
Generators with a capacity of less than 30 MW are not required to dispatch the electricity they generate via the NEM bidding arrangements, although distribution of their electricity and their integration into the electricity grid is still overseen by the NEM operator.
Tasmania’s active licensed generators are shown in Figure 15, along with their respective generation capacities.
Figure 15 - Tasmania's licensed generators
Source: Tasmanian Energy Supply Industry Performance Report 2009-10, OTTER
27 Unless the generator is not connected to the network.
31 | P a g e
Energy Sector Overview Tasmania’s supply of energy
Hydro Tasmania is the state’s largest generator and its position in Tasmania is unlike that of any generator in other NEM regions. As can be seen from Figure 16, no other generator has more than a 35 per cent share of registered generation capacity in any other region of the NEM. Even though not all generators are created equal, in that some generation technologies lend themselves to producing base load electricity while others are more suited for use as peaking plant, Hydro Tasmania’s share of Tasmania’s on-island generation capacity is still clearly unique within the context of the NEM.

32 | P a g e
Energy Sector Overview Tasmania’s supply of energy
Notes: Pre-dates the recent changes in NSW from the privatisation process
Capacity that is subject to power purchase agreements is attributed to the party with control over output. AGL Energy ownership excludes its 32.5% stake in GEAC, which owns Loy Yang A. Excludes power stations not managed through central dispatch. Some corporate names are shortened or abbreviated. Source: State of the energy market 2010, Australian Energy Regulator
Figure 16 - Market shares in electricity generation capacity, by region, 2010
33 | P a g e
Energy Sector Overview Tasmania’s supply of energy
Twenty nine of Tasmania’s 32 power stations are hydroelectric, including two small mini-hydro schemes, one of which is run in conjunction with an irrigation scheme. Hydro-electric generation represents around 81 per cent of Tasmania’s registered generation portfolio and in 2009-10 produced 76 per cent28 of all electricity generated in the State.
Gas-fired generation, in the form of the Tamar Valley Power Station which is owned and operated by a subsidiary of Aurora Energy, accounted for 14 per cent of registered generation capacity and produced 11 per cent of the electricity generated in 2009-10. The TVPS has a total installed capacity of 387 MW, made up of:
a 208.9 MW combined cycle gas turbine for base load generation; and
four open cycle gas turbines with a combined capacity of 178 MW that operate as peaking plant and backup for the combined cycle gas turbine.
Wind generation makes up five per cent (140 MW) of the State’s registered capacity and generated four per cent of total energy consumed in Tasmania in both 2008-09 and 2009-1029. The inherently intermittent availability of wind generation means that its share of generation output is typically well below its share of generation capacity. The timing of wind generation output and system demand is an issue that has attracted attention of some commentators. This is because the intermittent nature of wind generation can have material impact correlation on the management of the overall system, on the operation of other generators and on spot pricing volatility. This is addressed in the AEMC’s Strategic Priorities for Energy Market Development Discussion Paper 2011, but not considered further in this paper.
Across the NEM in 2009-10, wind generation represented around three per cent of generation capacity and yielded two per cent of output.30
The installed wind generation capacity would more than double with the construction of the proposed Musselroe Wind Farm. Development of the 56 turbine, 168 MW wind farm in the State’s north-east is being undertaken by Musselroe Wind Farm Pty Ltd, a wholly-owned subsidiary of Roaring 40s Renewable Energy, itself a joint venture of Hydro Tasmania and China Light & Power. The project has had a long gestation period, having first been proposed by Hydro Tasmania in 2003. While preliminary site works have been undertaken, construction is yet to commence.
28 Tasmanian Energy Supply Industry Performance Report 2009-10, OTTER 29 Transend Networks Annual Report 2010 30 State of the energy market 2010, Australian Energy Regulator
34 | P a g e
Energy Sector Overview Tasmania’s supply of energy
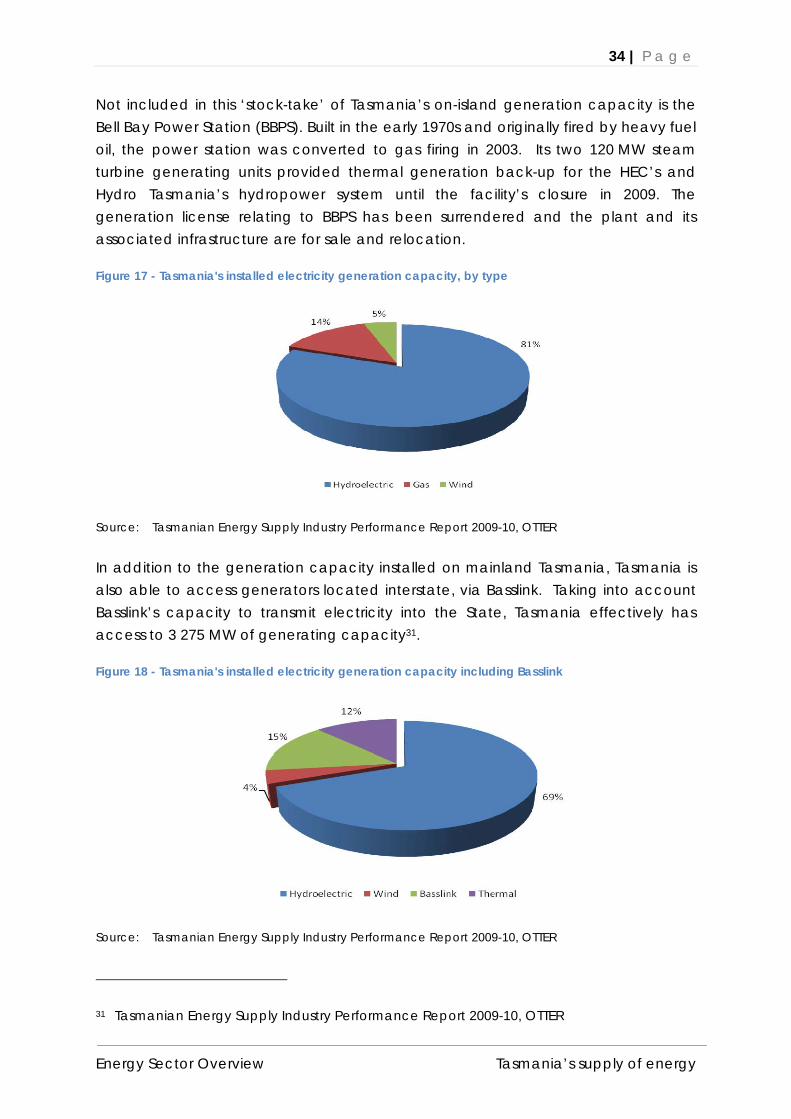
Not included in this ‘stock-take’ of Tasmania’s on-island generation capacity is the Bell Bay Power Station (BBPS). Built in the early 1970s and originally fired by heavy fuel oil, the power station was converted to gas firing in 2003. Its two 120 MW steam turbine generating units provided thermal generation back-up for the HEC’s and Hydro Tasmania’s hydropower system until the facility’s closure in 2009. The generation license relating to BBPS has been surrendered and the plant and its associated infrastructure are for sale and relocation.
Figure 17 - Tasmania's installed electricity generation capacity, by type
Source: Tasmanian Energy Supply Industry Performance Report 2009-10, OTTER
In addition to the generation capacity installed on mainland Tasmania, Tasmania is also able to access generators located interstate, via Basslink. Taking into account Basslink’s capacity to transmit electricity into the State, Tasmania effectively has access to 3 275 MW of generating capacity31.
Figure 18 - Tasmania's installed electricity generation capacity including Basslink
Source: Tasmanian Energy Supply Industry Performance Report 2009-10, OTTER
31 Tasmanian Energy Supply Industry Performance Report 2009-10, OTTER

35 | P a g e
Energy Sector Overview Tasmania’s supply of energy
In terms of the energy actually supplied in Tasmania in 2009-10, the following chart illustrates the extent to which each of the above generation sources contributed to that total supply.
Figure 19 - Tasmania's electricity generation mix, 2009-10
Source: Tasmanian Energy Supply Industry Performance Report 2009-10, OTTER
For a number of reasons, the mix of generation sources in 2009-10 was significantly different from the combination of generation sources that have supplied Tasmania in the past, and may not be indicative of the mix of generation sources that might be used in the future.
For example, due to increased rainfall in 2008-09 which replenished Hydro Tasmania’s water storages, net flows of electricity into Tasmania from Basslink represented around 10 per cent of the State’s electricity requirements in 2009-10, compared to 23 per cent in 2008-09, and further substantial rainfall during 2009-10 has increased the State’s capacity to transmit electricity to Victoria over Basslink in the immediate future. The 209 MW combined cycle gas turbine plant at AETV was also commissioned in September 2009, meaning that Tasmania now has on-island thermal generation capacity which is suited to generating base-load.
The extent to which Tasmania relies in the future on electricity generated by the new gas-fired power station operated by Aurora Energy or by flows from Basslink will also be affected by future rainfall and water storage levels.
36 | P a g e
Energy Sector Overview Tasmania’s supply of energy
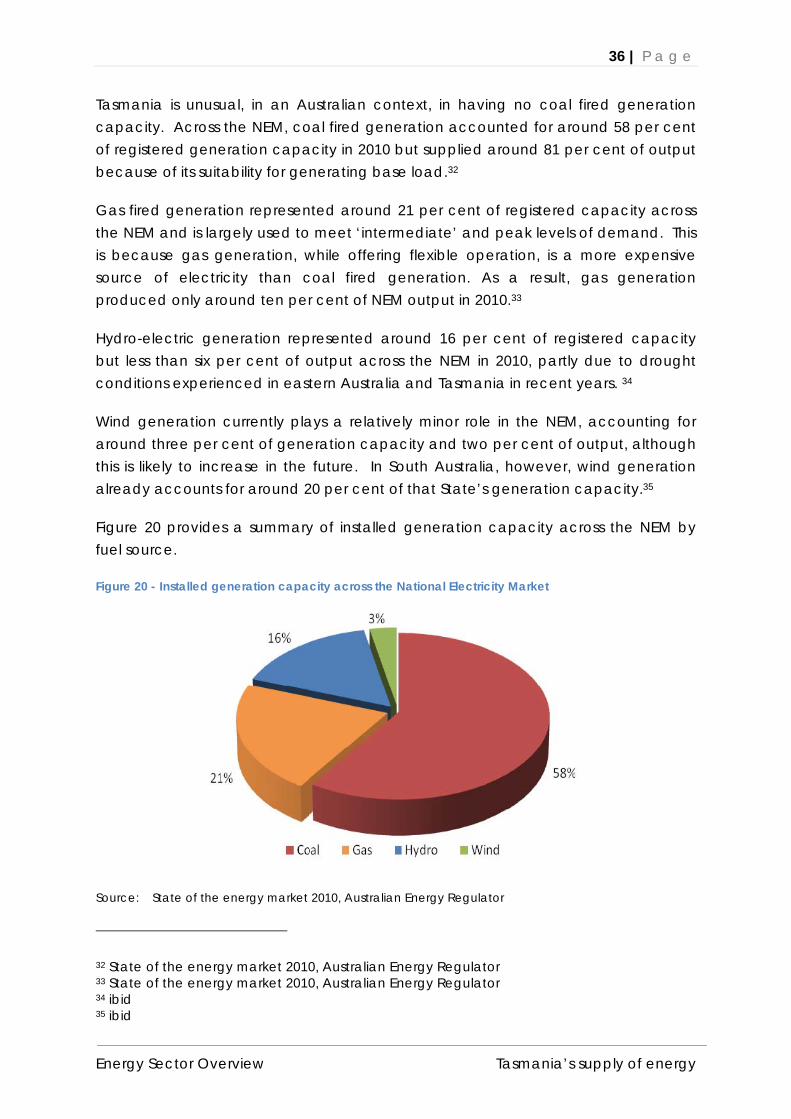
Tasmania is unusual, in an Australian context, in having no coal fired generation capacity. Across the NEM, coal fired generation accounted for around 58 per cent of registered generation capacity in 2010 but supplied around 81 per cent of output because of its suitability for generating base load.32
Gas fired generation represented around 21 per cent of registered capacity across the NEM and is largely used to meet ‘intermediate’ and peak levels of demand. This is because gas generation, while offering flexible operation, is a more expensive source of electricity than coal fired generation. As a result, gas generation produced only around ten per cent of NEM output in 2010.33
Hydro-electric generation represented around 16 per cent of registered capacity but less than six per cent of output across the NEM in 2010, partly due to drought conditions experienced in eastern Australia and Tasmania in recent years. 34
Wind generation currently plays a relatively minor role in the NEM, accounting for around three per cent of generation capacity and two per cent of output, although this is likely to increase in the future. In South Australia, however, wind generation already accounts for around 20 per cent of that State’s generation capacity.35
Figure 20 provides a summary of installed generation capacity across the NEM by fuel source.
Figure 20 - Installed generation capacity across the National Electricity Market
Source: State of the energy market 2010, Australian Energy Regulator
32 State of the energy market 2010, Australian Energy Regulator 33 State of the energy market 2010, Australian Energy Regulator 34 ibid 35 ibid

37 | P a g e
Energy Sector Overview Tasmania’s supply of energy
Figure 21 compares the installed generation capacity in the five jurisdictions that participate in the NEM, by fuel source, and further highlights the current reliance on coal fired electricity generation across the NEM.
Figure 21 - Registered generation capacity in NEM regions, by fuel type (2010)
Note: New South Wales and Victoria include Snowy Hydro capacity allocated to those regions. Source: Australian Electricity Market Operator, Australian Energy Regulator Tasmania is not the only jurisdiction that relies on flows from other regions to meet its electricity needs. South Australia and New South Wales are also both net importers of electricity, although South Australia’s reliance on imported electricity has been diminishing in recent years as a result of new investments in generation capacity.36 Queensland and Victoria are both net exporters of electricity.
While other states are, technically, capacity constrained, instances where generation capacity is insufficient to meet the demand for electricity have been rare (see Reliability). However, if indigenous demand in Queensland or Victoria were to increase at a rate which exceeds the augmentation of generation capacity, then their position as net exporters is likely to decline.
Constraints of Hydro power Because the ability of Tasmania’s hydroelectric generation plants to produce electricity over time is limited by the availability of water as a source of energy,
36 Mostly wind generation

38 | P a g e
Energy Sector Overview Tasmania’s supply of energy
Tasmania’s hydro system is ‘energy constrained’. The instantaneous capability of the system is well above its sustainable output level because of the constraints on fuel availability. By contrast, the predominance of thermal generation in most states and territories and the ready availability of fuel means that the ability of interstate generators to meet the demand for electricity is largely constrained only by the capacity of installed generation plants to produce it.
The key driver of the production capability of the hydro system is the amount of water in storage in the dams and flows into rivers, which in turn is dependent upon inflows from rain in Hydro Tasmania’s catchments. Tasmanian hydro system contains a mix of storage capability:
Run of river and limited storage – electricity is produced whenever water is available, as the water is not able to be stored for later use;
Intermediate storage – these storages will cycle from full to empty over a year and there are some opportunities to choose when to produce electricity (or retain water); and
Long-term storage – these are inter-year storages and generally fill and empty over a long period. The two major storages of Lake Gordon and Great Lake have storage capability substantially in excess of their annual flows.
These long-term storage options are critical in managing the disparity between annual inflows of water and annual electricity production levels. When Tasmania experiences a year of below-average inflows, production from the long-term storages can make up for lower yields from the run-of-river and intermediate storage systems by drawing down water levels, which can be replenished in periods of higher than average rainfall.
Figure 22 shows the long term hydrological trend for Hydro Tasmania’s current system. It shows a high degree of variability around the average ‘yield’ of water, with some very low years in the mid 1930s, the early 1950s and several very low years in the 1960s.
The period from the mid 1990s to 2010 shows a slightly different trend, with a long succession of below-average inflows, none of which individually represented historic lows. What is significant is that the sustained periods of weak inflows did not allow the ‘restocking’ of water in the long-term and intermediate storages, so the hydro system was materially ‘drained’ over this period.
It is impossible to predict with certainty what the level of inflows into the system will be in the future, but probabilistic estimates can be used to determine the sustainable level of hydro output that can be produced (with a given level of confidence).

39 | P a g e
Energy Sector Overview Tasmania’s supply of energy
Hydro Tasmania currently estimates that the sustainable level of output of its system is around 8 700 GWh pa. As shown in Figure 22, the expected long-term yield of hydro catchments has been progressively de-rated by Hydro Tasmania over recent years, in response to observed long-term hydrological trends.
For example, in the mid 1990s when Basslink was being actively considered as the State’s next energy option, the sustainable capacity of the hydro system was considered to be 9745 GWh pa37, which is around 1000 GWh pa higher than the current estimate. To put this into perspective, this ten per cent reduction in effective capacity is the equivalent of removing a 115 MW generator (that operated 24 hours a day, each day of the year) from the Tasmanian system. This is significant, given that Hydro Tasmania invested heavily over this period in improving the efficiency of the hydro system, with the primary aim o improving its production capacity.
Figure 22 - Longer-term hydrological trend
Source: Hydro Tasmania
Table 4 shows the recent hydrological trends in more detail. It shows that in 2008, hydro storages reached a very low level of only 19.1 per cent, with total hydro output for that year the lowest of the decade at 7 100 GWh, close to 20 percent below the average sustainable level of production. By contrast, in 2002 (pre-Basslink), total hydro output was 10 133 GWh, or some 16 per cent above the sustainable average production level.
37 Electricity in Tasmania, Office of Energy Planning and Conservation, April 2007
0
2000
4000
6000
8000
10000
12000
14000
16000
1924
1928
1932
1936
1940
1944
1948
1952
1956
1960
1964
1968
1972
1976
1980
1984
1988
1992
1996
2000
2004
2008
Yie
ld (G
Wh
, ca
l ye
ars)
1997-20091976-19961924-1975Mean 1924-2010 (9739 GWh)Mean 1924-75 (10100 GWh)Mean 1976-96 (9486 GWh)Mean 1997-2010 (8779 GWh)
All yields are obtained from modelling

40 | P a g e
Energy Sector Overview Tasmania’s supply of energy
This is unique in the NEM, in that in no other NEM jurisdiction does any single generator have both such a large share of production capability and exhibit such large variations in output. Moreover, this variability is largely out of the control of the generator and is difficult to predict with any certainty. During the Review the Panel will explore the implications/ramifications that these unique characteristics of the Tasmanian hydroelectric system of generation have for the future development of Tasmania’s energy sector.
Table 4 - Hydro Tasmanian water storage levels
Financial Year
00 01 02 03 04 05 06 07 08 09 10
Water Storages (% full)
48.8 38.8 30.2 30.5 38.2 22.7 30.5 20.0 19.1 27.7 36.3
Hydro Station Output (GWh)
9,995 10,028 10,133 9,938 9,834 9,610 9,688 8,128 7,100 7,203 8,184
Tas System Load (GWh)
9,563 9,654 9,751 9,987 10,210 10,347 10,001 10,694 10,972 10,938 10,834
Source: OTTER performance report
4.1.2. Flows across Basslink Basslink, the undersea electricity interconnector which links Tasmania’s electricity grid to the Victorian region of the NEM, allows electricity to be traded between Victoria and Tasmania. Basslink is rated to flow southwards 480 MW or flow northwards at 500 MW on a continuous basis; although it can operate at up to 630 MW northwards for limited periods.
Since Tasmania’s physical connection to the NEM in 2006, the State has consistently seen net southward flows of electricity. That balance of physical flows is due, in the main, to the impact that a prolonged period of below average rainfall had on Hydro Tasmania’s water storages and the amount of electricity that it could generate without endangering continuity of supply.
Regardless of the net position over a year, electricity flows in both directions over Basslink within the year. The comparatively marked differences between peak and off-peak electricity prices in the Victorian region of the NEM combined with the flexibility of Tasmania’s hydro-electric generation capacity. At times it is commercially advantageous for generators in Tasmania to produce more electricity than is required for on-island demand and thereby create northward flows of electricity, while at other times it is advantageous – even necessary – for Tasmanian generators to produce less electricity and allow some of the State’s electricity needs to be met by interstate generators, via Basslink.

41 | P a g e
Energy Sector Overview Tasmania’s supply of energy
Over time, the net flow of electricity across Basslink will be determined primarily by the balance between the supply of, and demand for, electricity on mainland Tasmania.
If, for example, the State’s generation capacity were to expand considerably, a major industrial consumer of electricity were to close or Tasmania experience above average rainfall for a prolonged period, there would be an excess supply of electricity in Tasmania, which would be likely to result in the net flow of electricity from Tasmania. Conversely, were Tasmania to encounter a supply shortfall, possibly due to sustained below average rainfalls in Hydro Tasmania’s catchments, there would be a need for Tasmania to bring in more electricity than is sent out of the State..
Over the longer term, where Tasmania’s energy needs are approximately in balance with on-island supply capability, the volume of electricity transmitted in each direction would broadly be the same, though generally northward flows would be at periods of peak price and southward flows at periods of low price. However, the flow of electricity to and from Tasmania at any given point in time is a function of the prevailing spot prices for electricity in Tasmania and the Victorian region of the NEM. The operation of the NEM is discussed in Appendix 2.
During 2009-10 Tasmania sent 650 GWh of electricity to other regions in the NEM via Basslink, a significant increase on the previous year’s 71 GWh, which reflected low water storage levels in Hydro Tasmania’s dams. Tasmania still used significantly more energy from Basslink than was sent northwards (1 798 GWh), meaning that the State was again a net importer of electricity. Following the commissioning of Tamar Valley Power Station in September 2009, and the return to expected inflows in Hydro Tasmania’s storages, historical Basslink flows may not be representative of future flows.

42 | P a g e
Energy Sector Overview Tasmania’s supply of energy
Summary: Generation Tasmania’s ability to generate electricity is constrained by the availability of water,
rather than the capacity of its power stations (as is the case interstate). The yield from the State’s water catchments and storages is subject to significant variability and unpredictability.
The annual demand for electricity in Tasmania consistently exceeds the level that the State’s existing hydro-generation system is able to meet sustainably, meaning that alternative sources of supply are required to meet Tasmania’s demand for electricity.
In addition to its hydro-electric schemes, Hydro Tasmania has an ownership interest in two wind farms, which represents a further five per cent of the State’s generation capacity. With a total ownership interest in 86 per cent of installed generation, this level of concentration of ownership is highly unusual in the NEM. The Panel is examining the impact of this concentration of ownership as a part of its Review.
The sustainable production level of the hydro system has been downgraded materially over the past 15 years. It is now more than ten per cent lower than in 2007, notwithstanding investments in improving the efficiency of the system.
Tasmania’s interconnection with the NEM enables interstate generators to supplement Tasmania’s generation, while providing opportunities for on-island generators to sell electricity in other NEM regions, particularly at times of peak demand (and prices) interstate.
Tasmania’s supply/demand balance, which is heavily dependent on hydrological factors, drives the net flow of electricity via Basslink.
Subject to the availability of water, the flexibility of Tasmania’s hydro generation system, coupled with it capacity relative to Tasmanian electricity needs, creates opportunities for trading between Tasmania and other states at times where demand and prices are high.
The climate drives large changes in Hydro Tasmania’s production capability. Coupled with the small number of very large customers in Tasmania, the potential variability in supply and demand in Tasmania sets it apart from other NEM regions. This is likely to have implications for perceptions of risk in the Tasmanian market and could have an impact on the attractiveness of investment in the electricity sector in the State. This is a matter that the Panel is considering as a part of its Review.

43 | P a g e
Energy Sector Overview Tasmania’s supply of energy
4.1.3. Transmission and Distribution Electricity generators are usually located near fuel sources, whether it be a natural gas pipeline, water storage or strong and consistent winds. Most customers, however, are located significant distances from the point at which electricity is generated, concentrated in cities and towns, regional population centres or commercial/industrial precincts. In the context of the electricity supply industry, the term ‘network’ is used to describe the assets and systems used to transport power from generators to end users.
The transportation of electricity via the network is divided into two distinct functions – transmission and distribution. Transmission refers to the bulk transportation of high voltage electricity from generators to large industrial users that take electricity at extra high voltage and to the distribution networks within urban areas and regional population centres that reticulate electricity to individual households and businesses in those communities.
Transmission The transmission network comprises the towers, extra high voltage wires and cabling that criss-cross the landscape, along with the voltage transformation equipment needed to reduce that voltage to a level at which lower voltage distribution networks can take over. In 2009-10, the annual costs of owning, operating and maintaining Tasmania’s transmission network, as reflected in prices to Tasmanian electricity users, is stood at $165 million up from $144 million the previous year38.
The NEM is currently divided into five regional markets, each with their own transmission network which, as a product of geography and the historical involvement of governments in the electricity supply industry, largely follow state boundaries. Those transmission networks are linked by five cross-border interconnectors – including Basslink – to form a single electricity grid.
Traditionally, transmission networks have been government owned, and Tasmania’s high-voltage transmission network is owned and operated by the State Government Company, Transend Networks Pty Ltd. The governments of Queensland and New South Wales also own and operate the transmission networks in their jurisdictions.
Generally transmission companies interstate have assets with voltage levels greater than 132kV. Transend’s assets range from 88-220kV, with the majority of its assets at 110kV and 220kV forming the main trunks from power schemes to major load centres.
38 Transend Annual Report 2010

44 | P a g e
Energy Sector Overview Tasmania’s supply of energy
Table 5 below lists each transmission network and interconnector, and compares their fundamental characteristics, including ownership.
Table 5 - Electricity Transmission networks with the National Electricity Market
NETWORK
LOC
ATIO
N
LIN
E LE
NG
TH (k
m)
ELEC
TRIC
ITY
TRA
NSM
ITTED
(G
Wh)
08
-09
MA
XIM
UM D
EMA
ND
(MW
) 08-
09
ASS
ET
BASE
(2
009
$M) 1
INVE
STM
ENT
– C
URRE
NT
PERI
OD
(200
9 $M
) 2
CUR
REN
T RE
GUL
ATO
RY
PERI
OD
OWNER
NEM REGION NETWORKS Powerlink QLD 13 106 49 104 8 677 3 979 2 564 1/7/07 – 30/6/12 QLD Government
Transgrid NSW 12 445 74 744 14
274 4 213 2 440 1/7/09 – 30/6/14 NSW Government
SP AusNet VIC 6 553 51 777 10 446
2 265 1 004 3 1/4/08 – 30/3/14 Publicly listed company (Singapore Power International 51%)
ElectraNet SA 5 589 13 327 3 408 1 303 659 1/7/08 – 30/6/13 Powerlink (QLD Government), YTL Power Investment, Hastings Utilities Trust
Transend TAS 3 650 11 031 2 236 950 615 1/7/09 – 30/6/14 TAS Government
NEM TOTALS 41 343 200 983 12 710 7 282 INTERCONNECTIONS4
Directlink (Terranora)
QLD / NSW
63 180 132 1/7/05 – 30/6/15 Energy Infrastructure Investments (Marubeni 50%, Osaka Gas 30%, APA Group 20%)
Murraylink VIC / SA 180 220 121 1/10/03 – 30/6/13
Energy Infrastructure Investments (Marubeni 50%, Osaka Gas 30%, APA Group 20%)
Basslink VIC/TAS 375 8585 Unregulated CitySpring Infrastructure Trust (Temesek Holdings (Singapore) 28%)
Source: State of the Energy Market 2010, Australian Energy Regulator
Tasmania’s transmission network is the smallest in the NEM, in terms of line length, volume of electricity and asset value. However, the average utilisation of Tasmania’s transmission network is much higher than in some other jurisdictions, such as South Australia, because the major industrial consumers that make up a high proportion of the demand for electricity in Tasmania have almost constant load profiles.
45 | P a g e
Energy Sector Overview Tasmania’s supply of energy
Electricity transmission networks are considered natural monopolies39, and as such, are subject to considerable regulation. The National Electricity Rules (NER) apply to all transmission networks in the NEM and the economic regulation of the Tasmanian transmission networks is under the jurisdiction of the Australian Energy Regulator (AER). The AER undertakes five-yearly detailed reviews of the cost structure of transmission network and determines an annual allowable revenue that Transend Networks can charge the distribution business and direct access customers for use of the transmission network. Transend Networks translates that allowable revenue into network tariffs.
Since Transend Networks was established in 1998, there has been substantial capital spending in the transmission system40 to upgrade the transmission network to meet contemporary standards, replace aging assets and improve the reliability of the system. In 2009-10, Transend Networks invested $144m in capital projects.41 The consequences of this investment program on electricity prices is a keen area of interest for the Panel during the Review, and is discussed in the Discussion Paper “Tasmanian Electricity Pricing Trends”.
Some 16 large electricity users take their supply directly from the transmission system, and do not utilise the distribution network. This provides them with a substantial cost saving in the delivered cost of electricity by comparison with smaller users, who need to contribute to the costs of the distribution network (which is substantially greater than the cost of the transmission system).
Transend Networks Transend Networks is the smallest of Tasmania’s three State-owned electricity entities. Its workforce grew from 53 full-time equivalent staff in 200-01 to 274 employees in 2009-10, although it has experienced a number of changes in function over this time. In 2009-10 Transend Networks recorded a profit of $26.4 million and returned nearly as much in the way of dividend income, taxes and guarantee fees ($23.5 million) to the Tasmanian Government as Aurora Energy and Hydro Tasmania combined.
39 Networks exhibit substantial scale economies nearly that it is most efficient to have a single provider, with regulation providing the safeguards and monopolistic behaviour, such as monopoly pricing and rent seeking
40 Details of current and completed capital projects can be found at http://www.transend.com.au/ourprojects.
41 Transend 2010 Annual Report. This level of capital spending was a high point for Transend. More information on capital spending is included in the Panel’s Discussion Paper “Tasmanian Electricity Pricing Trends”.
46 | P a g e
Energy Sector Overview Tasmania’s supply of energy
Transend Networks also owns, operates and maintains a telecommunications network in Tasmania which is used to control operation of the transmission network, acquire data and undertake remote asset management, as well as provide business data and voice networking.
Basslink Basslink was facilitated by the Tasmanian Government during the late 1990s through a competitive bidding process, which culminated in National Grid PLC being selected as the builder, owner and operator of the cable in February 2000. The detailed design of the project was completed in 2003, with the cable commencing commercial operations in April 2006.
The facility is owned by Basslink Pty Ltd, who operates and maintains the interconnector, and holds the required transmission license. Basslink was acquired by CitySpring Infrastructure Trust from National Grid in July 2007 through the acquisition of Basslink Pty Ltd for an enterprise value of $1.175 billion. 42
Basslink also includes a fibre optic link laid alongside the power cable.
Basslink is a Market Network Service Provider (MNSP), unlike the other interconnectors which join regions of the NEM. Those other interconnectors form part of the electricity supply industry’s transmission networks. This means that the cost of the interconnectors are recovered from customers directly by way of transmission charges, and the allowable revenue which they can recover is determined by the AER in the same way that Transend Networks recovers the cost of transporting energy around Tasmania’s transmission network.
As Australia’s only MNSP43, Basslink sits outside these regulated charges arrangements, and is required to earn its revenues in a way similar to generators by bidding its capacity into the spot market, with the returns determined by price differences between Victoria and Tasmania.
In the broad, the commercial agreements entered into between Basslink Pty Ltd and Hydro Tasmania, which underpinned the project’s development, swap that market-based revenue for a relatively fixed facility fee. These arrangements also give Hydro Tasmania the rights to control the way in which Basslink Pty Ltd bids its interconnector capacity, although these arguments have been partly curtailed by Tasmanian legislation.
42 http://www.cityspring.com.sg/pdf/press_release_20070731.pdf 43 Two other interconnectors (Directlink and Murraylink) were developed under the MNSP
model, but have subsequently been converted to ‘regulated’ status.
47 | P a g e
Energy Sector Overview Tasmania’s supply of energy
In short, under these arrangements, for most of the time, Basslink effectively physically operates in a similar way to regulated interconnectors, although the financial arrangements that support the project are significantly different. This Paper does not seek to explain these arrangements, and this will be taken up in subsequent Panel reports – the financial, physical, trading and other implications of the commercial arrangements that support Basslink are central matters for the Review.
System Protection Scheme The capacity of Basslink to transfer electricity to and from Tasmania is determined by the ability of the electricity system to withstand an unplanned outage of the cable. Without special arrangements in place, the transfer capacity hold would be limited to 100MW. These physical limitations have been relieved by the development of a System Protection Scheme (SPS) that substantially increases the trading capability of the cable.
The SPS protects the Tasmanian electricity grid through measures that are designed to keep the supply and demand for electricity on mainland Tasmania in balance in the event of an unexpected loss of transmission over Basslink. In essence, the SPS does this by either instantaneously closing down the generation of electricity in Tasmania if Basslink fails whilst electricity is being sent from Tasmania, or rapidly shedding load if the interconnector becomes unavailable when the link is flowing southwards.
With the SPS in place, the cable is now rated to transmit 500MW from Tasmania and transmit 480MW to Tasmania on a continuous basis, and it can send 630MW from Tasmania for limited periods.
This southward-flow related element of the SPS involves a number of measures, including agreements with major industrial users of electricity to instantaneously scale back their electricity usage, in order to reduce their demand for electricity while additional on-island generation is brought on line to replace the supply that was lost as a result of the Basslink outage. While such outages are not common, the SPS arrangements with major industrial users ensure that supply to residential and business customers (other than tripped MI customers) remains unaffected if Basslink unexpectedly fails.

48 | P a g e
Energy Sector Overview Tasmania’s supply of energy
Distribution The distribution system provides supply to all but the largest electricity customers, who are connected directly to the high voltage transmission network. The distribution network comprises the system of poles, smaller transformers, wires and below ground cabling that transports electricity, at a much reduced voltage, directly to residential and commercial consumers. For 2009-10, the assessed annual costs of owing, operating and maintaining Tasmania’s distribution network was $230 million (up from $211 million the previous year). 44
While each regional market within the NEM, including Tasmania, has only one transmission network, Victoria, New South Wales and Queensland all have multiple distribution networks (five, four and two respectively). Like South Australia and the Australian Capital Territory, Tasmania has a single distribution network, which is owned and operated by the State-owned Company, Aurora Energy Pty Ltd.
Ownership of distribution networks is split between the private and public sector across Australia. Tasmania’s electricity distribution network is publically owned, as are New South Wales’ three networks and Queensland’s two networks. South Australia and Victoria’s distribution networks are privately owned.
Table 6 summarises and compares the fundamental characteristics of the 13 distribution networks that currently make up the NEM.
On a per customer basis, the value of the distribution assets employed in Tasmania is consistent with other networks within the NEM. In terms of customer numbers, however, Tasmania’s distribution network is significantly smaller than any other within the NEM, except for the network in the ACT. Reflecting the dispersed nature of Tasmania’s population, the per-customer length of the Tasmanian distribution network is relatively high by comparison with interstate counterparts that operate in major metropolitan areas, and considerably smaller than those that operate in regional areas of mainland Australia.
44 Investigation of Prices for Electricity Distribution Services and Retail Tariffs on Mainland Tasmania, OTTER 2007
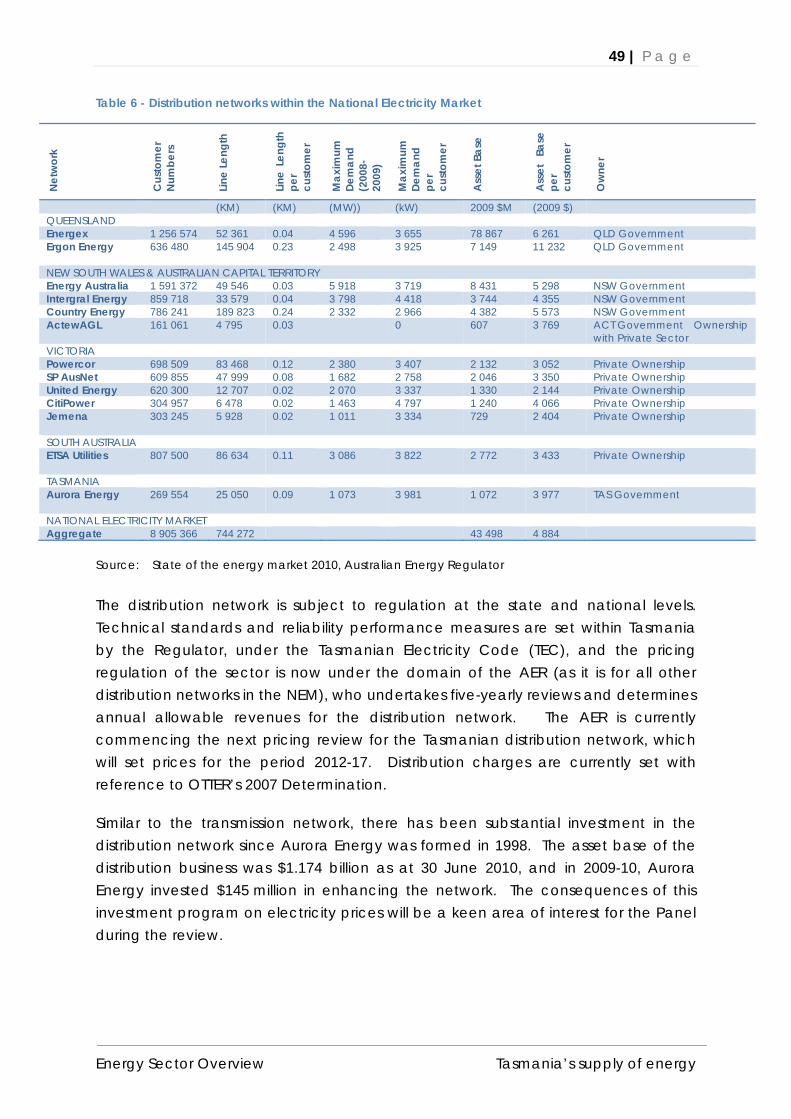
49 | P a g e
Energy Sector Overview Tasmania’s supply of energy
Table 6 - Distribution networks within the National Electricity Market
Net
wor
k
Cus
tom
er
Num
bers
Line
Leng
th
Line
Leng
th
per
cust
omer
Max
imum
De
man
d
(200
8-20
09)
Max
imum
De
man
d pe
r cu
stom
er
Ass
et B
ase
Ass
et
Base
pe
r cu
stom
er
Ow
ner
(KM) (KM) (MW)) (kW) 2009 $M (2009 $) QUEENSLAND Energex 1 256 574 52 361 0.04 4 596 3 655 78 867 6 261 QLD Government Ergon Energy
636 480 145 904 0.23 2 498 3 925 7 149 11 232 QLD Government
NEW SOUTH WALES & AUSTRALIAN CAPITAL TERRITORY Energy Australia 1 591 372 49 546 0.03 5 918 3 719 8 431 5 298 NSW Government Intergral Energy 859 718 33 579 0.04 3 798 4 418 3 744 4 355 NSW Government Country Energy 786 241 189 823 0.24 2 332 2 966 4 382 5 573 NSW Government ActewAGL 161 061 4 795 0.03 0 607 3 769 ACT Government Ownership
with Private Sector VICTORIA Powercor 698 509 83 468 0.12 2 380 3 407 2 132 3 052 Private Ownership SP AusNet 609 855 47 999 0.08 1 682 2 758 2 046 3 350 Private Ownership United Energy 620 300 12 707 0.02 2 070 3 337 1 330 2 144 Private Ownership CitiPower 304 957 6 478 0.02 1 463 4 797 1 240 4 066 Private Ownership Jemena
303 245 5 928 0.02 1 011 3 334 729 2 404 Private Ownership
SOUTH AUSTRALIA ETSA Utilities
807 500 86 634 0.11 3 086 3 822 2 772 3 433 Private Ownership
TASMANIA Aurora Energy
269 554 25 050 0.09 1 073 3 981 1 072 3 977 TAS Government
NATIONAL ELECTRICITY MARKET Aggregate 8 905 366 744 272 43 498 4 884
Source: State of the energy market 2010, Australian Energy Regulator
The distribution network is subject to regulation at the state and national levels. Technical standards and reliability performance measures are set within Tasmania by the Regulator, under the Tasmanian Electricity Code (TEC), and the pricing regulation of the sector is now under the domain of the AER (as it is for all other distribution networks in the NEM), who undertakes five-yearly reviews and determines annual allowable revenues for the distribution network. The AER is currently commencing the next pricing review for the Tasmanian distribution network, which will set prices for the period 2012-17. Distribution charges are currently set with reference to OTTER’s 2007 Determination.
Similar to the transmission network, there has been substantial investment in the distribution network since Aurora Energy was formed in 1998. The asset base of the distribution business was $1.174 billion as at 30 June 2010, and in 2009-10, Aurora Energy invested $145 million in enhancing the network. The consequences of this investment program on electricity prices will be a keen area of interest for the Panel during the review.

50 | P a g e
Energy Sector Overview Tasmania’s supply of energy
Summary: Transmission and Distribution The electricity transmission and distribution networks in Tasmania are substantial
business undertakings. Combined, they account for around $400 million in annual costs to Tasmanian customers in 2009-10. Both are owned and operated by Tasmanian Government-owned companies, Transend Networks and Aurora Energy.
By national standards, the electricity and gas networks are of a small-medium size.
The economic regulation of the electricity transmission and distribution networks in Tasmania is the responsibility of the (AER). The AER undertakes 5-yearly comprehensive reviews of each network business and determines the allowable revenue that the network business are able to charge, which the businesses translate into network prices.
There has been substantial investment in the transmission and distribution networks since the network companies were established in 1998. The impact that this investment has had on electricity prices is the subject of further work by the Panel.
Basslink is owned and operated independently of the general transmission network. Unlike other regional interconnectors within the NEM, Basslink obtains its revenues from the operation of the NEM’s spot market, rather than regulated transmission charges. That revenue is accrued by Hydro Tasmania, in exchange for the payment of an annual facility fee to Basslink’s owners.
Large industrial customers who are supplied with electricity directly from the State’s transmission network do not utilise the distribution network, resulting in significantly lower delivered energy costs compared with typical electricity customers.

51 | P a g e
Energy Sector Overview Tasmania’s supply of energy
4.1.4. Electricity Retailing The electricity supply chain is completed by retailers, who buy wholesale electricity from generators (via the NEM) and package it with transmission and distribution services for sale to residential, commercial and industrial customers. Retail services include arranging supply (connection), billing and providing customer support. Electricity is sold either under contract (to contestable customers) or a standardised tariff (to non-contestable customers), which covers service standards as well as pricing.
The retail sectors in New South Wales and Victoria became fully contestable in 2002. South Australia and the Australian Capital Territory followed a year later and Queensland introduced Full Retail Contestability in 2007 although safety net tariffs continue to be kept in place in some jurisdictions to provide added security for customers.
Tasmania was the last NEM jurisdiction to introduce retail contestability to its electricity supply industry (reflecting its relatively late participation in the NEM). Prior to the introduction of retail contestability, Aurora Energy held the sole franchise for retailing electricity in Tasmania and Aurora Energy continues to be the only retailer licensed to supply electricity to non-contestable customers, namely small business users and the residential market.
Since 2006 the scope for competition has been progressively introduced to the retail market, starting with the largest users (based on annual consumption of electricity per site) and extending to progressively smaller users. Table 7 shows the timetable adopted by the Tasmanian Government to progressively introduce retail contestability to different classes of customer (known as 'tranches').
Currently electricity users with annual consumption of 150 MWh or more can choose their electricity supplier. From 1 July 2011, small businesses that use more than 50 MWh per annum, such as bakeries, take-away food outlets, service stations, restaurants and medium-sized offices, through to the largest electricity user, will be free to choose their electricity retailer.

52 | P a g e
Energy Sector Overview Tasmania’s supply of energy
Table 7 - Tasmanian retail contestability timeline
Tranche Annual consumption at one site(1)
Approximate annual spend at one site
Customer Type Year contestability introduced
Tranche 1 ≥ 20 000 MWh/yr over $2 million/yr Mineral Processors 1 July 2006
Tranche 2 ≥ 4 000 MWh/yr over $400 000/yr Large industrial facilities
Large commercial complexes
1 July 2007
Tranche 3 ≥ 750 MWh/yr over $80 000/yr Medium factories and smaller commercial complexes
1 July 2008
Tranche 4 ≥ 150 MWh/yr over $25 000/yr Small factories and large offices
1 July 2009
Tranche 5a ≥ 50 MWh/yr over $10 000/yr Smaller offices 1 July 2011
Notes:
1 1MWh is equal to 1 000kWh
Source: OTTER
Unlike customers in Tranches 4 and above, customers in Tranche 5a will still be able to access tariffs regulated by OTTER, whereas the larger customers in other tranches that do not enter into a contract with a retailer revert to a Deemed Fallback Contract. This contract is designed to operate as a short term safety net and customers are only expected to remain on it for a short time to provide the opportunity to enter into a contract with a retailer.
There are four retailers currently licensed in Tasmania and able to compete with Aurora Energy for the provision of electricity to contestable customers. Neither Transend Networks nor Hydro Tasmania45 is licensed to retail electricity.
45 The Electricity Supply Industry Act 1995 precludes generators with a substantial degree of market power in the Tasmanian market from holding a licence to retail electricity in Tasmania. The granting of a retail license to Hydro Tasmania would, therefore, be impossible without legislative amendment, or until its predominant position in Tasmania is reduced.

53 | P a g e
Energy Sector Overview Tasmania’s supply of energy
AGL Sales Pty Ltd AGL was issued with a retail licence by OTTER on 15 October 2010, which authorises the company to retail electricity to contestable customers in Tasmania. AGL has advised OTTER that it does not intend offering market contracts to customers in Tasmania consuming less than four GWh of electricity per year. AGL also has retail licences in Victoria, New South Wales, Queensland and South Australia.
Aurora Energy Pty Ltd Aurora Energy holds a licence to retail electricity to both contestable and non-contestable customers on mainland Tasmania (including Bruny Island), and is the dominant retailer in the market. Aurora Energy is the only retailer authorised in Tasmania to supply electricity to non-contestable customers. Aurora Distribution is also the Retailer of Last Resort (RoLR) appointed under the Electricity Supply Industry Act 1995, with the responsibility for ensuring ongoing supply to consumers in cases where another retailer unexpectedly exits the industry, in order to provide time for those customers to make alternate arrangements with a new supplier of their choice.
ERM Power Retail Pty Ltd ERM Power is a publicly listed company, with electricity generation assets in Queensland, New South Wales and Western Australia. ERM’s licence application stated that the company planned to retail electricity only to large customers that consume more than 160 MWh annually, however the company is now understood to be retailing to significantly smaller users (which it is free to do under its retail licence). The Panel understands from early interaction with industry stakeholders that ERM Power and Aurora Energy are the primary competitors for smaller contestable customers.
Country Energy Country Energy is one of three New South Wales-based electricity retailers and has been purchased by Origin Energy as part of the NSW Government’s privatisation of that state’s electricity sector. Country Energy has advised the Tasmanian Economic Regulator that the company intends offering contracts only to customers consuming at least four GWh of electricity per annum. It is unclear what impact the purchase of Country Energy by Origin Energy will have on Country Energy’s retail presence and objectives in Tasmania.

54 | P a g e
Energy Sector Overview Tasmania’s supply of energy
TRUenergy Pty Ltd TRUenergy is a subsidiary of China Light and Power, and has electricity generation and retail businesses in Victoria, New South Wales, South Australia, Queensland and the Australian Capital Territory. TRUenergy also manages China Light and Power’s involvement in Roaring 40s Renewable Energy Pty Ltd, a joint venture with Hydro Tasmania to develop wind generation technologies and opportunities. TRUenergy has informed OTTER that it does not currently intend to offer retail electricity to customers in Tasmania who consume less than 4GWh of electricity per year.
Full Retail Contestability Customers that do not use enough electricity to be classed as contestable, which includes residential customers and the majority of small businesses, continue to be supplied by Aurora Energy under tariffs that are regulated by OTTER.
The introduction of full retail contestability has been a central feature of Tasmanian energy policy since the late 1990s. The Government’s decision to introduce retail contestability in Tasmania was in the context of a public benefit assessment being undertaken prior to the final tranche of customers moving to market arrangements, given the substantial costs involved in preparing the distribution and retail sectors for that level of competition.
The Government commissioned OTTER in September 2007 to undertake that public benefit assessment. OTTER produced a final report in July 2008, and a summary of the findings of the assessment is presented in Figure 23. The Government has decided to split the final Tranche 5 customers into two groups (a and b), and that Tranche 5a will be contestable from 1 July 2011.
The Minister for Energy has written to the Panel clarifying the Government’s expectation that the Panel will consider the broad issue of extending contestability to all customers as a part of its Review, having regard to the previous work undertaken by OTTER.

55 | P a g e
Energy Sector Overview Tasmania’s supply of energy
Figure 23 - The benefits of full retail contestability
In 2008, OTTER undertook an assessment of the public benefits of extending retail competition to all Tasmanian electricity customers, in response to a request from the Tasmanian Government.
OTTER assessed that, if implemented in a prudent manner, the introduction of Full Retail Contestability (FRC) would offer sufficient long term benefits to justify the costs of implementation. Accordingly, OTTER recommended that all Tasmanian electricity customers be made contestable as soon after 1 July 2010 as practicable, noting that a significant amount of work would be required to prepare for FRC, and that this work would be likely to take more than two years.
In its assessment of the costs and benefits of FRC, OTTER estimated that introducing FRC would require all small customers to pay an additional $20 to $35 per annum for the systems necessary to allow a fully competitive retail market to operate46.
OTTER also recommended that the regulation of prices would need to be continued until such time as new retailers established themselves in the market and effective competition emerged. While the purpose of ‘standing offers’ is to protect small customers, it was acknowledged by OTTER that customers who remained on a regulated standing offer rather than accept a market contract would be likely to pay $50 to $80 per annum more than they would under the then current tariffs.
OTTER also concluded that the principal beneficiaries of FRC would, in fact, be larger customers and the Tasmanian economy more generally, rather than residential and small business customers, because of the amount of electricity larger entities use and the scope for FRC to make Tasmania more attractive to new electricity retailers.
So, while it was considered that the benefits to customers in the longer term would outweigh these costs, OTTER noted that without appropriate transitional measures and consumer protection, the potential benefits of FRC may not be realised by small customers if the electricity supply industry was ultimately unable to support and deliver a dynamic contestable retail market.
The entry of new retailers into the market and their ability to provide effective retail competition was found by OTTER to be dependent on a range of factors, the most significant of these being the scope for competing retailers to procure cheaper wholesale energy on their customers’ behalf. This requires effective competition between generators in the wholesale electricity market, in the form of generators that are responsive to the competitive pressure flowing from increased retail competition.
In New South Wales, Queensland and Victoria, the introduction of FRC was supported by actively competitive wholesale markets. OTTER concluded that this contrasts markedly with Tasmania’s wholesale electricity market, however, which is dominated by a single generator with a high degree of market power.
OTTER concluded that a competitive wholesale electricity market is key to the ability of retailers to deliver better pricing outcomes for their customers because the costs generation represent a much larger contribution to overall customer bills than do the costs incurred by electricity retailers in providing services to their customers. This means that efficiencies resulting in even significantly lower retailer costs are likely to deliver no more than relatively small cost savings for customers. For significant benefits to be realised by customers, they will primarily need to be driven by the scope for competing retailers to procure cheaper wholesale energy on their customers’ behalf.
46 Aurora Energy is understood to have completed some of this work since the Economic Regulator released his findings in 2008, though substantial investment remains for the introduction of FRC

56 | P a g e
Energy Sector Overview Tasmania’s supply of energy
Summary: Electricity Retail On the basis of retailer numbers, there has been limited entry of new retailers into the
Tasmanian retail sector, and several of these have taken a commercial decision not to pursue smaller industrial and commercial customers. The Panel will seek to identify the strength of competition within the various tranche levels, and identify reforms that could enhance it.
The introduction of full retail contestability in electricity was assessed by OTTER in 2008. OTTER concluded that if implemented in a prudent manner, full retail contestability would offer sufficient long-term benefits to justify its implementation.
OTTER noted that the additional will need to be recovered from the general customer base regardless of whether some customers benefit from choosing a new retailer.
There is a degree of uncertainty about the willingness of new retailers to enter into the Tasmanian market, and the Panel will investigate this during the Review.
The high proportion of households which are provided with subsidised electricity through pensioner concession potentially further reduces the size of the residential market likely to be targeted by new entrant retailers. The Panel will explore the factors that drive the attraction (or otherwise) of the Tasmanian retail market with retailers as a part of the Review.
The Regulator concluded that the ability of new retailers to provide effective retail competition is partly a function of their ability to secure differing and competitive wholesale electricity arrangements. This is a key matter that the Panel is examining as a part of the Review.
57 | P a g e
Energy Sector Overview Tasmania’s supply of energy
4.2. Natural Gas Supply
Most markets for natural gas are based on contractual arrangements between producers, the owners of pipeline or network assets, major users and retailers, all of whom are linked together through pipeline hubs connecting gas fields to gas consumers. The natural gas supply chain is, therefore, not dissimilar to that in the electricity supply industry, in that involves four key functions: production, transmission, distribution and retail.
4.2.1. Production and processing Tasmania’s natural gas is sourced from Bass Strait’s gas fields and processed at facilities in Longford, Victoria, which is the onshore receiving point for all of the oil and gas output from offshore production platforms in Bass Strait.
The Longford gas processing plant is owned by Esso Australia and BHP Billiton Petroleum in a 50:50 joint venture arrangement. The plant is operated by Esso Australia, which is a subsidiary of the multi-national Exxon Mobil Corporation.
4.2.2. Transmission and Distribution
Transmission Natural gas is brought to Tasmania via the Tasmanian Gas Pipeline, which extends from Longford in Victoria to Bell Bay in the State’s north, and then on to Port Latta in Tasmania’s northwest and Bridgewater in the south. This project was completed by Duke Energy International in 2002.
Not unlike the electricity transmission network, the backbone gas distribution network directly supplies approximately 20 major industrial and commercial customers (who require higher volumes and/or pressures of gas) from eight ‘take-off’ stations on the Tasmanian Gas Pipeline. The take-off stations are located at Hobart, Launceston, Devonport, Burnie, Longford, Bell Bay, Wynyard and Westbury, and gas is also supplied from those points to the natural gas distribution networks that service domestic and small to medium sized commercial customers in those centres.
The Tasmanian Gas Pipeline is now owned by Prime Infrastructure, an Australian public company which owns, manages and operates a range of infrastructure assets globally, primarily in the energy and transport sectors. The pipeline is operated and maintained by TasGas Networks Pty Ltd, formerly Powerco Tasmania Pty Ltd, which is a wholly owned subsidiary of Prime Infrastructure.

58 | P a g e
Energy Sector Overview Tasmania’s supply of energy
Distribution After the transmission pipeline was completed in 2002, a distribution network was progressively rolled out to residential and small to medium sized commercial customers, including residential customers in specific suburbs of Hobart, Launceston, Devonport and Burnie. The gas reticulation network was completed during 2006-07 and now runs past 43 000 properties.
The rollout was supported by substantial financial assistance from the Tasmanian Government under a Heads of Agreement.
The Tasmanian Government conducted a competitive process to facilitate the rollout of natural gas distribution. The Government eventually entered into a memorandum of understanding with Powerco Limited (a New Zealand-based electricity and distribution business) for a two-stage construction process.
Stage one saw the rollout of a backbone network to industrial customers in major Tasmanian cities and towns, with 100 km of pipeline being laid by 2005. The project cost of stage one was around $34 million. Stage two involved a further 612 km of distribution network progressed through urban areas around Tasmania, and was completed in April 2007. 47 The Panel understands that around $54 million has been provided by the State Government to support the two rollout stages, which represents just under one quarter of the estimated $230 million total capital cost. 48
Since the completion of the stage two rollout, TasGas’ focus has been on achieving customer connections to the network from amongst the 43 000 properties that the distribution now passes. TasGas has also made public statements about its desire to work with the Government to achieve a further rollout of the distribution network.
4.2.3. Natural Gas Retail From the commencement of natural gas market operations in Tasmania, the natural gas industry in Tasmania has been a fully contestable market. As at the end of 2009-10 there were three gas retail licence holders in Tasmania, although this has since decreased to two, after one licence holder, County Energy, surrendered its retail licence. A fourth retailer, TRUenergy, previously surrendered its retail licence in July 2009.
47 http://www.tasgasnetworks.com.au/index.php?option=com_content&view=article&id=14&Itemid=16 48 Discussions with TasGas Pty Ltd.

59 | P a g e
Energy Sector Overview Tasmania’s supply of energy
Unlike the State’s electricity supply industry, there is no retailer of last resort in the natural gas market.
Currently, Aurora Energy Pty Ltd and TasGas Retail Pty Ltd are the only licensed retailers operating in the Tasmanian natural gas retail market. Based on figures published by OTTER in the Tasmanian Energy Supply Industry Performance Report 2009-10, Figure 24 shows the number of customers serviced by each retailer.
Figure 24 - Tasmanian natural gas customer numbers, by retailer
Source: Tasmanian Energy Supply Industry Performance Report 2009-10, OTTER
TasGas Retail TasGas Retail is a wholly owned subsidiary of Prime Infrastructure. TasGas Retail and TasGas Networks are, therefore, related entities, both being subsidiaries of the same company.
In order that other gas retailers are not disadvantaged by TGRs relationship with TGN, the Tasmanian Economic Regulator required TasGas Networks to develop, publish and implement a ‘ring fencing’ policy, which is intended to ensure that TasGas Retail does not:
obtain an unfair advantage over other retailers through subsidisation of its costs by the distributor (TasGas Networks), whether directly through preferential prices or indirectly through, for example, sharing premises, information technology etc;
receive an unfair advantage through the use of information belonging to the TasGas Networks; or
benefit unfairly from having a common brand name with the distributor.
Compliance on the part of TasGas Networks with its ring fencing policy is independently and regularly audited.

60 | P a g e
Energy Sector Overview Tasmania’s supply of energy
As at 30 June 2010, TasGas Retail had 4,591 natural gas retail customers, of which approximately 89 per cent were residential customers and the remainder business and industrial customers. 49
Aurora Energy As at 30 June 2010, Aurora Energy had over 3,450 natural gas retail customers, of which approximately 97 per cent were residential customers and the remainder small and large business customers.50
4.2.4. Market arrangements Underpinning the physical operation of the natural gas market are the financial flows that relate to the physical supply of gas.
Market settlement Market settlement involves metering the gas flowing in to and out of the distribution system to determine who has consumed the gas. This allows for the allocation of natural gas commodity, transmission and distribution costs between retailers and customers.
This process is also used to determine unaccounted for losses of natural gas from the relevant network and allocate the cost of these losses across market participants.
Customer transfer To facilitate full retail contestability from the commencement of the Tasmanian natural gas market, the Director of Gas51 developed a Gas Customer Transfer and Reconciliation Code under the provisions of the Gas Act 2000. The Code ensures that customers have access to an efficient, fair and simple system by which they can transfer between retailers, and enables the associated financial impacts on market participants to be accounted for. The Code sets out obligations concerning the provision of information, the customer transfer process and the process for the allocation and reconciliation of gas quantities between retailers, in the absence of actual daily and/or monthly consumption metering.
The Transfer Code also details technical requirements in relation to metering. It is binding upon market participants.
49 Tasmanian Energy Supply Industry Performance Report 2009-10, OTTER 50 ibid 51 The role of the Director of Gas was subsumed by the Tasmanian Economic Regulator on 1
June 2010

61 | P a g e
Energy Sector Overview Energy Pricing
5. Energy Pricing The Panel’s Discussion Paper, “Tasmanian Electricity Pricing Trends “discusses electricity pricing in detail, including the factors which drive pricing outcomes. The following section of this paper, therefore, provides only a high-level overview of electricity pricing in Tasmania.
5.1. Composition of electricity bills
The electricity bills paid by customers cover more than the just the cost of generating the energy consumed. Through a combination of fixed and variable charges, customers are also billed for the transportation of that electricity through the transmission and distribution network, as well as the provision of services by their electricity retailer, such as metering, billing and customer service functions.
Figure 25 shows components of electricity prices in Tasmania following the most recent retail price determination by OTTER.
Figure 25 - Components of Tasmanian residential & small business electricity prices
Source: Electricity Pricing - Information Sheet, Office of the Tasmanian Economic Regulator
The key point to observe is that the cost of actual energy in the delivered price (tariff) comprises around 40 per cent of the delivered price of electricity, with the majority of cost incurred in delivering that electricity to customers through the networks (around 50 per cent) or in the systems and processes required to manage accounts.
To provide a comparison with other jurisdictions, Figure 25 shows the composition of a typical retail electricity bill for a residential customer in each NEM jurisdiction that regulates prices.

62 | P a g e
Energy Sector Overview Energy Pricing
Based on analysis by the Australian Energy Regulator, across the NEM in 2009-10, wholesale energy costs accounted for around 37 – 45 per cent of retail bills, while network charges accounted for 43 – 51 per cent. Electricity retailers’ operating costs ranged between four – eight per cent, and retail profit margins were within a range of three – five per cent.
Figure 26 - Indicative components of residential electricity bills
Source: State of the energy market 2010, Australian Energy Regulator Note: Victoria is not shown as retail electricity prices are not regulated in Victoria
5.2. Comparative electricity pricing
5.2.1. Comparative electricity costs - residential OTTER undertakes regular comparisons of Tasmanian electricity prices with electricity prices interstate, the results of which are published annually.
In the Tasmanian Energy Supply Industry Performance Report 2009-10, OTTER noted in relation to residential electricity prices that:
Tasmanian residential tariffs have higher fixed daily charges and lower average energy rates than their equivalents interstate52; and
for most residential customers, the incremental cost of using additional electricity is lower in Tasmania than in other states.
52 Tasmanian Energy Supply Industry Performance Report 2009-10, Office of the Tasmanian Economic Regulator

63 | P a g e
Energy Sector Overview Energy Pricing
Comparison of the effective per kWh price paid for electricity, taking consumption related costs and fixed costs into account, showed that:
low consumption Tasmanian standard tariff residential customers face an average per kWh cost for their electricity in the high range of that experienced across Australia;
high consumption residential customers typically incur per kWh electricity costs in the mid to low range of Australian prices;
the prices of off-peak electricity in other states and territories, where thermal generation predominates, are lower than those on offer to Tasmanian customers;
the Tasmanian Government's electricity concessions are some of the most generous in Australia, with generally broader eligibility criteria than apply in other jurisdictions; and
approximately one in three residential customers receive the concession, and once this discount is taken into consideration, residential customers in Tasmania using between 50 and 200 per cent of State average consumption (9 399 kWh53 in 2009-10) paid a price for their electricity which was in the low range of that paid elsewhere in Australia.
These comparisons were necessarily based on published standing tariffs available from electricity retailers in other states, and OTTER noted that customers in other states may have access to cheaper products.
5.2.2. Comparative electricity costs – small business OTTER concluded that, in 2010, small business customers with very low annual consumption would have incurred electricity costs in the low to mid range of the rates available in other states and territories. 54
While Tasmanian small business customers with average to high consumption of electricity (not including major industrial users of electricity) would have paid some of the highest electricity prices in Australia, it was noted by OTTER that very few businesses in Tasmania would be likely to have used the levels of electricity required for this to be the case.
5.2.3. Comparative electricity costs – business & commercial customer OTTER has noted the inherent difficulty involved in comparing prices for business customers because of the different stages of retail contestability within the NEM, and the impact that retail contestability has on the accessibility of pricing information, given that contract prices for electricity are not publicly disclosed.
53 2009/2010 Aurora Annual Report, Aurora Energy 54 Tasmanian Energy Supply Industry Performance Report 2009-10, OTTER

64 | P a g e
Energy Sector Overview Energy Pricing
All business customers are now contestable in New South Wales, Victoria, South Australia and the Australian Capital Territory. While all of those markets, with the exception of Victoria, have regulated safety net tariffs and/or other arrangements in place for business customers who do not enter into a contract, and retailers in Victoria are at least obliged to have standing offers, comparisons of those published safety net tariffs and standing offers are of limited value, because of the likelihood that contracted customers are likely to secure significantly lower electricity pricing.
Nonetheless, comparisons by OTTER of the typical per kWh electricity costs borne by business customers, based on published standing offers and safety net arrangements in other states, showed that in 2009-10:
Business customers in Tasmania that consumed between 20 MWh per annum (approximately $1 150 per quarter) and 40 MWh per annum (approximately $2 195 per quarter) were subject to prices that were in the mid-range of prices available across Australia; and
Business customers on low voltage demand tariffs were charged competitive prices with those available elsewhere in Australia.
5.2.4. Major industrial pricing Ever since the debate in 1916 over the price at which the Hydro-Electric Department had contracted to supply the new zinc smelter being constructed by the Electrolytic Zinc Company of Australasia at Risdon, the Tasmanian public has held a keen interest in the relative price of electricity paid by small and large users in Tasmania.
The debate about the “the zinc bargain”, as it was known at the time, was arguably the beginning of the ongoing speculation that significant cross-subsidisation exists between different classes of customers. This idea has been fuelled over the intervening years by pricing for large users of electricity that has lacked transparency from the perspective of the general community.
No published information is available in relation to the prices paid by Tasmania’s largest commercial and industrial users of electricity.
Recent history shows that these arrangements are of particular commercial importance to Hydro Tasmania (given the volume of electricity involved), and it has been active in negotiating wholesale arrangements with major customers directly, with the customer negotiating retailing arrangements separately.55
55 More typically, an end user would contract only with the retailer for a ‘delivered cost’, and the retailer would back those arrangements with wholesale contracts with generators.

65 | P a g e
Energy Sector Overview Energy Pricing
The Panel is examining major customer pricing as a part of its Review to determine whether there are (and the nature and extent of them if they exist) any cross subsidies between very large and other electricity users in Tasmania.
5.2.5. Aurora Pay As You Go Approximately 39,000 (17 per cent) of Tasmania’s residential customer base use the Aurora Pay As You Go (APAYG) pre-paid metering product. The number of APAYG connections has declined in recent years from just under 45,000 in 2007-08.
Unlike Aurora’s standard residential tariffs, APAYG offers prices that vary according to time-of-use and the time-of year, and the prices are not regulated by OTTER as it is a ‘choice’ product - all customers have the option of reverting to (or staying on) regulated tariffs. OTTER does, however, publish an annual comparison of APAYG rates and standard residential tariffs.
OTTER notes the difficultly involved in making a definitive comparison between APAYG and standard regulated tariffs because the bills for standard tariff customers are calculated on consumption for each tariff over a quarter and APAYG charges vary according to time of use and summer and winter rates.
Based on the rates for APAYG customers published on 1 August 2010 and rates for standard regulated tariff customers published on 1 July 2010, OTTER concluded that:
APAYG Standard customers (light and power only) may be paying more per fortnight than customers on the standard regulated tariff, regardless of consumption level, although the difference in fortnightly cost is not significant, at less than $5 per fortnight regardless of consumption levels;
APAYG HydroHeat customers generally pay up to $7 more per fortnight – including the cost of general light and power – than standard regulated tariff customers with HydroHeat, but $3 less per fortnight in winter;
For APAYG HydroHeat customers who also receive a concession, they may pay $3 per fortnight more for their electricity during summer than customers on standard tariffs, but around $6 per fortnight less in winter, equating to the APAYG customer paying up to $64 less during the course of a year;
For many Off Peak customers, the fortnightly cost is generally higher for APAYG customers compared to those on the standard regulated tariffs, although high consumption APAYG Off Peak customers were assessed as paying marginally less than customers on the regulated off-peak tariff, and APAYG customers with a concession may pay as little as $3 more per fortnight in summer and around $3 less per fortnight in winter;
For customers eligible for a concession, APAYG offers savings compared to customers paying the standard regulated tariffs, although the savings are not significant; and

66 | P a g e
Energy Sector Overview Energy Pricing
Overall, while APAYG may be less attractive for some non-concession customers than the standard regulated tariffs, APAYG costs are on a par with standard regulated tariffs for customers with high consumption winter usage, and slightly lower for HydroHeat customers, due to the lower APAYG winter rates.
5.2.6. Price rises The Panel’s discussion paper “Tasmanian Electricity Pricing Trends” discusses how Tasmanian electricity prices have changed since 2000, and discusses the drivers of those price changes. Tasmanian non-contestable customer prices rose by around six per cent during 2009-10, with a further six per cent increase occurring on 1 July 2010. OTTER has determined that prices would again increase by 8.8 per cent from 1 December 2010, a further 8.5 per cent on 1 July 2011 and 8.7 per cent on 1 July 2012.
This upward trend in prices is not isolated to Tasmania. The prices of electricity are increasing across Australia. For example:
In New South Wales, regulated electricity prices rose by up to 21.7 per cent in 2009-10, with further increases of between seven - 13 per cent expected in 2010-11.
The Queensland Competition Authority increased regulated electricity prices for 2009-10 by 11.8 per cent, which increased to 15.5 per cent following an appeal by energy retailers.
In Victoria, standing offer electricity prices rose by around 12 – 19 per cent in 2009-10 (Note that customers in each of these states may be able to negotiate discounts against these prices by entering in to a contract.)
OTTER has cited rising network charges as a significant driver of price increases. This situation is not unique to Tasmania.
In the case of New South Wales, the Independent Pricing and Regulatory Tribunal (IPART) found that higher network charges accounted for 50 per cent of the 2009-10 price increases and 80 per cent of the 2010-1 increases
The Queensland Competition Authority attributed around 61 per cent of the projected rise in prices in 2010-11 to rising network charges.
Figure 27 shows the indicative changes in residential electricity prices which have occurred in each capital city within the NEM over the last 20 years. While electricity prices in Tasmania have clearly trended upwards, the chart shows that this trend is consistent with experiences interstate, and that more recently prices have been increasing at a faster rate in some other states and territories than they have in Tasmania.
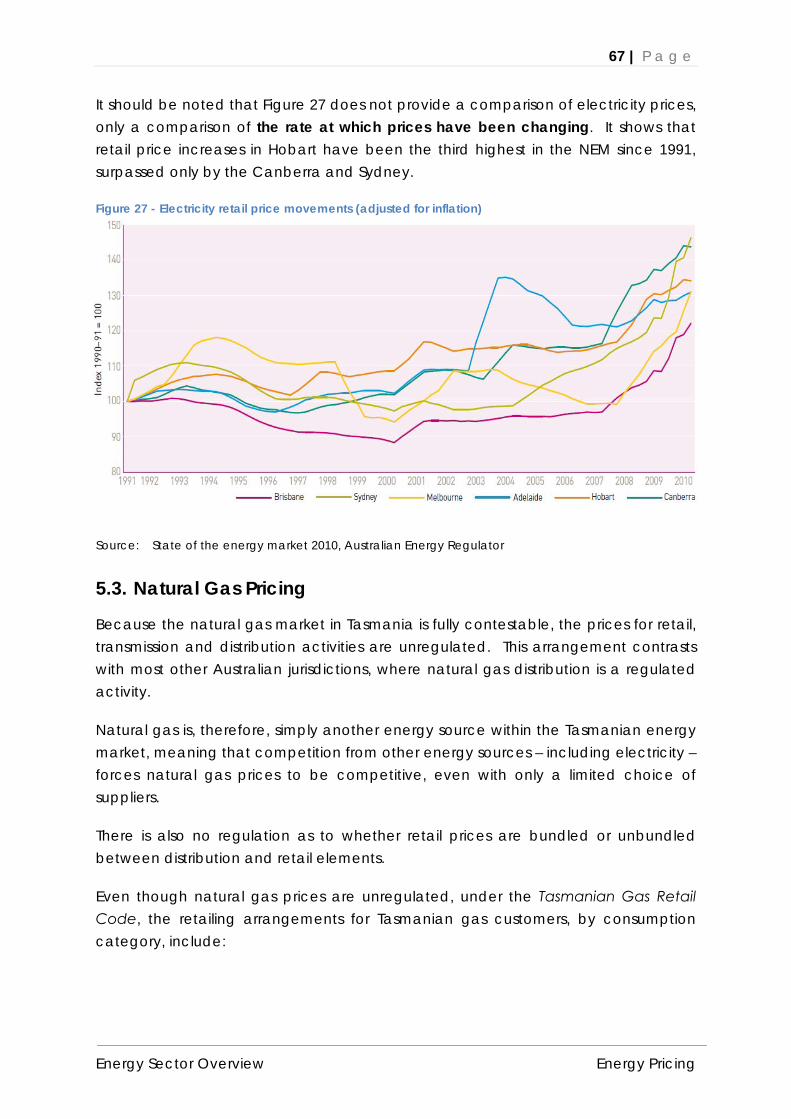
67 | P a g e
Energy Sector Overview Energy Pricing
It should be noted that Figure 27 does not provide a comparison of electricity prices, only a comparison of the rate at which prices have been changing. It shows that retail price increases in Hobart have been the third highest in the NEM since 1991, surpassed only by the Canberra and Sydney.
Figure 27 - Electricity retail price movements (adjusted for inflation)
Source: State of the energy market 2010, Australian Energy Regulator
5.3. Natural Gas Pricing
Because the natural gas market in Tasmania is fully contestable, the prices for retail, transmission and distribution activities are unregulated. This arrangement contrasts with most other Australian jurisdictions, where natural gas distribution is a regulated activity.
Natural gas is, therefore, simply another energy source within the Tasmanian energy market, meaning that competition from other energy sources – including electricity – forces natural gas prices to be competitive, even with only a limited choice of suppliers.
There is also no regulation as to whether retail prices are bundled or unbundled between distribution and retail elements.
Even though natural gas prices are unregulated, under the Tasmanian Gas Retail Code, the retailing arrangements for Tasmanian gas customers, by consumption category, include:

68 | P a g e
Energy Sector Overview Energy Pricing
for customers consuming between one and five TJ per annum, gas retailers negotiate specific tariff agreements and provide a bundled price, including retail and distribution service costs;
for customers consuming between five and ten TJ per annum, gas retailers generally only provide the retail agreement, with the end consumer required to contact TasGas Networks directly for distribution services.
Customers consuming above ten TJ per annum are not considered to be small retail customers, and are not covered by the provisions of the Gas Act and Gas Retail Code.
5.3.1. Composition of natural gas bills Analysis undertaken by OTTER concludes that, for the average customer on a reticulated natural gas retail tariff, the cost of their gas supply can be broken down as shown in Figure 28
Figure 28 - Breakdown of natural gas bills
Source: Tasmanian Energy Supply Industry Performance Report 2009-10, Office of the Tasmanian Economic Regulator
While this breakdown is approximate, and is likely to differ for each tariff, the Economic Regulator considers that it provides a reasonable indication of the impact that each part of the industry has on the final bill. It was noted by OTTER, however, that the net retail margin for Tasmanian natural gas retailers is likely to be significantly less than the 19 per cent indicated in Figure 28, as this figure does not take into account the ‘cost to serve’ incurred by retailers.
Cost to serve represents the cost to a retailer of providing services to customers and includes billing and revenue collection, marketing expenditures, the provision of advice and answers to customer queries (via a call centre and/or website), as well as an appropriate proportion of corporate overheads and regulatory compliance costs.
69 | P a g e
Energy Sector Overview Energy Pricing
OTTER noted that the net retail margin in Tasmania appeared similar to the net retail margin in Victoria.
5.3.2. Comparative gas pricing As with electricity, undertaking meaningful comparisons between interstate prices requires consideration of many factors, including the different weightings placed on fixed (daily) charges and variable (consumption related) charges. Most mainland gas retailers also offer off-peak pricing, reflecting the fact that those systems are capacity constrained, whereas the unutilised capacity within the Tasmanian transmission network means that the pricing policies of the two gas retailers operating in Tasmania do not reflect time of use.
OTTER undertakes a comparison of the natural gas prices experienced in Tasmania and interstate for both residential and business consumers. As the gas market is still in its infancy, no historical trend information is available.
Residential customers Based on the tariffs available as at 4 August 2010, the Tasmanian Economic Regulator concluded that Tasmanian natural gas users were paying in the low to mid range of natural gas prices across Australia. Victoria was assessed as the only state to offer lower per MJ prices, while Queensland, Western Australian and South Australian customers were assessed as paying higher prices for natural gas under the analytical model adopted by OTTER.
There are no pensioner concessions available in relation to natural gas.
Business customers OTTER noted that obtaining comparative prices for business customers in each state is problematical because of the difficulties involved with researching the (undisclosed) contract prices paid by business customers in a contestable market.
To the extent that analysis of the gas prices paid by business customers was able to be undertaken, OTTER concluded that, overall, Tasmanian natural gas prices appeared to be in the upper band of natural gas business rates available elsewhere in Australia.
70 | P a g e
Energy Sector Overview Energy Pricing
5.4. Concessions
5.4.1. Pensioner discount In 2007-08, 34.1 per cent of Tasmanian households relied upon government pensions and allowances as their primary source of income, the highest proportion of all states and territories. 56
Under a Community Services Activity Agreement (CSAA) with the Tasmanian Government, Aurora Energy provides a discount of 100.60 cents per day ($367 per annum) to eligible low-income earners who hold pensioner concession or health care cards. The State Government reimburses Aurora Energy for the cost of meeting its community service obligations, including any associated administration costs.
Based on the electricity prices as at 1 August 2010, analysis by the OTTER concluded that residential electricity customers in Tasmania who were entitled to receive a concession paid prices in the low range of those available in Australia. 57
The current concession is one of the most generous available in Australia. 58 By way of comparison, the concessions available in New South Wales, the Australian Capital Territory, Queensland and South Australia are capped at $112, $195, $190 and $150 per annum respectively. The Tasmanian State Government also made a one-off payment of $100 to eligible concession customers as at 1 September 2010, effectively raising the concession in Tasmania to $440 in 2010-11.
Eligibility for the concession in Tasmania is also generally broader than in other states.
Over the last decade, the cost to the Tasmanian Government of the pensioner discounts has been $138.5 million, plus $0.9 million in administrative costs associated with Aurora Energy delivering the concession, see Table 8. As a result of the funding arrangements that are in place, Aurora’s business performance has not been compromised as a result of delivering these non-commercial services, nor is there any indirect impact on the prices paid by other customers. Electricity concessions are now indeed in line with electricity prices, rather than inflation, which preserves their real value over time.
56 Household Income and Income Distribution, Australia, 2007-08, Cat No 6523.0 Australian Bureau of Statistics,
57 Comparison of 2010 Australian Standing Offer Energy Prices, OTTER 58 ibid

71 | P a g e
Energy Sector Overview Energy Pricing
In 2009-10, Aurora Energy residential customers received discounts worth a total of nearly $23.2 million. As at 30 June 2010, 78 490 customers were eligible for the electricity discount. Based on a total of 226 97759 residential customers, this means that just over one third (34.6 per cent) of Tasmanian households currently pay less than full price for their electricity.
Table 8- Expenditure on pensioner discounts, 2000-01 to 2009-10
Year Pensioner Discount Expenditure ($m)
2000-01 9.719
2001-02 9.745
2002-03 13.005
2003-04 11.319
2004-05 11.520
2005-06 11.191
2006-07 11.775
2007-08 14.207
2008-09 22.917
2009-10 23.151
Total 138.549
Administration costs (2000-01 to 2009-10) 0.830
Additional concession payment (2010) 7.605
Combined total 146.984
Source: Aurora Energy
5.4.2. Life support discount Aurora Energy provides an electricity discount to customers who use an approved life support system, or live with someone who uses one. The approved life support systems and cents per day discounts, currently at 1 July 2010 are shown in Table 9
59 2009/2010 Aurora Energy Annual Report

72 | P a g e
Energy Sector Overview Energy Pricing
Table 9- Life support discount
Type of Machine Discount (cents per day)
Oxygen concentrator 42.1811
Peritoneal dialysis machine 31.2958
Haemo-dialysis machine 31.2958
Chronic positive pressure & airways regulator 14.9675
Respirator (iron lung) 55.7880
OXCP (combine 1 & 4 above) 57.1486
Phototherapy 79.4888
Source: Aurora Energy
5.4.3. Financial hardship assistance In 2004-05, Aurora Energy implemented a Hardship Policy, under which residential customers who are finding it difficult to pay their electricity bills on time and are, as a result, at risk of disconnection, are able to access financial counselling, repayment plans and financial support, funded by Aurora Energy. Aurora Energy has no role in determining the allocation of funds, with the program being administered by the Salvation Army, which distributes the funds to its own clients, as well as other welfare bodies that, in turn, distribute their allocations to their clients.
In the first five full-years of the programme, community agencies allocated approximately $680,000 to their clients. By 2009-10, the number of assistance payments made had increased by 160 per cent compared to the first full-year of the Policy’s operation, and the total amount of the payments has nearly trebled (see Table 10).
Table 10 - Aurora Energy Hardship Policy Expenditure
Year Number of payments
Amount/Funding
2005-06 857 $94 461
2006-07 930 $88 119
2007-08 1 069 $92 541
2008-09 1 276 $134 000
2009-10 2 226 $270 000
2010-11 - $286 400
Total $965 521
Source: Information provided by Aurora Energy
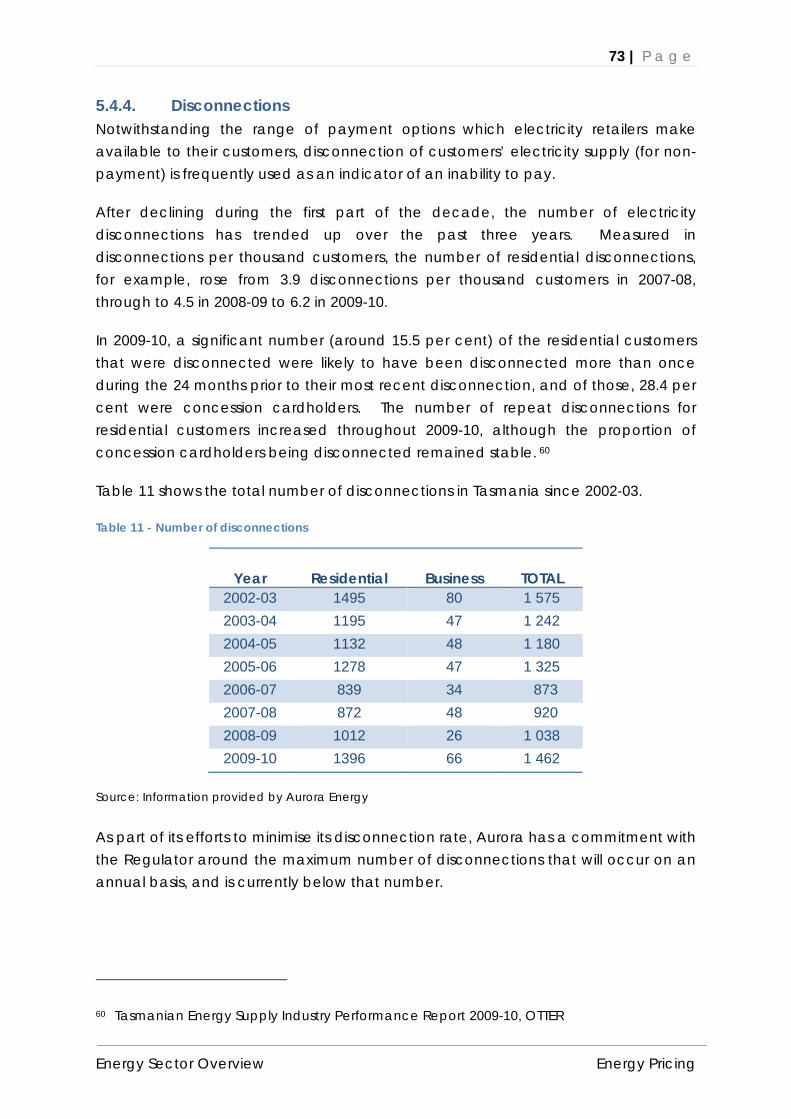
73 | P a g e
Energy Sector Overview Energy Pricing
5.4.4. Disconnections Notwithstanding the range of payment options which electricity retailers make available to their customers, disconnection of customers’ electricity supply (for non-payment) is frequently used as an indicator of an inability to pay.
After declining during the first part of the decade, the number of electricity disconnections has trended up over the past three years. Measured in disconnections per thousand customers, the number of residential disconnections, for example, rose from 3.9 disconnections per thousand customers in 2007-08, through to 4.5 in 2008-09 to 6.2 in 2009-10.
In 2009-10, a significant number (around 15.5 per cent) of the residential customers that were disconnected were likely to have been disconnected more than once during the 24 months prior to their most recent disconnection, and of those, 28.4 per cent were concession cardholders. The number of repeat disconnections for residential customers increased throughout 2009-10, although the proportion of concession cardholders being disconnected remained stable. 60
Table 11 shows the total number of disconnections in Tasmania since 2002-03.
Table 11 - Number of disconnections
Year Residential Business TOTAL 2002-03 1495 80 1 575 2003-04 1195 47 1 242 2004-05 1132 48 1 180 2005-06 1278 47 1 325 2006-07 839 34 873 2007-08 872 48 920 2008-09 1012 26 1 038 2009-10 1396 66 1 462
Source: Information provided by Aurora Energy
As part of its efforts to minimise its disconnection rate, Aurora has a commitment with the Regulator around the maximum number of disconnections that will occur on an annual basis, and is currently below that number.
60 Tasmanian Energy Supply Industry Performance Report 2009-10, OTTER

74 | P a g e
Energy Sector Overview Energy Pricing
A comparison with other states indicates that while the disconnection rate in Tasmania has increased over the past few years, outside of Tasmania the rate of disconnections has been decreasing (see Figure 29). Nonetheless, the rate of disconnections in Tasmania remains relatively low compared to disconnection rates in some other jurisdictions, despite the fact that average per capita incomes in Tasmania are lower than in other jurisdictions and interstate residential electricity accounts are typically smaller (due to lower energy consumption and access to natural gas as an alternative fuel source), making them more easily paid. Disconnection rates can also be influenced by electricity retailers’ credit management practices.
Once the National Energy Customer Framework (NECF) is introduced, the disconnection and hardship policy process will be administered by the AER.
Figure 29 - Residential disconnection rates
Source: Tasmanian Energy Supply Industry Performance Report, OTTER

75 | P a g e
Energy Sector Overview Energy Pricing
Summary: Pricing Distribution and transmission charges represent nearly 50 per cent of the costs
embedded in the electricity bills paid by Tasmanian retail customers, which is more than the wholesale cost of the electricity consumed.
As has been the case across Australia, electricity prices in Tasmania have increased significantly in recent years. The Panel is publishing more detailed information on the drivers of these price increases in its Discussion Paper “Tasmanian Electricity Pricing Trends”.
Residential tariffs in Tasmania have higher fixed charges and lower average energy rates than their equivalents interstate.
Residential customers typically incur per kWh electricity costs in the mid to low range of Australian prices, with the exception of low consumption residential customers, who incur an average per kWh cost for their electricity which is in the high range of that experienced across Australia
Higher levels of electricity consumption in Tasmania also contribute to higher levels of expenditure on electricity for businesses and households in Tasmania relative to interstate counterparts.
The electricity concessions available in Tasmania are some of the most generous in Australia, with generally broader eligibility criteria.
Just over a third of residential customers in Tasmania receive the concession, resulting in effective prices for their electricity (per kWh) which are in the low range of that paid elsewhere in Australia even though their total bills may still be relatively high as a result of the amount of electricity they consume.
The State Government funded electricity concessions have cost a total of $147 million over the last decade.
Tasmania’s residential electricity prices reflect that there is only one distribution network operator, and do not differentiate between regional and urban customers. In other regions of the NEM, distribution charges may vary between network operators and according to location, which can impacts on the prices paid by otherwise similar customers.
Small business customers with very low annual consumption incur electricity costs in the low to mid range of the rates available in other states and territories, while business customers with average to high consumption of electricity pay some of the highest electricity prices in Australia.
Larger business customers in Tasmania are subject to prices in the mid range of those available across Australia.
76 | P a g e
Energy Sector Overview Performance
6. Performance Electricity system performance is generally measured by the reliability, quality and security of electricity supply.
Reliability refers to the ability of the system to supply the energy requirements of consumers at all times. The reliability of electricity systems can be affected by a range of factors at all stages in the supply chain, including:
Availability of generating capacity to meet demand; The availability of transmission capacity to convey electricity to distribution
networks; Unexpected contingency events that can affect generation or transmission; and The performance of the distribution network in delivering electricity to
consumers’ premises.
Quality of supply refers to the maintenance of system frequency and voltages within established acceptable parameters.
Security of supply relates to the ability of a system to withstand disturbances like short circuits. A secure system has measures in place to ensure that equipment is protected from damage and operates within limits so as to minimise interruptions due to contingency events.
Under the National Electricity Rules, AEMO has overall responsibility for ensuring that the power system is operated in a safe, secure and reliable manner. OTTER has a statutory responsibility to establish and monitor proper performance standards in the supply of electricity and natural gas in Tasmania. Network performance requirements are set through the Tasmanian Electricity Code (TEC), price determinations and regulations.
Measuring electricity system performance is a highly technical undertaking and is further complicated by the fact that performance is measured differently for generation, transmission and distribution. The TEC requires OTTER to review and report annually on the performance of the industry. The Regulator also prepares an annual Reliability Review Report. Both reports provide highly detailed information on the performance of Tasmania’s electricity system and are available at www.economicregulator.tas.gov.au
Provided below is a brief ‘snapshot’ of the general features of, and trends in, Tasmania’s power system performance, drawn largely from information contained in OTTER’s most recent reports.

77 | P a g e
Energy Sector Overview Performance
6.1. Generation
The key drivers of generation performance are the availability and adequacy of generating plant to meet generation requirements on an ongoing basis. In the case of Hydro Tasmania, the ability of its installed generation to meet generation requirements also depends on water storages.
6.1.1. Availability Generating plan cannot always be available for generation, due to planned maintenance, unplanned outages or the loss of generation capacity. Regardless of the cause, the readiness of generation plant to meet the demand for electricity is expressed in terms of an ‘availability factor’.
The availability of generation plant in Tasmania, both hydro and thermal, is generally above the average elsewhere in Australia61, mainly because hydroelectric power plants are inherently more reliable than coal-fired plants. Comparisons undertaken by OTTER also suggest that Hydro Tasmania’s performance is on par with hydro-electric generators in other countries, including the United Kingdom and North America62.
Tasmania’s availability performance tends to be more heavily influenced by planned and maintenance outages than the less frequent, but more critical, forced outages. Hydro Tasmania’s performance with respect to planned outages deteriorated in 2009-10, which Hydro Tasmania attributes to ongoing investment in the maintenance of ageing assets. Nonetheless, the level of planned outage in 2009-10 was still comparable with the hydro generation scheduled outage factor reported in North America.
Historically, the frequency of forced generation outages in Tasmania is lower than that recorded in all other states, which – again – may be attributable to the inherent reliability of hydro generation compared to thermal power stations. In 2009-10, Tasmania’s overall forced outage rate was comparable to other states and again compared favourably with large hydro schemes in North America.
61 Tasmanian Energy Supply Industry Performance Report 2009-10, Office of the Tasmanian Economic Regulator
62 ibid

78 | P a g e
Energy Sector Overview Performance
6.1.2. Adequacy Tasmania’s reliance on hydro generation leaves the State exposed to the risk associated with variations in rainfall and subsequently dam inflows. The development of significant water storage capacity has not completely mitigated this risk. Changing rainfall patterns indicate that inflows into Hydro Tasmania’s storages have been significantly lower over the past 13 years than for any other period for which records exist, and this has resulted in Hydro Tasmania progressively de-rating its sustainable annual generation capacity, from 10 000 GWh, used as recently as 2006, to 8 700 GWh.
However, as noted earlier in this Paper, based on forecasts of Tasmania’s consumption and maximum demand, Tasmania’s existing generation capacity, together with Basslink inward flows, is still calculated to be sufficient to meet forecast maximum demand until 2028. 63 AEMO has estimated that Tasmania will have sufficient installed and committed generation capacity until at least 2019-20, even under a high economic growth scenario.
6.2. Transmission
As owner and operator of the network, Transend is required to ensure that the planned power system meets the minimum performance criteria prescribed in the National Electricity Rules and the Electricity Supply Industry (Network Performance Requirements) Regulations 2007 (ESI Regulations). Transmission performance is generally measured in terms of network reliability and transmission plant availability.
6.2.1. Transmission network reliability Transend reports on the reliability of its transmission network in terms of the Loss Of Supply (LOS) events that occur every financial year. LOS is measured in ‘system minutes’, which is calculated by dividing the total energy not supplied to customers throughout the year by the maximum demand for electricity experienced at any point during that same year. Targets are set for the number of LOS events greater than 0.1 system minute and for the number of LOS events greater than two system minutes. Table 12 shows the LOS performance of the transmission network from 2002-03 to 2008-09.
Transend’s level of system minutes off supply is generally higher than other Australian transmission entities, due in part to the weaker ‘meshing’ of the Tasmanian network which makes it susceptible to single significant incidents. 64
63 2010 Annual Planning Report, Transend Networks 64 Tasmanian Energy Supply Industry Performance Report 2009-10, OTTER
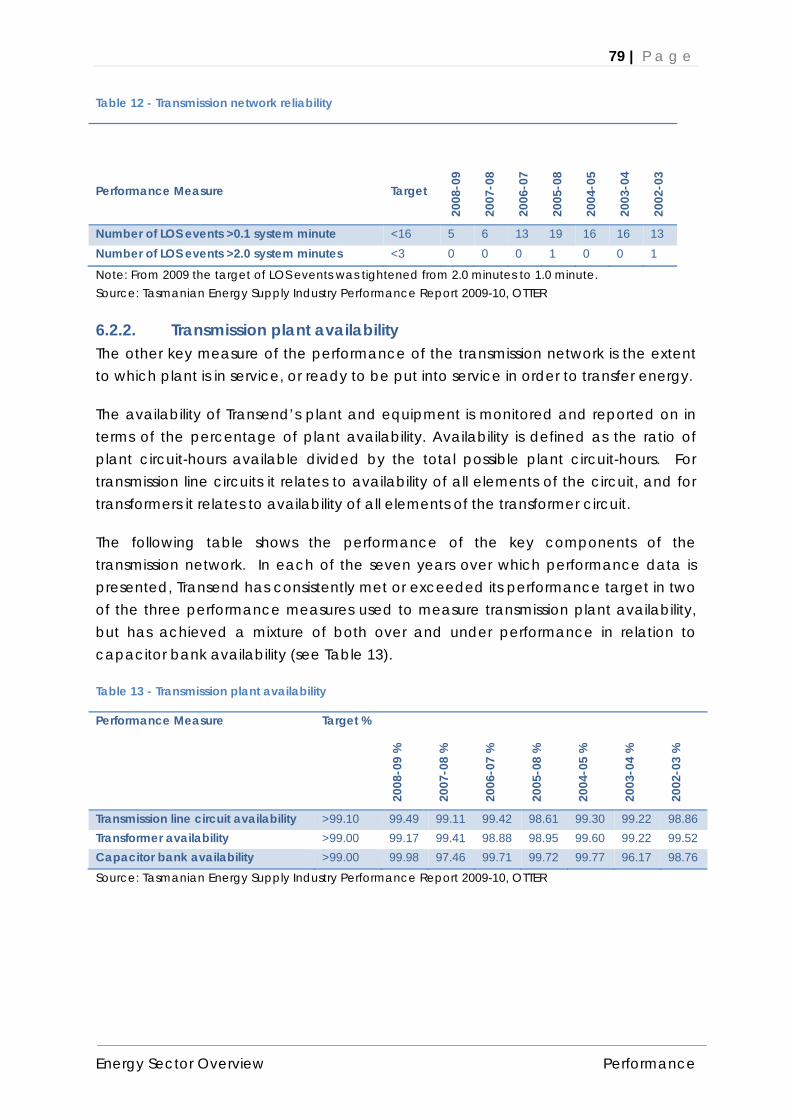
79 | P a g e
Energy Sector Overview Performance
Table 12 - Transmission network reliability
Performance Measure
Target
2008
-09
2007
-08
2006
-07
2005
-08
2004
-05
2003
-04
2002
-03
Number of LOS events >0.1 system minute <16 5 6 13 19 16 16 13 Number of LOS events >2.0 system minutes <3 0 0 0 1 0 0 1
Note: From 2009 the target of LOS events was tightened from 2.0 minutes to 1.0 minute. Source: Tasmanian Energy Supply Industry Performance Report 2009-10, OTTER
6.2.2. Transmission plant availability The other key measure of the performance of the transmission network is the extent to which plant is in service, or ready to be put into service in order to transfer energy.
The availability of Transend’s plant and equipment is monitored and reported on in terms of the percentage of plant availability. Availability is defined as the ratio of plant circuit-hours available divided by the total possible plant circuit-hours. For transmission line circuits it relates to availability of all elements of the circuit, and for transformers it relates to availability of all elements of the transformer circuit.
The following table shows the performance of the key components of the transmission network. In each of the seven years over which performance data is presented, Transend has consistently met or exceeded its performance target in two of the three performance measures used to measure transmission plant availability, but has achieved a mixture of both over and under performance in relation to capacitor bank availability (see Table 13).
Table 13 - Transmission plant availability
Performance Measure Target %
2008
-09
%
2007
-08
%
2006
-07
%
2005
-08
%
2004
-05
%
2003
-04
%
2002
-03
%
Transmission line circuit availability >99.10 99.49 99.11 99.42 98.61 99.30 99.22 98.86 Transformer availability >99.00 99.17 99.41 98.88 98.95 99.60 99.22 99.52 Capacitor bank availability >99.00 99.98 97.46 99.71 99.72 99.77 96.17 98.76
Source: Tasmanian Energy Supply Industry Performance Report 2009-10, OTTER
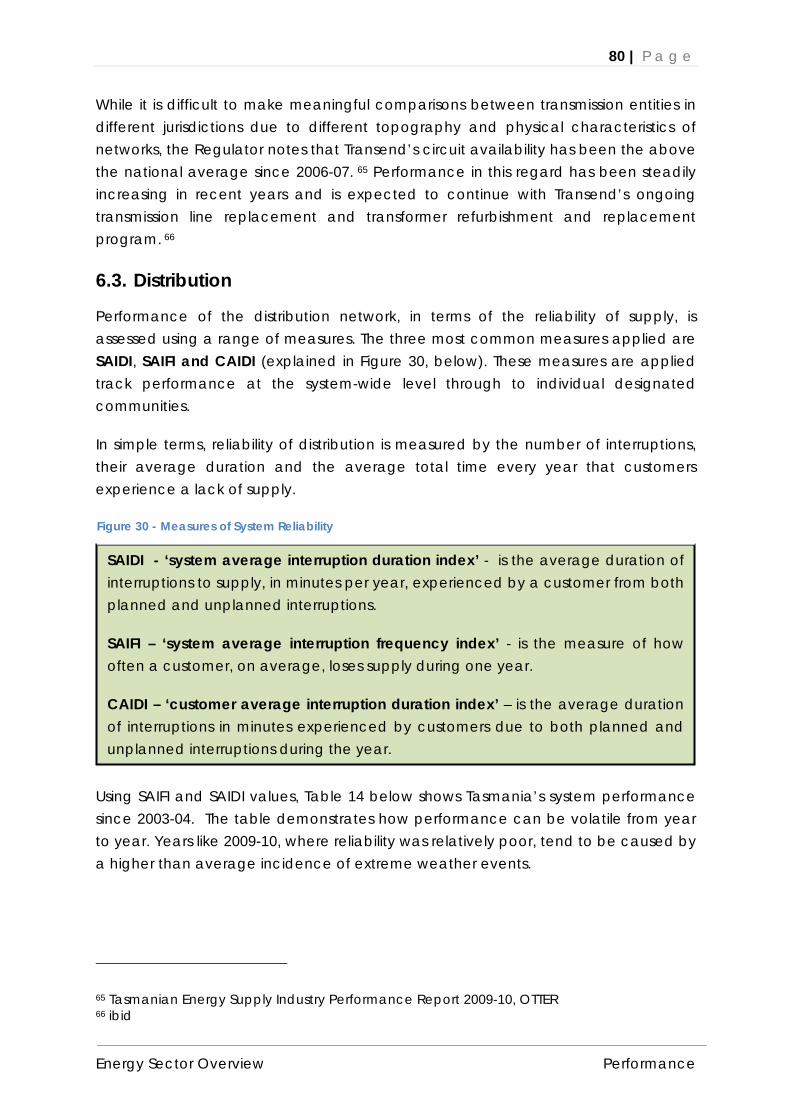
80 | P a g e
Energy Sector Overview Performance
While it is difficult to make meaningful comparisons between transmission entities in different jurisdictions due to different topography and physical characteristics of networks, the Regulator notes that Transend’s circuit availability has been the above the national average since 2006-07. 65 Performance in this regard has been steadily increasing in recent years and is expected to continue with Transend’s ongoing transmission line replacement and transformer refurbishment and replacement program. 66
6.3. Distribution
Performance of the distribution network, in terms of the reliability of supply, is assessed using a range of measures. The three most common measures applied are SAIDI, SAIFI and CAIDI (explained in Figure 30, below). These measures are applied track performance at the system-wide level through to individual designated communities.
In simple terms, reliability of distribution is measured by the number of interruptions, their average duration and the average total time every year that customers experience a lack of supply.
Using SAIFI and SAIDI values, Table 14 below shows Tasmania’s system performance since 2003-04. The table demonstrates how performance can be volatile from year to year. Years like 2009-10, where reliability was relatively poor, tend to be caused by a higher than average incidence of extreme weather events.
65 Tasmanian Energy Supply Industry Performance Report 2009-10, OTTER 66 ibid
SAIDI - ‘system average interruption duration index’ - is the average duration of interruptions to supply, in minutes per year, experienced by a customer from both planned and unplanned interruptions.
SAIFI – ‘system average interruption frequency index’ - is the measure of how often a customer, on average, loses supply during one year.
CAIDI – ‘customer average interruption duration index’ – is the average duration of interruptions in minutes experienced by customers due to both planned and unplanned interruptions during the year.
Figure 30 - Measures of System Reliability

81 | P a g e
Energy Sector Overview Performance
In 2009-10, the performance of the system fell short of the TEC standards at the compliance level of individual communities. The standards for frequency and/or duration of interruptions were not met for 35 of the 101 designated communities in the distribution system. Aurora Energy has indicated to the Regulator that it is aiming to address this issue through its targeted reliability strategy and capital expenditure program. 67
Table 14 - Distribution system performance
Measure 2003-04 2004-05 2005-06 2006-07 2007-08 2008-09 2009-10
SAIDI (min) 314 244 240 200 257 220 420
SAIFI 3.08 2.25 2.32 2.01 2.06 1.65 2.25
Source: Tasmanian Energy Supply Industry Performance Report 2009-10, OTTER
Table 15 provides a comparison of SAIDI and SAIFI across other jurisdictions for 2009-10. Tasmania ranks fourth for both SAIDI and SAIFI. However, distribution reliability is affected by factors like the size of supply areas and lengths of ‘feeders’ and the Tasmanian Energy Regulator has noted that Aurora’s performance is largely what would be expected when considering Tasmania’s relative area and topography. 68
Table 15 - SIADI and SAIFI Jurisdictional Comparison
State SAIDI SAIFI
NT 405.6 5.4
VIC 186.8 1.8
SA 155.1 1.5
NSW 197.6 1.7
WA 370.8 2.8
TAS# 316.1 2.3
QLD 345.2 2.6
# Tasmanian figure includes transmission and third party outages
Source: ESAA, Electricity Gas Australia 2010
67 2010 Reliability Review Report, Office of the Tasmanian Economic Regulator 68 Tasmanian Energy Supply Industry Performance Report 2009-10, OTTER

82 | P a g e
Energy Sector Overview Performance
Summary: Performance The performance of electricity systems is measured against a range of factors including
the reliability, quality and security of electricity supply.
Hydro-electric generation is inherently more reliable than other forms of generation, such as coal fired thermal technology, and Tasmania typically experiences less planned and unplanned generation outages than other states, and experiences levels of reliability which are comparable with major hydro schemes in the UK and North America.
Unlike thermal generation, the availability of hydro-electric generation is impacted on by the availability of ‘fuel’ (water).
Despite Hydro Tasmania derating its system, Tasmania’s generation capacity is still considered to be adequate until at least 2020, and possibly until late in the following decade.
Transmission network performance is measured in terms of loss of supply and availability of transmission plant. Transend generally achieves its key performance targets for the transmission system; however the trend has been a reduction in loss of supply events, although 2009-10 saw an increase in the number of events.
Reliability of distribution is measured by looking at the number of interruptions, their average duration and the average total time every year that customers experience a lack of supply. Measures of reliability are susceptible to the impact of contingency events from year to year.
In 2009-10, the performance of the distribution network fell short of the required TEC standards at the compliance level of individual communities. The standards for frequency and/or duration of interruptions were not met for 35 of the 101 designated communities in the distribution system.
In 2009-10, Tasmania’s overall electricity reliability ranked fourth compared to other Australian jurisdictions. However, the Regulator considers that Aurora Energy’s performance is generally what would be expected given the relative area and topography of the State.
83 | P a g e
Energy Sector Overview
Appendix 1
Comparisons with other jurisdictions

84 | P a g e
Energy Sector Overview Comparisons with other jurisdictions
Issue Tasmania National
Generation ownership
State owned entities own nearly all generation capacity.
Two thirds of generation capacity government owned or controlled69, except in Victoria and South Australia where most generation capacity is privately owned.
Generation technology
Hydro generation accounts for around 81 per cent70 of State’s generation portfolio and produced 71 per cent of electricity generated in Tasmania in 2009-10.
Gas-fired generation accounts for 14 per cent of registered generation capacity and accounted for 10 per cent of electricity generation.
Wind generation made up 5 per cent of the State’s registered capacity and generated 5 per cent of Tasmania’s output.
Tasmania has no coal fired generation capacity.
Coal fired generation accounts for around 58 per cent of registered generation capacity and in 2010 supplied around 81 per cent of output.71
Gas fired generation represented around 21 per cent of registered capacity across the NEM and produced around 10 per cent of NEM output72 - mainly to meet ‘intermediate’ and peak levels of demand.
Hydro-electric generation represents around 16 per cent of registered capacity and delivered less than 6 per cent of output in 2010, partly due to drought conditions experienced in eastern Australia and Tasmania in recent years.73
Wind generation plays a relatively minor role in the NEM, accounting for around 3 per cent of generation capacity and 2 per cent of output, although likely to increase in the future. In South Australia, however, wind generation accounts for around 20 per cent of generation capacity.74
Network ownership Tasmania’s transmission network and single distribution network are both owned by the State Government.
The transmission networks in South Australia and Victoria, as well as the interconnectors between those states, are privately owned. Victoria’s distribution networks are also privately owned while the South Australian network is leased by a publically owned organisation to private interests.
All transmission and distribution networks in
69 State of the energy market 2010, Australian Energy Regulator 70 Tasmanian Energy Supply Industry Performance Report 2008-09 71 State of the energy market 2010, Australian Energy Regulator 72 ibid 73 ibid 74 ibid
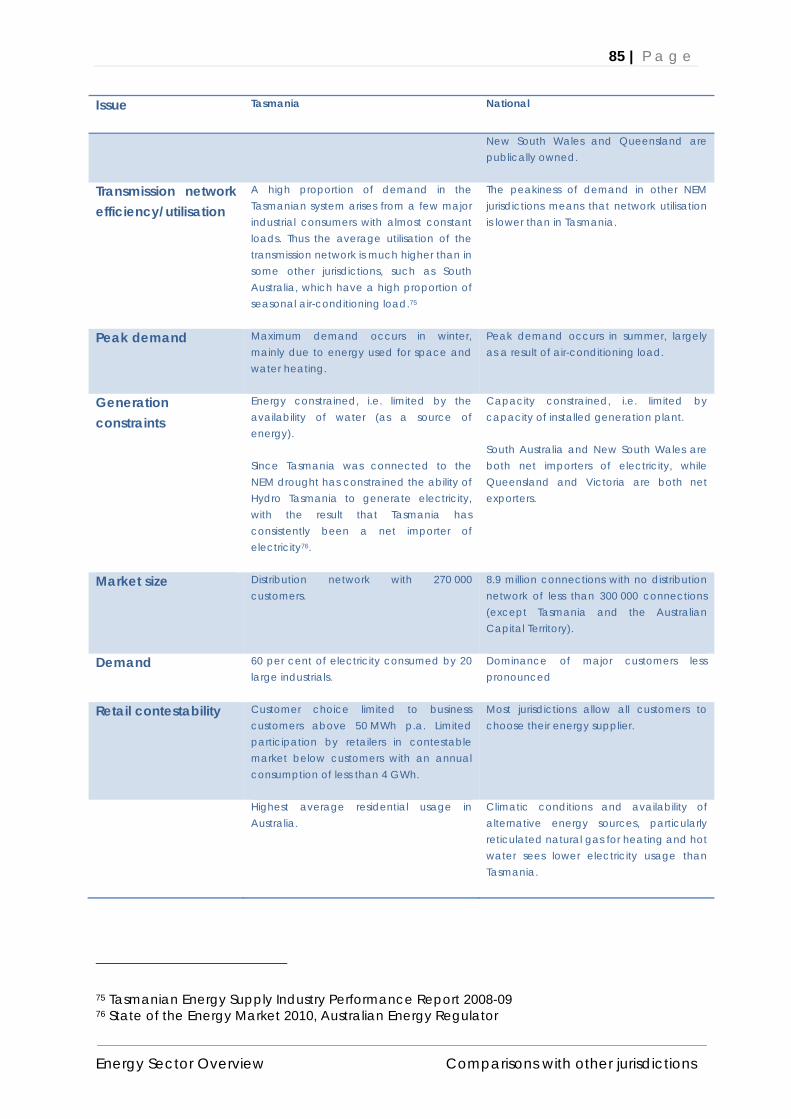
85 | P a g e
Energy Sector Overview Comparisons with other jurisdictions
Issue Tasmania National
New South Wales and Queensland are publically owned.
Transmission network efficiency/utilisation
A high proportion of demand in the Tasmanian system arises from a few major industrial consumers with almost constant loads. Thus the average utilisation of the transmission network is much higher than in some other jurisdictions, such as South Australia, which have a high proportion of seasonal air-conditioning load.75
The peakiness of demand in other NEM jurisdictions means that network utilisation is lower than in Tasmania.
Peak demand Maximum demand occurs in winter, mainly due to energy used for space and water heating.
Peak demand occurs in summer, largely as a result of air-conditioning load.
Generation constraints
Energy constrained, i.e. limited by the availability of water (as a source of energy).
Since Tasmania was connected to the NEM drought has constrained the ability of Hydro Tasmania to generate electricity, with the result that Tasmania has consistently been a net importer of electricity76.
Capacity constrained, i.e. limited by capacity of installed generation plant.
South Australia and New South Wales are both net importers of electricity, while Queensland and Victoria are both net exporters.
Market size Distribution network with 270 000 customers.
8.9 million connections with no distribution network of less than 300 000 connections (except Tasmania and the Australian Capital Territory).
Demand 60 per cent of electricity consumed by 20 large industrials.
Dominance of major customers less pronounced
Retail contestability Customer choice limited to business customers above 50 MWh p.a. Limited participation by retailers in contestable market below customers with an annual consumption of less than 4 GWh.
Most jurisdictions allow all customers to choose their energy supplier.
Highest average residential usage in Australia.
Climatic conditions and availability of alternative energy sources, particularly reticulated natural gas for heating and hot water sees lower electricity usage than Tasmania.
75 Tasmanian Energy Supply Industry Performance Report 2008-09 76 State of the Energy Market 2010, Australian Energy Regulator

86 | P a g e
Energy Sector Overview
Appendix 2
An overview of the operation of the National Electricity Market

87 | P a g e
Energy Sector Overview An overview of the operation of the National Electricity Market
Figure 14 on page 28 shows how electricity travels physically from a power station, through the electricity network, to arrive at homes and businesses, as well as the entities involved in each stage of the process. It does not, however, explain the market-based arrangements that underpin how electricity is sold by generators and bought by retailers (for on-sale to their customers).
Many people assume that the commercial arrangements between the parties that make up the electricity supply chain mirror the physical flow of electricity from generator through to end user. This is not the case, as there is a separation of the physical flows of electricity and the financial arrangements that drive the end cost of that electricity.
This separation is key design feature of the NEM. The operations of the NEM are highly complex and not widely understood outside of the electricity supply industry. In essence, the NEM is a wholesale market for electricity that:
coordinates the physical exchange of electricity between generators and the customers of electricity retailers to ensure that the demand for electricity is matched by the supply of electricity from generators at all times;
arranges generation so that it is produced at least cost to the market; and
facilitates payment to generators from retailers whose customers have used that electricity.
The NEM is divided into five interconnected regions that largely follow state boundaries, and encompasses Queensland, New South Wales (which is combined with the Australian Capital Territory), Victoria, South Australia and Tasmania.
Generators in each region bid throughout the day to supply electricity into the region in which they are physically located, based on forecasts of the demand for electricity prepared by the independent operator of the NEM. Those bids are ‘stacked’ in price order and the NEM operator then schedules which generators are to produce electricity at any given point time, in order of the prices submitted (from the lowest to highest).
The operator also examines if trade across regions through the interconnectors is more cost effective than meeting all electricity needs within a region from indigenous generators, based on the bids from generators in each region (if so the electricity will be transferred from the cheaper region and generation in the higher priced region not dispatched).

88 | P a g e
Energy Sector Overview An overview of the operation of the National Electricity Market
In this way, the demand and supply for electricity is always kept in balance. Unexpected variations in demand are managed by scheduling additional or fewer generators as required. It is impossible determine the generator that produced the electricity purchased by a given retailer or used by a specific customer (a useful mental model is to think of the market as a pool into which generators place electricity and retailers draw electricity).
It is important to note that the price received by all generators supplying electricity within a region of the NEM during any five minute interval is the same, and reflects the highest bid from amongst the generators that need to be called upon in order to match supply with demand (the marginal generator). This means that the price bid by the generator at the point where supply meets demand in each region of the NEM sets the price of the electricity in that region. 77
All electricity is traded through this ‘pooling’ arrangement78, all generators receive payment according to the pool price outcome (at the clearing price, not the price that they bid), and all retailers make payments based on a pool price outcome. Transactions volumes within the NEM are considerable, and the financial liability of all market participants is calculated on a daily basis and settled weekly. The settlement process involves the NEM operator collecting the money due for electricity purchases from retailers, and then paying generators for the electricity they have produced, based on metered volumes.
The competitive bidding process and the scheduling of generators in order from the lowest to the highest bid is designed to ensure that the most efficient producers are generating at all times, which ensures that wholesale electricity prices are kept as low as possible.
Figure 31 provides a simplified example of the bidding process, and the impact that trade between regions though interconnectors can have on the market outcomes.
77 Ignoring interconnections between regions for simplicity. Where interconnectors are not constrained, the price in the two regions will be the same (adjusted for losses) and be set by the marginal generator in the exporting region.
78 Note: generators with less than 30MW can self dispatch without going through the bidding process.

89 | P a g e
Energy Sector Overview An overview of the operation of the National Electricity Market
With no interconnection between the 2 regions, price out wins, the market operator works through the bids in each region until the demand in each region is met.
In region A, the first 4 bids are accepted, with A4 offer only party utilised. A4 has set the price that all generators in region A receive, at $30/MWh
Similarly in region B, the first 6 bids are accepted, B1 third bid is only partly utilised. B1 sets the price that all generators in region B receive, at $60/MWh
With the two regions interconnected, the market operator is able to accept bids from generators in region A to meet some of region B’s needs.
In region A, all of A4’s bid of 50MW can now be accepted and A1’s second bid is partly accepted and now sets the price in region A at $34/MWh
In region B, B1’s third bid of $60 is too high and part of its second bid of $40 is accepted. (its former value has been replaced by imports across the interconnector).
The effect of interconnection has been to lower prices for production in region B while increasing production in region A.
Figure 31 - Simplified Dispatch Example
With no interconnector With interconnector with a capacity of 50MW

90 | P a g e
Energy Sector Overview An overview of the operation of the National Electricity Market
Generators, such as wind farm operators, who have no control over when they can generate and no option but to dispatch the electricity being produced or see it go to waste (given that electricity cannot be stored), will tend to bid at a price to ensure they are called on and dispatched, noting that it will then receive the prevailing spot price.
Base load generators that maximise efficiency by producing relative steady volumes of electricity at a low cost, will tend to bid relatively low to ensure that the operator dispatches their capacity.
The bidding arrangements mean that generators that are able to more readily vary their output (such as a hydro-electric generators), or have a relatively high cost of production, will tend to bid at higher prices than base load generators. If the level of demand for electricity means that the prevailing market price is below the price tendered by those generators, that generator will not be called on to dispatch electricity. However, once demand exceeds the availability of lower-cost base-load generation, the market operator will call on higher cost peaking plant to match demand and supply, and all generators dispatched will receive the higher clearing price.
Figure 32 provides a stylised bid stack to illustrate the typical bidding patterns of different types of generators. Depending on the circumstances prevailing in the market, and the contractual positions of generators, actual bidding can vary substantially from this stylised example.
Figure 32 – Indicative Bid Stack

91 | P a g e
Energy Sector Overview An overview of the operation of the National Electricity Market
Electricity retailers participating in the NEM can only purchase electricity from the pool and they must buy at the prevailing spot price. In this way, Aurora Energy does not, for example, buy energy directly from Hydro Tasmania – or any other generator, whether in Tasmania or interstate – even though Hydro Tasmania may physically be generating the energy Aurora Energy supplies to its customers.
Spot prices can vary substantially anywhere between -$1000 per MWh through to $12500 per MWh (these are the price floor and price caps in the NEM) at any time. This creates very significant financial risk for both generators and retailers. To protect against these risks, generators and retailers enter into contractual arrangements with each other, which remain outside of the NEM spot market arrangements.
Retailers require protection from the risk of sustained high prices in the spot market (given that they typically sell electricity under fixed-price arrangements with end customers). On the other hand, generators seek protection from sustained periods of low prices. These contractual arrangements involve each party giving up some potential gain from favourable price movements in return for protection from unfavourable price movements. While removing one form of risk (price risk), contractual arrangements introduce another form of risk (production or volume risk). This is explained below.
The most common type of risk instrument is a ‘swap’ (also known as a two-way hedge or a contract for differences), in which a generator and retailer agree a fixed price for electricity and swap the variable market price in exchange for the agreed fixed price.
The generator receives the prevailing market price from the market operator, which is funded by the retailer paying the operator the prevailing price (both parties have ‘seen’ the market price.
Under the swap contract, this cash flow is reversed, with the generator swapping back that variable price with the retailer, and the retailer paying the generator the agreed fixed price.
Both the generator and retailer manage their price risk through this arrangement.
It is important to note that under these arrangements, the generator need not have produced any electricity or the retailer’s customers consumed any electricity during the period in which the swap is operational, as these arrangements are outside the NEM spot market.

92 | P a g e
Energy Sector Overview An overview of the operation of the National Electricity Market
If the generator experienced a plant failure (or bid at a level that meant the market operator did not dispatch it), the generator would not have the cash flow from the spot market to use to fund the return payment to the retailer. This creates ‘volume risk’ for the generator.
Similarly, if the retailer’s customers did not consume the volume of electricity provided for under its contract with the generator, the retailer would have a contract for a higher volume of electricity than it received payment from customers for, leaving it with a volume exposure. Where a retailer’s contacts with generators do not cover all of the volume consumed by its customers, the retailer is exposed to the spot market for that marginal volume. If there is a high-priced event in the spot market, the retailer could be exposed to substantial spot payment obligations without the protection of contract cover.
Contract arrangements, such as swaps can reduce one form of risk (price risk), but create other risks for each party, such as volume risk.
Another common risk management arrangement is a ‘cap’, which is a product typically sold by generators. These arrangements provide retailers insurance against high prices. Retailers pay an agreed fee to the generator, and in the event of prices exceeding the agreed ‘cap’ level, the generator pays the difference between the prevailing spot price and the agreed cap price. Where prices remain below the ‘cap’ level, the retailer remains exposed to the market price. This enables retailers to limit (or cap) their price risk. Caps can provide a source of revenue to a generator without it needing to dispatch any electricity, and are commonly sold by hydro generators in the NEM.
Given the volatility in the NEM spot market, risk management is a fundamental aspect of business operations and is highly complex. There is a wide variety of financial instruments available to protect generators and retailers from movements in the spot price of electricity but it is beyond the scope of this Paper to explore these.

93 | P a g e
Energy Sector Overview
Details of Tasmania’s generation sector

94 | P a g e
Energy Sector Overview Details of Tasmania’s generation sector
There are currently 10 licensed generators in Tasmania, although not all are active. Brief profiles of Tasmania’s generators are provided below.
Hydro-Electric Corporation (Hydro Tasmania) Hydro Tasmania is a Government Business Enterprise and the major generator in Tasmania. With hydro-electric generation assets worth around $3 billion, including over 50 large dams and 28 power stations, Hydro Tasmania’s total hydro-electric generation capacity of 2 281 MW represents around 81 per cent of Tasmania’s registered generation portfolio and in 2009-10 produced 76 per cent of all electricity generated in the State. Hydro Tasmania is also an equal partner in a joint venture with the China Light and Power Group to develop wind generation, Roaring 40s Renewable Energy Pty Ltd, which owns and operates the Woolnorth Bluff point and Studland Bay wind farms (and other wind farm assets elsewhere).
Given the structural reforms of the electricity supply industry which have occurred in other jurisdictions over the past two decades, it is unusual for a single generator in any region of the NEM to have such a large share of generation capacity as Hydro Tasmania does in Tasmania.
Aurora Energy (Tamar Valley) Pty Ltd A subsidiary of the State Government owned Aurora Energy, Aurora Energy (Tamar Valley) has recently completed the construction of, and now owns and operates the gas fired Tamar Valley Power Station located at Bell Bay. The project was initiated by Alinta Energy and partly completed by Babcock and Brown Power prior to the Tasmanian Government directing Aurora Energy to acquire and complete the facility when Babcock and Brown Power found it could not continue to finance its construction. The new TVPS incorporates a 208.9 MW combined cycle gas turbine which operates as a base load generator, as well as four open cycle gas turbines with a combined capacity of 178 MW that operate as a peaking plant and provide backup to the combined cycle gas turbine, making for a total installed capacity of 387 MW.
Woolnorth Bluff Point Wind Farm Pty Ltd (formerly Roaring 40’s Wind Pty Ltd) Woolnorth Bluff Point Wind Farm is a wholly-owned project of Roaring 40s Renewable Energy and operates the 65 MW Bluff Point wind farm in the State’s far north-west.
Woolnorth Studland Bay Wind Farm Pty Ltd A wholly-owned subsidiary of Roaring 40s Renewable Energy, Woolnorth Studland BayWind Farm owns and operates a 75 MW wind farm at Studland Bay in Tasmania’s far north-west.
95 | P a g e
Energy Sector Overview Details of Tasmania’s generation sector
LMS Generation Pty Ltd LMS Generation is a renewable electricity generator specialising in the collection and conversion of landfill gas to energy. LMS Generation operates landfill gas fuelled generation in most states and territories in Australia, including – since early 2007 – a landfill gas fuelled generation facility at the Remount Landfill in Launceston with a capacity of up to 2.2 MW.
AGL Energy Services AGL Energy Services (originally the Australian Gas Light Company) is a publically listed energy company that develops, owns and operates generation assets in every state and territory, except the Northern Territory. Nationally, AGL has investments in hydro, wind, gas, coal, and land-fill gas generation, and is pursuing solar, geothermal, biomass, and bagasse developments. AGL Energy is the product of a 2006 merger of AGL’s infrastructure assets with Alinta Limited. AGL is licensed to operate two landfill gas-fuelled generators, one at the Jackson Street tip-site in Glenorchy and the other at the McRobies Gully tip site in Hobart, with a combined capacity of up to 2.6 MW.
Tasmanian Irrigation Schemes Pty Ltd Tasmanian Irrigation Schemes (TIS) is a wholly owned subsidiary of the Rivers and Water Supply Commission (a GBE), which manages the operation of irrigation schemes in Tasmania. The TIS owns and operates the Meander Mini-Hydro station which was has a capacity of up to 2 MW and was constructed as part of the Meander Dam Project and is powered from irrigation water released from the Meander Dam79. There are several other mini-hydro schemes under consideration/development by the Tasmanian Irrigation Development Board, although the future ownership of those assets has yet to be decided.
Cascade Renewable Energy Pty Ltd Licensed since May 2007, Cascade Renewable Energy operates a 1.15 MW mini- hydro generator driven by water from the Winnaleah irrigation scheme in the State’s north-east. The generator is driven only by water which is not being used for irrigation and, therefore, produces electricity largely in the winter months.
Paper Australia Pty Ltd Paper Australia formerly operated two steam turbine generators, with a combined capacity of 9 MW, at the Associated Pulp & Paper Mills site in Burnie. The mill was closed in June 2010 and the generation of electricity discontinued soon after.
79 Annual Report 2008-09, Tasmanian Irrigation Schemes Pty Ltd

96 | P a g e
Energy Sector Overview Details of Tasmania’s generation sector
Musselroe Wind Farm Pty Ltd Musselroe Wind Farm is a wholly-owned subsidiary of Roaring 40s Renewable Energy with the responsibility for undertaking the development of a 168MW wind farm at Musselroe in the State’s north east. While preliminary site works have been undertaken, construction is yet to commence, despite the project having been proposed by Hydro Tasmania in 2003.
Bell Bay Power Station The original Bell Bay Power Station (BBPS) was established in the early 1970s to provide thermal generation back-up for the HEC’s hydropower system. It originally comprised two 120 MW steam turbine generating units and was fired by heavy fuel oil. The power station was only run at times of very low water storage levels in the hydropower system.
The BBPS was a foundation customer for the Tasmanian Natural Gas Pipeline and each of its generating units were converted to gas in 2003. Further concern about potential generation shortfalls prior to the commissioning of Basslink led Hydro Tasmania to install three additional 35 MW gas turbine generators at the site in 2005. The turbines were commissioned 2007 but were owned by Bell Bay Three Pty Ltd, a subsidiary of Hydro Tasmania, and operated under a generation licence held by Bell Bay Power Pty Ltd, after separation of the BBPS from Hydro Tasmania’s other generating capacity was agreed to as part of Tasmania’s entry into the NEM.
The three gas turbines were sold to Alinta Energy (Tamar Valley) Pty Ltd, and integrated into the new Tamar Valley Power Station, which is located immediately adjacent to the Bell Bay Power Station. Hydro Tasmania continued to operate the Bell Bay Power Station until its closure in April 2009 and the original 120 MW generating units remain.
Hydro Tasmania is seeking to divest itself of the Bell Bay Power Station, and the plant and its associated infrastructure are for sale for relocation.
97 | P a g e
Energy Sector Overview
Appendix 3
Bass Strait Islands
98 | P a g e
Energy Sector Overview Bass Strait Islands
Bass Strait Islands
Hydro Tasmania owns both the generation assets and electricity distribution systems on King Island and Flinders Island (there being no transmission system on either island). Aurora Energy operates the system and provides retail services under a contract with Hydro Tasmania.
The majority of the 660 customers on Flinders Island are domestic, rural and business customers, with no significant industrial load. On King Island, approximately 35 per cent of the load associated with the Island's 1 200 customers is residential, with industrial, commercial and dairy farm users comprising the remainder.
The electricity supply on the two islands is quite different from the predominantly hydro-based system operating on mainland Tasmania, with generation largely provided by diesel engines, complemented by wind turbines. The inherent variability of wind turbine generation restricts the extent to which either island is able to rely on wind generation as a source of electricity at any given moment.
On King Island, electricity generation capacity is supplemented by a 100Kw solar unit, which is owned by Hydro Tasmania, in partnership with a private company, and was developed with the aid of $720 000 in State and Australian government funding as part of the Renewable Remote Power Generation Program (RRPGP).
Those same parties are also equal joint venture partners in the recently announced King Island Renewable Energy Project, which aims to eliminate the Island’s dependence on conventional diesel by creating a renewable energy power system built around two additional wind turbines, a facility to produce and store biodiesel, smart-grid technology to better balance the demand for electricity with the available supply, and energy storage. The Australian Government is again contributing to the cost of the project through a $15.28 million grant under its Renewable Energy Demonstration Program.
The islands’ isolation from mainland Tasmania’s electricity grid and their reliance on diesel generation means that the cost of supplying electricity to the islands is significantly higher than on mainland Tasmania. Nonetheless, the prices paid by island customers do not reflect the full extent of those differences. The State Government administers a Bass Strait Islands (BSI) Community Service Obligation (CSO) which provides for the supply of electricity to customers on the Bass Strait Islands at heavily subsidised rates. (The CSO also provides for concessions to pensioner customers.)

99 | P a g e
Energy Sector Overview Bass Strait Islands
The State Budget typically allows for expenditure on the subsidy of approximately $7 million per annum, which equates to a subsidy of approximately 40c per kWh80 (or about 65 per cent of the total cost). The CSO has been funded since 1998-99, and in 2009-10 its cost to the Government was approximately $6.6 million.
80 Tasmanian Energy Supply Industry Performance Report 2009-10, OTTER