Risk Assessment Modeling of a Potential Red Abalone Fishery at

TASMANIAN ABALONE FISHERY - 2011
David Tarbath and Caleb Gardner
September 2012

Institute for Marine and Antarctic Studies, University of Tasmania, PO Box 49, Hobart TAS 7001
Citation: Tasmanian Abalone Fishery (2011). Tarbath, D. and Gardner, C. Institute for Marine and Antarctic Studies Report. 111pp.
Enquires should be directed to: David Tarbath Fisheries, Aquaculture & Coasts Centre Institute for Marine and Antarctic Studies University of Tasmania Private Bag 49, Hobart, Tasmania 7001, Australia [email protected]
The authors do not warrant that the information in this document is free from errors or omissions. The authors do not accept any form of liability, be it contractual, tortious, or otherwise, for the contents of this document or for any consequences arising from its use or any reliance placed upon it. The information, opinions and advice contained in this document may not relate, or be relevant, to a reader’s particular circumstance. Opinions expressed by the authors are the individual opinions expressed by those persons and are not necessarily those of the Institute for Marine and Antarctic Studies (IMAS) or the University of Tasmania (UTas).
© Institute for Marine and Antarctic Studies, University of Tasmania 2012 Copyright protects this publication. Except for purposes permitted by the Copyright Act, reproduction by whatever means is prohibited without prior written permission of the Institute for Marine and Antarctic Studies.

Abalone Fishery Assessment: 2011
Page i
Abalone Fishery Assessment: 2011 Executive summary
Total landings of abalone in 2011 comprised 2,406 t of blacklip and 143 t of greenlip, a total of 2,548 t from a TAC of 2,565.5 t. Landings were down relative to 2010, mostly due to the 175 t reduction in the Eastern Zone TAC. The gross landed value of the catch in 2011 was $84.8 million, which was $19 million less than 2010. While the beach price for canned product remained stable or even slightly increased, the price for live market product fell. There has been an overall decline in abalone beach price since 2001, consistent with increased strength of the Australian currency and increased production of competing farmed abalone in Asia (although there are other processes also affecting demand). The value of the portion of the resource rent that is collected as royalties by the Tasmanian government fell by $0.85 million to $6.35 million in 2011, as a result of lower beach prices and the smaller catch.
The status of the fishery was assessed using catch and catch rates from diver catch returns, and samples of catches were measured to provide information about the length of abalone. Information on stocks also comes through consultation with the abalone industry to obtain their observations on the state of stocks and market drivers affecting the fishery.
The major findings of this assessment are summarised below for each fishing zone.
Eastern Zone In recent years, up to 50% of the zone’s TAC has been taken in the south at the Actaeons. This region tends to be dependent on recruits of the year. Falling catch rates indicated that levels of recruitment were inadequate for the high catch taken from this region. Stocks have been reduced to moderate levels, and are continuing to fall.
The catch from both the lower D’Entrecasteaux Channel and Bruny Island was much lower than recent years. Estimating stock abundance from abalone fishery data becomes more difficult at low levels of catch because effort may be affected more by fleet dynamics than stock abundance. However, the almost uniform decline in catch rate and reduced median size of abalone from these regions was a strong indication that stocks have failed to rebuild. Stocks level was assessed as low. On the eastern side of Storm Bay, stocks appeared depleted throughout the region, with consistent and often sharp declines in catch rates over the last few years. The smaller size of abalone was consistent with high levels of fishing mortality. Serial depletion was evident as divers moved to deeper water to maintain catch rates. The annual catch has been very moderate in recent years, at approximately two thirds of long-term averages, and the stock decline is consistent with diminished levels of recruitment.
On the East Coast between Tasman Island and Eddystone Point, stocks continued to decline in 2011 and appeared to be at very low levels across most of the region. Production of abalone in some locations in this region has been affected by the formation of Centrostephanus urchin barrens. Here too it appears that the primary cause of the stock decline has been lower than usual recruitment because catch rates have declined despite moderate catches.
Abalone Fishery Assessment: 2011
Page ii
Management of this region is difficult because of the potential for catch to become concentrated in vulnerable parts of the zone which leads to localised recruitment overfishing. This process has previously excised parts of the coast from the fishery and reduced long-run yield from the zone. Reducing this risk has led to a reduction in the Eastern Zone TAC of almost 40% over the last few years (896 t in 2010 to 549.5 t in 2012). The outcome of this management response is however dependent on recruitment, which is variable and unknown. This means that levels of catch that appear conservative historically may still result in stock decline if recruitment is below average or if productivity has been reduced through other processes such as urchin barren formation.
Central Western Zone There were two parts to this zone, each operating under different management arrangements. The northern part included coast from the Arthur River to the Sandy Cape beach (sub-blocks 5D, 6A, 6B, 6C). The southern part included coast from Sandy Cape to Ocean Beach near Strahan (sub-block 6D, blocks 7 and 8). Abalone in the southern part attracted a higher beach price and was generally preferred over that from the north; consequently the catch was capped at 150 t to reduce risk of recruitment overfishing. Implementation of the cap led to competitive pulse fishing.
In the north (block 6C) there was a sharp decline in catch rate following two years of very high catches. To put this reduction in perspective, catch rates remained above 100 kg/h and most landed abalone were not recruits of the year, which indicated that stocks were at moderate levels. However, a continuation of falling catch rates and lower median sizes indicated that fishing mortality was too high, and potentially reaching levels that could eventually limit recruitment. In blocks 6A and 6B catch rates and median sizes were unchanged, and abalone stocks were assessed as stable.
Further south at Sandy Cape (block 6D), lower catch rates and reduced median size indicated that stock levels were further reduced with no apparent recovery since the last assessment. In blocks 7 and 8 there was a small increase in catch rates, which appeared to be due divers taking advantage of good weather conditions at the start of the year to fish remaining high stock levels in blocks 7A and 8B. In contrast, stocks were more depleted in areas closer to Granville Harbour where the greatest amount of catch had been taken in recent years so that catch rates were lower. Stocks were assessed as moderate, having been reduced from former levels, with ongoing stock reduction apparent.
Western Zone In block 9 south of Strahan, catch and catch rates were relatively stable, with catch rates at moderate to high levels. Stocks were assessed as stable.
In the South West (blocks 10, 11 and 12A) the regional catch was reduced by approximately one third in 2009 in response to evidence of widespread depletion (including a sustained eight-year fall in catch rates). Following the catch reduction, catch rates improved marginally but in 2011 they again fell. It was evident that stocks remained low and did not rebuild as hoped. Further management intervention appears necessary to restore catch rates.
On the South Coast (sub-blocks 12B - 13B), catch rates were lower than in other parts of the zone. However, their long-term stability provides confidence that stock levels

Abalone Fishery Assessment: 2011
Page iii
were stable here, although at lower levels than elsewhere. The median size of abalone was smaller than elsewhere in the Western Zone and there is higher dependence on recruits than in other parts of the zone, which exposes the fishery to risk of a sudden downturn should there be a year of low recruitment. The reduction in catch to 260 t appears likely to provide more resilience for this part of the fishery.
Northern Zone At King Island, resumption of fishing by visiting divers from motherships, stronger market demand and streamlining of AVG restrictions combined to produce an annual catch of over 100 t, with most divers fishing at high catch rates. Stock levels were moderate to high, although most fishing has occurred in a relatively small area around Currie, and divers predict that stocks will become depleted in this local area at current levels of catch.
In the North West (block 5), the annual catch has been maintained at high levels since 2008 when the size limit was reduced. This has been part of a management initiative to attempt to improve quality by reducing density. There has been a steady fall in catch rates during the past three years. Many areas that were once highly productive are now reported to be extensively depleted. Stock levels have fallen and there is no evidence of improvement in abalone quality as yet.
In the North East, catch rates were highly variable and influenced by factors other than stock abundance. Consequently there was less certainty in assessment of stock status from this region than elsewhere in the state. Diver reports indicate that stocks were adequate, and there were no indications of declines. Catch rate and catch information suggested stocks were stable in this region.
Bass Strait Zone High levels of catch continued to be taken from the east and south east of the Furneaux Group, from blocks 33 and 38. Catch rates have been reduced by approximately 25%. The area requires careful management to reduce risk of recruitment overfishing. Stocks here are regarded as of moderate abundance and in danger of rapid depletion should they be intensively fished.
Elsewhere in the zone, on the Central North Coast stock levels were assessed as low, although there remained high density populations of very small abalone in places. In the Hogan and Curtis Groups, stocks were assessed as stable.
Greenlip Because of the inadequacy of the existing fishery-derived performance measures as indices of abundance, assessment of the greenlip fishery is less certain. Stocks in the Furneaux Group, King Island, the North West, west of Perkins Bay and the North East were assessed moderate and stable in terms of post-zoning levels of abundance. Stock levels in Perkins Bay were assessed high. We were unable to assess stock levels on the Central North Coast.
Recreational and other fisheries The most recent catch survey of recreational abalone fishing in 2010/11 found that active participation fell by approximately 25% since a peak in 2002-2003 (i.e. 5,853 to 4,349 divers). The survey estimated 61,000 abalone (approximately 29 t) were taken by the recreational fishery, which is approximately 1% of the of the total Tasmanian

Abalone Fishery Assessment: 2011
Page iv
abalone catch. This is a 25% catch reduction since the previous (2008/2009) survey and is less than 50% of the peak recreational catch reported in 2002-2003.
Abalone were caught as part of cultural fishing activities by indigenous people, under permits for special events and research purposes. This catch was not recorded but is believed to be far smaller than the recreational catch and of negligible tonnage relative to the total catch.
Illegal commercial fishing operations are known to occur for abalone and this is a further source of fishing mortality but was not estimated for this assessment.
The quantity of abalone taken under permits for special events and research purposes was less than 2 tonnes.
Recommendations
The rapid decline of Eastern Zone stocks since 2009 was unexpected due to the pattern of rising catch rates and moderate levels of catch that preceded this period. There appeared to be two factors contributing to this: (a) some of the blocks had low levels of catch so that the data series became noisy and it was more difficult to infer stock levels (as noted for several of the regional assessments above), and (b) information produced from recent fishing activities is not necessarily a predictor of future stock levels because recruitment varies – in this case rapidly downwards.
Fishing at high catch and low catch rates leads to stock depletion and ultimately recruitment overfishing. Blacklip abalone stocks are especially sensitive to this due to their limited larval dispersal. Recruitment overfishing creates depleted localised abalone populations that take many years to recover, so that yield is substantially reduced. There are broadly two responses to this risk. One is to ensure that catch rates are maintained at high levels through conservative TACs. The other is to collect information on pre-recruit abundance and utilise this information to adjust the TAC prior to any period where recruitment differs substantially from typical levels. It is recommended that methods be developed for estimating future levels of recruitment to the fishery so that TAC decisions can be made with some consideration of recruitment.
Stock levels in the South West part of the Western Zone fishery have been reducing steadily for many years. Initially it was anticipated that the catch reduction following the development of the Central West Zone would be sufficient to enable stock rebuilding, but lower catch rates in 2011 confirmed that stock levels were essentially unchanged. There is therefore a risk that at these low levels, parts of the coast may become subject to recruitment overfishing. This is a key part of the abalone fishery and it is recommended that further measures be taken to reduce risk of recruitment overfishing by rebuilding stocks.

Abalone Fishery Assessment: 2011
Page v
Abalone Fishery Assessment: 2011
Page vi
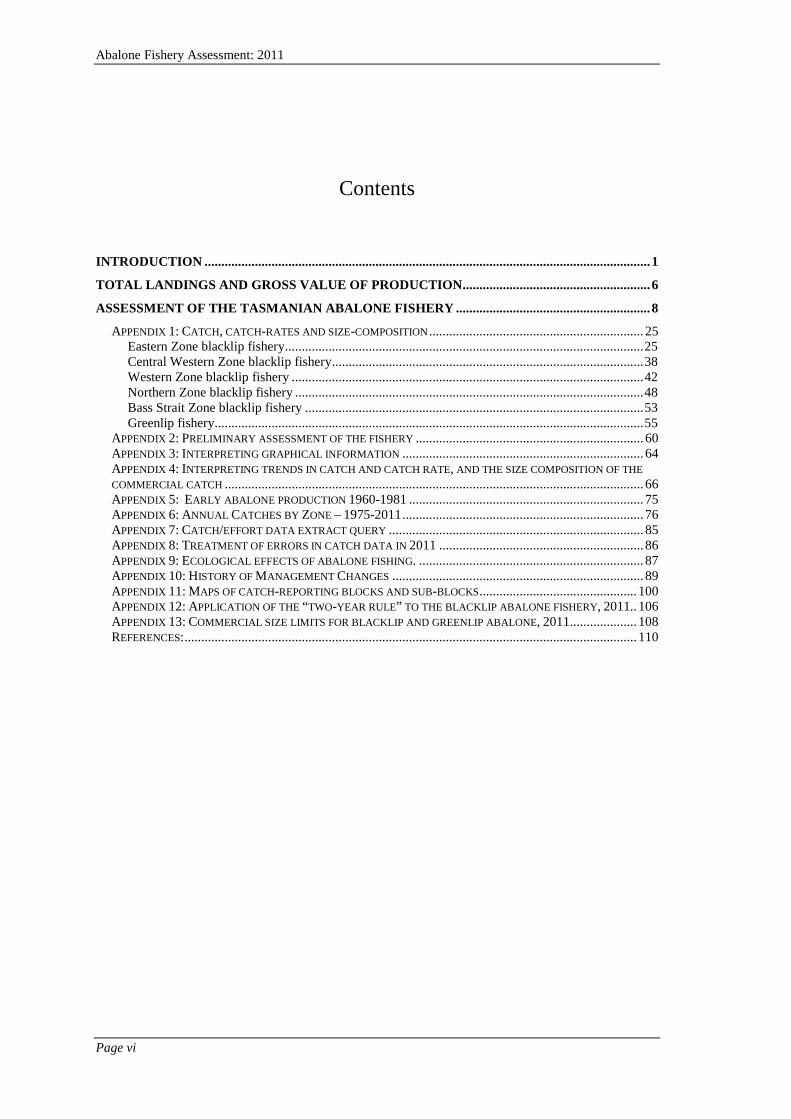
Contents
INTRODUCTION ..................................................................................................................................... 1
TOTAL LANDINGS AND GROSS VALUE OF PRODUCTION ........................................................ 6
ASSESSMENT OF THE TASMANIAN ABALONE FISHERY .......................................................... 8 APPENDIX 1: CATCH, CATCH-RATES AND SIZE-COMPOSITION ................................................................ 25
Eastern Zone blacklip fishery ........................................................................................................... 25 Central Western Zone blacklip fishery ............................................................................................. 38 Western Zone blacklip fishery ......................................................................................................... 42 Northern Zone blacklip fishery ........................................................................................................ 48 Bass Strait Zone blacklip fishery ..................................................................................................... 53 Greenlip fishery................................................................................................................................ 55
APPENDIX 2: PRELIMINARY ASSESSMENT OF THE FISHERY .................................................................... 60 APPENDIX 3: INTERPRETING GRAPHICAL INFORMATION ........................................................................ 64 APPENDIX 4: INTERPRETING TRENDS IN CATCH AND CATCH RATE, AND THE SIZE COMPOSITION OF THE COMMERCIAL CATCH ............................................................................................................................. 66 APPENDIX 5: EARLY ABALONE PRODUCTION 1960-1981 ...................................................................... 75 APPENDIX 6: ANNUAL CATCHES BY ZONE – 1975-2011 ........................................................................ 76 APPENDIX 7: CATCH/EFFORT DATA EXTRACT QUERY ............................................................................ 85 APPENDIX 8: TREATMENT OF ERRORS IN CATCH DATA IN 2011 ............................................................. 86 APPENDIX 9: ECOLOGICAL EFFECTS OF ABALONE FISHING. ................................................................... 87 APPENDIX 10: HISTORY OF MANAGEMENT CHANGES ........................................................................... 89 APPENDIX 11: MAPS OF CATCH-REPORTING BLOCKS AND SUB-BLOCKS ............................................... 100 APPENDIX 12: APPLICATION OF THE “TWO-YEAR RULE” TO THE BLACKLIP ABALONE FISHERY, 2011.. 106 APPENDIX 13: COMMERCIAL SIZE LIMITS FOR BLACKLIP AND GREENLIP ABALONE, 2011 .................... 108 REFERENCES: ....................................................................................................................................... 110

Abalone Fishery Assessment: 2011
Page 1
Introduction
This assessment relies on fishery-dependent data. Principally, changes in catch and catch rate have been used to make inferences about changes in abalone abundance. In addition, information is presented on changes in the median length of abalone sampled from the commercial catch across relatively fine spatial scales. This provides additional information on changes in abundance, especially in interpreting trends in recruitment and fishing mortality.
The use of catch and catch rates to monitor changes in abalone abundance has often been criticised as unreliable and elsewhere is infrequently used. In theory, the fishing of abalone aggregations, serial depletion and changes in fishing efficiency reduce the link between catch rates and abundance. These factors are more problematic in areas where effort and catch data are sparse and compounded by the use of arithmetic means which are sensitive to skewed data.
However, when abalone populations are intensively fished, catch and catch rate trends are more reliable indicators of changes in abundance. When fishing pressure is sufficient, large aggregations are unable to develop, and high visitation rates prevent stock build up and subsequent serial depletion. The confounding effects of effort creep may be reduced by using short-term (10 years or less) catch and catch-rate trends to assess changes in stock levels. Under these circumstances, catch and catch-rate trends appear to reflect changes in abundance.
This document makes use of fisheries data collated over progressively diminishing spatial scales. The top level scale is the zone. The use of zones was first introduced into the Tasmanian fishery in 2000 to manage the spatial distribution of catch. Since 2003, the Tasmanian blacklip fishery has been divided into four zones: Eastern, Western, Northern and Bass Strait. A fifth zone (Central West) was introduced in 2009. The greenlip abalone fishery is managed separately from the blacklip fishery. The greenlip fishery is restricted to the north of the state, and the spatial distribution of its catch is managed by regions.
Whilst zones are now the established method of managing the fishery, they mask details important for fishery assessment. Zones are too large and include too many physical differences (e.g. water temperature regimes, types of habitat, accessibility for divers), and may include divergent recruitment patterns, and different levels of abundance and fishing methods. There is a risk that recruitment in particular parts of a zone may be very different to that of the wider region. In this assessment, understanding of stock abundance is improved by looking at fishing patterns across smaller regions within each zone which have a greater likelihood of sharing common fishing practises and stock levels. The regions and region boundaries used in this assessment have been set arbitrarily, but are generally based upon commonly used Tasmanian regions, about which boundaries have been placed aligned with the abalone fishery reporting blocks. Where necessary, reference is made to the component blocks or sub-blocks within a region to help
Abalone Fishery Assessment: 2011
Page 2
understand the performance of its fishery, provided the annual catch was 10 t or more in any one of the years since 2000.
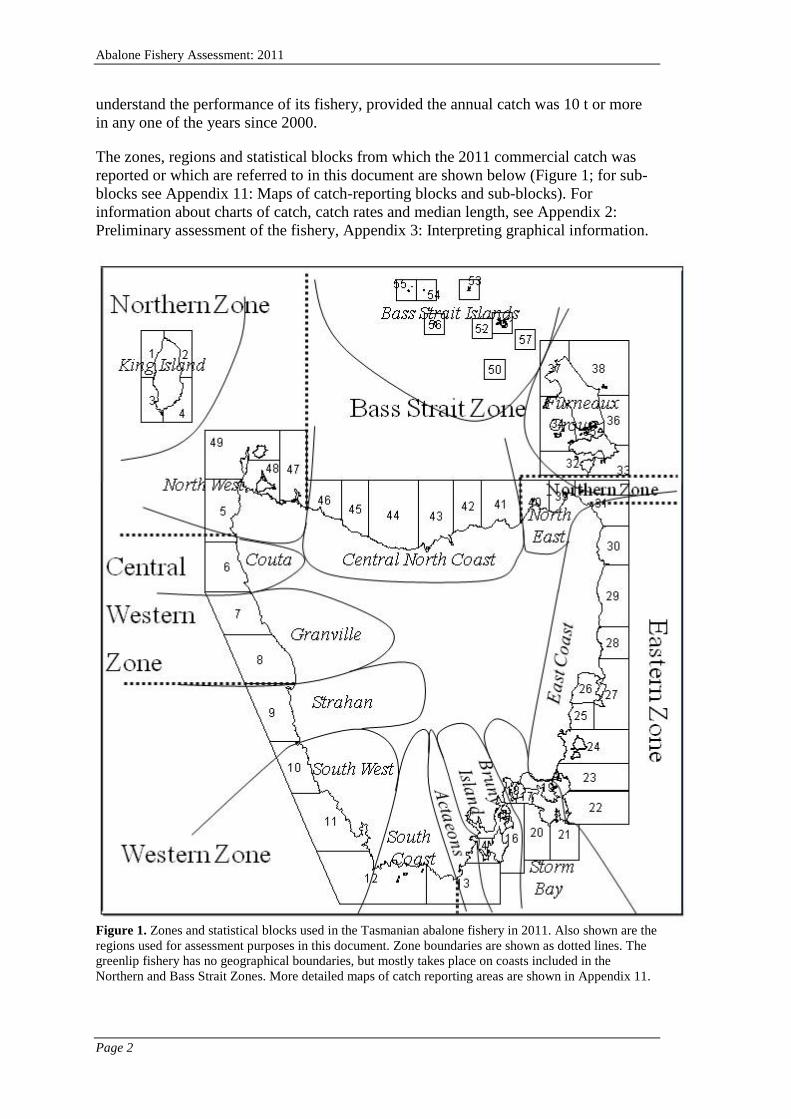
The zones, regions and statistical blocks from which the 2011 commercial catch was reported or which are referred to in this document are shown below (Figure 1; for sub-blocks see Appendix 11: Maps of catch-reporting blocks and sub-blocks). For information about charts of catch, catch rates and median length, see Appendix 2: Preliminary assessment of the fishery, Appendix 3: Interpreting graphical information.
Figure 1. Zones and statistical blocks used in the Tasmanian abalone fishery in 2011. Also shown are the regions used for assessment purposes in this document. Zone boundaries are shown as dotted lines. The greenlip fishery has no geographical boundaries, but mostly takes place on coasts included in the Northern and Bass Strait Zones. More detailed maps of catch reporting areas are shown in Appendix 11.

Abalone Fishery Assessment: 2011
Page 3
The zone boundaries and their reporting blocks for the 2011 fishing year were as follows:
Zones (blacklip fishery) Eastern Zone: Whale Head to Great Musselroe River, Sub-blocks 13C, 13E, 13E, Blocks 14 to 30, Sub-block 31A. Northern Zone: Great Musselroe River to Anderson Bay, Cowrie Point to Arthur River including King Island, Sub-block 31B, Blocks 39 to 40, Blocks 47 to 49, Sub-blocks 5A, 5B, 5C. Bass Strait Zone: Central North Coast: Cowrie Point to Anderson Bay, Blocks 41 to 46, remote Bass Strait Islands: Blocks 50 to 57, Furneaux Group: Blocks 32 to 38. Central Western Zone: Arthur River to Ocean Beach, Sub-block 5D, Blocks 6 to 8. Western Zone: Ocean Beach to Whale Head, Blocks 9 to 12, Sub-blocks 13A, 13B.
The greenlip fishery has no spatial boundaries but is restricted by the natural distribution of greenlip to waters north of the Great Musselroe River in the east and Cape Grim in the west.
Regions The regions used for blacklip assessment purposes in this document comprise the following reporting blocks: Actaeons (and lower Channel): Sub-blocks 13C, 13D, 13E, 14A, 14B Bruny Island: Sub-blocks 14C, 14D, 14E, Blocks 15 and 16 Storm Bay: Blocks 17 to 21 East Coast: Blocks 22 to 30, Sub-block 31A North East: Sub-block 31B, Blocks 39 and 40 Furneaux Group: Blocks 32 to 38 Bass Strait Islands: Blocks 50 to 57 Central North Coast: Blocks 41 to 46 King Island: Blocks 1 to 4 North West: Blocks 47 to 49, Sub-blocks 5A, 5B, 5C Couta: Sub-block 5D, Block 6 Granville: Blocks 7 to 8 Strahan: Block 9 South West: Blocks 10 to 11, Sub-block 12A South Coast: Sub-blocks 12B, 12C, 12D, 13A, 13B
The greenlip fishery is reported from the North West (Blocks 5, 48B, 48C and 49), King Island (Blocks 1 to 4), the Furneaux Group (Blocks 32 to 38), the North East (Blocks 31, 39 and 40), Perkins Bay (sub-block 48A) and the Central North Coast (Blocks 41 to 47). Small catches are occasionally reported from the remote Bass Strait Islands (Blocks 50 to 57).
This document contains charts of annual total catch and geometric mean catch rates, catch-rate distributions and annual median length. Important details about the use of these charts and the data from which they were produced are summarised below (a more detailed explanation may be found in Appendix 3: Interpreting graphical information).

Abalone Fishery Assessment: 2011
Page 4
The weights from all reported catches between 1975 and 2011 (inclusive) were used to estimate annual total tonnages i.e. no catches were omitted. The catch and effort database is known to contain duplicate, incorrect and incomplete records. These records are difficult to detect, but are corrected when they are encountered, and consequently there may be minor variations in annual catch reported in these documents from year to year.
Sales of abalone commenced during the late 1950’s but catch return data was not collected until 1975. Between 1975 and 1984 abalone catches were reported by the skipper of the fishing vessel as estimated weights, on a monthly basis. Between 1985 and 1992, catches were reported as landed weights, by the diver, per landing. Estimated weights by block are unavailable for this period, which means that catches taken from several blocks in one trip may be reported as caught from one of those blocks. Since 1992, estimated weights by block have been used, to enable the best spatial resolution of catch. The sum of estimated weights by zone is usually within 2-3% of the sum of landed weights by zone, but between 1992 and 1995 was up to 10% less.
Annual catch rates were derived from the geometric mean of individual catch rates, and all mean catch rates referred to in this document are geometric means. Geometric means are more reliable estimators of the mean catch rate across all divers than arithmetic means (averages), because they are less affected by variable skewness of distributions (e.g. where there are small but variable percentages of high catch rates), and the standard error of the geometric mean is smaller than that of the arithmetic mean. Only catch rates from catches of 40 kg or more were considered when calculating catch-rate means (to reduce the effects of fishing events that were adversely affected by mechanical breakdown or calculating catch rates on the by-catch of fishing for different species).
Catch-rate distribution charts show the distribution of catch rates across all divers i.e. the proportion of daily records having catch rates in categories grouped from low to high. By comparing the distribution of catch rates between recent years, it is possible to see where changes in catch rate have occurred, and the effect that they have had on the mean catch rate.
The annual median length of abalone, when viewed as a time series of data, is used to show changes in the length of abalone that may reflect changes in fishing pressure or levels of recruitment. Between 1998 and 2000, median length was derived from length measurements obtained from photographs of 25 abalone taken from divers’ catches, photographed aboard divers’ boats. Since 2000, median lengths were derived from samples of 100 measured abalone randomly selected from individual catches, and in most cases, sampling has been undertaken at factories. Since 2008, the larger processors have conducted this sampling. As a rule of thumb, median lengths are deemed useful when more than 4% of catches in a reporting area have been sampled, although in the less productive blocks where relatively few catches are landed, a much higher proportion of sampled catches is required to produce reliable information.

Abalone Fishery Assessment: 2011
Page 5
The performance measures (catch, catch rates and median length) for each region of the fishery were assigned a status (stable, rising, falling and erratic or no data), and an initial assessment made (Appendix 2: Preliminary assessment of the fishery). The regional assessments were combined and presented as a draft fishery assessment to panels of divers and other industry participants at meetings in Hobart and other regional centres. The initial assessments were subsequently modified where it was apparent that the performance measures reflected changes caused by factors other than changes in stock levels, and a final assessment was developed.

Abalone Fishery Assessment: 2011
Page 6
Total landings and gross value of production
At the end of 2011 annual totals of reported landings comprised 2,406 tonnes (t) of blacklip and 143 t of greenlip, a total of 2,548 t from a TAC of 2,565.5 t (Table 1). Total landings fell in 2011, mostly attributable to a large (175 t) reduction in the Eastern Zone TAC, but also because a small amount of quota remained uncaught.
Table 1. 2011 landings by zone, in tonnes
Zone 2011 TAC 2011 Landings (tonnes)
Greenlip 143.5 142.577 Eastern Blacklip 721.0 714.362 Northern Blacklip 402.5 398.735 Western Blacklip 924.0 920.386 Central Western Blacklip 304.5 302.577 Bass Strait Blacklip 70.0 69.497 2565.5
2548.134
Processor returns showed that the 2011 catch had a gross value of production of $84.8 million, down by $19 million from the previous year. While beach prices for canned product (mostly from the Northern and Bass Strait Zones) remained stable or even increased slightly, prices for live market product (mostly sourced from the Eastern, Western and Central West Zones, and the greenlip fishery) fell in 2011.
In 2011 beach prices for live market product were weaker mid-year and rose in December, while prices from processors were mostly stable throughout the year (Figure 2). Approximately 9% of the resource rent is paid as a royalty to the Tasmanian government with the absolute amount varying due to a progressive scale based on beach price. This royalty payment fell by $0.85 million to $6.35 million in 2011 as a result of lower beach prices and the smaller catch.
Figure 2. Monthly trends in average beach price for abalone, by zone, 2011. Bass Strait and Northern Zone abalone were predominantly used for canning; Eastern, Western and Central West Zone abalone were mostly sold to the live market. Greenlip beach-price data were incomplete.
0
50
100
150
200
250
20
25
30
35
40
45
1 2 3 4 5 6 7 8 9 10 11 12
Land
ings
tonn
es/m
onth
Bea
ch p
rice
$/kg
Month
Central West
Bass Strait
Eastern
Northern
Western
Greenlip

Abalone Fishery Assessment: 2011
Page 7
There has been an overall decline in abalone beach prices since 2001 due to factors including: strengthening of the Australian dollar; competition between Australian exporters; structural changes in the market; seasonal quality factors; inability to match available sizes with market demand; changes in the business operations of importers; and border issues in importing live abalone into China (Tony Johnston, pers. comm.).
There has also been substantial increased production of farmed abalone in Asia, which although a different product, is a partial substitute in some markets and would be expected to affect demand for wild abalone. Southern rock lobster was exposed to most of the same market processes as abalone with the exception of competition from aquaculture product and thus provides some insight to this effect. The beach price of southern rock lobster tracked that of abalone until 2005 but has had a very different trajectory since then, peaking at record highs in 2010 (Figure 3).
Figure 3. Trends in average beach price by zone, 2001-2011 for blacklip and greenlip abalone and southern rock lobster, and relative change in value of the Australian dollar against key trading currencies (US dollar, Chinese yuan). Prices are actual values, and have not been adjusted for the consumer price index (CPI) which increased by more than 30% during this period.
0.5
1
1.5
2
2.5
1015202530354045505560
20012002200320042005200620072008200920102011
Valu
e of
fore
ign
curr
ency
Aver
age
beac
h pr
ice $
/Kg
Year
Eastern
Western
Central West
Northern
Bass Strait
Greenlip
Rock Lobster
USD/AUS
CNY/AUS

Abalone Fishery Assessment: 2011
Page 8
Assessment of the Tasmanian abalone fishery
Eastern Zone
Actaeons and Lower Channel (Sub-blocks 13C, 13D, 13E, 14A, 14B):
Fishery-dependent data The region’s annual catch has slowly increased from 356 t (2008) to 371 t in 2011. Catch from the most productive area (13C, 13D and 13E) was closed to fishing on 29 October after 359 t had been caught. Of this, 296 t was taken in 13E, 52 t from 13C while only 11 t were caught in 13D. Most of remaining catch was taken from 14A (12 t), with only 376 kg reported from 14B. The distribution of catch within the region was affected by the closure of some fishing areas after higher than permissible levels of paralytic shellfish toxin (PST) were detected. From 20 May 2011 abalone products sourced from all sub-blocks in the region with the exception of 13C were subject to export restrictions imposed by the Department of Agriculture, Fisheries and Forestry (DAFF) i.e. abalone could not be exported. These restrictions were modified on 1 June 2011, when live exports from 13E were allowed to resume. Product from the other sub-blocks, as well as 16A (South Bruny) could only be exported with viscera removed i.e. could not be exported live. Live abalone attracts a higher price than canned abalone, and the export restrictions caused catch to increase in 13E and 13C. On 29 July 2011 restrictions were lifted to allow abalone from 14A to be exported live, while abalone product of any kind sourced from 14E was prohibited for export. On 1 November 2011, live exports were allowed from 13D, but by that stage the 340 t catch cap had been reached, and DPIPWE had closed the fishery.
Figure 4. Changes in the distribution of annual catch within the Actaeons sub-blocks: 2000-2010 average compared with 2011. Sales of abalone from sub-block 13D were subject to restrictions following the detection of paralytic shellfish toxin in samples collected there and divers avoided the sub-block.
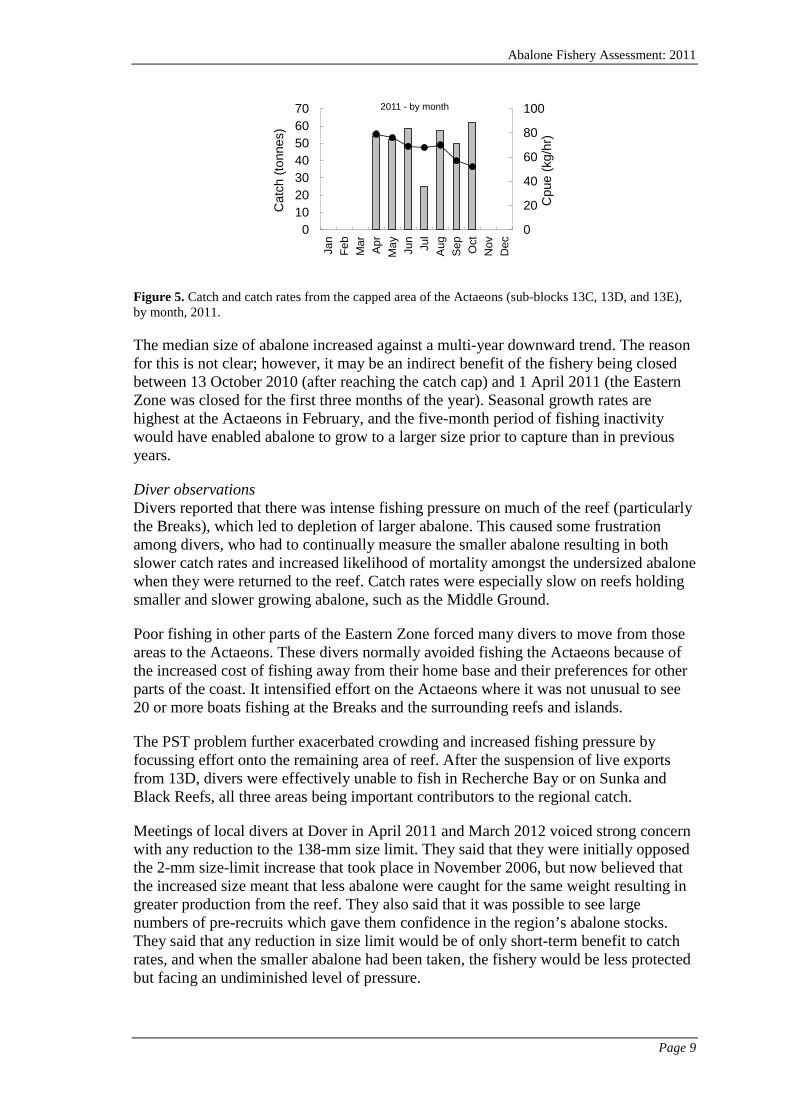
Regionally, catch rates continued to fall, the highest being in 13D prior to closure in May at 68 kg/h. When the capped area had closed, catch rates had fallen to 65 kg/h in both 13E and 13C. In 14A, catch rates fell to 42 kg/h. Catch rates from the capped area showed an almost continuous decline from 79 kg/h when the fishery opened in April to 52 kg/h in October (Figure 5).
13%
15%
71%
2000 to 2010
14% 3%
83%
2011
13C13D13E
Abalone Fishery Assessment: 2011
Page 9
Figure 5. Catch and catch rates from the capped area of the Actaeons (sub-blocks 13C, 13D, and 13E), by month, 2011.
The median size of abalone increased against a multi-year downward trend. The reason for this is not clear; however, it may be an indirect benefit of the fishery being closed between 13 October 2010 (after reaching the catch cap) and 1 April 2011 (the Eastern Zone was closed for the first three months of the year). Seasonal growth rates are highest at the Actaeons in February, and the five-month period of fishing inactivity would have enabled abalone to grow to a larger size prior to capture than in previous years.
Diver observations Divers reported that there was intense fishing pressure on much of the reef (particularly the Breaks), which led to depletion of larger abalone. This caused some frustration among divers, who had to continually measure the smaller abalone resulting in both slower catch rates and increased likelihood of mortality amongst the undersized abalone when they were returned to the reef. Catch rates were especially slow on reefs holding smaller and slower growing abalone, such as the Middle Ground.
Poor fishing in other parts of the Eastern Zone forced many divers to move from those areas to the Actaeons. These divers normally avoided fishing the Actaeons because of the increased cost of fishing away from their home base and their preferences for other parts of the coast. It intensified effort on the Actaeons where it was not unusual to see 20 or more boats fishing at the Breaks and the surrounding reefs and islands.
The PST problem further exacerbated crowding and increased fishing pressure by focussing effort onto the remaining area of reef. After the suspension of live exports from 13D, divers were effectively unable to fish in Recherche Bay or on Sunka and Black Reefs, all three areas being important contributors to the regional catch.
Meetings of local divers at Dover in April 2011 and March 2012 voiced strong concern with any reduction to the 138-mm size limit. They said that they were initially opposed the 2-mm size-limit increase that took place in November 2006, but now believed that the increased size meant that less abalone were caught for the same weight resulting in greater production from the reef. They also said that it was possible to see large numbers of pre-recruits which gave them confidence in the region’s abalone stocks. They said that any reduction in size limit would be of only short-term benefit to catch rates, and when the smaller abalone had been taken, the fishery would be less protected but facing an undiminished level of pressure.
0
20
40
60
80
100
010203040506070
Jan
Feb
Mar Apr
May Jun
Jul
Aug
Sep Oct
Nov
Dec
Cpu
e (k
g/hr
)
Cat
ch (t
onne
s)
2011 - by month

Abalone Fishery Assessment: 2011
Page 10
Qualitative assessment Falling catch rates since 2009 and rapid declines in monthly catch rates in both 2010 and 2011 indicated that levels of recruitment were inadequate for the quantity of catch taken at the Actaeons, and that substantial catch reductions were required. Stocks were assessed to be moderate and continuing to fall.
Catches in recent years have been high at over 350 t, and of a magnitude not seen since the boom period just prior to and at the start of zone management in 1997-2000, when what is now the Eastern Zone produced 1100-1500 t p.a. Following those sustained high catches, catch rates crashed to 50 kg/h or less for three successive years (2002-2004). The level of catch fell as low as 212 t (2006) which enabled the stock levels to rebuild and catch rates to return to levels that divers found economically viable.
At the end of 2011, the Actaeons fishery was in a depleted state similar to that of 2002. However, the Eastern Zone TAC has been reduced by almost 40% since 2010 whereas in 2002 managers were much slower to react. This quick response coupled with a higher LML should mean that the fishery recovers faster and that a prolonged downturn in stock levels might be avoided.
Bruny Island (Sub-blocks 14C, 14D, 14E, Blocks 15 and 16):
Fishery-dependent data The annual catch from Bruny Island was 40 t, less than half that of 2010, and a small fraction of the former levels of catch from Blocks 14 and 16. Some of the reduction in catch can be attributed to closure of sub-blocks 14C, 14D, 14E and 16A for the sourcing of live export abalone because of PST restrictions and consequent preference by divers to fish elsewhere. Consequently total annual catches from 14C, 14D and 14E were all very small (<2 t pa) and the amount of effort applied there was inconsequential and too low to evaluate stock levels.
On Bruny’s eastern coastline, small quantities were taken from 16A (14 t), 16B (13 t), 16C (5 t) and 16D (6 t). In the D’entrecasteaux Channel (Block 15) only a single catch of 200 kg was taken.
Regional catch rates remained low (46 kg/h). Highest catch rates were in 16D, where they fell marginally to 60 kg/h. In 16A and 16B they fell to 46 kg/h, in 16C they rose slightly to 50 kg/h.
Compared with previous years, the median length of abalone was smaller by 1-2 mm in sub-blocks where adequate samples were collected (16A, 16B and 16C). This reduction in size is considered to reflect increased levels of fishing mortality on stocks.
Diver observations A very small number of divers were able to maintain reasonable catch rates particularly at North Bruny, but most experienced slow fishing and complained of widespread stock reduction. They also reported seeing fewer undersized fish. Most divers avoided the region if able to, and moved to either the Actaeons or Eaglehawk Neck.
Qualitative assessment At such low levels of catch, effort may be insufficiently diverse and affected more by fleet dynamics than stock abundance, and consequently the risk that catch rates trends

Abalone Fishery Assessment: 2011
Page 11
fail to reflect trends in abundance is higher than usual. However the almost uniform decline in catch rates and reduced median size of abalone is a strong indication that stocks have failed to rebuild following low levels of catch in previous years. Storm Bay (Blocks 17-21):
Fishery-dependent data The regional catch (86 t) was reduced by more than 50% in 2012. Less than 20 t was taken from the northern part of the bay (Blocks 17, 19, 20A). Between Nubeena and Cape Raoul (20B, 20C) only 22 t was taken. During the previous 10 years between two to three times this quantity was taken. The remainder of the catch (47 t) was taken between Cape Raoul and Tasman Island (21A, 21C).
Like other parts of the Eastern Zone, catch rates have fallen sharply in Storm Bay despite reduced catch targets. Between 2006 and 2009, catch rates were between 80 – 90 kg/h but had fallen to 58 kg/h in 2011. In the northern part of the bay (Blocks 17, 19 and 20A) where catch was least, catch rates were similarly low at 46 kg/h. The highest catch rates were found in sub-blocks 21A and 21C (71 kg/h).
Figure 6. Percentage of effort (dive-time) reported at depths >20 m in Block 21, 2011. No fishing occurred prior to April.
The percentage of time spent in deep water increased throughout the year in this region, and by December in Block 21, 9% of effort was reported at depths > 20 metres (Figure 6), with 20% deep-water effort reported from sub-block 21A, also in December.
In most sub-blocks (17B, 20B, 21A, 21C) the median length of abalone was smaller or same-sized, counter to a trend of increasing size in recent years. Most sub-blocks have had sampling rates of 10-15% in recent years.
Diver observations Depleted stocks and slow fishing were reported throughout much of the region. Divers tended to avoid the northern part of Storm Bay and Nubeena, preferring to fish from Port Arthur instead where stock levels were higher with more acceptable catch rates. Here, divers reported that they had found it necessary to move into deeper water because the shallower reefs were too depleted. In some cases they obtained high catch rates (>150 kg/h) on the deep reefs. They expressed concern that these deeper reefs may be a source of egg production for the shallows and that in turn the deeper reefs were becoming depleted, thereby jeopardising populations at all depths. They said that the deeper reefs recovered from fishing more slowly than the shallower reefs.
0
2
4
6
8
10
Apr
May Jun Jul
Aug
Sep
Oct
Nov De
c
% to
tal e
ffort
effort deeper than 20 metres

Abalone Fishery Assessment: 2011
Page 12
Quantitative assessment Stocks have become depleted throughout the region, with catch rates trending downwards toward levels last seen ten years ago. The smaller median size of abalone was consistent with high levels of fishing mortality. Serial depletion was evident as divers moved to deeper water to maintain catch rates. The annual catch has been very moderate in recent years, at approximately two thirds of long-term averages, and it seems that the stock decline is not driven by over-fishing, but is consistent with diminished levels of recruitment.
East Coast (Blocks 22 to 30, Sub-block 31A):
Fishery-dependent data The annual catch for the region was 212 t, 82 t lower than in 2010. Catch limits in this region were heavily reduced because of concerns about falling stock levels and all parts south of and including Long Point (Block 29A) were closed to fishing towards the end of 2011 after those limits had been reached.
In Block 22 (Eaglehawk Neck and further south) the annual catch was 54 t. The area was initially closed in September but reopened at the end of the year for two weeks. In the area east of Dunalley, including Maria Island (Blocks 23, 24), the catch (54 t) was the lowest since the major stock downturn of 1989. Further north, the catch from Schouten Island, the Freycinet Peninsula and the coast north of Bicheno including Long Point (Blocks 27, 28, 29A) was also very low at 46 t. The remainder of Block 29 and 30 (Scamander to Binalong Bay) were not capped, but only 14 t of catch was reported from here. In Block 31 (north of Eddystone Point) which was expected to produce 60 t, only 42 t were caught.
On some parts of the coast which were once considered prime fishing areas, no or very low catches have been reported for many years. These include Blocks 25, 26 and 28. Most of Block 30 has effectively been closed to fishing since 2006 and the status of stocks here is not known.
In general, catch rates were low, and continued the downward trend of previous years. In Blocks 22, 23 and 24 they fell to 54 kg/h. Between Schouten Island and Long Point they fell to 48 kg/h. Further north (29B-30A) catch rates were higher (56 kg/h) and were best in Block 31 (90 kg/h) although they fell here as well.
The median size of abalone was generally unchanged compared with previous years, with no clear trends evident. In most reporting blocks the percentage of catches sampled was high, reaching 46% of catches from sub-block 23A and 24-25% from the eastern side of Maria Island (24D, 24E).
Diver observations Divers were very concerned about stock levels in this region. They cited a number of problems facing stocks here, including the spread of the long-spined sea urchin Centrostephanus rodgersii and the creation of barrens in abalone habitat, the effects of warmer than usual water temperatures, and the consequences on future recruitment following prolonged low stock levels.
They also expressed concern about the management of the fishery in this region, questioning the effect on residual stocks when they were forced into areas of depleted

Abalone Fishery Assessment: 2011
Page 13
stocks after other (better) areas were closed to fishing. They were unable to take full advantage of higher stock levels in Block 31 because its abalone were of lower value and given a choice, processors or quota owners directed them elsewhere.
Areas of particular concern included the northern end of Maria Island, Wineglass Bay, Bicheno and Long Point. At Wineglass Bay stocks were reported so low, and barrens so extensive that divers could not foresee any recovery in the near future. The coast north and south of Bicheno was once a productive part of the fishery but appears to have lost most of its capacity to produce fish. They requested that the remainder of Block 30 be reopened to fishing so that effort could be directed here for the relief of other areas.
Qualitative assessment Stocks continued to decline in 2011 and throughout much of the region appeared to be at very low levels. The annual catch was reduced in 2010 to match the stock decline and while catch rates have remained low, have not yet fallen to levels seen during the previous 2001-2003 downturn.
Some areas have been particularly affected by a combination of low abalone stocks and increasing Centrostephanus levels. It appears that the primary cause of the stock decline has been lower than usual recruitment, although just why stocks should fall so rapidly and to such low levels after several years of high catch rates is not understood.
Central West Zone
Couta Rocks Region (Sub-block 5D and Block 6):
Fishery-dependent data The annual catch reported from this region was 152 t, similar to the 2010 catch and 9 t more than the 2009 catch. In the last two years most effort has been directed at 6C, where 55 t and 68 t have been taken respectively. This was a remarkable increase in catch, effectively doubling the average of the previous 10 years (28 t). In the north, 45 t was taken from 6A, also more than its 10 year average (37 t), but here there was high between-year variability in annual catch (the standard deviation of catches is 26 t), and the size of the 2011 catch falls within the 10-year range. 6B (21 t) and 6D (17 t) both contributed comparatively small amounts of catch. The catch from 6D was controlled under the 150 t cap for the southern part of the zone, and 6D was closed to fishing on 23 May. The southern cap closure saw a rapid escalation of effort in the remainder of Block 6. Prior to July no more than 5 t had been taken in any month but when weather permitted during the remainder of the year between 18 t and 36 t was taken every month.
Catch rates fluctuated around 120 kg/h in 6A and 6B. In 6C, they fell sharply from 155 kg/h in 2010 to 112 kg /h in 2011. The size of catch from this sub-block and the magnitude of its catch-rates decline caused regional catch rates to fall. In 6D after years of large catches, there has been a steady decline to 116 kg/h.
The median size of abalone from 6D has trended smaller in recent years from approximately 155 mm between 2000-2003 to 147 mm. The LML here is 140 mm. Elsewhere, where the LML is 132 mm, the median size has been stable around 140 mm.

Abalone Fishery Assessment: 2011
Page 14
Diver observations Divers reported that excessive effort in 6C was due to both its proximity to the Sandy Cape anchorage for motherships, and its fish, which were said to be of higher quality than those from further north, making them more suited to live export. Fishing had become more difficult here, but good catches could still be landed. Further north the abalone were more suited for processing and attracted a lower beach price. Opinions about where the division between abalone quality occurred were mixed: some believed it to be at Dawson Bay (Block 6B/6C boundary), others at Couta Rocks and yet others at the Sandy Cape Beach (6C/6D boundary). There has been much discussion about management arrangements for the Central West Zone and the problems caused by a two-tiered (live/canned) pricing arrangement within one zone. Many believed that the Central West Zone should be abolished, with the northern part merged into the Northern Zone, and the south into the Western Zone.
Elsewhere, concern was expressed for stocks at Sandy Cape (6D) which had not fished well for several years following high levels of catch 2006-2009. Some were expecting a similar downturn in 6C following recent large catches. Fishing in the north (6A, 6B) was reported to be good.
Qualitative assessment. In consideration of lower catch rates and reduced median size, stock levels were again assessed as reduced in 6D, with no evidence of recovery. In 6C where there was a sharp catch rate decline following very high catches, stock levels were also assessed reduced. To put this reduction in perspective, catch rates remained above 100 kg/h with the abalone of medium size indicating that numbers had not fallen to critical levels. However, any further catch rate falls or reduction in median size would indicate that fishing mortality was too high, and possibly at levels that could limit recruitment. In 6A and 6B catch rates and median sizes were unchanged, and abalone stocks were assessed stable.
Granville Harbour Region (Blocks 7 to 8):
Fishery-dependent data Levels of catch in this region since the advent of the Central Western Zone in 2009 have been approximately 50% higher than long-term averages at between 140-160 t. In 2011 the catch was 143 t. Distribution of this catch changed compared with earlier years, with more catch (25 t) coming from north of the Pieman (7A) and less from Conical Rocks (31 t). The coast immediately north of Granville Harbour (7C) supplied double its usual amount (38 t), while to the south in 8A and along the cliffs to Trial Harbour (8B) 24 t and 18 t were taken respectively.
Regionally, catch rates increased slightly from 124 kg/h to 132 kg/h. Reflecting the change in catch distribution, catch rates were very high in 7A (195 kg/h) but only 112 kg/h in 7B. In the remainder they varied between 119 kg/h (8A) and 159 kg/h (8B).
This part of fishery closed on 23 May after four months of intensive effort. In January catch rates were highest at 166 kg/h, but declined rapidly as stocks were reduced, and by May the effects of such heavy fishing pressure had become apparent, with the last 9 t taken at 98 kg/h.

Abalone Fishery Assessment: 2011
Page 15
Rates of sampling of catches have been highly variable as abalone from the region fall in and out of favour with processors. Consequently there are many years when insufficient sampling has been done to evaluate changes in median length. In the three sub-blocks with sufficient samples (7A, 7B, 7C) median length was between 151-153 mm in 2011. In 7A, median length has fallen from 156 mm in 2008 (38% of catches measured) to 151 mm (31% measured). There appears to be no clear trend in 7B and 7C, with abalone ranging between 151-157 mm since 2002. Changes in median length may be partially due to the inadequate levels of sampling, and not wholly reflective of changes in population size structure.
Diver observations Divers reported good fishing from north of the Pieman in 7A. They had no difficulties with the large size of abalone from Rupert Point, which in previous years had caused concern among processors. They said that Conical Rocks (7B) had suffered greatly from the previous year’s high catch (84 t) and would take years to recover. Generally, they believed that the level of catch produced from Blocks 7 and 8 was too high to be sustained. They were also concerned that the short intense effort in the region was detrimental to stocks, promoted habitat change, and increased the cost of fishing.
Qualitative assessment There was a small increase in catch rates predominately due to divers taking advantage of good weather conditions at the start of the year to fish remaining high stock levels in the northern and southern extremities of the region. Elsewhere, in areas closer to Granville Harbour where the greatest amount of catch has been taken in recent years, catch rates started lower. Divers sought to maximise landings of the higher valued southern component of the Central West quota and high levels of effort were applied as they sought to catch abalone before the cap was reached. Stocks were assessed as moderate, having been reduced from former levels, and this reduction appears to be ongoing.
Western Zone
Strahan Region (Block 9):
Fishery-dependent data Reported catch at 171 t was slightly higher in 2011, with a cap at 186 t. For the first time more catch (102 t) came from 9C (south of Gorge Point) than 9B (68 t - Cape Sorell to Gorge Point). Minimal catch (1.3 t) was taken from the coast immediately west of Macquarie Heads (9A). The higher catch in 9C was due to mothership-based divers moving further north than usual, and Strahan based runabouts by-passing 9B and driving further south, both to find better fishing.
Catch rates were only slightly higher in 9C (166 kg/h) than 9B (155kg/h). However, during the year catch rates were consistently high in 9C, whereas in 9B they occasionally fell below 100 kg/h.
Median size of abalone has been quite variable in 9B in recent years, fluctuating in the range 151-158 mm. In contrast, there has been a strong downward in 9C from 158mm to 151 mm. The percentage of catches sampled from the region, while above the 4% threshold, has been lower than desirable.

Abalone Fishery Assessment: 2011
Page 16
Diver observations Divers were generally satisfied with fishing conditions in Block 9. They said that while it had become difficult to successfully fish in deep water when the swell was high, good catches could be obtained when the swell dropped. They said that they preferred to fish when swell was two metres or less, and only fished in larger swells if they were asked to supply fish. They said that continuing improvement in weather forecasts meant that they spent less time struggling to fish when swells were too large, and that during the last few years this had caused catch rates to be higher than they would have been previously i.e. effort creep needed to be considered when comparing catch rates from the last couple of years with those of earlier years.
Qualitative assessment Catch and catch rates were relatively stable in this part of the Western Zone. Catch rates were at moderate to high levels. Stock levels were assessed stable.
South West (Blocks 10, 11, Sub-block 12A):
Fishery-dependent data The reported catch from this region was 450 t. The actual catch may have been higher, considering (a) the ~ 30 t discrepancy between total estimated weights and landed weights from the Western Zone, and (b) that mothership divers are usually unable to accurately weigh daily catches.
Of the total catch, 159 t was reported from Block 10 in the north (Low Rocky Point to Point Hibbs), 247 t from Block 11 (Faults Bay just south of Port Davey to Low Rocky Pt.), and 44 t from sub-block 12A (South West Cape to Faults Bay). These catches are at moderate levels both from a short term (since 2000) perspective, and when viewed over a longer timeframe (since 1975).
Catch rates fell across the region after rising briefly between 2009 and 2010, from 128 kg/h to 119 kg/h. The highest catch rates were in the north in sub-blocks 10A, 10B and 10C with catch rates between 138-164 kg/h. In the remainder, they were between 96-126 kg/h. Average regional cpue in January was 125 kg/h, falling to 108 kg/h at the end of March. Catch rates picked up again in July and in months with significant amounts of catch, were highest in December (134 kg/h).
Length distributions show a fall in median length in aggregated sub-block data from both Blocks 10 and Blocks 11. In Block 10, the fall has been from 157-163 mm between 2001-2008 (2000 regarded as an outlier) to 153-154 mm in 2010-2011, with a similar reduction seen in 25th and 75th percentiles. In Block 11 median length has fallen from 154-159 mm (2000-2008) to 153-154 mm (2009-2011). Note that the percentage of catches sampled prior to 2008 was below the 4% threshold level, and that amalgamating sub-blocks to block level was required to obtain sufficient samples. Both factors increase the risk that samples do not adequately represent populations within each block.
Diver observations In 2010 most divers were confident that stock levels were increasing again after the large reduction of catch in the region. In 2011, few divers thought that conditions continued to improve, most thought it about the same while the remainder thought that stocks had declined further.

Abalone Fishery Assessment: 2011
Page 17
There were many divers who continued to find abalone at reasonable catch rates. They said that the low overall catch rates reflected the need to produce abalone at the start of the year when the Eastern Zone was closed. This meant that they often fished in unfavourable sea conditions which prevented them accessing the better inshore populations, producing poor catch rates. Certainly, catch rates early in the season were low, supporting the assertion that they were weather affected. However, catch rates failed to improve later in the year when the demand for abalone was less intense, and divers could fish in more favourable weather.
The other group of divers said that reefs where they had successfully fished for years, particularly between Port Davey and Low Rocky, were no longer worth fishing because stocks had become too depleted. They said that stock levels in the South West were as low as they had ever known and that constant fishing in the area was causing them to decline further. The first group countered that these divers should move around more and avoid over-fishing the same reefs. They said that better fishing was available north of Low Rocky.
Qualitative assessment The regional catch was reduced by approximately one third in 2009 in response to evidence of widespread depletion including a sustained eight-year fall in catch rates. Catch rates then improved marginally until 2011, when they again fell. It is evident that stocks are not rebuilding as was hoped, and that they remain low. Further management intervention appears necessary before catch rates can rise again.
South Coast (Sub-blocks 12B, 12C, 12D, 13A, 13B):
Fishery-dependent data The South Coast catch was 268 t from a 260 t cap. The 2011 cap was reduced by ~15% from previous 2008-2010 levels. The largest proportion of catch (98 t) came from 12D (Prion Bay to Cox’s Bluff), with lesser amounts (59 t) from 12B (South West Cape to Cox’s Bluff), 55t from the Maatsuyker Group (12C), 33t from Prion Bay to South Cape (13A) and 23 t from South Cape to Whale Head (13B). This distribution of catch between sub-blocks was broadly similar to previous years.
In 2011 regional catch rates were 99 kg/h, compared with previous years during which catch rates fluctuated over a narrow range of approximately 90-100 kg/h since 2002. The highest catch rates were from the offshore islands in 12C, whilst along the coast eastward from South West Cape they ranged from 93 kg/h (12B) to 102 kg/h (13A). In 13B they were lower at 85 kg/h, but catch rates here have been at similar levels since 2004.
Abalone from the region tended to be smaller in recent years than in the past and it appears that the fishery is more reliant on recruits than other parts of the Western Zone. Median sizes have fallen from approximately 160 mm (2000-2004) to 150-154 mm (2008-2011). This is believed to be a direct result of high fishing mortality.
Diver observations South Coast abalone are a premium live market product and are in high demand by processors. The region is close to a large group of divers who operate from Dover and Southport. Divers work in this part of the zone under conditions that they would regard as unsuitable anywhere else.
Abalone Fishery Assessment: 2011
Page 18
Divers reported reasonable fishing conditions on the South Coast with acceptable catch rates and were confident that this part of the fishery was stable and that the current management arrangements (260 t cap, 140 mm LML) were appropriate. In contrast, ten years earlier catch rates had fallen from 120-140 kg/h to their current levels after annual catches rose from 150-200 t pa to 250-300 t pa, and divers were most concerned for the future of stocks in the region. It appears to be an example of a fishery where higher levels of fishing pressure do not necessarily precipitate an ongoing decline in stocks which instead settle at a new lower equilibrium.
Qualitative assessment Lower than normal Western Zone catch rates in this region indicated high levels of fishing pressure. However, the long-term stability of catch rates provides confidence that stock levels were stable here, although at lower levels than elsewhere. The median size of abalone is smaller than elsewhere in the Western Zone, and there is increased dependence on recruits, which in turn increases risk of a sudden downturn should a year class fail. The reduction in catch to 260 t should provide more security for this part of the fishery.
Northern Zone
King Island (Blocks 1 to 4):
Fishery-dependent data Annual catch has increased from 42 t in 2009 to 105 t in 2011. Most of the 2011 catch (67 t) was taken off the western side of the island from sub-block 3A (Ettrick to Airport, including Currie), with smaller amounts taken from 1C (13 t – Airport north to Whistler Point) immediately north, and 3C (9 t – Cataraqui Point to Seal Bay) to the south. There was less catch taken from Block 4 (6 t) than in 2010 (24 t). The amount of catch increased towards the end of the year following the closure of Blocks 5 and 49 in the North West.
Catch rates increased slightly, from 99 kg/h to 111 kg/h. In the areas where most catch was taken (3A, 1C), catch rates were 125 and 126 kg/h respectively, but elsewhere were substantially lower (3C – 103 kg/h, Block 4- 69 kg/h).
In past years the high catch rates have been attributed to diving reefs at depths > 20 m, where unfished stocks provided high yields for short dive times. In 2011 there was comparatively little effort in deep water and it was evident that divers were able to maintain reasonable catch rates in shallow (0-10 m) and mid-range (10-20 m) depths.
Diver observations The 2011 catch increase can be partially attributed to renewed interest in the region by mothership operators. Smaller catches in previous years had enabled shallow water stocks to rebuild and most visiting divers found good fishing conditions and high catch rates, with many catches of 800 kg or more per day. Most fishing was done along a relatively small section of coast north and south of Currie. Further south towards Cataraqui Point, fishing became less productive, but picked up again along the cliffs south to Stokes Point. However, along the cliffs divers said that it was obvious where earlier fishing had occurred, and that recovery was slower in this area. In the south and eastern parts of the island from Seal Bay to Grassy the fishing was poorer. Divers said

Abalone Fishery Assessment: 2011
Page 19
that while stock levels seemed high, continued taking of such large amounts of catch would soon reduce catch rates.
Qualitative assessment Resumption of fishing by visiting divers from motherships, stronger market demand and streamlining of AVG restrictions combined to produce an annual catch of over 100 t, with most divers fishing at high catch rates. Stock levels were assessed to be moderate to high. However, most fishing has occurred in a relatively small area and divers warned that excessive catch would quickly reduce stocks.
North West (Blocks 47 to 49, Sub-blocks 5A, 5B, 5C):
Fishery-dependent data The catch from this region at 266 t was the highest since the 1980’s. Some parts of the region which were productive then no longer support a blacklip fishery (Block 47) or now have very limited capacity (Block 48), so most of the catch is now taken from Block 5 (155 t) and Block 49 (103 t). In contrast with previous years, less catch (47 t) was taken near Woolnorth (5A) and more catch from the more remote 5B (55 t) and 5C (Bluff Hill Point - 53 t). In Block 49, 19 t was taken from Three Hummock Island (49A), 43 t from Albatross Island and the northern half of Hunter Island, and 40 t from the southern half of Hunter Island (49C). Block 5 was closed on 29 August after the 142.5 t cap was reached, and the remainder of the region was closed on 29 October (100 t cap).
Regional catch rates were 85 kg/h. Generally, catch rates have fallen throughout the region since 2009 by 15%, and have almost reached the low point of 2006 (82 kg/h) when Block 5 was fished at the 132-mm size-limit (it was reduced to 127 mm in 2008). In recent years the highest catch rates have been in 49B at Albatross Island, where because of its remoteness, stocks had built up to high levels and in 2004, produced catch rates over 150 kg/h. By 2011, catch rates there had fallen to 89 kg/h, despite a size limit reduction to 125 mm. Near Woolnorth (5A, 49C) and at Three Hummock Island catch rates had fallen to 77-81 kg/h. In 5B, between Studland Bay and Mount Cameron, catch rates were highest at 101 kg/h, and from there south to the Arthur River (5C), reached 93 kg/h.
Until 2011, resident divers usually fished at higher catch rates than visiting divers because of greater knowledge and experience in the region and knowledge of recent fishing activity. This difference between the residents and the visitors all but disappeared in 2011, as the residents’ catch rates fell at a faster rate.
The median size of abalone from Block 5 has been stable in the range of 132-136 mm since the size limit was reduced from 132 mm to 127 mm. Between 7-11% of catches from Block 5 were sampled.
Diver observations The principal concern of divers was that too much catch was being taken from this region. They said that size-limit reductions improved short-term catch rates, but if the catch was too high, areas quickly became depleted and catch-rates fell again. Divers were able to maintain catch rates for several years by progressively fishing more remote parts of the coast after the easily-accessed areas had become too depleted; however even in the remote areas stocks have been reduced.

Abalone Fishery Assessment: 2011
Page 20
Numerous examples of now-depleted but formerly highly productive areas were provided. These included Albatross Island, Steep Island, the area between Woolnorth and Trefoil Island, Hippo Point and Mt Cameron. Divers said that they could see no signs of improvement in quality among remaining abalone after extensive thinning of populations. An example given was the Trefoil-Woolnorth patch, where after sustained heavy fishing for many years, the abalone now seemed smaller, more crusty-shelled and of inferior quality, and greatly reduced in number.
Qualitative assessment The annual catch has been maintained at high levels since 2008, at which time the size limit was reduced. This has been part of a management initiative to improve abalone quality by thinning populations and reducing density. There has been a steady fall in catch rates during the past three years. Many areas that were once highly productive are now reported extensively depleted. Stock levels have fallen while there has been no evidence of improvements in abalone quality.
North East (Sub-block 31B, Blocks 39 and 40)
Fishery-dependent data The area of reef in this region is comparatively small, and in 2011 the regional catch was capped at 30 t, of which 29 t was caught. The region was closed to fishing on 5 December, when both blacklip and greenlip caps were about to be reached. Most of the catch (24 t) came from sub-block 31B (which includes Swan Island), with the remainder from Block 39 (3 t), and Block 40 (2 t). The region’s catch has been highly variable, ranging between 14-66 t since the zone was established in 2001.
Catch rates have also been highly variable and because effort often includes greenlip catch, are probably less than reliable as indicators of abundance. Since 2008, catch rates have fluctuated in the range 58-68 kg/h, and in 2011 were 60 kg/h.
Insufficient catches were sampled from this region to provide information about the size of its abalone.
Diver observations Divers thought that stock levels in the region were reasonable, and that fishing was satisfactory. Stock levels were well below those seen in 2007, but they said that 2007 was an exceptional year and that lower stock levels were to be expected. Regarding the implications of mixed species effort on catch rates, they said that they normally fished for either blacklip or greenlip and usually did not do mixed species fishing trips, but this depended on the amount and type of quota available to them, and whether the processor would buy both species.
Qualitative assessment Catch rates, which have fluctuated over a large range in recent years unlikely to be attributable to changes in blacklip stocks, may be unreliable as indicators of abundance in this region, so caution is required here. The annual catch has been limited to levels more commensurate with the size of the stock. Diver reports indicated that stocks were adequate, and there were no indications of declines. Stock levels were considered to be moderate in this region.

Abalone Fishery Assessment: 2011
Page 21
Bass Strait Zone
Fishery-dependent data Almost the entire Bass Strait catch was taken from three small areas: the south-east end of Cape Barren Island (33B, 33C – 23 t), Babel Island (38A - 19 t), and Hogan Island (Block 53 – 13 t). Small amounts were taken from Blocks 41-47 (the central north coast between Bridport and Circular Head, 5 t), the Kent Group (3 t) and Curtis Island (2 t). In Block 37 which produced 65 t between 2003-2009, only 260 kg was taken.
Catch rates were highest in Block 33 (78 kg/h). Catch rates in this part of the fishery were initially 95 kg/h in 2010 when the size limit was reduced from 127 to 114 mm as part of its transfer from the Northern to Bass Strait Zone. In 38A catch rates also fell, from 95 to 71 kg/h, and at Hogan Island they were marginally higher at 71 kg/h. Across the central north coast they continued to fall, from a high of 52 kg/h in 2009 to 35 kg/h in 2011.
Insufficient catches were sampled to provide information about the size of fish.
Diver observations Divers reported that good fishing conditions and high stock levels had been maintained at both Babel Island and Cape Barren Island. This was not expected to continue indefinitely because they said that the current level of catch was unsustainably high for such a small section of coast. However, divers would continue to fish here until catch rates fell to relatively low levels because the abalone were of good quality, the area was relatively sheltered and it was closer to port than the islands in northern Bass Strait.
Few divers fished the central north coast and those that did so found that the fishing was slow. There were substantial patches of reef containing high density populations of abalone too small to be taken under the current size limit. Areas that produced abalone in recent years had not recovered.
There was comparatively little fishing done in the more remote Bass Strait Islands. Divers who fished there said that stock levels were satisfactory.
Qualitative assessment High levels of catch continued to be taken from the east and south east of the Furneaux Group, from Blocks 33 and 38. Catch rates have been reduced by approximately 25% through stock depletion but remained at acceptable levels for divers. The area requires careful management least stocks be reduced below that required to maintain recruitment. Stocks here are regarded as of moderate abundance and in danger of rapid depletion should they be intensively fished. Elsewhere, on the Central North Coast stock levels were assessed low, although there remain high density populations of very small abalone in places. In the Hogan and Curtis Groups, stock levels were assessed moderate and stable.
Greenlip fishery
The greenlip fishery takes place in the regions of the North West, King Island, North East, Furneaux Group and the Central North Coast between Smithton and Bridport. The catch is comparatively small, contributing approximately 5% to Tasmania’s total

Abalone Fishery Assessment: 2011
Page 22
abalone catch. The fishery tends to be specialised, and in 2011, just five divers caught almost 50% of the TAC.
The following issues make fishery derived performance measures (catch, catch rate) less reliable when used to assess greenlip stocks:
• The greenlip TAC is relatively small, and each region’s catch is capped, effectively masking changes in distribution of catch that might indicate changed stock levels in one or more regions.
• Current knowledge of a region’s stocks can greatly increase an individual's catch rates. Increases in catch rate can occur when individual divers fish exclusively in a region gaining local knowledge and expertise, and then catch increasingly larger proportions of the available regional cap. Conversely catch rate declines may be caused regardless of changes in stock size by increased numbers of visitors to a region.
• Where divers catch both greenlip and blacklip in a single fishing trip, effort may be reported in two ways. Some divers estimate the proportion of time taken to catch each species, while others report the total amount of fishing time twice, once for each species. Reliability of the first method depends upon the divers’ ability to accurately gauge how much time was devoted to catching each species. The second method is likely to be more accurate, but catch rates will be lower (for both species). The effect of the second method is noticeable in CPUE distributions from these regions where up to 20% of catches were reported with catch rates of less than 25 kg/h. It is also noticeable in a CPUE time series, where varying proportions of the usage of both methods masks the abundance signal. In 2009, DPIPWE wrote to all divers requesting that they report effort for each species as a proportion of the trip’s total effort.
• The differences in price between different sized abalone are often sufficient for some divers to selectively fish for large greenlip (e.g. > 160 mm), which means that they catch less abalone per day than if they were fishing the stock from its 145-mm legal minimum size. The size of the stock for such large abalone is much smaller compared with the stock at the legal size limit, and divers' catch rates are reduced accordingly.
Fishery-dependent data The annual catch was distributed approximately as per regional caps: King Island (28 t), the North West (21 t) and North East (24 t), and the Furneaux Group (44 t). The Perkins Bay catch was 21 t, all of which was taken from Black Reef. Of the 10 t available in the new fishing region between Circular Head and Bridport, only 1.6 t was taken.
Interpretation of catch-rate trends is subject to the limitations outlined above. On King Island, catch rates have been stable between 53-62 kg/h since 2002 and were 61 kg/h in 2011. During this 10-year period, in the North West catch rates have fluctuated over a much greater range (49-75 kg/h) and in 2011 were 62 kg/h. In the North East there has been similarly high variation (41-66 kg/h) and catch rates reached 66 kg/h in 2011. At the Furneaux Group catch rates were 60 kg/h in 2011, compared with a 10-year range between 53-68 kg/h. In Perkins Bay, where a recent 13-mm size-limit reduction greatly increased stock size, catch rates have been steadily increasing, reaching 135 kg/h in 2011.

Abalone Fishery Assessment: 2011
Page 23
Diver observations In the North East, divers repeated previous years’ comments that the smaller legal-sized abalone appeared to be at a fast-growing stage and that if the size limit was increased, the abalone would rapidly reach the larger size, quality would be improved, market demand for larger abalone would be met and the population size would be increased. They said that stocks were in reasonable condition.
At Perkins Bay, divers said that stock levels remained high. There was little interest in the new fishing area between Circular Head and Bridport. In both regions the abalone were smaller than elsewhere and less suitable for live market sales.
At the Furneaux Group and King Island reports were mixed. Some divers reported poor catches and low catch rates in areas where they had regularly fished, while others found much better fishing. There were no reports of widespread depletion from either area.
Qualitative assessment Because of the inadequacy of the existing fishery-derived performance measures as indices of abundance, assessment of the greenlip fishery is less certain. With this proviso, stocks in the Furneaux Group, King Island, the North West west of Perkins Bay and the North East were assessed moderate and stable in terms of post-zoning levels of abundance. Stock levels in Perkins Bay were assessed high. We were unable to assess stock levels on the Central North Coast.
Recreational fishery
The recreational fishing season takes place between 1 November and 31 October the following year, when licenses expire. Most licenses are issued prior to Christmas, coinciding either with the opening of the rock lobster season in November or with the holiday period over Christmas.
The most recent catch survey of recreational abalone fishing was undertaken for the 2010/2011 season (Lyle and Tracey, 2012). It found that notwithstanding a 30% increase in issued licenses between the recreational fishing seasons 2002-2003 to 2010-2011 (Figure 7), active participation in recreational abalone fishing has fallen by approximately 25%, from a peak of 5,853 to 4,349 divers.
The survey estimated 60,943 abalone (approximately 29 t) were taken by the recreational fishery, i.e. approximately 1% of the of the total Tasmanian abalone catch. This is a 25% catch reduction since the previous (2008/2009) survey, and is less than 50% of the peak catch reported in 2002-2003.
Approximately 50% of the recreational catch was taken in the east and south-east between Southport and Eddystone Point, i.e. the area covered by Blocks 14 to 30. As a proportion of total catch (recreational plus commercial), recreational catch was highest in the area covered by Blocks 28 to 30 (Friendly Beaches to Eddystone Point). Here the recreational catch was 11.5% of the total regional catch, but this was not because the recreational catch was large, but because the commercial catch was unusually low. In the south-east covered by Blocks 14-22, the recreational catch was 4.9% of the total catch.
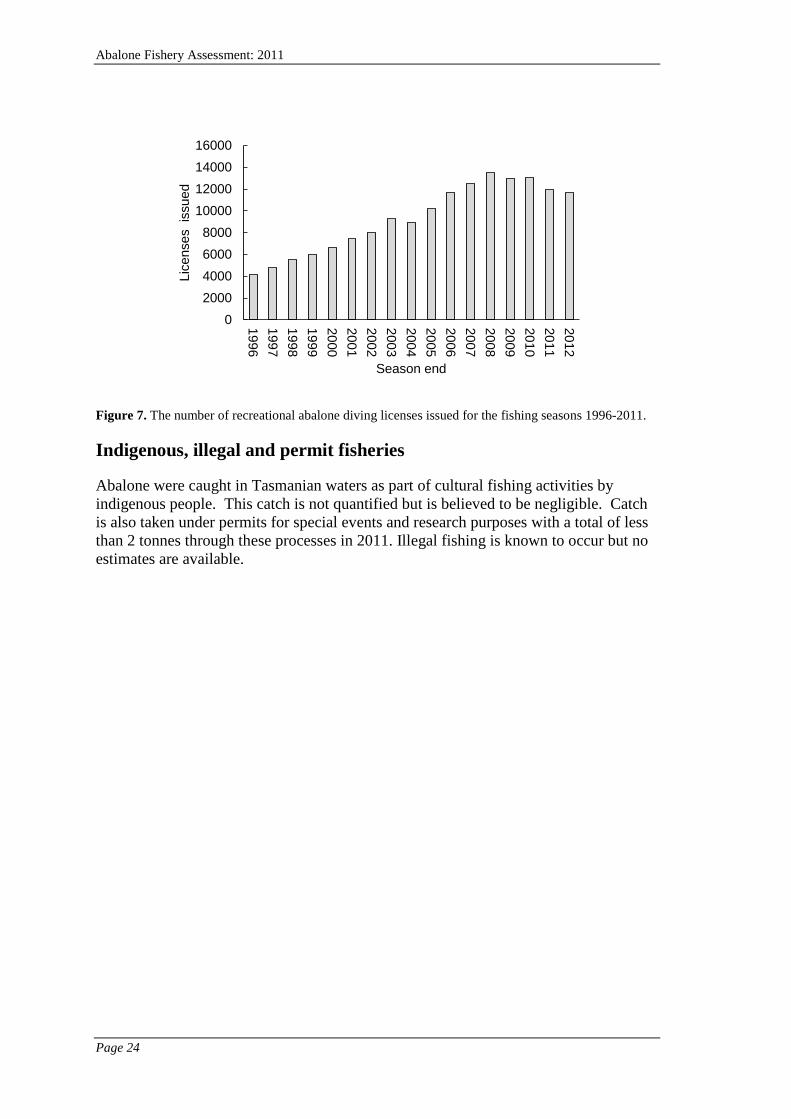
Abalone Fishery Assessment: 2011
Page 24
Figure 7. The number of recreational abalone diving licenses issued for the fishing seasons 1996-2011.
Indigenous, illegal and permit fisheries
Abalone were caught in Tasmanian waters as part of cultural fishing activities by indigenous people. This catch is not quantified but is believed to be negligible. Catch is also taken under permits for special events and research purposes with a total of less than 2 tonnes through these processes in 2011. Illegal fishing is known to occur but no estimates are available.
02000400060008000
10000120001400016000
19961997199819992000200120022003200420052006200720082009201020112012
Lice
nses
iss
ued
Season end

Abalone Fishery Assessment: 2011
Page 25
Appendix 1: Catch, catch-rates and size-composition
Eastern Zone blacklip fishery Distribution of catch between the four main regions of the fishery:
Eastern Zone - Actaeons, Lower Channel (Sub-blocks 13C, 13D, 13E, 14A, 14B)
Regional view:
CPUE distribution:
Regional catch and catch rates by month
13C, 13D, 13E, area cap 341 t in 2011, 359 t caught:
0
50
100
150
200
250
300
350
400
Actaeons Bruny Island East Coast Storm Bay
Ann
ual c
atch
(ton
nes)
2009
2010
2011
0
20
40
60
80
100
050
100150200250300350400
2002
2003
2004
2005
2006
2007
2008
2009
2010
2011
Cpu
e (k
g/hr
)
Cat
ch (t
onne
s)
05
101520253035404550
<25
25-5
0
50-7
5
75-1
00
100-
125
125-
150
150-
175
175-
200
>200
%
Cpue category (kg/hr)
2002
2004
2006
2008
2010
2011
0
20
40
60
80
100
010203040506070
Jan
Feb
Mar Apr
May Jun
Jul
Aug
Sep Oct
Nov
Dec
Cpu
e (k
g/hr
)
Cat
ch (t
onne
s)
2011 - by month
0
20
40
60
80
100
050
100150200250300350400
2002
2003
2004
2005
2006
2007
2008
2009
2010
2011
Cpu
e (k
g/hr
)
Cat
ch (t
onne
s)
CPUE (kg/h) Catch (tonnes)

Abalone Fishery Assessment: 2011
Page 26
Sub-block 13C Fishers Point to Whale Head
Sub-block 13D Fishers Point to Southport Lagoon Beach, including Recherche Bay
Sub-block 13E Actaeon and Sterile Islands, and reefs to the south (the Breaks)
14A, 14B, area cap 10 t in 2011, 12 t caught.
Sub-block 14A Southport Lagoon Beach to Burnett Point
Sub-block 14B Burnett Point to Blubber Head
020406080100120
01020304050607080
2002
2003
2004
2005
2006
2007
2008
2009
2010
2011
Cpu
e (k
g/hr
)
Cat
ch (t
onne
s)
0
20
40
60
80
100
010203040506070
2002
2003
2004
2005
2006
2007
2008
2009
2010
2011
Cpu
e (k
g/hr
)
Cat
ch (t
onne
s)
0
20
40
60
80
100
050
100150200250300350
2002
2003
2004
2005
2006
2007
2008
2009
2010
2011
Cpu
e (k
g/hr
)
Cat
ch (t
onne
s)
01020304050607080
05
10152025303540
2002
2003
2004
2005
2006
2007
2008
2009
2010
2011
Cpu
e (k
g/hr
)
Cat
ch (t
onne
s)
01020304050607080
0
5
10
15
20
2002
2003
2004
2005
2006
2007
2008
2009
2010
2011
Cpu
e (k
g/hr
)
Cat
ch (t
onne
s)
010203040506070
0
5
10
15
20
25
2002
2003
2004
2005
2006
2007
2008
2009
2010
2011
Cpu
e (k
g/hr
)
Cat
ch (t
onne
s)

Abalone Fishery Assessment: 2011
Page 27
Actaeons, Lower Channel (Sub-blocks 13C, 13D, 13E, 14A, 14B) Median length of catch Sub-block 13C Whale Head to Fishers Point
Sub-block 13E Actaeon and Sterile Islands, and reefs to the south (the Breaks)
Sub-block 14A Southport Lagoon Beach to Burnett Point
Eastern Zone – Bruny Island (Blocks 14C, 14D, 14E, 15, 16).
Regional view, area cap 40 t in 2011, 40 t caught.
CPUE distribution:
0
5
10
15
20
25
30
35
130
135
140
145
150
155
160
165
170
1998
1999
2000
2001
2002
2003
2004
2005
2006
2007
2008
2009
2010
2011
% C
atch
es m
easu
red
Med
ian
leng
th (
mm
)
Year
% Catches measured Median (25%-75%)
0
5
10
15
20
25
30
35
130
135
140
145
150
155
160
165
170
1998
1999
2000
2001
2002
2003
2004
2005
2006
2007
2008
2009
2010
2011
% C
atch
es m
easu
red
Med
ian
leng
th (
mm
)
Year
% Catches measured Median (25%-75%)
0
5
10
15
20
25
30
35
40
45
130
135
140
145
150
155
160
165
170
1999
2000
2001
2002
2003
2004
2005
2006
2007
2008
2009
2010
2011
% C
atch
es m
easu
red
Med
ian
leng
th (
mm
)
Year
% Catches measured Median (25%-75%)
0
20
40
60
80
100
020406080
100120140160
2002
2003
2004
2005
2006
2007
2008
2009
2010
2011
Cpu
e (k
g/hr
)
Cat
ch (t
onne
s)
05
101520253035404550
<25
25-5
0
50-7
5
75-1
00
100-
125
125-
150
150-
175
175-
200
>200
%
Cpue category (kg/hr)
2002
2004
2006
2008
2010
2011
CPUE (kg/h) Catch (tonnes)

Abalone Fishery Assessment: 2011
Page 28
Regional catch and catch rates by month
Sub-block 14C Mays Creek to Hopwood Light (Lower Channel) – significant catch reporting errors in 2009.
Sub-block 14D Hopwood Point to West Cloudy Head - significant catch reporting errors in 2009.
Sub-block 14E West Cloudy Head to Boreel Head, including the Friars
Block 15 D’Entrecasteaux Channel, Huon Estuary- significant catch reporting errors in 2009.
Sub-block 16A Boreel Head to North Mangana Bluff
Sub-block 16B North Mangana Bluff to Neck Beach
Sub-block 16C Neck Beach to Trumpeter Bay
010203040506070
02468
101214
Jan
Feb
Mar Apr
May Jun
Jul
Aug
Sep Oct
Nov
Dec
Cpu
e (k
g/hr
)
Cat
ch (t
onne
s)
2011 - by month
020406080100120
02468
101214
2002
2003
2004
2005
2006
2007
2008
2009
2010
2011
Cpu
e (k
g/hr
)
Cat
ch (t
onne
s)
0
20
40
60
80
100
0
5
10
15
20
25
2002
2003
2004
2005
2006
2007
2008
2009
2010
2011
Cpu
e (k
g/hr
)
Cat
ch (t
onne
s)
0
20
40
60
80
100
0102030405060
2002
2003
2004
2005
2006
2007
2008
2009
2010
2011
Cpu
e (k
g/hr
)
Cat
ch (t
onne
s)
020406080100120
0
2
4
6
8
10
2002
2003
2004
2005
2006
2007
2008
2009
2010
2011
Cpu
e (k
g/hr
)
Cat
ch (t
onne
s)
020406080100120
05
1015202530
2002
2003
2004
2005
2006
2007
2008
2009
2010
2011
Cpu
e (k
g/hr
)
Cat
ch (t
onne
s)
0
20
40
60
80
100
05
1015202530
2002
2003
2004
2005
2006
2007
2008
2009
2010
2011
Cpu
e (k
g/hr
)
Cat
ch (t
onne
s)
0
20
40
60
80
100
02468
10121416
2002
2003
2004
2005
2006
2007
2008
2009
2010
2011
Cpu
e (k
g/hr
)
Cat
ch (t
onne
s)
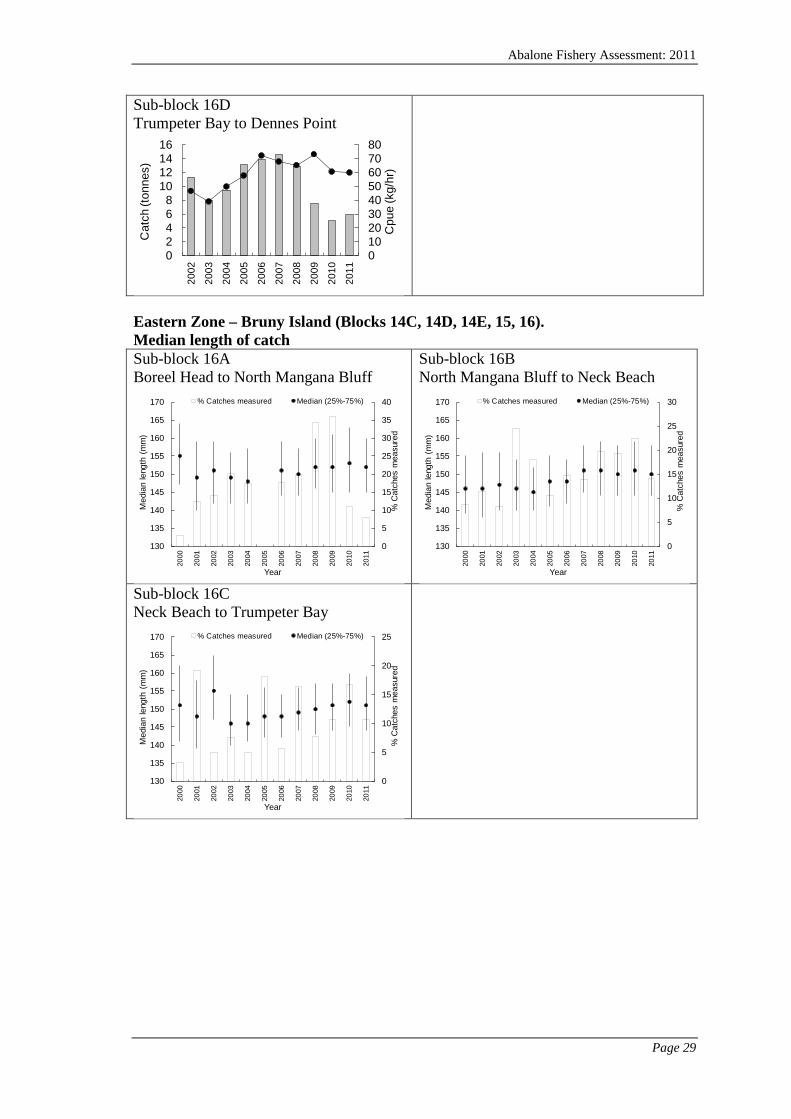
Abalone Fishery Assessment: 2011
Page 29
Sub-block 16D Trumpeter Bay to Dennes Point
Eastern Zone – Bruny Island (Blocks 14C, 14D, 14E, 15, 16). Median length of catch Sub-block 16A Boreel Head to North Mangana Bluff
Sub-block 16B North Mangana Bluff to Neck Beach
Sub-block 16C Neck Beach to Trumpeter Bay
01020304050607080
02468
10121416
2002
2003
2004
2005
2006
2007
2008
2009
2010
2011
Cpu
e (k
g/hr
)
Cat
ch (t
onne
s)
0
5
10
15
20
25
30
35
40
130
135
140
145
150
155
160
165
170
2000
2001
2002
2003
2004
2005
2006
2007
2008
2009
2010
2011
% C
atch
es m
easu
red
Med
ian
leng
th (
mm
)
Year
% Catches measured Median (25%-75%)
0
5
10
15
20
25
30
130
135
140
145
150
155
160
165
170
2000
2001
2002
2003
2004
2005
2006
2007
2008
2009
2010
2011
% C
atch
es m
easu
red
Med
ian
leng
th (
mm
)
Year
% Catches measured Median (25%-75%)
0
5
10
15
20
25
130
135
140
145
150
155
160
165
170
2000
2001
2002
2003
2004
2005
2006
2007
2008
2009
2010
2011
% C
atch
es m
easu
red
Med
ian
leng
th (
mm
)
Year
% Catches measured Median (25%-75%)

Abalone Fishery Assessment: 2011
Page 30
Eastern Zone - Storm Bay (Blocks 17-21)
Regional view, area cap 80 t in 2011, 86.5 t caught
CPUE distribution:
Regional catch and catch rates by month
Sub-block 17B Blackjack shoreline from Lobster Point to Outer North Head
Sub-block 20A Outer North Head to White Beach
Sub-block 20B White Beach to Salters Point
Sub-block 20C Salters Point to Cape Raoul
Sub-block 21A Cape Raoul to Port Arthur
0
20
40
60
80
100
0
50
100
150
200
250
2002
2003
2004
2005
2006
2007
2008
2009
2010
2011
Cpu
e (k
g/hr
)
Cat
ch (t
onne
s)
05
101520253035404550
<25
25-5
0
50-7
5
75-1
00
100-
125
125-
150
150-
175
175-
200
>200
%
Cpue category (kg/hr)
2002
2004
2006
2008
2010
2011
010203040506070
0
5
10
15
20
Jan
Feb
Mar Apr
May Jun
Jul
Aug
Sep Oct
Nov
Dec
Cpu
e (k
g/hr
)
Cat
ch (t
onne
s)
2011 - by month
020406080100120
0
5
10
15
20
2520
02
2003
2004
2005
2006
2007
2008
2009
2010
2011
Cpu
e (k
g/hr
)
Cat
ch (t
onne
s)
0
20
40
60
80
100
05
10152025303540
2002
2003
2004
2005
2006
2007
2008
2009
2010
2011
Cpu
e (k
g/hr
)
Cat
ch (t
onne
s)
0
20
40
60
80
100
010203040506070
2002
2003
2004
2005
2006
2007
2008
2009
2010
2011
Cpu
e (k
g/hr
)
Cat
ch (t
onne
s)
0
20
40
60
80
100
05
1015202530
2002
2003
2004
2005
2006
2007
2008
2009
2010
2011
Cpu
e (k
g/hr
)
Cat
ch (t
onne
s)
020406080100120
05
1015202530
2002
2003
2004
2005
2006
2007
2008
2009
2010
2011
Cpu
e (k
g/hr
)
Cat
ch (t
onne
s)
CPUE (kg/h) Catch (tonnes)

Abalone Fishery Assessment: 2011
Page 31
Sub-block 21C Port Arthur to Cape Pillar
Eastern Zone - Storm Bay (Blocks 17-21) Median length of catch Sub-block 17B Blackjack shore from Slopen Main to Outer North Head
Sub-block 20A Outer North Head to White Beach
Sub-block 20B White Beach to Salters Point
Sub-block 21A Cape Raoul to Port Arthur
020406080100120
0
10
20
30
40
50
2002
2003
2004
2005
2006
2007
2008
2009
2010
2011
Cpu
e (k
g/hr
)
Cat
ch (t
onne
s)
0
5
10
15
20
25
30
35
40
45
130
135
140
145
150
155
160
165
170
2001
2002
2003
2004
2005
2006
2007
2008
2009
2010
2011
% C
atch
es m
easu
red
Med
ian
leng
th (
mm
)
Year
% Catches measured Median (25%-75%)
0
2
4
6
8
10
12
14
16
18
130
135
140
145
150
155
160
165
170
2000
2001
2002
2003
2004
2005
2006
2007
2008
2009
2010
2011
% C
atch
es m
easu
red
Med
ian
leng
th (
mm
)
Year
% Catches measured Median (25%-75%)
0
5
10
15
20
25
30
35
130
135
140
145
150
155
160
165
170
2000
2001
2002
2003
2004
2005
2006
2007
2008
2009
2010
2011
% C
atch
es m
easu
red
Med
ian
leng
th (
mm
)
Year
% Catches measured Median (25%-75%)
0
5
10
15
20
25
30
35
130
135
140
145
150
155
160
165
170
1999
2000
2001
2002
2003
2004
2005
2006
2007
2008
2009
2010
2011
% C
atch
es m
easu
red
Med
ian
leng
th (
mm
)
Year
% Catches measured Median (25%-75%)

Abalone Fishery Assessment: 2011
Page 32
Sub-block 21C Port Arthur to Cape Pillar
Eastern Zone – East Coast (Blocks 22-31)
Regional view:
CPUE distribution
Regional catch and catch rates by month
Block 22, area capped at 40 t in 2011, 54 t caught
0
5
10
15
20
25
30
130
135
140
145
150
155
160
165
17020
00
2001
2002
2003
2004
2005
2006
2007
2008
2009
2010
2011
% C
atch
es m
easu
red
Med
ian
leng
th (
mm
)
Year
% Catches measured Median (25%-75%)
0
20
40
60
80
100
050
100150200250300350
2002
2003
2004
2005
2006
2007
2008
2009
2010
2011
Cpu
e (k
g/hr
)
Cat
ch (t
onne
s)
0
10
20
30
40
50
60
<25
25-5
0
50-7
5
75-1
00
100-
125
125-
150
150-
175
175-
200
>200
%
Cpue category (kg/hr)
2002
2004
2006
2008
2010
2011
010203040506070
0
5
10
15
20
Jan
Feb
Mar Apr
May Jun
Jul
Aug
Sep Oct
Nov
Dec
Cpu
e (k
g/hr
)
Cat
ch (t
onne
s)
2011 - by month
0
20
40
60
80
100
0
20
40
60
80
100
2002
2003
2004
2005
2006
2007
2008
2009
2010
2011
Cpu
e (k
g/hr
)
Cat
ch (t
onne
s)
CPUE (kg/h) Catch (tonnes)

Abalone Fishery Assessment: 2011
Page 33
Sub-block 22A Cape Pillar to the Lanterns
Sub-block 22B The Lanterns to Eaglehawk Neck
Sub-block 22C Eaglehawk Neck to Deep Glen Bay
Forestier Peninsula, Maria Island (Blocks 23, 24), area cap 50 t, 54 t caught
Regional catch and catch rates by month
Sub-block 23A Deep Glen Bay to Lagoon Bay
Sub-block 23B Lagoon Bay to Marion Bay
0
20
40
60
80
100
05
10152025303540
2002
2003
2004
2005
2006
2007
2008
2009
2010
2011
Cpu
e (k
g/hr
)
Cat
ch (t
onne
s)
0
20
40
60
80
100
0
10
20
30
40
50
2002
2003
2004
2005
2006
2007
2008
2009
2010
2011
Cpu
e (k
g/hr
)
Cat
ch (t
onne
s)
01020304050607080
02468
101214
2002
2003
2004
2005
2006
2007
2008
2009
2010
2011
Cpu
e (k
g/hr
)
Cat
ch (t
onne
s)
0
20
40
60
80
100
020406080
100120
2002
2003
2004
2005
2006
2007
2008
2009
2010
2011
Cpu
e (k
g/hr
)
Cat
ch (t
onne
s)
010203040506070
0
5
10
15
20
25
Jan
Feb
Mar Apr
May Jun
Jul
Aug
Sep Oct
Nov
Dec
Cpu
e (k
g/hr
)
Cat
ch (t
onne
s)
2011 - by month
0
20
40
60
80
100
0
5
10
15
20
2002
2003
2004
2005
2006
2007
2008
2009
2010
2011
Cpu
e (k
g/hr
)
Cat
ch (t
onne
s)
01020304050607080
02468
1012
2002
2003
2004
2005
2006
2007
2008
2009
2010
2011
Cpu
e (k
g/hr
)
Cat
ch (t
onne
s)

Abalone Fishery Assessment: 2011
Page 34
Sub-block 24A Marion Bay to Rheban
Sub-block 24B Eastern shore of Mercury Passage
Sub-block 24C Rheban to Cape Bougainville
Sub-block 24D north-east side of Maria Island
Sub-block 24E south-east side of Maria Island
Freycinet-Bicheno (Blocks 25, 26, 27, 28, 29A), area cap 40 t in 2011, 48 t caught
Regional catch and catch rates by month
0
20
40
60
80
100
01234567
2002
2003
2004
2005
2006
2007
2008
2009
2010
2011
Cpu
e (k
g/hr
)
Cat
ch (t
onne
s)
0
20
40
60
80
100
02468
10121416
2002
2003
2004
2005
2006
2007
2008
2009
2010
2011
Cpu
e (k
g/hr
)
Cat
ch (t
onne
s)
020406080100120
0
1
2
3
4
5
2002
2003
2004
2005
2006
2007
2008
2009
2010
2011
Cpu
e (k
g/hr
)
Cat
ch (t
onne
s)
020406080100120
0
10
20
30
40
50
2002
2003
2004
2005
2006
2007
2008
2009
2010
2011
Cpu
e (k
g/hr
)
Cat
ch (t
onne
s)
0
20
40
60
80
100
05
101520253035
2002
2003
2004
2005
2006
2007
2008
2009
2010
2011
Cpu
e (k
g/hr
)
Cat
ch (t
onne
s)
0
20
40
60
80
100
0
20
40
60
80
100
2002
2003
2004
2005
2006
2007
2008
2009
2010
2011
Cpu
e (k
g/hr
)
Cat
ch (t
onne
s)
010203040506070
02468
1012
Jan
Feb
Mar Apr
May Jun
Jul
Aug
Sep Oct
Nov
Dec
Cpu
e (k
g/hr
)
Cat
ch (t
onne
s)
2011 - by month

Abalone Fishery Assessment: 2011
Page 35
Sub-block 27A south side of Schouten Island
Sub-block 27B east side of Schouten Island
Sub-block 27C Schouten Passage to Wineglass Bay
Sub-block 27D Wineglass Bay to the Friendly Beaches
Block 28 Friendly Beaches to Long Point
Sub-block 29A Long Point to Templestowe Beach
Sub-block 29B, 29C, 29D, 30A,31A Templestowe Beach to Musselroe, 120 t cap in 2011, 56t caught
Sub-block 31A (also includes old E zone part of 31B), Eddystone Point to Musselroe
0
20
40
60
80
100
02468
1012
2002
2003
2004
2005
2006
2007
2008
2009
2010
2011
Cpu
e (k
g/hr
)
Cat
ch (t
onne
s)
0
20
40
60
80
100
02468
1012
2002
2003
2004
2005
2006
2007
2008
2009
2010
2011
Cpu
e (k
g/hr
)
Cat
ch (t
onne
s)
020406080100120
05
1015202530
2002
2003
2004
2005
2006
2007
2008
2009
2010
2011
Cpu
e (k
g/hr
)
Cat
ch (t
onne
s)
0
20
40
60
80
100
05
1015202530
2002
2003
2004
2005
2006
2007
2008
2009
2010
2011
Cpu
e (k
g/hr
)
Cat
ch (t
onne
s)
01020304050607080
02468
101214
2002
2003
2004
2005
2006
2007
2008
2009
2010
2011
Cpu
e (k
g/hr
)
Cat
ch (t
onne
s)
0
20
40
60
80
100
05
101520253035
2002
2003
2004
2005
2006
2007
2008
2009
2010
2011
Cpu
e (k
g/hr
)
Cat
ch (t
onne
s)
020406080100120
0
20
40
60
80
100
2002
2003
2004
2005
2006
2007
2008
2009
2010
2011
Cpu
e (k
g/hr
)
Cat
ch (t
onne
s)
020406080100120140
01020304050607080
2002
2003
2004
2005
2006
2007
2008
2009
2010
2011
Cpu
e (k
g/hr
)
Cat
ch (t
onne
s)

Abalone Fishery Assessment: 2011
Page 36
Sub-block 31A – monthly catch rates
Eastern Zone – East Coast (Blocks 22-31) Median length of catch Sub-block 22A Cape Pillar to the Lanterns
Sub-block 22B The Lanterns to Eaglehawk Neck
Sub-block 23A Deep Glen Bay to Lagoon Bay
Sub-block 24D north-east side of Maria Island
Sub-block 24E south-east side of Maria Island
Sub-block 27A south side of Schouten Island
020406080100120140160
02468
1012
Jan
Feb
Mar Apr
May Jun
Jul
Aug
Sep Oct
Nov
Dec
Cpu
e (k
g/hr
)
Cat
ch (t
onne
s)2011 - by month
0
5
10
15
20
25
30
135
140
145
150
155
160
165
1999
2000
2001
2002
2003
2004
2005
2006
2007
2008
2009
2010
2011
% C
atch
es m
easu
red
Med
ian
leng
th (
mm
)
Year
% Catches measured Median (25%-75%)
0
5
10
15
20
25
30
35
135
140
145
150
155
160
165
1999
2000
2001
2002
2003
2004
2005
2006
2007
2008
2009
2010
2011
% C
atch
es m
easu
red
Med
ian
leng
th (
mm
)
Year
% Catches measured Median (25%-75%)
05101520253035404550
135
140
145
150
155
160
165
1999
2000
2001
2002
2003
2004
2005
2006
2007
2008
2009
2010
2011
% C
atch
es m
easu
red
Med
ian
leng
th (
mm
)
Year
% Catches measured Median (25%-75%)
0
5
10
15
20
25
30
135
140
145
150
155
160
165
1999
2000
2001
2002
2003
2004
2005
2006
2007
2008
2009
2010
2011
% C
atch
es m
easu
red
Med
ian
leng
th (
mm
)
Year
% Catches measured Median (25%-75%)
0
5
10
15
20
25
135
140
145
150
155
160
165
2000
2001
2002
2003
2004
2005
2006
2007
2008
2009
2010
2011
% C
atch
es m
easu
red
Med
ian
leng
th (
mm
)
Year
% Catches measured Median (25%-75%)
0
10
20
30
40
50
60
135
140
145
150
155
160
165
2000
2001
2002
2003
2004
2005
2006
2007
2008
2009
2010
2011
% C
atch
es m
easu
red
Med
ian
leng
th (
mm
)
Year
% Catches measured Median (25%-75%)

Abalone Fishery Assessment: 2011
Page 37
Sub-block 27C Schouten Passage to Wineglass Bay
Sub-block 27D Wineglass Bay to Friendly Beaches
Sub-block 31A Eddystone Point to Musselroe
0
5
10
15
20
25
30
35
40
135
140
145
150
155
160
165
2000
2001
2002
2003
2004
2005
2006
2007
2008
2009
2010
2011
% C
atch
es m
easu
red
Med
ian
leng
th (
mm
)
Year
% Catches measured Median (25%-75%)
0
2
4
6
8
10
12
14
16
18
135
140
145
150
155
160
165
1999
2000
2001
2002
2003
2004
2005
2006
2007
2008
2009
2010
2011
% C
atch
es m
easu
red
Med
ian
leng
th (
mm
)
Year
% Catches measured Median (25%-75%)
0
2
4
6
8
10
12
14
16
135
140
145
150
155
160
165
2000
2001
2002
2003
2004
2005
2006
2007
2008
2009
2010
2011
% C
atch
es m
easu
red
Med
ian
leng
th (
mm
)
Year
% Catches measured Median (25%-75%)
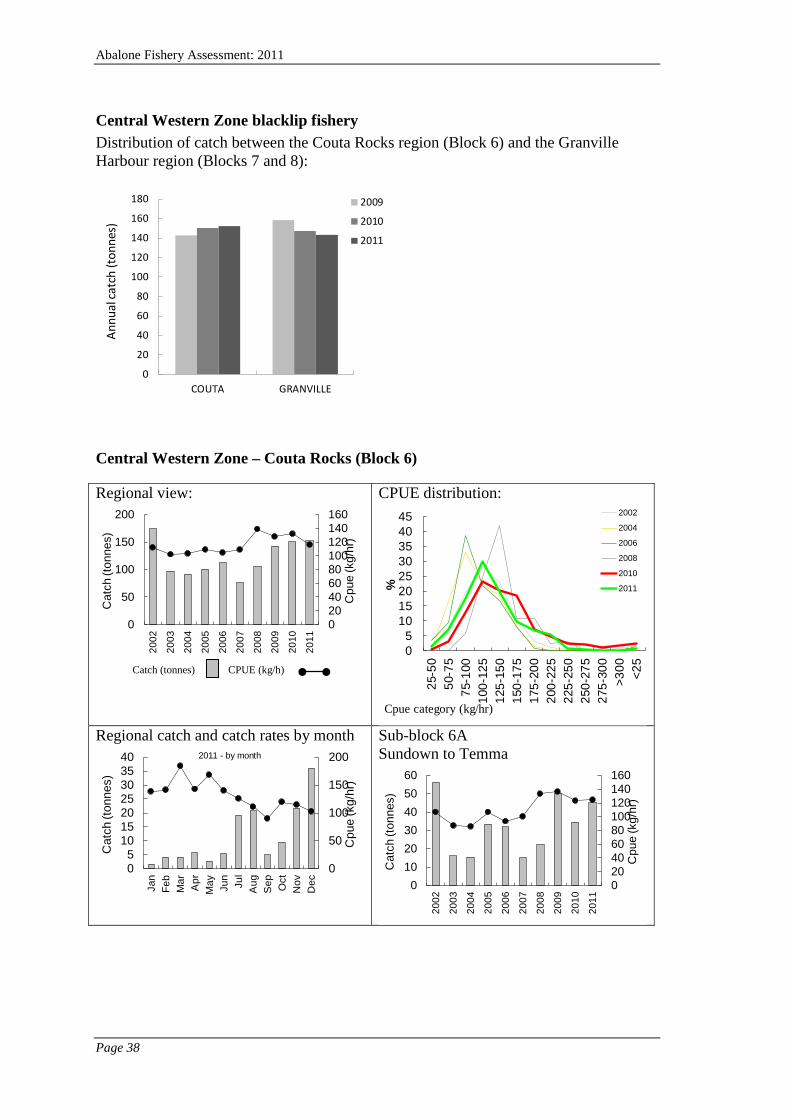
Abalone Fishery Assessment: 2011
Page 38
Central Western Zone blacklip fishery Distribution of catch between the Couta Rocks region (Block 6) and the Granville Harbour region (Blocks 7 and 8):
Central Western Zone – Couta Rocks (Block 6)
Regional view:
CPUE distribution:
Regional catch and catch rates by month
Sub-block 6A Sundown to Temma
0
20
40
60
80
100
120
140
160
180
COUTA GRANVILLE
Annu
al ca
tch
(tonn
es)
2009
2010
2011
020406080100120140160
0
50
100
150
200
2002
2003
2004
2005
2006
2007
2008
2009
2010
2011
Cpu
e (k
g/hr
)
Cat
ch (t
onne
s)
05
1015202530354045
25-5
050
-75
75-1
0010
0-12
512
5-15
015
0-17
517
5-20
020
0-22
522
5-25
025
0-27
527
5-30
0>3
00 <25
%
Cpue category (kg/hr)
2002
2004
2006
2008
2010
2011
0
50
100
150
200
05
10152025303540
Jan
Feb
Mar Apr
May Jun
Jul
Aug
Sep Oct
Nov
Dec
Cpu
e (k
g/hr
)
Cat
ch (t
onne
s)
2011 - by month
020406080100120140160
0102030405060
2002
2003
2004
2005
2006
2007
2008
2009
2010
2011
Cpu
e (k
g/hr
)
Cat
ch (t
onne
s)
CPUE (kg/h) Catch (tonnes)

Abalone Fishery Assessment: 2011
Page 39
Sub-block 6B Temma to north of Dawson River
Sub-block 6C Dawson River to Wild Wave River
Sub-block 6D - capped area see below Wild Wave River to Italian River, including Sandy Cape
Central Western Zone – Couta Rocks (Block 6) Median length of catch
Sub-block 6A Sundown to Temma
Sub-block 6B Temma Harbour to north of Dawson River
020406080100120140160
0102030405060
2002
2003
2004
2005
2006
2007
2008
2009
2010
2011
Cpu
e (k
g/hr
)
Cat
ch (t
onne
s)
0
50
100
150
200
01020304050607080
2002
2003
2004
2005
2006
2007
2008
2009
2010
2011
Cpu
e (k
g/hr
)
Cat
ch (t
onne
s)
020406080100120140160
0102030405060
2002
2003
2004
2005
2006
2007
2008
2009
2010
2011
Cpu
e (k
g/hr
)
Cat
ch (t
onne
s)
0
5
10
15
20
25
30
120
125
130
135
140
145
150
155
160
2001
2002
2003
2004
2005
2006
2007
2008
2009
2010
2011
% C
atch
es m
easu
red
Med
ian
leng
th (
mm
)
Year
% Catches measured Median (25%-75%)
0
5
10
15
20
25
30
35
120
125
130
135
140
145
150
155
160
2001
2002
2003
2004
2005
2006
2007
2008
2009
2010
2011
% C
atch
es m
easu
red
Med
ian
leng
th (
mm
)
Year
% Catches measured Median (25%-75%)

Abalone Fishery Assessment: 2011
Page 40
Sub-block 6C Dawson River to Wild Wave River
Sub-block 6D Wild Wave River to Italian River, including Sandy Cape
Central Western Zone – Granville Harbour (Blocks 7 and 8) Blocks 7 and 8
CPUE distribution:
Regional catch and catch rates by month
Sub-block 6D, Blocks 7 and 8, cap set at 160 t in 2011, 160 t caught
Sub-block 7A Italian River to Pieman River
Sub-block 7B Pieman to Ahrberg Bay
0
5
10
15
20
25
120
125
130
135
140
145
150
155
16020
01
2002
2003
2004
2005
2006
2007
2008
2009
2010
2011
% C
atch
es m
easu
red
Med
ian
leng
th (
mm
)
Year
% Catches measured Median (25%-75%)
02468101214161820
130
135
140
145
150
155
160
165
170
2000
2001
2002
2003
2004
2005
2006
2007
2008
2009
2010
2011
% C
atch
es m
easu
red
Med
ian
leng
th (
mm
)
Year
% Catches measured Median (25%-75%)
0
50
100
150
200
0
50
100
150
200
2002
2003
2004
2005
2006
2007
2008
2009
2010
2011
Cpu
e (k
g/hr
)
Cat
ch (t
onne
s)
05
101520253035
25-5
050
-75
75-1
0010
0-12
512
5-15
015
0-17
517
5-20
020
0-22
522
5-25
025
0-27
527
5-30
0>3
00 <25
%
Cpue category (kg/hr)
2002
2004
2006
2008
2010
2011
0
50
100
150
200
0102030405060
Jan
Feb
Mar Apr
May Jun
Jul
Aug
Sep Oct
Nov
Dec
Cpu
e (k
g/hr
)
Cat
ch (t
onne
s)
2011 - by month
0
50
100
150
200
0
50
100
150
200
250
2002
2003
2004
2005
2006
2007
2008
2009
2010
2011
Cpu
e (k
g/hr
)
Cat
ch (t
onne
s)
0
50
100
150
200
250
05
1015202530
2002
2003
2004
2005
2006
2007
2008
2009
2010
2011
Cpu
e (k
g/hr
)
Cat
ch (t
onne
s)
0
50
100
150
200
0
20
40
60
80
100
2002
2003
2004
2005
2006
2007
2008
2009
2010
2011
Cpu
e (k
g/hr
)
Cat
ch (t
onne
s)
CPUE (kg/hr) Catch (tonnes)

Abalone Fishery Assessment: 2011
Page 41
Sub-block 7C Ahrberg Bay to Granville Harbour
Sub-block 8A Granville Harbour to Tasman Bay
Sub-block 8B Tasman Bay to Henty River
Central Western Zone – Granville Harbour (Blocks 7 and 8) Median length of catch Sub-block 7B Pieman River to Ahrberg Bay
Sub-block 7A Italian River to Pieman River low sampling rates in 2001, 2002, 2009
Sub-block 7C Ahrberg Bay to Granville Harbour Note low sampling rates in 2005, 2010
0
50
100
150
200
05
10152025303540
2002
2003
2004
2005
2006
2007
2008
2009
2010
2011
Cpu
e (k
g/hr
)
Cat
ch (t
onne
s)
0
50
100
150
200
05
1015202530
2002
2003
2004
2005
2006
2007
2008
2009
2010
2011
Cpu
e (k
g/hr
)
Cat
ch (t
onne
s)
0
50
100
150
200
250
05
1015202530
2002
2003
2004
2005
2006
2007
2008
2009
2010
2011
Cpu
e (k
g/hr
)
Cat
ch (t
onne
s)
051015202530354045
130
135
140
145
150
155
160
165
170
2000
2001
2002
2003
2004
2005
2006
2007
2008
2009
2010
2011
% C
atch
es m
easu
red
Med
ian
leng
th (
mm
)
Year
% Catches measured Median (25%-75%)
0
5
10
15
20
25
30
35
40
130
135
140
145
150
155
160
165
170
2000
2001
2002
2003
2004
2005
2006
2007
2008
2009
2010
2011
% C
atch
es m
easu
red
Med
ian
leng
th (
mm
)
Year
% Catches measured Median (25%-75%)
051015202530354045
130
135
140
145
150
155
160
165
170
1998
1999
2000
2001
2002
2003
2004
2005
2006
2007
2008
2009
2010
2011
% C
atch
es m
easu
red
Med
ian
leng
th (
mm
)
Year
% Catches measured Median (25%-75%)
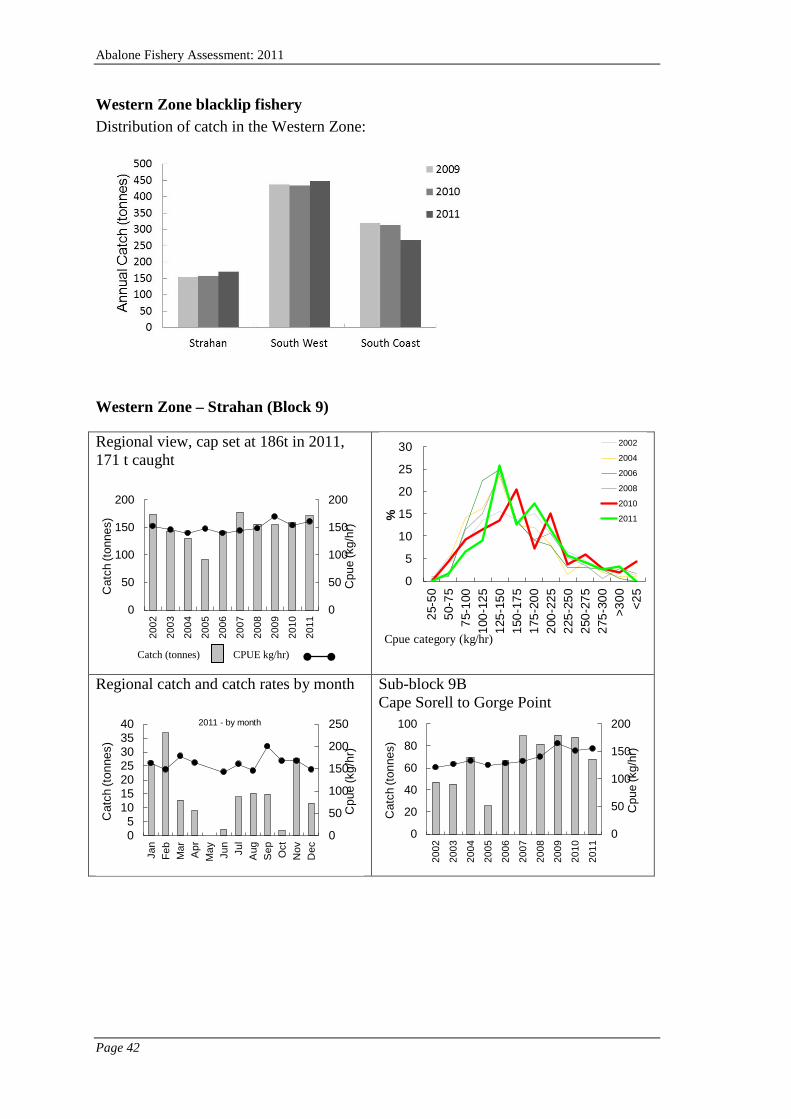
Abalone Fishery Assessment: 2011
Page 42
Western Zone blacklip fishery Distribution of catch in the Western Zone:
Western Zone – Strahan (Block 9)
Regional view, cap set at 186t in 2011, 171 t caught
Regional catch and catch rates by month
Sub-block 9B Cape Sorell to Gorge Point
0
50
100
150
200
0
50
100
150
200
2002
2003
2004
2005
2006
2007
2008
2009
2010
2011
Cpu
e (k
g/hr
)
Cat
ch (t
onne
s)
0
5
10
15
20
25
3025
-50
50-7
575
-100
100-
125
125-
150
150-
175
175-
200
200-
225
225-
250
250-
275
275-
300
>300 <2
5
%
Cpue category (kg/hr)
2002
2004
2006
2008
2010
2011
0
50
100
150
200
250
05
10152025303540
Jan
Feb
Mar Apr
May Jun
Jul
Aug
Sep Oct
Nov
Dec
Cpu
e (k
g/hr
)
Cat
ch (t
onne
s)
2011 - by month
0
50
100
150
200
0
20
40
60
80
100
2002
2003
2004
2005
2006
2007
2008
2009
2010
2011
Cpu
e (k
g/hr
)
Cat
ch (t
onne
s)
CPUE kg/hr) Catch (tonnes)
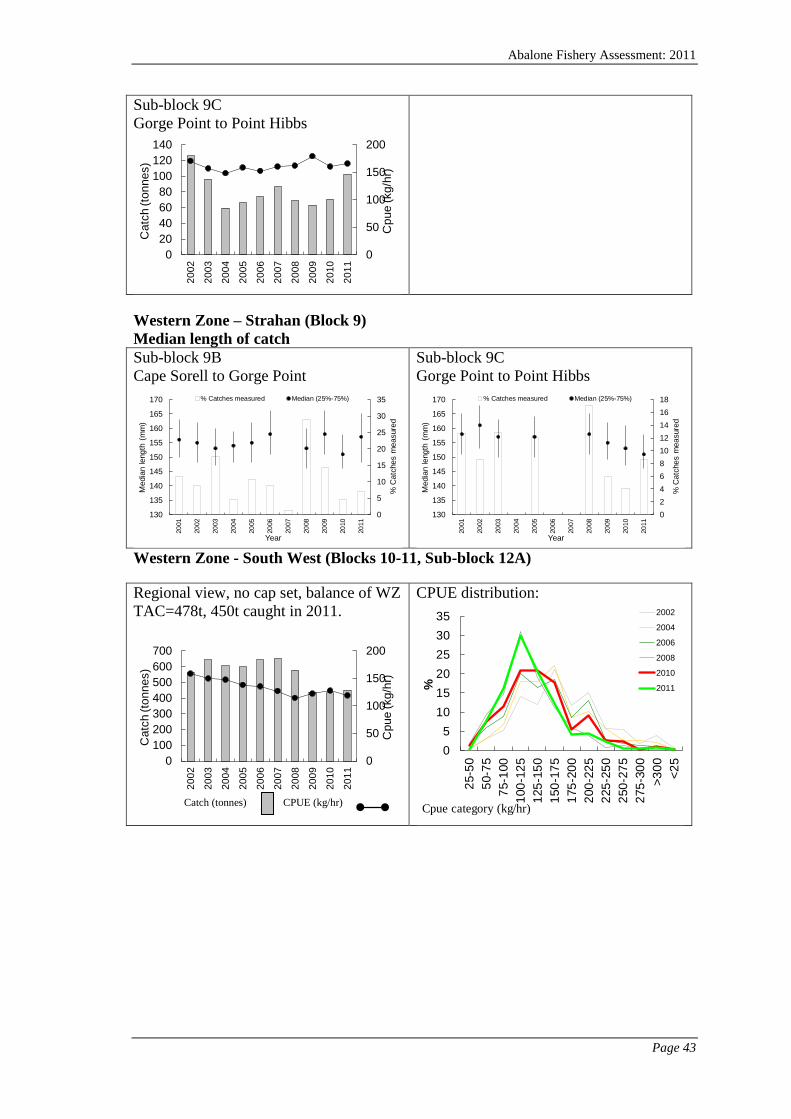
Abalone Fishery Assessment: 2011
Page 43
Sub-block 9C Gorge Point to Point Hibbs
Western Zone – Strahan (Block 9) Median length of catch Sub-block 9B Cape Sorell to Gorge Point
Sub-block 9C Gorge Point to Point Hibbs
Western Zone - South West (Blocks 10-11, Sub-block 12A)
Regional view, no cap set, balance of WZ TAC=478t, 450t caught in 2011.
CPUE distribution:
0
50
100
150
200
020406080
100120140
2002
2003
2004
2005
2006
2007
2008
2009
2010
2011
Cpu
e (k
g/hr
)
Cat
ch (t
onne
s)
0
5
10
15
20
25
30
35
130
135
140
145
150
155
160
165
170
2001
2002
2003
2004
2005
2006
2007
2008
2009
2010
2011
% C
atch
es m
easu
red
Med
ian
leng
th (
mm
)
Year
% Catches measured Median (25%-75%)
024681012141618
130
135
140
145
150
155
160
165
170
2001
2002
2003
2004
2005
2006
2007
2008
2009
2010
2011
% C
atch
es m
easu
red
Med
ian
leng
th (
mm
)
Year
% Catches measured Median (25%-75%)
0
50
100
150
200
0100200300400500600700
2002
2003
2004
2005
2006
2007
2008
2009
2010
2011
Cpu
e (k
g/hr
)
Cat
ch (t
onne
s)
05
101520253035
25-5
050
-75
75-1
0010
0-12
512
5-15
015
0-17
517
5-20
020
0-22
522
5-25
025
0-27
527
5-30
0>3
00 <25
%
Cpue category (kg/hr)
2002
2004
2006
2008
2010
2011
CPUE (kg/hr) Catch (tonnes)

Abalone Fishery Assessment: 2011
Page 44
Regional catch and catch rates by month
Sub-block 10A Point Hibbs to Endeavour Bay
Sub-block 10B Endeavour Bay to High Rocky Point
Sub-block 10C High Rocky Point to Mainwaring River
Sub-block 10D Mainwaring River to Low Rocky Point
Sub-block 11A Low Rocky Point to Elliott Point
Sub-block 11B Elliott Point to Svenor Gulches
Sub-block 11C Svenor Gulches to Point St Vincent
0
50
100
150
200
0
20
40
60
80
100Ja
nFe
bM
ar Apr
May Jun
Jul
Aug
Sep Oct
Nov
Dec
Cpu
e (k
g/hr
)
Cat
ch (t
onne
s)
2011 - by month
0
50
100
150
200
010203040506070
2002
2003
2004
2005
2006
2007
2008
2009
2010
2011
Cpu
e (k
g/hr
)
Cat
ch (t
onne
s)
0
50
100
150
200
05
1015202530
2002
2003
2004
2005
2006
2007
2008
2009
2010
2011
Cpu
e (k
g/hr
)
Cat
ch (t
onne
s)
0
50
100
150
200
01020304050607080
2002
2003
2004
2005
2006
2007
2008
2009
2010
2011
Cpu
e (k
g/hr
)
Cat
ch (t
onne
s)
0
50
100
150
200
020406080
100120140160
2002
2003
2004
2005
2006
2007
2008
2009
2010
2011
Cpu
e (k
g/hr
)
Cat
ch (t
onne
s)
0
50
100
150
200
0
50
100
150
200
2002
2003
2004
2005
2006
2007
2008
2009
2010
2011
Cpu
e (k
g/hr
)
Cat
ch (t
onne
s)
0
50
100
150
200
020406080
100120
2002
2003
2004
2005
2006
2007
2008
2009
2010
2011
Cpu
e (k
g/hr
)
Cat
ch (t
onne
s)
0
50
100
150
200
020406080
100120140160
2002
2003
2004
2005
2006
2007
2008
2009
2010
2011
Cpu
e (k
g/hr
)
Cat
ch (t
onne
s)

Abalone Fishery Assessment: 2011
Page 45
Sub-block 11D Hilliard Head to Faults Bay
Sub-block 11E Point St Vincent to Hilliard Head, including Port Davey
Sub-block 12A Faults Bay to South West Cape
Western Zone - South West (Blocks 10-11, Sub-block 12A) Median length of catch Block 10 (aggregated) Point Hibbs to Low Rocky Point Note sampling rate below 4% prior to 2008
Block 11 (aggregated) Low Rocky Point to Faults Bay Note sampling rate below 4% prior to 2008
020406080100120140160
0
10
20
30
40
50
2002
2003
2004
2005
2006
2007
2008
2009
2010
2011
Cpu
e (k
g/hr
)
Cat
ch (t
onne
s)
0
50
100
150
200
0
10
20
30
40
50
2002
2003
2004
2005
2006
2007
2008
2009
2010
2011
Cpu
e (k
g/hr
)
Cat
ch (t
onne
s)
020406080100120140160
0
20
40
60
80
100
2002
2003
2004
2005
2006
2007
2008
2009
2010
2011
Cpu
e (k
g/hr
)
Cat
ch (t
onne
s)
0
2
4
6
8
10
12
14
16
140
145
150
155
160
165
170
175
180
2000
2001
2002
2003
2004
2005
2006
2007
2008
2009
2010
2011
% C
atch
es m
easu
red
Med
ian
leng
th (
mm
)
Year
% Catches measured Median (25%-75%)
0
2
4
6
8
10
12
14
140
145
150
155
160
165
170
175
180
2000
2001
2002
2003
2004
2005
2006
2007
2008
2009
2010
2011
% C
atch
es m
easu
red
Med
ian
leng
th (
mm
)
Year
% Catches measured Median (25%-75%)

Abalone Fishery Assessment: 2011
Page 46
Western Zone - South Coast (Sub-blocks 12B, 12C, 12D, 13A, 13B) Region view, cap set at 260 t in 2011, 268 t caught
CPUE distribution:
Regional catch and catch rates by month
Sub-block 12B South West Cape to Cox‘s Bluff
Sub-block 12C Maatsuyker Group
Sub-block 12D Cox’s Bluff to Prion Beach
Sub-block 13A Prion Beach to South Cape
Sub-block 13B South Cape to Whale Head
020406080100120
050
100150200250300350
2002
2003
2004
2005
2006
2007
2008
2009
2010
2011
Cpu
e (k
g/hr
)
Cat
ch (t
onne
s)
05
101520253035
25-5
050
-75
75-1
0010
0-12
512
5-15
015
0-17
517
5-20
020
0-22
522
5-25
025
0-27
527
5-30
0>3
00 <25
%
Cpue category (kg/hr)
2002
2004
2006
2008
2010
2011
020406080100120140
0
10
20
30
40
50
Jan
Feb
Mar Apr
May Jun
Jul
Aug
Sep Oct
Nov
Dec
Cpu
e (k
g/hr
)
Cat
ch (t
onne
s)
2011 - by month
020406080100120
0
20
40
60
80
100
2002
2003
2004
2005
2006
2007
2008
2009
2010
2011
Cpu
e (k
g/hr
)
Cat
ch (t
onne
s)
020406080100120140
010203040506070
2002
2003
2004
2005
2006
2007
2008
2009
2010
2011
Cpu
e (k
g/hr
)
Cat
ch (t
onne
s)
020406080100120
020406080
100120140160
2002
2003
2004
2005
2006
2007
2008
2009
2010
2011
Cpu
e (k
g/hr
)
Cat
ch (t
onne
s)
020406080100120
0
10
20
30
40
50
2002
2003
2004
2005
2006
2007
2008
2009
2010
2011
Cpu
e (k
g/hr
)
Cat
ch (t
onne
s)
0
20
40
60
80
100
0102030405060
2002
2003
2004
2005
2006
2007
2008
2009
2010
2011
Cpu
e (k
g/hr
)
Cat
ch (t
onne
s)
CPUE (kg/hr) Catch (tonnes)
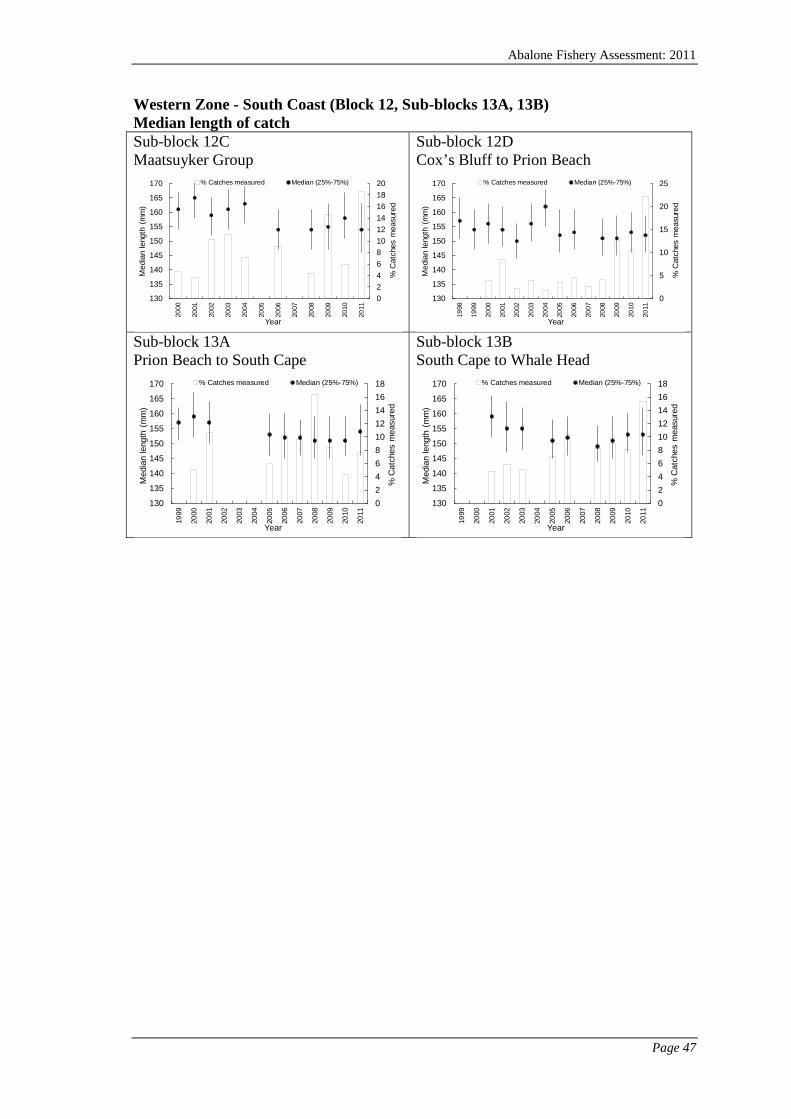
Abalone Fishery Assessment: 2011
Page 47
Western Zone - South Coast (Block 12, Sub-blocks 13A, 13B) Median length of catch Sub-block 12C Maatsuyker Group
Sub-block 12D Cox’s Bluff to Prion Beach
Sub-block 13A Prion Beach to South Cape
Sub-block 13B South Cape to Whale Head
02468101214161820
130
135
140
145
150
155
160
165
17020
00
2001
2002
2003
2004
2005
2006
2007
2008
2009
2010
2011
% C
atch
es m
easu
red
Med
ian
leng
th (
mm
)
Year
% Catches measured Median (25%-75%)
0
5
10
15
20
25
130
135
140
145
150
155
160
165
170
1998
1999
2000
2001
2002
2003
2004
2005
2006
2007
2008
2009
2010
2011
% C
atch
es m
easu
red
Med
ian
leng
th (
mm
)
Year
% Catches measured Median (25%-75%)
024681012141618
130
135
140
145
150
155
160
165
170
1999
2000
2001
2002
2003
2004
2005
2006
2007
2008
2009
2010
2011
% C
atch
es m
easu
red
Med
ian
leng
th (
mm
)
Year
% Catches measured Median (25%-75%)
024681012141618
130
135
140
145
150
155
160
165
170
1999
2000
2001
2002
2003
2004
2005
2006
2007
2008
2009
2010
2011
% C
atch
es m
easu
red
Med
ian
leng
th (
mm
)
Year
% Catches measured Median (25%-75%)

Abalone Fishery Assessment: 2011
Page 48
Northern Zone blacklip fishery Until 2010, the southern part of the Furneaux Group blacklip fishery was in the Northern Zone. In 2010, the size limit operating there was reduced from 127mm to 114mm, and this part of the fishery was moved to the Bass Strait Zone.
Most of the Northern Zone catch is taken from the North West, particularly from Block 5, which in 2011 has been capped at 142.5 tonnes. The remainder of the zone was by default, capped at 260 t.
Distribution of catch between Northern Zone regions:
Northern Zone - North West (Blocks 5, 47- 49)
Regional view (Blocks 5, 47-49):
CPUE distribution:
0
50
100
150
200
250
300
King Island North West North East
Annu
al ca
tch
(tonn
es)
2009
2010
2011
020406080100120
050
100150200250300
2002
2003
2004
2005
2006
2007
2008
2009
2010
2011
Cpu
e (k
g/hr
)
Cat
ch (t
onne
s)
05
101520253035
<25
25-5
0
50-7
5
75-1
00
100-
125
125-
150
150-
175
175-
200
>200
%
Cpue category (kg/hr)
2002
2004
2006
2008
2010
2011
CPUE (kg/hr) Catch (tonnes)

Abalone Fishery Assessment: 2011
Page 49
Blocks 47-49, area capped 100 t in 2011, 112 t caught.
Blocks 47-49 catch and catch rates by month
Sub-block 49A Three Hummock Island
Sub-block 49B Northern part of Hunter Island and Albatross Island
Sub-block 49C South-western Hunter Island
Block 5, area capped 142.5 t in 2011, 155 t caught.
Block 5 catch and catch rates by month
Sub-block 5A Woolnorth Point to Studland Bay
020406080100120
020406080
100120
2002
2003
2004
2005
2006
2007
2008
2009
2010
2011
Cpu
e (k
g/hr
)
Cat
ch (t
onne
s)
020406080100120
0
5
10
15
20
25
Jan
Feb
Mar Apr
May Jun
Jul
Aug
Sep Oct
Nov
Dec
Cpu
e (k
g/hr
)
Cat
ch (t
onne
s)
2011 - by month
0
20
40
60
80
100
0
5
10
15
20
25
2002
2003
2004
2005
2006
2007
2008
2009
2010
2011
Cpu
e (k
g/hr
)
Cat
ch (t
onne
s)
0
50
100
150
200
0
10
20
30
40
50
2002
2003
2004
2005
2006
2007
2008
2009
2010
2011
Cpu
e (k
g/hr
)
Cat
ch (t
onne
s)
020406080100120
0
10
20
30
40
50
2002
2003
2004
2005
2006
2007
2008
2009
2010
2011
Cpu
e (k
g/hr
)
Cat
ch (t
onne
s)
020406080100120
0
50
100
150
200
2002
2003
2004
2005
2006
2007
2008
2009
2010
2011
Cpu
e (k
g/hr
)
Cat
ch (t
onne
s)
020406080100120
05
101520253035
Jan
Feb
Mar Apr
May Jun
Jul
Aug
Sep Oct
Nov
Dec
Cpu
e (k
g/hr
)
Cat
ch (t
onne
s)
2011 - by month
020406080100120
01020304050607080
2002
2003
2004
2005
2006
2007
2008
2009
2010
2011
Cpu
e (k
g/hr
)
Cat
ch (t
onne
s)

Abalone Fishery Assessment: 2011
Page 50
Sub-block 5B Studland Bay to Greens Beach, including Mt Cameron West
Sub-block 5C Greens Beach to Arthur River
Northern Zone – North West (Blocks 5, 47- 49) Median length of catch Sub-block 5A Woolnorth Point to Studland Bay
Sub-block 5B Studland Bay to Greens Beach, including Mt Cameron West
Sub-block 5C Greens Beach to Arthur River
020406080100120140
0102030405060
2002
2003
2004
2005
2006
2007
2008
2009
2010
2011
Cpu
e (k
g/hr
)
Cat
ch (t
onne
s)
020406080100120
0
20
40
60
80
100
2002
2003
2004
2005
2006
2007
2008
2009
2010
2011
Cpu
e (k
g/hr
)
Cat
ch (t
onne
s)
0
5
10
15
20
25
120
125
130
135
140
145
150
155
160
2001
2002
2003
2004
2005
2006
2007
2008
2009
2010
2011
% C
atch
es m
easu
red
Med
ian
leng
th (
mm
)
Year
% Catches measured Median (25%-75%)
0
5
10
15
20
25
30
120
125
130
135
140
145
150
155
160
2001
2002
2003
2004
2005
2006
2007
2008
2009
2010
2011
% C
atch
es m
easu
red
Med
ian
leng
th (
mm
)
Year
% Catches measured Median (25%-75%)
0
5
10
15
20
25
30
35
120
125
130
135
140
145
150
155
160
2001
2002
2003
2004
2005
2006
2007
2008
2009
2010
2011
% C
atch
es m
easu
red
Med
ian
leng
th (
mm
)
Year
% Catches measured Median (25%-75%)

Abalone Fishery Assessment: 2011
Page 51
Northern Zone - King Island (Blocks 1-4) Regional view: Area cap 120 t in 2011, 105 t caught.
CPUE distribution:
Regional catch and catch rates by month
Sub-block 1C North-west King Island
Sub-block 3A west King Island
Sub-block 3C South-west King Island
Sub-block 4B South-east King Island
Sub-block 4C South-east King Island
020406080100120140
020406080
100120140
2002
2003
2004
2005
2006
2007
2008
2009
2010
2011
Cpu
e (k
g/hr
)
Cat
ch (t
onne
s)
05
101520253035
<25
25-5
0
50-7
5
75-1
00
100-
125
125-
150
150-
175
175-
200
>200
%
Cpue category (kg/hr)
2002
2004
2006
2008
2010
2011
020406080100120140160
05
1015202530
Jan
Feb
Mar Apr
May Jun
Jul
Aug
Sep Oct
Nov
Dec
Cpu
e (k
g/hr
)
Cat
ch (t
onne
s)
2011 - by month
020406080100120140160
0
5
10
15
20
25
2002
2003
2004
2005
2006
2007
2008
2009
2010
2011
Cpu
e (k
g/hr
)
Cat
ch (t
onne
s)
020406080100120140
01020304050607080
2002
2003
2004
2005
2006
2007
2008
2009
2010
2011
Cpu
e (k
g/hr
)
Cat
ch (t
onne
s)
020406080100120140160
0
10
20
30
40
50
2002
2003
2004
2005
2006
2007
2008
2009
2010
2011
Cpu
e (k
g/hr
)
Cat
ch (t
onne
s)
020406080100120
02468
1012
2002
2003
2004
2005
2006
2007
2008
2009
2010
2011
Cpu
e (k
g/hr
)
Cat
ch (t
onne
s)
020406080100120140
0
5
10
15
20
2002
2003
2004
2005
2006
2007
2008
2009
2010
2011
Cpu
e (k
g/hr
)
Cat
ch (t
onne
s)
CPUE (kg/hr) Catch (tonnes)

Abalone Fishery Assessment: 2011
Page 52
Northern Zone - North East (Sub-block 31B, Blocks 39, 40) Regional view: Area cap 30 t in 2011, 29 t caught.
CPUE distribution:
Sub-block 31B Cape Naturaliste to Little Musselroe Bay
Sub-block 39A Little Musselroe Bay to Petal Point
01020304050607080
010203040506070
2002
2003
2004
2005
2006
2007
2008
2009
2010
2011
Cpu
e (k
g/hr
)
Cat
ch (t
onne
s)
0
10
20
30
40
50
60
<25
25-5
0
50-7
5
75-1
00
100-
125
125-
150
150-
175
175-
200
>200
%
Cpue category (kg/hr)
2002
2004
2006
2008
2010
2011
0
20
40
60
80
100
0102030405060
2002
2003
2004
2005
2006
2007
2008
2009
2010
2011
Cpu
e (k
g/hr
)
Cat
ch (t
onne
s)
010203040506070
02468
1012
2002
2003
2004
2005
2006
2007
2008
2009
2010
2011
Cpu
e (k
g/hr
)
Cat
ch (t
onne
s)
CPUE (kg/hr) Catch (tonnes)

Abalone Fishery Assessment: 2011
Page 53
Bass Strait Zone blacklip fishery Distribution of catch between Bass Strait Zone regions:
Bass Strait Zone - Furneaux Group (Blocks 32-38) Furneaux Group: (Blocks 32-38) Region cap 40t in 2011, 44 t caught.
Block 33 South-east Furneaux Group
Block 37
Block 38 East side of Flinders Island, inc Babel Island
05
101520253035404550
Central North Furneaux Group Bass Strait Island
Ann
ual C
atch
(ton
nes)
2009
2010
2011
0
20
40
60
80
100
0
10
20
30
40
50
2002
2003
2004
2005
2006
2007
2008
2009
2010
2011
Cpu
e (k
g/hr
)
Cat
ch (t
onne
s)
0
20
40
60
80
100
0
5
10
15
20
25
2002
2003
2004
2005
2006
2007
2008
2009
2010
2011
Cpu
e (k
g/hr
)
Cat
ch (t
onne
s)
0102030405060
0
5
10
15
20
25
2002
2003
2004
2005
2006
2007
2008
2009
2010
2011
Cpu
e (k
g/hr
)
Cat
ch (t
onne
s)
0
20
40
60
80
100
05
1015202530
2002
2003
2004
2005
2006
2007
2008
2009
2010
2011
Cpu
e (k
g/hr
)
Cat
ch (t
onne
s)

Abalone Fishery Assessment: 2011
Page 54
Central North (Blocks 40-46)
Bass Strait Islands (Blocks 50-56)
Block 53 Hogan Group
0102030405060
05
1015202530
2002
2003
2004
2005
2006
2007
2008
2009
2010
2011
Cpu
e (k
g/hr
)
Cat
ch (t
onne
s)
0
20
40
60
80
100
0102030405060
2002
2003
2004
2005
2006
2007
2008
2009
2010
2011
Cpu
e (k
g/hr
)
Cat
ch (t
onne
s)
020406080100120
0
10
20
30
40
50
2002
2003
2004
2005
2006
2007
2008
2009
2010
2011
Cpu
e (k
g/hr
)
Cat
ch (t
onne
s)

Abalone Fishery Assessment: 2011
Page 55
Greenlip fishery In 2011 a new fishing region with a cap of 10 t was developed on the Central North coast (Blocks 41 to 47) following the reduction of the size limit there in 2010 to 132mm. The 2011 greenlip TAC of 143 t was distributed between six regions:
King Island – 30 t North West – 18 t Perkins Bay- 20 t Central North-10 t North East – 23 t Furneaux Group – 42 t
Annual catches: Year King
Island North West
North East
Furneaux Group
Perkins Bay
Central North
Total
2000 9.6 41.0 38.9 42.5 8.1 0.1 140.1 2001 18.6 28.9 30.4 44.2 17.8 0 139.9 2002 25.0 29.9 31.3 43.3 10.0 139.5 2003 32.6 30.3 35.3 37.6 4.0 0 139.8 2004 31.0 25.3 31.4 36.8 4.0 0.1 128.5 2005 28.8 25.2 19.4 42.4 7.2 0.1 123.0 2006 27.9 22.9 16.2 39.6 16.1 0.4 122.7 2007 25.6 22.8 33.5 31.1 10.5 123.5 2008 20.0 19.1 24.4 34.9 22.1 0.2 120.5 2009 25.3 13.7 35.0 27.3 20.1 1.1 121.4 2010 33.1 22.8 24.6 33.6 19.7 133.7 2011 28.3 21.1 23.7 44.3 21.0 1.6 140.0
Small quantities (<1.0t pa) have been taken in recent years from Blocks 50 to 57.
Greenlip - King Island (Blocks 1-4)
Blocks 1-4:
CPUE distribution:
010203040506070
05
101520253035
2002
2003
2004
2005
2006
2007
2008
2009
2010
2011
Cpu
e (k
g/hr
)
Cat
ch (t
onne
s)
010203040506070
<25
25-5
0
50-7
5
75-1
00
100-
125
125-
150
150-
175
175-
200
>200
%
Cpue category (kg/hr)
2002
2004
2006
2008
2010
2011
CPUE kg/hr) Catch (tonnes)

Abalone Fishery Assessment: 2011
Page 56
Sub-block 1B north-west King Island
Sub-block 2C east King Island
Sub-block 3A west King Island
Greenlip - North West (Blocks 5, 48B, 48C, 49) Regional view:
CPUE distribution:
Sub-block 5A west of Woolnorth Point
Sub-block 48B Petrels
01020304050607080
02468
1012
2002
2003
2004
2005
2006
2007
2008
2009
2010
2011
Cpu
e (k
g/hr
)
Cat
ch (t
onne
s)
010203040506070
02468
1012
2002
2003
2004
2005
2006
2007
2008
2009
2010
2011
Cpu
e (k
g/hr
)
Cat
ch (t
onne
s)
020406080100120
012345678
2002
2003
2004
2005
2006
2007
2008
2009
2010
2011
Cpu
e (k
g/hr
)
Cat
ch (t
onne
s)
0102030405060708090
05
101520253035
2002
2003
2004
2005
2006
2007
2008
2009
2010
2011
Cpu
e (k
g/hr
)
Cat
ch (t
onne
s)
05
10152025303540
<25
25-5
0
50-7
5
75-1
00
100-
125
125-
150
150-
175
175-
200
>200
%
Cpue category (kg/hr)
2002
2004
2006
2008
2010
2011
0102030405060708090100
02468
101214
2002
2003
2004
2005
2006
2007
2008
2009
2010
2011
Cpu
e (k
g/hr
)
Cat
ch (t
onne
s)
0102030405060708090100
0123456789
2002
2003
2004
2005
2006
2007
2008
2009
2010
2011
Cpu
e (k
g/hr
)
Cat
ch (t
onne
s)
CPUE (kg/hr) Catch (tonnes)

Abalone Fishery Assessment: 2011
Page 57
Sub-block 48C Woolnorth to Robbins Island
Sub-block 49C west of Hunter island
Greenlip – Perkins Bay (Sub-block 48A) Sub-block 48A, Black Reef.
CPUE distribution:
Greenlip - North East (Blocks 31, 39, 40) Regional view:
CPUE distribution:
0102030405060708090100
02468
1012
2002
2003
2004
2005
2006
2007
2008
2009
2010
2011
Cpu
e (k
g/hr
)
Cat
ch (t
onne
s)
0102030405060708090
02468
1012
2002
2003
2004
2005
2006
2007
2008
2009
2010
2011
Cpu
e (k
g/hr
)
Cat
ch (t
onne
s)
020406080100120140160
0
5
10
15
20
25
2002
2003
2004
2005
2006
2007
2008
2009
2010
2011
Cpu
e (k
g/hr
)
Cat
ch (t
onne
s)
05
101520253035404550
<25
25-5
0
50-7
5
75-1
00
100-
125
125-
150
150-
175
175-
200
>200
%
Cpue category (kg/hr)
2002
2004
2006
2008
2010
2011
010203040506070
05
10152025303540
2002
2003
2004
2005
2006
2007
2008
2009
2010
2011
Cpu
e (k
g/hr
)
Cat
ch (t
onne
s)
05
101520253035404550
<25
25-5
0
50-7
5
75-1
00
100-
125
125-
150
150-
175
175-
200
>200
%
Cpue category (kg/hr)
2002
2004
2006
2008
2010
2011
CPUE (kg/hr) Catch (tonnes)
CPUE (kg/hr) Catch (tonnes)

Abalone Fishery Assessment: 2011
Page 58
Block 31 Eddystone Point to Little Musselroe, Swan Is.
Block 39 Tomahawk to Little Musselroe
Greenlip – Furneaux Group (Blocks 32-38) Regional view:
CPUE distribution:
Block 32 western side of Clarke Is, Armstrong Passage
Block 33 south east Clarke, Cape Barren Islands
01020304050607080
0
5
10
15
20
25
2002
2003
2004
2005
2006
2007
2008
2009
2010
2011
Cpu
e (k
g/hr
)
Cat
ch (t
onne
s)
010203040506070
0
5
10
15
20
25
2002
2003
2004
2005
2006
2007
2008
2009
2010
2011
Cpu
e (k
g/hr
)
Cat
ch (t
onne
s)
01020304050607080
05
101520253035404550
2002
2003
2004
2005
2006
2007
2008
2009
2010
2011
Cpu
e (k
g/hr
)
Cat
ch (t
onne
s)
010203040506070
<25
25-5
0
50-7
5
75-1
00
100-
125
125-
150
150-
175
175-
200
>200
%
Cpue category (kg/hr)
2002
2004
2006
2008
2010
2011
0102030405060708090
0123456
2002
2003
2004
2005
2006
2007
2008
2009
2010
2011
Cpu
e (k
g/hr
)
Cat
ch (t
onne
s)
0102030405060708090
02468
1012141618
2002
2003
2004
2005
2006
2007
2008
2009
2010
2011
Cpu
e (k
g/hr
)
Cat
ch (t
onne
s)
CPUE (kg/hr) Catch (tonnes)

Abalone Fishery Assessment: 2011
Page 59
Block 35 Franklin Sound
Block 38 north-east Flinders Island
010203040506070
02468
10121416
2002
2003
2004
2005
2006
2007
2008
2009
2010
2011
Cpu
e (k
g/hr
)
Cat
ch (t
onne
s)
01020304050607080
02468
10121416
2002
2003
2004
2005
2006
2007
2008
2009
2010
2011
Cpu
e (k
g/hr
)
Cat
ch (t
onne
s)
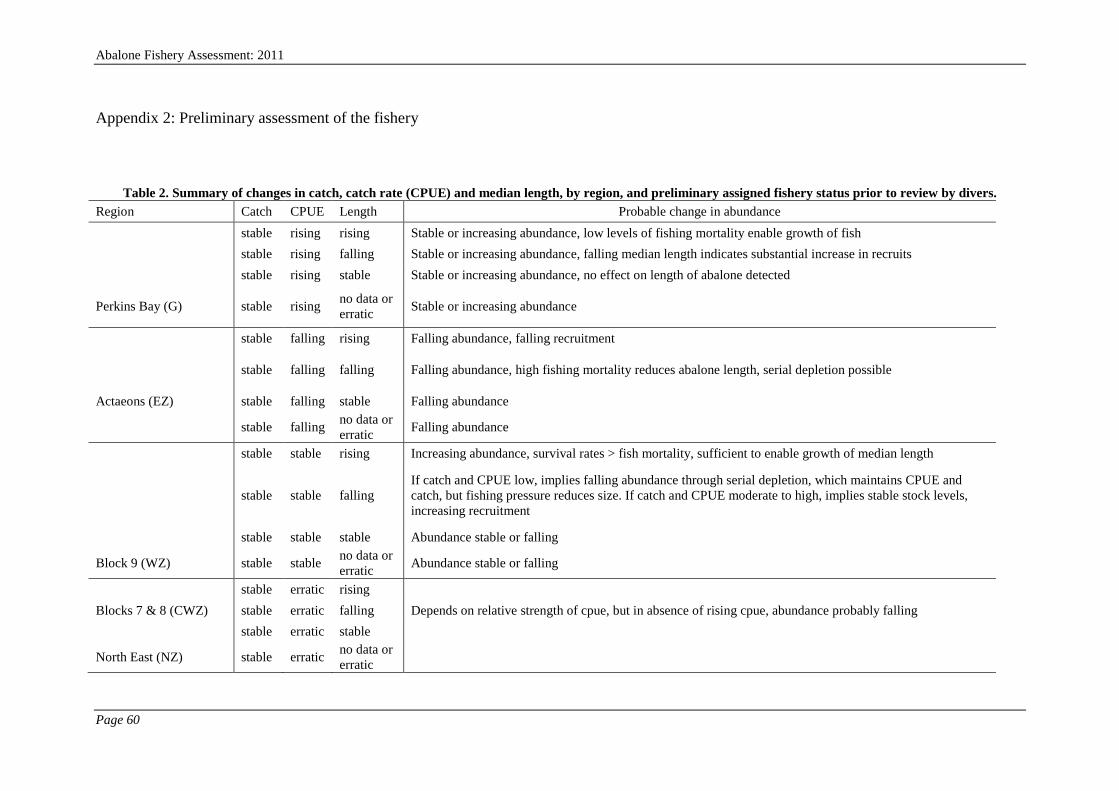
Abalone Fishery Assessment: 2011
Page 60
Appendix 2: Preliminary assessment of the fishery
Table 2. Summary of changes in catch, catch rate (CPUE) and median length, by region, and preliminary assigned fishery status prior to review by divers.
Region Catch CPUE Length Probable change in abundance
stable rising rising Stable or increasing abundance, low levels of fishing mortality enable growth of fish
stable rising falling Stable or increasing abundance, falling median length indicates substantial increase in recruits
stable rising stable Stable or increasing abundance, no effect on length of abalone detected
Perkins Bay (G) stable rising no data or erratic Stable or increasing abundance
stable falling rising Falling abundance, falling recruitment
stable falling falling Falling abundance, high fishing mortality reduces abalone length, serial depletion possible
Actaeons (EZ) stable falling stable Falling abundance
stable falling no data or erratic Falling abundance
stable stable rising Increasing abundance, survival rates > fish mortality, sufficient to enable growth of median length
stable stable falling If catch and CPUE low, implies falling abundance through serial depletion, which maintains CPUE and catch, but fishing pressure reduces size. If catch and CPUE moderate to high, implies stable stock levels, increasing recruitment
stable stable stable Abundance stable or falling
Block 9 (WZ) stable stable no data or erratic Abundance stable or falling
stable erratic rising Blocks 7 & 8 (CWZ) stable erratic falling Depends on relative strength of cpue, but in absence of rising cpue, abundance probably falling
stable erratic stable North East (NZ) stable erratic no data or
erratic

Abalone Fishery Assessment: 2011
Page 61
Region Catch CPUE Length Probable change in abundance
falling rising rising Insufficient exploitation for clear signal, indicates current levels of exploitation insufficient to impact on stocks, which could be at low or high levels
falling rising falling falling rising stable Bass Strait Islands (BSZ) falling rising no data or
erratic
Lower Channel (EZ) falling falling rising Stock levels almost certainly falling, absence of recruits causes median length to rise, indicates weak recruitment
Bruny Island (EZ), Freycinet-Bicheno (EZ) falling falling falling Stock levels almost certainly falling, high fishing mortality reduces median size
falling falling stable Stock levels almost certainly falling Storm Bay (EZ), Central North (BSZ), Block 22 (EZ), Blocks 23 & 24 (EZ), North East inc 31A (EZ)
falling falling no data or erratic Stock levels almost certainly falling
falling stable rising Stock levels almost certainly falling, absence of recruits causes median length to rise, indicates weak recruitment
falling stable falling Stock levels almost certainly falling, high fishing mortality reduces median size
falling stable stable Stock levels almost certainly falling
falling stable no data or erratic Stock levels almost certainly falling
falling erratic rising Stock levels stable or decreasing, less likely to be increasing.
falling erratic falling Stock levels stable or decreasing, less likely to be increasing.
falling erratic stable Stock levels stable or decreasing, less likely to be increasing.
South Coast (WZ) falling erratic no data or erratic Stock levels stable or decreasing, less likely to be increasing.

Abalone Fishery Assessment: 2011
Page 62
Region Catch CPUE Length Probable change in abundance
rising rising rising Increasing abundance, low levels of fishing mortality enable growth of fish
rising rising falling Increasing abundance, falling median length indicates substantial increase in recruits or size limit decrease
rising rising stable Increasing abundance
King Island (NZ) rising rising no data or erratic Increasing abundance
rising falling rising Stock levels falling, reduced recruit levels
rising falling falling Stock levels falling, increasing fishing mortality
rising falling stable Stock levels falling Block 6 (CWZ), NW (NZ), Furneaux Group (BSZ)
rising falling no data or erratic Stock levels falling
rising stable rising Stock levels stable or increasing, less likely to be decreasing
rising stable falling Stock levels stable or increasing, less likely to be decreasing
rising stable stable Stock levels stable or increasing, less likely to be decreasing
rising stable no data or erratic Stock levels stable or increasing, less likely to be decreasing
rising erratic rising No clear signal
rising erratic falling No clear signal
rising erratic stable No clear signal
Furneaux Group (G) rising erratic no data or erratic No clear signal
erratic rising rising No clear signal
erratic rising falling No clear signal
erratic rising stable No clear signal
erratic rising no data or erratic No clear signal
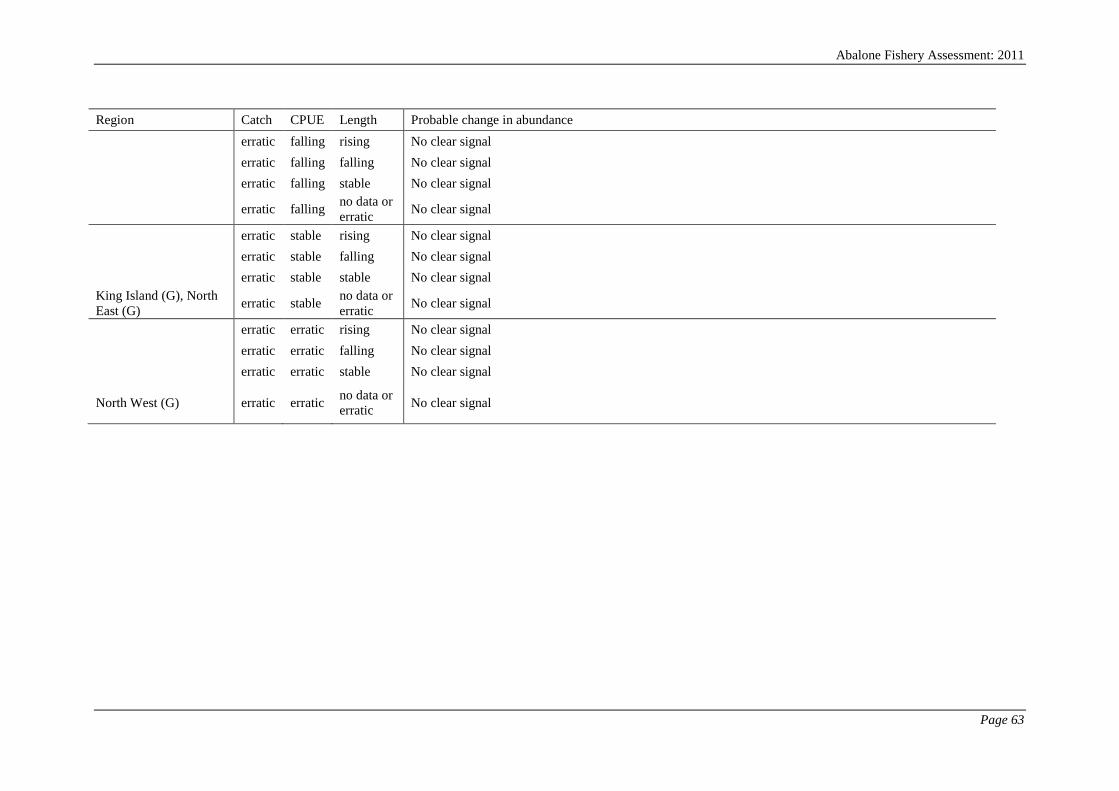
Abalone Fishery Assessment: 2011
Page 63
Region Catch CPUE Length Probable change in abundance
erratic falling rising No clear signal
erratic falling falling No clear signal
erratic falling stable No clear signal
erratic falling no data or erratic No clear signal
erratic stable rising No clear signal
erratic stable falling No clear signal
erratic stable stable No clear signal King Island (G), North East (G) erratic stable no data or
erratic No clear signal
erratic erratic rising No clear signal
erratic erratic falling No clear signal erratic erratic stable No clear signal
North West (G) erratic erratic no data or erratic No clear signal

Abalone Fishery Assessment: 2011
Page 64
Appendix 3: Interpreting graphical information
Catch and catch rate by region, block and sub-block. Catch and catch rate information is shown across a range of geographical scales ranging from large (regional) to small (sub-block) where relevant (i.e. catches consistently larger than 10 t pa, or six or more divers contributed to the catch). Figure 9 shows catch and catch rates for the last eight years for sub-blocks. The vertical columns show catch in tonnes, for the period 2000-2007. The black line with balls shows catch rates (CPUE) over the same period. Greenlip charts show catch as hatched columns, and catch rates as grey balls joined with a grey line.
Figure 8. Annual catch (tonnes) and geometric mean catch rates (kg/hour), 2000 - 2009.
Catch and effort were not reported by sub-block and zone prior to 2000, and consequently are shown only from that year onwards. Additionally, catch rates trends over short periods (compared with longer periods) are more likely to reflect changes in abundance of abalone and not changes in fishing methods, and catch rates earlier than 2000 are not used in this assessment.
Regional catch-rate distribution: The distribution of catch rates provides information about how divers are catching abalone that is not explained by the mean (Figure 10). That the distributions are skewed (not evenly distributed about the category with the highest percentage) implies that fewer divers are achieving high catch rates. Skewness tends to be greatest when abalone abundance is low or has been recently reduced, making high catch rates less common.
Figure 9. The percentage distribution of catch-rates, 2000 - 2009.
0
20
40
60
80
100
0
100
200
300
400
50020
00
2001
2002
2003
2004
2005
2006
2007
2008
2009
Cpu
e (k
g/hr
)
Cat
ch (t
onne
s)
05
101520253035
<25
25-5
050
-75
75-1
0010
0-12
512
5-15
015
0-17
517
5-20
020
0-22
522
5-25
025
0-27
527
5-30
0>3
00
%
Cpue category (kg/hr)
2000
2002
2004
2006
2008
2009

Abalone Fishery Assessment: 2011
Page 65
Size-composition charts. The size-composition of divers’ catches is reviewed at sub-block level (Figure 11). At this spatial scale, there is a greater likelihood that the catches come from populations with similar growth characteristics than at larger scales. We are unable to estimate the percentage of catches sampled prior to 2000 because sub-block reporting was not introduced until then. We are able to attribute some sampled catches to sub-blocks in earlier years, because we know the location from where the catches were taken.
Figure 10. Median length with 25%-75% inter-quartile size range of abalone from commercial catch samples. The vertical columns represent the percentage of catches sampled.
Size-composition charts plot median length (the middle or 50 P
thP percentile length if all
abalone were sorted from smallest to larges t) for the period 1998-2008 (or the period since catches can be attributed to sub-blocks). They also show the size of abalone at the 25 P
thP and 75P
thP percentiles i.e. the size range of the middle 50% of abalone from the
sampled catches.
0
5
10
15
20
25
30
35
135
140
145
150
155
160
165
1999
2000
2001
2002
2003
2004
2005
2006
2007
2008
2009
% C
atch
es m
easu
red
Med
ian
leng
th (m
m)
Year
% Catches measured Median (25%-75%)
Abalone Fishery Assessment: 2011
Page 66
Appendix 4: Interpreting trends in catch and catch rate, and the size composition of the commercial catch
a. The use of catch and catch rates to infer changes in abundance
This assessment is primarily based upon the interpretation of information produced from fishery catch data; both catch distribution and catch rates. It relies upon the assumption that trends in catch-rates reflect changes in abundance of the fishable stock. Despite CPUE being much discredited as an index of abalone abundance (e.g. Breen (1992), Prince (1992), Shepherd et al. (2001)) it has been used with some success for many years in the Tasmanian fishery. There are several factors that adversely affect the relationship between CPUE and abalone abundance: gregarious behaviour of abalone, serial depletion of local populations constituting the stock, and changes in fishing efficiency. If the effects of the above factors are understood and can be minimized then the reliability of CPUE as an index of abundance can be improved.
Gregarious behaviour
Abalone tend to aggregate in favourable habitat (e.g. gutters, sand-edges, shallow margins), and a large proportion of abalone may be found in only a small area of each reef (Prince, 1992). When these aggregations are fished, the remaining abalone tend to form new aggregations (Officer et al., 2000), and thus reefs may become depleted while catch rates are maintained (McShane, 1995; Officer et al., 2000). Similar problems among other commercially fished marine species are well documented (e.g. Hilborn and Walters (1992), Rose and Kulka (1999)).
Where abalone abundance is high and abalone are aggregated, catch rates are primarily a function of handling time (the time taken to detach abalone from the reef and transfer them to the boat). As abalone abundance decreases, and aggregations become smaller and further apart, search time increases, and adds significantly to the overall effort required. This makes the relationship between abalone abundance and CPUE non-linear (hyperstable – CPUE remains high even when stock size reduces), and by the time catch rates start to decline rapidly, abalone abundance will already have been greatly reduced (Prince, 1992).
A related problem occurs when divers search for favourable habitats, and the aggregations within them. Time spent searching for aggregations is only weakly related to the number of individuals landed, and catch rates do not necessarily decline at the same rate as the abundance of aggregations (Breen, 1992). Under these circumstances, catch rates are again unreliable, and extra care is needed when attempting to interpret such information. This problem would also occur if divers were searching for areas containing abalone within a specified size range, or where divers were swimming over larger abalone within an area if selecting a particular size range of abalone.
Where abalone abundance is low, a consequence of aggregating behaviour is that the most favourable habitats can accommodate most of the population and the surrounding areas may be relatively sparsely populated. Provided effort is also low (i.e. diver visitation rates are low), legal-sized abalone move to the favourable habitat (Officer et al., 2000; Shepherd and Partington, 1995) between fishing events. Experienced divers can maintain catch rates by fishing the most favourable areas (Shepherd and Partington, 1995), and the CPUE/abundance relationship is again non-linear and hyperstable.

Abalone Fishery Assessment: 2011
Page 67
Serial depletion
Serial depletion of reefs occurs when divers progressively reduce stock abundance on individual reefs, and maintain stable catch rates by moving between reefs (Prince and Shepherd, 1992). Reefs are abandoned when divers find it harder to maintain levels of daily catch, and effort is focused on reefs with higher stock levels. When there are many reefs with low levels of abundance in a reporting block, divers can move between reefs, depleting stock levels in each, while producing stable but relatively low levels of annual catch at acceptable catch rates.
If management units are large and catch reporting occurs over large spatial scales, falling catch rates caused by depletion of individual reefs are masked when divers transfer effort to reefs with higher levels of abundance. If catch reporting occurred at the scale of individual reefs, the fall in CPUE that precipitated the divers’ movements and the fall in catch indicative of depletion would be detected. In Tasmania, the sub-block scale of reporting (Appendix 11) is too large to detect such fine scale declines in CPUE.
Regular patterns observed in the spatial distribution of catch from Tasmania’s East Coast appear to indicate that provided effort is low enough, stock levels on the reefs first depleted may recover sufficiently to support further fishing, thus developing a cycle of depletion and recovery. Analysis of catch data from a range of reporting blocks has revealed historically low levels of annual catch. Such low catch levels may appear stable in the short term, but have been seen to fall slowly over a period of years, presumably as reefs become less productive (i.e. the period between fishing and recovery is greater than the period between fishing events). Examples include Blocks 25, 26, 28, 29 and 30. Catch rates under this scenario typically appear stable, or with improvements in diver efficiency, may even rise slowly.
Change in fishing efficiency
The detection and avoidance of difficulties associated with improvement in fishing efficiency, or effort creep is a continuing problem when catch rates are used as an index of stock biomass or abundance when assessing fisheries. Catch rates (CPUE) and the stock biomass are assumed to be related: CPUE = qB, where q is the catchability coefficient and B is the exploitable biomass. If q increases through time in an unknown manner, through diving operations becoming more efficient, then the relationship between CPUE and biomass becomes altered to an unknown degree and the interpretation of CPUE as a measure of biomass becomes biased high.
One of the features of commercial fisheries is that fishermen almost always find ways to make their operations more efficient, and the abalone fishery has been no exception. Thus, because of improved efficiency, if stock levels are unchanged, more abalone can be collected per unit time now than in the past i.e. catchability increases. This leads to a rise in reported catch rates without an associated increase in abalone abundance, or alternatively, it can lead to catch rates appearing to be stable while the stock abundance is, in fact, declining. Two broad categories of causes of change in fishing efficiency have been identified in the Tasmanian abalone fishery – technological and behavioural.
Technological causes of change in fishing efficiency are usually easy to detect. For example, early in the history of the Tasmanian abalone fishery, divers anchored their
Abalone Fishery Assessment: 2011
Page 68
boats, and often worked without a deckhand. Later, during the 1970’s, the boats carried a deckhand who drove the boat and followed the diver, thus eliminating time spent swimming the catch from the reef to the anchored boat. It was estimated that the catching efficiency of divers doubled between the start of the fishery in the 1960’s and 1982 (Harrison, 1983).
Possibly the greatest single improvement occurred during the late 1980’s when divers widely adopted the practise of attaching their collecting nets to ropes lowered to them by their deckhands (droplines) and they no longer had to surface to the boat every time they filled their nets. This increased efficiency because: (a) time spent ascending to the boat, unloading the catch and descending back to the reef was eliminated, (b) the diver maintained his position on the productive part of the reef, (c) catch bags could be reduced in size, which meant that divers could swim more easily and with less effort.
However, the increase in efficiency caused by droplines is not constant across all abalone densities. At low levels of abundance, divers may finish swimming over a reef before their net is full, so the method offers little improvement. At the other extreme, when nets are being filled every few minutes because abalone are particularly abundant, the method offers great savings in time i.e. the method causes catch rates to change non-linearly with abundance.
More recent technological changes to fishing operations include the increased use of GPS navigation systems, Nitrox breathing gases and diver propulsion vehicles (DPV). The extent of the usage of GPS navigators and associated plotting equipment by abalone divers is unknown, but it apparently has become much more widespread over the last five years. Nitrox gas mixing plants are currently used by only a few divers, but these divers are responsible for landing a large proportion of the catch in the regions where they work. DPVs are also not yet in common usage, but help divers move more quickly between concentrations of abalone, particularly in deeper water.
Changes in fishing efficiency due to behavioural causes, while not as obvious as technological causes, may have a profound effect upon catch rates. Competition between divers for abalone or quota, or inducements offered by processors, or management changes, may all improve, or at least alter, the way divers work (Gorfine, 2001). Divers, either individually or as a group may learn to fish an area more effectively (Breen, 1992). Daily catches may increase when divers realise they are catching at a high rate, leading to a correlation between high catch rates and larger catches (Worthington et al., 1998). These types of changes are more difficult to detect and account for than changes in fishing methods.
In Tasmania, the practise of team diving (where two divers share a boat and catch abalone on the same quota unit) was legitimised in 2005. Team diving potentially has the effect of reducing diver efficiency, but increasing profitability because of cost-sharing between the divers. Prior to 2005 team diving was illegal and unreported but allegedly quite common. There is no information to show that the incidence of team diving post-legalisation is different to the former level, but it is potentially a cause of changes to diver efficiency.
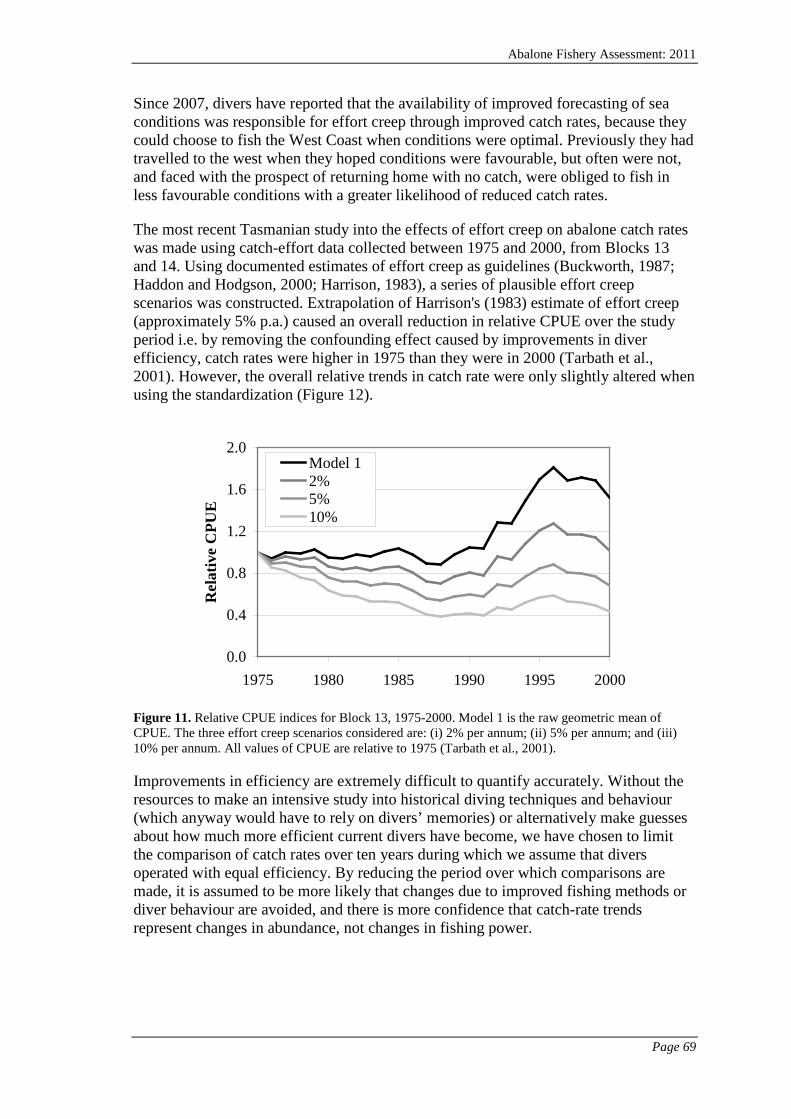
Abalone Fishery Assessment: 2011
Page 69
Since 2007, divers have reported that the availability of improved forecasting of sea conditions was responsible for effort creep through improved catch rates, because they could choose to fish the West Coast when conditions were optimal. Previously they had travelled to the west when they hoped conditions were favourable, but often were not, and faced with the prospect of returning home with no catch, were obliged to fish in less favourable conditions with a greater likelihood of reduced catch rates.
The most recent Tasmanian study into the effects of effort creep on abalone catch rates was made using catch-effort data collected between 1975 and 2000, from Blocks 13 and 14. Using documented estimates of effort creep as guidelines (Buckworth, 1987; Haddon and Hodgson, 2000; Harrison, 1983), a series of plausible effort creep scenarios was constructed. Extrapolation of Harrison's (1983) estimate of effort creep (approximately 5% p.a.) caused an overall reduction in relative CPUE over the study period i.e. by removing the confounding effect caused by improvements in diver efficiency, catch rates were higher in 1975 than they were in 2000 (Tarbath et al., 2001). However, the overall relative trends in catch rate were only slightly altered when using the standardization (Figure 12).
Figure 11. Relative CPUE indices for Block 13, 1975-2000. Model 1 is the raw geometric mean of CPUE. The three effort creep scenarios considered are: (i) 2% per annum; (ii) 5% per annum; and (iii) 10% per annum. All values of CPUE are relative to 1975 (Tarbath et al., 2001).
Improvements in efficiency are extremely difficult to quantify accurately. Without the resources to make an intensive study into historical diving techniques and behaviour (which anyway would have to rely on divers’ memories) or alternatively make guesses about how much more efficient current divers have become, we have chosen to limit the comparison of catch rates over ten years during which we assume that divers operated with equal efficiency. By reducing the period over which comparisons are made, it is assumed to be more likely that changes due to improved fishing methods or diver behaviour are avoided, and there is more confidence that catch-rate trends represent changes in abundance, not changes in fishing power.
0.0
0.4
0.8
1.2
1.6
2.0
1975 1980 1985 1990 1995 2000
Rel
ativ
e C
PUE
Model 12%5%10%
Abalone Fishery Assessment: 2011
Page 70
Circumstances when catch rates are reliable indices of abalone abundance
When problems caused by abalone aggregations, serial depletion and improved efficiency are understood and measures are taken to counter their effects, catch rates can reliably reflect abundance in fished populations. For example, in the NSW blacklip fishery, high visitation and exploitation rates preclude the formation of aggregations of legal-sized abalone, and stocks are uniformly maintained at a low level. A consequence of this is that the recovery-depletion cycle evident in other fisheries is removed. Researchers in NSW have concluded that with the lowered stock abundance catch rates had become a reliable index of abundance (Andrew et al., 1997; Worthington et al., 1998). Similarly, in the more heavily fished parts of Tasmania (e.g. the Actaeons) where it is known that diver visitation rates to reefs are high (i.e. restrict the formation of aggregations), divers are unable to successively deplete reefs (because all reefs support continuous levels of effort). Provided the effects of effort creep are reduced by limiting the review period to years when diving methodology is unchanged, we can assume that catch-rate trends are indicative of changes in abundance.
These conditions of intense fishing pressure are probably common in parts of the Eastern Zone fishery from where most of the catch is taken, particularly the Actaeons and Storm Bay regions, and the more heavily fished parts of the Northern and Western Zone fisheries in North West Tasmania and the South Coast. However, there are many parts of the Tasmanian fishery where these conditions cannot be met, and assessment of these areas based on catch rates must be viewed with caution. The following cases are discussed:
Earlier assessments assumed that abalone abundance was high on Tasmania’s west coast because catch rates were relatively high compared with the east coast. It now appears that along much of the coastline, the population remnants contracted to either deep water or the wash zone, where they can still be caught at high catch rates. Earlier assessments also failed to account for the larger size of west coast fish, which causes high catch rates relative to other parts of the fishery. The reported decline of stocks and widespread concern among divers who fish in the South West highlights the dangers of relying upon absolute values of catch rates to gauge abundance levels.
We assume that a change in annual catch (e.g. TAC reduction) will cause effort to be proportionally reduced throughout a zone, but this is not usually the case. Effort is maintained on favoured areas, while less favoured areas may go unfished, and means that effort is not applied consistently to populations. This can increase the time between fishing events and allow aggregations to form where previously there were none, or worse, reduce effort on populations to superficial levels. Both can produce high catch rates and the illusion of high stock levels. Under these circumstances, the relationship between abalone abundance and catch rates is different than under conditions of constant levels of effort, and catch rate trends should be used with caution.
Much of Tasmania’s greenlip fishery is fished at low levels of effort, reducing the value of catch rates for assessment purposes. However, there are two further problems to consider with the greenlip fishery. Firstly, it is evident that many divers are learning to fish greenlip abalone more efficiently, compounding the difficulty faced in interpreting the abundance/catch-rate relationship. Secondly, each region’s greenlip catch is relatively small, with few participating divers. The entry or exit of a diver who catches at different rates from the others can change the region’s catch rates (attempts at

Abalone Fishery Assessment: 2011
Page 71
standardising effort by diver have proved unsuccessful). Throughout southern Australia, fishery managers have a long history of monitoring greenlip fisheries using fishery catch and effort data with a notable lack of success. The Victorian fishery collapsed, and fisheries in South Australia (Shepherd et al., 2001), Western Australia (Hart et al., 1999), and Tasmania (Officer, 1999) have all wiped out greenlip populations because CPUE trends provided inadequate warning of stock depletion. Consequently we have placed less reliance on a CPUE/catch-based assessment in these areas.
Despite the difficulties with interpreting catch-rate information, it is proposed that, when catch rates are examined in combination with trends in the catch itself, along with the median size of captured abalone, some interpretations are more likely than others. The strongest indications of abundance change occur in two situations: (i) when catch rates continue to decline despite a decline in the catch; and (ii) when catch rates increase when catches increase.
Declining catches combined with continuing declines in catch rates should indicate a recruitment decline: despite a reduction in fishing pressure, catch rates continue to decline because there are increasingly fewer recruits each year to the fishery. This is expected to be associated with a decline in the median size of abalone because fishing mortality increases and fewer animals are left to grow to larger sizes.
Catch rates increasing with increasing catches are likely to indicate an increase in fishable biomass. It is expected that the median size will eventually increase, though a decrease is possible if the increased catch is due to large numbers of new recruits entering the fishery.
b. Size composition of the commercial catch
Almost since the start of the fishery, abalone from divers’ catches have been sampled for length measurements to provide information about the condition of stocks. However, because the reporting of catches was at the gross spatial scale of blocks, the samples were of limited value in assessing the impact of fishing on populations. While changes in size structure could be seen, it was never certain whether the changes were due to fishing mortality or because divers re-directed effort between populations with vastly different growth characteristics. In 1998, divers started submitting photographic samples of their catches with details of the location from where the catch was taken, which, given adequate levels of sampling, meant that individual populations could be monitored. Although the photographic program stopped in 2000, in that year the start of catch reporting by sub-blocks increased the value of length-based monitoring for the stock assessment.
Between 2000 and 2008, diver’s catches from around the State were routinely sampled by IMAS research staff at fish processing factories. Most of the sampling has been from catches taken in the south east and east coasts, but catches from the north and west coasts have also been measured. The fish processing factories have included both canners and live-market traders.
Since 2008, market measuring has been undertaken by four abalone processors (Ralphs Tasmanian Seafoods Pty Ltd, Tasmanian Seafoods (Margate) Pty Ltd, Tasmanian Seafoods (Smithton) Pty Ltd and Abalone Tasmania Pty Ltd) who together process
Abalone Fishery Assessment: 2011
Page 72
over 40% of the catch. Processor staff measure samples of 100 abalone from catches using electronic measuring boards.
The aim of catch sampling is to provide information about the size-structure of the catch from fished abalone populations, independent of variation caused by a range of confounding effects. This variation may stem from several causes: e.g. divers’ catches from the same sub-block on the same day may comprise abalone of widely varying lengths, caused by fishing populations with different growth characteristics. The size-structure of catch samples may also be influenced by seasonal growth rates, particularly when exploitation rates are low, and consequently samples collected during autumn and winter contain larger abalone than in spring and summer. Market preferences for abalone within a specific size-range will also be reflected in catch samples.
Sampling involves measuring 100 abalone randomly selected from a diver’s catch. Sample design was loosely based upon work done by Andrew and Chen (1997) in the New South Wales abalone fishery. Their strategy was to collect small samples from many catches, rather than large samples from a few catches, increasing the likelihood that the samples better represented the whole commercial catch and hence the populations from which they were taken.
For the purpose of this assessment, samples have been grouped by year and sub-block. Sub-blocks where less than 4% of catches have been sampled during more than two years have usually not been reviewed, because the level of sampling is probably inadequate to reflect size-structure of fished populations. Across much of the fishery, the level of sampling has been inadequate. Landings from motherships usually comprise catches from more than one sub-block and more than one day, and because it is not possible to identify the sub-block from where the catch came, size-compositions from areas fished predominately by motherships are generally not available.
The 4% level was chosen arbitrarily, with consideration given to the methods of Andrew and Chen (1997). However, where the number of annual landings is low, much higher percentages of sampling may still be inadequate. For example, during 2003 in the Western Zone sub-block 8A, there were 41 landings. Of these, four were sampled (~10%). The median and inter-quartile length estimates from the samples were larger than both those from earlier years and 2004. One of the four samples was taken from an unusually large catch caught at high catch rates, and it is surmised that, as occasionally happens on the west coast, unusually calm conditions enabled the diver to fish part of a hitherto unexploited population which contained older and larger abalone than normally encountered.
In the Eastern Zone, particularly the south east, the number of landings is much higher and effort is more evenly distributed across populations, thus reducing the effect of unusual catches. The size-composition charts of the south east blocks consistently show similar trends, even those sampled at less than the 4% level. In particular, the median length of 2002 samples in almost all sub-blocks increased, in conjunction with the 4-mm size-limit increase that was applied in that year, regardless of the level of sampling. The relatively high median size of 1998 and 1999 samples and the fall in length since then is also common across sub-blocks where those years were sampled. This trend is consistent with known decreases in the available stock and confirms that the level of sampling is adequate to detect trends. The level of sampling in 1998-1999 can only be guessed at by applying catch numbers from later years, which suggests sampling was

Abalone Fishery Assessment: 2011
Page 73
below 4% in many sub-blocks. (The level of sampling of pre-2000 catches could not be determined because although the sampled catch locations were known, all other catches were not reported by sub-block.) We conclude that the 4% level of sampling in the Eastern Zone is adequate, and that trends in median and inter-quartile lengths can reflect changes in the fished population size-structure.
Interpreting annual changes in median and inter-quartile lengths
Catch samples show that since 1998, throughout much of the south east there has been a trend of decreasing median size of abalone in commercial catches. Two opposing scenarios are proposed that might explain falling median length in the south east.
If abundance levels fall yet catch levels remain constant (i.e. exploitation rates rise), the average period of time between attaining legal size (recruiting) and being caught becomes shorter. Because abalone length is a function of time and growth rate, this means that overall growth is reduced, and the median length of the catch will fall. Under these circumstances, the 75 P
thP percentile length (the length which, down to the
legal limit, includes 75% of the available legal stock) could also be expected to fall with the median. As long as recruitment levels are unaffected, the 25 P
thP percentile length
would be expected to remain at similar levels to those seen in previous years. If exploitation rates further increase, then the 25 P
thP percentile length would eventually fall.
As a further indication of falling abundance a corresponding reduction in catch and catch rate trends would be expected.
Figure 12. Trends in catch, catch rate and median length (flanked by the 25 P
thP and 75P
thP percentile bounds),
sub-block 13C, 2000-2004.
For example, in sub-block 13C (Whale Head to Fishers Point, Actaeons region) between 2002 and 2004, firstly catch rates and then catches fell, suggesting high exploitation rates (Figure 13). The median length of landed abalone increased in 2002, when the size limit was raised 4 mm, but has since fallen, again suggesting high exploitation rates. In 2004, the 75P
thP percentile fell sharply, consistent with a fall in the
numbers of large abalone landed. In addition, in 2004, the 25 P
thP percentile declined
suggesting a decline in recruitment. The catch and catch rate trends indicate that abundance here is low. All three indicators suggested unsustainable levels of fishing in 2004 (Figure 13).
The second alternative interpretation of the reduced median length is that abundance of small abalone has increased due to an extraordinarily large influx of recruits. The median and 25P
thP percentile length could be expected to fall, but, unless the fishery was
dominated by recruits, the 75P
thP percentile length would be stable or possible increase as
exploitation rates fell. Increased levels of catch and catch rate would confirm that
01020304050607080
01020304050607080
2000
2001
2002
2003
2004
Cpu
e (k
g/hr
)
Cat
ch (t
onne
s)
135
140
145
150
155
160
2000
2001
2002
2003
2004
Year
Med
ian
leng
th (m
m)
0
2
4
6
8
10
12
% C
atch
es m
easu
red
% Catches measured Median (25%-75%)

Abalone Fishery Assessment: 2011
Page 74
abundance had increased. An example of this has occurred in sub-block 20B (Figure 14).
Figure 13. Trends in catch, catch rate and median length (flanked by the 25 P
thP and 75P
thP percentile bounds),
sub-block 20B, 2000-2004.
Increasing or stable median length, in conjunction with increasing catch and catch rates are strong indicators of rising stock levels. Catch rates and levels of catch in sub-block 24B (Maria Island) have started to recover since 2002 (Figure 15). The median length from catches sampled since then is also consistent with stock recovery. The increase in median length associated with the 4-mm increase in size limit in 2002 is again apparent; however, in contrast to sub-block 13C (Figure 13), the size-structure has been maintained, indicating that the levels of fishing pressure currently appear to be sustainable.
Figure 14. Trends in catch, catch rate and median length (flanked by the 25 P
thP and 75P
thP percentile bounds),
sub-block 24B, 2000-2004.
010203040506070
05
10152025303540
2000
2001
2002
2003
2004
Cpu
e (k
g/hr
)
Cat
ch (t
onne
s)
135
140
145
150
155
160
1998
1999
2000
2001
2002
2003
2004
Year
Med
ian
leng
th (m
m)
0
2
4
6
8
10
12
% C
atch
es m
easu
red
% Catches measured Median (25%-75%)
01020304050607080
05
1015202530
2000
2001
2002
2003
2004
Cpu
e (k
g/hr
)
Cat
ch (t
onne
s)
135
140
145
150
155
160
2000
2001
2002
2003
2004
Year
Med
ian
leng
th (
mm
)
0
2
4
6
8
10
12
14
% C
atch
es m
easu
red
% Catches measured Median (25%-75%)

Abalone Fishery Assessment: 2011
Page 75
Appendix 5: Early abalone production 1960-1981
Annual tonnages of abalone production from Tasmania are shown below. The first two series - divers' catches P
aP and Tasmanian processors' receipts P
bP have been reproduced from
"Summary of Statistics – Tasmania", Abalone Situation Report 10, Demersal Mollusc Research Group, published by CSIRO, 1982. Tasmanian Year Book P
cP totals were
published each year from 1967 by the Commonwealth Bureau of Census and Statistics (annual totals from 1964 were reported in the 1967 edition).
All three totals were reported by financial year. Abalone catch prior to 1968 was reported by divers in general fish returns as miscellaneous catch, and annual totals are incomplete. Catches are believed to have been substantially under-reported between 1960 and 1981 i.e. catch totals were higher than shown here. Processor receipts were from Tasmanian processors only: much of the early catch was freighted to interstate processors and is not included amongst these processor receipts. Little or no processing was done in Tasmania prior to 1964. The source of the Tasmanian Year Book totals is unknown.
Year Diver P
aP
returns Processor P
bP
returns Tasmanian Year Book P
c
1960 * * ** 1961 * * ** 1962 * * ** 1963 * * **
1964 * 49 33 1965 * 225 225 1966 412 753 727 1967 1,050 1,722 2,003 1968 1,966 2,354 2,792 1969 1,894 2,139 2,113 1970 2,297 2,613 2,613 1971 2,504 3,488 3,495 1972 2,287 2,971 2,977 1973 1,703 2,174 2,172 1974 1,883 2,106 2,060 1975 1,919 2,108 2,108 1976 2,289 2,429 2,429 1977 2,263 2,368 2,368 1978 2,823 2,524 2,525 1979 2,762 3,100 3,100 1980 3,391 3,204 3,214 1981 3,800 3,621 3,743
* Records unavailable. ** Records not published.

Abalone Fishery Assessment: 2011
Page 76
Appendix 6: Annual Catches by Zone – 1975-2011
Eastern Zone The Eastern Zone comprises Sub-blocks 13C, 13D, 13E, Blocks 14 to 30 and Sub-block 31A). The Western and Eastern Zones were not established until 2000, and the Northern Zone until 2001; prior to those years catches cannot be accurately assigned to zones in blocks where zone boundaries occur (Blocks 13 and 31). Catches in these blocks are reported as Eastern Zone because the majority of later catches occurred there, and consequently the average catch for these two blocks may be overestimated.
Year 13 14 15 16 17 19 20 21 22
Estim
ated
wei
ghts
1975 247 111 10 47 11 0 16 27 49 1976 208 156 0 64 36 1 18 25 45 1977 245 232 2 190 11 1 23 35 37 1978 322 218 6 119 24 1 32 65 60 1979 374 251 8 148 25 2 51 52 43 1980 272 255 7 145 30 1 33 30 42 1981 254 299 18 127 48 4 45 69 35 1982 337 218 15 147 24 3 36 62 63 1983 250 300 10 189 28 3 43 63 54 1984 318 297 18 166 35 5 47 70 73
Land
ed w
eigh
ts 1985 256 262 4 89 83 11 68 80 43
1986 220 262 22 82 93 4 65 66 70 1987 224 229 7 47 80 1 43 44 32 1988 219 258 6 76 57 4 62 44 43 1989 156 172 2 56 43 2 61 42 22 1990 132 193 4 76 29 3 33 51 40 1991 127 207 2 60 37 3 53 50 47
Estim
ated
wei
ghts
1992 140 106 3 28 20 2 51 43 49 1993 257 116 4 100 40 1 59 78 48 1994 295 139 10 114 46 1 109 80 55 1995 310 247 1 100 35 1 95 74 34 1996 391 195 0 78 18 3 71 55 44 1997 471 137 0 64 25 2 79 49 47 1998 470 108 1 116 23 2 85 64 63 1999 491 66 2 113 35 6 102 72 50 2000 381 98 2 71 29 4 62 60 69 2001 324 157 3 108 20 2 56 50 40 2002 296 101 1 72 16 1 62 58 46 2003 291 116 2 60 17 1 88 54 35 2004 221 104 7 50 20 2 92 52 35 2005 181 90 8 56 20 3 116 62 36 2006 184 84 3 67 13 2 73 66 71 2007 255 70 0 56 8 6 68 63 61 2008 340 56 1 64 8 0 50 61 56 2009 341 63 1 52 20 1 51 52 91 2010 342 70 1 39 10 2 71 59 73 2011 359 15 0 37 8 1 30 47 54
Average 75-11 284 164 5 88 30 3 60 56 50 Average 85-11 284 138 4 72 32 3 69 58 50 Average 00-11 293 85 3 61 16 2 68 57 56
continued next page
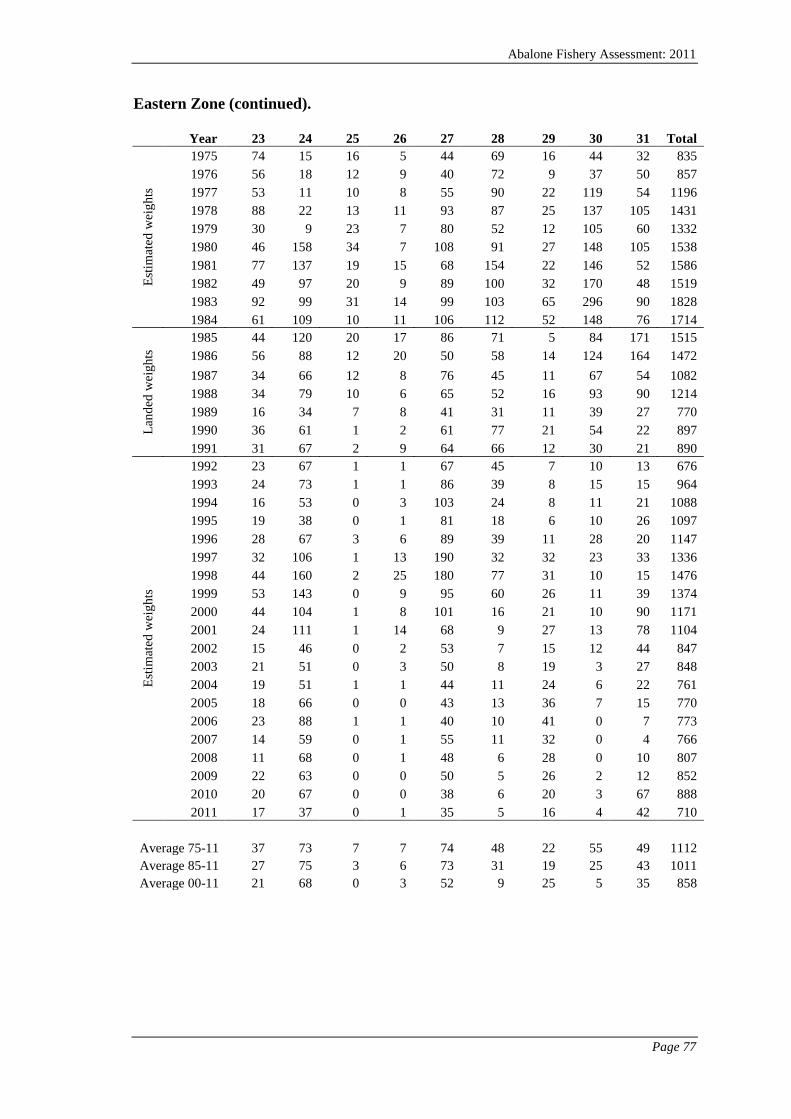
Abalone Fishery Assessment: 2011
Page 77
Eastern Zone (continued).
Year 23 24 25 26 27 28 29 30 31 Total
Estim
ated
wei
ghts
1975 74 15 16 5 44 69 16 44 32 835 1976 56 18 12 9 40 72 9 37 50 857 1977 53 11 10 8 55 90 22 119 54 1196 1978 88 22 13 11 93 87 25 137 105 1431 1979 30 9 23 7 80 52 12 105 60 1332 1980 46 158 34 7 108 91 27 148 105 1538 1981 77 137 19 15 68 154 22 146 52 1586 1982 49 97 20 9 89 100 32 170 48 1519 1983 92 99 31 14 99 103 65 296 90 1828 1984 61 109 10 11 106 112 52 148 76 1714
Land
ed w
eigh
ts 1985 44 120 20 17 86 71 5 84 171 1515
1986 56 88 12 20 50 58 14 124 164 1472 1987 34 66 12 8 76 45 11 67 54 1082 1988 34 79 10 6 65 52 16 93 90 1214 1989 16 34 7 8 41 31 11 39 27 770 1990 36 61 1 2 61 77 21 54 22 897 1991 31 67 2 9 64 66 12 30 21 890
Estim
ated
wei
ghts
1992 23 67 1 1 67 45 7 10 13 676 1993 24 73 1 1 86 39 8 15 15 964 1994 16 53 0 3 103 24 8 11 21 1088 1995 19 38 0 1 81 18 6 10 26 1097 1996 28 67 3 6 89 39 11 28 20 1147 1997 32 106 1 13 190 32 32 23 33 1336 1998 44 160 2 25 180 77 31 10 15 1476 1999 53 143 0 9 95 60 26 11 39 1374 2000 44 104 1 8 101 16 21 10 90 1171 2001 24 111 1 14 68 9 27 13 78 1104 2002 15 46 0 2 53 7 15 12 44 847 2003 21 51 0 3 50 8 19 3 27 848 2004 19 51 1 1 44 11 24 6 22 761 2005 18 66 0 0 43 13 36 7 15 770 2006 23 88 1 1 40 10 41 0 7 773 2007 14 59 0 1 55 11 32 0 4 766 2008 11 68 0 1 48 6 28 0 10 807 2009 22 63 0 0 50 5 26 2 12 852 2010 20 67 0 0 38 6 20 3 67 888 2011 17 37 0 1 35 5 16 4 42 710
Average 75-11 37 73 7 7 74 48 22 55 49 1112 Average 85-11 27 75 3 6 73 31 19 25 43 1011 Average 00-11 21 68 0 3 52 9 25 5 35 858
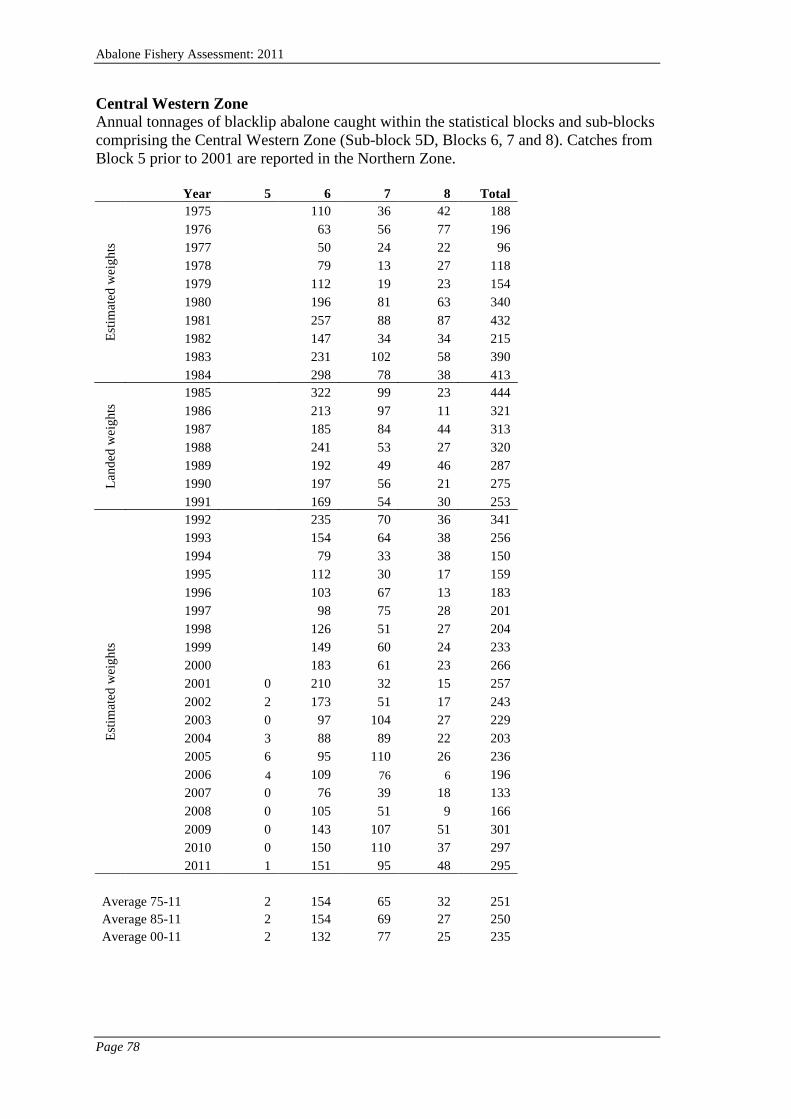
Abalone Fishery Assessment: 2011
Page 78
Central Western Zone Annual tonnages of blacklip abalone caught within the statistical blocks and sub-blocks comprising the Central Western Zone (Sub-block 5D, Blocks 6, 7 and 8). Catches from Block 5 prior to 2001 are reported in the Northern Zone.
Year 5 6 7 8 Total
Estim
ated
wei
ghts
1975
110 36 42 188 1976
63 56 77 196
1977
50 24 22 96 1978
79 13 27 118
1979
112 19 23 154 1980
196 81 63 340
1981
257 88 87 432 1982
147 34 34 215
1983
231 102 58 390 1984 298 78 38 413
Land
ed w
eigh
ts 1985
322 99 23 444
1986
213 97 11 321 1987
185 84 44 313
1988
241 53 27 320 1989
192 49 46 287
1990
197 56 21 275 1991 169 54 30 253
Estim
ated
wei
ghts
1992
235 70 36 341 1993
154 64 38 256
1994
79 33 38 150 1995
112 30 17 159
1996
103 67 13 183 1997
98 75 28 201
1998
126 51 27 204 1999
149 60 24 233
2000
183 61 23 266 2001 0 210 32 15 257 2002 2 173 51 17 243 2003 0 97 104 27 229 2004 3 88 89 22 203 2005 6 95 110 26 236 2006 4 109 76 6 196 2007 0 76 39 18 133 2008 0 105 51 9 166 2009 0 143 107 51 301 2010 0 150 110 37 297 2011 1 151 95 48 295
Average 75-11 2 154 65 32 251 Average 85-11 2 154 69 27 250 Average 00-11 2 132 77 25 235

Abalone Fishery Assessment: 2011
Page 79
Western Zone Annual tonnages of blacklip abalone caught within the statistical blocks and sub-blocks comprising the Western Zone in 2009 (Blocks 9 to 12, Sub-blocks 13A, 13B). Pre-zoning (1975-1999) catches from Block 13 are reported in the Eastern Zone.
Year 9 10 11 12 13 Total
Estim
ated
wei
ghts
1975 126 130 191 143
590 1976 252 179 240 153
824
1977 123 98 153 189
562 1978 115 258 275 208
855
1979 172 166 269 325
933 1980 316 195 338 351
1200
1981 444 260 417 246
1366 1982 249 100 303 235
887
1983 199 174 430 242
1045 1984 248 284 681 258 1471
Land
ed w
eigh
ts 1985 246 140 478 155
1019
1986 133 127 289 193
742 1987 252 82 339 195
868
1988 159 124 270 162
715 1989 120 109 212 144
586
1990 95 80 232 125
532 1991 102 106 219 140 567
Estim
ated
wei
ghts
1992 91 95 266 159
611 1993 110 65 197 177
548
1994 77 60 202 160
499 1995 44 68 186 182
479
1996 59 75 145 148
428 1997 140 66 224 227
657
1998 78 47 163 192
480 1999 115 58 220 251
645
2000 205 148 326 282 54 1015 2001 186 152 312 290 43 983 2002 174 143 360 236 93 1005 2003 142 239 345 229 67 1023 2004 130 181 374 250 96 1031 2005 92 149 389 311 65 1006 2006 142 198 384 228 89 1041 2007 178 231 354 267 68 1097 2008 156 178 345 305 79 1064 2009 155 110 244 327 77 913 2010 159 158 245 277 68 907 2011 171 159 247 256 56 889
Average 75-11 161 140 294 222 71 840 Average 85-11 137 124 280 217 71 791 Average 00-11 158 170 327 272 71 998

Abalone Fishery Assessment: 2011
Page 80
Northern Zone The Northern Zone comprises Blocks 1 to 4, Sub-blocks 5A, 5B, 5C, 31B, Blocks 39 to 40 and Blocks 47 to 49. There are no records for the Northern Zone part of Block 31 prior to the creation of the zone in 2001.
Year 31 39 40 47 48 49 5 1 2 3 4 Total
Estim
ated
wei
ghts
1975
2 1 1 12 9 38 32 1 27 15 139 1976
5 0 1 12 33 46 39 0 51 8 195
1977
6 2 0 8 17 51 17 1 87 8 196 1978
8 2 3 10 11 65 21 3 55 25 204
1979
6 1 0 27 7 85 24 2 10 9 172 1980
3 1 0 10 1 92 51 3 33 3 197
1981
6 2 3 33 10 120 19 8 32 9 242 1982
5 2 1 45 7 121 22 9 27 13 253
1983
7 4 9 45 19 228 22 2 31 52 418 1984 6 3 4 80 44 312 10 1 33 55 548
Land
ed w
eigh
ts 1985
5 1 4 48 50 319 43 0 26 11 508
1986
10 5 15 85 97 267 35 4 24 13 556 1987
6 1 18 58 67 198 44 62 24 54 531
1988
3 1 18 30 38 165 29 16 21 60 380 1989
1 28 14 15 24 88 14 7 10 5 206
1990
0 0 6 14 20 82 11 10 9 11 164 1991 1 0 8 12 10 97 6 7 14 26 182
Estim
ated
wei
ghts
1992
4 0 3 10 11 76 2 3 9 8 126 1993
0 0 1 7 7 65 8 3 8 9 107
1994
0 0 0 7 12 49 15 2 4 1 90 1995
0 0 0 6 2 62 11 3 1 8 94
1996
0 0 0 4 0 63 7 2 1 2 80 1997
1 0 0 6 2 56 10 1 10 6 91
1998
0 1 0 7 3 61 3 1 0 2 78 1999
5 0 0 14 4 57 5 1 6 6 97
2000
5 2 0 12 25 45 0 0 9 10 108 2001 12 11 3 0 17 72 117 2 1 12 12 260 2002 30 4 3 0 12 48 103 10 2 35 16 262 2003 7 8 1 0 10 76 73 25 1 61 10 270 2004 14 6 1 0 6 62 55 10 0 85 34 273 2005 11 2 0 0 6 54 73 15 2 92 18 273 2006 16 4 0 0 5 57 96 11 3 57 8 258 2007 55 11 0 0 6 59 89 6 0 47 3 276 2008 29 5 0 0 7 74 163 5 0 24 10 317 2009 20 9 0 0 4 75 172 10 0 27 5 322 2010 36 5 0 0 8 72 132 5 1 41 24 324 2011 24 5 0 0 8 103 155 17 1 82 6 400
Average 75-11 23 4 2 3 19 35 112 17 4 30 16 249 Average 85-11 23 4 2 3 16 42 110 13 5 27 14 246 Average 00-11 23 6 1 0 8 65 106 10 1 48 13 278
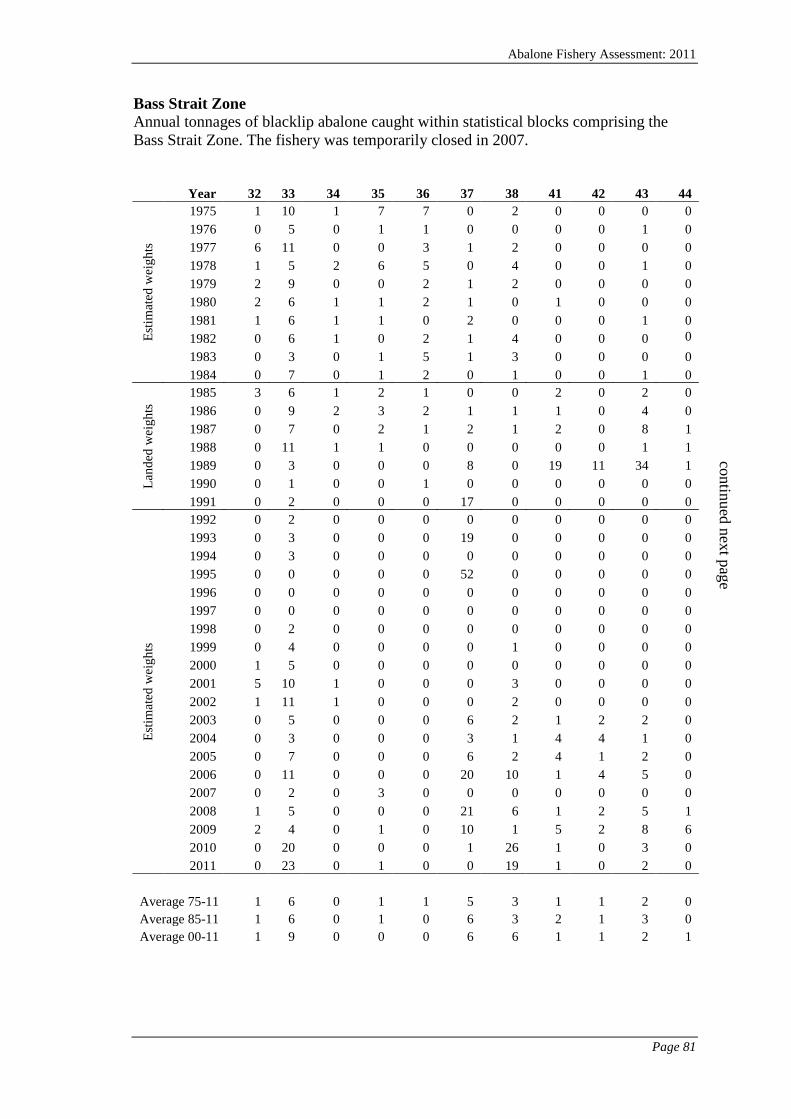
Abalone Fishery Assessment: 2011
Page 81
Bass Strait Zone Annual tonnages of blacklip abalone caught within statistical blocks comprising the Bass Strait Zone. The fishery was temporarily closed in 2007.
Year 32 33 34 35 36 37 38 41 42 43 44
Estim
ated
wei
ghts
1975 1 10 1 7 7 0 2 0 0 0 0 1976 0 5 0 1 1 0 0 0 0 1 0 1977 6 11 0 0 3 1 2 0 0 0 0 1978 1 5 2 6 5 0 4 0 0 1 0 1979 2 9 0 0 2 1 2 0 0 0 0 1980 2 6 1 1 2 1 0 1 0 0 0 1981 1 6 1 1 0 2 0 0 0 1 0 1982 0 6 1 0 2 1 4 0 0 0 0 1983 0 3 0 1 5 1 3 0 0 0 0 1984 0 7 0 1 2 0 1 0 0 1 0
Land
ed w
eigh
ts 1985 3 6 1 2 1 0 0 2 0 2 0
1986 0 9 2 3 2 1 1 1 0 4 0 1987 0 7 0 2 1 2 1 2 0 8 1 1988 0 11 1 1 0 0 0 0 0 1 1 1989 0 3 0 0 0 8 0 19 11 34 1 1990 0 1 0 0 1 0 0 0 0 0 0 1991 0 2 0 0 0 17 0 0 0 0 0
Estim
ated
wei
ghts
1992 0 2 0 0 0 0 0 0 0 0 0 1993 0 3 0 0 0 19 0 0 0 0 0 1994 0 3 0 0 0 0 0 0 0 0 0 1995 0 0 0 0 0 52 0 0 0 0 0 1996 0 0 0 0 0 0 0 0 0 0 0 1997 0 0 0 0 0 0 0 0 0 0 0 1998 0 2 0 0 0 0 0 0 0 0 0 1999 0 4 0 0 0 0 1 0 0 0 0 2000 1 5 0 0 0 0 0 0 0 0 0 2001 5 10 1 0 0 0 3 0 0 0 0 2002 1 11 1 0 0 0 2 0 0 0 0 2003 0 5 0 0 0 6 2 1 2 2 0 2004 0 3 0 0 0 3 1 4 4 1 0 2005 0 7 0 0 0 6 2 4 1 2 0 2006 0 11 0 0 0 20 10 1 4 5 0 2007 0 2 0 3 0 0 0 0 0 0 0 2008 1 5 0 0 0 21 6 1 2 5 1 2009 2 4 0 1 0 10 1 5 2 8 6 2010 0 20 0 0 0 1 26 1 0 3 0 2011 0 23 0 1 0 0 19 1 0 2 0
Average 75-11 1 6 0 1 1 5 3 1 1 2 0 Average 85-11 1 6 0 1 0 6 3 2 1 3 0 Average 00-11 1 9 0 0 0 6 6 1 1 2 1
continued next page

Abalone Fishery Assessment: 2011
Page 82
Bass Strait Zone (continued).
Year 45 46 50 51 52 53 54 55 56 57 Total
Estim
ated
wei
ghts
1975 0 0 0 0 0 0 0 0 0 0 29 1976 0 0 0 0 0 0 0 0 0 0 9 1977 0 0 0 0 0 0 0 0 0 0 23 1978 0 0 0 0 0 0 0 0 0 0 22 1979 0 3 0 0 0 0 0 0 0 0 20 1980 0 0 0 0 0 0 0 0 0 0 13 1981 0 0 0 0 0 0 0 0 0 0 12 1982 0 0 0 0 0 0 0 0 0 0 14 1983 0 0 0 0 0 0 0 0 0 0 14 1984 0 3 0 0 0 0 0 0 0 0 16
Land
ed w
eigh
ts 1985 0 0 0 0 0 0 0 0 0 0 18
1986 0 1 0 0 0 0 0 0 0 0 25 1987 0 0 0 0 0 0 0 0 0 0 26 1988 0 1 0 0 0 0 0 0 0 0 16 1989 5 14 1 24 0 41 4 0 6 0 172 1990 0 0 0 0 0 0 0 0 0 0 2 1991 0 0 0 14 5 28 1 0 17 15 98
Estim
ated
wei
ghts
1992 0 0 0 0 0 0 0 0 0 0 3 1993 0 0 0 21 4 37 1 0 6 8 99 1994 0 0 0 0 0 0 0 0 0 0 4 1995 0 0 1 46 2 44 0 0 0 5 150 1996 0 0 0 0 0 0 0 0 0 0 0 1997 0 0 0 0 0 0 0 0 0 0 0 1998 0 0 0 0 0 0 0 0 0 0 2 1999 0 0 0 0 0 0 0 0 0 0 6 2000 0 0 0 0 0 0 0 0 0 0 7 2001 0 0 0 0 0 0 0 0 0 2 21 2002 0 0 0 0 0 0 0 0 0 0 17 2003 0 2 0 7 2 36 2 0 7 2 78 2004 0 1 0 1 0 42 5 2 7 0 75 2005 0 0 0 8 0 35 5 3 3 0 78 2006 0 5 0 3 0 24 5 2 1 1 91 2007 0 0 0 0 0 0 0 0 0 0 5 2008 1 3 0 1 0 27 0 0 6 0 80 2009 1 1 0 5 0 24 1 0 4 2 78 2010 1 1 0 2 0 13 0 0 0 0 68 2011 1 1 0 3 0 13 0 0 2 0 68
Average 75-11 0 1 0 4 0 10 1 0 2 1 39 Average 85-11 0 1 0 5 0 13 1 0 2 1 48 Average 00-11 0 1 0 2 0 18 2 1 3 1 55
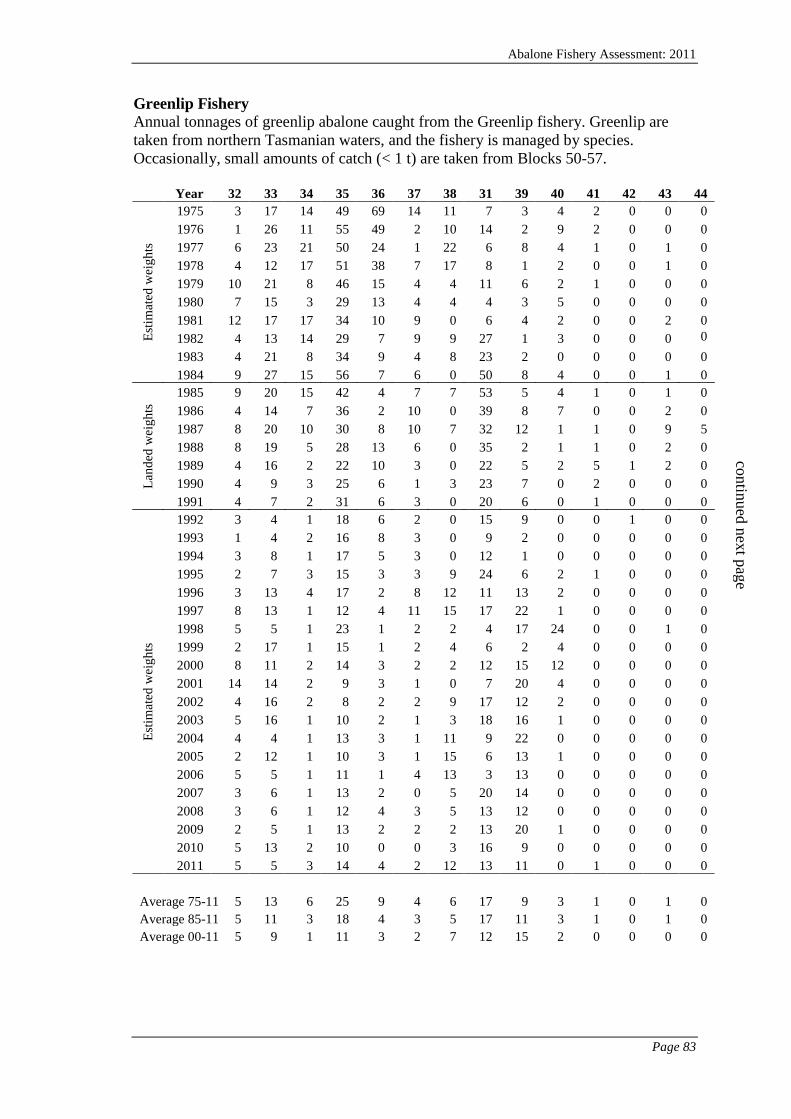
Abalone Fishery Assessment: 2011
Page 83
Greenlip Fishery Annual tonnages of greenlip abalone caught from the Greenlip fishery. Greenlip are taken from northern Tasmanian waters, and the fishery is managed by species. Occasionally, small amounts of catch (< 1 t) are taken from Blocks 50-57.
Year 32 33 34 35 36 37 38 31 39 40 41 42 43 44
Estim
ated
wei
ghts
1975 3 17 14 49 69 14 11 7 3 4 2 0 0 0 1976 1 26 11 55 49 2 10 14 2 9 2 0 0 0 1977 6 23 21 50 24 1 22 6 8 4 1 0 1 0 1978 4 12 17 51 38 7 17 8 1 2 0 0 1 0 1979 10 21 8 46 15 4 4 11 6 2 1 0 0 0 1980 7 15 3 29 13 4 4 4 3 5 0 0 0 0 1981 12 17 17 34 10 9 0 6 4 2 0 0 2 0 1982 4 13 14 29 7 9 9 27 1 3 0 0 0 0 1983 4 21 8 34 9 4 8 23 2 0 0 0 0 0 1984 9 27 15 56 7 6 0 50 8 4 0 0 1 0
Land
ed w
eigh
ts 1985 9 20 15 42 4 7 7 53 5 4 1 0 1 0
1986 4 14 7 36 2 10 0 39 8 7 0 0 2 0 1987 8 20 10 30 8 10 7 32 12 1 1 0 9 5 1988 8 19 5 28 13 6 0 35 2 1 1 0 2 0 1989 4 16 2 22 10 3 0 22 5 2 5 1 2 0 1990 4 9 3 25 6 1 3 23 7 0 2 0 0 0 1991 4 7 2 31 6 3 0 20 6 0 1 0 0 0
Estim
ated
wei
ghts
1992 3 4 1 18 6 2 0 15 9 0 0 1 0 0 1993 1 4 2 16 8 3 0 9 2 0 0 0 0 0 1994 3 8 1 17 5 3 0 12 1 0 0 0 0 0 1995 2 7 3 15 3 3 9 24 6 2 1 0 0 0 1996 3 13 4 17 2 8 12 11 13 2 0 0 0 0 1997 8 13 1 12 4 11 15 17 22 1 0 0 0 0 1998 5 5 1 23 1 2 2 4 17 24 0 0 1 0 1999 2 17 1 15 1 2 4 6 2 4 0 0 0 0 2000 8 11 2 14 3 2 2 12 15 12 0 0 0 0 2001 14 14 2 9 3 1 0 7 20 4 0 0 0 0 2002 4 16 2 8 2 2 9 17 12 2 0 0 0 0 2003 5 16 1 10 2 1 3 18 16 1 0 0 0 0 2004 4 4 1 13 3 1 11 9 22 0 0 0 0 0 2005 2 12 1 10 3 1 15 6 13 1 0 0 0 0 2006 5 5 1 11 1 4 13 3 13 0 0 0 0 0 2007 3 6 1 13 2 0 5 20 14 0 0 0 0 0 2008 3 6 1 12 4 3 5 13 12 0 0 0 0 0 2009 2 5 1 13 2 2 2 13 20 1 0 0 0 0 2010 5 13 2 10 0 0 3 16 9 0 0 0 0 0 2011 5 5 3 14 4 2 12 13 11 0 1 0 0 0
Average 75-11 5 13 6 25 9 4 6 17 9 3 1 0 1 0 Average 85-11 5 11 3 18 4 3 5 17 11 3 1 0 1 0 Average 00-11 5 9 1 11 3 2 7 12 15 2 0 0 0 0
continued next page

Abalone Fishery Assessment: 2011
Page 84
Greenlip Fishery (continued)
Year 45 46 47 48 49 5 1 2 3 4 Total
Estim
ated
wei
ghts
1975 0 0 0 7 2 8 0 3 0 1 214 1976 0 0 0 8 6 14 0 0 0 0 212 1977 0 0 0 40 2 17 0 0 0 0 225 1978 0 0 1 13 3 12 1 3 0 2 192 1979 0 0 0 11 0 8 0 0 0 0 147 1980 0 0 0 6 0 5 0 3 0 0 101 1981 0 0 3 12 1 9 0 12 0 4 155 1982 0 0 2 7 0 2 0 14 0 2 141 1983 0 0 14 40 11 9 0 9 0 5 201 1984 0 2 52 60 2 11 0 7 1 5 323
Land
ed w
eigh
ts 1985 0 1 12 36 3 3 0 1 0 1 225
1986 0 1 57 35 14 5 1 8 0 3 255 1987 0 1 37 33 3 8 13 125 5 69 446 1988 0 7 35 21 4 10 3 33 2 12 251 1989 0 6 20 27 4 6 1 70 3 10 241 1990 0 4 21 27 11 11 2 49 3 13 224 1991 0 8 13 32 6 12 2 29 3 16 200
Estim
ated
wei
ghts
1992 0 3 4 14 2 4 3 21 0 8 119 1993 1 3 2 26 4 2 2 18 0 9 113 1994 0 0 3 48 3 10 4 25 0 7 149 1995 0 0 5 23 5 8 14 9 0 12 150 1996 0 1 1 15 0 3 37 33 1 13 191 1997 0 0 1 28 3 6 35 33 0 6 215 1998 0 0 2 43 8 14 31 34 0 5 223 1999 0 0 0 20 1 10 21 25 1 10 142 2000 0 0 0 24 12 13 2 4 1 3 140 2001 0 0 0 35 9 3 8 8 1 2 140 2002 0 0 0 27 7 7 11 6 1 7 140 2003 0 0 0 14 10 10 14 11 3 4 140 2004 0 0 0 14 6 10 14 10 4 3 129 2005 0 0 0 19 1 12 16 7 4 3 123 2006 0 0 0 29 2 8 11 10 2 5 123 2007 0 0 0 21 3 9 10 7 3 6 124 2008 0 0 0 33 3 5 4 10 1 5 121 2009 0 0 0 26 2 5 8 8 3 6 123 2010 0 0 0 30 5 8 11 13 4 5 134 2011 0 0 0 31 5 6 6 9 9 4 140
Average 75-11 0 1 8 25 4 8 8 18 2 7 179 Average 85-11 0 1 8 27 5 8 10 23 2 9 175 Average 00-11 0 0 0 25 5 8 10 8 3 4 131

Abalone Fishery Assessment: 2011
Page 85
Appendix 7: Catch/effort data extract query
Catch/effort data from divers' catch dockets were provided by DPIPWE, with tables updated weekly and stored in an Oracle database at the University of Tasmania. The following SQL query was used to extract catch records from the Oracle database:
SELECT DISTINCT d.docket_number docket , f.fishing_date day , EXTRACT(month FROM f.fishing_date) month , EXTRACT(year FROM f.fishing_date) year , UPPER(n3.last_name)||','||REPLACE(TRANSLATE(INITCAP(n3.first_names), 'abcdefghijklmnopqrstuvwxyz','##########################'),'#','') diver_name , SUBSTR(d.zone_fishery_code, 3, 2) zone , CASE WHEN f.block_code BETWEEN 'AB13C' AND 'AB14B' THEN 'ACT' WHEN f.block_code BETWEEN 'AB14C' AND 'AB16D' THEN 'BRUNY' WHEN f.block_code BETWEEN 'AB17A' AND 'AB21C' THEN 'STMBY' WHEN f.block_code BETWEEN 'AB22A' AND 'AB31A' THEN 'EC' WHEN f.block_code BETWEEN 'AB32A' AND 'AB38C' THEN 'FG' WHEN f.block_code BETWEEN 'AB39A' AND 'AB40C' THEN 'NE' WHEN f.block_code BETWEEN 'AB41' AND 'AB46' THEN 'CN' WHEN f.block_code BETWEEN 'AB47A' AND 'AB49C' THEN 'NW' WHEN f.block_code BETWEEN 'AB01A' AND 'AB04C' THEN 'KI' WHEN f.block_code BETWEEN 'AB05A' AND 'AB05C' THEN 'NW' WHEN f.block_code BETWEEN 'AB05D' AND 'AB06D' THEN 'COUTA' WHEN f.block_code BETWEEN 'AB07A' AND 'AB08C' THEN 'GRANVILLE' WHEN f.block_code BETWEEN 'AB09A' AND 'AB09C' THEN 'STRAHAN' WHEN f.block_code BETWEEN 'AB10A' AND 'AB12A' THEN 'SW' WHEN f.block_code BETWEEN 'AB12B' AND 'AB13B' THEN 'SC' WHEN f.block_code BETWEEN 'AB50' AND 'AB57' THEN 'ISLAND' WHEN f.block_code = 'AB31B' THEN 'NE' END region , SUBSTR(f.block_code,1,4) blok , f.block_code sub_block , ROUND(f.blacklip_estimated_weight,0) blips, ROUND(f.greenlip_estimated_weight,0) glips, NVL(dive_time_1,0) + NVL(dive_time_2,0) + NVL(dive_time_3,0) total_time FROM qms.abalone_fishing_details f , qms.quota_dockets d , lmm.clients n3 WHERE EXTRACT(year FROM f.fishing_date)= 2011 AND d.qudo_id = f.qudo_id AND n3.client_id = d.docket_signatory_id ORDER BY f.fishing_date asc

Abalone Fishery Assessment: 2011
Page 86
Appendix 8: Treatment of errors in catch data in 2011
No amendments were made to catch totals from earlier years presented in this report. Where errors are identified they will be corrected, and any corrections will be reported in subsequent assessment reports. Several errors have been found and corrected in previous years. Although this process is important for rigor of the assessment, the magnitude of any errors identified to date has been small and had no effect on interpretation of stock trends and thus management decisions. This is because errors identified to date typically involve key stroke errors on individual catch records rather than systematic errors affecting a large portion of the catch.
Abalone Fishery Assessment: 2011
Page 87
Appendix 9: Ecological effects of abalone fishing.
Abalone fishing is typically regarded as having low ecological impact because there is no bycatch (other than sessile organisms on the shells), the conservation status of the target species is secure, and the high energy coastal environments where the fishery operates are typically subject to large environmental variation which creates resilience. For this reason there is little concern regarding the ecological effects of abalone fishing and thus there has been little research initiated on the issue. Nonetheless, consideration of the issue is important for EBFM. Information from recent research at IMAS is presented here.
This summary is an extract from Chapter 2, Towards integrated multi-species management of Australia's SE reef fisheries: A Tasmanian example. Report to Fisheries Research and Development Corporation. No. 2004/013. Tasmanian Aquaculture and Fisheries Institute, University of Tasmania. Frusher S, Buxton C, Barrett N, Tarbath D, Redd K, Semmens J, Pederson H, Valentine J & Guest M (2009).
Summary:
At a global level, overfishing and subsequent depletion leading to the collapse of abalone populations on individual reefs and parts of the coast are common problems (Dugan and Davis, 1993; Karpov et al., 2000; Shepherd and Baker, 1998). While overall the Tasmanian blacklip abalone fishery has been relatively robust, depletion and consequent loss of production are evident in parts of the fishery. For example, following years of fishing at apparently sustainable levels, some reporting areas (‘blocks’) of the abalone fishery in east and north-east Tasmania experienced rapid declines in annual catch to less than 10% of their former levels (Tarbath et al., 2007).
These reporting blocks are large (tens of kilometres), and consequently the history of abalone production at the scale of individual reefs within them is unknown. Divers who once worked extensively along the coastline have reported that many of the reefs had become too depleted to warrant fishing at economic levels, and fishing activity was concentrated on the remaining productive reefs. Similar patterns had also been reported by divers in other previously productive parts of the Tasmanian fishery.
Information was sought about the history of productive abalone reefs from commercial abalone divers. Thirty three divers were interviewed: 16 early divers from pre-1972, 7 mid-era divers from between 1972 and 1992 and 10 current divers. By using a combination of maps, logbooks and diaries, reefs and coastline in use by the fishery were identified in five key areas (Blocks 13, 14, 23, 28, and 30) in the east and south-east, throughout the course of its history.
Perceptions of productivity varied greatly and were affected by economic factors (beach price, costs) as well as abundance. However, by comparing usage of reefs over time, it was possible to identify continuously productive reefs and reefs where production had fallen, and subsequently produce approximate estimates of the extent of reef decline in each of the five key areas. Fished areas were relatively unchanged in Block 13 (10% decline – mostly Recherche Bay), while areas lost to fishing in the east and north-east (Block 28, Block 30) were as high as 90%. Reefs in the northern part of Block 23 were no longer productive, but the remaining 90% of reefs elsewhere in the
Abalone Fishery Assessment: 2011
Page 88
block were still fished, while in Block 14, mostly in the vicinity of the southern D’Entrecasteaux Channel, productive reef area had declined by 50%.
To assuage doubts about the validity of these estimates, we compared levels of fishing effort through time in each block (current compared with peak years). We found comparable declines in effort in Blocks 13, 28 and 30, but greater declines in Block 14, and Block 23. It was considered likely that losses of productive reef in the last two blocks were underestimated because current divers could fish these areas at low cost and had heightened perceptions of recent productivity.
Associated with depletion, there have been persistent reports from divers concerning changes to reef habitat. These changes appeared to follow extensive depletion of abalone populations by fishing, suggesting a level of interdependency between abalone and habitat. They included the reduction in coverage of crustose coralline algae and its subsequent replacement by sediment, other encrusting organisms and algae. Globally, over-harvesting of herbivores is recognised as one of the main factors contributing to changes in marine systems (Burkepile and Hay, 2006). In abalone fisheries, these changes implied a reduction of habitat type associated with juvenile abalone recruitment (McShane and Smith, 1988; Shepherd and Turner, 1985).
Field surveys were conducted at reefs with a history of abalone production in each region. A quantitative survey of benthic organisms on reefs with contrasting levels of abalone abundance was conducted, and a correlative approach was used to investigate interactions between benthic organisms and abalone to detect effects of fishing on reef communities.
In all regions there were positive correlations between abalone abundance and crustose coralline algae, while understory algae and abundance were negatively correlated. However, these associations were only weakly significant (α=0.05, r P
2P=P
P0.02-0.30),
implying that abalone abundance explained only a small proportion of the variability in their distribution and abundance. In addition, there were isolated and inconsistent associations between abalone abundance and other understorey groups (sessile invertebrates, canopy-forming algae recruits). Typically, regional differences in community structure were more strongly correlated than abalone density. While not experimentally tested it was apparent that physical characteristics (exposure, reef structure, orientation) played a much greater role in determining community structure than the activities of abalone.
In summary, abalone played a relatively minor role in structuring habitat on reefs fished by abalone divers. As a consequence, it is unlikely that the observed reef-scale changes to habitat on reefs have occurred as a consequence of depletion of abalone stocks. It also means that loss of juvenile abalone habitat (crustose coralline algae habitat) does not necessarily occur following over-fishing.

Abalone Fishery Assessment: 2011
Page 89
Appendix 10: History of Management Changes
This history has been compiled from a number of sources, principal among which has been DPIW’s Abalone Management Plans.
1962 Minimum size limit (MSL) of 5 inches (127 mm) minimum shell diameter introduced.
1964 MSL increased to 6 inches (152 mm).
1965 MSL reduced to 5 inches.
Introduction of commercial abalone diving licenses.
All abalone to be landed live (no processing at sea).
Skippers of boats engaged in abalone fishing required to lodge monthly fish returns as part of their license conditions.
1966 Abalone processing factories required to record the number of persons from whom abalone were bought.
1967 Abalone divers required to carry a measuring device to measure the abalone before taking them.
Special penalty introduced for possession of undersized abalone at $1 per fish.
Abalone to be sold in live condition to registered processors only.
1968 Abalone catch returns were introduced. These recorded daily catches and effort by reporting block, and were lodged monthly by the skipper (not necessarily a diver) of an abalone fishing vessel. More than one diver’s catch could be reported on a return. These returns replaced the general fish return on which earlier catches were reported.
1969 License limitation introduced. Rapid expansion of the fishery led to this first attempt to control effort. Only divers fishing the previous year were licensed to fish in 1969. This figure (120 divers) was maintained in subsequent years.
1971 Only licensed divers allowed to dive from a boat engaged in abalone fishing.
Unusually prolonged calm sea conditions and warm water were associated with a widespread die-off of abalone and rock lobster between the Arthur River and Granville Harbour. Substantial quantities of both species were reported killed.
1972 License transfer from a retiring diver to his nominee allowable on grounds of health problems.
Annual license fees calculated as 1.5% of the mean of the previous three years value of annual production.
An additional five licenses were issued to divers living in the Furneaux Group. These divers were restricted to fishing the Furneaux Group, but the other 120 divers were not prevented from fishing there.
Penalties for breaches of regulations in relation to abalone fishing increased.
Permit to transfer licenses between divers revoked.

Abalone Fishery Assessment: 2011
Page 90
1974 License transfer from a retiring diver to his nominee permitted.
Computerised catch records started from July 1974.
1979 Penalties for breaches of regulations in relation to abalone fishing increased, with special penalties rising to $2 per fish.
Identification cards for divers introduced.
1982 Penalties for breaches of regulations in relation to abalone fishing increased, with special penalties rising to $10 per fish.
Catch restricted by marketing crisis: processors limit divers to 24 tonnes pa.
1983 Penalties for breaches of regulations in relation to abalone fishing increased.
Easing of market difficulties sees lifting of processor applied catch restrictions.
1985 Individual transferable quota (ITQ) and a total allowable catch (TAC) were introduced. Each of the 120 general license divers were allocated 28 units of quota, the Furneaux Group divers 20 units: therefore there were 3460 units. For 1985, the quota unit was set at 1100 kg i.e. the TAC was 3806 tonnes. –
This amount was derived from an estimate of average catches, with a 10% bonus granted by the Minister to compensate for any financial difficulties caused by the new system.
License fees were increased to 2.5% of the value of the annual landed catch, for each quota unit held.
Quota unit transfers between Furneaux divers and non-Furneaux divers were prohibited.
The 120 Tasmanian mainland divers were prohibited from diving in the Furneaux group.
Divers were required to own at least 16 units, but could accumulate no more than 80.
The catch (kg) per quota unit was determined by the Liaison Committee based upon advice from the government researchers.
Catch dockets recording the catch weight landed by individual divers were introduced.
1986 Annual license fees set at 5% of value of annual landed catch.
The catch per ITQ was reduced to 1000 kg (9% reduction) i.e. TAC was 3460 tonnes.
1987 MSL increased to 132 mm from 127 mm.
The catch per ITQ was reduced to 950 kg (5% reduction) i.e. TAC was 3287 tonnes.
1988 The catch per ITQ was reduced to 855 kg (5% reduction) i.e. TAC was 2958.3 tonnes.
The minimum legal weight for abalone meats was set at 90 g.
1989 The catch per ITQ was reduced to 600 kg (30% reduction) i.e. TAC was

Abalone Fishery Assessment: 2011
Page 91
2076 tonnes.
A fishery for abalone in Bass Strait was held in April, with a MSL of 110 mm and a maximum size limit of 132 mm. Each diver was limited to 2.4 tonnes, with 198 tonnes caught. The fishery was free of fees, and while only licensed abalone divers could participate, was held to be distinct from the Tasmanian abalone fishery (hence the maximum size limit).
The minimum meat weight regulation of 90g was amended to apply only to blacklip abalone.
1990 MSL for blacklip abalone on south and west coasts between the Wild Wave River (north of Sandy Cape) and Whale Head increased to 140 mm.
MSL for greenlip in Furneaux Group waters increased to 140 mm.
Furneaux Group boundary removed. The Furneaux Group divers were issued with an extra 8 units each, which could only be fished by the divers themselves and were not transferable. This increased the number of units in the fishery to 3500, and the TAC to 2100 tonnes.
1991 A fishery for abalone in Bass Strait was held in May, with a MSL of 118 mm. The TAC was 110 tonnes, with a fee of $1.40 per kg of quota.
The license system was restructured: the diving entitlement was uncoupled from the entitlement to hold quota units and the lower and upper limits on the amount of units held was abolished.
1992 Minimum meat weight for greenlip was set at 70 g.
Development of DPIF's compliance catch database (SEALSPROD) that enabled auditing of catch from vessel to factory.
1993 A fishery for abalone in Bass Strait was held in May and June, with a MSL of 110 mm. The TAC was 100 tonnes, with a fee of $5.00 per kg of quota.
Minimum meat weight regulation amended to 90g for all abalone other than greenlip.
Penalties reviewed and significantly increased, with the option of prison terms for serious and repeat offenders. Special penalties increased to $50 per fish.
1994 Quota owners were given the choice of continuing with their annual abalone licenses or entering into a Deed of Agreement that applied for 10 years with the right of renewal for perpetuity. 90% of owners chose the Deed of Agreement.
The Deed of Agreement set a fee structure that included both management costs and return to the community, based upon an increasing (but non-linear) proportion of beach price. At $6/kg, no fees were payable, at $35/kg fees were 10% at and at $200/kg, fees were 33% of beach price.
1995 A fishery for abalone in Bass Strait was held in May and June, with a MSL of 110 mm. Only 12 commercial divers (i.e. non-abalone) participated. While the TAC was 100 tonnes, only 21 tonnes was taken. The fee was $10.00 per kg of quota.
Another Bass Strait fishery was held in November, with both abalone and

Abalone Fishery Assessment: 2011
Page 92
commercial divers participating. The MSL was 100 mm, and the TAC was set at 140 tonnes, with a fee of $10/kg. Only 106 tonnes was taken before the fishery was closed. It was maintained by divers that a very high proportion of the fishable biomass had been taken, and that continuing the fishery could affect the sustainability of stocks.
1996 The Living Marine Resources Management Act 1995 was introduced.
Trigger points were introduced by DPIF to initiate a management response if catch and catch rates changed by a pre-determined quantity with respect to those from two earlier reference periods.
1997 The TAC was increased to 2520 tonnes (720 kg per quota unit).
Difference in beach price between east coast and west coast blacklip first appears – is initially $2.00.
1998 The first abalone Fishery Management Plan was introduced. Among changes that it introduced were catch monitoring, which included:
1. Pre-fishing reporting by divers, 2. Post-fishing reporting of catch by divers and processors, 3. Processors required to maintain a daily balance of stock in, stock out
and stock on hand, 4. Processors to report prior to movement of stock out and on receipt of
stock, 5. Reports to be made by telephone, where information was immediately
available to Compliance Audit Unit and Tasmania Police.
For several years, greenlip abalone had attracted premium beach prices, causing a diversion of effort to that species. To enhance protection, a number of management changes were made:
• For management purposes, the greenlip fishery was subdivided into two regions: the Furneaux Group and the remainder (North West, North East and King Island)
• MSL was raised to 140 mm state-wide (except the North West, which was left at 132 mm),
• The annual catch for the Furneaux Group was capped at 42 t based on estimates of sustainable yield. This cap was managed monthly, so that where more than one twelfth of the annual cap (3.5 t) was taken in any month, the Minister could close the fishery until the next month.
Within the Furneaux Group, several other rules were introduced to reduce effort:
• Divers could only work two days per week. Originally, the days were fixed, but because this forced divers to work in often hazardous conditions, divers were allowed to nominate which two days they could work.
• A 200 kg/day bag limit was introduced, as was a 200 kg/day landing limit. This effectively meant that catch was not held on motherships overnight.
• These rules were repealed in 1999. • The greenlip catch from the remainder of the State was to be limited

Abalone Fishery Assessment: 2011
Page 93
to 106 tonnes. • Because the Department was unable to monitor catch closely enough,
the monthly Furneaux Group catch usually overran its limit, and the fishery there was closed in August when the regional cap was met. The greenlip cap in the rest of the State was also overrun.
Vessels over 10 m landing abalone at Smithton or Stanley had to make a prior report to the CAU reporting service so that Tasmania Police could inspect their catch.
Fixed trigger points were abandoned as an assessment strategy as rising catch and catch rates indiscriminately fired triggers. Assessments have since used catch and catch rate trends to monitor stock levels.
A new compliance catch database (LMM/QMS) introduced by DPIWE
1999 MSL for greenlip raised to 140 mm in North West, and 150 mm for the remainder. This applied to the commercial fishery only, the MSL for recreational fishers remaining at 140 mm.
The greenlip fishery was divided into east (Furneaux Group and North East) and west (King Island and North Wes t) with quarterly caps of 17 tonnes and 20 tonnes respectively. Overrun of caps led to a closure of the greenlip fishery in October.
Within the Furneaux Group, Block 35 was closed to fishing between 1 October and 31 March to protect spawning abalone.
2000 The blacklip fishery was divided into two East and West management zones with boundaries at Whale Head and Port Sorell. The greenlip fishery was managed separately. Eastern blacklip units were set at 340 kg (TAC 1190 t), Western units at 400 kg (1400 t) and greenlip units at 40 kg (140 t), with a TAC for the whole fishery of 2730 tonnes.
Size limits for blacklip abalone remained unchanged. The zone boundaries meant that the Western Zone had a size limit of 140 mm from Whale Head to the Wild Wave River and 132 mm from there to Port Sorell.
Following egg-per-recruit studies by researchers, MSL for King Island greenlip was raised to 155 mm, 140 mm for North West and 145 for both the North East and the Furneaux Group.
The Block 35 (Franklin Sound - Furneaux Group) greenlip catch was capped at 20 tonnes.
Catch were reported on a smaller spatial scale with the introduction of sub-blocks state-wide.
Owners of fishing license (abalone dive) were allowed to hold more than one license and allow others to dive those licenses as supervisors.
2001 The Northern Zone (between Arthur River in the west and Musselroe Point in the east) for blacklip abalone was established, with a MSL of 127 mm except between Woolnorth Point and the Arthur River, where 132 mm prevailed. Catch per unit was 80 kg, with a TAC of 280 t. Because the Northern Zone covered coast that was previously included in the two other blacklip zones, catch for those zones was proportionally reduced, with a further allowance

Abalone Fishery Assessment: 2011
Page 94
for declining Eastern Zone stocks. The TAC for the West was set at 1260 t (360kg/unit), and the East at 1120 t (320 kg/unit). The greenlip TAC remained at 140 tonnes, so production from the entire fishery was 2800 t, or 800 kg/unit.
In association with establishment of Northern Zone, research monitoring areas were set aside at the Inner Sister, Swan Island, Waterwitch Reef, and the Doughboys.
MSL’s for recreational divers were changed to 132 mm for blacklip state-wide, and 145 mm for greenlip in all areas except the North West, which remained at 140 mm.
The regional catch for the greenlip fishery was limited in three of the main regions. The North West catch was capped at 40 t, the North East at 30 t, while the Furneaux Group catch remained fixed at 42 t. Catch from King Island and the Bass Strait islands (Kent, Curtis, Hogan Groups) was not capped.
2002 MSL for Eastern Zone was increased to 136 mm.
MSL for greenlip on King Island was reduced to 150 mm.
MSL for greenlip in the North West was increased to 145 mm.
Eastern Zone TAC reduced to 857.5 t (245 kg/unit).
Western Zone TAC remained 1260 t (360 kg/unit)
Northern Zone TAC remained 280 t (80 kg/unit)
Greenlip TAC remained 140 t (40 kg/unit)
Production for the whole fishery was set at 2537.5 t (725 kg/unit).
Catch from the Actaeons (sub-blocks 13C, D and E) was capped at 350 t, managed firstly as a half-yearly cap, then quarterly. The fishery there was closed in September and then mid-October when those caps were reached.
2003 A Bass Strait blacklip zone (TAC 70 tonnes (20kg/unit), MSL of 114 mm) was created within the Northern Zone in central Bass Strait and part of the Furneaux Group. Its purpose was to enable the catching of abalone smaller than allowed by the Northern Zone size limit. The Bass Strait Boundaries were set at Cowrie Point in the west and Anderson Bay in the east. The Flinders Island boundaries were on an unnamed point north of Settlement Point on the western side of the island (40°00’36.32”) and Foochow Inlet on the east.
Eastern Zone TAC remained 857.5 t (245 kg/unit).
Western Zone TAC remained 1260 t (360 kg/unit)
Northern Zone TAC remained 280 t (80 kg/unit)
Greenlip TAC remained 140 t (40 kg/unit)
Bass Strait Zone TAC set at 70 t (20 kg/unit)
Fishery production was set at 2607.5 t (745 kg/unit) state-wide.
Blacklip catch from Block 5 (Northern Zone) was capped at 100 t.

Abalone Fishery Assessment: 2011
Page 95
MSL for Western Zone between the Wild Wave River and Arthur River was increased to 136 mm from 132 mm.
Abalone taken from Western Zone subject to upper size limit of 160 mm by canners and live market buyers. Note that this was not rigidly enforced and market sampling showed most samples contained many abalone over this size.
2004 Eastern Zone TAC reduced to 770 t (220 kg/unit)
Western Zone TAC remained 1260 t (360 kg/unit)
Northern Zone TAC remained 280 t (80 kg/unit)
Greenlip TAC reduced to 129.5 t (37 kg/unit)
Bass Strait Zone TAC remained 70 t (20 kg/unit)
Fishery production was set at 2509.5 t (717 kg/unit) state-wide.
The greenlip TAC reduction affected the North West only, where the annual cap was reduced by 10 t to 30 t.
October-March closure for Franklin Sound greenlip fishery abolished. Block 35 cap reduced from 20 t to 15 t.
2005 Eastern Zone TAC remained 770 t (220 kg/unit)
Western Zone TAC remained 1260 t (360 kg/unit)
Northern Zone TAC remained 280 t (80 kg/unit)
Greenlip TAC reduced to 122.5 t (35 kg/unit)
Bass Strait Zone TAC remained 70 t (20 kg/unit)
Fishery production was set at 2502.5 t (715 kg/unit) state-wide.
The greenlip TAC reduction affected the North East only, where the annual cap was reduced by 7 t to 23 t.
Team diving (sharing catch from one quota unit by two divers) was introduced to legitimise the practise of divers catching abalone for others when they held no quota to which their catch could be assigned. Team dive dockets were submitted by teams, but not computerised.
High grading (discarding large abalone in the catch from the deck) prohibited.
Caufing prohibited.
Introduction of cancellation reports where a prior reported trip is cancelled.
Introduction of single (blacklip) zone fishing provisions.
Overcatch provisions introduced to cover unintentional underestimation of catch weight.
In Victoria in December, ganglioneuritis detected on two land-based (Portland and Port Fairy) and two offshore (Westernport) aquaculture sites.
2006 Eastern Zone TAC remained 770 t (220 kg/unit)
Western Zone TAC remained 1260 t (360 kg/unit)

Abalone Fishery Assessment: 2011
Page 96
Northern Zone TAC remained 280 t (80 kg/unit)
Greenlip TAC remained 122.5 t (35 kg/unit)
Bass Strait Zone TAC remained 70 t (20 kg/unit)
Fishery production was set at 2502.5 t (715 kg/unit) state-wide.
On 1 January 2006, interim reduction in MSL for Perkins Bay greenlip area (Blocks 47, 48A), from 145 mm to 140 mm.
On 20 September 2006, MSL for Bass Strait Zone in Blocks 41-46 (North Coast) reduced from 114 mm to 110 mm.
On 1 November 2006, MSL for Eastern Zone was increased to 138 mm from 136 mm. MSL for greenlip abalone in Perkins Bay was reduced to 132 mm from 140 mm.
As a temporary measure to facilitate research, Block 30 was entirely closed to commercial abalone fishing and partially closed (except sub-block 30A) to recreational abalone fishing. The bag limit for recreational fishers in sub-block 30A reduced to 5 abalone per day.
May 2006: Victorian ganglioneuritis (AVG) outbreaks reported from wild stocks adjacent to land-based aquaculture site at Port Fairey. As a precautionary measure, the Tasmanian wild fishery in Bass Strait closest to the Victorian coast was closed to abalone fishing, from 16 August 2006, initially for three months but then extended to 28 February 2007. The closure was for waters within latitudes 39º 12' S and 39 º 33' S, and longitudes 146 º to 147 º 35' (Blocks 51 to 56, and part of Block 57, including Wright Rock and Endeavour Reef). The taking of abalone in Tasmanian waters from vessels used in the Victorian fishery was prohibited, and the transfer by sea of abalone from King Island to the Tasmanian mainland was prohibited.
2007 Eastern Zone TAC remained 770 t (220 kg/unit)
Western Zone TAC remained 1260 t (360 kg/unit)
Northern Zone TAC remained 280 t (80 kg/unit)
Greenlip TAC remained 122.5 t (35 kg/unit)
Bass Strait Zone TAC remained 70 t (20 kg/unit)
Fishery production was set at 2502.5 t (715 kg/unit) state-wide. However, it was agreed that the Bass Strait component (70 t) would not be caught due to concerns about disease outbreaks (AVG) in abalone stocks in adjacent Victorian waters.
In October 2007, it was agreed that the cap for the southern part of the Actaeons (Sub-blocks 13C, 13D and 13E) would be reduced from 350 t to 266 t, and that a cap of 245 t be implemented for the South Coast (Sub-blocks 12B, 12C, 12D, 13A and 13B).
2008 Eastern Zone TAC increased to 808.5 t (231 kg/unit)
Western Zone TAC remained 1260 t (360 kg/unit)

Abalone Fishery Assessment: 2011
Page 97
Northern Zone TAC increased to 332.5 t (95 kg/unit)
Greenlip TAC remained 122.5 t (35 kg/unit)
Bass Strait Zone TAC remained 70 t (20 kg/unit)
The total catch state-wide was set at 2,593.5 t, or 741 kg/unit.
As part of a controlled trial in the North West, size limits in Block 5 and part of Block 6 were reduced for divers meeting defined operating requirements on the basis that there were large stocks of abalone too small to catch at the larger size limit, and that removing these smaller abalone would promote growth among the remaining fish. The MSL in the Northern Zone part of Block 5 (5A, 5B and 5C) was reduced from 132 mm to 127 mm, and in sub-blocks 5D, 6A, 6B and 6C, from 136 mm to 132 mm. To promote fishing in the Northern Zone part of Block 5, the cap was increased from 100 t to 152.5 t and the Northern Zone TAC increased to 332.5 t. The remainder of the Northern Zone was capped at 180 t.
In Bass Strait, south of 39° 33’, the Bass Strait Zone was reopened to fishing on 1 January 2008. North of this line, all islands in the Bass Strait Zone remained closed to fishing as part of measures to reduce the spread of AVG from Victoria. The closed area included the Kent, Hogan and Curtis Groups. It was reopened to fishing on 6 July 2008.
Fears of an outbreak of AVG resulted in the closure of the Lower Channel (sub-blocks 14A, 14B, 14C and 14D) to abalone fishing between 16 September 2008 and 12 March 2009. The area was reopened after extensive sampling and testing failed to find diseased abalone.
Actaeons (Blocks 13C, 13D, 13E) closed to fishing for the remainder of the year from 21 October because the 266 t catch limit had been reached (340 t).
South Coast closed to fishing on 29 October because the 245 t catch limit had been reached (332 t).
2009 Eastern Zone TAC increased to 850.5 t (243 kg/unit)
Western Zone TAC reduced to 924 t (264 kg/unit)
Central Western Zone established at 304.5 t (87 kg/unit)
Northern Zone TAC remained 332.5 t (95 kg/unit)
Greenlip TAC remained 122.5 t (35 kg/unit)
Bass Strait Zone TAC remained 70 t (20 kg/unit)
The total catch state-wide was set at 2,604 t, or 744 kg/unit.
A new zone was created on the west coast to transfer catch from the South West further north. The Central Western Zone covers Blocks 6, 7 and 8. The Western Zone was correspondingly reduced to Blocks 9, 10, 11, 12, 13A and 13B.
Blocks 7 and 8 were closed to fishing on 13 July because the 108 t cap had been reached (155 t).
The North West greenlip region (cap 30 t) was closed to fishing on 1 August after the 20 t Perkins Bay cap was reached (20.1 t). The region’s catch was

Abalone Fishery Assessment: 2011
Page 98
33.9 t.
The North East greenlip region was closed to fishing on 19 October because the 23 t cap had been reached (35 t).
The Actaeons were closed to fishing on 1 November, because the 340 t cap had been reached (341 t).
The South Coast (cap 300 t) was closed to fishing on 1 November with the catch at 321 t.
The Block 5 (cap 152 t) was closed to fishing on 5 December with the catch at 172 t.
2010 Eastern Zone TAC increased to 896 t (256 kg/unit)
Western Zone TAC remained 924 t (264 kg/unit)
Central Western Zone remained 304.5 t (87 kg/unit)
Northern Zone TAC remained 332.5 t (95 kg/unit)
Greenlip TAC increased to 133 t (38 kg/unit)
Bass Strait Zone TAC remained 70 t (20 kg/unit)
The total catch state-wide was set at 2,660 t, or 760 kg/unit.
In September 2010, the size limit for greenlip caught between Andersons Bay (Block 41) and Cowrie Point (Block 46) was reduced from 145mm to 132mm, in line with Blocks 47 and 48A (Perkins Bay/Black Reef) .
The size limit for Eastern Zone blacklip caught in Block 31A north of Cod Bay and Georges Rocks (latitude 40º54'53"S) was reduced from 138 mm to 132 mm while fishing under permit. This was a temporary measure between July and October to encourage fishing there. Block 31A was closed to fishing on 4 October after 50 t of abalone had been caught, but was subsequently reopened in December 2010 (at 138 mm) to ease pressure across the remainder of the fishery.
Furneaux Group blacklip closed 9 August, capped at 35 t (49 t caught).
The Actaeons closed 13 September capped at 340 t cap (342 t).
Block 22 closed 13 October when the 60 t cap was almost reached (55 t). It was reopened in December to ease pressure on the reminder of the fishery.
Blocks 7, 8 and 6D closed 20 October capped at 150 t (171 t).
North East greenlip closed 1 November, capped at 23 t (25 t).
North West greenlip closed 13 November, capped at 18 t (23t).
Perkins Bay greenlip closed 13 November, capped at 20 t (20t).
All the Northern Zone except Block 5 closed 22 November capped at 180 t (191 t caught).
South Coast closed 13 December capped at 300 t (311 t).
King Island greenlip closed on 13 December, cap 30 t (32 t).
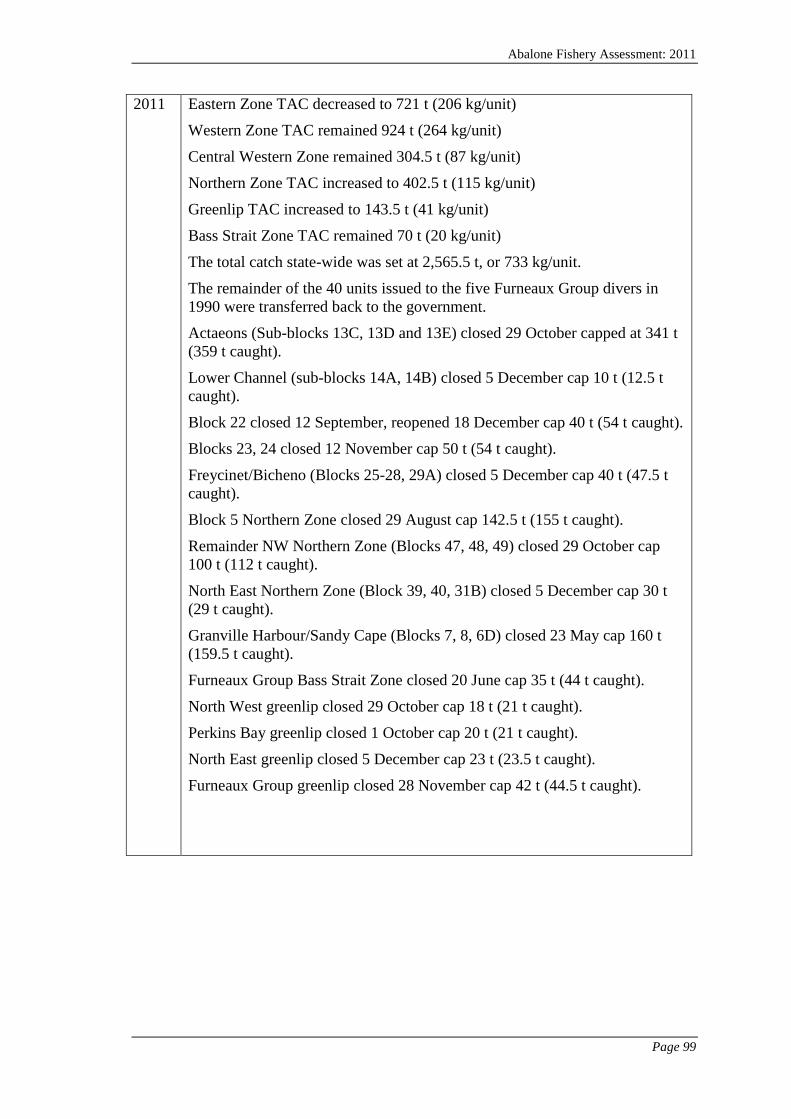
Abalone Fishery Assessment: 2011
Page 99
2011 Eastern Zone TAC decreased to 721 t (206 kg/unit)
Western Zone TAC remained 924 t (264 kg/unit)
Central Western Zone remained 304.5 t (87 kg/unit)
Northern Zone TAC increased to 402.5 t (115 kg/unit)
Greenlip TAC increased to 143.5 t (41 kg/unit)
Bass Strait Zone TAC remained 70 t (20 kg/unit)
The total catch state-wide was set at 2,565.5 t, or 733 kg/unit.
The remainder of the 40 units issued to the five Furneaux Group divers in 1990 were transferred back to the government.
Actaeons (Sub-blocks 13C, 13D and 13E) closed 29 October capped at 341 t (359 t caught).
Lower Channel (sub-blocks 14A, 14B) closed 5 December cap 10 t (12.5 t caught).
Block 22 closed 12 September, reopened 18 December cap 40 t (54 t caught).
Blocks 23, 24 closed 12 November cap 50 t (54 t caught).
Freycinet/Bicheno (Blocks 25-28, 29A) closed 5 December cap 40 t (47.5 t caught).
Block 5 Northern Zone closed 29 August cap 142.5 t (155 t caught).
Remainder NW Northern Zone (Blocks 47, 48, 49) closed 29 October cap 100 t (112 t caught).
North East Northern Zone (Block 39, 40, 31B) closed 5 December cap 30 t (29 t caught).
Granville Harbour/Sandy Cape (Blocks 7, 8, 6D) closed 23 May cap 160 t (159.5 t caught).
Furneaux Group Bass Strait Zone closed 20 June cap 35 t (44 t caught).
North West greenlip closed 29 October cap 18 t (21 t caught).
Perkins Bay greenlip closed 1 October cap 20 t (21 t caught).
North East greenlip closed 5 December cap 23 t (23.5 t caught).
Furneaux Group greenlip closed 28 November cap 42 t (44.5 t caught).

Abalone Fishery Assessment: 2011
Page 100
Appendix 11: Maps of catch-reporting blocks and sub-blocks
It is not intended that these maps be used for any purpose other than identifying the position of sub-blocks mentioned in this report.
Map1: King Island
10 Kilometers
20 0
1B
2A
Whistler Point
Cuvier Pt Light
Fraser Beach
Cumberland Light
Grassy Harbour Cataraqui Point
Ettrick River
King Island Airport
Lavinia Point
Sea Elephant Lagoon
Yellow Rock Beach Nth 1A
1C 2C
2B
4A
4C
4B
3A
3C
3B
49A 49B
Middle Point
Cape Wickham
Y ll B h

Abalone Fishery Assessment: 2011
Page 101
Map 2: North West Tasmania
Map 3: Central West Coast (north)
20
kilometres
100
49A
Arthur River
Studland Bay Beach
Woolnorth Point
Cuvier Pt LightYellow Beach
5A
5C
6A
48A
48B48C
49C
49B
5D
47B 47A46
45
44
5B
6B
6C
Arthur Beach South
Chambers Bay
Cowrie Point
Heybridge
N
Duck River
Renard Point
Wild Wave River
Richardson Point
Three Mile Sand Beach
Guyton PointLittle Creek
Harcus Island Highfield Point
High Rock
10
Kilometers
200
Wild Wave River
9A
Granville Harbour
Italian River
Ocean Beach
Henty River
Tasman River
Cape Sorell
Newdegate Creek
Pieman River
Richardson Point
High Rock
9B
8C
8A
8B
6D
7A
7C
6B
6C
7B
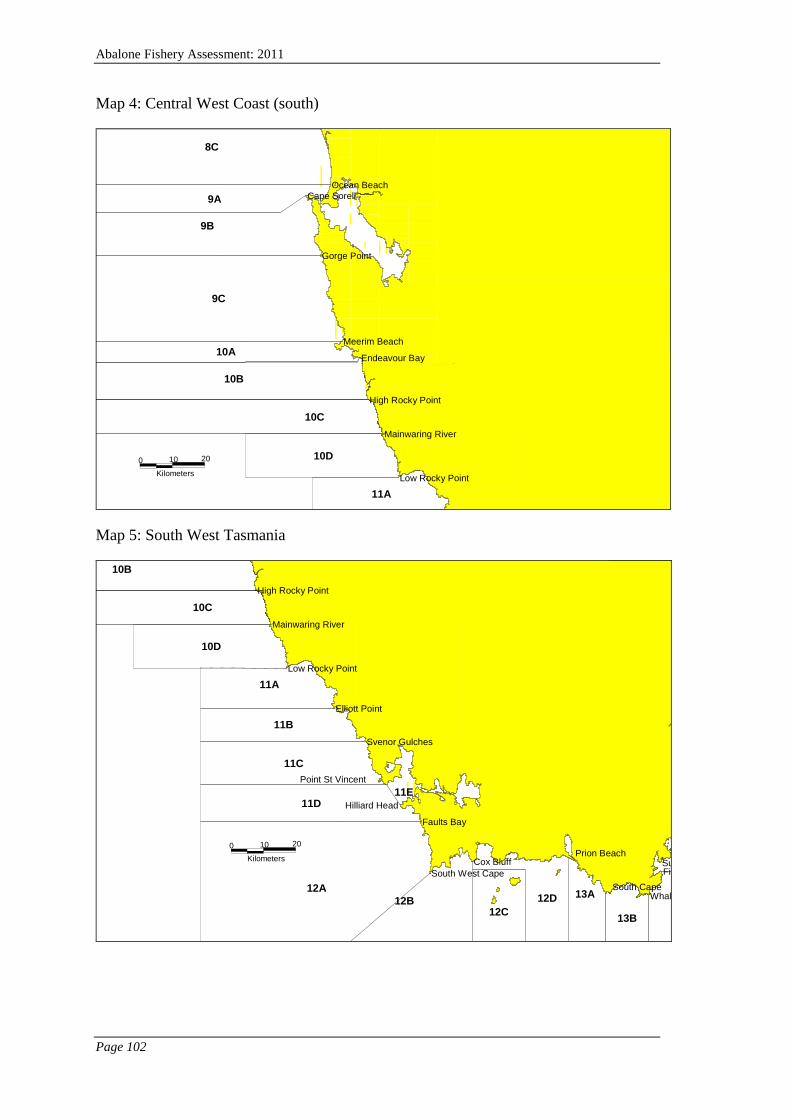
Abalone Fishery Assessment: 2011
Page 102
Map 4: Central West Coast (south)
0 10 Kilometers
20
9A
10D
10C
10B
11A
10A
9C
9B
8C
Low Rocky Point
Meerim Beach
Ocean Beach Cape Sorell
Gorge Point
Endeavour Bay
High Rocky Point
Mainwaring River
Map 5: South West Tasmania
Kilometers 10 20 0
11E
11C
11B
11D
10D
10C
12B 13B 12C
10B
11A
12D 13A 12A
Faults Bay
Low Rocky Point
High Rocky Point
Mainwaring River
Elliott Point
Svenor Gulches
Point St Vincent Hilliard Head
South West Cape Cox Bluff
Whal South Cape Fis Su Prion Beach

Abalone Fishery Assessment: 2011
Page 103
Map 6: South East Tasmania
10 Kilometers
20 0 13D 13E
16D
18 17A
16C 15
17B 22C
Big Lagoon Beach
Burnett Pt
Fishers Pt Whale Head
Middle Lagoon Bay Beach
Eaglehawk Neck Deep Glen Bay
Cape Pillar Budget Head The Lanterns
Dennes Pt Piersons Pt
Trumpeter Bay Salters Pt
Middle Neck Beach
North Mangana Bluff Boreel Head
Standup Pt
Blubber Head 16B
13B 13C
21B
14D 14A 14C
16A 14E
14B
19A 19B
21A 21C
20A
20C 20B
23B
23A
22B
22A
Lobster Pt
Mays Creek
Outer North Head
Cape Raoul
South Arm Neck
Middle Whitebeach
Hopwood Pt Light
West Cloudy Head
South Cape
Sullivan Pt
Seven Mile Beach Denison Canal Bridge
Cremorne
Map 7: Lower East Coast
10 Kilometers
20 0
24A
26B
27A
Point Bagot Wineglass Bay Beach
Friendly Beaches Sth
Cape Bougainville
Middle Riedle Bay Eagles Beach
Peggys Point
Passage Rock Passage Pt
South Hazard Beach
Sandstone Bluff Seaford Point
Isaacs Point
Middle Lagoon Bay Beach son Canal Bridge
25
24E
24D 24C
23B
23A A 19B
24B
28A
27E
27D
27C 26D
26A
27B
26C
Cape Peron
Marine Reserve Boundary Return Point
Seven Mile Beach
Cape Sonnerat
Rheban Boat Ramp

Abalone Fishery Assessment: 2011
Page 104
Map 8: Upper East Coast
10 Kilometers
20 0 30A
St Helens Point
Peggys Point
Douglas River Long Point (Seymour)
Middle Templestowe Beach
Ironhouse Point
Scamander River
Taylors Beach south Gardens Lagoon Beach
Eddystone Point
29D
31A
30B
30C
28B
28A
29C
28C 29A 29B
Map 9: North East Tasmania
20100kilometres
Musselroe Point
30C
31A
31B39A
40A
40B
40C
44
29D
39B
4142
43
30B
30A
Northdown Beach
Petal Pt Little Musselroe Bay
Eddystone PointFannys Bay
St Helens Point
Three Mile Bluff
Tomahawk Beach
Waterhouse Beach Sth
Gardens Lagoon Beach
Taylors Beach south
Scamander River
Ironhouse Point
Waterhouse PtCroppies Pt
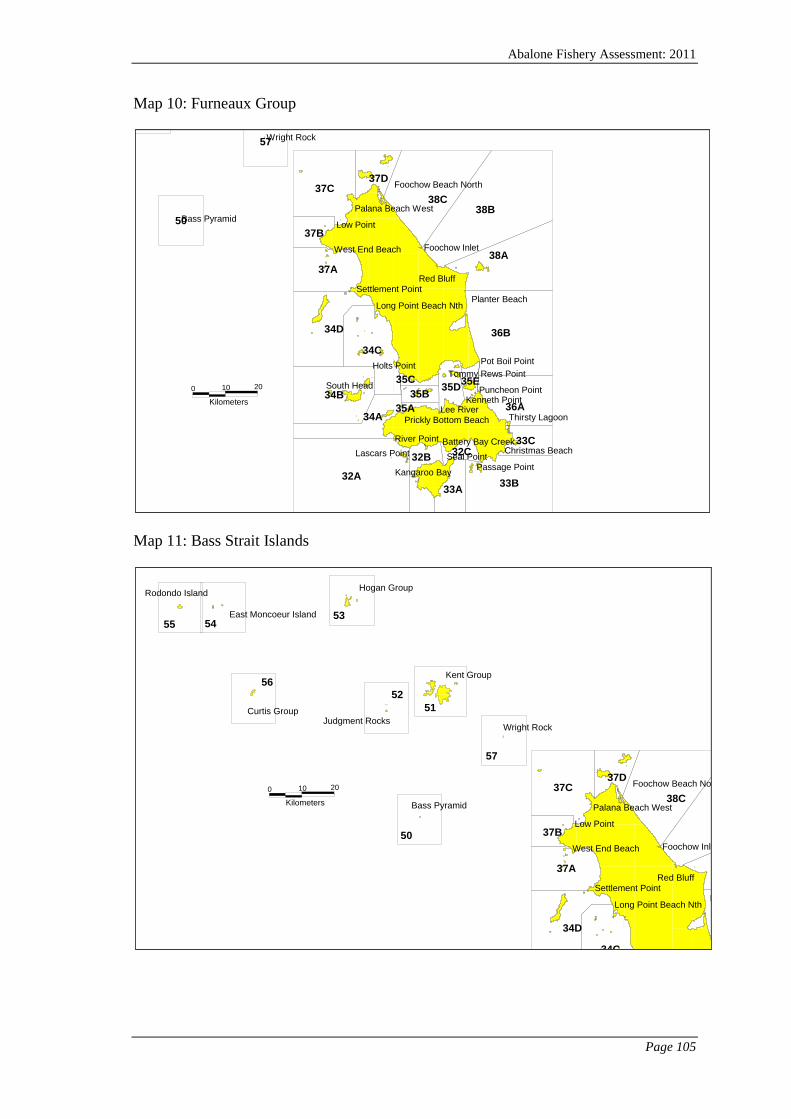
Abalone Fishery Assessment: 2011
Page 105
Map 10: Furneaux Group
Map 11: Bass Strait Islands
10
Kilometers
200
32B
33A
36A
35E
Christmas Beach
Passage PointSeal Point
Kangaroo Bay
Lascars Point
Thirsty Lagoon
Tommy Rews PointHolts Point
South Head
Settlement PointRed Bluff
Planter Beach
Lee RiverPrickly Bottom Beach
Foochow Beach North
Palana Beach West
36B
35B35C
35A
35D
32C
32A
34B
34A
38C
38A
38B
37D37C
37A
37B
34D
34C
33C
33B
57
50Bass Pyramid
Pot Boil Point
Puncheon Point
River Point
Wright Rock
West End Beach
Low Point
Foochow Inlet
Long Point Beach Nth
Kenneth Point
Battery Bay Creek
10
Kilometers
200
545553
50
57
5256
51
East Moncoeur Island
Rodondo Island Hogan Group
Bass Pyramid
Wright RockJudgment Rocks
Curtis Group
Kent Group
Settlement PointRed Bluff
P
Foochow Beach No
Palana Beach West38C
37D37C
37A
37B
34D
34C
West End Beach
Low Point
Foochow Inl
Long Point Beach Nth

Abalone Fishery Assessment: 2011
Page 106
Appendix 12: Application of the “two-year rule” to the blacklip abalone fishery, 2011
In the blacklip fishery, management policy specifies that size-limits allow abalone to have had at least two breeding seasons before they reach legal size. This policy is known as the “two-year rule”. Biological information from field studies is used to determine the average size to which abalone grow in the two years following maturation. The map below shows how well size limits match the application of the policy to blacklip populations, grouped by reporting block. The map may change from year to year as new biological information becomes available, or size limits change.
Colours between orange and red show that the estimated size at maturity plus two years growth (SAM+2) is greater than the 2011 size limit operating in a particular block, and by how much (in millimetres). Blocks shaded orange to red means that the size limit is too low to meet the policy. In blocks shaded yellow, SAM+2 is within 2 mm (+/-) of

Abalone Fishery Assessment: 2011
Page 107
the size limit and the size-limit policy is approximately met. Blocks shaded green show where SAM+2 is less than the size limit, Blocks with no colour indicate no information is available.
Growth rates, maximum size and median size at maturity are highly variable among abalone populations around Tasmania’s coast. Generally, abalone in the north grow slower and to a smaller maximum size, and become sexually mature at a smaller size than abalone in the south. There are exceptions, and in the south there are places with significant populations of smaller abalone, while in the north there are places where abalone grow larger and faster than those around them.
On a smaller scale, within each region, there is also variation in growth and maturity between populations. This occurs particularly in the North East in Block 31 and in the North West, in Block 6, where there are large differences in growth over small distances. In other areas, Block 22 (Tasman Peninsula) and the Western Zone part of Block 13 exhibit greater variation than surrounding blocks. It is impractical to develop size limits that accommodate all the combinations of growth and size at maturity exhibited by populations within a region, so managers aim to achieve the best fit, where the average of SAM+2 meets the management policy.
Abalone populations around the coast are regularly sampled by IMAS for the purpose of estimating their median size at maturity. In addition, abalone growth is measured through tagging programs at key parts of the fishery. These maturity and growth studies are ongoing, have been in place since the late 1980’s, and useful information from approximately 500 maturity samples and over 40 growth studies is available.
Acquiring biological information is difficult and costly, and while there is substantial knowledge of abalone populations in some regions, others have less than adequate or no information. Where biological information is sparse, there are limitations with the application of SAM+2 across populations within an area, and the map needs to be viewed accordingly. Many of the SAM+2 estimates for the North West, North Coast and Central West blocks were derived from just a few samples, or the samples were collected many years ago, and consequently there is less confidence about these estimates.
Most sites where maturity sampling has occurred lack population-specific growth information, so assumptions about population growth characteristics are made, and growth parameters from regionally similar populations are applied. This means that SAM+2 estimates are only as valid as the assumptions made about regional population growth, and while the best available knowledge is used when developing these assumptions, it is possible that there are some regions where these assumptions are not met.

Abalone Fishery Assessment: 2011
Page 108
Appendix 13: Commercial size limits for blacklip and greenlip abalone, 2011
In 2010, the size limit for blacklip in the Furneaux Group was reduced to 114mm as a result of the transfer of this part of the fishery from the Northern Zone to the Bass Strait Zone. In sub-block 31A, the size limit in the Eastern Zone fishery north of latitude 40°54’53” (Cod Bay) was reduced under permit to 132mm in August 2010 as a temporary measure to increase the catch in the area.

Abalone Fishery Assessment: 2011
IMAS Fishery Assessment Report Page 109

Abalone Fishery Assessment: 2011
IMAS Fishery Assessment Report Page 110
References:
Andrew, N. L. and Chen, Y. (1997). Optimal sampling for estimating the size structure and mean size of abalone caught in a New South Wales fishery. Fisheries Bulletin 95, 403-413. Andrew, N. L., Worthington, D. G. and Brett, P. A. (1997). Size-structure and growth of individuals suggest high exploitation rates in the fishery for blacklip abalone, Haliotis rubra, in New South Wales, Australia. Molluscan Research 18, 275-287. Breen, P. A. (1992). A review of models used for stock assessment in abalone fisheries. In Abalone of the world: biology, fisheries and culture, eds. S. A. Shepherd M. J. Tegner and S. A. Guzmán del Próo), pp. 253-275. Oxford: Blackwell. Buckworth, R. (1987). Changes in fishing effort and catching power in the DMZ tiger prawn fishery. In Northern Prawn Fishery Information Notes, vol. February 1987. Cleveland: CSIRO Division of Fisheries. Dugan, J. E. and Davis, G. E. (1993). Applications of marine refugia to coastal fisheries management. Canadian Journal of Fisheries and Aquatic Sciences 50, 2029-2042. Gorfine, H. K. (2001). Diver behaviour and its influence on assessments of a quota-managed abalone fishery. Journal of Shellfish Research 20, 787-794. Haddon, M. and Hodgson, K. (2000). Spatial and seasonal stock dynamics of Northern Tiger prawns using fine-scale commercial catch-effort data. In FRDC Final Report, (ed. FRDC): FRDC. Harrison, A. J. (1983). The Tasmanian abalone fishery. In Tasmanian Fisheries Research, vol. 26, pp. 1-42. Hobart: Tasmanian Fisheries Development Authority. Hart, A. M., Hall, N. and Syers, C. (1999). Stock assessment and modelling for management of the WA greenlip abalone fishery. Perth: Fisheries Western Australia. Hilborn, R. and Walters, C. J. (1992). Quantitative fisheries stock assessment: choice, dynamics and uncertainty. London: Chapman and Hall. Karpov, K. A., Haaker, P. L., Taniguchi, I. K. and Rogers-Bennett, L. (2000). Serial depletion and the collapse of the California abalone (Haliotis spp.) fishery. Can. Spec. Publ. Fish. Aquat. Sci. 130, 11-24. Lyle, J. M. and Tracey, S. R. (2012). Tasmanian recreational rock lobster and abalone fisheries: 2010-11 fishing season, pp. 39. Hobart: Institute for Marine and Antarctic Studies, University of Tasmania. McShane, P. E. (1995). Estimating the abundance of abalone: the importance of patch size. Marine and Freshwater Research 46, 657-662. McShane, P. E. and Smith, M. G. (1988). Measuring abundance of juvenile abalone, Haliotis rubra Leach (Gastropoda, Haliotidae) and Comparison of a novel method with two other methods. Australian Journal of Marine and Freshwater Research 39, 331-336. Officer, R. A. (1999). Size limits for greenlip abalone in Tasmania. Hobart: Tasmanian Aquaculture and Fisheries Institute. Officer, R. A., Haddon, M. and Gorfine, H. K. (2000). Distance-based abundance estimation for abalone. Journal of Shellfish Research This volume.
Abalone Fishery Assessment: 2011
IMAS Fishery Assessment Report Page 111
Prince, J. D. (1992). Using a spatial model to explore the dynamics of an exploited stock of the abalone Haliotis rubra. In Abalone of the world: biology, fisheries and culture, eds. S. A. Shepherd M. J. Tegner and S. A. Guzmán del Próo), pp. 305-317. Oxford: Blackwell. Prince, J. D. and Shepherd, S. A. (1992). Australian abalone fisheries and their management. In Abalone of the world: biology, fisheries and culture, eds. S. A. Shepherd M. J. Tegner and S. A. Guzmán del Próo). Oxford: Blackwell. Rose, G. A. and Kulka, D. W. (1999). Hyperaggregation of fish and fisheries: how catch-per-unit-effort increased as the northern cod (Gadus morhua) declined. Canadian Journal of Fishery and Aquatic Sciences 56, 118-127. Shepherd, S. A. and Baker, J. L. (1998). Biological reference points in an abalone (Haliotis laevigata) fishery. In Canadian Special Publication in Fisheries and Aquatic Sciences, vol. 125 eds. G. S. Jamieson and A. Campbell), pp. 235-245: Proceedings of the North Pacific Symposium on Invertebrate Stock Assessment and Management: Nanaimo, Canada. Shepherd, S. A. and Partington, D. (1995). Studies on southern Australian abalone (genus Haliotis) XVI. Recruitment, habitat and stock relations. Marine and Freshwater Research 46, 669-680. Shepherd, S. A., Rodda, K. R. and Vargas, K. M. (2001). A chronicle of collapse in two abalone stocks with proposals for precautionary management. Journal of Shellfish Research 20, 843-856. Shepherd, S. A. and Turner, J. A. (1985). Studies on southern Australian abalone (genus Haliotis) VI. Habitat preference, abundance and predators of juveniles. Journal of Experimental Marine Biology and Ecology 93, 285-298. Tarbath, D. B., Hodgson, K., Karlov, T. and Haddon, M. (2001). Tasmanian abalone fishery 2000, pp. 103. Hobart: Tasmanian Aquaculture and Fisheries Institute. Tarbath, D. B., Mundy, C. and Haddon, M. (2007). Tasmanian abalone fishery 2006, pp. 77. Hobart: Tasmanian Aquaculture and Fisheries Institute. Worthington, D. G., Andrew, N. L. and Bentley, N. (1998). Improved indices of a catch rate in the fishery for blacklip abalone, Haliotis rubra, in New South Wales, Australia. Fisheries Research 36, 87-97.
Acknowledgements
In recent years, abalone divers' catches have been sampled at Tasmanian Seafoods Pty Ltd (both Margate and Smithton), Ralph’s Tasmanian Seafood Pty Ltd, and Abalone Tasmania Pty Ltd. These processors are thanked for their cooperation.
The committee of the FRAG, and other divers who attended meetings in Hobart, Smithton, Scamander and Dover are thanked for their help in the preparation of this assessment.
A number of individual divers were approached directly for information about fishery performance. These divers are also thanked.

The Institute for Marine and Antarctic Studies (IMAS), established in 2010, comprises the University of Tasmania's internationally recognised expertise across the full spectrum of temperate marine, Southern Ocean, and Antarctic research and education.