TASK1 by UMBRELLA Corp.2008 PowerPoint Presentation to accompany Operations Management, 6E (Heizer &...
27
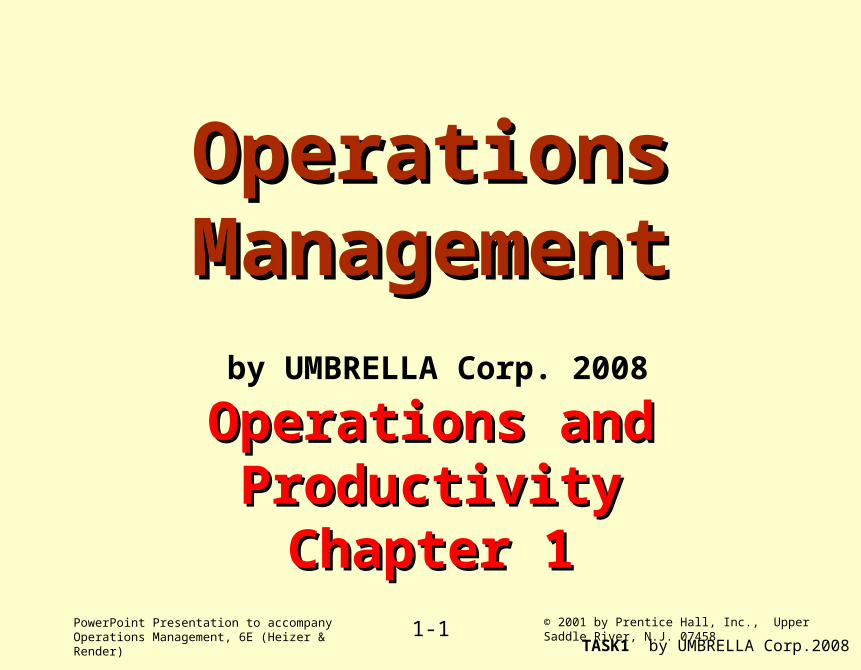
PowerPoint Presentation to accompany Operations Management, 6E (Heizer & Render) © 2001 by Prentice Hall, Inc., Upper Saddle River, N.J. 07458 1-1 TASK1 by UMBRELLA Corp.2008 Operations Operations Management Management Operations and Operations and Productivity Productivity Chapter 1 Chapter 1 by UMBRELLA Corp. 2008
-
date post
19-Dec-2015 -
Category
Documents
-
view
213 -
download
0
Transcript of TASK1 by UMBRELLA Corp.2008 PowerPoint Presentation to accompany Operations Management, 6E (Heizer &...
PowerPoint Presentation to accompany Operations Management, 6E (Heizer & Render)
© 2001 by Prentice Hall, Inc., Upper Saddle River, N.J. 074581-1TASK1 by UMBRELLA Corp.2008
Operations Operations ManagementManagement
Operations and ProductivityOperations and ProductivityChapter 1Chapter 1
by UMBRELLA Corp. 2008

PowerPoint Presentation to accompany Operations Management, 6E (Heizer & Render)
© 2001 by Prentice Hall, Inc., Upper Saddle River, N.J. 074581-2TASK1 by UMBRELLA Corp.2008
OutlineOutline Global company profile: Whirlpool What is Operations Management?
The heritage of Operations Management Why study OM? What Operations Managers do
Organizing to produce goods and services Where are the OM jobs?
Exciting new trends in Operations Management
Operations in the service sector The Productivity challenge

PowerPoint Presentation to accompany Operations Management, 6E (Heizer & Render)
© 2001 by Prentice Hall, Inc., Upper Saddle River, N.J. 074581-3TASK1 by UMBRELLA Corp.2008
Learning ObjectivesLearning Objectives
When you complete this chapter, you should be able to: Identify or Define:
Production and productivity Operations Management (OM) What operations managers do Services
Describe or Explain: A brief history of operations management The future of the discipline Measuring productivity

PowerPoint Presentation to accompany Operations Management, 6E (Heizer & Render)
© 2001 by Prentice Hall, Inc., Upper Saddle River, N.J. 074581-4TASK1 by UMBRELLA Corp.2008
Whirlpool Case ExampleWhirlpool Case Example
Change in attitude - employees “live quality” Training - “use your heads as well as your
hands” Flexible work rules Gain-sharing Global procurement Role of information/information technology Adoption of a Worldwide strategy

PowerPoint Presentation to accompany Operations Management, 6E (Heizer & Render)
© 2001 by Prentice Hall, Inc., Upper Saddle River, N.J. 074581-5TASK1 by UMBRELLA Corp.2008
What Is Operations Management?What Is Operations Management?
Operations management is the set of activities that creates goods and services by transforming raw materials (inputs) into value products (outputs)
Production is the creation of goods and services according to Estimated Demand.
PowerPoint Presentation to accompany Operations Management, 6E (Heizer & Render)
© 2001 by Prentice Hall, Inc., Upper Saddle River, N.J. 074581-6TASK1 by UMBRELLA Corp.2008
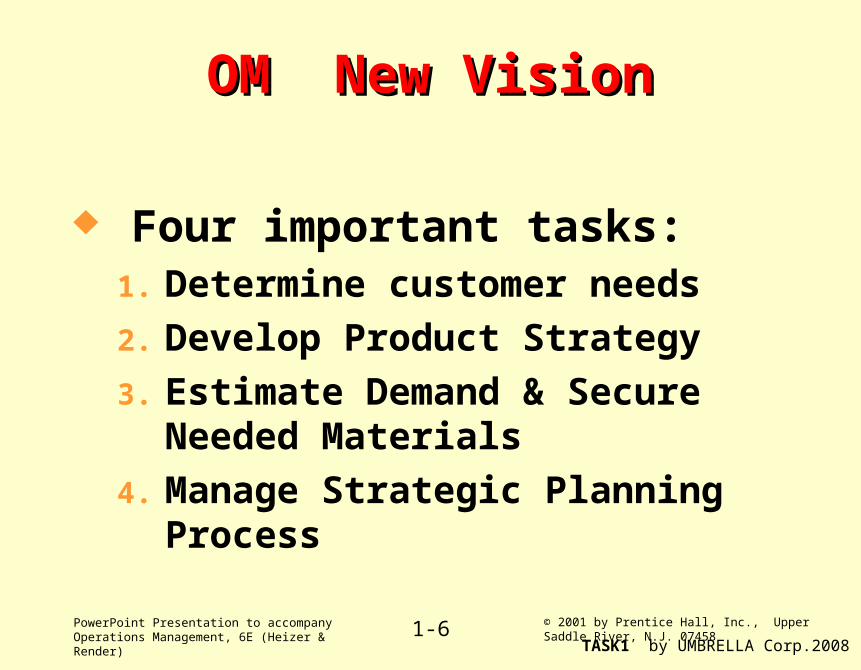
OM New VisionOM New Vision
Four important tasks:1. Determine customer needs
2. Develop Product Strategy
3. Estimate Demand & Secure Needed Materials
4. Manage Strategic Planning Process

PowerPoint Presentation to accompany Operations Management, 6E (Heizer & Render)
© 2001 by Prentice Hall, Inc., Upper Saddle River, N.J. 074581-7TASK1 by UMBRELLA Corp.2008
Significant Events in OMSignificant Events in OM
Division of labor (Smith, 1776) Standardized parts (Whitney, 1800) Scientific management (Taylor, 1881) Coordinated assembly line (Ford 1913) Gantt charts (Gantt, 1916) Motion study (the Gilbreths, 1922) Quality control (Shewhart, 1924)

PowerPoint Presentation to accompany Operations Management, 6E (Heizer & Render)
© 2001 by Prentice Hall, Inc., Upper Saddle River, N.J. 074581-8TASK1 by UMBRELLA Corp.2008
Significant Events - ContinuedSignificant Events - Continued
CPM/PERT (Dupont, 1957) MRP (Orlicky, 1960) CAD Flexible manufacturing systems (FMS) Manufacturing automation protocol (MAP) Computer integrated manufacturing (CIM)
PowerPoint Presentation to accompany Operations Management, 6E (Heizer & Render)
© 2001 by Prentice Hall, Inc., Upper Saddle River, N.J. 074581-9TASK1 by UMBRELLA Corp.2008
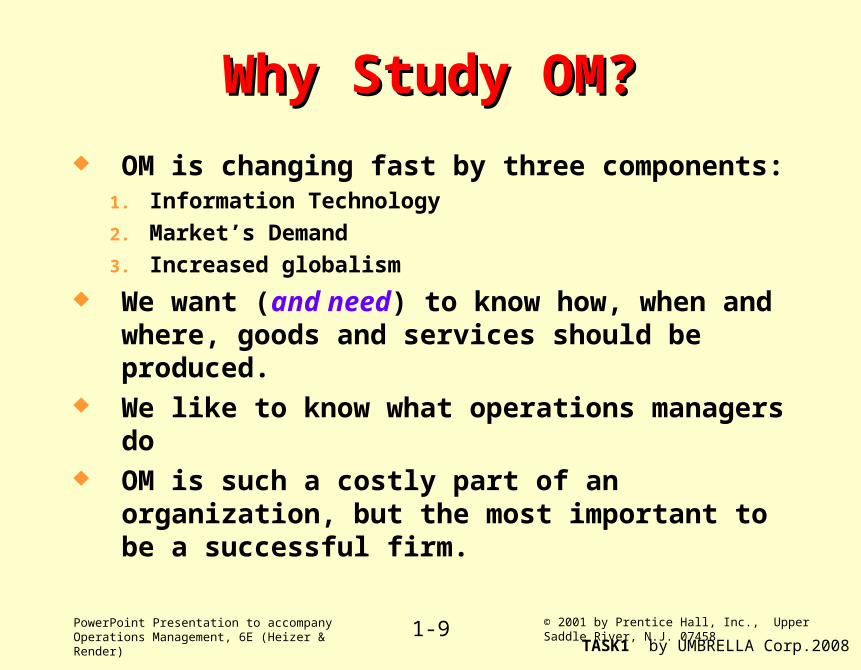
Why Study OM?Why Study OM?
OM is changing fast by three components:1. Information Technology
2. Market’s Demand
3. Increased globalism
We want (and need) to know how, when and where, goods and services should be produced.
We like to know what operations managers do OM is such a costly part of an organization, but the
most important to be a successful firm.
PowerPoint Presentation to accompany Operations Management, 6E (Heizer & Render)
© 2001 by Prentice Hall, Inc., Upper Saddle River, N.J. 074581-10TASK1 by UMBRELLA Corp.2008
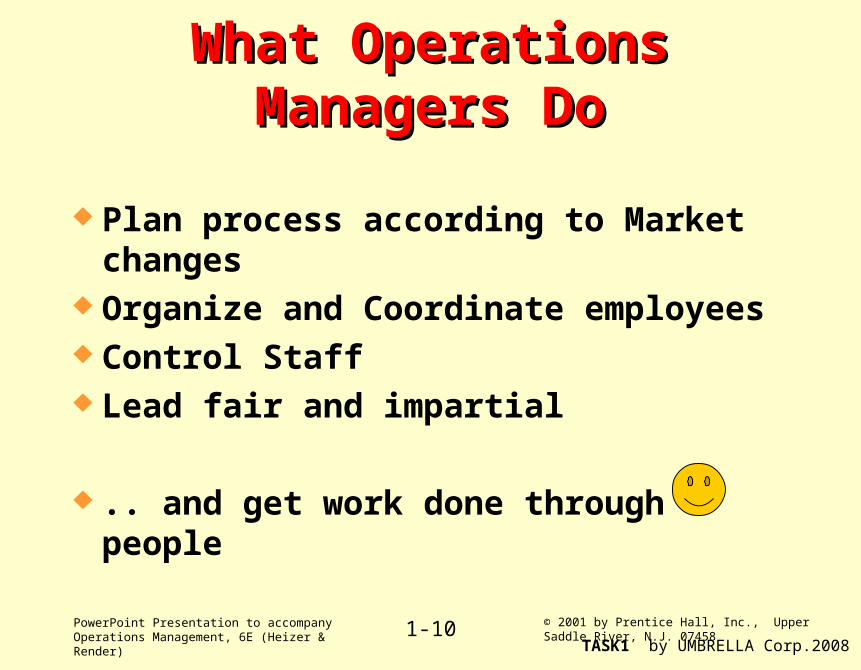
What Operations Managers DoWhat Operations Managers Do
Plan process according to Market changes Organize and Coordinate employees Control Staff Lead fair and impartial
.. and get work done through people

PowerPoint Presentation to accompany Operations Management, 6E (Heizer & Render)
© 2001 by Prentice Hall, Inc., Upper Saddle River, N.J. 074581-11TASK1 by UMBRELLA Corp.2008
Ten Critical DecisionsTen Critical Decisions 01 Service, product design 02 Quality management 03 Process, capacity design 04 Location 05 Layout design 06 Human resources, job design. 07 Supply-chain management 08 Inventory management 09 Scheduling 10 Maintenance

PowerPoint Presentation to accompany Operations Management, 6E (Heizer & Render)
© 2001 by Prentice Hall, Inc., Upper Saddle River, N.J. 074581-12TASK1 by UMBRELLA Corp.2008
Organizational FunctionsOrganizational Functions
Human resource Management Marketing
Creates global customers Research & Development Process
creates product or service according demand Finance/Accounting
Obtains funds Tracks money

PowerPoint Presentation to accompany Operations Management, 6E (Heizer & Render)
© 2001 by Prentice Hall, Inc., Upper Saddle River, N.J. 074581-13TASK1 by UMBRELLA Corp.2008
Where Are the OM Jobs?Where Are the OM Jobs? Technology/methods Facilities/space utilization Strategic issues Response time People/team development Customer service Quality Cost reduction Inventory reduction Productivity improvement Feedback
PowerPoint Presentation to accompany Operations Management, 6E (Heizer & Render)
© 2001 by Prentice Hall, Inc., Upper Saddle River, N.J. 074581-14TASK1 by UMBRELLA Corp.2008
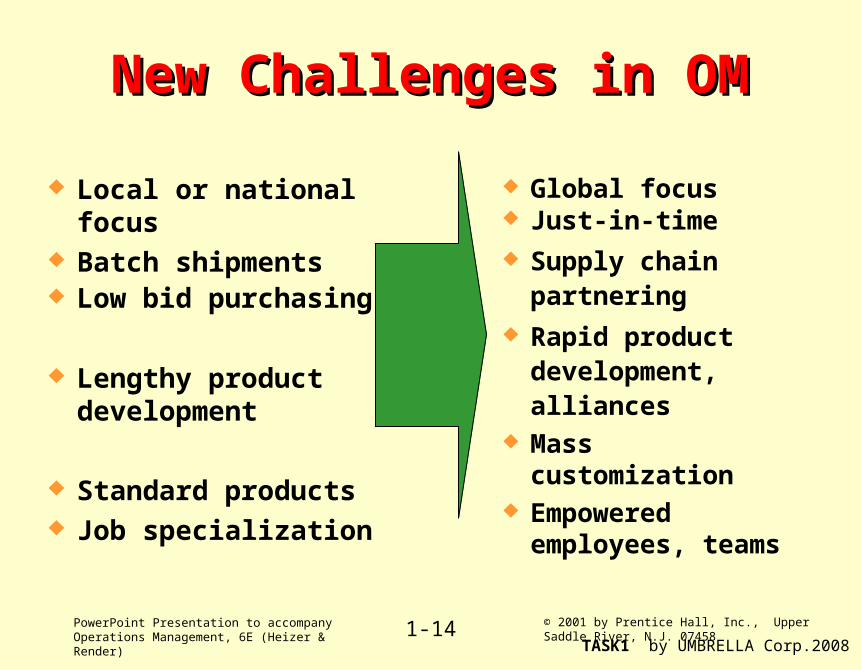
New Challenges in OMNew Challenges in OM
Local or national focus Batch shipments Low bid purchasing
Lengthy product development
Standard products Job specialization
Global focus Just-in-time Supply chain
partnering Rapid product
development, alliances
Mass customization Empowered
employees, teams
FromFrom ToTo
PowerPoint Presentation to accompany Operations Management, 6E (Heizer & Render)
© 2001 by Prentice Hall, Inc., Upper Saddle River, N.J. 074581-15TASK1 by UMBRELLA Corp.2008
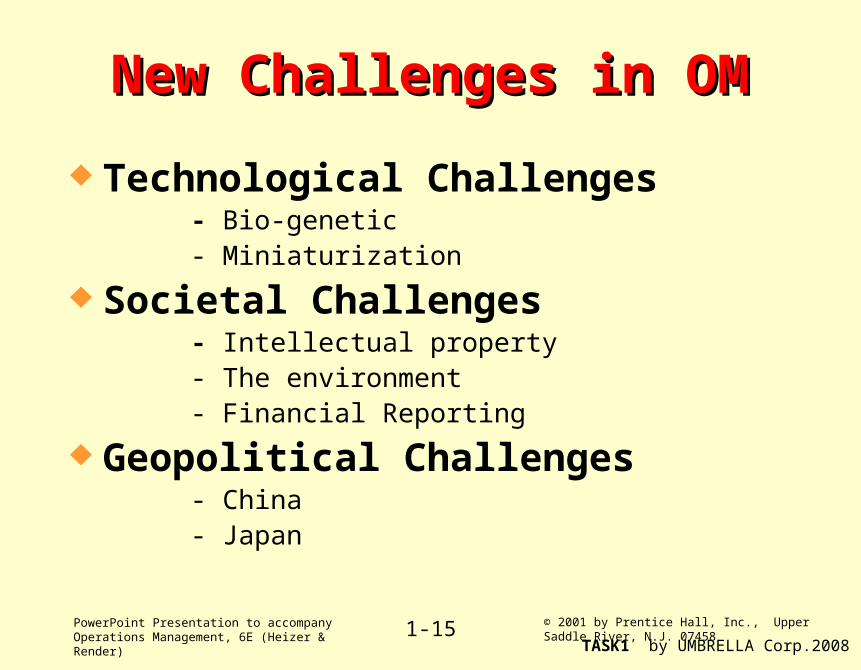
New Challenges in OMNew Challenges in OM
Technological Challenges- Bio-genetic- Miniaturization
Societal Challenges - Intellectual property
- The environment- Financial Reporting
Geopolitical Challenges- China- Japan

PowerPoint Presentation to accompany Operations Management, 6E (Heizer & Render)
© 2001 by Prentice Hall, Inc., Upper Saddle River, N.J. 074581-16TASK1 by UMBRELLA Corp.2008
Characteristics of GoodsCharacteristics of Goods
Tangible product Consistent product definition Production usually separate from
consumption Can be inventoried Low customer interaction

PowerPoint Presentation to accompany Operations Management, 6E (Heizer & Render)
© 2001 by Prentice Hall, Inc., Upper Saddle River, N.J. 074581-17TASK1 by UMBRELLA Corp.2008
Characteristics of ServiceCharacteristics of Service
Intangible product Produced & consumed at same time Often unique High customer interaction Inconsistent product definition Often knowledge-based Frequently dispersed

PowerPoint Presentation to accompany Operations Management, 6E (Heizer & Render)
© 2001 by Prentice Hall, Inc., Upper Saddle River, N.J. 074581-18TASK1 by UMBRELLA Corp.2008
Goods Versus ServicesGoods Versus Services
Can be resold Can be inventoried
Some aspects of quality measurable
Selling is distinct from production
Reselling unusual Difficult to
inventory Quality difficult to
measure Selling is part of
service
GoodsGoods ServiceService

PowerPoint Presentation to accompany Operations Management, 6E (Heizer & Render)
© 2001 by Prentice Hall, Inc., Upper Saddle River, N.J. 074581-19TASK1 by UMBRELLA Corp.2008
Goods Versus Services - Goods Versus Services - ContinuedContinued
Product is transportable
Site of facility important for cost
Often easy to automate
Revenue generated primarily from tangible product
Provider, not product is transportable
Site of facility important for customer contact
Often difficult to automate
Revenue generated primarily from intangible service.
GoodsGoods ServiceService
PowerPoint Presentation to accompany Operations Management, 6E (Heizer & Render)
© 2001 by Prentice Hall, Inc., Upper Saddle River, N.J. 074581-20TASK1 by UMBRELLA Corp.2008
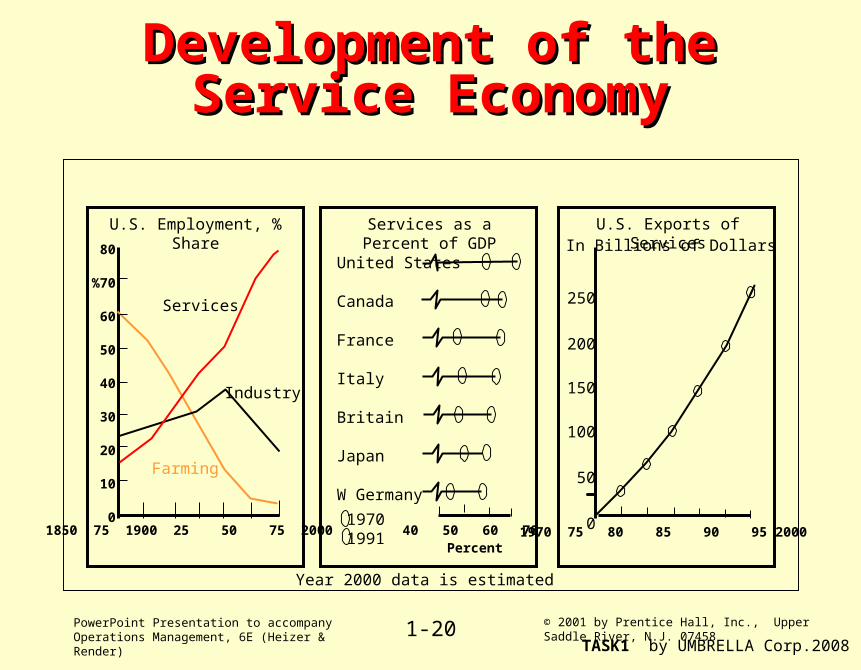
1850 75 1900 25 50 75 2000 40 50 60 70 1970 75 80 85 90 95 2000Percent
United States
Canada
France
Italy
Britain
Japan
W Germany
19701991
Services
Industry
Farming
250
200
150
100
50
0
80
%70
60
50
40
30
20
10
0
U.S. Employment, % Share Services as a Percent of GDP U.S. Exports of ServicesIn Billions of Dollars
Year 2000 data is estimated
Development of the Service Development of the Service EconomyEconomy

PowerPoint Presentation to accompany Operations Management, 6E (Heizer & Render)
© 2001 by Prentice Hall, Inc., Upper Saddle River, N.J. 074581-21TASK1 by UMBRELLA Corp.2008
The Economic System The Economic System Transforms Inputs to OutputsTransforms Inputs to Outputs
The economic system transforms inputs to outputs at about an annual 1.7% increase in productivity (capital 38% of 1.7%), labor (10% of 1.7%), management (52% of 1.7%)
Land, Labor, Capital, Management
Goods and Services
Feedback loop
Inputs Process Outputs
PowerPoint Presentation to accompany Operations Management, 6E (Heizer & Render)
© 2001 by Prentice Hall, Inc., Upper Saddle River, N.J. 074581-22TASK1 by UMBRELLA Corp.2008
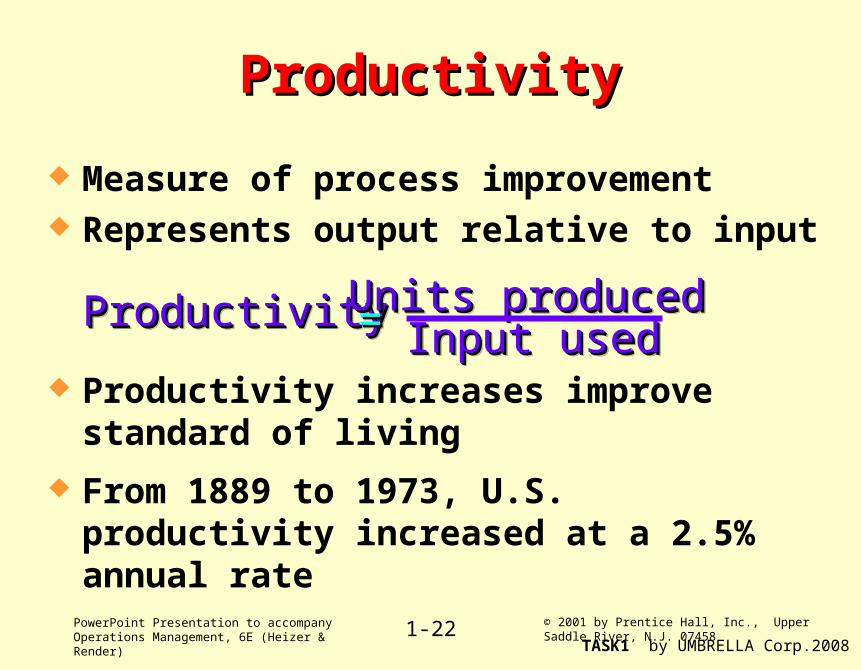
Measure of process improvement Represents output relative to input
Productivity increases improve standard of living
From 1889 to 1973, U.S. productivity increased at a 2.5% annual rate
ProductivityProductivity
ProductivityProductivityProductivityProductivity UnitsUnits producedproducedUnitsUnits producedproducedInput usedInput usedInput usedInput used= = = =
PowerPoint Presentation to accompany Operations Management, 6E (Heizer & Render)
© 2001 by Prentice Hall, Inc., Upper Saddle River, N.J. 074581-23TASK1 by UMBRELLA Corp.2008
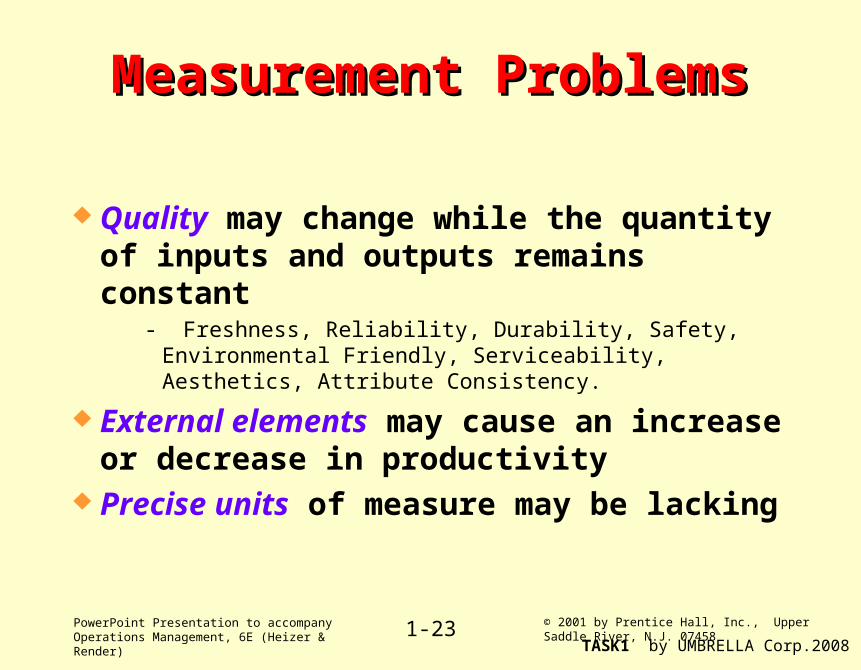
Measurement ProblemsMeasurement Problems
Quality may change while the quantity of inputs and outputs remains constant
- Freshness, Reliability, Durability, Safety, Environmental Friendly, Serviceability, Aesthetics, Attribute Consistency.
External elements may cause an increase or decrease in productivity
Precise units of measure may be lacking

PowerPoint Presentation to accompany Operations Management, 6E (Heizer & Render)
© 2001 by Prentice Hall, Inc., Upper Saddle River, N.J. 074581-24TASK1 by UMBRELLA Corp.2008
Productivity VariablesProductivity Variables
Labor - contributes about 10% of the annual increase
Capital - contributes about 32% of the annual increase
Management - contributes about 52% of the annual increase
PowerPoint Presentation to accompany Operations Management, 6E (Heizer & Render)
© 2001 by Prentice Hall, Inc., Upper Saddle River, N.J. 074581-25TASK1 by UMBRELLA Corp.2008
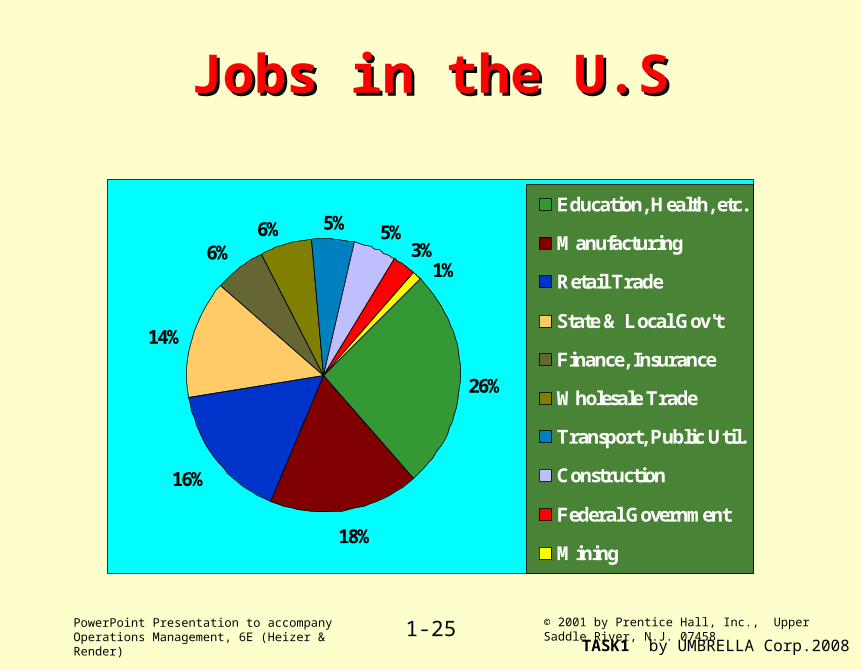
Jobs in the U.SJobs in the U.S
26%
18%
16%
14%
6%6% 5% 5%
3%1%
Education, Health, etc.
Manufacturing
Retail Trade
State & Local Gov't
Finance, Insurance
Wholesale Trade
Transport, Public Util.
Construction
Federal Government
Mining

PowerPoint Presentation to accompany Operations Management, 6E (Heizer & Render)
© 2001 by Prentice Hall, Inc., Upper Saddle River, N.J. 074581-26TASK1 by UMBRELLA Corp.2008
Productivity Growth 1971- 1992Productivity Growth 1971- 1992
0
0.5
1
1.5
2
2.5
3
3.5
4
4.5
5
United StatesWest GermanyJapan
Whole Economy Manufacturing
% p
er y
ear
LaborLabor

PowerPoint Presentation to accompany Operations Management, 6E (Heizer & Render)
© 2001 by Prentice Hall, Inc., Upper Saddle River, N.J. 074581-27TASK1 by UMBRELLA Corp.2008
Service ProductivityService Productivity
Typically labor intensive Frequently individually processed Often an intellectual task performed by
professionals Often difficult to mechanize Often difficult to evaluate for quality